Making Workers Compensation Medical Fee … Workers Compensation Medical Fee Schedules More ......
21
1 Making Workers Compensation Medical Fee Schedules More Effective Cost containment is critical to maintaining a viable workers compensation (WC) system, and the rising cost of delivering healthcare services underscores the need to control WC medical costs. Fee schedules are the oldest and most widely used device to regulate WC medical payments. Still, questions remain as to what makes for an effective fee schedule. Many studies compare WC fee schedules with various other price tables. None, however, has looked directly at how WC fee schedules perform within the broader healthcare delivery system. Here we look at state WC fee schedule designs and the relationship between WC reimbursements and those for employer-sponsored group health in the state. The primary finding is simply that fee schedules are effective at controlling WC medical costs. We also show that most schedules work well for primary care but not as well for specialty medicine, and we identify areas for possible improvement. Because WC fee schedules have been around for so long, it is tempting to discount them as a viable tool for WC reform. Policymakers, however, should look beyond the initial role of fee schedules as only price controls and come to view fee schedules as one way to help WC insurers build networks that deliver high quality, readily accessible, and cost-effective medical care. Executive Summary Our conclusions on the overall effectiveness of WC medical fee schedules are: • Most states reimburse WC medical care at prices that are marked up above Group Health (GH) • States without fee schedules reimburse at a higher markup over GH than states with fee schedules • Radiology and surgery show higher markups above GH than other medical services Among states with fee schedules: • Office visits and physical therapy are reimbursed at about the same prices as GH • Our comparisons with GH are consistent with comparisons between WC fee schedules and Medicare reimbursement schedules Comparing medical costs between WC and GH over the same time frame and on similar injuries, higher utilization in WC accounts for more of the difference than the price markups over GH. And this holds quite generally regardless of the structure of the WC fee schedule or even whether the state has a fee schedule. We conclude that fee schedules by themselves have a very limited ability to bring WC utilization levels closer to GH levels. The Conclusion includes suggestions for possible improvements to fee schedules that may be worth future investigation and consideration Study Objective In contrast to studies that compare a WC fee schedule with other price lists, we look at actual WC and GH experience to address the following: • Do workers compensation medical fee schedules control costs? • Which fee schedules are most effective in controlling costs? • When prices are lower, is utilization higher? • Does the effectiveness of fee schedules vary by type of service? December 2007 By John Robertson and Dan Corro NCCI RESEARCH BRIEF
Transcript of Making Workers Compensation Medical Fee … Workers Compensation Medical Fee Schedules More ......

1
Making Workers Compensation Medical Fee Schedules More Effective Cost containment is critical to maintaining a viable workers compensation (WC) system, and the rising cost of delivering healthcare services underscores the need to control WC medical costs. Fee schedules are the oldest and most widely used device to regulate WC medical payments. Still, questions remain as to what makes for an effective fee schedule. Many studies compare WC fee schedules with various other price tables. None, however, has looked directly at how WC fee schedules perform within the broader healthcare delivery system. Here we look at state WC fee schedule designs and the relationship between WC reimbursements and those for employer-sponsored group health in the state. The primary finding is simply that fee schedules are effective at controlling WC medical costs. We also show that most schedules work well for primary care but not as well for specialty medicine, and we identify areas for possible improvement. Because WC fee schedules have been around for so long, it is tempting to discount them as a viable tool for WC reform. Policymakers, however, should look beyond the initial role of fee schedules as only price controls and come to view fee schedules as one way to help WC insurers build networks that deliver high quality, readily accessible, and cost-effective medical care. Executive Summary Our conclusions on the overall effectiveness of WC medical fee schedules are: • Most states reimburse WC medical care at prices that are marked up above Group Health (GH) • States without fee schedules reimburse at a higher markup over GH than states with fee schedules • Radiology and surgery show higher markups above GH than other medical services Among states with fee schedules: • Office visits and physical therapy are reimbursed at about the same prices as GH • Our comparisons with GH are consistent with comparisons between WC fee schedules and Medicare reimbursement
schedules Comparing medical costs between WC and GH over the same time frame and on similar injuries, higher utilization in WC accounts for more of the difference than the price markups over GH. And this holds quite generally regardless of the structure of the WC fee schedule or even whether the state has a fee schedule. We conclude that fee schedules by themselves have a very limited ability to bring WC utilization levels closer to GH levels. The Conclusion includes suggestions for possible improvements to fee schedules that may be worth future investigation and consideration Study Objective In contrast to studies that compare a WC fee schedule with other price lists, we look at actual WC and GH experience to address the following: • Do workers compensation medical fee schedules control costs? • Which fee schedules are most effective in controlling costs? • When prices are lower, is utilization higher? • Does the effectiveness of fee schedules vary by type of service?
December 2007
By John Robertson and Dan Corro
NCCI RESEARCH BRIEF

2
Background and Methodology This study considers medical care provided from 1996 to 2004 in 28 of the states where NCCI provides ratemaking services. For half of these states, we have a sufficient volume of data for both WC and GH to make utilization comparisons based on a detailed comparison of a dozen common WC injuries. In addition to updating fee schedules, WC medical cost containment programs evolve over time. For example, since our last study, some states (Florida and Illinois in particular) have undergone significant reform in their workers compensation statutes, and two states (Illinois and Tennessee) have introduced a WC medical fee schedule. Our discussion assumes a basic familiarity with WC fee schedules. While we briefly recall some aspects as needed, the reader is invited to consult Appendix 1, which provides a short primer on the design and application of WC fee schedules. For both their GH and WC patients, doctors and other medical professionals use the same HCPCS/CPT1 codes to identify medical procedures on their bills. Similarly, prescription medications are identified by a National Drug Code [NDC] that is common to WC and GH. WC medical fee schedules assign maximum allowable fees by CPT code. These codes are also used by Medicare. Hospitals and other facilities, however, do not use a standardized coding scheme. Nor do they provide a uniform level of detail in their billing. Some jurisdictions exempt facilities from their WC fee schedule, even services that have an assigned CPT code. Consequently, our analysis excludes many facility charges. The introduction of WC hospital fee schedules in some states might eventually improve our ability to investigate WC medical costs. There are essentially two kinds of WC medical fee schedules, based on either: • What services should cost as determined by special studies • What providers are billing for their services Schedules based on what services should cost reference a Relative Value Scale (RVS). RVS schedules are based on analyses of the resources of time, equipment, and expense required to deliver the various medical services. The Medicare Resource-Based RVS, or RBRVS, is used by many states as the starting point for their WC fee schedules, but state fee schedules generally allow a higher maximum fee than the Medicare reimbursement amount. Schedules based on what providers bill typically reference tables of Usual, Customary, and Reasonable (UCR) charges. While, traditionally, GH insurers geared reimbursement to UCR charges, increasingly, GH insurers follow the Medicare RBRVS reimbursement. Comparison With Medicare A convenient characterization of the price level set by a WC fee schedule is the ratio of the WC fee schedule to Medicare. That ratio is the cost of a market basket of CPT procedures evaluated at the fee schedule maximum allowable amounts divided by the cost of the same basket using Medicare reimbursement amounts. The market basket consists of a mix of medical services typical for treating WC claims. Itemizing the basket into service categories, such as physical therapy or surgery, produces ratios by service type. Medicare prices are reviewed annually and take into account the local cost of providing medical services. In addition to time and place, Medicare prices are subject to political and budgetary pressures. The WCRI publishes a series of studies based on this characterization of WC fee schedules. Here we use the WCRI study, “Benchmarks for Designing WC Medical Fee Schedules: 2001” so as to best align with the time period of the data. A 2006 edition provides a more current picture. Using Medicare as a standard for comparison by service type, Exhibit 1 illustrates the very significant variation in fee schedules that is possible both between states and between service categories within a state. Here we see that, overall, Nebraska has higher fee reimbursement relative to Medicare than does Maryland. Exhibit 1 also illustrates a typical feature of WC medical fee schedules in that both states reimburse radiology and surgery at higher levels, relative to Medicare, than other medical services.
1 Appendix 2 provides a glossary of acronyms and specialized terminology.

3
Exhibit 1: There is very significant variation in fee schedules, both between states
and between service categories within a state.

4
Exhibit 2 shows the ratio of WC medical fee schedules to Medicare for 15 RVS states. These states are divided into two categories, low and high, depending upon whether the overall ratio is below or above 140% of Medicare. Again, the range is considerable, from below Medicare for Florida to nearly double Medicare for the Oregon fee schedule in 2001.
Exhibit 2: States show considerable range in the ratio of WC medical fee schedules to Medicare.

5
Even though the Medicare RBRVS is geared toward a resource-based assessment of what services should cost, the ratio to Medicare makes equally good sense for any state with a fee schedule, including those states whose fee schedules are predicated on what providers are billing (UCR). Exhibit 3 shows that UCR states included in our review are spread among the high RVS states.
Exhibit 3: UCR states are spread among the high RVS states.
Medicare is a convenient standard, and with changing population demographics Medicare is becoming even more dominant in the healthcare delivery system. This puts Medicare and its RBRVS foremost among the choices to use when designing a WC medical fee schedule. Still, be mindful that the WC claimant population and injury mix is different from Medicare’s. Medicare is also less interested in return-to-function, and return-to-work, than is WC. Such considerations may shift the relative values that Medicare places on services away from an allocation better suited to WC.

6
Schedule Effectiveness: Comparison With Group Health For a complementary perspective, we shift from comparing published price schedules to examining actual experience. We compare WC prices, utilization, and costs to those for GH, noting that: • GH prices are what medical services cost in a competitive market • GH prices take into account geographical location • Care is available at GH prices The WC data for the study is from a sample of medical transaction data that is predominantly from large property/casualty insurance companies. The GH medical transaction data was obtained from Medstat, a company that specializes in the collection and analysis of medical experience from employer-sponsored health benefit plans. Those plans include: • PPOs • HMOs • Traditional plans The WC and GH medical services considered are both from 1997–2004. When comparing WC and GH, the terms “cost,” “price,” and “utilization” are used in a precise manner: • “Cost” signifies the total amount paid for the various services to treat an injury • “Price” refers to the amount paid per service for particular medical services • “Utilization” represents both the quantity and the mix of services provided (e.g., X-ray versus MRI) Costs are a function of prices and utilization:
Cost = Price x Utilization Because cost has two factors, a difference between costs naturally breaks down into two components2
WC Cost = GH Cost + WC/GH Utilization Difference + WC/GH Price Markup Cost Difference = WC Cost – GH Cost = WC/GH Utilization Difference + WC/GH Price Markup
2 The decomposition formula is described in the Appendix to the 2006 study of this series, "What Can Workers Compensation
Learn from Group Medical Insurance?”

7
Comparison by State Exhibit 4 compares WC and GH prices in states for which we had sufficient data to perform the price and utilization analysis. States are ranked by increasing WC markup over GH and are color coded according to the basis for the WC fee schedule (high and low RVS discussed above). States without a fee schedule show the highest WC price markup over GH. Florida and Maryland have prices that are at a discount from GH and have fee schedules below Medicare reimbursement. Observe that the WC price markup over GH in Kentucky seems high for an RVS-low state; we return to this and similar observations later.
Exhibit 4: States without a fee schedule show the highest WC price markup over GH.

8
Exhibit 5 gives a side-by-side look at effectiveness versus design. Here, price effectiveness (WC price markup over GH) is to the left, with design (Allowable Fee on Schedule versus Medicare) to the right. Effectiveness follows design: • Whether GH or Medicare is used as the yardstick, RVS-low states consistently show the lowest relative WC
reimbursement level • UCR states are near RVS-high states—a bit lower than the RVS-high group when the relativity is to GH and a bit higher
when the relativity is to Medicare • The WC price markup over GH is greater for the RVS-high than for the RVS-low states, as one would expect • It is also reasonable that the WC price markup over GH, at an average of +17% (=113% – 96%), is less than the
corresponding +40% (=147% – 107%) difference in the fee schedule ratio to Medicare, because the latter difference is based on maximum allowable charges whereas the former is geared to what is actually paid
• As in previous studies, we see that states without any fee schedule have the highest WC price markup
Exhibit 5: Effectiveness follows design.

9
Turning to the utilization piece of the WC versus GH cost comparison, Exhibit 6 relates fee schedule type with utilization difference. Here, each fee schedule class of states shows much higher utilization in WC than in GH. Oklahoma shows the greatest utilization difference and accounts for the higher figure for the UCR group (removing Oklahoma from the UCR group would produce a utilization difference within the narrow 160%–166% range of the other fee schedule types).
Exhibit 6: Each fee schedule class of states shows much higher utilization in WC than in GH.
Each state has a unique combination of practice standards and availability of resources. Since WC and GH mostly use the same resources, this study uses GH to benchmark WC utilization at the state level. When we compare WC and GH utilization across states, we find that WC utilization is consistently higher and that no design emerges as superior at controlling WC utilization. That is not to say that WC fee schedules do not affect utilization. Other studies suggest that utilization is responsive to fee schedule changes within a state. For example, researchers have observed that when Medicare lowers its reimbursement rates for a particular geographic area, some providers modify their practice to offset the cost reduction, either by switching to higher compensated procedures or performing more procedures.3 Although no WC fee schedule blueprint appears best at controlling overall WC medical utilization, that overall observation does not necessarily apply to specific procedures or to what happens when a particular price is set artificially low or high. In particular, we do see some relationships between prices and utilization for some specific medical treatments, e.g., instances when a high or no maximum allowable fee for a specific procedure did correlate with a difference in the utilization of that procedure. We discuss some findings by type of service in the next section.
3 “Memorandum on Physician Volume and Intensity Response,” prepared by the Office of the Actuary of the Centers for Medicare
and Medicaid Services (http://cms.hhs.gov/statistics/actuary/physicianresponse/). In addition to presenting its own findings, this report summarizes other independent studies that conclude that some medical providers respond to fee reductions with offsetting increases in utilization.

10
Exhibit 7 combines what has been seen into a single picture. Fee schedule design is related to WC price markup but not to WC utilization. We conclude that, in and of themselves, fee schedules are very limited in their ability to deal with the utilization cost driver. Earlier studies have identified utilization as the main factor producing WC costs that are above those of GH, indicated here by the higher bars for utilization than for price.
Exhibit 7: Fee schedule design relates with WC price markup but not with higher utilization.

11
Comparison by Type of Service Exhibit 8 shows the WC price markup over GH (“markdown” when the figure is below 100%) according to the type of medical service, keeping the usual color codes for the fee schedule categories. We observe from this chart that: • For all service types, the WC markup over GH increases from RVS Low to RVS High and again from RVS High to the
No Fee Schedule state categories • UCR is again sometimes above and sometimes below the RVS High category • In states with no fee schedule, WC is priced higher than GH for all four service types • Within each category of fee schedule, physical therapy services show the least markup over GH, followed by office
visits Surgery and radiology are priced above GH for all four fee schedule categories. This contrasts sharply with physical therapy, whose services are priced below GH in the states with fee schedules. Radiology and surgery in non-fee schedule states show the two highest WC markups over GH. We have already observed that even when WC fee schedules are based on the Medicare RBRVS they do not relate uniformly to the RBRVS schedule across service categories. It is typical for fee schedules to provide a higher ratio to Medicare reimbursement for surgery and radiology. We see this in Exhibit 8, where radiology and surgery show a higher markup over GH. When designing a WC medical fee schedule, a higher ratio to Medicare for surgery may be warranted because Medicare reimbursement may be low compared to what is being charged. Also, a higher ratio to Medicare may be needed to ensure access to quality care. If Medicare is deemed inadequate, however, it is not clear how much higher than Medicare the schedule should be set. There is, however, access to care at GH price levels. Exhibit 8 raises the concern that for many state fee schedules, even among the RVS-low states, comparatively higher fees allowed for radiology and surgery may overcompensate. We observe WC prices for radiology and surgery that are well above GH and appear to be higher than necessary to ensure access to care and to compensate for additional administrative burdens that may attach to treating WC cases.
Exhibit 8: Surgery and radiology are priced above GH for all four fee schedule categories.

12
Exhibit 9 takes a closer look at reimbursement for office visits—more precisely, evaluation and management services. These primary care services show a WC reimbursement, expressed as a percentage of GH, that is very similar to the maximum allowable charge, expressed as a percentage of Medicare. For office visits, the amount the fee schedule allows providers to charge is near the amount actually reimbursed; it appears that the fee schedule dictates prices. UCR states, in particular, set WC maximum fees very near their Medicare reimbursement, which results in WC reimbursement rates that are very near the rates for GH and Medicare.
Exhibit 9: For office visits, the amount the fee schedule allows is near the amount reimbursed.
13
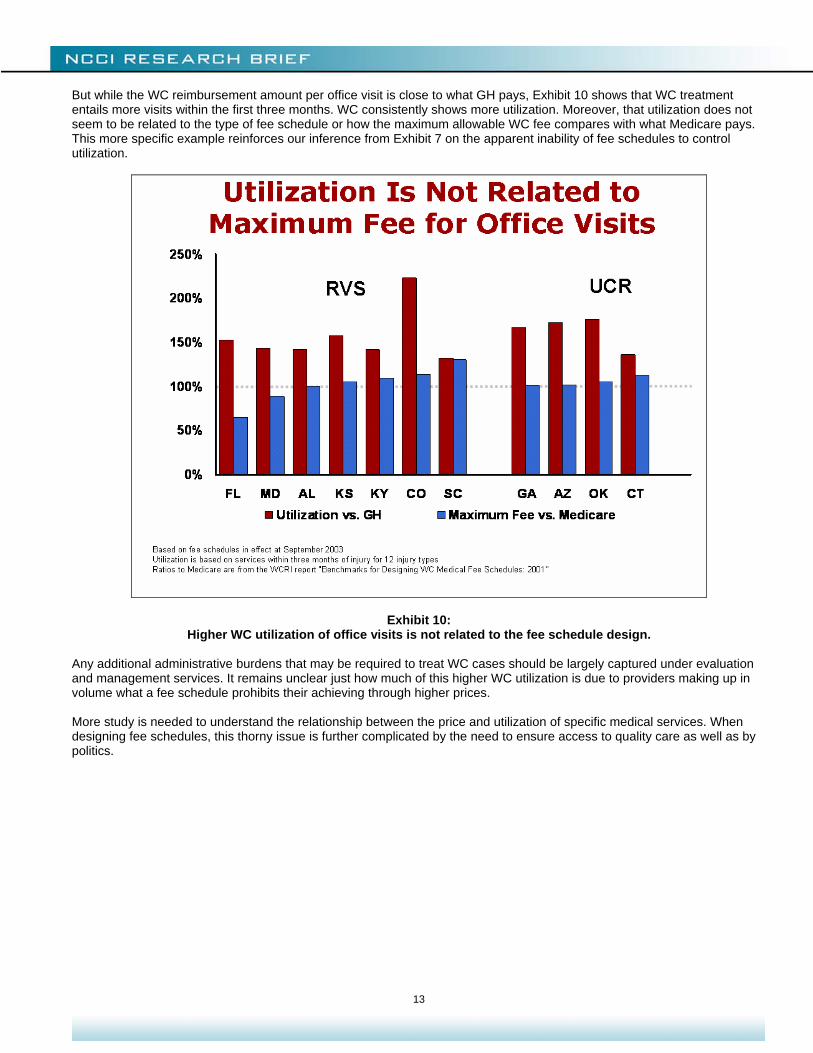
But while the WC reimbursement amount per office visit is close to what GH pays, Exhibit 10 shows that WC treatment entails more visits within the first three months. WC consistently shows more utilization. Moreover, that utilization does not seem to be related to the type of fee schedule or how the maximum allowable WC fee compares with what Medicare pays. This more specific example reinforces our inference from Exhibit 7 on the apparent inability of fee schedules to control utilization.
Exhibit 10: Higher WC utilization of office visits is not related to the fee schedule design.
Any additional administrative burdens that may be required to treat WC cases should be largely captured under evaluation and management services. It remains unclear just how much of this higher WC utilization is due to providers making up in volume what a fee schedule prohibits their achieving through higher prices. More study is needed to understand the relationship between the price and utilization of specific medical services. When designing fee schedules, this thorny issue is further complicated by the need to ensure access to quality care as well as by politics.

14
Identifying Effective Schedules We have seen in Exhibit 4 that the WC price markup over GH in a state relates to how its fee schedule compares with Medicare. We now take a closer look at that. The ratio to Medicare quantifies the design objective of a schedule. The WC markup over GH measures how effectively the schedule holds down WC prices. Exhibit 11a is the first of a series of three related charts. All three charts plot the “design” (WC fee schedule to Medicare) along the horizontal axis and “effectiveness” (WC to GH) along the vertical. Each point is a state. The first chart again shows that comparisons with either GH or Medicare produce fairly consistent rankings of state WC fee schedules.
Exhibit 11a: Effectiveness versus design.

15
The second chart, Exhibit 11b, adds some material to help interpret the first chart: • An upward arrow points toward a higher WC markup over GH, for a fixed design ratio to Medicare, and indicates a fee
schedule that is less effective at controlling costs • A downward arrow points toward a lower WC markup, indicating a more effective fee schedule • Dotted lines indicate the average range of relationships between design and effectiveness (determined from a
regression line4) • The broadening of the ranges at the ends illustrates how the relationship becomes more tenuous the farther away one
moves from the cluster of states nearest the center of the chart
Exhibit 11b: Effectiveness versus design.
This envelope identifies those states that depart from the overall pattern. States that depart on the more effective (downward) side may help identify what is most effective in a WC fee schedule, while those on the less effective side may reveal what does not work as well.
4 The “independent variable” is the ratio to Medicare that measures the design input of the schedule and is a value that policy-
makers can, in theory, control. The “dependent variable” is the WC price markup over GH, which has a natural interpretation as a measure of how effective a schedule is at controlling price.

16
The third chart, Exhibit 11c, highlights two candidates as “less effective” and five as “more effective” state fee schedules: • Above Expected Price: KY, MS • Near Expected Price: MD, CO, UT, KS, SC, OK, ME, AL, NV, LA, NE, CT • Below Expected Price: FL, GA, AZ, AR, OR
Exhibit 11c: Effectiveness versus design.

17
Exhibit 12 shows the use of provider networks for the seven states outside the envelope: • The two states with less effective performance also show significantly lower use of provider networks than the five
states whose schedules performed better • This suggests that the effectiveness of a fee schedule is enhanced with the use of provider networks
Exhibit 12: Effectiveness of a fee schedule is enhanced with the use of provider networks.
This illustrates that WC fee schedules do not act in a vacuum. They should serve as starting points in a negotiation process between WC insurers and medical providers. Accordingly, fee schedules may help to level the playing field for WC insurers. This can be especially important when the WC niche within the healthcare delivery market is too small to enable WC insurers to effectively negotiate discounted fees. For example, radiology and surgery are both areas where many state fee schedules could be lowered while remaining significantly above GH, thereby helping WC insurers negotiate a better deal without an adverse impact on the availability of care to injured workers.

18
Conclusion We conclude with a recapitulation of the questions that prompted this study: • Do workers compensation medical fee schedules control costs?
Yes. States without WC fee schedules show higher medical costs. • Which fee schedules are more effective in controlling costs?
The more effective fee schedules are those that set maximum allowable fees that are no more than 40% above Medicare. In practice, that was only achieved among fee schedules based on what reimbursements should be (RVS approach) as opposed to schedules geared to what is being billed (UCR approach). Also, fee schedules are more effective in combination with the use of provider networks.
• When prices are lower, is utilization higher?
Not when the comparison is made between states and on an overall basis. In general, greater utilization of WC services than for GH is a commonality among states that is not responsive to the presence or design of a fee schedule. Other studies suggest that within a geographic area, utilization is responsive to fee schedules. It is also important to appreciate that this observation applies only at an overall basis and does not consider specific procedures or what happens when particular prices are set artificially low or high. More study is needed to understand the complex relationship between price, utilization, and accessibility of specific medical services.
• Does the effectiveness of fee schedules vary by type of service?
Yes. WC fee schedules are best at controlling physical therapy and are generally effective at controlling the cost of primary care. Fee schedules are less effective at specialty care, like radiology and surgery. Although fee schedules may be less effective at controlling the price of radiology and surgery, the lack of any maximum fee for those services is of still greater concern, since that is associated with much higher WC medical costs.
This investigation relates the effectiveness of WC medical fee schedules, measured empirically as the amount of price markup over GH, with their design, calculated as a ratio of the schedule amounts to Medicare reimbursement tables. Both these measures adapt to differences in the cost of delivering medical care between states. Our primary findings are: • Utilization is relatively uniform across states • Greater network penetration reduces costs • RVS schedules with lower markups relative to Medicare work best • Fee schedules reduce WC medical costs Our analysis suggests that comparatively high allowable fees for radiology and surgery services are often excessive. Those fees should be brought into closer alignment with what is allowed on other services. This would help WC insurers negotiate a better and more equitable deal on provider discounts. Our comparison with market prices suggests that WC insurers could achieve this without an adverse impact on the availability of care to injured workers. Moving forward, NCCI will continue to examine areas of market interest such as workers compensation versus group health and to report our findings to the industry. For a complete review of ongoing NCCI research projects, please visit ncci.com.
19
APPENDIX 1: WC Fee Schedule Primer WC fee schedules specify maximum allowable amounts to reimburse for medical services covered under WC insurance. Most apply on a statewide basis, although some states have schedules that differ by geographic region within the state. Various Approaches to Fee Schedules States employ different approaches to constructing fee schedules and to maintaining them. California was a pioneer state in this regard, developing a three-digit coding scheme to identify specific medical procedures and a relative value scale to simplify assigning dollar amounts. Today, that coding scheme has evolved into a five-plus digit code called the CPT, which is the intellectual property of the American Medical Association (AMA). The CPT identifies professional services and is the standard coding scheme for doctors, physical therapists, chiropractors, dentists, and indeed for most medical professionals. While the majority of medical procedures are amenable to a single fee for service, some pose technical challenges. Radiology, for example, often involves distinct reimbursements for the use of equipment and technicians as well as for the reading by a radiologist (technical and professional components). Reimbursements for anesthesia often must take into account both risk and time. It is also important to appreciate that while medical facilities may use the CPT to itemize some services, that is far from standard, and many facility charges, like per diems, are not captured in the CPT. The CPT also does not cover medications. Most WC fee schedules today are based on the CPT. Many states are looking to expand their coverage of WC medical pricing, typically through additional schedules for hospitals and prescription drug plans. This study focuses on WC fee schedules for CPT-based reimbursement. With the implementation of new medical techniques, maintaining the CPT is a technical challenge. The AMA issues new versions of the CPT on an ongoing basis. WC fee schedules often specify the applicable version of the CPT to be used. With medical price inflation typically exceeding overall inflation, keeping fee schedule amounts current is another challenge. Promulgating a WC medical fee schedule represents a major commitment for the administrative body of a state WC system. There is considerable variation in the approaches states take to do this. Some state legislatures have very detailed rules with reference to particular data sources and time frames, while others delegate the task to committees whose members are doctors or other professionals with special expertise in this area. Beyond the technical and administrative challenges to maintaining a WC fee schedule, associations of medical specialists and employer groups align into opposing interest groups, inevitably bringing politics into the equation. RVS Method A common technique to simplify the task of maintaining WC fee schedules is the use of a relative value scale, or RVS. The idea is that while reasonable dollar reimbursements for two procedures X and Y may change with inflation, the ratio of the two amounts may stay the same. An RVS enables many codes to be updated just by specifying a single percentage change. Very often this is done by grouping CPT according to general categories of care, like surgery or physical medicine. This also conforms to the AMA scheme for organizing the CPT. For each category, a single conversion factor is used to translate the relative value, which varies within the category, to the dollar amount that is the maximum allowable fee shown on the schedule. For example, a state may currently use a conversion factor of $100 per value unit for physical medicine procedures and $150 per unit for radiology. In updating the schedule, the physical medicine conversion factor may be increased to $103 and the radiology to $175. In this way, some differentiation can be achieved without a case-by-case investigation of thousands of CPT procedures. The RVS scheme evolved from the idea that price should reflect the delivery cost of a medical procedure as a protection from prices that exploit the life and death nature of medical care. For that, it is natural to collect procedures together by the AMA categories of care. Neurosurgeons have similar malpractice, education, and rent costs that may be very different from those of obstetricians or podiatrists. As a result, the formulas used to calculate relative values conform to AMA categories of care and also vary by geographic region. The best known RVS is the Medicare RBRVS. Due perhaps to the enormous amount of work needed to maintain such an RVS, as well as deference to Medicare’s growing market share, the Medicare RBRVS is being used more and more by group health insurers. The Medicare RBRVS is also finding more application to WC fee schedules.

20
UCR-Based Method An alternative approach to WC fee schedules aligns the schedule amounts with what is being charged. These schedules are geared to UCR data. While such empirical data may not conform as neatly to service categories, it is still common for UCR-based fee schedules to aggregate data into service categories and use conversion factors to simplify maintenance of the WC fee schedule. Most states now have WC fee schedules. Because all use a CPT coding scheme, there is a superficial similarity between them. Beneath that surface, however, are significant differences in design and implementation.

21
APPENDIX 2: Glossary of Acronyms CPT: Current Procedural Terminology—coding scheme for medical procedures GH: Group Health HCFA: Health Care Financing Administration HCPCS: HCFA Common Procedure Coding System RBRVS: Resource-Based Relative Value Scale—used to assign a fair relative cost between charges for medical services; most common is that in use by Medicare UCR: Usual, Customary, and Reasonable—refers to reimbursement levels geared toward what is commonly charged or paid RVS: Relative Value Scale—assigns a fair relative cost between charges for medical services; most common is that in use by Medicare WC: Workers Compensation WCRI: Workers Compensation Research Institute—research organization headquartered in Cambridge, MA, dedicated to producing studies about public policy issues involving workers compensation systems
© Copyright 2007 National Council on Compensation Insurance Inc. All Rights Reserved.
THE RESEARCH ARTICLES AND CONTENT DISTRIBUTED BY NCCI ARE PROVIDED FOR GENERAL INFORMATIONAL PURPOSES ONLY AND ARE PROVIDED “AS IS.” NCCI DOES NOT GUARANTEE THEIR ACCURACY OR COMPLETENESS NOR DOES NCCI ASSUME ANY LIABILITY THAT MAY RESULT IN YOUR RELIANCE UPON SUCH INFORMATION. NCCI EXPRESSLY DISCLAIMS ANY AND ALL WARRANTIES OF ANY KIND INCLUDING ALL EXPRESS, STATUTORY AND IMPLIED WARRANTIES INCLUDING THE IMPLIED WARRANTIES OF MERCHANTABILITY AND FITNESS FOR A PARTICULAR PURPOSE.