Making Waste Productive - University of Wisconsin Center … · 2006-12-31 · Food industry...
18
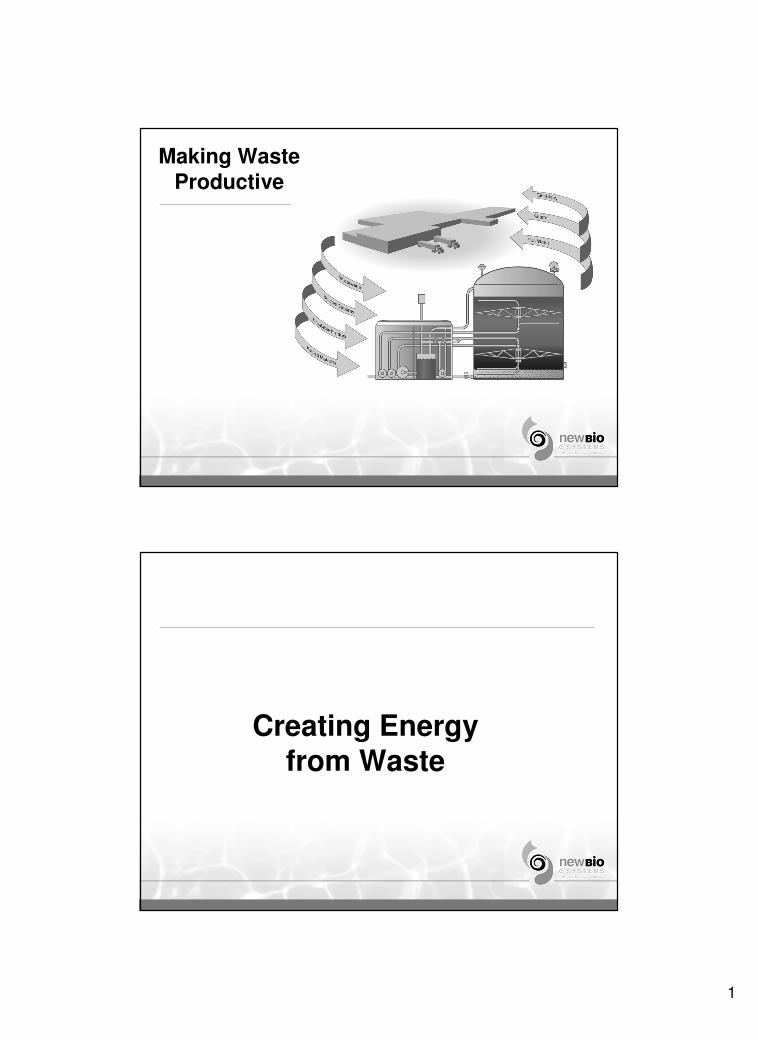
1 Making Waste Productive Creating Energy from Waste
Transcript of Making Waste Productive - University of Wisconsin Center … · 2006-12-31 · Food industry...
1
Making WasteProductive
Creating Energy from Waste

2
Creating Energy Inputs from Current Waste Outputs
►Organic material (waste) can be converted into energy (methane) through a process called anaerobic digestion
►Applications where waste disposal costs $100,000s/year can be turned into energy worth $100,000s/year
Creating Energy Inputs from Current Waste Outputs
►Two industries suitable to making energy from waste outputs
●Food industry
Cheese/Dairy plants
Snack Food plants
Prepared Food plants
●Biofuels industry

3
Converting Biomass to Energy
► The energy value of a waste stream is measured in pounds of chemical oxygen demand (COD)
► Every pound of COD digested results in 5.6 cubic feet of methane
► An effective anaerobic digester usually converts 95+% of the available COD into methane
► Every cubic foot of methane produces around 1,000 BTU’s of energy
● Approximately 5,600 BTUs in a pound of COD
► A pound of organic solids will contain around a pound of COD
► A truck load of solids can contain around 50,000 pounds of COD
● Energy potential to power a 1 MW generator on a continuous basis
Segregating Biomass Streams
► Process and environmental technologies segregate the insoluble fraction of a
biomass stream from the soluble
● Isolate the energy potential material within a facility
Clarifiers
Screens
All types of filtration and dissolved air flotation devices
● The isolated insoluble high energy potential stream usually ends up on a truck…
4
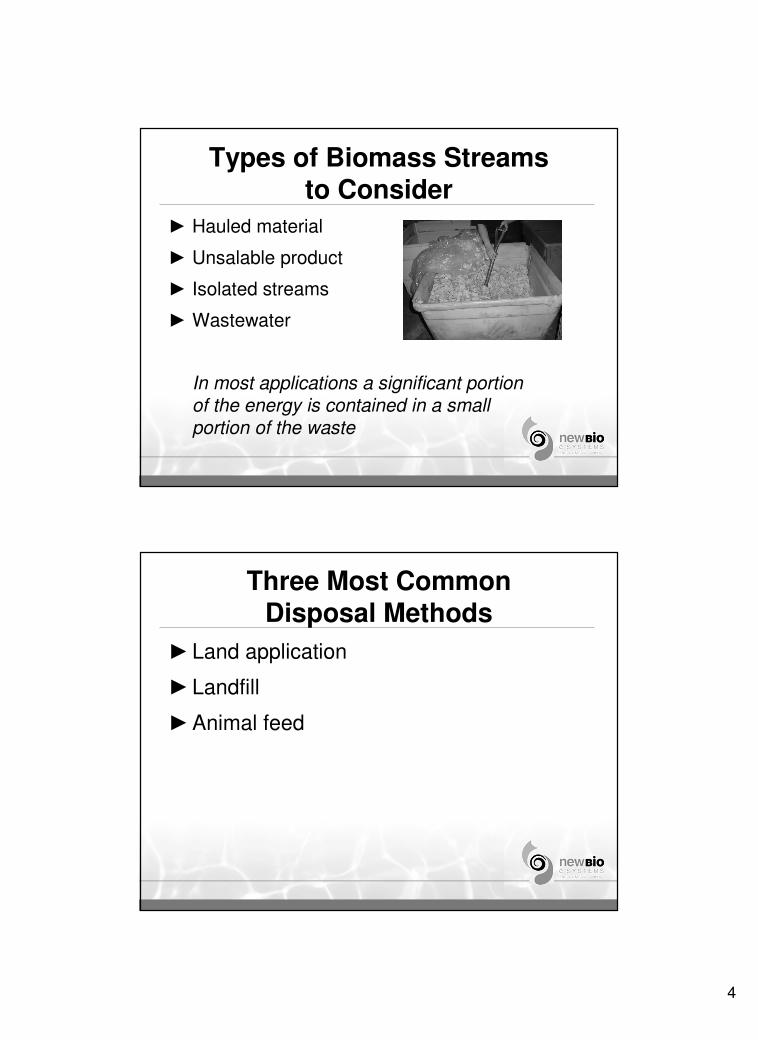
Types of Biomass Streams to Consider
► Hauled material
► Unsalable product
► Isolated streams
► Wastewater
In most applications a significant portion of the energy is contained in a small portion of the waste
Three Most Common Disposal Methods
►Land application
►Landfill
►Animal feed

5
Paying others to haul and dispose of biomass
. . . Is the waste of a valuable asset
Stop feeding your cash to cows!
How the Anaerobic Process Works
to Create Energy

6
Creating Energy Using the Anaerobic Process
Conversion of organic material
Raw input material:Fats, Oils, proteins, starches, carbohydrates, sugars
Digester
Acetogenic bacteria break complex food molecules down to
produce Carbon dioxide and Acetic Acid
Methanogenic bacteria break acetic acid down
to produce Methane
Acetic Acid
Carbon Dioxide Methane: 5.6 ft3/ lb COD
Discharge:
>95% COD Removal
�99% BOD Removal
Biomass accumulation: ~1% of Aerobic rate
• Air is not used so process proceeds at a much lower energy input than Aerobic treatment
pH Adjustment
Temperature Control
Factors in Renewable Energy Plant Design
►Material handling
►Solids retention
►Good contact
►pH control
►Temperature control
►Nutrients
►Gas utilization

7
The Economics of Making Waste Productive
Factors that Weigh in an Economic Decision
►Avoided disposal cost
►Energy value
►Green value—Some options have
significant federal/state taxes and other credits
● Renewable energy credits
● Emissions trading credits

8
Identifying and Evaluating Energy
Potential
Identifying Energy Potential
►There is a potential project if…
● Gas costs greater than $7 per MM BTU
● Electricity costs greater than 7.5¢ per KWh
● The plant produces 20,000 lbs. or more COD per day
● The plant is situated where there is a Renewable Portfolio Standard (RPS) in place
● Significant avoided cost

9
Identifying Energy Potential
►By geographic area, in cooperation with regional facility (power plant, research facility, cooperative)
►By individual plant
Identifying Energy Potential
► By individual plant: 3-step process
● STEP ONE: Data evaluation, using existing plant data
Estimate the effectiveness technology to generate energy in the form of methane gas
● STEP TWO: Lab evaluation, using actual samples of plant residuals and organic waste
Determine parameters, limits and potential quantities of methanegas generation
● STEP THREE: Demonstration project
Test the design parameters on waste residuals to finalize the optimum factors for a full-scale plant

10
Evaluating Energy Potential
► Demonstration project (pilot) can be an important step to developing design
► Material handling, gas storage, waste blending
Demonstration Project: Cheese Plant
► Project timeline: 9-29-05 to 5-25-06
► Waste source● Permeate stream
COD concentration averaged 52,000 mg/l
► Existing disposal methods ● Recovery of whey protein concentrate
● Recovery of lactose
● Treatment of 350,000 gallons per day of waste in plant-owned treatment plant
Trucked 6,000 gallon of waste from WPC and lactose recovery process

11
Demonstration Project: Cheese Plant
► Demonstration project goals
● Replicate a full-scale loading rate
50 lbs of feed COD/1000 gallons of digester liquid volume
● Determine COD Removal Efficiency
● Evaluate Gas Quality
● Evaluate Material handling needs
● Determine optimum factors for a full-scale plant
Demonstration Project: Cheese Plant
► Test history
● Permeate (whey filtered to remove protein) fed to digester (1-18-06――――5-25-06)
Average COD strength of 53,000 mg/l
Ramped up until the target feed rate of 300 lbs COD/day (50 lbs/1000 gallons of digester volume)

12
Demonstration Project: Cheese Plant
► Test history: COD
● Operating at design capacity on permeate
Demonstration Project: Cheese Plant
► Test history: methane production
● Relatively steady
Flow dropped when the gas flow was shut down to clean the gas discharge line of accumulated moisture

13
Demonstration Project: Cheese Plant
► Test history: methane flow per unit of COD removed
● Consistently within the projected flow rate of 5.6 cubic feet of methane/lb of COD
Demonstration Project: Cheese Plant
► Test history: BOD
● Virtually the entire BOD available has been consumed in the digester

14
Demonstration Project: Cheese Plant
► Test history: alkalinity
● Stable; most of the alkalinity is retained in the digester, conserving chemical
Demonstration Project: Cheese Plant
► Test history: calcium (needed for growth)
● Sufficient quantities; supplemental calcium is not required

15
Demonstration Project: Cheese Plant
► Test history: hydrogen sulfide
● A contaminant in the gas could cause operational difficulties in high concentrations; data inconclusive
Demonstration Project: Cheese Plant
► Test history: solids—TS, VS, TSS, VSS
● TSS-No accumulation of total suspended solids

16
Demonstration Project: Cheese Plant
► Test history: Methane and CO2 Production
● Bag samples were collected to verify the accuracy of the on-line instruments that measure COD and methane (two manufacturers = 4 instruments)
Demonstration Project: Cheese Plant
► Test history ―――― summary
● Conversion of the dairy permeate to energy is straight forward and achievable
Digester operated in a stable fashionNo accumulation of COD in the digesterConverted 98 percent of the COD (>99% of the BOD) to energyGas production met the design value of 5.6 cubic feet of methane/lb of COD removed
► Energy breakdown● 80% to 100% of gas demand
● 1 MW power output plus heat recovery
► Status● Demonstration project completed
● Final plant design

17
Demonstration Project: Cheese Plant
► Projected ROI—Assumes output of gas to be burned in boilers or fed into a co-generation facility to generate electricity and waste heat
● Option A assumes the addition of a co-generation unit and the recovery of heat from that unit
● Option B assumes that the biogas is only burned in existing boilers
● Both options assume the biogas plant is NewBio’s property and the biogas utilization equipment is the client’s property
► Calculations based on 120 months contract term
● No “Green Credits” included
Demonstration Project: Cheese Plant
► Projected ROI

18
Demonstration Project: Cheese Plant
► Projected ROI
More Information
►Contact NewBio
● www.newbio.com
● 952-476-6194