Making stakeholder communications work...communication with investors and other stakeholders....
27
Making stakeholder communications work Stakeholder communication study 2011/12
Transcript of Making stakeholder communications work...communication with investors and other stakeholders....

Making stakeholder communications workStakeholder communication study 2011/12

FOREWORD ...................................................................................................1
EXECUTIVE SUMMARY ..............................................................................2
ABOUT THE SAMPLE AND DATA .............................................................4
Market capitalisation ...........................................................................................4
Industry classification ..........................................................................................5
Local versus foreign companies ..........................................................................5
Public float and distribution of shareholdings .......................................................6
COMMUNICATION RESOURCES ...........................................................10
In-house or external IR function.........................................................................10
Size of the IR team ............................................................................................11
Responsibility for IR ..........................................................................................12
Reporting relationship of Head of IR ..................................................................14
Availability of separate IR contact ......................................................................15
Investors’ access to independent directors .......................................................16
COMMUNICATION MODES .....................................................................17
Separate IR Link on website .............................................................................17
COMMUNICATION CONTENT .................................................................20
Information in annual reports .............................................................................20
Information in company websites ......................................................................22
Sustainability reporting ......................................................................................24
COMMUNICATION FREQUENCY AND TIMELINESS ........................26
Frequency of results reporting ...........................................................................26
Timeliness of results reporting ...........................................................................27
Timeliness of annual general meeting ................................................................30
Number of days taken to hold AGM ..................................................................30
Time gap between Notice of AGM and AGM Date ............................................31
Announcement of AGM results .........................................................................32
COMMUNICATION QUALITY ...................................................................33
Independent review/audit of announced results ................................................33
Variances between announced and audited results ...........................................34
Modifications of auditor’s opinion ......................................................................35
Queries by the Singapore Exchange .................................................................36
Issue of profit warnings .....................................................................................38
Clarity of resolutions for AGMs ..........................................................................38
Accessibility of AGM location ............................................................................38
Clustering of AGMs ...........................................................................................40
Appointment of multiple proxies ........................................................................42
Method of voting at the AGM ............................................................................43
Publication and verification of vote results .........................................................44
Detailed minutes of the AGM ............................................................................44
CONCLUSIONS ...........................................................................................45
PAGE 1
CO
NTE
NTS
FOR
EW
OR
D
How companies communicate with investors and other stakeholders is one of the key pillars of corporate governance. This is enshrined in legal requirements, listing rules and codes of corporate governance. Today, listed companies are expected to do a lot more than just hold general meetings and publish statutory accounts. They are also subjected to increasingly extensive requirements and guidelines on shareholder communications, such as quarterly reporting, continuous disclosure and conduct of general meetings.
Many listed companies recognise the importance of engaging in effective communication with investors and other stakeholders. Consequently, they are taking actions such as investing more resources in stakeholder communications, employing different and new modes of communication, and improving the content, frequency, timeliness and quality of communications.
Nevertheless, there are challenges in effectively communicating with stakeholders and some companies are lagging behind in their stakeholder communication efforts.
ACCA and KPMG have come together to embark on a study to explore how companies communicate with their stakeholders. This report jointly presents our findings on how companies listed on the Singapore Exchange communicate with investors and other stakeholders.
This detailed analysis indicates that companies need to tailor their IR initiatives according to the unique profile and needs of their stakeholders. The distribution of shareholdings in Singapore listed companies should influence the way communication methods – communication resources, modes, content, frequency, timeliness and quality – are being applied.
Delivery on the priorities set out in this survey will ensure that the stakeholder communications truly reflect the distinct requirements of their stakeholders.
We trust that you will find this report informative.
Darryl WeeCountry HeadACCA Singapore
Tan Wah YeowDeputy Managing PartnerHead of Markets, KPMG in Singapore

In this report, we present findings from our research of how companies listed on the Singapore Exchange (SGX) communicate with investors and other stakeholders. Our research focuses on the six elements of the Stakeholder Communication Framework we developed as shown in Figure 1.
Our study covers 712 companies listed on the SGX as at 31 December 2011. Publicly available information from company annual reports, websites and announcements were used.
The key findings from our study are: On average, small shareholders make up 56 percent of the shareholders in a company but only hold about two percent of shares. In contrast, large shareholders make up two percent of shareholders on average but hold about 81 percent of shares.
Some 67 percent of companies which disclosed information about their Investor Relations (IR) functions have an in-house IR function, 24 percent outsource the IR function, seven percent co-source using a combination of in-house and outsourcing, and two percent handle it via a parent company. Local companies are more likely than foreign companies to have an in-house IR function.
More than half – 62 percent – of the
companies which disclosed information about their IR functions have only one person handling investor relations. Foreign companies are more likely than local companies to engage a dedicated person to attend to IR matters. Additionally, two-thirds of large cap companies have a dedicated IR person, while the Chief Financial Officer (CFO) is commonly responsible in small cap companies.
Among companies which disclose who their Head of IR reports to, two-thirds of these companies reveal that the Head of IR had a reporting line directly to the chief executive officer, while another 16 percent have it to the CFO. Surprisingly, 47 percent of companies did not disclose any IR contact information in the annual report or website.
Other than annual reports and announcements on SGXNET, the most common method of communication with shareholders is through the company website, with 91 percent of companies adopting this mode. Compared to small and mid cap companies, large cap companies are more likely to use a wide variety of communication modes including websites, press releases and briefings.
An assessment of the frequency of results reported by listed companies
reveals that 27 percent report semi-annually and 73 percent report quarterly. Of the 73 percent reporting quarterly, two percent had adopted this voluntarily.
Most companies report results close to the 45-day and 60-day deadlines for interim and annual results specified by the SGX.
As listed companies in Singapore are not required to have an auditor review their quarterly/half yearly or annual results before they are announced, it is not surprising that only four percent disclosed that their announced interim results had been reviewed by the auditor and only seven percent indicated that their announced annual results had been either reviewed or audited.
Five percent reported variances between their audited and announced annual results.
Five percent of companies received a modified auditor’s opinion, either a qualified opinion or a disclaimer of opinion. Approximately 32 percent of companies received one or more queries from the Singapore Exchange between 1 January 2011 and 31 January 2012, with the most common queries regarding full year results announcements or unusual share trading activity.
Thirty-six percent of companies had lower earnings or a higher loss compared with the preceding year but only 14 percent of these companies issued a profit warning in advance.
Forty seven percent of the companies in our study held their AGMs in the last five business days of April. There is a serious clustering of AGM dates which poses a challenge for shareholders, directors and the media participating in or covering AGMs.
Our detailed analysis shows that small shareholders are a common feature for Singapore listed companies. Companies need to tailor their IR initiatives according to the unique profile and needs of their stakeholders. They need to address their communication strategies in a holistic manner by focusing on the following aspects – communication resources, modes, content, frequency, timeliness and quality. Smaller companies should leverage more on technology to improve the effectiveness of communications with their stakeholders.
Furthermore, companies in Singapore need to ensure they are adhering to the principle of fair communication by taking into consideration the
PAGE 2 PAGE 3
FIgURE 1: Stakeholder Communications Framework
Resources
Frequency
Content
Modes
Timeliness
Quality
PAGE 2 PAGE 3
EXE
CU
TIV
E S
UM
MA
RY
Our key recommendations to companies for improving the effectiveness of their communications with stakeholders include the following:
• Thoroughly assess the investor profile of the company to ensure that modes, content, frequency, timeliness and quality of the communications truly reflect the distinct requirements of their stakeholders.
• Ensure that the IR function is adequately resourced, has adequate stature through an appropriate reporting relationship to senior management, and is closely involved with the strategic management of the business.
• Ensure that the IR function is accessible with IR contacts publicly disclosed in the annual report and website, and is actually working effectively. Contact details of the lead independent director or other independent directors should be disclosed if they are to be the points of contact for investors.
• Adequately leverage technology to communicate with their stakeholders. Smaller companies, in particular, should better use technology to overcome the lack of other forms of access to stakeholders enjoyed by larger companies.
• Ensure that shareholders have timely notice and information to make informed decisions at general meetings. Companies with international investors should strive to improve the notice period of general meetings.
• Take steps to minimise the risk of variances between announced and audited results, by ensuring adequate internal or independent review of results before announcement.
• Provide timely profit warnings where results are expected to fall below their results for the prior year or period.
• Enhance shareholders' participation at general meetings by ensuring that locations of meetings are easily reachable, that the risk of conflict in timing with other companies' general meetings is minimised, and that shareholders holding shares through nominee companies are not prevented from attending these meetings through the "two proxies" rule.
• Address the problem surrounding the clustering of annual general meetings, by planning well ahead and publicising meeting dates as early as possible.
• Provide shareholders who are unable to attend meetings with access to the proceedings of the meetings, such as through detailed AGM minutes or recordings of these meetings.
• Ensure that voting rights of shareholders are safeguarded by voting all resolutions by poll.
• Ensure that timely, complete and reliable disclosure of voting results is provided to all shareholders.
This research was led byAssociate Professor Mak Yuen TeenHead of ResearchKPMG Institutes in Singapore
needs of smaller investors, alongside the needs of their large institutional investors.

For this study, the sample consists of 712 companies listed on the SGX as at 31 December 2011. The following companies are excluded:• Companies with a secondary listing on SGX• Newly-listed companies, defined as those that have not held an AGM since listing
on SGX• Companies that have not released any annual report during the calendar year 2011• Companies that are under judicial management
The data for the study were obtained from the following secondary sources:• Latest annual report of the company as at 31 January 2012 • Company announcements to SGX from 1 January 2011 to 31 January 2012 • Company website
Market capitalisationFigure 2 shows the breakdown of companies in terms of market capitalisation (market cap). The companies in the sample have been divided into three market cap categories based on their market cap as at 30 December 20111.
Industry classificationThe breakdown of companies by industry is shown in Figure 3. The highest number of companies is in manufacturing (39 percent), followed by services (18 percent) and commerce (14 percent).
PAGE 5PAGE 4
FIgURE 2: Market capitalisation of companies in the study
FIgURE 3: Industry breakdown
FIgURE 4: Local versus foreign companies1 Since the study is based on public disclosures, the actual number of companies included for some of the analyses in this report may be less than 712. Where less than 712 companies are included, the actual number of companies included is disclosed. A
BO
UT
THE
SA
MP
LE A
ND
DAT
A
Local versus foreign companiesFigure 4 shows the breakdown of companies into local or foreign companies. Foreign companies are defined by SGX as those that have their principal place of business outside Singapore. Of the 712 companies, 64 percent are local companies.
Small cap: Companies with less than S$300 million in market capitalisation
Mid cap: Companies with S$300 million to less than S$1 billion in market capitalisation
Large cap: Companies with S$1 billion and above in market capitalisation
77%
13%
10%
6.2%Transportation/ Storage/Communication
1%Agriculture
4.5%Construction
0.3%Electricity/Gas/Water
13.9%Commerce
2.2%Hotel/Restaurants
38.8%Manufacturing0.3%
Mining/Quarrying
2.2%Multi-Industry
8.7%Properties
3.5%Finance
18.4%Services
36%Foreign
64%Local

Public float and distribution of shareholdingsThe investor communications strategies adopted by companies may depend, to some extent, on the percentage of shares which are held by public shareholders and on whether their public shareholders tend to be small retail or large institutional investors.
Figure 5 shows the percentage of the public float for the companies in the study. One and a half percent of companies either did not disclose their public float or disclosed that their public float was 10 percent or more. For the remaining companies, 70 percent have a public float of 50 percent and less. A fifth of the companies have a public float of 21 to 30 percent while a similar proportion has a public float of between 31 to 40 percent. Only nine percent have a public float of more than 70 percent.
Figure 6 compares the public float for small cap, mid cap and large cap companies. It shows that for all three market cap categories, more than 60 percent of companies have a public float of 50 percent or less. A larger percentage of mid-cap companies have a public float of 50 percent or less.
PAGE 7PAGE 6
FIgURE 5: Public float for all companies
FIgURE 6: Public float for small cap, medium cap and large cap companies
^ This includes seven companies which only disclosed that the percentage of shareholding of the company held in the hands of the public is more than 10 percent.
^ This includes seven companies which only disclosed that the percentage of shareholding of the company held in the hands of the public is more than 10 percent.
10-20
Percentage
21-30
31-40
41-50
51-60
61-70
81-90
91-100
Not Disclosed^
71-80
Large cap
Mid cap
Small cap
22.5%
10.2%16.9%
12.3%
19.8%21.3%
13.7%
21.1%
16.4%
16.9%14.6%
17.8%
12.4%6.7%
13.7%
10.4%5.6%5.5%
4.4%7.9%
6.8%
3.3%2.2%
1.4%
1.3%2.7%
9.7%2.3%
0.2%
10-20
Percentage
21-30
31-40
41-50
51-60
61-70
81-90
91-100
Not disclosed^
71-80
All companies
11.2%
19.4%
20.8%
16.7%
11.8%
9.3%
5.1%
2.9%
1.3%
1.5%

Figure 7 shows the average percentage of small, medium and large shareholders for the companies in our study, and separately for small cap, medium cap and large cap companies. Figure 8 shows the average percentage ownership held by these different groups of shareholders. We classify shareholders into small, medium and large shareholders based on the following:
• Small shareholders: shareholders holding 10,000 shares or less of a company• Medium shareholders: shareholders holding 10,000 to less than 1 million shares of
a company• Large shareholders: shareholders holding 1 million or more shares of a company
PAGE 9PAGE 8
It can be seen that on the average, small shareholders make up 56 percent of the shareholders in a company, but only hold about two percent of the shares. In contrast, large shareholders make up an average of about two percent of shareholders but hold about 81 percent of the shares.
The percentage of small shareholders and the percentage of shares held by these small shareholders increase as the market capitalisation of companies increases. On average, a small cap company has about 52 percent of small shareholders holding about two percent of the total number of outstanding shares. For a mid-cap company, on average, about 66 percent of small shareholders hold about three percent of the total shares. For a large cap company, small shareholders on average make up about 79 percent of the total number of shareholders, and they hold an average of just over three percent of the total shares.
This suggests that as companies become larger, small shareholders become more important and companies need to ensure that their communication plans address the concerns of such shareholders. In contrast, the percentage of medium shareholders and the percentage of shares held by
FIgURE 7: Average percentage of shareholders, by market cap
FIgURE 8: Average percentage of shares held, by market cap
such shareholders decline as market capitalisation increases. The pattern is less evident for large shareholders. Overall, the analysis of ownership distribution shows that a typical listed company in Singapore has a small public float, with many small shareholders who together hold a very small percentage of the total shares of the company.
Although small shareholders in most companies control only a small fraction of the total voting rights, it is still important for companies to bear them in mind when planning their communication strategies. These shareholders must be treated fairly and given access to relevant information.
The revised code of Corporate Governance (2012) recommends that companies put in place an investor relations policy to promote regular, effective and fair communication with shareholders. The revised Code also recommends that the board “identify the key stakeholder groups and recognise that their perceptions affect the company’s reputation” (Guideline 1.1(d)).
For most Singapore companies, small shareholders constitute an important stakeholder group whose views and rights need to be respected.
All companies
Small cap
Mid cap
Large cap
56% 42% 2%
52% 47% 1%
66% 33% 1%
79% 20% 1%
Small shareholders Medium shareholders Large shareholders
All companies
Small cap
Mid cap
Large cap
2%
2%
3%
3%
17% 81%
19% 79%
11% 86%
8% 89%
Small shareholders Medium shareholders Large shareholders

PAGE 11PAGE 10
CO
MM
UN
ICAT
ION
RE
SO
UR
CE
S Figure 10 shows that local companies are more likely than foreign companies to have an in-house IR function. This is understandable as foreign companies have their operations overseas, and an in-house IR function based overseas may not be sufficiently responsive to Singapore-based investors. About 40 percent of foreign companies either out-source or co-source their IR function, compared to 25 percent of local companies.
FIgURE 9: Nature of investor relations function, by market cap
FIgURE 11: Size of IR team, by market cap
Percentages based on the 315 companies that disclosed the nature of IR function (53 large cap, 55 mid cap and 207 small cap companies).
In this section, we examine how the IR function of companies is resourced by focusing on the following:
• Whether IR is managed in-house or externally• Size of the IR team• Primary person responsible for IR• Reporting relationship of the Head of IR • Availability of separate IR contact• Investors’ access to independent directors
In-house or external IR functionIn our study, 420 companies disclosed some information about their IR functions. Of these, 315 companies (75 percent) provided information on how their IR function is handled. These companies clearly view information related to their IR as sufficiently important to disclose to their stakeholders.
There are four ways in which these companies handle their IR function - in-house within the company, out-sourced, co-sourced, or handled by the parent or holding company. Figure 9 shows that 67 percent of the companies have an in-house IR function, 24 percent outsource the IR function, seven percent use a combination of -in-house and outsourcing (co-sourced). In rare cases, the IR function is handled by the parent/holding company, with only two percent using this method. An in-house IR function is most common for companies in all three market cap categories. Nearly all the large cap companies that disclosed the nature of their IR function handle their IR in-house. Out-sourcing or co-sourcing of IR is more common for small and medium-sized companies.
The decision to have an IR function handled in-house or through other methods involves a cost-benefit trade-off. While having an in-house IR function can better ensure that the IR function has a good understanding of the business, this may be too costly for a smaller company, which may also find it difficult to attract and retain suitably qualified IR professionals. Out-sourcing or co-sourcing may enable smaller companies to tap on competent IR advice which may otherwise not be available.
FIgURE 10: Nature of the investor relations function, local versus foreign companies
Percentages based on the 315 companies that disclosed the nature of IR function (113 foreign companies and 202 local companies)
Percentages based on the 313 companies that disclosed the size of IR team (53 large cap, 56 mid cap and 204 small cap
companies)
Size of the IR teamIn our study, 313 companies disclosed the number of persons in their IR teams. The size of the IR team includes both internal and outsourced IR personnel, where applicable. Figure 11 shows the size of the IR team by market cap. Most companies tend to have only one person handling IR. However, about one in five of the large cap companies have three or more persons handling IR.
In-house
Out-sourced
Co-sourced
Parent/HoldingCompany
1%
67%60%
64%98%
2%
7%
10%5%
7%
2%24%
29%24%
Mid cap
Small cap
All companies
Large cap
Foreign
Local
All companies
1 person
2 people
3 or morepeople
62%
75%
47%
62%
28%
29%
20%
32%
10%
9%
5%
21%
Mid cap
Small cap
All companies
Large cap
In-house
Out-sourced
Co-sourced
Parent/HoldingCompany
67%
71%
60%
24%
19%
31%
7%
9%
6%
2%
4%

PAGE 13PAGE 12
Responsibility for IROf the 235 companies that indicated they have an internal person handling investor relations (on a stand-alone basis or along with an external IR firm), 88 percent disclosed the designation of the person primarily responsible for investor relations. Figure 12 shows that 31 percent of companies have a dedicated person looking after IR, while 23 percent have the CFO performing this role. Foreign companies are more likely to engage a dedicated person to attend to IR related matters, while local companies are likely to give this responsibility to an IR officer, the CFO or a corporate communications professional.
Percentages based on the 210 companies (50 large cap, 35 mid cap and 125 small cap companies) that disclosed the position held by the primary person responsible for IR.
^Others comprise of persons holding positions such as Operations Manager, General Manager, Chief Investment Officer, Marketing and Sales director, etc.
Percentages based on the 210 companies (72 foreign companies and 138 local companies) that disclosed the position held by the primary person responsible for IR.
^Others comprise of persons holding positions such as operations manager, general manager, chief investment officer, marketing and sales director, etc.
Figure 13 shows the primary person responsible for IR for companies with different market cap. It can be seen that large cap companies typically have a dedicated person responsible for IR, with about two-thirds of such companies having such a position. In contrast, for the small cap companies, the CFO is most often the designated person responsible for IR, with almost one in three of these companies doing so.
FIgURE 12: Position held by primary person responsible for IR within companies
FIgURE 13: Position held by primary person responsible for IR within companies, by market cap
Investor Relations Officer
Financial Controller
Chief FinancialOfficer
CorporateCommunications
Executive Director
Others^
Company Secretary
Chief ExecutiveOfficer
Board Chairman
31%11%
46%68%
23%31%
14%8%
14%
15%9%
16%
10%14%
6%2%
5%9%
4%
3%
3%
2%
2%1%
3%
2%1%
12%12%
19%4% Mid cap
Small cap
All companies
Large cap
Foreign
Local
All companies
38%
Investor Relations Officer
Financial Controller
Chief FinancialOfficer
CorporateCommuncations
Executive Director
Others^
Company Secretary
Chief ExecutiveOfficer
Board Chairman
31%27%
23%20%
28%
14%19%
6%
10%8%
13%
5%5%
6%
4%3%
3%
2%1%
2%1%
12%13%
6%

PAGE 15PAGE 14
Reporting relationship of Head of IRThe reporting relationship of the Head of IR provides an indication of the stature of the IR function and the importance placed by a company on IR.
About 49 percent of the companies with an internal or co-sourced IR function disclosed who their Head of IR reports to. Figure 14 shows that around two-thirds of these companies have the Head of IR reporting to the chief executive officer, while another 16 percent has the Head of IR reporting to the CFO. A small number have the Head of IR reporting to other senior management or board members. These findings support the importance placed by these companies on IR.
Percentages based on the number of companies that disclosed whom the Head of IR reports, that is 114 companies.^ Others include Chief Operating Officer, Board of Directors, Finance Manager, etc.
Availability of separate IR contactCompanies which want to improve communication with investors should provide details of a separate IR contact either in their annual report or website, or preferably in both. This will ensure that investors with queries are able to reach the right person.
Figure 15 shows the disclosure of IR contacts for the companies, based on their market cap in our study.
About four percent of the companies provided the contact details for investor-related enquiries only in their annual report while 33 percent provided the contact details only on their website. Sixteen percent of the companies disclose their IR contact information in both the annual report and website. Almost 47 percent of the companies did not disclose any IR contact information in the annual report or website. Large cap companies are more likely to disclose their IR contacts. However, there is room for improvement in the disclosure of IR contacts for all market cap categories. Companies need to do more to provide avenues through which investors can contact companies with queries.
Beyond the disclosure of IR contacts, companies need to ensure that the IR contacts provided in their annual report and/or website are actually responsive to investors’ queries. Companies should periodically test the effectiveness of their IR contacts, for example, through something akin to “mystery shopping”.
FIgURE 15: Disclosure of IR contact, by market cap
FIgURE 14: Person to whom IR function reports to
16%Chief Financial Officer
10%Others^
5%Executive Director
1%Board Chairman
68%Chief Executive Officer
Website only
Annual report and website
Not disclosed
Annual report only
33%
32%
40%
36%
8%
4%
4%
4%
16%
11%
26%
37%
47%
53%
26%
23%
Mid capSmall capAll companies Large cap

PAGE 17PAGE 16
CO
MM
UN
ICAT
ION
MO
DE
SWe examined each company’s website, annual report and announcements to the SGX to determine the modes of communication used2. Figure 17 shows that - other than annual reports and periodic announcements on SGXNET - the most common modes of communication used are company websites (91 percent of companies), followed by press releases (77 percent) and email (34 percent).
We should highlight that there are other companies which have websites, but which are either solely in the Chinese language or which are not working. We excluded these companies in calculating the percentage of companies with websites. It is interesting that almost 10 percent of listed companies do not have a website which is accessible to most investors, even though these are all small and mid-cap companies. In today’s technology-driven environment where much information is available online, it would seem that having a working website easily accessible to stakeholders is an absolute necessity.
About one-third of the companies disclose that they have an email alert service. This service is generally provided through the company website where interested parties can sign up for regular updates from the company. Figure 17 also shows that large cap companies are more likely to use a wide variety of communication modes compared to the small and mid cap companies. For large and mid cap companies, company website, press releases and analyst briefings are the three most common modes of communication. For small cap companies, email replaces analyst briefings as the third most common mode of communication. Therefore, some smaller companies, recognising
FIgURE 16: Disclosure of IR contact, local versus foreign companies
Investors’ access to independent directorsThe revised Code of Corporate Governance (2012) recommends that companies should appoint a lead independent director where the Chairman and the Chief Executive Officer (CEO) is the same person, where the Chairman and the CEO are related by close family ties, where the Chairman and the CEO are both part of the executive management team, or where the Chairman is not an independent director. Under the Code, one of the lead independent director’s roles is to be a channel through which shareholders can raise concerns, after contact through normal channels of the Chairman, CEO or CFO has failed to resolve these concerns or where such contact is inappropriate.
In our study, 22 percent of the companies indicated that shareholders can contact the lead independent director or any of the independent directors regarding any issues of concern. Of these, 48 percent are foreign companies.
However, only five companies provided the contact details of these independent directors.
If companies are serious about allowing shareholders access to their lead independent director or other independent directors, the relevant contact details should be provided.
From Figure 16, it can be seen that foreign companies are slightly better than local companies when it comes to the disclosure of IR contact. Coupled with the earlier finding that foreign companies are more likely to assign IR responsibilities to a dedicated IR officer, this suggests that foreign companies do recognise the need to have effective communication with investors. This may be because they are based overseas and therefore need to do more to engage with local investors.
that analyst briefings and other direct means of engaging with investors (such as direct meetings, investor conferences and conference calls) may not be cost-effective or attract sufficient interest, are using other communication modes.
Less than five percent of the companies used other modes such as company visits and newsletters. A few companies have also adopted a more personal touch to their communications with stakeholders, by inviting members of the public to post questions to the board and management on the company website. Replies to these queries are then posted on the website.
Smaller companies need to consider how to improve communications with their stakeholders. To do so, they can consider better use of technology, such as websites and emails.
Figure 18 shows the most common modes of communication used by local and foreign companies. In general, the modes of communication used by local and foreign companies are similar. However, it is interesting that 15 percent of foreign companies do not have a company website easily accessible to stakeholders, compared to six percent of local companies. Foreign companies should review their use of websites to ensure that they provide easy access and are informative.
Separate IR link on websiteAs mentioned earlier, about 90 percent of the companies have a working website in English language for communicating with stakeholders. As investors are a key group of stakeholders for listed companies, we examine the extent to which these companies have a separate link for communicating with investors (IR link).
2 The availability of company websites was first obtained from the SGX website and the annual reports of companies. For companies that did not disclose their website on the SGX website or annual report, an online search was done to determine if the websites were available.
Websiteonly
Annual report and website
Annual report only
33%
Not disclosed
32%
35%
16%
15%
17%
47%
48%
45%
5%
4%
3%
ForeignLocalAll companies

PAGE 19PAGE 18
FIgURE 18: Modes of communication, local versus foreign companies
Of the companies which have a working website, we found that 79 percent have a separate IR link which contains relevant information (working IR link). Of the remaining companies, 15 percent did not have an IR link at all. The other six percent, or 42 companies, had defective IR links. Seven companies have an IR link which merely connects the user to the SGX homepage. There are 21 companies with an IR link which provides outdated information. Some 14 companies have IR links that are not working, are under construction, or which directed the user to an external site that does not contain any information regarding the company.
We then examined the user-friendliness and relevance to purpose for the 79 percent of companies (562 companies) which had a working IR link. We found that most of IR links (97 percent) are user-friendly, allowing for easy navigation through the link. For those which were not user-friendly, issues faced include a poor categorisation of information or the wrong use of colours and fonts (for example, use of a light font on a dark background which makes it difficult for information to be viewed clearly).
We found that 94 percent of these IR links provided up-to-date information regarding the company in the form of annual reports, interim reports, and the latest
announcements. However, the remaining IR links contained obsolete information, with important content such as annual reports, interim reports and/or announcements being outdated.
We recommend that all companies should have a dedicated IR link on their websites. However, it is also important that they ensure that these links are user-friendly and that information is regularly updated. They should also ensure that relevant information can be downloaded speedily. For example, while we found that about eight in 10 companies have materials such as annual reports which can be downloaded within a minute, some companies have materials which were time-consuming to download. One approach taken by some companies to make their annual reports more accessible is to put different sections of the annual reports in separate files. Another approach was to enable the viewing of the annual report online without having to download the file.
Companywebsite
Press releases
Analyst & results briefings
Media briefings
Investor conferences
One-on-one or group meetings
Conferencecalls
91%94%
85%
77%75%
79%
34%33%35%
33%32%35%
19%20%
16%
15%15%15%
10%11%
8%
9%9%9%
9%10%
7% Foreign
Local
All companies
Roadshows
FIgURE 17: Modes of communication, by market cap
Companywebsite
Press releases
Analyst & results briefings
Media briefings
Investor conferences
One-on-one or group meetings
Conferencecalls
Roadshows Mid cap
Small cap
All companies
Large cap
91%89%
94%100%
77%73%
83%93%
34%30%
39%53%
33%22%
61%84%
30%66%
10%19%
7%
2%
2%
2%
15%
20%66%
53%20%
16%53%
52%19%
10%
9%
9%

PAGE 21PAGE 20
In this section, we look at the types of information which are provided to stakeholders through the two major modes of communication used by companies – annual reports and websites.
Information in annual reports In addition to statutory accounts and reports, many companies today provide extensive additional information which may be of interest to different stakeholders. Figure 19 shows the major types of additional information provided by companies in their annual reports. Most companies disclose the key performance indicators or drivers of the company. Examples of such indicators or drivers are return on assets, return on equity, and profit before tax.
In 2004, the Council on Corporate Disclosure and Governance (CCDG) recommended that companies present the operating and financial review (OFR) in a separate section in the annual report. Just over three-quarters of the companies provide a separate OFR or management discussion and analysis (MD&A). However, more than 90 percent of the large cap companies do so.
It can be seen that in general, large cap companies tend to disclose more supplementary information in their annual reports. For example, two-thirds of large cap companies disclosed information about their share price performance and 40 percent disclosed their financial calendar
for the next financial year. In comparison, just four percent of small cap companies displayed both types of information.
There are no major differences in terms of disclosure of supplementary information in annual reports between local and foreign companies.
An important type of information which more companies should disclose in their annual reports is their policy on dividend payments. The revised Code of Corporate Governance (2012) recommends that companies have a policy on the payment of dividends which should be shared with shareholders (Guideline 15.5). Further, where dividends are not paid, it is recommended that companies should disclose their reasons.
Given the increasing focus on stakeholders, companies may also wish to consider improving disclosures which are relevant to these other stakeholders, including employees and customers. The recently released ASEAN Corporate Governance Scorecard, an initiative driven by the ASEAN regulators under the auspices of the ASEAN Capital Markets Forum, includes an assessment of disclosure of policies and activities undertaken by companies which are in the interest of other stakeholders. Examples include those related to target capital structure, employees’ health, safety and welfare, and supplier selection.
FIgURE 19: Disclosure of information in annual report, by market cap
CO
MM
UN
ICAT
ION
CO
NTE
NT
76%
93%
Key performance indicators/drivers
Separate OFR or MD&A
Dividend payout ratio
Share price performance
Financial calendar (for the next financial year)
Value Added Statements
Shareholder information (by geographical distribution)
IR calendar of events (IR activities for the past year)
Economic Value Added Statements
97%97%98%99%
73%80%
16%14%15%
33%
13%4%
24%67%
4%9%
18%40%
4%1%3%
23%
4%8%
25%
4%3%
26%
1%12%
Mid cap
Small cap
All companies
Large cap

PAGE 23PAGE 22
Information in company websites Today, many stakeholders are familiar with technology and access to the internet is widely available. Company websites have become an important mode for companies to communicate with their stakeholders. Compared to annual reports, communication through the website has the advantage of being more cost-effective, environmentally- friendly and timely. Information on websites can be more up-to-date than in annual reports.
Figure 20 shows the different items most relevant to investors that are commonly found on company websites. Nearly all the companies disclose information about the company and its activities. However, many companies are still not paying sufficient attention to their websites and ensuring that they include relevant information. For example, more than 20 percent of the companies with working websites do not put their annual reports or results announcements on their websites. One-third of companies do not put the profile of their directors and 60 percent do not put the profiles of their senior management on their websites.
The more progressive companies are increasingly putting additional corporate governance-related information or highlighting the more important aspects of corporate governance on their websites. Examples include board charter, terms of reference of key committees, and the company’s code of conduct/ethics.
Figure 21 shows the five most common types of information that are found on company websites for companies in different market cap categories. There is a significant difference in information provided on websites between small cap companies and other companies, but not between large cap and mid cap companies. Small cap companies are less likely to disclose all the different types of information, except for corporate information. This is likely so because smaller companies have fewer resources, and have therefore paid less attention to populating their websites with relevant information and keeping information up-to-date. Despite the possible lack of resources, small cap companies should bear in mind that leveraging technology and the appropriate use of their website may be more cost-effective when it comes to communicating with stakeholders. With small cap companies also attracting less interest from analysts, they need to be more proactive in building their relationships with stakeholders.
FIgURE 20: Information available on company website
FIgURE 21: Information available on company website - Top 5 most common, by market cap
Percentages based on 646 companies with working websites in English
FIgURE 21: Information available on company website - top 5 most common, by market cap
Corporate information
Annual reports
Results announcement
Profile of directors
Latest announcements
Latest news
Profiles of senior management
Stock prices
Financial highlights
Shareholders information
Financial ratios
Presentation slides of results/briefings
Insider trades
Circulars
Analyst reports
Webcast of results briefings
Financial calendar
Speeches 1%
99%
77%
73%
68%
68%
40%
40%
51%
40%
30%
29%
24%
22%
11%
10%
6%
3%
All companies
Corporate information
Annual reports
Results announcements
Profiles of directors
Latest announcements 86%
99%
100%
99%
72%
90%
95%
66%
95%
92%
64%
80%
81%
62%
86%
Large capMid capSmall cap

PAGE 25PAGE 24
Sustainability reportingOn 27 June 2011, the SGX released its “Policy Statement on Sustainability Reporting” for listed companies3. Although voluntary in nature, SGX encourages all companies to adopt sustainability reporting to raise corporate transparency, strengthen risk management, promote stakeholder engagement and improve communications with stakeholders.
The revised Code of Corporate Governance (2012) recommends that boards of directors “consider sustainability issues, e.g. environmental and social factors, as part of its strategic formulation” (Guideline 1.1(f)). Clearly, sustainability reporting will become an increasingly important part of communication with stakeholders.
A study commissioned by ACCA in 20104 found that only 21 Singapore companies published a detailed sustainability report, either separately or as part of the annual report, with 10 of them being listed companies. Of the companies covered in the study, only 11 companies published a separate sustainability report. They comprised 10 large cap companies and 1 mid cap company.
We reviewed annual reports and websites of the companies in our study to assess the extent to which they report on sustainability.
Figure 22 shows that only about one in four companies report on sustainability, either through a separate sustainability report and/or a section on sustainability in the annual report or website. It can be seen that a much higher percentage of large cap companies provide information on sustainability in their annual report and/or website. However, sustainability reporting is clearly still at a nascent stage in Singapore, particularly among small companies.
FIgURE 22: Sustainability reporting, by market cap
FIgURE 23: Sustainability reporting, by industry
3 “Guide to Sustainability Reporting for Listed Companies”, Singapore Exchange, 20114 “Sustainability Reporting: Sustainability Disclosure amongst companies in selected ASEAN member countries and responses from Stakeholders”, ACCA, March 2010
Figure 23 shows the extent of sustainability reporting by industry. The highest percentage of companies that report on sustainability are those in the multi-industry, transport/storage/communication, and 'others' (agriculture, electricity/gas/water and mining/quarrying) sectors. This may be due to a requirement for companies in these sectors to more closely manage their environmental and labour image.
^Others includes companies in agriculture, electricity/gas/water and mining/quarrying
Multi-Industry
Transporation/Storage/Communication
Properties
Finance
Hotels/Restaurants
Services
Commerce
Manufacturing
Construction
Others^
14%
71%
50%
19%13%
3%
Both
Annual Report only
Website only
55%
18%
3%6%
3%
6%
5%
10%
9%
5%
4%
8%
8%6%
6%
19%
16%4%
12%
16%18%
10%
30%7%
9%
31%
19%
13%
All companies
Small cap
Mid cap
Large cap
11%
4%
13%
15%
16%59%
6%
3%
Both
Website only
Annual Report only
8%
7%
17%
7%

PAGE 27PAGE 26
CO
MM
UN
ICAT
ION
FR
EQU
ENC
Y AN
D T
IMEL
INES
S In this section, we look at the frequency of results reporting by companies and also the timeliness of communications with stakeholders.
Frequency of results reportingRule 705(2) of the SGX Listing Manual requires a company to report results quarterly if • its market cap exceeded S$75 million as at 31 March 2003; • it was listed after 31 March 2003 and its IPO market cap exceeded S$75 million
at the time of listing; or• if its market cap is S$75 million or higher on the last trading day of each calendar
year commencing from 31 December 2006. A company which meets the criteria under this criterion has a grace period of one year to prepare for quarterly reporting.
Rule 705(3) requires companies to continue with quarterly reporting even if its market capitalisation subsequently falls below S$75 million. It also requires all other companies to report semi-annually.
In our study, 27 percent of the companies report semi-annually. Figure 24 shows that 73 percent of all companies report quarterly. It also shows that 67 percent of local and 83 percent of foreign companies respectively report quarterly.
Only two percent (12 companies) which reported quarterly were not required by rules 705(2) and 705(3) to do so and had therefore voluntarily adopted quarterly reporting.
It appears that most companies do not perceive the benefits of quarterly reporting to outweigh the costs, as they generally do not report quarterly unless it is mandatory.
FIgURE 24: Quarterly reporting
Timeliness of results reporting We found that 22 percent of the companies announced the release dates of their full year results5 in advance. An early announcement of the results release date would enable the busy investor, analyst or media personnel to better plan their schedules ahead of the release. Figure 25 shows that a much higher percentage of large cap companies announce their results release dates in advance.
Rule 705(1) of the SGX Listing Manual requires companies to announce their full year results within 60 days after the financial year end. Rules 705(2) and 705(3) require companies to report their interim results (quarterly or half-yearly results) within 45 days from the end of each quarter or the first half year. Figures 26 shows the number of days taken for companies to report their interim and annual results. It can be seen that the fastest release of interim results was just six days after the quarter end, and for annual results, just 12 days after the year end. However, there are companies which were late in announcing their interim and annual results, with the slowest being 131 days after the quarter end (by a company which reports quarterly) and 166 days after the year end.
5 The full year results announcement includes the quarter four results since companies report their Q4 and full year results in the same announcement. Interim refers to the Q1, Q2, Q3 and half-yearly results.
All companies
Local companies
Foreign companies
73%
67%
83%
FIgURE 21: Information available on company website - Top 5 most common, by market cap
FIgURE 25: Announcement of results release date in advance
All companies
Small cap
Mid cap
Large cap
22%
13%
38%
71%
FIgURE 21: Information available on company website - Top 5 most common, by market cap
FIgURE 26: Number of days taken to report results - all companies
Full year results 166
12
54
Interim results
6
131
38Mean
Maximum
Minimum

PAGE 29PAGE 28
Figure 27 shows the timeliness of results reporting for companies with different market cap. This shows that, on average, smaller companies are the slowest in reporting their interim and annual results, and large cap companies the fastest to do so. This is probably because smaller companies have fewer resources to manage their reporting obligations.
Figure 28 shows the differences in timeliness of results reporting between local and foreign companies. Although foreign companies are somewhat slower in results reporting, the difference is not significant.
FIgURE 21: Information available on company website - Top 5 most common, by market cap
FIgURE 27: Number of days taken to report results, by market cap
FIgURE 21: Information available on company website - Top 5 most common, by market cap
FIgURE 28: Number of days taken to report results, local versus foreign
Figures 29 and 30 show more detailed information about the number of days taken by companies with different market cap to release the interim and full year results. It can be seen that most companies report their results close to the 45-day and 60-day deadlines specified by SGX. Although this is understandable given the relatively short time given to companies to report their results, it does mean that results announcements are highly clustered. Note that such clustering will affect not only companies with the same year end, because companies with different year ends will often have the same quarter ends. Most Singapore companies have December, June and March year ends. All such companies which have to report quarterly will have similar quarter ends.
The significant clustering of results announcements may make it more difficult for some companies to attract the interest of investors, analysts and the media when they announce results. It also means that directors serving on multiple boards, especially those serving on multiple audit committees which have to review results before announcements, will likely be faced with highly clustered meeting dates. This may affect the ability of such directors to properly discharge their responsibilities.
Interim results - Large cap
Full year results - Large cap
Interim results - Mid cap
Full year results - Mid cap
Interim results - Small cap
Full year results - Small cap
4513
33
1889
44
6131
37
18166
52
10106
40
12120
55
Mean
Maximum
Minimum
Interim results - Local
Full year results - Local
Interim results - Foreign
Full year results - Foreign
10610
38
12
6
19
120
131
166
52
40
57
Mean
Maximum
Minimum
>45
41-45
31-40
21-30
11-20
0-10
Mid cap
Small cap
All companies
Large cap
Mid cap
Small cap
All companies
Large cap
>60
51-60
41-50
31-40
21-30
11-20
FIgURE 21: Information available on company website - Top 5 most common, by market cap
FIgURE 29: Timeliness in reporting interim results by market cap
FIgURE 21: Information available on company website - Top 5 most common, by market capFIgURE 30: Timeliness in reporting full year results,
by market cap
57%62%
51%34%
27%28%
25%26%
11%
4%
0%
1%
0%
6%
0%
15%
0%
8%16%
25%
1%
2%
2%
2%
4%
11%
79%
1%
2%
2%
0%
2%
10%
84%
2%
2%
3%
5%
7%
10%
73%
0%
1%
4%
8%
18%
24%
45%

PAGE 31PAGE 30
Timeliness of annual general meetingNumber of days taken to hold AGMFor companies incorporated in Singapore, Section 175 (1) of the Companies Act states that a company should hold its AGM not more than 15 months after its last AGM. Section 201(1)(a) and and Rule 707(1) of the SGX Listing Manual require listed companies to hold their AGM within four months from the financial year end.
Figures 31 and 32 show the number of days taken to hold the AGM from the financial year end. The data has been analysed according to market cap and whether the company is a foreign or local company. On average, companies hold their AGMs 117 days after the financial year end, which is very near to the maximum allowed under the rules. Twenty-three companies hold their AGMs after the period allowed, presumably with permission granted by the relevant regulators. The longest time taken to hold the AGM after the year end was 304 days, or about 10 months, after the year end.
FIgURE 21: Information available on company website - Top 5 most common, by market cap
FIgURE 21: Information available on company website - Top 5 most common, by market cap
FIgURE 21: Information available on company website - Top 5 most common, by market cap
FIgURE 31: Number of days taken to hold the AgM, by market cap
FIgURE 32: Number of days taken to hold the AgM, local vs foreign
FIgURE 33: Time gap between Notice of AgM and AgM date
Time gap between Notice of AgM and AgM dateA report published by the Asian Corporate Governance Association in 20066 recommends that companies should release the Notice of AGM and accompanying information at least 28 days before the AGM date. This is to provide shareholders (particularly international institutional shareholders) with sufficient time to analyse the information and make informed voting decisions.
Rule 704(15) of the SGX Listing Manual requires companies to send their Notice of AGMs to shareholders at least 14 calendar days before the AGM. For meetings to pass special resolutions, the Notice is to be sent at least 21 calendar days before the AGM. In both instances, the number of days excludes the date of notice and the date of the meeting. Sections 177 (2) and 184 (1) of the Companies Act have similar requirements. Section 185 of the Companies Act also specifies that in the case of matters requiring special notice, a notice period of at least 28 days is to be given.
Figure 33 shows that only six percent of companies provide a notice period of 28 days or more. On average, large cap companies provide longer notice for their AGMs, with just over one in five of these companies providing at least 28 days of notice. About 72 percent of small cap and 53 percent of mid cap companies released their Notice of AGMs with a time gap of between 14 to 16 days. Only three percent of small cap companies and 12 percent of mid cap companies provide at least 28 days of notice.
6 “ACGA Asian Proxy Voting Survey 2006”, Asian Corporate Governance Association, 2006
All companies
Large cap
Mid cap
Small cap
304
304
249
133
117
70
112
87
116
77
70
117
Minimum
Maximum
Mean
Local
Foreign
115
249
70
118
304
82 Mid cap
Small cap
All companies
Large cap
Exactly 14 days
15 to 16 days
17 to 20 days
21 to 27 days
28 daysor more
31%35%
21%8%
34%37%
32%16%
13%14%14%
11%
16%11%
21%43%
6%3%
12%22%
Minimum
Maximum
Mean

PAGE 33PAGE 32
Of the 22 percent of companies shown in Figure 33 with a notice period of 21 days or more, seven percent had a special resolution to be voted on at the AGM and were therefore required to give at least 21 days of notice.
We would, however, emphasise that Singapore-listed companies must hold their AGMs within four months after the financial year end – which is a shorter period than that allowed for listed companies in other countries such as Malaysia and Hong Kong. The requirements for the annual accounts to be audited before they are presented to shareholders at the AGM may pose a constraint on companies to hold their AGMs and send out notices to meetings sooner. It may also cause more clustering of AGMs than in other countries which allow companies more time to hold their AGMs after the year end. International investors calling for improvements to the timeliness of notices of AGMs or less clustering of AGMs should bear in mind this constraint. Nevertheless, we can see some companies, especially large cap companies which are more likely to attract international investors, making efforts to increase the notice period. Companies should also explore how to better use technology to help overcome constraints faced by investors, especially international investors holding shares through nominee companies where the “voting chain” is relatively more complicated and time becomes much more of an issue. For example, they could consider amending their articles to provide for voting by email or other means of electronic voting.
Further analysis was conducted on the six percent of companies (41 companies) which had notice periods of at least 28 days to determine if there were other statutory requirements the companies were subjected to.
Three of the companies that released their Notice of AGM at least 28 days before the AGM date are incorporated in China. Under Article 20 of the Special Provisions of the State Council on Issuing and Listing of Shares Abroad by Companies Limited by Shares (Decree No.160 of the State Council of the People’s Republic of China, promulgated on August 4, 1994), the China Securities Regulatory Commission requires companies that are incorporated in China to issue a written notice of 45 days in advance for shareholders’ meetings.
Nine companies with a time gap of 28 days or more are also listed on the Hong Kong Stock Exchange. Section 3.1 of the Guide on General Meetings issued by the Hong Kong Stock Exchange states that companies should release the Notice of AGM at least 20 clear business days before the meeting.
Announcement of AgM resultsRule 704 (16) of the SGX Listing Manual requires companies to immediately announce the results from the AGM after the meeting. All the companies in the study released the results of their AGM on the same date as the AGM except for seven companies, which released their results between one and four days after the AGM. Only one of these companies is a local company.
CO
MM
UN
ICAT
ION
QU
ALI
TY
In this section, we examine the following indicators of quality of communications between companies and stakeholders throughout the year and in relation to the conduct of the annual general meeting (AGM):
• whether the quarterly or annual results announced by companies have been reviewed or audited by the external auditor
• variances between the announced results and audited results• modifications of auditors’ opinion • queries by SGX• issue of profit warnings when there is a decline in profitability• clarity of resolutions in the Notice of AGM accessibility of AGM location• extent of clustering of AGMs • whether companies allow more than two proxies to attend the AGMs• method of voting at the AGM• publication and independent verification of detailed results of voting at AGMs• publication of detailed minutes of AGMs
Independent review/audit of announced results Listed companies in Singapore are not required to have an auditor review or audit their quarterly/half-yearly and annual results before they are announced. Since quarterly/half-yearly results have to be made within 45 days and annual results within 60 days of the end of the financial period, it may be challenging for companies to have these results reviewed or audited before they are announced.
It is therefore not surprising that very few companies disclosed that their announced results have been reviewed or audited. Figure 34 shows that only four percent of the companies disclosed that they had at least one of their quarterly results reviewed. It also shows that large cap companies are more likely to do so, but even then, only eight large cap companies did so.
FIgURE 34: Review of quarterly/half-yearly results
Was notreviewed
Reviewed
2%
96%
98%
93%
84%
4%
7%
16%
Mid cap
Small cap
All companies
Large cap

PAGE 35PAGE 34
One percent or six of the companies disclosed that their announced full year results had been reviewed while six percent or 42 of the companies disclosed that their full year results were audited. The breakdown according to market cap is shown in Figure 35. It can be seen that a third of large cap companies disclosed that they had their full year results audited or reviewed by the auditors prior to announcement.
FIgURE 36: Nature of Audit Opinion
7 The percentages for “Net profit (loss) attributable to owners of the company” includes “Profit for the period attributable to owners of the parent” and “profit attributable to equity holders”, depending on which term has been used by the company in its disclosure. In general, it refers to net profit (loss) attributable to persons other than minority/non-controlling interests.
8 The negative sign indicates that the announced results were higher than the audited results or the losses in the announced results were lower than the audited results
FIgURE 21: Information available on company website - Top 5 most common, by market cap
TABLE 1: Extent of variances in net profit (loss) attributable to owners of the company
Extent of variance8 Number of companies
More than - 100 percent 1
-20 to -60 percent 5
-10 to -20 percent 4
0 to -10 percent 11
0 percent 1
0 to 10 percent 9
10 to 20 percent 2
20 to 30 percent 2
30 to 50 percent 2
Total number of companies 37
FIgURE 21: Information available on company website - Top 5 most common, by market cap
FIgURE 37: Qualified or Disclaimer of Audit Opinion, local versus foreign companies
Modifications of auditor’s opinionFigure 36 shows the nature of the auditor’s opinion received by companies in the study. Five percent of the companies received a modified auditor’s opinion - either a qualified opinion or disclaimer of opinion. Except for one mid cap company which had received a disclaimer of audit opinion, the rest of the companies that received a qualified or disclaimer of audit opinion are small cap companies.
Figure 37 suggests that local companies are slightly less likely to receive modified audit opinions. This difference is primarily due to foreign companies being somewhat more likely to receive an auditor's opinion with an emphasis of matter.
FIgURE 35: Review/Audit of full year results
Mid cap
Small cap
All companies
Large cap
Variances between announced and audited resultsThere are 37 companies (five percent) that reported variances between their audited and announced annual results, based on net profit (loss) attributable to owners of the company (Table 1)7. The variances ranged from -1052 percent to +41 percent. Except for two mid cap companies, the rest are small cap companies. This suggests that the more limited resources of smaller companies have had an impact on the quality of their reporting of results. There is, however, no significant difference in likelihood of variances between local and foreign companies.
In the previous subsection, we reported that 48 companies disclosed that their announced annual results were either reviewed or audited. Not surprisingly, none of these companies reported variances between their announced and audited results.
Table 1 shows the range of variances in net profit (loss) attributable to owners of the company.
Audited
Reviewed
29%8%
3%
6%
1%
2%
4%92%Unmodified
1%Qualified with emphasis of matter
2% Qualified
2% Disclaimer3% Unmodified - emphasis of matter
Unmodified
Unmodified - emphasis of matter
Disclaimer
Qualified
Qualified with emphasis of matter
94%
90%
2%
5%
2%
2%
2%1%
1%
1% Foreign
Local

PAGE 37PAGE 36
Queries by the Singapore ExchangeQueries from SGX can create the perception that a company has not been sufficiently proactive in ensuring that its communications are understandable and transparent.
About 32 percent of companies received queries from the Singapore Exchange for the period between 1 January 2011 and 31 January 2012. Some companies received more than one query for different issues while there were some that received several queries for the same issue. The most common queries were regarding the full year results announcement (32 percent), unusual share trading activities (28 percent) and third quarter results (25 percent). Less common were queries relating to auditors’ opinion, appointments/resignations of key officers, and differences between audited and announced results.
Percentages based on number of companies that received one or more queries from SGX, that is 224 companies
FIgURE 38: Nature of query by SgX
For both small cap and mid cap companies, 33 percent received one or more queries from the SGX, compared to 15 percent for large cap companies.
Figure 39 shows the types of queries received for companies with different market cap. It can be seen that large cap companies are more likely to be queried about unusual share trading activities compared to other types of queries, such as those relating to results. Mid-cap companies also often receive queries about unusual share trading activities, but frequently also receive queries about other issues, such as results. In contrast, the types of queries small cap companies receive span across different areas, except they rarely receive queries about media reports.
Companies can take steps to minimise queries through proactive measures, such as carefully reviewing their disclosures, and monitoring share trading activity and media reports. They should pay particular attention to significant changes in results compared to the prior year or period, or where there are major items which may have a material impact on their financial statements. In such cases, clearer explanations at the time of announcement of results or transactions may help preempt queries from the SGX. It may also give a more positive impressions about internal processes relating to stakeholder communications.
Percentages based on number of companies that received one or more queries from SGX within each market cap category (i.e., 11 large cap, 29 mid cap and 184 small cap companies).
FIgURE 39: Nature of query by SgX, by market cap
Full year results
Unusual share trading activities
Third quarter results
Second quarter/ half year results
Annual report
First quarter results
Acquisition/Disposal
Media reports
Audit opinion
Appointments/Resignation of directors and management
Difference in audited and unaudited results
Full year results
Unusual share trading activity
Third quarter results
Second quarter/ half year results
Annual report
First quarter results
Acquisition/ Disposal
Media reports
Audit opinions
Appointments/Resignation of directors and management
Difference in audited and unaudited results
Large cap
Mid cap
Small cap
OthersOthers
34%28%
9%
23%48%
55%
17%27%
21%22%
17%17%18%
16%10%
11%
9%
3%14%
18%
2%
2%
2%
10%7%
32%
28%
25%
21%
17%
15%
10%
5%
2%
1%
1%
9%

PAGE 39PAGE 38
Issue of profit warnings There have been instances where companies have been criticised for failing to issue profit warnings in advance where there is a decline in profitability. In the absence of a profit warning, investors may expect a company to maintain or increase its profit compared to the previous period. Issuing a profit warning in advance of an announcement of a decline in profitability allows a company to manage investors' expectations. It also keeps the market informed on a timely basis, and demonstrates that the company is transparent.
In our study, 36 percent of the companies had lower earnings or a higher loss for the full financial year as compared to the preceding year. Of these, only 14 percent —or less than half the companies—announced a profit warning in advance to inform the market that the company is expecting lower earnings or a higher loss for the year. More companies should adopt the good practice of issuing a profit warning before they announce a decline in profitability.
Clarity of resolutions for AgMsThe revised Code of Corporate Governance (2012) recommends that there should be separate resolutions at general meetings on each substantially separate issue. Companies should also avoid "bundling" resolutions unless they are interdependent and linked so as to form one significant proposal. All the companies in the study have separate resolutions for substantially different issues.
However, many companies can improve the clarity of their resolutions by providing more detailed information about these resolutions (other than certain routine resolutions such as the adoption of the accounts). In our study, we found that 94 percent of the companies provided detailed information on items covered under “Special business” in the Notice to AGM. However, it was very rare for companies to provide detailed information on each resolution in the Notice to the AGM, even though some of this information may be provided in the annual report itself.
Companies should consider providing more information on important resolutions, and not just those under "special business". For example, there have been calls for companies to provide more information and justification for the resolutions proposing the appointment of directors, particularly independent directors. Another example is the resolution to approve the payment of dividends. Guideline 15.5 of the revised Code of Corporate Governance (2012) recommends that companies should have a policy on payment of dividends which should be communicated to shareholders. It also recommends that where dividends are not paid, companies should disclose their reasons. Companies should consider providing more information on their dividend policy and why the proposed amount of dividends is considered to be appropriate.
Accessibility of AgM location In June 2011, the Singapore Exchange released a public consultation paper9 which included a proposal that companies with a primary listing on the Singapore Exchange should hold their AGM in Singapore, unless they are prohibited by relevant laws and regulations in the jurisdiction of their incorporation. About 98 percent of the companies in our study held their AGMs in Singapore. Therefore, the SGX’s proposal is likely to affect only a small number of companies. Figure 40 shows where the AGMs of the remaining two percent of companies (16 companies) were held.
9 Consultation Paper on Proposed Rule Changes on General Meetings to Increase Shareholder Engagement and Enhance Corporate Governance Practice, Singapore Exchange, 2 June 2011
Figure 41 shows that of the companies that held their AGMs in Singapore, 52 percent held it in a central location, defined as the Central Business District and its surrounding fringe area10. Some of the companies which held their AGMs in Singapore held them at the company headquarters or at another company site which was outside the central area. However, a few companies disclosed that transportation facilities were provided from a nearby MRT station or bus interchange for the convenience of shareholders who wish to attend.
The market cap of companies that held their AGMs at a central location is also shown in Figure 41. It can be seen that a higher percentage of large cap companies held their AGMs in a central location compared to the mid and small cap companies.
FIgURE 21: Information available on company website - Top 5 most common, by market cap
FIgURE 40: Number of companies with AgMs held outside Singapore
FIgURE 41: Companies that held the AgM in Singapore
Percentages based on the number of companies that held the AGM in a central location in Singapore, that is 696 (70 large cap, 88 mid cap and 538 small cap companies)
10 Fringe area refers to any location within 2.5 km from the Central Business District
5
4
1 1 1
2 2
Netherlands Taiwan ThailandChina Hong Kong Indonesia Israel
Central location
Non-central location
52%
47%
67%
79%
48%
53%
33%
21%
Mid cap
Small cap
All companies
Large cap
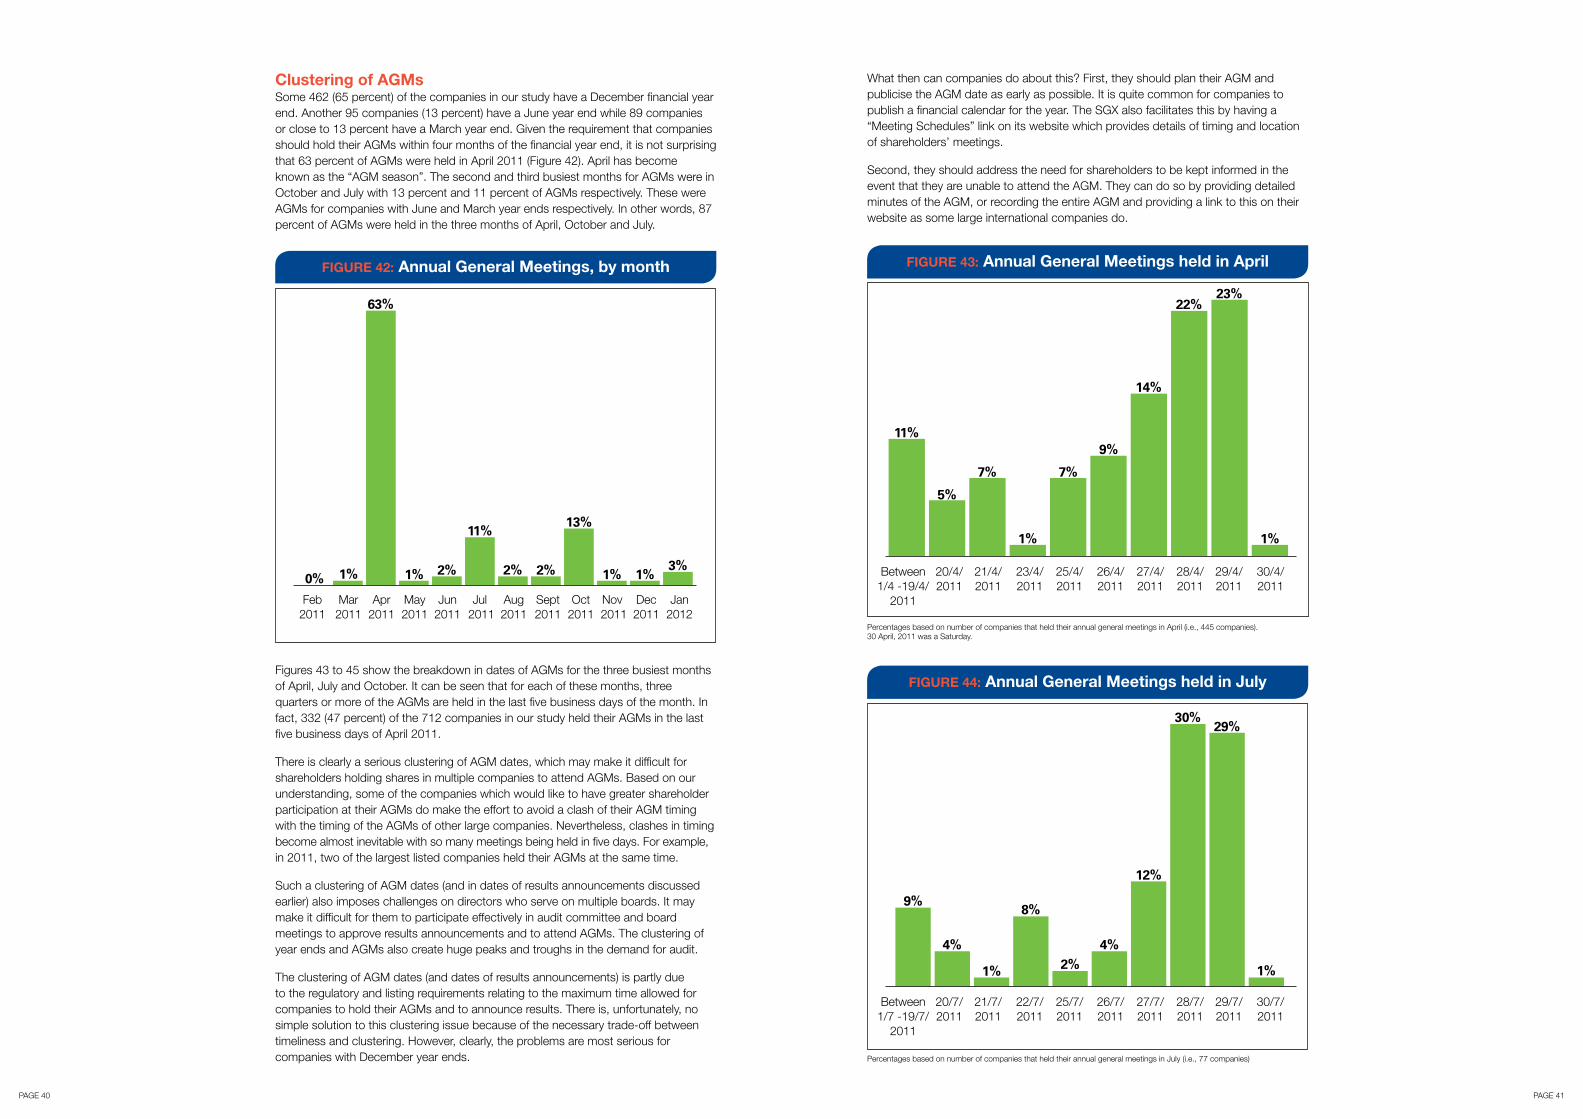
PAGE 41PAGE 40
Clustering of AgMsSome 462 (65 percent) of the companies in our study have a December financial year end. Another 95 companies (13 percent) have a June year end while 89 companies or close to 13 percent have a March year end. Given the requirement that companies should hold their AGMs within four months of the financial year end, it is not surprising that 63 percent of AGMs were held in April 2011 (Figure 42). April has become known as the “AGM season”. The second and third busiest months for AGMs were in October and July with 13 percent and 11 percent of AGMs respectively. These were AGMs for companies with June and March year ends respectively. In other words, 87 percent of AGMs were held in the three months of April, October and July.
FIgURE 42: Annual general Meetings, by month
FIgURE 44: Annual general Meetings held in July
What then can companies do about this? First, they should plan their AGM and publicise the AGM date as early as possible. It is quite common for companies to publish a financial calendar for the year. The SGX also facilitates this by having a “Meeting Schedules” link on its website which provides details of timing and location of shareholders’ meetings.
Second, they should address the need for shareholders to be kept informed in the event that they are unable to attend the AGM. They can do so by providing detailed minutes of the AGM, or recording the entire AGM and providing a link to this on their website as some large international companies do.
Figures 43 to 45 show the breakdown in dates of AGMs for the three busiest months of April, July and October. It can be seen that for each of these months, three quarters or more of the AGMs are held in the last five business days of the month. In fact, 332 (47 percent) of the 712 companies in our study held their AGMs in the last five business days of April 2011.
There is clearly a serious clustering of AGM dates, which may make it difficult for shareholders holding shares in multiple companies to attend AGMs. Based on our understanding, some of the companies which would like to have greater shareholder participation at their AGMs do make the effort to avoid a clash of their AGM timing with the timing of the AGMs of other large companies. Nevertheless, clashes in timing become almost inevitable with so many meetings being held in five days. For example, in 2011, two of the largest listed companies held their AGMs at the same time.
Such a clustering of AGM dates (and in dates of results announcements discussed earlier) also imposes challenges on directors who serve on multiple boards. It may make it difficult for them to participate effectively in audit committee and board meetings to approve results announcements and to attend AGMs. The clustering of year ends and AGMs also create huge peaks and troughs in the demand for audit.
The clustering of AGM dates (and dates of results announcements) is partly due to the regulatory and listing requirements relating to the maximum time allowed for companies to hold their AGMs and to announce results. There is, unfortunately, no simple solution to this clustering issue because of the necessary trade-off between timeliness and clustering. However, clearly, the problems are most serious for companies with December year ends.
FIgURE 43: Annual general Meetings held in April
Percentages based on number of companies that held their annual general meetings in April (i.e., 445 companies). 30 April, 2011 was a Saturday.
Percentages based on number of companies that held their annual general meetings in July (i.e., 77 companies)
63%
Feb 2011
13%11%
1% 1%3%2% 2%2%1%1%0%
Mar 2011
Apr 2011
May 2011
Jun 2011
Jul 2011
Aug 2011
Sept 2011
Oct 2011
Nov 2011
Dec 2011
Jan 2012
Between 1/4 -19/4/
2011
20/4/2011
21/4/2011
23/4/2011
25/4/2011
26/4/2011
27/4/2011
28/4/2011
29/4/2011
30/4/2011
11%
1% 1%
5%
7% 7%
9%
14%
22%23%
Between 1/7 -19/7/
2011
20/7/2011
21/7/2011
22/7/2011
25/7/2011
26/7/2011
27/7/2011
28/7/2011
29/7/2011
30/7/2011
1%
9%
4%
8%
2%4%
12%
30%29%
1%

PAGE 43PAGE 42
Appointment of multiple proxiesSection 181(1)(b) of the Companies Act states that a member of a company is allowed to appoint a maximum of two proxies to attend and vote at a meeting of the company, unless the company’s articles of association provide otherwise. Guideline 14.3 of the revised Code of Corporate Governance (2012) encourages companies to allow corporations which provide nominee or custodial services to appoint more than two proxies so that shareholders who held shares through such corporations can attend and participate in general meetings as proxies.
Only 27 companies (or less than five percent) disclosed that they allow the appointment of multiple proxies, on a voting or observer basis. Although some other companies disclosed that they allow multiple proxies, some imposed constraints such as permission having to be sought from the Chairman, approval being subject to availability of seats, written requests to be made, and approval granted on a case-by-case basis. The most common reason given for not allowing multiple proxies for nominee companies was that this would create separate classes of rights among shareholders.
In 2011, the Ministry of Finance (MOF) published the "Report of the Steering Committee to Review the Companies Act". One of the recommendations by the Steering Committee was that11:
Section 181 should be amended to the effect that, subject to contrary provision in the company’s articles, members falling within the following two categories are allowed to appoint more than two proxies, provided that each proxy is appointed to exercise the rights attached to a different share or shares and the number of shares and class of shares shall be specified:
(a) any banking corporation licensed under the Banking Act or wholly-owned subsidiary of such a banking corporation, whose business includes the provision of nominee services and who holds shares in that capacity; and
(b) any person holding a capital markets services licence to provide custodial services for securities under the Securities and Futures Act. (Recommendation 2.10)
FIgURE 45: Annual general Meetings held in October
Percentages based on number of companies that held their annual general meetings in October (i.e., 94 companies) FIgURE 46: Voting methods used at AgMs, by market cap
It also recommended that the Companies Act "should be amended” to allow the proposed multiple proxies to each be given the right to vote on a show of hands in a shareholders’ meeting. (Recommendation 2.11)
If these recommendations are accepted, companies will need to address the issue of having more proxies being appointed by certain shareholders to attend meetings.
Method of voting at the AgMGuideline 16.5 of the revised Code (2012) recommends as follows: “Companies should put all resolutions to vote by poll and make an announcement of the detailed results showing the number of votes cast for and against each resolution and the respective percentages. Companies are encouraged to employ electronic polling”. The SGX has also proposed to make poll voting for all resolutions mandatory in June 201112. In our study, we found that only 11 percent of the companies disclosed the voting method used at their annual general meetings. Only 50 companies (seven percent of all companies) have disclosed that they adopted voting by poll. To our knowledge, most companies still conduct their voting by a show of hands. As Figure 46 shows, large cap companies are more likely to disclose the voting method used, and amongst these, a larger percentage used voting by poll. Of the companies that reported they conduct their voting by poll, 25 percent indicated that the voting was conducted using electronic devices, as opposed to using ballot slips.
11 Chapter 2 - Shareholders' Rights and Meetings, Report of the Steering Committee for Review of the Companies Act, MOF and ACRA, 2011
12 Consultation Paper on Proposed Rule Changes on General Meetings to Increase Shareholder Engagement and Enhance Corporate Governance Practice, SGX, June 2011
Between 1/10 -19/10/
2011
20/10/2011
21/10/2011
24/10/2011
25/10/2011
27/10/2011
28/10/2011
31/10/2011
11%
4%
15%
5%
15%16%
22%
12%
Not disclosed
By poll
By show of hands
89%
95%
80%
59%
16%
30%
7%
3%
4%
2%
4%
11% Mid cap
Small cap
All companies
Large cap

PAGE 45PAGE 44
Effective communications with stakeholders, including investors, is an important pillar of good corporate governance. Laws and regulations, listing rules and codes of corporate governance contain extensive requirements and recommendations on communication with shareholders, and increasingly, with other stakeholders.
To provide an analytical model for companies to assess the current state of their stakeholder communications and to benchmark against other companies, we developed a new Stakeholder Communications Framework which comprises of the following six elements of stakeholder communications:
• Communication resources• Communication modes• Communication content• Communication frequency• Communication timeliness• Communication quality
Using this framework, we examined current stakeholder communications practices of 712 companies listed on the SGX as at 31 December 2011. Data on these practices were obtained from the following sources:
• Latest annual report of the company as at 31 January 2012
• Company announcements to SGX from 1 January 2011 to 31 January 2012
• Company website
Our detailed findings are as follow:
Communication resources
• Local companies are more likely than foreign companies to have an in-house IR function. About 40 percent of foreign companies either out-source or co-source their IR function, compared to 25 percent of local companies.
• Most companies have only one person handling IR. However, about one in five of the large cap companies have three or more persons handling IR.
• Thirty-one percent of companies have a dedicated person looking after IR, while 23 percent have the CFO performing this role. Foreign companies are more likely to engage a dedicated person to attend to IR related matters, while local companies are about equally likely to give this responsibility to an IR officer, the CFO or a corporate communications personnel.
• Large cap companies most commonly have a dedicated person responsible for IR, with about two-thirds of such companies having such a position in the company. In contrast, for the small cap companies, the CFO is most often the designated person responsible for IR, with almost one in three of these companies doing so.
• Around two-thirds of the companies which disclosed the reporting relationship of their in-house or co-sourced IR function have the Head of IR reporting to the chief executive officer, while another 16 percent has the Head of IR reporting to the CFO.
• Almost 47 percent of companies did not disclose any IR contact information in their annual report or website. Large cap companies are more likely to disclose their IR contacts.
• Although 22 percent of the companies (157 companies) indicated that shareholders can contact the lead independent director or any of the independent directors regarding any issues of concern, only five companies provided the contact details of these independent directors.
CO
NC
LUS
ION
SPublication and verification of vote resultsIn our study, 46 companies disclosed the detailed voting results while five companies disclosed the proxy votes received. Sixteen companies disclosed that an independent party was appointed to verify the voting results.
Detailed minutes of the AgMGuideline 16.4 of the revised Code of Corporate Governance (2012) states: “Companies should prepare minutes of general meetings that include substantial and relevant comments or queries from shareholders relating to the agenda of the meeting, and responses from the Board and Management, and to make these minutes available to shareholders upon their request." The
2005 version of the Code contains a similar recommendation. However, most companies do not comply with this recommendation. Only seven companies (one percent) published detailed minutes of their AGMs, and this included four foreign listings.
Guideline 16.3 of the revised Code (2012) recommends: “All directors should attend general meetings of shareholders. In particular, the chairman of the Board and the respective chairman of the AC, NC and RC should be present and available to address shareholders’ queries at these meetings.” Because few companies provide detailed minutes of meetings, it was difficult to determine the extent to which directors, board chairmen, and committee chairmen currently attend AGMs.
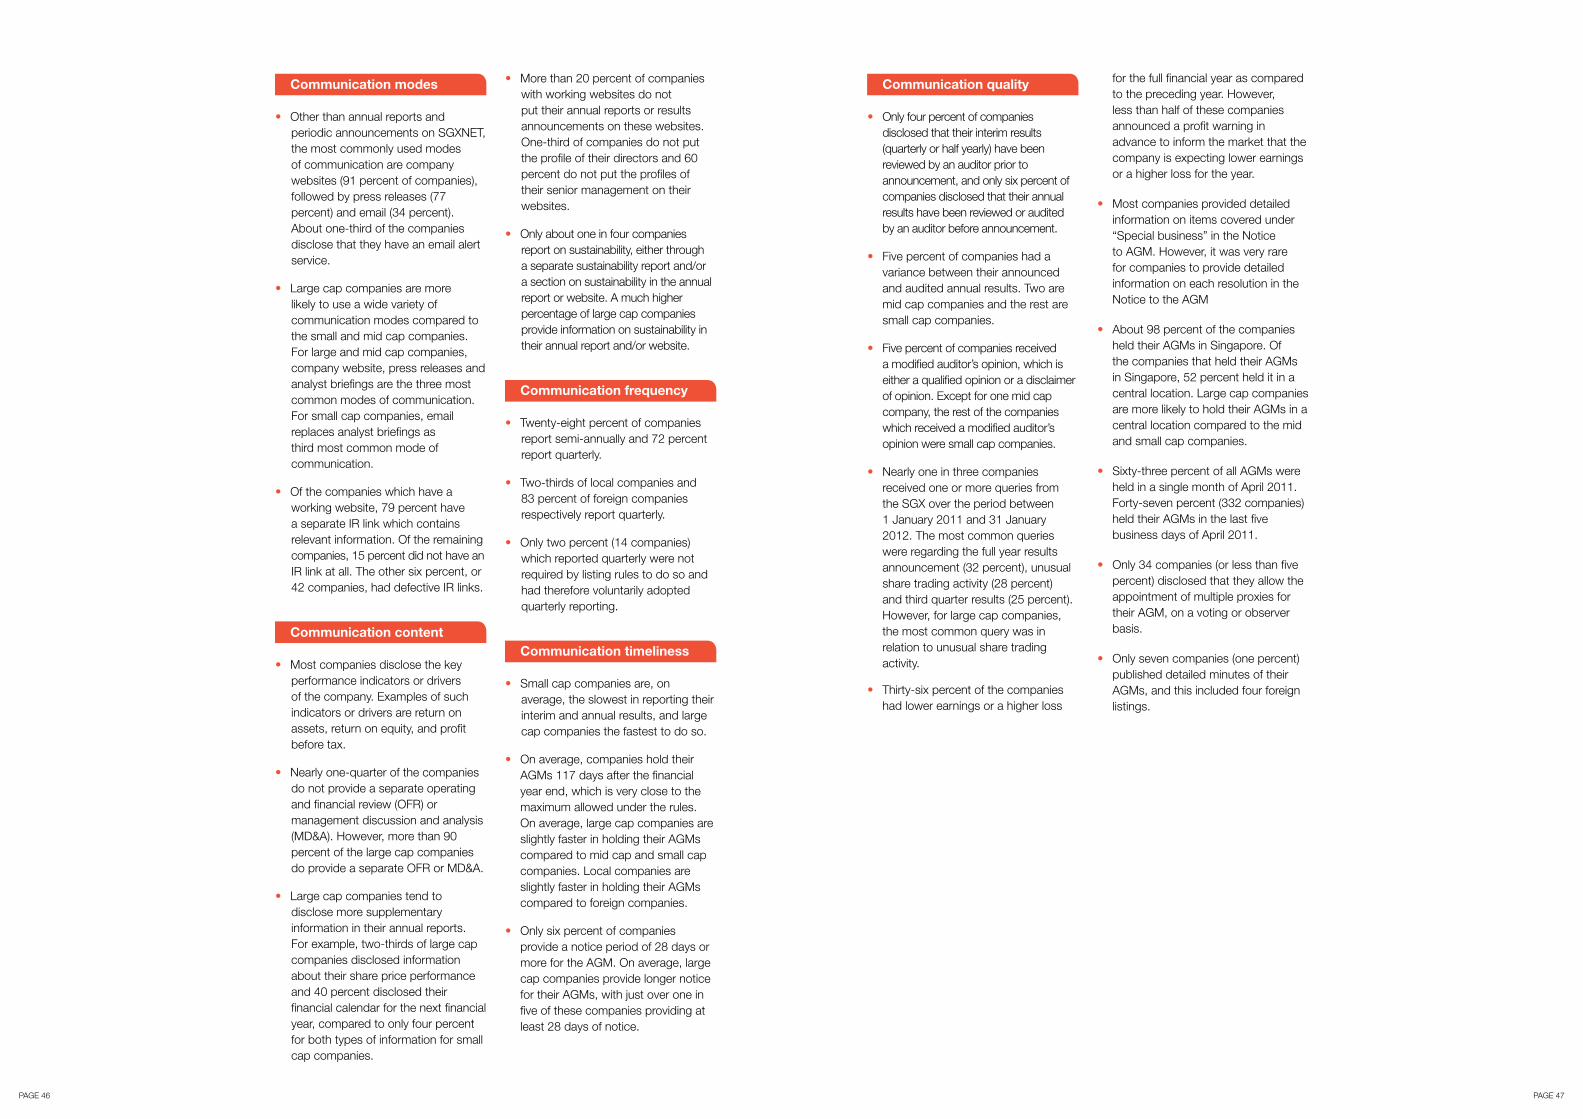
PAGE 47PAGE 46
Communication quality
• Only four percent of companies disclosed that their interim results (quarterly or half yearly) have been reviewed by an auditor prior to announcement, and only six percent of companies disclosed that their annual results have been reviewed or audited by an auditor before announcement.
• Five percent of companies had a variance between their announced and audited annual results. Two are mid cap companies and the rest are small cap companies.
• Five percent of companies received a modified auditor’s opinion, which is either a qualified opinion or a disclaimer of opinion. Except for one mid cap company, the rest of the companies which received a modified auditor’s opinion were small cap companies.
• Nearly one in three companies received one or more queries from the SGX over the period between 1 January 2011 and 31 January 2012. The most common queries were regarding the full year results announcement (32 percent), unusual share trading activity (28 percent) and third quarter results (25 percent). However, for large cap companies, the most common query was in relation to unusual share trading activity.
• Thirty-six percent of the companies had lower earnings or a higher loss
for the full financial year as compared to the preceding year. However, less than half of these companies announced a profit warning in advance to inform the market that the company is expecting lower earnings or a higher loss for the year.
• Most companies provided detailed information on items covered under “Special business” in the Notice to AGM. However, it was very rare for companies to provide detailed information on each resolution in the Notice to the AGM
• About 98 percent of the companies held their AGMs in Singapore. Of the companies that held their AGMs in Singapore, 52 percent held it in a central location. Large cap companies are more likely to hold their AGMs in a central location compared to the mid and small cap companies.
• Sixty-three percent of all AGMs were held in a single month of April 2011. Forty-seven percent (332 companies) held their AGMs in the last five business days of April 2011.
• Only 34 companies (or less than five percent) disclosed that they allow the appointment of multiple proxies for their AGM, on a voting or observer basis.
• Only seven companies (one percent) published detailed minutes of their AGMs, and this included four foreign listings.
Communication modes
• Other than annual reports and periodic announcements on SGXNET, the most commonly used modes of communication are company websites (91 percent of companies), followed by press releases (77 percent) and email (34 percent). About one-third of the companies disclose that they have an email alert service.
• Large cap companies are more likely to use a wide variety of communication modes compared to the small and mid cap companies. For large and mid cap companies, company website, press releases and analyst briefings are the three most common modes of communication. For small cap companies, email replaces analyst briefings as third most common mode of communication.
• Of the companies which have a working website, 79 percent have a separate IR link which contains relevant information. Of the remaining companies, 15 percent did not have an IR link at all. The other six percent, or 42 companies, had defective IR links.
Communication content
• Most companies disclose the key performance indicators or drivers of the company. Examples of such indicators or drivers are return on assets, return on equity, and profit before tax.
• Nearly one-quarter of the companies do not provide a separate operating and financial review (OFR) or management discussion and analysis (MD&A). However, more than 90 percent of the large cap companies do provide a separate OFR or MD&A.
• Large cap companies tend to disclose more supplementary information in their annual reports. For example, two-thirds of large cap companies disclosed information about their share price performance and 40 percent disclosed their financial calendar for the next financial year, compared to only four percent for both types of information for small cap companies.
• More than 20 percent of companies with working websites do not put their annual reports or results announcements on these websites. One-third of companies do not put the profile of their directors and 60 percent do not put the profiles of their senior management on their websites.
• Only about one in four companies report on sustainability, either through a separate sustainability report and/or a section on sustainability in the annual report or website. A much higher percentage of large cap companies provide information on sustainability in their annual report and/or website.
Communication frequency
• Twenty-eight percent of companies report semi-annually and 72 percent report quarterly.
• Two-thirds of local companies and 83 percent of foreign companies respectively report quarterly.
• Only two percent (14 companies) which reported quarterly were not required by listing rules to do so and had therefore voluntarily adopted quarterly reporting.
Communication timeliness
• Small cap companies are, on average, the slowest in reporting their interim and annual results, and large cap companies the fastest to do so.
• On average, companies hold their AGMs 117 days after the financial year end, which is very close to the maximum allowed under the rules. On average, large cap companies are slightly faster in holding their AGMs compared to mid cap and small cap companies. Local companies are slightly faster in holding their AGMs compared to foreign companies.
• Only six percent of companies provide a notice period of 28 days or more for the AGM. On average, large cap companies provide longer notice for their AGMs, with just over one in five of these companies providing at least 28 days of notice.

The following are our recommendations to companies for improving the effectiveness of their communications with stakeholders:
Thoroughly assess the investor profile of the company to ensure that modes, content, frequency, timeliness and quality of the communications truly reflect the distinct requirements of their stakeholders.
Ensure that the IR function is adequately resourced, has adequate stature through an appropriate reporting relationship to senior management, and is closely involved with the strategic management of the business.
Ensure that the IR function is accessible with IR contacts publicly disclosed in the annual report and website, and is actually working effectively. Contact details of the lead independent director or other independent directors should be disclosed if they are to be the points of contact for investors.
Adequately leverage technology to communicate with their stakeholders. Smaller companies, in particular, should better use technology to overcome the lack of other forms of access to stakeholders enjoyed by larger companies.
Ensure there is a working website accessible to stakeholders and have a dedicated link for communicating with investors, and that the content is relevant and up-to-date.
Better utilise the website and technology to provide required and supplementary information to stakeholders, including corporate governance information.
Provide a separate operating and financial review (OFR) or management disclosure and analysis (MD&A) if they are not already doing so.
Improve the reporting on how the interests of stakeholders, such as customers, employees and creditors, are safeguarded and improve reporting on sustainability.
Carefully evaluate the costs and benefits of more frequent reporting to shareholders if the company does not already report quarterly, and consider adopting quarterly reporting even if not mandated to do so.
Ensure that shareholders have timely notice and information to make informed decisions at general meetings. Companies with international investors should strive to improve the notice period of general meetings.
Take steps to minimise the risk of variances between announced and audited results, by ensuring adequate internal or independent review of results before announcement.
Take steps to minimise the risk of queries by the Singapore Exchange, for example, by proactively reviewing disclosures related to results announcements and significant transactions.
Provide timely profit warnings where results are expected to fall below their results for the prior year or period.
Provide more information about all key resolutions for general meetings, including those relating to election of directors and dividends.
Enhance shareholders’ participation at general meetings by ensuring that locations of meetings are easily reachable, that the risk of conflict in timing with other companies’ general meetings is minimised, and that shareholders holding shares through nominee companies are not prevented from attending these meetings through the “two proxies” rule.
Address the problem surrounding the clustering of AGMs, by planning well ahead and publicising meeting dates as early as possible.
Provide shareholders who are unable to attend meetings with access to the proceedings of the meetings, such as through detailed AGM minutes or recordings of these meetings.
Ensure that voting rights of shareholders are safeguarded by voting all resolutions by poll.
Ensure that timely, complete and reliable disclosure of voting results is provided to all shareholders.
PAGE 48 PAGE 49

ACCA
Darryl WeeCountry Head, ACCA SingaporeT: +65 6637 8181E: [email protected]
Joseph AlfredPolicy & Technical AdvisorT: +65 6637 8182E: [email protected]
www.accaglobal.com
KPMG
Tan Wah YeowDeputy Managing PartnerHead of MarketsT: +65 6411 8338E: [email protected]
Mak Yuen TeenDirectorHead of ResearchT: +65 6507 1527E: [email protected]
kpmg.com.sg
The information contained herein is of a general nature and is not intended to address the circumstances of any particular individual or entity. Although we endeavour to provide accurate and timely information, there can be no guarantee that such information is accurate as of the date it is received or that it will continue to be accurate in the future. No one should act upon such information without appropriate professional advice after a thorough examination of the particular situation. ACCA and KPMG Services Pte. Ltd. accepts no responsibility for any loss which may arise from information contained in this publication. No part of this publication may be reproduced without prior written permission of ACCA and KPMG Services Pte. Ltd. © May 2012, ACCA and KPMG Services Pte. Ltd. All rights reserved. Printed in Singapore.
KPMG Services Pte. Ltd. (Registration No: 200003956G) is a Singapore incorporated company and a member firm of the KPMG network of independent member firms affiliated with KPMG International Cooperative (“KPMG International”), a Swiss entity.