Making Research Count -...
31
Making Research Count: Analyzing Canadian Academic Publishing Cultures Higher Education Strategy Associates Paul Jarvey Alex Usher Lori McElroy
Transcript of Making Research Count -...

Making Research Count: Analyzing Canadian Academic
Publishing Cultures
Higher Education Strategy Associates
Paul Jarvey
Alex Usher
Lori McElroy
June 2012

Higher Education Strategy Associates (HESA) is a Toronto-based firm specializing in research, data and strategy. Our mission is to help universities and colleges compete in the educational marketplace based on quality; to that end we offer our clients a broad range of informational, analytical, evaluative, and advisory services. Stoakley-Dudley Consultants is a long standing executive search firm that over the last three years has established itself as a proven partner in public sector searches, specifically in healthcare and education. Stoakley-Dudley Consultants partners with and sponsored the research behind the generation of the H-Index and the quantifiable use of Bibliometrics to level the playing field in academic institutional comparisons. Stoakley-Dudley and HESA have a strong track record of working together to bring forward new ways of thinking about the academy and implications for hiring senior leadership. Please cite as: Jarvey, P., Usher, A. and McElroy, L. 2012. Making Research Count: Analyzing Canadian Academic Publishing Cultures. Toronto: Higher Education Strategy Associates. Contact: Higher Education Strategy Associates 460 Richmond St. West, Suite 400 Toronto, Canada, M5V1Y1 phone: 416.848.0215 fax: 416.849.0500 [email protected] [email protected] [email protected] www.higheredstrategy.com © 2012 Higher Education Strategy Associates

Page | 2
Making Research Count: Analyzing
Canadian Academic Publishing Cultures
Introduction The use of bibliometrics as a way of measuring research output is now entering its sixth decade. Ever
since the Science Citation Index appeared in 1961 (the Social Sciences Index followed in 1966), it has
been possible to answer questions such as “who publishes more articles” and “whose articles are being
cited more often?” With additional analysis and more advanced databases, it is possible to aggregate up
from individual academics to departments or institutions, to answer the question “which groups of
scholars have greater research output?” It is precisely this kind of data which has fed the recent
explosion of university rankings, and in particular international rankings such as the Shanghai Jiao Tong
Academic Ranking of World Universities.
As use of bibliometrics has become more widespread, its critics have become more vocal. The criticisms
of bibliometrics fall into four main categories:
· Bibliometrics don’t measure the full range of scholarly activity and are therefore an inadequate
way to measure scholarly performance. In particular, they do not measure teaching ability.
· Bibliometrics can be misleading; some metrics have multiple interpretations (i.e., a high citation
count may reflect widespread criticism); more comprehensive metrics are often not very
intuitive and hence not easy for users to understand.
· Citation databases used in bibliometric calculations contain various biases that may affect the
result (such as under representation of non-English journals).
· The potential for bias in bibliometric comparisons is poorly understood and rarely controlled.
For example, bibliometric comparisons usually fail to account for the differences among
disciplines in scholarly publication cultures. Bibliometric comparisons that do not control for
these differences are biased when the groups being compared are from disciplines with
different publication cultures.
These criticisms reflect structural limitations of bibliometric measures which, for the most part, can be
addressed by changing the ways bibliometrics are both calculated and used. The first criticism reflects a
common concern that faculty should not be judged solely by their publication record. Indeed,
bibliometric measures only assess one component of academic activity, and should be used accordingly
– either in conjunction with other measures (such as expert peer review1), or explicitly as a measure of
research output only. This issue is beyond the scope of this paper.
1 For a discussion of how expert peer review can benefit when complemented by bibliometric analysis, see Aksnes D. W. and Taxt R. E. 2004. “Evaluation Correlation” Research Evaluation, 13(1), p. 33-41. The authors conclude that both measures are strongest when used in tandem – using bibliometric measures to identify possible problems with peer-review processes, and vice-versa.

Page | 3
The next three criticisms are essentially technical problems that can be addressed. In this document, we
propose a new way of comparing research output among groups of scholars that addresses these
objections to bibliometrics, especially the concern that bibliometrics can be biased by field of study. In
Part I, we describe the objections to bibliometrics and the methods we use to address them. In Part II,
we use a new method to estimate differences in publication cultures across disciplines at Canadian
universities, and identify the top scoring institution and researcher within each discipline. We finish in
Part III by demonstrating how this approach can be applied to Canadian scholars.

Page | 4
Part I: Making Bibliometrics Work
In part I, we look at three specific questions. First, we examine the question of how to display
bibliometric information on both scholarly productivity and impact in an efficient and understandable
manner. Second, we discuss considerations regarding the use of different bibliometric databases. And
third, we look at how to conduct bibliometric analysis in a manner which properly takes account of
disciplinary differences in publication cultures, or, to put it in the current jargon, to “discipline-
normalize” bibliometric data.
i) Choosing a simple bibliometric indicator
The increasing importance of publication records to hiring, quality assurance, and accountability
processes have brought a range of bibliometric measures into broad use over the past decade. At the
same time, the practical challenges to this type of analysis have faded as large citation databases have
reduced the costs of collecting source data.
Publication counts (a rough measure of productivity) and citation counts (a rough measure of impact)
are perhaps the most common bibliometric measures in use. They are both simple to calculate and easy
to understand, and their popularity stems in no small measure from this simplicity. But these measures
carry drawbacks. Publication is no guarantee of impact; some academics may publish extensively while
garnering few citations. Citation counts, on the other hand, may come disproportionately from one or
two papers that were highly influential (or worse, which are widely criticized), and thus may not signify
the presence of a sizable body of impactful work.
Hirsh developed the H-index as an alternative to traditional bibliometric measures. The H-index is a
single bibliometric indicator that combines measures of productivity and impact into one. Hirsch argued
that this combination reflects the impact of a publication on the corresponding scientific community
(Hirsch, 2005; see also Hirsch, 2007). The enormous popular interest and scholarly attention that this
metric has received since 2005 is a testament to the appeal of an easily-derived compound bibliometric,
and to the growing importance of the H-index to bibliometric analysis.

Page | 5
Understanding the H-index
The Hirsch-index, commonly abbreviated as the H-index, was proposed by Jorge E. Hirch (a
physicist at UCSD) in 2005 as a compound metric based on a single author’s citations and
publications. A researcher’s H-index is the largest possible number n for which n of the
researcher’s publications have been cited at least n times. The table below provides examples
using four researchers, showing the number of citations of their four most-cited papers, and the
corresponding H-index. The average citations per paper is also included, to demonstrate how the
H-index differs. In this example, Scholar C has a single highly-cited paper, and four papers with not
more than one citation. Because the H-index limits the contribution of individual papers with
many citations, as well as papers with low citation counts, this scholar has a low overall H-index
despite an average number of citations per paper that is the same as the other three.
Table 1: H-index calculation examples
Scholar A Scholar B Scholar C Scholar D
Citations for most-cited article 3 5 14 8
Citations for second most-cited article 3 5 1 3
Citations for third most-cited article 3 5 0 2
Citations for fourth most-cited article 3 0 0 1
Citations for fifth most-cited article 3 0 0 1
Average citations per paper 3 3 3 3
H-index 3 3 1 2
The popularity of the H-index is driven by the advantages it has over other bibliometric calculations:
· It considers both productivity and impact.
· It is not influenced by a small number of very successful articles, which may not be
representative of a researcher’s career output. The H-index similarly discounts the value of
papers that are not influential.
· The H-index is simpler and easier to understand than many other compound bibliometric
metrics.
While the H-index has many advantages, some factors are not included. Some of these include the age
of the scholar, the time since publication of individual articles, the quality and impact of the journals in
which they were published, the number of authors, whether the scholar in question was the first author,
whether the citations viewed the article positively or negatively, and whether the publication was a

Page | 6
book, monograph, or other publication type. Because these factors can be a source of bias, researchers
have attempted to control for many of these factors by constructing variations on the H-index.2
Many of these sources of bias do not matter when comparing academic departments within a discipline
(the basic unit of analysis used in this paper). For instance, type of publication differs greatly across
disciplines, but is rather homogeneous within a discipline, so is not a source of bias when comparing
within a discipline. While factors such as age do affect publication productivity and impact, controlling
for age does not necessarily add value when comparing across departments. It can be argued that a
department with older scholars deserves the value added by the publication records of its senior faculty.
Hence, the research we are reporting here has opted not to account for age.
ii) Choosing an appropriate database
Every system of bibliometrics requires a database from which to draw information. The problem is that
while many databases are extensive, no database can ever be truly comprehensive. Database managers
have to make editorial judgements about which publications will and will not be included in the
database. A comparison of the world’s two largest databases of peer-reviewed journals, Elsevier’s
Scopus and Thomson-Reuters’s Web of Science, reveals that the former contains a much larger number
of journals than the latter, but the difference is to a certain extent the result of a decision to include
more lower-impact (i.e., less-frequently cited) publications.
Decisions about what to include have the potential to generate biases. For instance, publication
databases tend to favour English-language publications, though Thomson Reuters has recently been
active in adding Mandarin and Lusophone journals in order to court the Chinese and Brazilian markets.
There are also biases which arise from differences across disciplines (other than publication culture). For
example, the strong hierarchy of journals that is observed in medicine or biology is not as pronounced in
many other disciplines. So limiting the journals that are included in the database will be more of an issue
for some disciplines than for others generate additional discipline-specific biases.
Over the past few years, Google Scholar has approached this problem with an alternative to traditional
indexing. Instead of archiving journals, it archives individual papers instead, which are identified and
indexed automatically. Google Scholar’s broad scope and inclusiveness give it several advantages over
Scopus and Web of Science; notably, that it also has much better coverage in humanities and social
sciences than other databases.3 Because it is not limited to peer-reviewed publications, it is useful for
fields such as economics and political science where some researchers’ best work can be for think-tanks
2 Many of these are discussed in S. Alonso, F.J. Cabrerizo, E. Herrera-Viedma, F. Herrera. 2009. “H-index: A Review Focused in its Variants, Computation and Standardization for Different Scientific Fields” Journal of Informetrics 3(4): 273-289. An online addendum listing and describing variant H-indices is maintained by the authors at http://sci2s.ugr.es/hindex/.
3 Harzing, Ann-Wil. 2012. “A preliminary test of Google Scholar as a source for citation data: A longitudinal study of Nobel Prize winners” Scientometrics (forthcoming).

Page | 7
and public agencies which typically fall outside the range of citation databases, or in disciplines where
conference papers play an important role in the academic process, as is the case in computer science.
Google scholar can also capture books and other monographs that are more typical scholarly outputs
than journal articles in some disciplines, such as English.
Lastly, because Google Scholar can be freely accessed, and because extracting and analyzing Google
Scholar data can be automated, researchers can perform basic bibliometric analyses at relatively low
cost – as has been done by the software tool Publish or Perish,4 as well as by numerous researchers
working in academic environments.
While Google Scholar has advantages that make it an attractive choice, there are three very common
criticisms of Google Scholar that need to be acknowledged.
First, due to the format in which Google Scholar allows users to enter name searches, it can be difficult
to distinguish between authors with similar or identical names. This presents a problem of false
attribution that increases H-index scores wherever common names are being analyzed. This is a serious
hurdle for automated bibliometric analysis, as it requires a manual review process before data can be
used. Second, Google Scholar is often criticised for inaccuracies in publication metadata, including
author, year of publication, and other fields (although this has improved dramatically in recent years).5
Both of these problems can be addressed in a straightforward, if time-consuming, manner through
manual review and correction of Google Scholar outputs. By this method, false attribution due to
similarity of names can be avoided and alternative spellings can be included (Google Scholar
automatically parses alternative name spellings and abbreviations). Similarly, metadata errors can be
identified and corrected.
The third criticism points to issues with Google Scholar’s coverage. First, that Google Scholar includes
data on publication types that are excluded by other popular databases (primarily patents and
conference proceedings). Second, that some of the included publications are not peer-reviewed. And
third, that the coverage is sufficiently different from the more established databases that its use would
lead one to substantially different conclusions about an individual’s publication record.
The issue of inclusion differences can be addressed with a combination of automated screening and
manual review. While non-peer reviewed publications could be similarly screened, this research has
included publications such as conference proceeding and work done for agencies such as the World
Bank (in economics), the Truth and Reconciliation Commission (in history and Aboriginal studies), and
the Institute for Research on Public Policy (political science). The rational for this choice is that non-peer
4 Publish or Perish is a free software tool that can be used to automatically retrieve publication data from Google Scholar and produce basic bibliometric indicators.
5 One of the most vocal critics of Google Scholar and the metadata errors it contains, Péter Jacsó, recently catalogued many of the changes, noting the improvement in metadata (but noting the need for more work to be done). See Péter Jacsó. 2012. “Google Scholar Author Citation Tracker: is it too little, too late?” Online
Information Review 36(1): 126 – 141. See also Péter Jacsó. 2010. “Metadata mega mess in Google Scholar” Online
Information Review 34( 1): 175 – 191.

Page | 8
reviewed work can have scholarly impact, insofar as it is cited by other researchers (and therefore has a
potential impact on the H-index of a given researcher). This is one of the advantages of using the H-
index as a metric of reference for this study, as this measure ensures that publications with no impact
are not reflected in scores. This is especially relevant because differences in inclusion weaken
comparisons across discipline – unless those differences have been normalized.
A number of scholars have compared existing citation databases, such as Thomson Reuters’s Web of
Science, Elsevier’s Scopus and Google Scholar. In 2010 Massimo Franchescet published a detailed
literature review of studies that had compared indicators calculated by different citation databases, as
well as a correlation test of results from Google Scholar, Web of Science and Scopus.6 He found four
examples that specifically focus on the H-index. These four papers found that the correlation between
H-indexes produced by different databases was high or moderate, and in most cases, that Google
Scholar produced higher H-index scores, which implies that it was able to capture a larger number of
publications and citations than either of the other two databases. Specifically, Franceschet noted the
following:
· Saad (2006) found a correlation of 0.82 between H-index scores of productive consumer
scholars calculated using Google Scholar and Web of Knowledge.7
· Meho and Rogers (2008) found a correlation of 0.96 for human-computer interaction scholars,
when comparing H-index rankings of Google Scholar with the union of Web of Knowledge and
Scopus (both databases combined).8
· Sanderson found “moderate” correlations of 0.51 and 0.69 between the H-index scores of
information science scholars calculated with Google Scholar and Web of Science, and Google
Scholar and Scopus, respectively.9
· The fourth paper (Bar-Ilan, 2008) found differences across a very small sample (40 scholars) of
Israeli scholars from mixed disciplines, but did not perform statistical analysis.10
· Franceschet conducted a fifth study among computer science scholars, finding that Google
Scholar generated higher H-index scores, but that these were correlated to those calculated
6 Franceschet, M. 2010. “A comparison of bibliometric indicators for computer science scholars and journals on web of science and Google Scholar.” Scientometrics, 83(1): 243-258. See especially pages 249-250.
7 Saad, G. 2006. “Exploring the H-Index at the author and journal levels using bibliometric data of productive consumer scholars and business-related journals respectively.” Scientometrics, 69(1): 117-120.
8 Meho L. I. and Rogers, Y. 2008. “Citation counting, citation ranking, and H-Index of human-computer interaction researchers: a comparison between Scopus and Web of Science.” Journal of the American Society for Information
Science and Technology, 59(11): 1711-1726.
9 Sanderson, M. 2008. “Revisiting h measured of US LIS academics.” Journal of the American Society for Information
Science and Technology, 59(7): 317-330.
10 Bar Ilan. 2008. “Which H-Index? A comparison of WoS, Scopus, and Google Scholar.” Scientometrics, 74(2): 257-271.

Page | 9
using Web of Science. Franceschet found a Spearman correlation of 0.84 between H-indexes
calculated using Google Scholar and H-indexes calculated using Web of Science.11
Two conclusions stand out from this review. The first is that the degree of correlation between results in
Google Scholar and other databases differs somewhat from one field to another. This is to be expected,
as it is well-known that the coverage of Scopus and World of Science can vary from one field to another.
More broadly, though, the degree of correlation suggests no prima facie reason why one would not
consider Google Scholar a reasonable indicator of scholarly output.
In sum, there are a number of databases that could be used to derive H-index data. Scopus and Web of
Science have the benefit of being easy to use and having wide currency. Google Scholar has the benefit
of wider coverage (which has some distinct advantages in certain disciplines), and greater ease of use
when using automated calculation processes.
iii) Accounting for differences in disciplinary publication cultures
Possibly the most important weakness of bibliometric analysis comes when attempts are made to
compare scholars across disciplines without taking into account the dramatic differences in publication
cultures. Scholars in different disciplines tend to produce research at different rates. They also cite other
papers at different frequencies, co-author papers with differing numbers of other scholars, collaborate
at different levels and publish in books, monographs, and journals at different rates. For example, only
the most productive scholars in the humanities publish on a monthly basis, rarely with more than one or
two authors. In other disciplines (e.g., biological sciences) however, this level of productivity and
multiple authors is quite common. This affects most of the basic inputs of common bibliometric
measures, including the number of articles published in peer-reviewed journals, the citation rate of
published articles and the number of authors per paper.
These differences in publication cultures can pose challenges when comparing the performance of
scholars across different disciplines. This point has been discussed by many authors, dating back at least
to Braun and Schubert’s 1986 article “Relative Indicators and Relational Charts for Comparative
Assessment of Publication Output and Citation Impact.”12 Braun and Schubert note that the inability to
compare publication productivity and impact across disciplines due to the differences in publication and
citation cultures is “one of the most frequently claimed caveats”13 in the use of publication and citation
measures.
By extension, this criticism applies to attempts to compare groups of scholars when they do not take
into account differences in publication culture between disciplines. For example, the Academic Ranking
11
Franceschet, 2010. See Pages 256-258.
12 Braun, T., and Schubert, A. 1986. “Relative indicators and relational charts for comparative assessment of publication output and citation impact” Scientometrics 9(5-6): 281.
13 Ibid., 281.

Page | 10
of World Universities (also known as the Shanghai Ranking), which uses counts of highly cited papers,
publication counts and per-capita academic performance for 70% of their ranking, does not account for
differences in publication culture. The insensitivity to discipline-based publication cultures is a major
weakness of this ranking, and others using similar inputs.
This problem is not insoluble. As Braun and Schubert said, “a reliable way to overcome this problem
seems to be the assessment of each single paper against its own standards, thus building some kind of
relative indicators of performance or impact.”14 This type of field normalization can be achieved either
by only making comparisons within a single discipline, or by accurately measuring publication culture
and then comparing each researcher against the standards of their own discipline. While many
contemporary scholars have discussed this issue and created field-normalised metrics within small
communities of researchers,15 a comprehensive database of field-normalized or discipline-normalized
bibliometric indicators has not been available prior to this publication.
Summary
In Part I, we looked specifically at three basic objections to bibliometrics. The first, that they should not
be used as a sole judge of scholarly value – is not a criticism of bibliometrics per se, but a criticism of
using bibliometrics out of context. The second, that citation databases contain biases, can be
approached by using one of a number of different comprehensive databases (Web of Science, Scopus or
Google Scholar), provided the limitations of different lenses on the universe of scholarly publication
have been measured and are well understood. The third and final objection – the difficulty in accounting
for cross-disciplinary differences in publication cultures – can be dealt with by restricting comparisons to
within a given field of study, or by comparing metrics to disciplinary norms.
The third objection, the need to account for cross-disciplinary difference in publication cultures, is the
focus of Part II.
14
Ibid., 281.
15 A recent example of an attempt to create field-normalized citation counts among Norwegian researchers may be found in Ahlgren, P., Colliander, C., and Persson, O. 2012. “Field normalized citation rates, field normalized journal impact and Norwegian weights for allocation of university research funds” Scientometrics 91(1): 1-14.

Page | 11
Part II – Determining Disciplinary Norms
To determine disciplinary publication norms that can be used for discipline-normalization, we began by
constructing a complete roster of academic staff at Canadian Universities, using institution and
department websites. We then derived an H-index score for each academic by feeding each name into a
program that uses Google Scholar to derive an H-index value. We also employed a number of quality-
control techniques (including manual review) to reduce the number of false positives, correct metadata
problems, and ensure that only desired publication types were included. Finally, with H-index scores for
each individual scholar, disciplinary averages were constructed from the national data. Below, we
explain this process and the results in more detail.
Creating a national roster of academics - Criteria for inclusion
The first step was to generate a roster of academics who would be included in calculation of the norms.
The first criterion for inclusion in the database was institutional: 71 universities were included, covering
the vast majority of university academics in Canada. A number of small universities were excluded,
especially in Quebec, due difficulty building accurate staff lists (and especially, differentiating between
adjunct and regular faculty) for those institutions. For the same reason, Laval University was not
included in this analysis. A full list of institutions is included in this document as Appendix A.
The second criterion for inclusion was disciplinary. Non-academic disciplines (i.e., those that deliver
programs of a primarily vocational nature, and which are mainly located in the newer universities in
British Columbia) were excluded. So, too, was medicine due to the difficulty in distinguishing between
academic and clinical faculty on institutional websites. Apart from these, all academic staff at the 71
universities were included.
Faculty members were included in a department if they were listed on that department’s website at the
time of collection (Summer 2011). Inclusion was limited to active academic staff in positions that
potentially involve both a research and teaching role within the department in question. Position titles
of those who were included consisted of:
· Professors
· Assistant professors
· Lecturers
· Instructors
· Deans/associate deans
· Chairs/associate chairs
Note that lecturers, instructors and chairs were included only at institutions where these positions could
potentially involve both a research and teaching role. For example, instructors at some institutions lack a
research role (and should therefore be excluded), while this term is used at some institutions to describe

Page | 12
academic faculty at an early stage of their career and so in these cases were included. Staff in the
following positions were not included:
· Administrative assistants
· Sessional lecturers
· Post doctorates
· Emeriti
· Adjunct professors
· Graduate students
· Visiting professors
Data Cleaning
Automated data collection processes risk producing large numbers of false positives. This is due to a
limited ability of these processes to distinguish between different authors sharing the same name, and
sometimes working in the same discipline. Authors with very common names can have bibliometric
scores that are dramatically inflated as publications by similarly named authors are falsely attributed.
Some publications appear more than once in Google Scholar’s list of results, duplicating their citation
counts or splitting citations for a single paper between two entries. For some types of searches, these
problems can cause serious issues for automated data collection process.
In order to avoid these kinds of issues, the Google Scholar results were manually reviewed by HESA staff,
to ensure that:
· The search term used accurately reflects the name used by the researcher in his or her
publications.
· Publications written by similarly named researchers are excluded.
· The articles, books and other publications included are only counted once.
The second point is especially important. It is not uncommon in large-scale bibliometric analysis for
publications to be inaccurately attributed to a researcher due to a similarity in names. While a manual
assessment methodology does not eliminate all errors, it dramatically reduces their incidence. Most
importantly, by eliminating cases of high over-attribution, it dramatically increases the accuracy of this
tool when used to compare groups of researchers.

Page | 13
The data cleaning process
For any given researcher, data was cleaned in a three-step process. First, publication data for each
researcher was automatically screened to reduce the most obvious errors. Second, a human agent
reviewed the data, and improved the search terms to accurately reflect the name used by the
researcher in his/her publications and to narrow search results if necessary. Lastly, publications
were manually reviewed to identify and correct false attribution and metadata errors.
The example below shows the number of publications attributed to an associate professor at the
University of Toronto, at each stage of the process, illustrating the importance of a manual review
process to maintain the integrity of the data. While the numbers here represent a real case, this is
a particularly dramatic example in which the number of false positives was unusually high
because a number of high-performing researchers shared their last name with the scholar being
analyzed.
•Simple automated search
H-index: 129
(1000+ pubs)
•Add advanced filtering and Boolean logic
43
(400+ pubs)
•Manual elimination of remaining false positives and other errors
2
(5 pubs)

Page | 14
Part III – Results
The main result of this process was the quantification of differences in publication cultures by discipline
among Canadian scholars, as measured by mean H-index scores. Figure 1 shows the difference in mean
H-index scores by field of study across all academics included in the study.
Figure 1: Mean H-index Scores by Field of Study
The sciences have the highest mean H-index at 10.6, while agriculture and engineering trail slightly at
8.9 and 8.5, respectively. Business, social sciences and applied health science have relatively similar
average H-index scores, ranging from 3.8 to 5.2. Humanities are somewhat lower at 2.3, while
design/architecture and fine arts both have mean indexes below one. This is what one would expect.
Fields of study which are highly quantitative and empirical in nature fall at one end of the scale, while
fields which are more creative in nature fall at the other end of the scale.
This is an important result in that it reflects the H-index of an entire population – the majority of all
researchers at Canadian universities. Two important caveats apply here, however. The first is that these
differences only apply to publication cultures among scholars based in Canada. If one were to do this
0.8
0.9
2.3
3.8
4.9
5.2
8.5
8.9
10.6
0 2 4 6 8 10 12
Fine arts
Architecture and design
Humanities
Business
Applied health sciences
Social sciences
Engineering
Agricutural sciences
Sciences

Page | 15
same exercise with a wider group of scholars, national strengths and weaknesses would be reflected. As
the Council of Canadian Academies (2006) has shown, there are some fields in which Canadian scholars
are known to have stronger publication records than their counterparts elsewhere in the world (notably
psychology & psychiatry) and ones where our record is significantly weaker (notably engineering). While
these results capture the publication culture among Canadian academics, they are no more than broadly
indicative of differences in global publication cultures.
The second caveat is that while there are large differences across fields of study, there are also very
large differences within fields of study. It is to this issue that we now turn.
Comparing Disciplines
The first step to creating a discipline-normalized bibliometric measure is to calculate average H-index
scores for each discipline. Differences in discipline averages are, in essence, a measure of the differences
in publication cultures. In this section we explore the differences in the H-index across disciplines, on a
field by field basis. Later we demonstrate the use of discipline-normalized scores.
H-indexes in Sciences
Table 2 provide the average H-index score for each science discipline. The table also provides the
institution with the highest H-index in that discipline, and the researcher with the highest H-index in the
discipline in Canada.16 Although the field average for sciences is 10.5, this figure hides an enormous
amount of diversity across science disciplines. Environmental science and mathematics & statistics have
lower H-indexes of between 6 and 7 – in fact, not enormously different than what we see in the more
quantitative social sciences like economics. At the other end of the scale, however, Canadian astronomy
and astrophysics (which has a somewhat anomalous publication culture where multiple authors are
common) professors had a mean H-index score of 20.3.
The University of British Columbia has the top publication records in three disciplines, the University of
Toronto and the University of Saskatchewan are top in two each, with Western, Alberta and Université
de Montreal being top in one each. However, top researchers can also be found further afield, at the
University of Manitoba (natural resource management) and Lethbridge (neuroscience).
16
Note that in this table, and in all tables that follow, H-index averages are only reported in disciplines with at least 25 researchers.

Page | 16
Table 2: Mean H-index by Discipline: Sciences
Discipline Mean H-
index Top Institution (score) Top Researcher, institution (score)
Astronomy/astrophysics 20.3 U Toronto17 (24.7) Ray Carlberg, U Toronto (66)
Biology 13.4 UBC (20.5) Robert E. W. Hancock, UBC (81)
Chemistry/biochemistry 11.9 U Toronto (21.2) Stephen G Withers, UBC (68)
Environmental Science 6.7 U Saskatchewan (9.8) John P. Geisy, U Saskatchewan (66)
Geology and Earth Sciences
9.5 U Saskatchewan (19.5) Jan Veizer, U Ottawa (43)
Math/Stats 6.6 UBC (11.1)
Natural resource management & forestry
9.1 U Alberta (14.4) Kermit Ritland, UBC (41) Fikret Berkes, U Manitoba (41) (tie)
Neuroscience 11.3 UWO (15.9) Ian Whishaw, U Lethbridge (58)
Physics 12.4 U de Montréal (21.1) Ray Carlberg, U Toronto (66)
All sciences 10.6 - -
H-indexes in Agriculture
In contrast to science, H-indexes within the agriculture field vary little across disciplines, ranging
between 8.6 and 9.4. The University of British Columbia is the top university in two of three disciplines,
and McGill in one, with Guelph and Manitoba also contributing some top researchers.
Table 3: Mean H-index by Discipline: Agriculture
Discipline Mean H-
index Top Institution (score) Top Researcher, institution (score)
Agricultural biology 9.4 McGill U (12.3) Clarence Swanton, U Guelph (30)
Horticulture 8.6 UBC (16.0) Tim A Mcallister, U Manitoba (33)
Nutritional sciences 9.2 UBC (14.1) Errol B. Marliss, McGill U (51)
All agriculture 8.9 - -
17
Unless otherwise noted “University of Toronto” refers to departments at the St. George campus only.

Page | 17
H-indexes in Engineering
Rather like sciences, engineering disciplines show a wide dispersion of H-index means across disciplines.
Biological engineering, for instance, has a mean H-index of over 13, rather like its cousin discipline of
biology. Civic engineering, on the other hand, has an H-index of just 4.5, which is lower than the mean in
social sciences. In terms of top institutions, University of Toronto and McGIll can each claim pre-
eminence in two disciplines, while McMaster and Queen’s can claim one each.
Table 4: Mean H-index by Discipline: Engineering
Discipline Mean H-
index Top Institution (score) Top Researcher (institution) (score)
Biological engineering 13.4 U Toronto (17.6) Kullervo Hynynen, U Toronto (53)
Chemical engineering 9.7 McMaster U (19.7) S. Zhu, McMaster U (40)
Civic engineering 4.5 Queen’s U (9.3) Peter Rasmussen, U. Manitoba (38)
Computer science, computer engineering, and electrical engineering
10.3 UBC (17.7) Geoffrey E. Hinton, U Toronto (53)
Materials engineering 9.2 McGill U (13.0) Bruce R Lennox, McGill U (33)
Mechanical engineering 6.1 McGill U (9.3) Ravin Balakrishnan, U Toronto (45)
All engineering
sciences 8.5 - -

Page | 18
H-indexes in Applied Health Sciences
As noted earlier, our study was not able to include fields in medicine because of the difficulty in
determining who constituted active faculty members. We were, however, able to look at applied health
disciplines such as nursing, and kinesiology since these, for the most part, are administered in separate
faculties. Where these disciplines are subsumed within the Faculty of Medicine, or where there are
significant cross-postings with the Faculty of Medicine, our data may under-report the actual strength of
these programs. We believe this is particularly a problem at the University of Toronto, but may affect
other institutions as well. Data in this field of study should therefore be examined with more caution
than data for others in this report.
These disciplines also show considerable diversity of publication culture. Nursing and dentistry have
publication cultures similar to many humanities disciplines, while veterinary medicine looks more like an
engineering discipline. Excellence in these fields appears to be spread relatively widely across Canada,
with the University of Manitoba having the top scores in two departments, McGill, Waterloo,
Saskatchewan and Guelph having one each, the University of Montreal having the top researcher in two
disciplines.
Table 5: Mean H-index by Discipline: Applied Health Sciences
Discipline Mean H-
index Top Institution (score) Top Researcher (institution) (score)
Dentistry 3.4 McGill U (11.6) Jeffrey Mogi, McGill U (42)
Kinesiology 5.8 U Waterloo (15.3) Richard Hughson, U Waterloo (47)
Nursing 2.1 U Manitoba (8.3) Lesley Degner, U Manitoba (30)
Pharmacy 5.8 U Manitoba (8.5) Francoise M. Winnick, U Montréal (36)
Public health 5.9 U Saskatchewan (7.5) Jack Siemiatycki, U de Montréal (37)
Veterinary
medicine 7.4 U Guelph (8.5) W. Allan King, U Guelph (36)
All health sciences
(excl. medicine) 4.9
- -

Page | 19
H-indexes in Social Sciences
There are a large number of disciplines within social sciences. Most of them have average H-indexes
between two and five; however Economics at 6.0 and Psychology at 9.6 appear to have publication
cultures nearer to those seen in the physical sciences. In terms of concentrations of academic talent,
McGill, Queen’s and UBC each come top in three disciplines, Montreal with two, with the other spots
taken by Lakehead, Wilfrid Laurier and the University of Toronto. The Universities of Alberta and
Western Ontario, as well as York, Dalhousie and Simon Fraser also show up in Table 6 due to the
presences of some of the country’s top researchers at these schools.
Table 6: Mean H-index by Discipline: Social Sciences
Discipline
Mean H-
index Top Institution (score) Top Researcher (institution) (score)
Aboriginal studies 2.0 Lakehead U. (3.7) Regna Darnell, UWO (14)
Anthropology 4.6 McGill U. (7.4) Colin Chapman, McGill U. (23)
Criminology 3.2 U. de Montréal (7.0) Paul J. Brantingham, SFU (19)
Culture and communications
2.2 U. de Montréal (5.4) Andrew Feenberg, SFU (20)
Economics 6.0 UBC (13.2) John Whalley, UWO (42)
Gender and women’s studies
4.6 Queen’s U. (7.5) Geraldine Pratt, UBC (25)
Geography 5.1 McGill U. (9.9) David Ley, UBC (36)
Law 2.8 U Toronto (6.9) Rebecca Cook, U Toronto (26)
Linguistics 5.6 McGill U. (16.9) Fred Genesee, McGill U. (44)
Political science /public policy
5.0 Queen’s U.(9.5) André Blais, U de Montréal (37)
Psychology 9.6 UBC (17.8) Patrick McGrath, Dalhousie U. (61)
Religious studies 2.8 Wilfrid Laurier U. (4.0) Michael Lambek, U Toronto (21)
Social work 3.7 UBC (6.5) Jane Aronson, McMaster U. (19)
Sociology 5.2 Queen’s U. (10.5) Barry Wellman, U Toronto (59)
All social sciences 5.2 - -

Page | 20
H-indexes in Business
Business has a similar mean H-index to social sciences, but the spread is considerably smaller.
Unsurprisingly, the highest scores come in the economics-related disciplines, and the lower ones in the
much more applied domains of administration and accounting. The University of British Columbia has
the country’s strongest departments in three of the six disciplines in this field, while Toronto, Dalhousie
and Victoria each come top in one.
Table 7: Mean H-index by Discipline: Business
Discipline
Mean H-
index Top Institution (score) Top Researcher (institution) (score)
Accounting 2.8 UBC (7.1) David Cooper, U Alberta (28)
Administration 2.1 Dalhousie U (3.1) Chris Robinson, York U (17)
Business economics 4.8 U Toronto (14.1) Richard Florida, U Toronto (37)
Finance 5.3 UBC (8.6) Randall Morck, U Alberta (42)
Management 3.6 UBC (14.7) Henry Mintzberg, McGill U (58)
Marketing 4.2 U Victoria (8.3) Joffre Swait, U Alberta (29)
All business 3.8 - -
H-indexes in Humanities
As one might easily surmise from the literature on bibliometrics, average H-index scores in the
humanities are low. Because books – which obviously take longer to write than articles – are a major
form of scholarly communication in the humanities, scholars in the humanities tend to publish less
frequently. Less well known is the fact that they also tend to be cited less frequently than other
disciplines. In fact, roughly one-third of professors in humanities have an H-index of zero – meaning
either that person is not published or (more likely) that their work has never been cited. (In the sciences,
by comparison, about one-eighth have an H-index of zero).
In terms of top institutions in the humanities, the University of Toronto’s St. George takes the top spot
in Classics and History, while the Mississauga campus takes it in Language and Translation. Queen’s has
the top publication record in English/Literature and Philosophy.
Page | 21
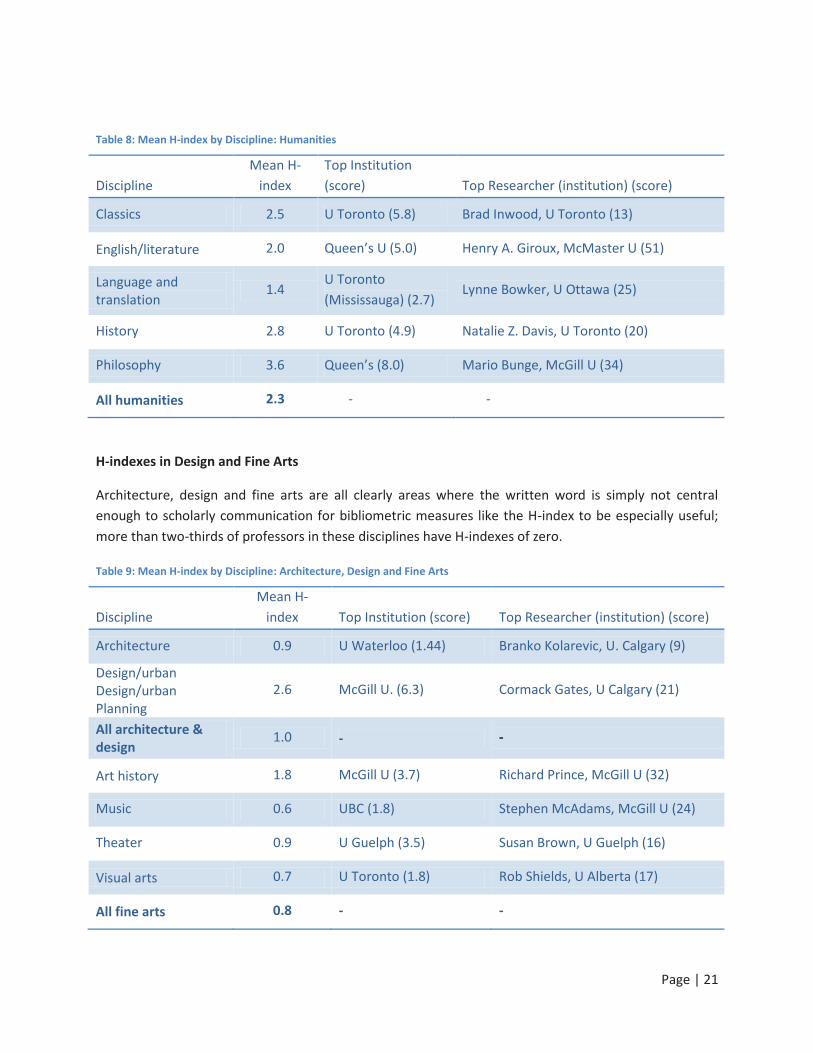
Table 8: Mean H-index by Discipline: Humanities
Discipline
Mean H-
index
Top Institution
(score) Top Researcher (institution) (score)
Classics 2.5 U Toronto (5.8) Brad Inwood, U Toronto (13)
English/literature 2.0 Queen’s U (5.0) Henry A. Giroux, McMaster U (51)
Language and translation
1.4 U Toronto
(Mississauga) (2.7) Lynne Bowker, U Ottawa (25)
History 2.8 U Toronto (4.9) Natalie Z. Davis, U Toronto (20)
Philosophy 3.6 Queen’s (8.0) Mario Bunge, McGill U (34)
All humanities 2.3 - -
H-indexes in Design and Fine Arts
Architecture, design and fine arts are all clearly areas where the written word is simply not central
enough to scholarly communication for bibliometric measures like the H-index to be especially useful;
more than two-thirds of professors in these disciplines have H-indexes of zero.
Table 9: Mean H-index by Discipline: Architecture, Design and Fine Arts
Discipline
Mean H-
index Top Institution (score) Top Researcher (institution) (score)
Architecture 0.9 U Waterloo (1.44) Branko Kolarevic, U. Calgary (9)
Design/urban Design/urban Planning
2.6 McGill U. (6.3) Cormack Gates, U Calgary (21)
All architecture &
design 1.0 - -
Art history 1.8 McGill U (3.7) Richard Prince, McGill U (32)
Music 0.6 UBC (1.8) Stephen McAdams, McGill U (24)
Theater 0.9 U Guelph (3.5) Susan Brown, U Guelph (16)
Visual arts 0.7 U Toronto (1.8) Rob Shields, U Alberta (17)
All fine arts 0.8 - -

Page | 22
Calculation of Normalized Scores and Practical Implications
The mean H-indexes by discipline shown above measure the differences in publication culture among
disciplines. Because these represent almost all Canadian researchers, they accurately measure how
discipline affects H-indexes, when calculated using the specific methodology applied by this research.
Mean H-index by discipline can then be used to calculate a discipline-normalized H-index score.
The normalized score is calculated by dividing each scholar’s H-index by the disciplinary average. A
researcher with a discipline-normalized score of one has an H-index equivalent to the average for his or
her discipline. A score of two implies that the H-index is, on average, twice that of the discipline average.
For example, a scholar working in a discipline where the mean discipline H-index is 10 who has an H-
index of 9 would have a (discipline-normalized) standard score of 0.9.
Using a discipline-normalized H-index allows for a straightforward comparison across disciplines. It can
also be applied to improve comparisons among groups of scholars where there are differences in the
composition of disciplines. For example, imagine one wished to know which school, out of a group of
research institutions, had the greatest research strength in the social sciences. Without field
normalization, one can easily confuse an institution with a larger proportion of its staff working in
disciplines with high mean H-index scores with an institution that genuinely has strength across a range
of disciplines.
Illustrating this point, Table 10 below shows mean normalized and raw H-index scores for two groups of
institutions. Within each group, the H-index scores have been discipline-normalized using the procedure
described above. Group A shows scores in social sciences, while Group B shows scores in sciences. The
rank ordering of the universities in the table changes depending on whether raw H-index scores are
used, or discipline normalized scores are used.
Within Group A, Université de Montréal has a slightly higher normalized score than the University of
Alberta, despite having a lower raw mean H-index. This reflects the high performance of Université de
Montréal in several disciplines where publication culture is less active.18 Similarly, in Group B, the
University of Saskatchewan has a high normalized score than the University of Ottawa despite a less
impressive raw H-index – again reflecting good performance in disciplines with less active publication
cultures.19 Emphasizing the point made earlier, all raw H-index scores in Group B are higher than those
in Group A – but the normalized scores tell a different story. For example, relying on discipline-
normalized H-indexes shows that on average, social science faculty at the University of Alberta have
higher scores than science faculty at the University of Western Ontario despite a much lower mean H-
index.
18
Specifically, Université de Montréal scores highly in criminology and in communications – both disciplines with less active publication cultures, and lower mean H-indexes.
19 Specifically, University of Saskatchewan performs highly in geology and environmental sciences – both disciplines with less active publication cultures, and lower mean H-indexes.

Page | 23
Table 10: H-index and discipline-normalized score: social sciences and sciences (select institutions)
Group A: Social Sciences only Group B: Sciences only
Mean DN H-index*
Mean Raw H-index
Mean DN H-index*
Mean Raw H-index
University of Manitoba 1.15 5.63
University of Western Ontario
1.14 12.17
McMaster University 1.16 6.74
Concordia 1.14 11.20
University of Alberta 1.21 5.52
University of Ottawa 1.34 14.22
Université de Montréal 1.22 4.59
University of Saskatchewan
1.36 11.56
University of Waterloo 1.24 6.54
University of Toronto – St. George
1.60 17.72
* Discipline normalized
A similar calculation can be used to compare groups of researchers at a more detailed level, for
example, comparing performance by discipline or by department. As above, using a discipline-
normalized metric reduces the effect of differences in publication cultures. Table 11 provides an
example where each discipline within the social sciences is presented for comparison. Instead of
presenting the results of a particular university, the U-15 have been merged to illustrate the particular
strengths of the U-15. The discipline-normalized scores show how the U-15 compare with the average of
all Canadian universities. In all social science disciplines, the U-15, as a group, has above average H-
indexes.
The disciplines with the highest mean H-indexes in the U-15 are psychology and economics. However, an
examination of discipline-standardized scores reveals that the U-15 stand out more in environmental
studies and criminology score, which have the highest normalized scores.
Table 11: Standardized score and H-index: social science disciplines, U-15 only
Discipline Mean H-index Mean DN*
Aboriginal Studies 2.72 1.33
Anthropology 5.73 1.24
Archeology 4.27 1.17
Criminology 5.06 1.58
Culture and communications 2.27 1.03
Development Studies 4.73 1.38
Economics 7.82 1.31
Environmental Studies 6.64 1.78
Gender and women's studies 6.23 1.37
Geography 6.93 1.36
History 3.26 1.16
International Relations 6.00 1.17
Law 2.93 1.03

Page | 24
Linguistics 6.51 1.17
Political science 6.20 1.25
Psychology 12.52 1.31
Social work 4.79 1.28
Sociology 7.10 1.37
Social sciences average 6.10 1.29
* normalized by discipline
Table 11 continued

Page | 25
Conclusion
This paper demonstrates that it is possible both to examine H-index scores within disciplines, and to
create discipline-normalized H-indexes for interdisciplinary comparisons. The same approach can be
applied to other bibliometric measures and be used to improve comparative metrics.
This is especially important for several common types of bibliometric comparisons. The first is
international rankings, such as the Shanghai Jiao Tong Academic Ranking of World Universities (ARWU,
or Shanghai Rankings, as it is colloquially known). In the 2011 edition, 20% of this ranking was
determined by research output. This was measured by number of papers cited in Nature and Science,
and papers indexed in Science Citation Index-expanded, and Social Science Citation Index (which were
given double the weight of papers indexed in Science Citation Index-expanded). Another 20% was
determined by “highly cited researchers in 21 broad subject categories.”20 The absence of discipline-
normalization means that this ranking does not control for publication cultures and the biases that they
can generate. As a consequence, institutions with more faculty members in highly productive disciplines
have an advantage. This issue is not unique to ARWU – while some ranking systems break out their
comparisons by field of study, none to date have implemented valid discipline-normalization.
Secondly, comparisons within institutions can be strengthened by discipline normalization. When
institutions assess the relative performance of academic departments or units, often as part of unit
review processes, using accurate discipline-normalization to control for publication culture provides a
more valid comparison.
Lastly, bibliometrics are increasingly applied to hiring decisions within universities. When candidates’
fields of study differ (as would be the case for a dean of science, for example), discipline normalization
helps to ensure that the hiring committee understands differences in publication records (and
corresponding H-indexes) in the context of differences in publication cultures.
It’s time for applications of bibliometrics to become more sensitive to publication culture. Just as
importantly, users of bibliometrics need to be aware of the dramatic biases that publication culture can
generate. We hope that this paper inspires both scholars and professionals to use accurate and
normalized measures when applying bibliometrics to their research, assessment, and decision-making
activities.
20
Academic Ranking of World Universities. 2011. Methodology. Accessed online on 12/06/2012 at http://www.shanghairanking.com/ARWU-Methodology-2011.html

Page | 26
Bibliography
Aksnes D. W. and Taxt R. E. 2004. “Evaluation Correlation” Research Evaluation 13(1): 33-41. Alonso, S., Cabrerizo, F. J., Herrera-Viedma, E., Herrera, F. 2009. “H-index: A Review Focused in its Variants,
Computation and Standardization for Different Scientific Fields” Journal of Informetrics 3(4): 273-289. Ahlgren, P., Colliander, C., and Persson, O. 2012. “Field normalized citation rates, field normalized journal impact
and Norwegian weights for allocation of university research funds” Scientometrics 91(1): 1-14. Bar Ilan. 2008. “Which H-Index? A comparison of WoS, Scopus, and Google Scholar.” Scientometrics, 74(2): 257-
271. Bakkalbasi N, Bauer K., Glover J., and Wang l. 2006. “Three options for citation tracking: Google Scholar, Scopus
and Web of Science”, Biomedical Digital Libraries, 3:7.
Braun, T., and Schubert, A. 1986. “Relative indicators and relational charts for comparative assessment of publication output and citation impact” Scientometrics 9(5-6): 281.
Council of Canadian Academies. 2006. The State of Science and technology in Canada. Ottawa: author. Franceschet, M. 2010. “A comparison of bibliometric indicators for computer science scholars and journals on web
of science and Google Scholar.” Scientometrics, 83(1): 243-258. See especially pages 249-250. Harzing, Ann-Wil. 2012. “A preliminary test of Google Scholar as a source for citation data: A longitudinal study of
Nobel Prize winners” Scientometrics (forthcoming). Harzing, A and van der Wal, R. 2008. “Google Scholar as a new source for citation analysis” Ethics in Science and
Environmental Politics, 8.
Hirsch, J.E. 2005. “An index to quantity and individual’s scientific research output” Proceedings of the National
Academy of Sciences 15: 16569-72.
Hirsch, J.E. 2007. “Does the H-index have predictive power?” Proceedings of the National Academy of Sciences 104:
19193-8.
Lockman I.M. and Yang K. 2007. “Impact of data sources on citation counts and rankings of LIS faculty: Web of
Science versus Scopus versus Google Scholar” Journal of the American Society for Information Science
and Technology, 58(13): 2105-25.
Meho L. I. and Rogers, Y. 2008. “Citation counting, citation ranking, and H-Index of human-computer interaction
researchers: a comparison between Scopus and Web of Science.” Journal of the American Society for
Information Science and Technology, 59(11): 1711-1726. Moed, H.F. 2002. “The impact factors debate: the ISI’s uses and limits”, Nature, 415: 731-2.
Péter Jacsó. 2012. “Google Scholar Author Citation Tracker: is it too little, too late?” Online Information Review
36(1): 126 – 141. Péter Jacsó. 2010. “Metadata mega mess in Google Scholar” Online Information Review 34( 1): 175 – 191.

Page | 27
Saad, G. 2006. “Exploring the H-Index at the author and journal levels using bibliometric data of productive
consumer scholars and business-related journals respectively.” Scientometrics, 69(1): 117-120. Sanderson, M. 2008. “Revisiting h measured of US LIS academics.” Journal of the American Society for Information
Science and Technology, 59(7): 317-330.

Page | 28
Appendix A
Acadia University
Algoma University
Athabasca University
Bishop's University
Brandon University
Brescia University College
Brock University
Canadian Mennonite University
Cape Breton University
College Universitaire de Saint-Boniface
College Universitaire Dominicain
Concordia University
Concordia University College of Alberta
Dalhousie University
École de Téchnologie Supérieure
Emily Carr University of Art and Design
First Nations University of Canada
Grant MacEwan University
Huron University College
King’s University College
King's Universtiy College at the University of Western Ontario
Kwantlen Polytechnic University
Lakehead University
Laurentian University
Laurentian University of Sudbury
Lethbridge University
Luther College
McGill University
McMaster University
Memorial University of Newfoundland
Mount Allison University
Mount Royal University
Mount Saint Vincent University
Nipissing University
Ontario College of Art & Design University
Queen's University
Royal Roads University
Ryerson University
Simon Fraser University
St. Francis Xavier University
St. Thomas University

Page | 29
The King's University College
Thompson Rivers University
Université de Montréal
École des hautes etudes commerciales de Montréal
Université du Québec à Chicoutimi
University of Alberta
University of British Columbia
University of British Columbia-Okanagan Campus
University of Calgary
University of Guelph
University of Lethbridge
University of Manitoba
University of New Brunswick
University of Northern British Columbia
University of Ontario Institute of Technology
University of Ottawa
University of Prince Edward Island
University of Regina
University of Saskatchewan
University of Sherbrooke
University of the Fraser Valley
University of Toronto-Mississauga
University of Toronto-St. George
University of Victoria
University of Waterloo
University of Western Ontario
University of Windsor
University of Winnipeg
Wilfrid Laurier University
York University

www.higheredstrategy.com
400-460 Richmond Street
Toronto, ON M5V 1Y1
Phone: (416) 848-0215
Fax: (416) 849-0500