Making Google Maps - Dawn Wright · Chapter 1: Introduction to Google Mashups! What are mashups?...
22
1 Making Google Maps A comprehensive user guide for creating and using your own online Google Maps By Devlin Hughes and Brett Jackson Trinity College May 2007 edition
Transcript of Making Google Maps - Dawn Wright · Chapter 1: Introduction to Google Mashups! What are mashups?...
1
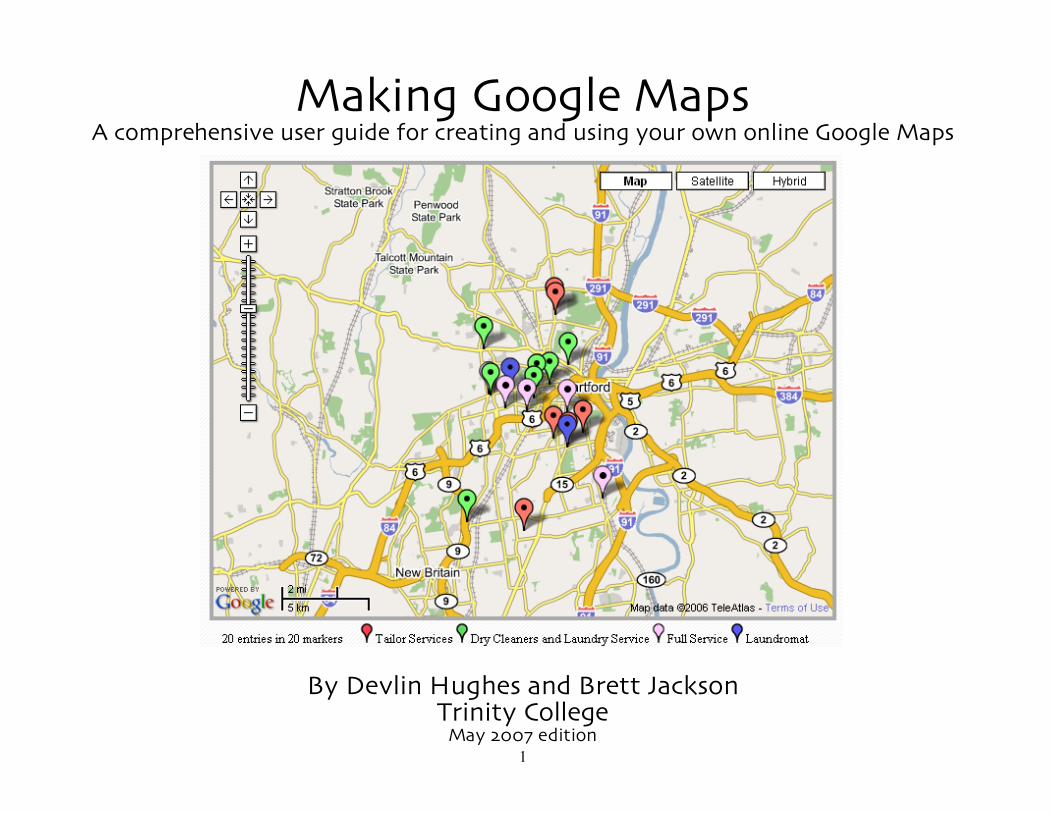
Making Google Maps
A comprehensive user guide for creating and using your own online Google Maps
By Devlin Hughes and Brett Jackson
Trinity College May 2007 edition
2
Chapter 1: Introduction to Google Mashups! What are mashups? Like all maps, mashups display locations chosen by the map’s creator, but unlike most maps, anybody with access to the internet can create a personalized mashup. Mashups live on the website on which they are created, can be edited by those with the correct login information, and are accessible to the public. You can also chose to display a mashup on your website. Mashups use Google Map technology to display specific locations that you pick. They can be created to include a variety of information, such as the location’s address and even a photograph. Depending on the type of location, you may also chose to include a phone number, hours of operation, or any other type of useful information. The technology to make these maps appeared in early 2005. A number of websites arose almost immediately that allowed internet users to create their own online maps. While there are a wide variety of websites online that can be used to create Google Mashups, for the purposes of this manual we will use the ZeeMaps website. Why would I make a mashup? A mashup visually graphs information in ways that charts, tables and spreadsheets cannot. By placing points in their actual geographic locations, data makes more sense and becomes more legible. They are useful for any number of purposes, from displaying the locations of dry cleaners in Hartford to mapping the frequency and location of criminal offences in a particular area. They can be useful for people who do not know an area well or to those who do know it well but need more information to be more readily available. They are relatively easy to make and to maintain, and can be made widely available through the Internet. They are flexible enough, too, as they can be used to create solutions for almost any organization. As a project, some students worked to map resources available to single parent families in the Hartford area. Using the ZeeMaps website, they uploaded over 30 locations onto the map, including the name of the organization, its address, phone number, hours of operation, website address, contact information, and a brief description of the location. To make this online map useful, the students also created an informational pamphlet, which included instructions for using the map and locations for individuals to use the internet to access the map. The goal they wished to reach was to create a network among the included organizations and to help single parents in Hartford gain access to helpful resources. Before creating a mashup, you should ask yourself if it would be helpful to your organization or to your patrons. Would it be valuable to display your information visually on a map? For example, mapping the food banks in the area to see where the available food is would indeed be helpful for examining food resources in a particular region, while mapping every store in a neighborhood might become cluttered and lose its usefulness. Who is my audience and how wil l they access the map? Another important question that can help define what steps to take is who your audience will be. Who needs this map, and how will you get it to them? Do they have Internet access? If not, how can they get to it, and how can they find out about the map? Do you have a mass e-mail list to which you can send a link? Can you include the address in other promotional material, like the pamphlet the students made?
3
Chapter 2: Data Organization What data do I want to use? Once you know what the subject of your map will be (such as Drycleaners in West Hartford), you need to decide what information you would like your map to portray.
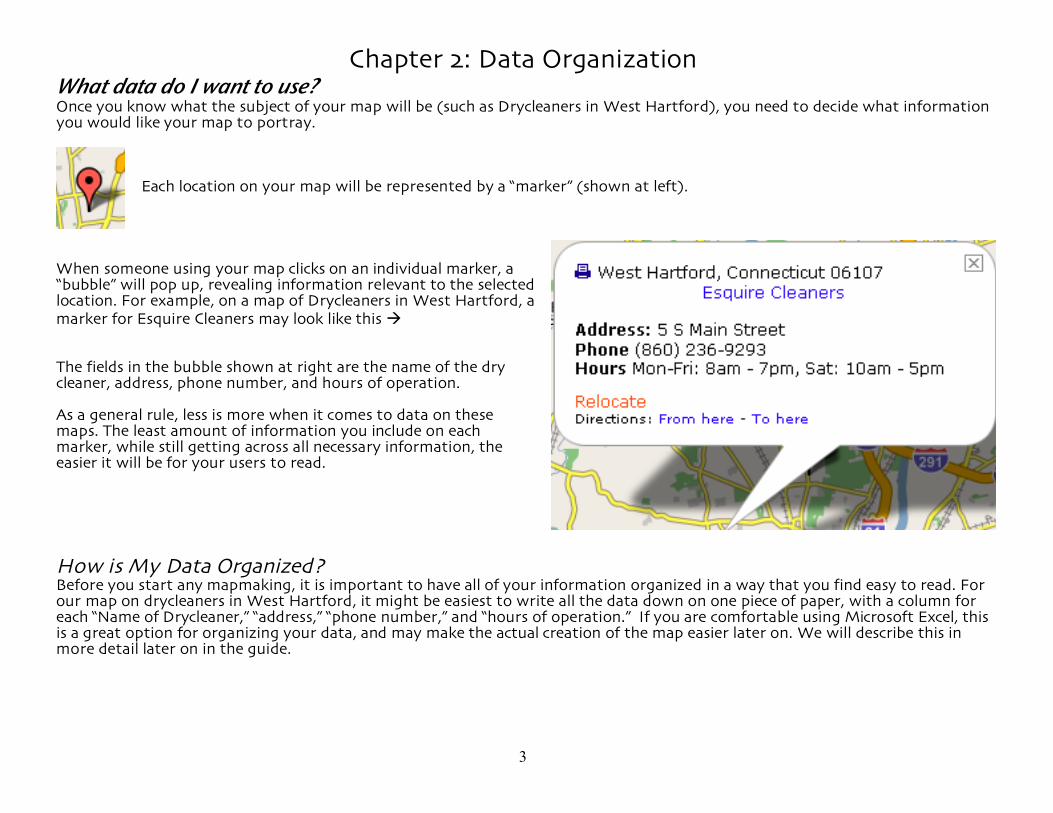
Each location on your map will be represented by a “marker” (shown at left).
When someone using your map clicks on an individual marker, a “bubble” will pop up, revealing information relevant to the selected location. For example, on a map of Drycleaners in West Hartford, a marker for Esquire Cleaners may look like this The fields in the bubble shown at right are the name of the dry cleaner, address, phone number, and hours of operation. As a general rule, less is more when it comes to data on these maps. The least amount of information you include on each marker, while still getting across all necessary information, the easier it will be for your users to read. How is My Data Organized? Before you start any mapmaking, it is important to have all of your information organized in a way that you find easy to read. For our map on drycleaners in West Hartford, it might be easiest to write all the data down on one piece of paper, with a column for each “Name of Drycleaner,” “address,” “phone number,” and “hours of operation.” If you are comfortable using Microsoft Excel, this is a great option for organizing your data, and may make the actual creation of the map easier later on. We will describe this in more detail later on in the guide.
4
Chapter 3: The Anatomy of a Google Map
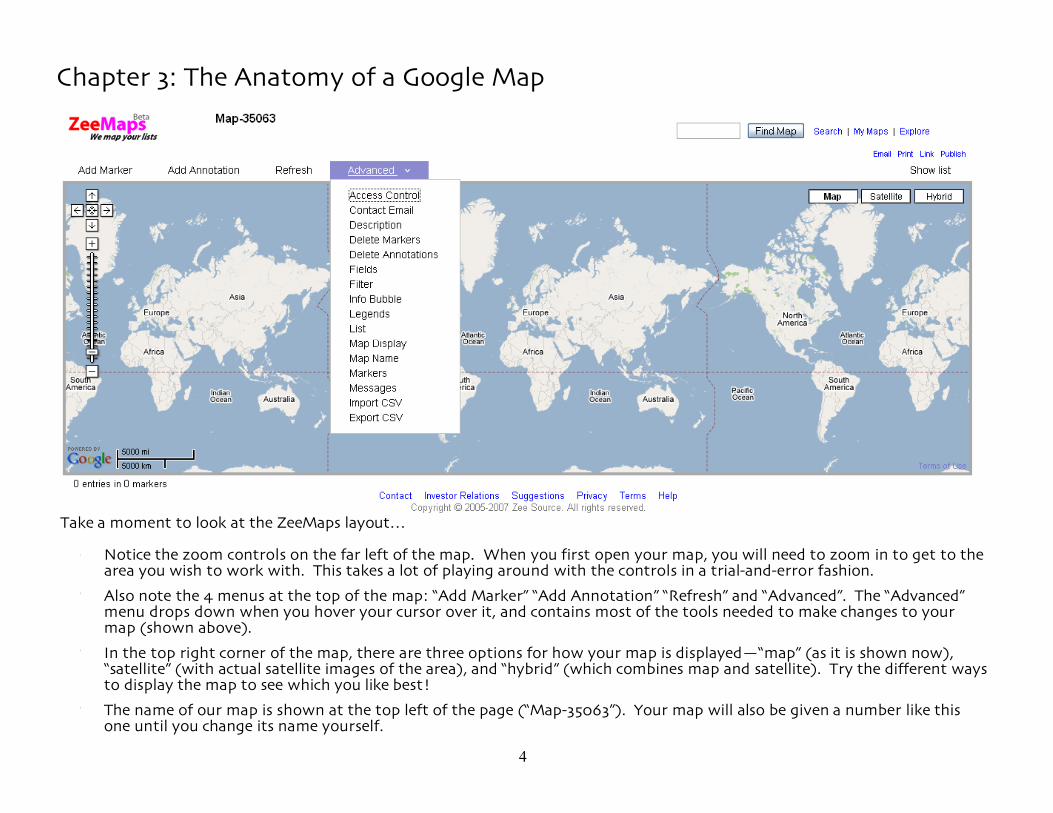
Take a moment to look at the ZeeMaps layout…
- Notice the zoom controls on the far left of the map. When you first open your map, you will need to zoom in to get to the area you wish to work with. This takes a lot of playing around with the controls in a trial-and-error fashion.
- Also note the 4 menus at the top of the map: “Add Marker” “Add Annotation” “Refresh” and “Advanced”. The “Advanced” menu drops down when you hover your cursor over it, and contains most of the tools needed to make changes to your map (shown above).
- In the top right corner of the map, there are three options for how your map is displayed—“map” (as it is shown now), “satellite” (with actual satellite images of the area), and “hybrid” (which combines map and satellite). Try the different ways to display the map to see which you like best!
- The name of our map is shown at the top left of the page (“Map-35063”). Your map will also be given a number like this one until you change its name yourself.
5
- Chapter 2: Making Your Map
Covered in this chapter: 2.1 Getting your Map and Giving it a Name 2.2 Zooming In 2.3 Setting Access Control 2.4 Adding Markers (Individually or as a CSV) 2.5 Changing the Fields of the Markers 2.6 Adding Annotations 2.7 Map Description
6
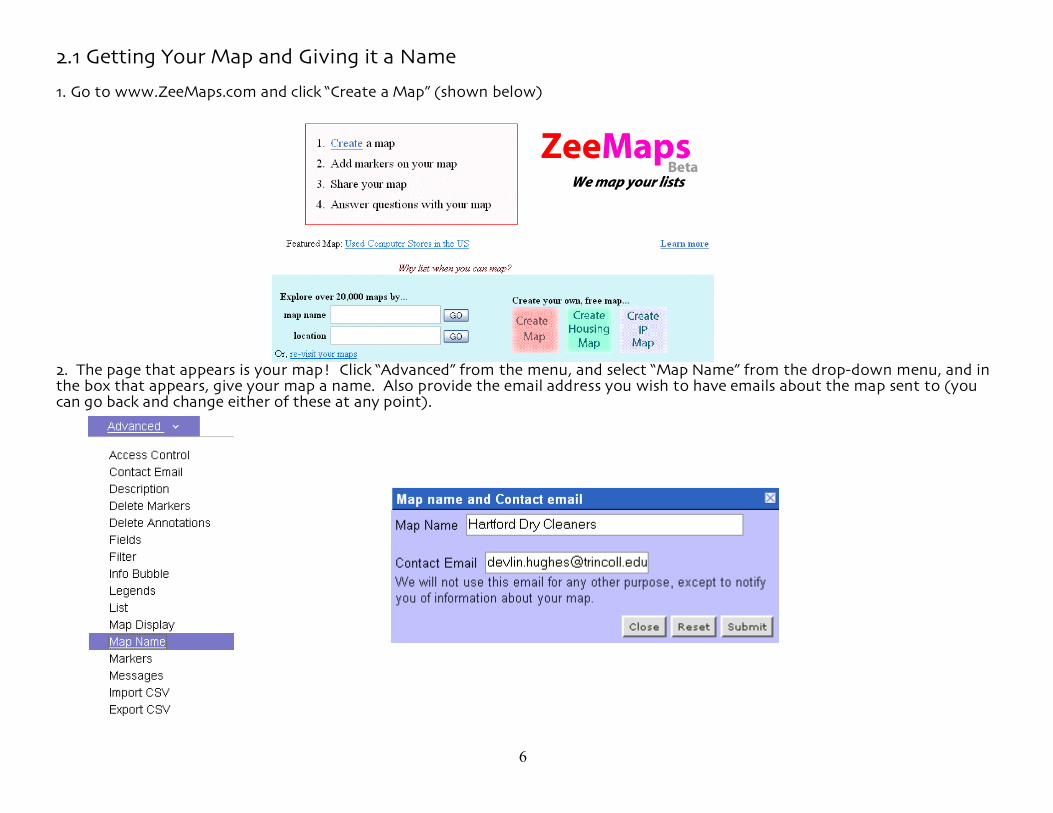
2.1 Getting Your Map and Giving it a Name 1. Go to www.ZeeMaps.com and click “Create a Map” (shown below)
2. The page that appears is your map! Click “Advanced” from the menu, and select “Map Name” from the drop-down menu, and in the box that appears, give your map a name. Also provide the email address you wish to have emails about the map sent to (you can go back and change either of these at any point).

7
2.2 Zooming In 1. Use the controls on the left side of your map (shown below) to zoom in to the area you wish to work with (i.e. Hartford, CT). To do this, just play around with the controls until your map looks the way you want it to.
ZeeMaps is saving all of these changes as you go along!
8
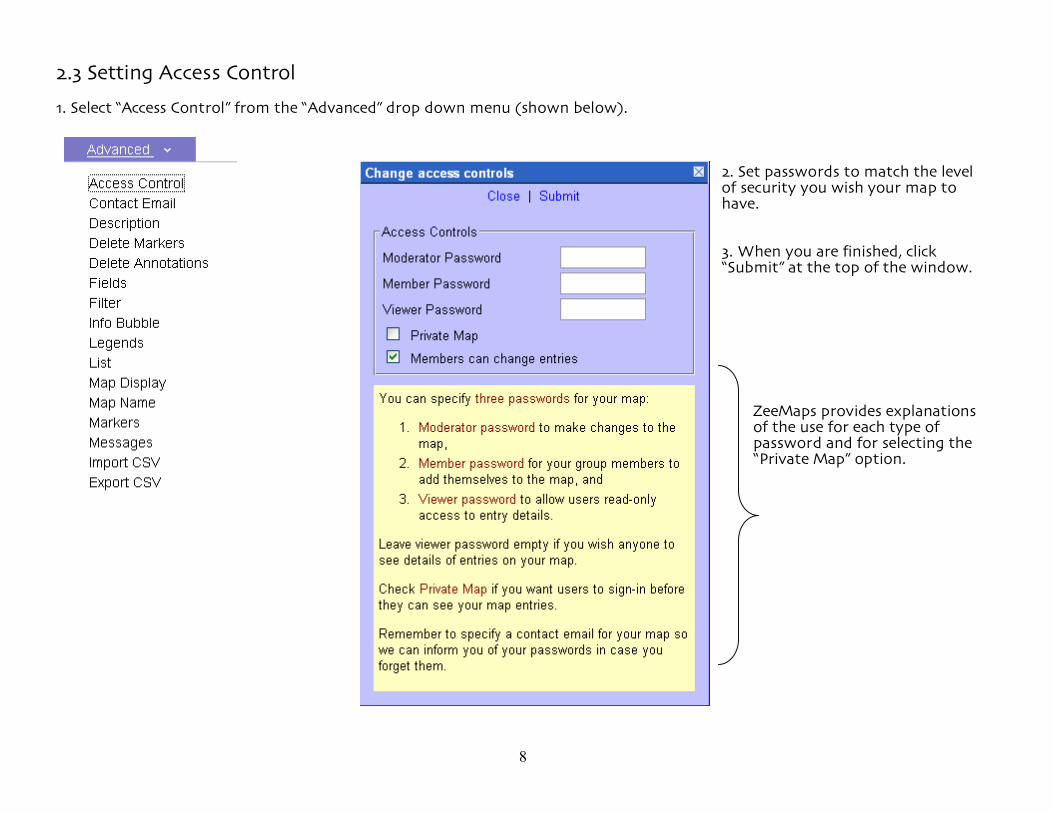
2.3 Setting Access Control 1. Select “Access Control” from the “Advanced” drop down menu (shown below).
2. Set passwords to match the level of security you wish your map to have. 3. When you are finished, click “Submit” at the top of the window.
ZeeMaps provides explanations of the use for each type of password and for selecting the “Private Map” option.
9
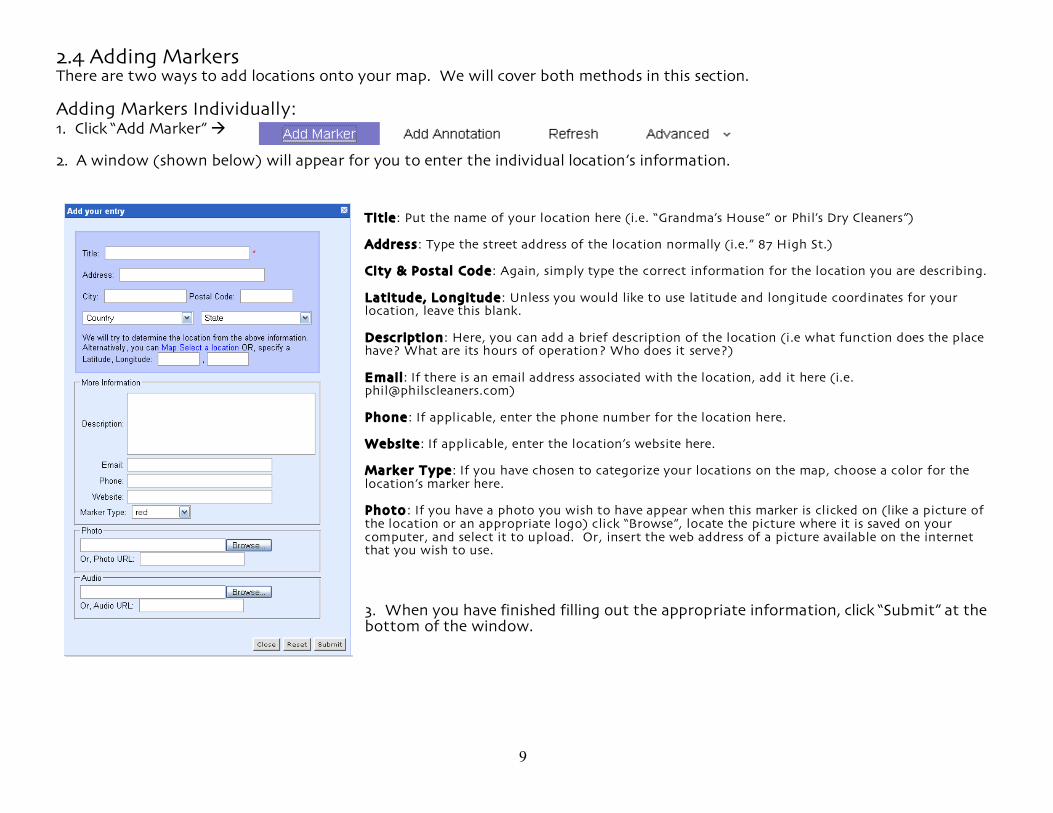
2.4 Adding Markers There are two ways to add locations onto your map. We will cover both methods in this section. Adding Markers Individually: 1. Click “Add Marker” 2. A window (shown below) will appear for you to enter the individual location’s information.
Title: Put the name of your location here (i.e. “Grandma’s House” or Phil’s Dry Cleaners”) Address: Type the street address of the location normally (i.e.” 87 High St.) City & Postal Code: Again, simply type the correct information for the location you are describing. Latitude, Lo ngitude: Unless you would like to use latitude and longitude coordinates for your location, leave this blank. Description: Here, you can add a brief description of the location (i.e what function does the place have? What are its hours of operation? Who does it serve?) E mail: If there is an email address associated with the location, add it here (i.e. [email protected]) Phone: If applicable, enter the phone number for the location here. Website: If applicable, enter the location’s website here. Marker Type: If you have chosen to categorize your locations on the map, choose a color for the location’s marker here. Photo: If you have a photo you wish to have appear when this marker is clicked on (like a picture of the location or an appropriate logo) click “Browse”, locate the picture where it is saved on your computer, and select it to upload. Or, insert the web address of a picture available on the internet that you wish to use. 3. When you have finished filling out the appropriate information, click “Submit” at the bottom of the window.
10
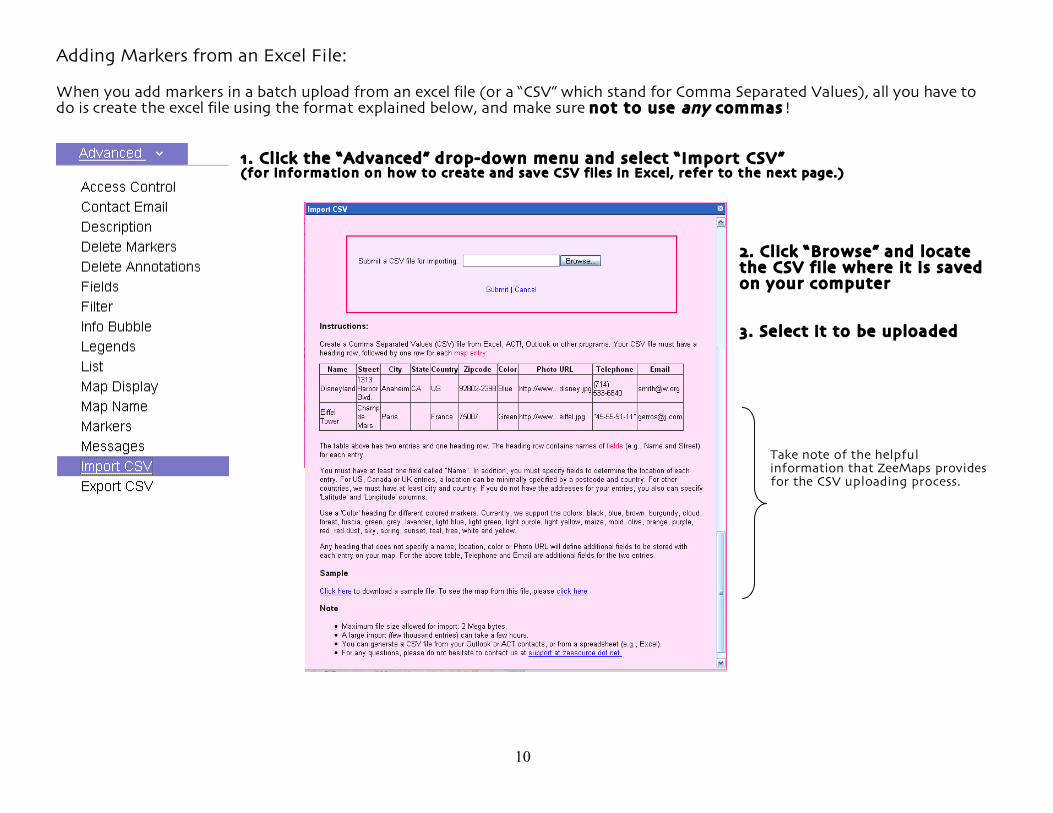
Adding Markers from an Excel File: When you add markers in a batch upload from an excel file (or a “CSV” which stand for Comma Separated Values), all you have to do is create the excel file using the format explained below, and make sure not to use any commas!
1 . Click the “Advanced” drop-down menu and select “Import CSV” ( fo r in fo r matio n o n h ow to create and save CSV files in Excel, re fer to the next page.)
2. Click “Browse” and locate the CSV file where it is saved on your computer 3. Select it to be uploaded
Take note of the helpful information that ZeeMaps provides for the CSV uploading process.
11
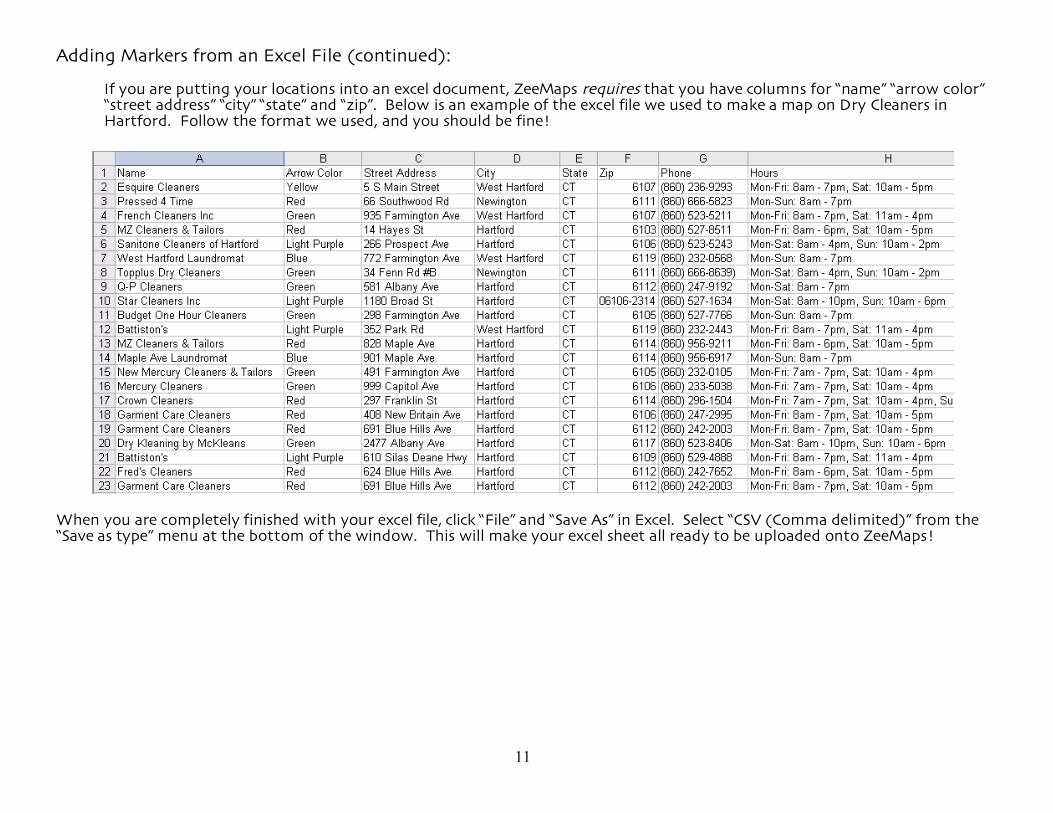
Adding Markers from an Excel File (continued): If you are putting your locations into an excel document, ZeeMaps requires that you have columns for “name” “arrow color” “street address” “city” “state” and “zip”. Below is an example of the excel file we used to make a map on Dry Cleaners in Hartford. Follow the format we used, and you should be fine!
When you are completely finished with your excel file, click “File” and “Save As” in Excel. Select “CSV (Comma delimited)” from the “Save as type” menu at the bottom of the window. This will make your excel sheet all ready to be uploaded onto ZeeMaps!
12
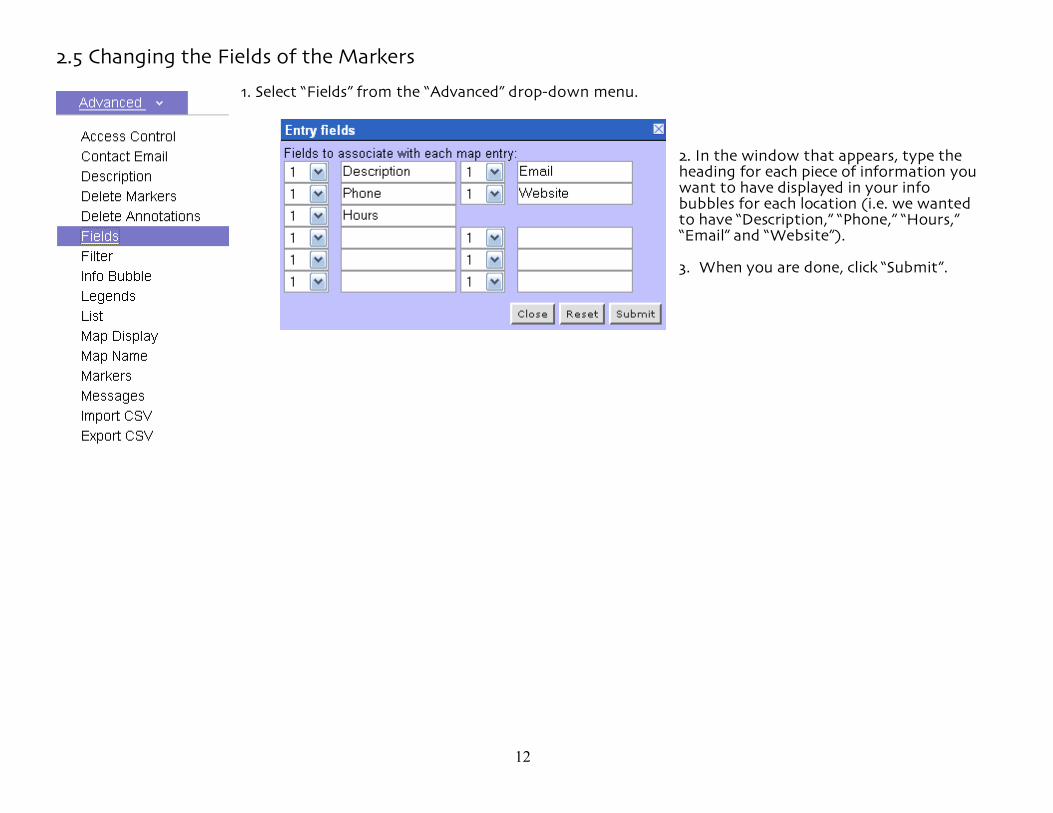
2.5 Changing the Fields of the Markers
1. Select “Fields” from the “Advanced” drop-down menu.
2. In the window that appears, type the heading for each piece of information you want to have displayed in your info bubbles for each location (i.e. we wanted to have “Description,” “Phone,” “Hours,” “Email” and “Website”). 3. When you are done, click “Submit”.
13
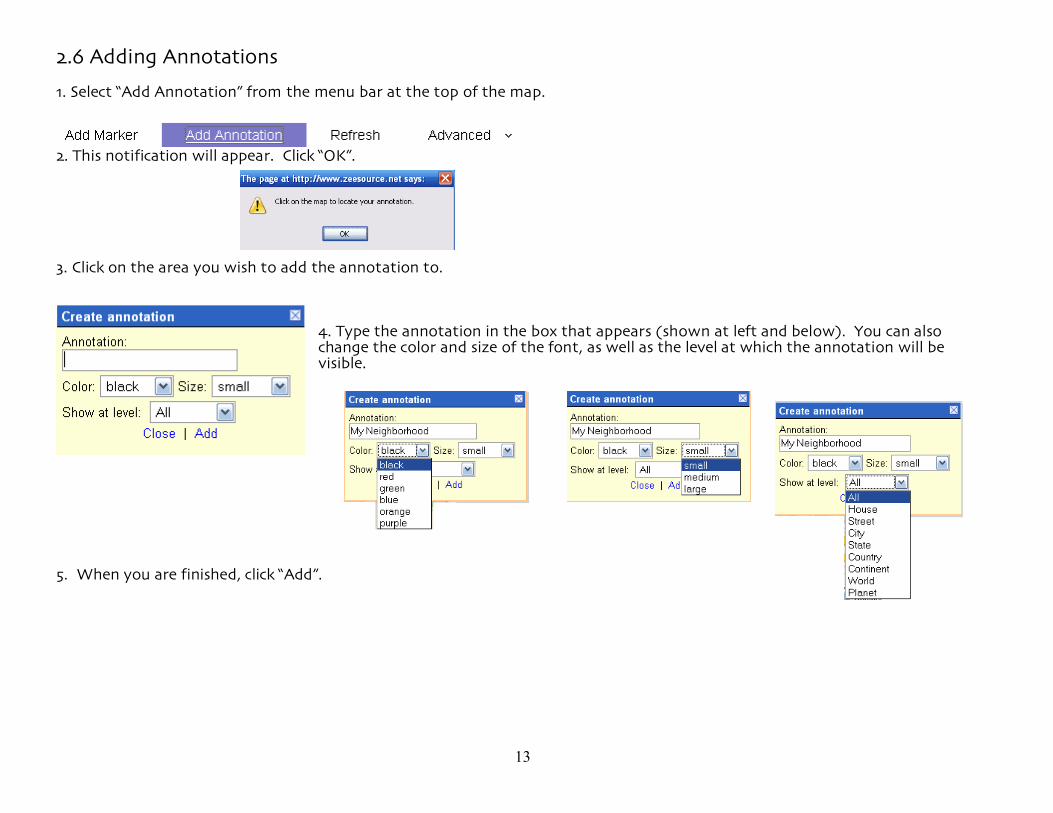
2.6 Adding Annotations 1. Select “Add Annotation” from the menu bar at the top of the map.
2. This notification will appear. Click “OK”. 3. Click on the area you wish to add the annotation to.
4. Type the annotation in the box that appears (shown at left and below). You can also change the color and size of the font, as well as the level at which the annotation will be visible.
5. When you are finished, click “Add”.
14
Chapter 3: Making Your Map Just How You Want It
Covered in this chapter: 3.1 Deleting Markers 3.2 Deleting Annotations 3.3 Filter 3.4 Info Bubble 3.5 Legends 3.6 Map Display
15
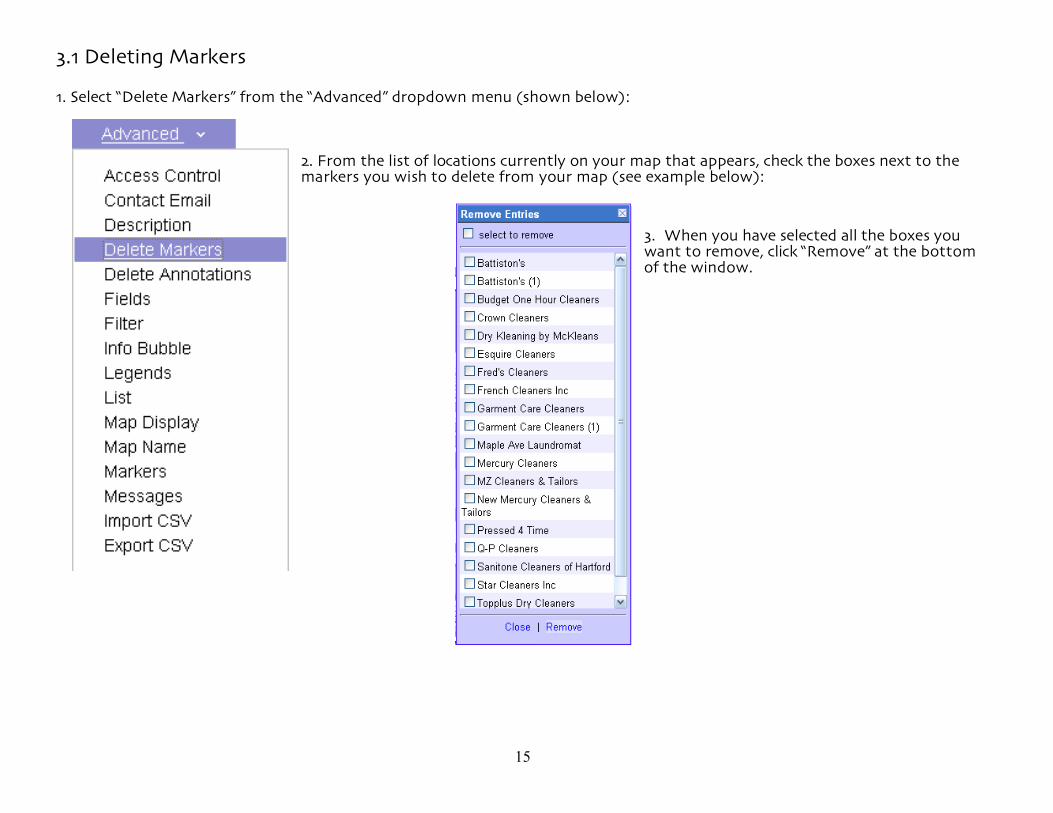
3.1 Deleting Markers 1. Select “Delete Markers” from the “Advanced” dropdown menu (shown below):
2. From the list of locations currently on your map that appears, check the boxes next to the markers you wish to delete from your map (see example below):
3. When you have selected all the boxes you want to remove, click “Remove” at the bottom of the window.
16
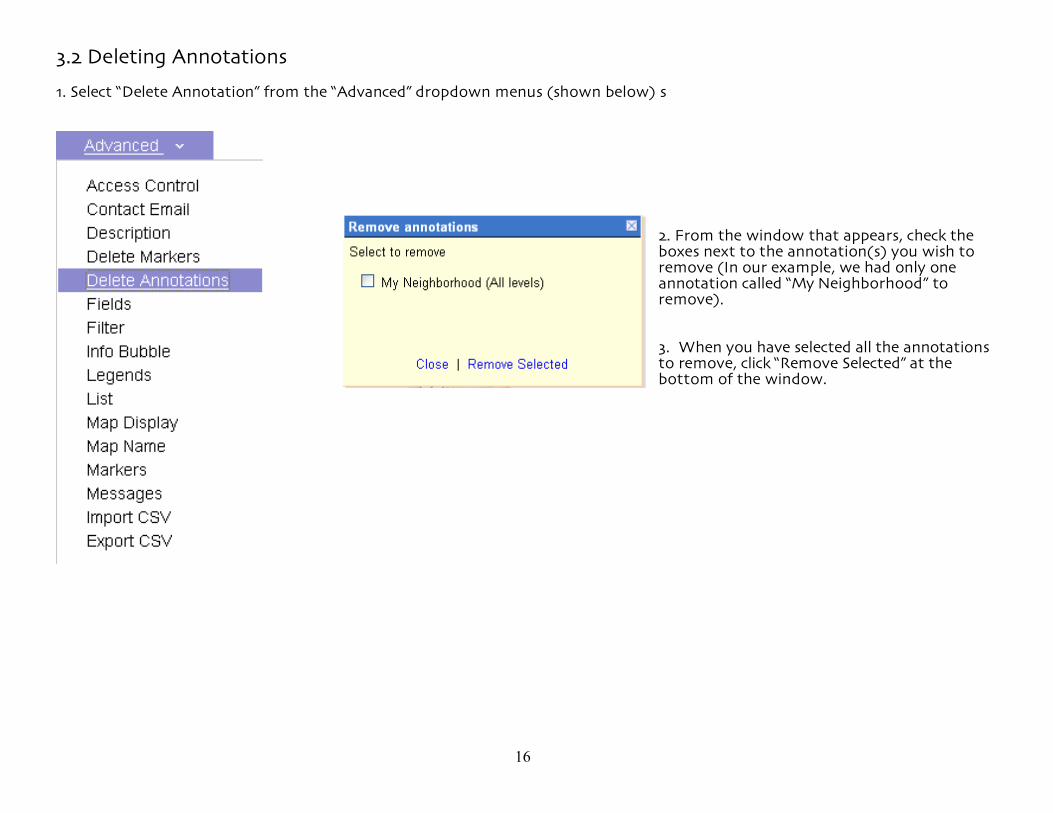
3.2 Deleting Annotations 1. Select “Delete Annotation” from the “Advanced” dropdown menus (shown below) s
2. From the window that appears, check the boxes next to the annotation(s) you wish to remove (In our example, we had only one annotation called “My Neighborhood” to remove). 3. When you have selected all the annotations to remove, click “Remove Selected” at the bottom of the window.
17
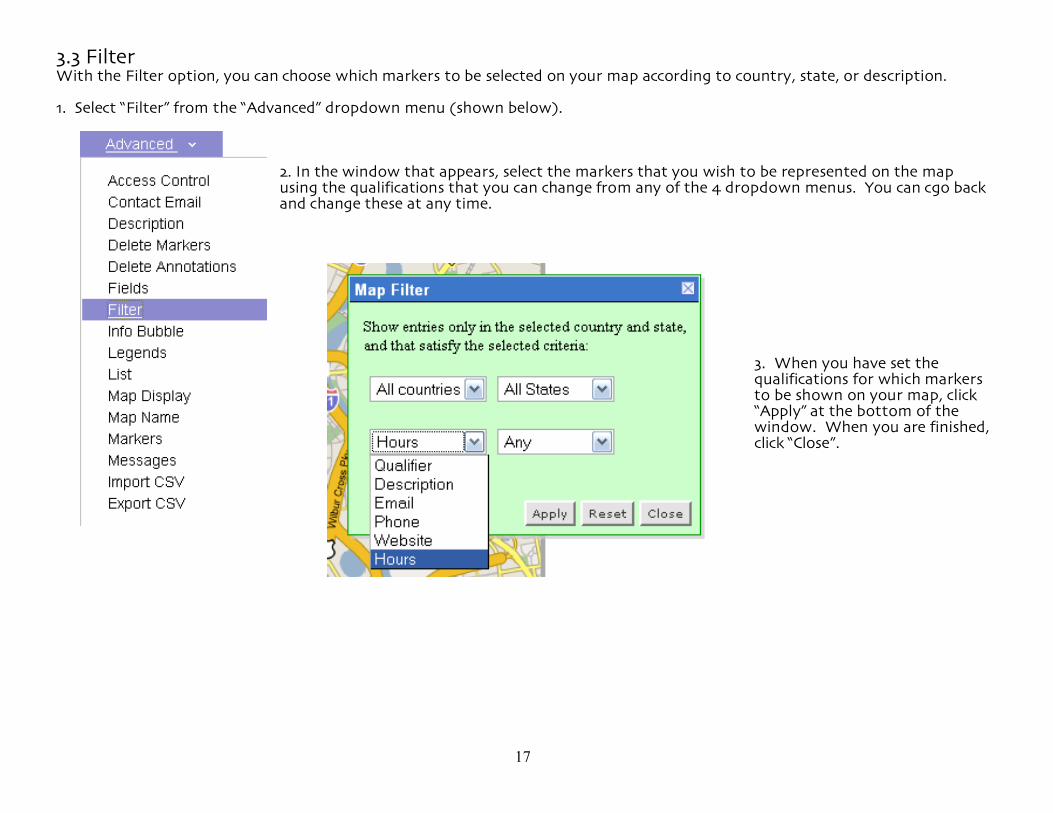
3.3 Filter With the Filter option, you can choose which markers to be selected on your map according to country, state, or description. 1. Select “Filter” from the “Advanced” dropdown menu (shown below).
2. In the window that appears, select the markers that you wish to be represented on the map using the qualifications that you can change from any of the 4 dropdown menus. You can cgo back and change these at any time.
3. When you have set the qualifications for which markers to be shown on your map, click “Apply” at the bottom of the window. When you are finished, click “Close”.
18
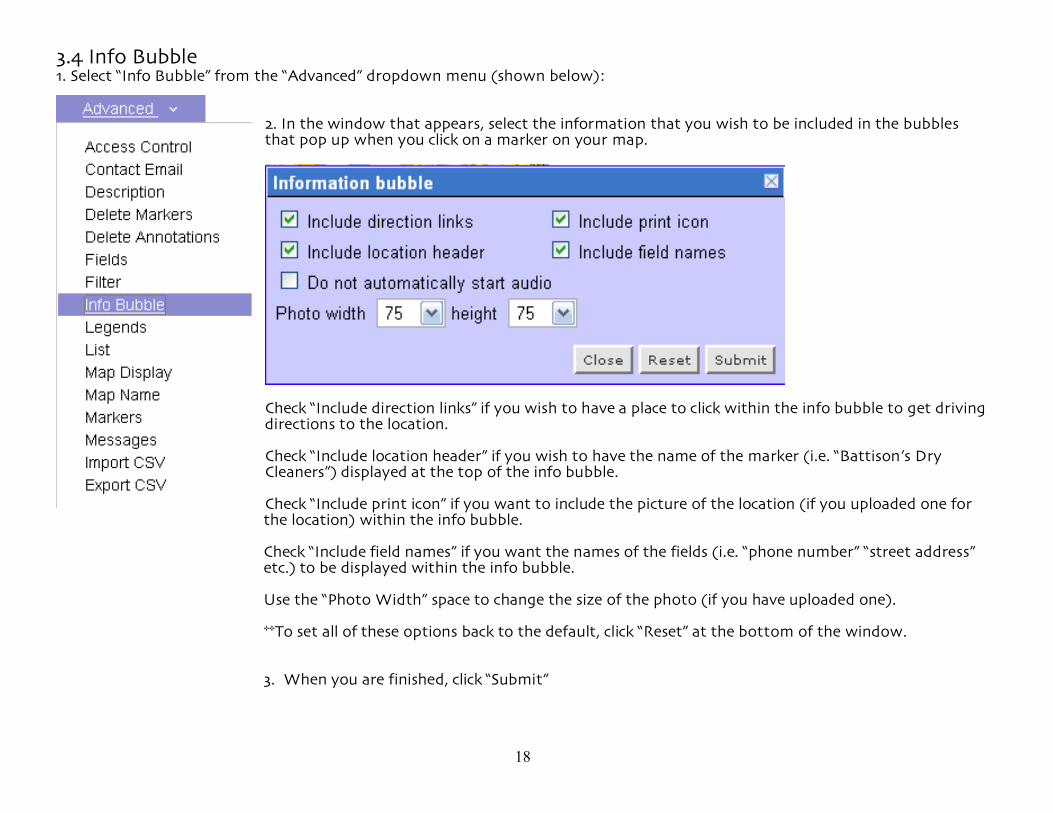
3.4 Info Bubble 1. Select “Info Bubble” from the “Advanced” dropdown menu (shown below):
2. In the window that appears, select the information that you wish to be included in the bubbles that pop up when you click on a marker on your map.
Check “Include direction links” if you wish to have a place to click within the info bubble to get driving directions to the location. Check “Include location header” if you wish to have the name of the marker (i.e. “Battison’s Dry Cleaners”) displayed at the top of the info bubble. Check “Include print icon” if you want to include the picture of the location (if you uploaded one for
the location) within the info bubble.
Check “Include field names” if you want the names of the fields (i.e. “phone number” “street address” etc.) to be displayed within the info bubble. Use the “Photo Width” space to change the size of the photo (if you have uploaded one). **To set all of these options back to the default, click “Reset” at the bottom of the window. 3. When you are finished, click “Submit”
19
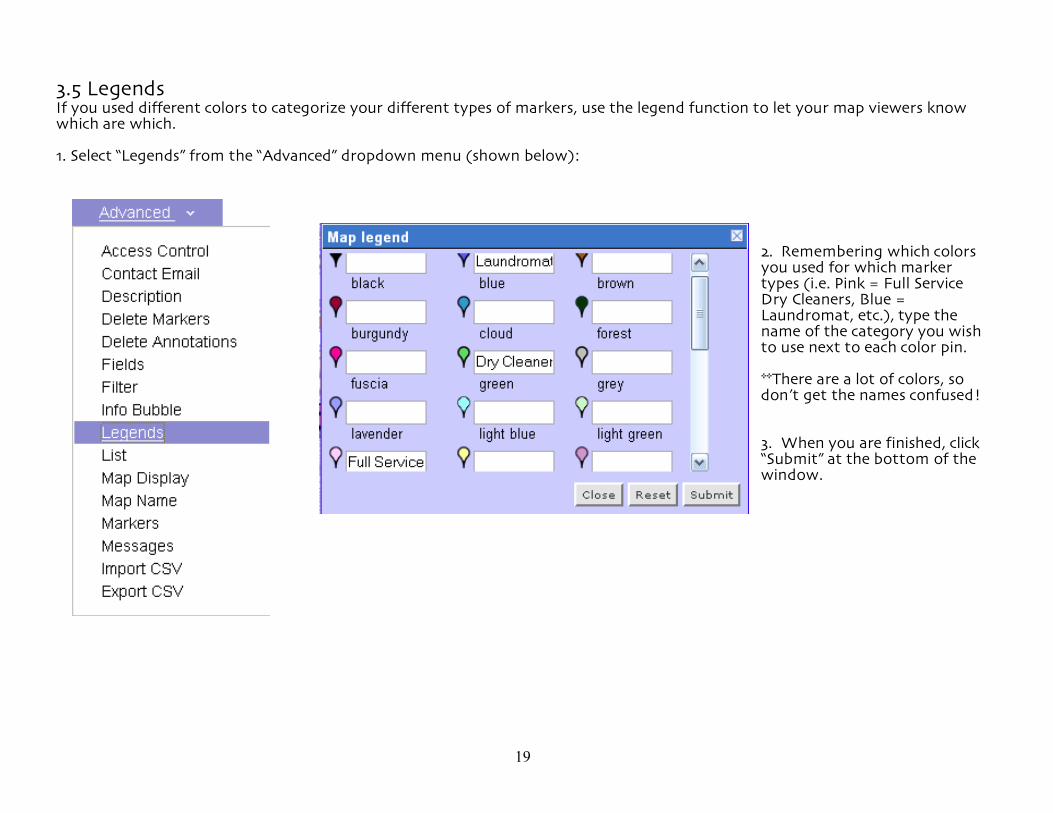
3.5 Legends If you used different colors to categorize your different types of markers, use the legend function to let your map viewers know which are which. 1. Select “Legends” from the “Advanced” dropdown menu (shown below):
2. Remembering which colors you used for which marker types (i.e. Pink = Full Service Dry Cleaners, Blue = Laundromat, etc.), type the name of the category you wish to use next to each color pin. **There are a lot of colors, so don’t get the names confused! 3. When you are finished, click “Submit” at the bottom of the window.
20
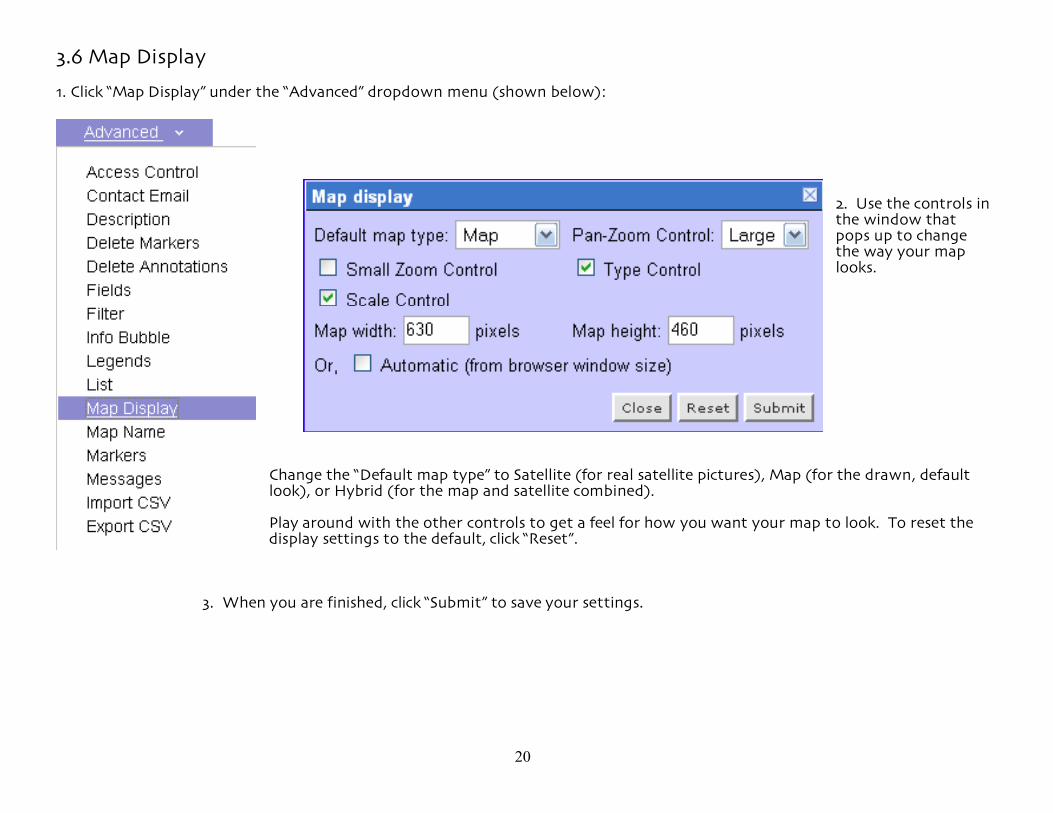
3.6 Map Display 1. Click “Map Display” under the “Advanced” dropdown menu (shown below):
2. Use the controls in the window that pops up to change the way your map looks.
Change the “Default map type” to Satellite (for real satellite pictures), Map (for the drawn, default look), or Hybrid (for the map and satellite combined). Play around with the other controls to get a feel for how you want your map to look. To reset the display settings to the default, click “Reset”.
3. When you are finished, click “Submit” to save your settings.
21
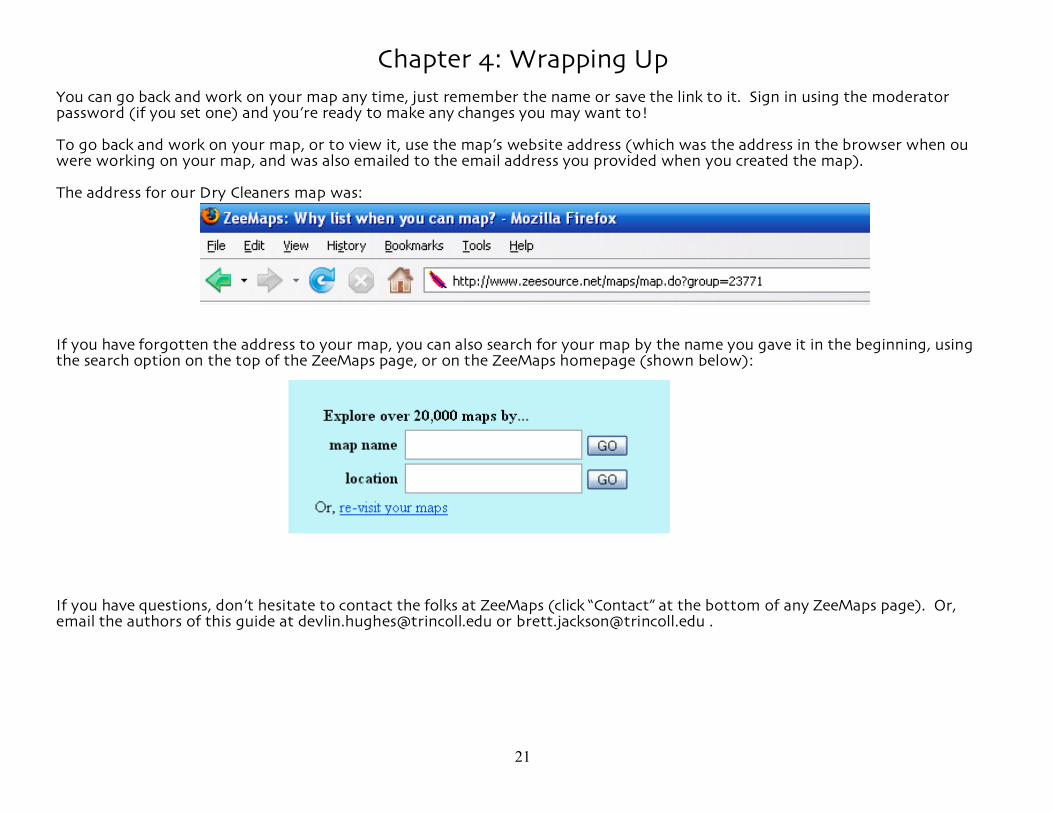
Chapter 4: Wrapping Up You can go back and work on your map any time, just remember the name or save the link to it. Sign in using the moderator password (if you set one) and you’re ready to make any changes you may want to! To go back and work on your map, or to view it, use the map’s website address (which was the address in the browser when ou were working on your map, and was also emailed to the email address you provided when you created the map). The address for our Dry Cleaners map was:
If you have forgotten the address to your map, you can also search for your map by the name you gave it in the beginning, using the search option on the top of the ZeeMaps page, or on the ZeeMaps homepage (shown below):
If you have questions, don’t hesitate to contact the folks at ZeeMaps (click “Contact” at the bottom of any ZeeMaps page). Or, email the authors of this guide at [email protected] or [email protected] .
22
Conclusion
We hope that this guide has been clear and helpful as you create your own Google Maps! If you have any questions, please contact us! Devlin Hughes, Co-Author: [email protected] Brett Jackson, Co-Author: [email protected] Rachael Barlow, [email protected] Dan Lloyd, [email protected] ZeeMaps also provides contact information on their website: Zee Source 1684 Nightingale Avenue, Suite 201 Sunnyvale, CA 94087, USA Email: [email protected] Phone: (408) 333-9853, (408) 373-4027, (US toll free 1-(888) 584-6071 About the Authors: Devlin Hughes ’09, a Psychology and Data Representation double major, and Brett Jackson ’09, an English and Music double major, discovered mashups in Professor Dan Lloyd’s class Invisible Cities at Trinity College in Hartford, in which students learned to use mashups to further the goals of community organizations. This project arose from an independent study following that class, Studies in Geographical Information Systems. Its goal was to create a long-term solution for community organizations to learn how to utilize the extensive tools available for making Google Maps.