MAKE IN MAHARASHTRA - indiaenvironmentportal Survey of... · employment guarantee act (MGNREGA) in...
241
MAKE IN MAHARASHTRA
Transcript of MAKE IN MAHARASHTRA - indiaenvironmentportal Survey of... · employment guarantee act (MGNREGA) in...

MAKE IN MAHARASHTRA

DIRECTORATE OF ECONOMICS AND STATISTICS,PLANNING DEPARTMENT,
GOVERNMENT OF MAHARASHTRA, MUMBAI

PREFACE
‘Economic Survey of Maharashtra’ is prepared by the Directorate of
Economics and Statistics, Planning Department every year for presentation in the
Budget Session of the State Legislature. The present publication for the year 2015-16
is the 55th issue in the series. The information related to various socio-economic
sectors of the economy alongwith indicators and trends, wherever possible, are also
provided for ready reference.
2. In an attempt to use latest available data for this publication, some of the
data / estimates used are provisional.
3. This Directorate is thankful to the concerned Departments and undertakings of
the Central and State Government for providing useful information in time that
enabled us to bring out this publication.
A.D. Deo Director Directorate of Economics and Statistics, Government of Maharashtra Mumbai
Dated : 17th March, 2016

Economic Survey of Maharashtra 2015-16
ECONOMIC SURVEY OF MAHARASHTRA 2015-16
CONTENTS Subject Page No. Overview of the State 1
A. Maharashtra at a Glance 3 B. Maharashtra’s comparison with India 6 1. State Economy 9 2. Population 13 3. State Income 21 4. Prices and Public Distribution System
Prices Public Distribution System
33
5. Public Finance 55 6. Institutional Finance & Capital Market 67 7. Agriculture and Allied Activities
Agriculture Irrigation Horticulture Animal Husbandry Dairy Development Fisheries Forests and Social Forestry
77
8. Industry & Co-operation Industry Co-operation
105
9. Infrastructure Energy Transport & Communications
127
10. Social Sector Education Public Health Women & Child Welfare Employment & Poverty Housing Water Supply & Sanitation Environment Conservation Social Justice
151
Human development 11. Special Studies 207
Glossary 213 C. Selected Socio-economic indicators of States in India 218

Economic Survey of Maharashtra 2015-16
ANNEXURES
Subject Page No.
Annx. 2.1 Population of Maharashtra and India as per censuses 15
Annx. 2.2 Rural and urban population in Maharashtra based on censuses 15
Annx. 2.3 Districtwise population characteristics - Census 2011 16
Annx. 2.4 Religionwise population - Census 2011 17
Annx. 2.5 Religionwise Literacy Rate - Census 2011 18
Annx. 2.6 Districtwise no.of Inhabited villages classified by female literacy rates – Census 2001 & 2011
19
Annx. 3.1 Gross State value added at basic prices by industry of origin & Gross State Domestic Product at market prices at current prices
25
Annx. 3.2 Gross State value added at basic prices by industry of origin & Gross State Domestic Product at market prices at constant (2011-12) prices
26
Annx. 3.3 Net State value added at basic prices by industry of origin & Net State Domestic Product at market prices at current prices
27
Annx. 3.4 Net State value added at basic prices by industry of origin & Net State Domestic Product at market prices at constant (2011-12) prices
28
Annx. 3.5 Gross value added at basic prices by industry of origin, Gross domestic product at market prices & gross national income at current prices
29
Annx. 3.6 Gross value added at basic price by economic activity, Gross Domestic product at market prices & Net National Income at constant (2011-12) prices
30
Annx. 3.7 Net value added at basic prices by industry of origin, Net domestic product at market prices & net national income at current prices
31
Annx. 3.8 Net value added at basic prices by industry of origin, Net domestic product at market prices & net national income at constant (2011-12) prices
32
Annx. 4.1 Groupwise Consumer Price Index numbers for rural Maharashtra 40
Annx. 4.2 Groupwise Consumer Price Index numbers for urban Maharashtra 41
Annx. 4.3 Consumer Price Index (central) for major states 42
Annx. 4.4 Consumer Price Index numbers for agricultural labourers and rural labourers in Maharashtra and All-India
43
Annx. 4.5 All-India Consumer Price Index numbers for industrial workers 44
Annx. 4.6 Consumer Price Index numbers for industrial workers at selected centres in Maharashtra
45
Annx. 4.7 Consumer Price Index numbers for industrial workers at selected centres in Maharashtra
46

Economic Survey of Maharashtra 2015-16
Subject Page No.
Annx. 4.8 All-India Wholesale Price Index numbers 47
Annx. 4.9 Inflation rates based on important price indices 48
Annx. 4.10 Districtwise total number of existing ration cards (As on 31stDecember,2015)
49
Annx. 4.11 Quantity of rice and wheat issued to authorised ration/fair price shops 50
Annx. 4.12 Allotment by Government of India to the State 50
Annx. 4.13 Districtwise number of godowns available, their capacity and Fair Price Shops
51
Annx. 4.14 Allotment, Off-take & Distribution of foodgrains to FPSs during 2014-15 under Antyodaya Anna Yojana
52
Annx. 4.15 Allotment, Off-take & Distribution of foodgrains to FPSs during 2015-16 upto December under Antyodaya Anna Yojana
53
Annx. 5.1 Budget at a glance 62
Annx. 5.2 Budget : Trends in receipts on revenue and capital accounts 63
Annx. 5.3 Budget : Trends in expenditure on revenue and capital accounts 64
Annx. 5.4 Borrowings & other liabilities during the year 65
Annx. 5.5 Final consumption expenditure and expenditure on capital formation of Government
66
Annx. 6.1 Deposits and credit of all scheduled commercial banks 74
Annx. 6.2 Districtwise Annual Credit Plan (2015-16) 75
Annx. 7.1 Area under principal crops, production and yield per hectare in the State 96
Annx. 7.2 Cropwise index numbers of agricultural production in the State 98
Annx. 7.3 Total number, area and average size of operational holdings in the State according to agricultural Censuses
99
Annx. 7.4 Land utilisation statistics of the State 100
Annx. 7.5 Area under irrigation in the State 101
Annx. 7.6 Irrigation & non-irrigation water charges levied, recovered and outstanding
102
Annx. 7.7 Livestock and poultry in Maharashtra State 103
Annx. 8.1 Important characteristics of industries in Maharashtra 120
Annx. 8.2 Index numbers of industrial production in India 122
Annx. 8.3 Financial assistance sanctioned and disbursed by financial institutions to industries in Maharashtra
123
Annx. 8.4 Minerals production in Maharashtra 124

Economic Survey of Maharashtra 2015-16
Subject Page No.
Annx. 8.5 Details of Co-operative societies in Maharashtra 125
Annx. 9.1 Electricity supply & consumption in the State 147
Annx. 9.2 Road length by type of roads in Maharashtra State (Maintained by Public Works Department and Zilla Parishads)
148
Annx. 9.3 Classification of district-wise road length according to breadth (maintained by PWD and ZP)
149
Annx. 9.4 Categorywise number of motor vehicles on road in Maharashtra State 150
Annx. 10.1 Statewise Composite Education Development Index All Schools : All Managements
192
Annx. 10.2 Number of health science institutions, their intake capacity and students admitted in the first year of the course for the year 2015-16
193
Annx. 10.3 Number of technical institutions, their intake capacity and students admitted in the first year of the course for the year 2015-16
194
Annx. 10.4 Number of institutions for arts, science, commerce, Non A.I.C.T.E courses, law, education, fine arts, their intake capacity and students admitted in first year of the course for the year 2015-16
195
Annx. 10.5 Number of institutions for agriculture, veterinary and fishery science courses, their intake capacity and students admitted in first year of the course for the year 2015-16
196
Annx. 10.6 Medical facilities available in Maharashtra State (public and government aided)
197
Annx. 10.7 Birth rates, death rates, infant mortality rates and total fertility rates based on sample registration scheme, Maharashtra State
198
Annx. 10.8 Economic classification of workers as per Population census 2011 199
Annx. 10.9 Average daily employment in different industries in Maharashtra 200
Annx. 10.10 Working factories and factory employment in Maharashtra 201
Annx. 10.11 Registrations in the employment and self employment Guidance centres in the state, the vacancies notified and Placements effected
202
Annx. 10.12 Number of persons on the live register of employment and Self-employment guidance centres as on 31st December, 2014
203
Annx. 10.13 Categorywise number of works completed and expenditure incurred thereon under the Mahatma Gandhi National rural employment guarantee act (MGNREGA) in Maharashtra
204
Annx. 10.14 Industrial disputes in Maharashtra** 205
Annx. 10.15 Districtwise human development index 2011 206
Annx. 11.1 Fifth and sixth economic census at a glance 210
Annx. 11.2 Number of establishments and persons working according to Broad economic activities (sixth economic census)
211

Economic Survey of Maharashtra 2015-16
OVERVIEW OF THE STATE
Maharashtra occupies the western and central part of the country and has a long coastline stretching nearly 720 km along the Arabian Sea. The Sahyadri mountain ranges provide a natural backbone to the State on the west, while the Satpuda hills along the north and Bhamragad-Chiroli-Gaikhuri ranges on the east serve as its natural borders. The State is surrounded by Gujarat to the north west, Madhya Pradesh to the north, Chhattisgarh to the east, Andhra Pradesh to the south east, Karnataka to the south and Goa to the south west.
The State enjoys tropical monsoon climate. The hot scorching summer from March onwards is followed by monsoon in early June. The rich green cover of the monsoon season persists during the mild winter that follows through an unpleasant October transition. The seasonal rains from the western sea-clouds are very heavy and the rainfall is over 400 cm on the Sahyadrian crests. The Konkan on the windward side is endowed with heavy rainfall, declining northwards. East of the Sahyadri, the rainfall diminishes to a meager 70 cm in the western plateau districts, with Solapur and Ahmednagar lying in the heart of the dry zone. The rains slightly increase eastwards in the Marathwada and Vidarbha regions.
Maharashtra is the second largest state in India in terms of population and has geographical area about 3.08 lakh sq. km. As per population census, 2011 the population of the State is 11.24 crore which is 9.3 per cent of the total population of India and is highly urbanised with 45.2 per cent people residing in urban areas.
The State has 36 districts which are divided into six revenue divisions viz. Konkan, Pune, Nashik, Aurangabad, Amravati and Nagpur for administrative purposes, with effective machinery for planning at the district level. For local self-governance in rural areas, there are 34 Zilla Parishads, 351 Panchayat Samitis and 27,920 Gram Panchayats. The urban areas are governed through 26 Municipal Corporations, 230 Municipal Councils, 110 Nagar Panchayats and seven Cantonment Boards.
Mumbai, the capital of Maharashtra and the financial capital of India, houses the headquarters of most of the major corporate & financial institutions. India's main stock exchanges & capital market and commodity exchanges are located in Mumbai.
The State has 234 lakh ha of land under cultivation and area under forest is 52.1 lakh ha. Many irrigation projects are being implemented to improve irrigation. A watershed development programme is being implemented to ensure that soil and water conservation measures are implemented speedily in the unirrigated area.
The Jalyukta Shivar Abhiyaan is launched to make Maharashtra ‘a drought-free state by 2019’ and every year 5,000 villages are targeted to make them free of water scarcity.
Animal husbandry is an important agriculture related activity. The State’s share in livestock and poultry population in India is about 6.3 per cent and 10.7 per cent respectively.
Maharashtra is one of the highly industrialised states. It is pioneer in Small Scale Industries and continues to attract industrial investments from both, domestic as well as foreign institutions. It is a major IT growth centre.
The State has given importance to primary education, which has resulted in consistent improvement in literacy rate. The literacy rate of the State is 82.3 per cent against 73 per cent at

Economic Survey of Maharashtra 2015-16
2
All-India level as per Population census, 2011. Free education upto XIIth class is provided to girls. Excellent higher educational institutions in the fields of engineering, medical and management are located here.
As per India Human Development Report 2011, India’s Human Development Index is 0.467 whereas, it is 0.572 for the State.
The State has well spread road network of 2.99 lakh km (maintained by Public Works Department and Zilla Parishads). All weather roads and fair weather roads connect about 99 per cent villages. The surface transport facilities and connectivity with sea ports and airports have resulted in good transport system.
The State is well known for its administrative acumen and innovative ideas. It is first to implement Women Policy and engendering the budget by establishing separate ‘Women & Child Development’ department. It is pioneer in implementing its ‘Employment Guarantee Scheme’ which is replicated by the Government of India.
Maharashtra is not just a geographical expression but an entity built on collective efforts of its people. Natural as well as cultural diversities have helped in the development of a unique Marathi culture. It has its own spiritual dimension and known as Land of Saints. The State has played a significant role in the social and political scenario of the nation.
Monuments such as Ajanta, Ellora and Elephanta caves, Gateway of India and architectural structures like Viharas and Chaityas attract tourists from all over the world. It has produced many important personalities covering almost every aspect of human development. The State has sizable contribution in sports, arts, literature and social services. The world famous film industry, popularly known as ‘Bollywood’ is located in the State.
All the above make Maharashtra a great place to live in.
* * * * *

Economic Survey of Maharashtra 2015-16
3
A. MAHARASHTRA AT A GLANCE Item 1960-61 1970-71 1980-81 1990-91 2000-01 2010-11 2014-15
(1) (2) (3) (4) (5) (6) (7) (8) 1. Geographical Area- ('000 sq. km.) 306 308 308 308 308 308 308
2. Administrative Setup - Revenue Divisions 4 4 6 6 6 6 6 Districts 26 26 28 31 35 35 36 Talukas 229 235 301 303 353 355@@ 355@@ Inhabited villages 35,851 35,778 39,354 40,412 41,095 40,959 40,959 Un-inhabited villages 3,016 2,883 2,479 2,613 2,616 2,706 2,706 Towns # 266 289 307 336 378 534 534 3. Population as per Census– (in '000)
(1961) (1971) (1981) (1991) (2001) (2011) (2011)
Total 39,554 50,412 62,784 78,937 96,879 1,12,374 1,12,374 Males 20,429 26,116 32,415 40,826 50,401 58,243 58,243 Females 19,125 24,296 30,369 38,111 46,478 54,131 54,131 Rural 28,391 34,701 40,791 48,395 55,778 61,556 61,556 Urban 11,163 15,711 21,993 30,542 41,101 50,818 50,818 Scheduled Castes 2,227 3,177 4,480 8,758 9,882 13,276 13,276 Scheduled Tribes 2,397 3,841 5,772 7,318 8,577 10,510 10,510 Density of population (per sq. km.)
129 164 204 257 315 365 365
Literacy rate (percentage) 35.1 45.8 57.1 64.9 76.9 82.3 82.3 Sex ratio (Females per thousand males)
936 930 937 934 922 929 929
Percentage of urban population 28.22 31.17 35.03 38.69 42.43 45.2 45.2 4. State Income – (At current prices)
State Income (` crore) 2,249 5,780 19,377 68,861 2,43,584 9,50,771 15,72,037+† Agriculture & allied activities (` crore)
585 1,078 3,756 12,326 32,711 1,22,932 1,57,477+††
Industry Sector (` crore) 553 1,732 6,224 22,554 64,942 2,63,512 4,48,077+†† Service Sector (` crore) 1,111 2,969 9,397 33,981 1,45,931 5,64,326 7,52,708+†† Per capita State income (`) 576 1,168 3,112 8,811 28,540 84,858 1,34,081+ 5. Agriculture - (Area in '000 ha) Net area sown 17,878 17,668 18,299 18,565 17,844 17,406 N.A. Gross cropped area 18,823 18,737 19,642 21,859 21,619 23,175 N.A. Gross irrigated area 1,220 1,570 2,415 3,319 3,852 @ @ of which command area^ 226$ 422 718 1,076$$ 1,764## 2,955## 3,137## Percentage of gross irrigated area to gross cropped area
6.5 8.4 12.3 15.2 17.8 N.A. N.A.
6. Area under principal crops- (in '000 ha)
Rice 1,300 1,352 1,459 1,597 1,512 1,516 1,551 Wheat 907 812 1,063 867 754 1,307 1,067 Jowar 6,284 5,703 6,469 6,300 5,094 4,060 3,288 Bajra 1,635 2,039 1,534 1,940 1,800 1,035 865 All cereals 10,606 10,320 10,976 11,136 9,824 8,985 8,059 All pulses 2,349 2,566 2,715 3,257 3,557 4,038 3,413 All foodgrains 12,955 12,886 13,691 14,393 13,382 13,023 11,472 N.A. Not Available @@ Excluding 3 Talukas of Mumbai & Mumbai suburban Districts # Including census towns + First revised estimates(Base year 2011-12) † Estimates are at market prices †† Estimates are at basic prices @ As per the recommendations of Special Inquiry Team (SIT) various committees/ sub-committees are formed to decide further line of action. $ 1961-62 $$ 1991-92 ## This includes canals, rivers, nallahas, wells & lift irrigation in command area. ^ Command area created by Water Resources Dept. .
Economic Survey of Maharashtra 2015-16
4
A. MAHARASHTRA AT A GLANCE
Item 1960-61 1970-71 1980-81 1990-91 2000-01 2010-11 2014-15 (1) (2) (3) (4) (5) (6) (7) (8)
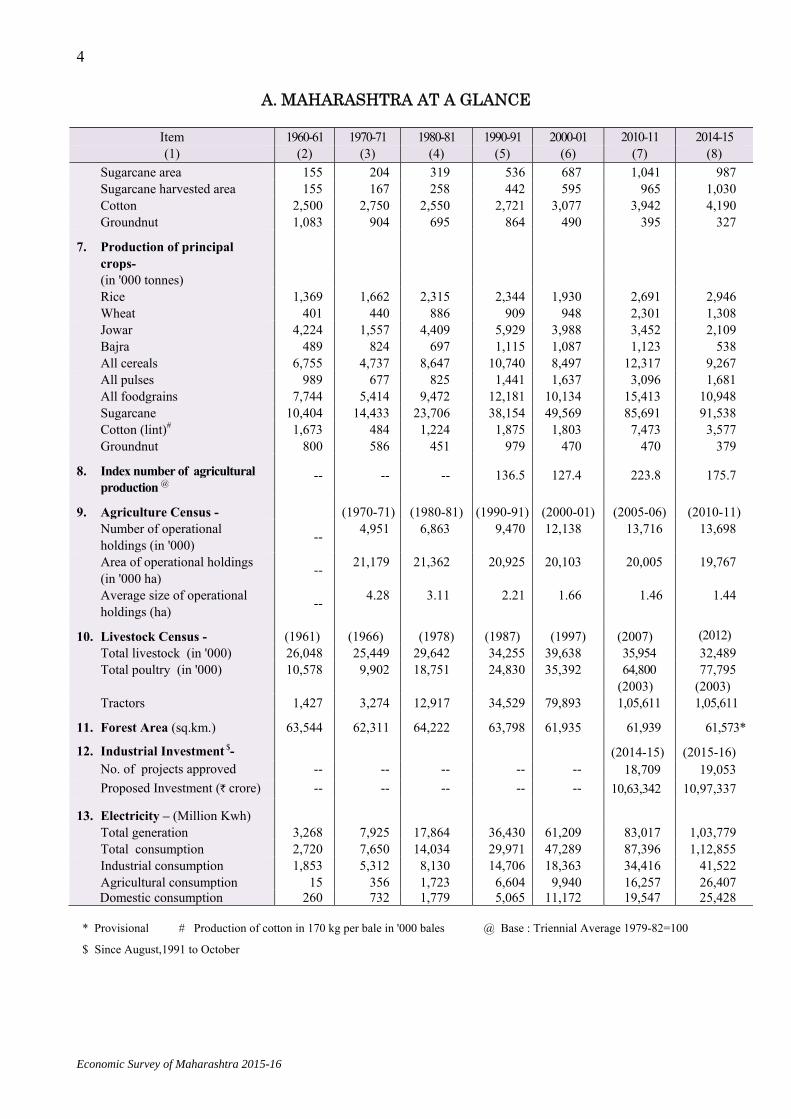
Sugarcane area 155 204 319 536 687 1,041 987 Sugarcane harvested area 155 167 258 442 595 965 1,030 Cotton 2,500 2,750 2,550 2,721 3,077 3,942 4,190 Groundnut 1,083 904 695 864 490 395 327
7. Production of principal crops-
(in '000 tonnes) Rice 1,369 1,662 2,315 2,344 1,930 2,691 2,946 Wheat 401 440 886 909 948 2,301 1,308 Jowar 4,224 1,557 4,409 5,929 3,988 3,452 2,109 Bajra 489 824 697 1,115 1,087 1,123 538 All cereals 6,755 4,737 8,647 10,740 8,497 12,317 9,267 All pulses 989 677 825 1,441 1,637 3,096 1,681 All foodgrains 7,744 5,414 9,472 12,181 10,134 15,413 10,948 Sugarcane 10,404 14,433 23,706 38,154 49,569 85,691 91,538 Cotton (lint)# 1,673 484 1,224 1,875 1,803 7,473 3,577 Groundnut 800 586 451 979 470 470 379
8. Index number of agricultural production @
-- -- -- 136.5 127.4 223.8 175.7
9. Agriculture Census - (1970-71) (1980-81) (1990-91) (2000-01) (2005-06) (2010-11) Number of operational holdings (in '000) -- 4,951 6,863 9,470 12,138 13,716 13,698
Area of operational holdings (in '000 ha) -- 21,179 21,362 20,925 20,103 20,005 19,767
Average size of operational holdings (ha) -- 4.28 3.11 2.21 1.66 1.46 1.44
10. Livestock Census - (1961) (1966) (1978) (1987) (1997) (2007) (2012) Total livestock (in '000) 26,048 25,449 29,642 34,255 39,638 35,954 32,489 Total poultry (in '000) 10,578 9,902 18,751 24,830 35,392 64,800 77,795 (2003) (2003) Tractors 1,427 3,274 12,917 34,529 79,893 1,05,611 1,05,611
11. Forest Area (sq.km.) 63,544 62,311 64,222 63,798 61,935 61,939 61,573*
12. Industrial Investment $- (2014-15) (2015-16) No. of projects approved -- -- -- -- -- 18,709 19,053 Proposed Investment (` crore) -- -- -- -- -- 10,63,342 10,97,337
13. Electricity – (Million Kwh)
Total generation 3,268 7,925 17,864 36,430 61,209 83,017 1,03,779 Total consumption 2,720 7,650 14,034 29,971 47,289 87,396 1,12,855 Industrial consumption 1,853 5,312 8,130 14,706 18,363 34,416 41,522 Agricultural consumption 15 356 1,723 6,604 9,940 16,257 26,407 Domestic consumption 260 732 1,779 5,065 11,172 19,547 25,428
* Provisional # Production of cotton in 170 kg per bale in '000 bales @ Base : Triennial Average 1979-82=100
$ Since August,1991 to October

Economic Survey of Maharashtra 2015-16
5
A. MAHARASHTRA AT A GLANCE
Item 1960-61 1970-71 1980-81 1990-91 2000-01 2010-11 2014-15 (1) (2) (3) (4) (5) (6) (7) (8)
14. Banking - (Scheduled Commercial)
(June, 1971) (June, 1981) (June, 1991) (June, 2001) (June, 2010) (June, 2014)
Banking offices N.A. 1,471 3,627 5,591 6,294 8,037 10,760* (March, 1991) (March, 2001) Banking offices for rural population
N.A. 450 1,355 2,749 2,294 2,170 2,914*
15. Education+ -
Primary schools 34,594 44,535 51,045 57,744 65,960 75,695 1,04,551 Enrolment (in '000) 4,178 6,539 8,392 10,424 11,857 10,626 16,172 Secondary schools (incl. higher secondary)
2,468 5,313 6,119 10,519 15,389 21,357 24,497
Enrolment (in '000) 858 1,985 3,309 6,260 9,267 10,711 6,181
16. Health - (1971) (1981) (1991) (2001) (2011) ( 2014) Hospitals N.A. 299 530 768 1,102 1368 1,402 Dispensaries N.A. 1,372 1,776 1,896 1,544 3012 3,087 Beds per lakh of population N.A. 88 114 144 106 103 108 (2013) Birth rate @ 34.7 32.2 28.5 26.2 20.7 16.7 16.5 Death rate @ 13.8 12.3 9.6 8.2 7.5 6.3 6.2 Infant mortality rate @ 86 105 79 60 45 25 24
17. Transport -
Railway route length (Kilometer)
5,056 5,226 5,233 5,434 5,459 5,984 6,103
Total road length (Kilometer)† 39,241 65,364 1,41,131 1,72,965 2,16,968 2,41,712 2,99,368 of which surfaced 24,852 35,853 66,616 1,32,048 1,78,999 2,21,182 2,45,214 Motor vehicles (in '000) 100 312 805 2,641 6,607 16,990 25,060
18. Co-operation -
Primary agricultural credit societies
21,400 20,420 18,577 19,565 20,551 21,451 21,064*
Membership (in lakh) 22 38 54 79 101 150 144* Total no. of co-op. societies 31,565 42,597 60,747 1,04,620 1,58,016 2,24,306 2,25,721* Total membership (in lakh) 42 86 148 269 430 530 539* Total working capital of 291 1,489 5,210 24,284 1,34,440 2,48,434 3,38,074* co-op. societies (` crore)
19. Local Self-Govt. Institutions - (2015-16)$
Zilla Parishads 25 25 25 29 33 33 34 Gram Panchayats 21,636 22,300 24,281 25,827 27,735 27,913 27,920 Panchayat Samitees 295 296 296 298 321 351 351 Municipal Councils 219 221 220 228 228 222 230 Municipal Corporations 3 4 5 11 15 23 26 Nagar Panchayat -- -- -- -- 3 4 111 Cantonment Boards 7 7 7 7 7 7 7
* Provisional @ As per Sample Registration Scheme N.A. Not Available
† Roads maintained by P.W.D. and Z.P. $ As per State Election Commission(As on 25.2.2016)
+ The source of this information has been changed from year 2011-12. The information is categorised as Primary (1 to 8) and Secondary (including higher secondary) (9 to 12). Earlier the information was categorised as Primary (1 to 7) and Secondary (including higher secondary) (8 to 12) and source for 2014-15. This information is U-DISE.
Economic Survey of Maharashtra 2015-16
6
B. MAHARASHTRA’S COMPARISON WITH INDIA
Item Unit Maharashtra India Comparison with India
(Percentage) (1) (2) (3) (4) (5)
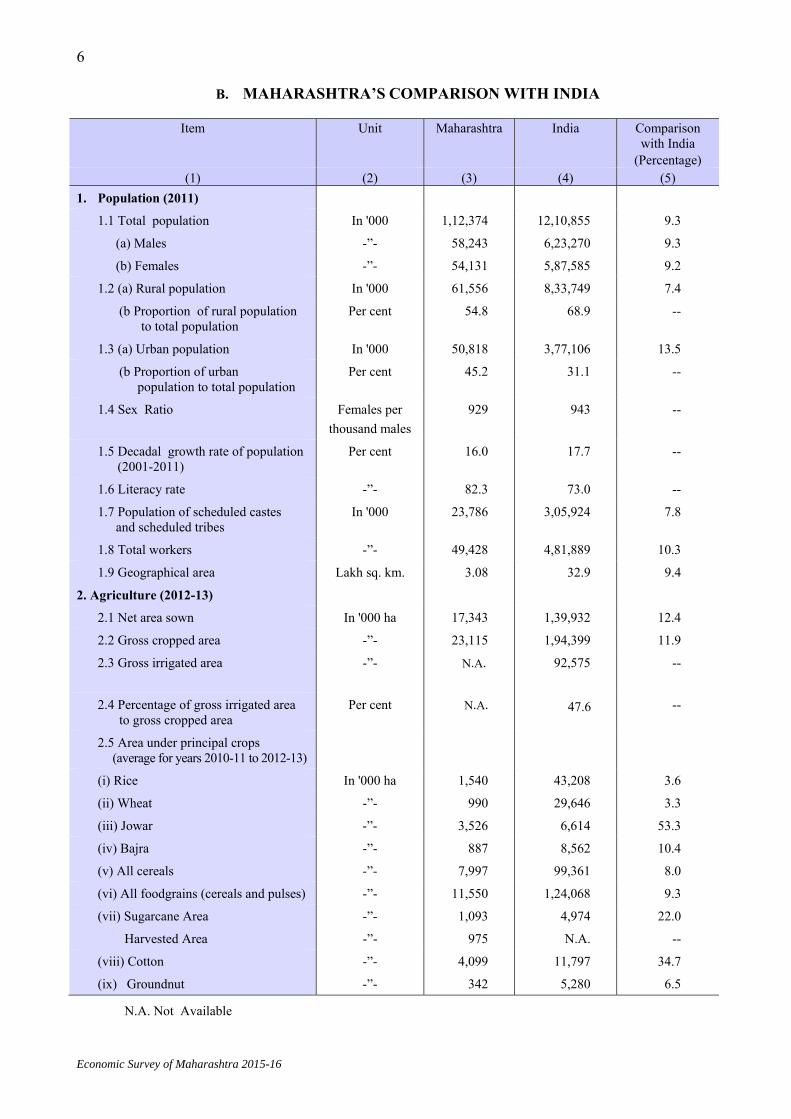
1. Population (2011)
1.1 Total population In '000 1,12,374 12,10,855 9.3
(a) Males -”- 58,243 6,23,270 9.3
(b) Females -”- 54,131 5,87,585 9.2
1.2 (a) Rural population In '000 61,556 8,33,749 7.4
(b Proportion of rural population to total population
Per cent 54.8 68.9 --
1.3 (a) Urban population In '000 50,818 3,77,106 13.5
(b Proportion of urban population to total population
Per cent 45.2 31.1 --
1.4 Sex Ratio Females per thousand males
929 943 --
1.5 Decadal growth rate of population (2001-2011)
Per cent 16.0 17.7 --
1.6 Literacy rate -”- 82.3 73.0 --
1.7 Population of scheduled castes and scheduled tribes
In '000 23,786 3,05,924 7.8
1.8 Total workers -”- 49,428 4,81,889 10.3
1.9 Geographical area Lakh sq. km. 3.08 32.9 9.4
2. Agriculture (2012-13)
2.1 Net area sown In '000 ha 17,343 1,39,932 12.4
2.2 Gross cropped area -”- 23,115 1,94,399 11.9
2.3 Gross irrigated area -”- N.A. 92,575
--
2.4 Percentage of gross irrigated area to gross cropped area
Per cent N.A. 47.6 --
2.5 Area under principal crops (average for years 2010-11 to 2012-13)
(i) Rice In '000 ha 1,540 43,208 3.6
(ii) Wheat -”- 990 29,646 3.3
(iii) Jowar -”- 3,526 6,614 53.3
(iv) Bajra -”- 887 8,562 10.4
(v) All cereals -”- 7,997 99,361 8.0
(vi) All foodgrains (cereals and pulses) -”- 11,550 1,24,068 9.3
(vii) Sugarcane Area -”- 1,093 4,974 22.0
Harvested Area -”- 975 N.A. --
(viii) Cotton -”- 4,099 11,797 34.7
(ix) Groundnut -”- 342 5,280 6.5
N.A. Not Available

Economic Survey of Maharashtra 2015-16
7
MAHARASHTRA’S COMPARISON WITH INDIA--- contd.
Item Unit Maharashtra India Comparison with India
(Percentage) (1) (2) (3) (4) (5)
3. Livestock census 3.1 Total livestock (2012) In '000 32,489 5,12,057 6.3 3.2 Wheel Tractors (2003) -”- 106 2,361 4.5
3.3 Diesel engines & Electric pumps for irrigation (2003)
-”- 1,174 15,684 7.5
4. Forests 4.1 Total forest area (2015) Sq.km. 61,573 7,64,566 8.1
5. Industry 5.1 Industrial Investment$ (a) Projects approved Number 19,053 1,05,900 18.0 (b) Proposed investment ` crore 10,97,337 1,09,73,794 10.0
6. Electricity (2013-14)
6.1 Total generation Million kwh. 91,987 10,26,649 9.0 6.2 Total consumption^ -”- 1,02,989 7,62,084 13.5 6.3 (a) Industrial consumption^ -”- 38,949 2,65,875 14.6 (b) Percentage of industrial consumption to total consumption
Per cent 37.8 34.9 --
7. Banking (Scheduled commercial) (March, 2015)
7.1 Banking offices Number 11,284 1,25,863 9.0
7.2 Towns and Villages having banking offices (March, 2014)
-”- 2,966 42,864 6.9
8. State / National Income (2014-15)
8.1 Income at current prices ` crore 15,72,037+ 1,10,07,592+ 14.3
8.2 Per capita income at current prices ` 1,34,081+ 86,879+ --
8.3 Gross State Domestic Product (GSDP) at market prices / Gross Domestic Product (GDP) at market prices
` crore 17,92,122+ 1,24,88,205+ 14.4
8.4 Per capita GSDP/ GDP ` 1,52,853+ 98,565+ --
$ From August, 1991 to October, 2015 + First revised estimates ^ Total Electricity Consumption and Industrial Consumption figures for India are calculated using per capita consumption from Central Electricity Authority and calibrated projected mid-year population provided by Central Statistics Office.

1State Economy

Economic Survey of Maharashtra 2015-16
1. STATE ECONOMY
State Income 1.1 Decline in agricultural output for two consecutive years has adversely affected rural economy which is highly dependent on agriculture. However, better performance of Services & Industry sectors has contributed to growth in State economy. At this backdrop, advance estimates of Gross State Domestic Product (GSDP) at constant (2011-12) prices maintained fairly decent growth of 8.0 per cent over the previous year. 1.2 As per advance estimates, GSDP for 2015-16 at constant (2011-12) prices is expected to be ` 16,47,045 crore. The ‘Agriculture & Allied activities’ sector is expected to decline by 2.7 per cent while, ‘Industry’ and ‘Services’ sectors are expected to grow at 5.9 per cent and 10.8 per cent respectively over the previous year. 1.3 As per the first revised estimates, GSDP at constant (2011-12) prices is ` 15,24,846 crore during 2014-15, as against ` 14,41,843 crore in 2013-14, showing an increase of 5.8 per cent. GSDP at current prices during 2014-15 is ` 17,92,122 crore. 1.4 Net State Domestic Product (State Income), as per the first revised estimates, is ` 15,72,037 crore and Per Capita State Income is ` 1,34,081 during 2014-15.
Prices 1.5 Average Consumer Price Index (CPI) for rural and urban areas in the State from April to December, 2015 was 257.2 and 246.7 respectively. It increased by 2.7 per cent and three per cent respectively over the corresponding period of the previous year. 1.6 The year-on-year rate of inflation based on CPI for rural areas decreased from 4.8 per cent in April, 2015 to 2.6 per cent in December, 2015 whereas, for urban areas it decreased from 4.7 per cent to 3.5 per cent. The rate of inflation for the same period for ‘Food’ group increased from 5.7 per cent to 5.9 per cent for rural areas while, it increased from 6.2 per cent to 7.3 per cent for urban areas. 1.7 The year-on-year rate of inflation based on Wholesale Price Index(WPI) at All-India increased from (-)2.4 per cent in April, 2015 to (-)0.7 per cent in December, 2015. It remained negative for 14 months in a row. For ‘Food’ sub-group in ‘Primary Articles’ group, it increased from 5.9 per cent to 8.2 per cent during the same period.
Public Finance 1.8 The expected revenue receipts of the State Government are ` 1,98,231 crore for 2015-16(BE) as against ` 1,80,794 crore during 2014-15(RE). The expected tax and non-tax revenue for 2015-16(BE) are ` 1,59,697 crore and ` 38,534 crore respectively. Actual revenue receipts during April to December, 2015 were ` 1,26,457 crore (63.8 per cent of BE). This showed increase of 10.3 per cent over same period of the previous year. 1.9 Revenue expenditure of the State Government is ` 2,01,988 crore in 2015-16(BE) as against ` 1,94,677 crore during 2014-15(RE). 1.10 As per budget estimates in 2015-16, revenue deficit is ` 3,757 crore, fiscal deficit is ` 30,733 crore and debt stock is ` 3,33,160 crore. The percentage of fiscal deficit to GSDP is 1.56 and debt stock to GSDP is 16.92 in 2015-16(BE), which is well within the limits stipulated by the 14th Finance Commission under ‘Consolidated Fiscal Reform Path’.

Economic Survey of Maharashtra 2015-16
10
Institutional Finance 1.11 As on 31st March, 2015, aggregate bank deposits and gross credit of Scheduled Commercial Banks in the State were ` 21.34 lakh crore and ` 19.76 lakh crore respectively. Credit-Deposit (CD) ratio was 92.6 per cent. 1.12 As on 31st March, 2015, total savings of 7.2 lakh Self Help Groups (SHGs) was ` 903.8 crore. The total loan of ` 1,532.8 crore was outstanding from about two lakh SHGs. 1.13 The Pradhan Mantri Jan-Dhan Yojana (PMJDY) launched on 28th August, 2014 is a national mission to bring about comprehensive financial inclusion of all households. Upto 3rd February, 2016, about 1.35 crore bank accounts were opened in the State with deposits of ` 1,863.06 crore and 1.14 crore ‘RuPay cards’ were issued.
Agriculture and allied activities 1.14 Total rainfall in the State during 2015 was deficient i.e. 59.4 per cent of the normal rainfall. Out of 355 talukas (excluding talukas in Mumbai City & Mumbai suburban districts) in the State, 278 talukas received deficient, 75 talukas received normal and two talukas received excess rainfall. 1.15 During kharif season of 2015, sowing was completed on 141.46 lakh ha, which was six per cent less than the previous year (150.97 lakh ha). This and deficient rains resulted in expected decline of 18 per cent in production of total foodgrains and marginal decline of two per cent in oilseeds production for kharif crops. 1.16 Due to deficient rains in kharif season 2015, area under rabi crops is expected to decrease by 16 per cent as compared to the previous year resulting in expected decline of 27 and 50 per cent in total foodgrains and oilseeds production respectively. 1.17 For two consecutive years 2014 and 2015 the State received deficient rainfall of 70.2 per cent and 59.4 per cent respectively of the normal rainfall. Live storage of water reservoir as on 15th October was 72.5 per cent in 2014 and 61.4 per cent in 2015 of its respective total capacity. This has posed challenges to meet water requirement not only for agriculture sector but also for drinking purposes. 1.18 The ‘Jalyukta Shivar Abhiyan’ launched by the State primarily aims at making Maharashtra ‘a drought-free state by 2019’. It involves deepening and widening of streams, construction of cement and earthen stop dams, works on nullahs and digging of farm ponds. The target is to make 5,000 villages free of water scarcity every year. 1.19 During 2014-15 and 2015-16, in all 6,205 villages from 34 districts have been selected to free them from water scarcity and 1,30,761 works of water conservation in the selected villages have been completed, whereas 34,989 works are under progress by the end of October, 2015. 1.20 During 2014-15, Commercial banks disbursed crop loan of ` 17,986.56 crore, Regional Rural Banks disbursed ` 1,690.53 crore and Maharashtra State Co-operative Bank, District Central Co-operative Banks and Land Development Banks together disbursed ` 14,423.30 crore. These banks together also disbursed agricultural term loans of ` 23,191.61 crore. During 2014-15, Primary Agricultural Credit Co-operative Societies disbursed loans of ` 14,030 crore to farmers, of which, loans of ` 6,388 crore were disbursed to small and marginal farmers. 1.21 During 2015-16, upto December, average daily collection of milk by the government and co-operative dairies was 50.52 lakh litres which was 45.45 lakh litres during 2014-15. The total milk production was 9.5 million MT during 2014-15. 1.22 During 2015-16, upto December, marine and inland fish production (provisional) was 3.40 lakh MT and 1.25 lakh MT respectively. During 2014-15, it was 4.64 lakh MT and 1.44 lakh MT respectively.

Economic Survey of Maharashtra 2015-16
11
Industry 1.23 During ‘Make in India’ event, 2,594 MoUs have been signed with proposed investment of ` 7,94,057 crore and expected employment of 30.9 lakh by the State.
1.24 Since August, 1991 to October, 2015 in all 19,053 industrial proposals with proposed investment of ` 10,97,337 crore were approved. Of these, 8,497 projects (44.6 per cent) with proposed investment of ` 2,62,631 crore (23.9 per cent) were commissioned.
1.25 Upto September, 2015 in all about 2.44 lakh micro, small and medium enterprises (MSMEs) were functioning in the State with investment of ` 56,552 crore and 29.2 lakh employment.
1.26 As per the provisional results of Annual Survey of Industries 2013-14 released by GoI, the State is at the top position in terms of gross value added.
1.27 As per Sixth Economic Census, total no. of establishments in the State is 61.3 lakh and employment therein is 145.1 lakh.
Co-operation 1.28 As on 31st March, 2015 there were about 2.26 lakh co-operative societies, with about 5.39 crore members therein. Of these, nine per cent were in agricultural credit, 10 per cent were in non-agricultural credit and 81 per cent were engaged in other activities. In all 24 per cent co-operative societies were in loss, of which, 21.8 per cent were in agricultural credit.
Energy 1.29 Installed capacity of electricity was 32,706 MW as on 31st December, 2015. Generation of electricity was 84,558 Million Units (MU) upto December, 2015, which was 8.1 per cent higher than corresponding period of the previous year. The per capita ultimate consumption of electricity in industrial, domestic and agriculture sectors for the year 2014-15 increased by 5.3 per cent, 6.1 per cent and 20.1 per cent respectively resulting in increase of 8.3 per cent for all sectors as compared to previous year.
1.30 Under Domestic Efficient Lighting Programme, annual savings of 750 MUs is expected through replacement of CFL and incandescent lamps by LEDs and upto 15th February, 2016, about 92 lakh LEDs are distributed to domestic consumers.
1.31 During 2014-15, transmission losses of MAHATRANSCO, distribution losses and Aggregate Technical & Commercial (AT & C) losses of MAHADISCOM were 3.89 per cent, 14.17 per cent and 18.71 per cent respectively. Corresponding losses during 2013-14 were 4.08 per cent, 14.0 per cent and 17.68 per cent respectively.
Transport 1.32 At the end of March, 2015, the total road length maintained by PWD and ZP was about 2.99 lakh km. About 99 per cent villages were connected by all-weather roads or fair weather roads.
1.33 The total number of vehicles on road in the State as on 1st January, 2016 was 271 lakh (23,009 vehicles per lakh population and 90 vehicles per km road length). The total number of accidents and persons killed during 2015 were 63,805 and 13,212 respectively.
1.34 During 2014-15, total cargo traffic handled by major and non-major ports was 1,528.19 lakh MT, of which, share of Mumbai Port Trust and Jawaharlal Nehru Port Trust was 40.3 per cent and 41.7 per cent respectively.

Economic Survey of Maharashtra 2015-16
12
1.35 During 2014-15, domestic and international cargo handled by airports in the State was 2.42 lakh MT and 4.87 lakh MT respectively. The passenger traffic during 2014-15 from domestic and international airports was 312.1 lakh and 113.7 lakh respectively. Social sector 1.36 As per Population Census 2011, the total population of the State is 11.24 crore, of which, female population is 48.2 per cent. The percentage of urban population is 45.2. The decadal growth of the population is about 16 per cent, less by 6.7 percentage points than that of the previous decade. 1.37 Sex ratio in the State is 929, which is 894 for age group 0-6 years as compared to 943 and 919 respectively for All-India level. The literacy rate in the State is 82.3 per cent, which is 79.7 per cent and 65.7 per cent for SC and ST respectively. At All-India level these rates are 73 per cent, 66.1 per cent and 59 per cent respectively. 1.38 Religionwise data revealed that proportions of population belonging to Hindu, Muslim, Christian, Sikh, Buddhist and Jain religions are 79.8 per cent, 11.5 per cent, one per cent, 0.2 per cent, 5.8 per cent and 1.2 per cent respectively. At All-India level these proportions are 79.8 per cent, 14.2 per cent, 2.3 per cent, 1.7 per cent, 0.7 per cent and 0.4 per cent respectively. 1.39 During 2015-16, number of primary schools (class I to VIII) is about 1.05 lakh with enrolment of about 1.60 crore as against same no. of schools with enrolment of 1.62 crore in 2014-15. During 2015-16, number of secondary & higher secondary schools (class IX to XII) is about 25,000 with enrolment of about 64.14 lakh as against 24,497 schools with enrolment of 61.81 lakh in 2014-15. 1.40 During 2014-15, the proportion of schools having drinking water facilities was 99.6 per cent, girls’ toilet (functional) 98.6 per cent and computers 54.3 per cent. 1.41 Birth rate, infant mortality rate and death rate are 16.5, 24 and 6.2 respectively in 2013. The corresponding figures were 16.6, 25 and 6.3 respectively in 2012. Maternal mortality ratio during 2011-2013 is 68. 1.42 According to ‘Maharashtra Human Development Report (MHDR) 2012’, HDI of the State is 0.752. Greater Mumbai has the highest HDI (0.841) whereas, Nandurbar district has the lowest HDI (0.604). Of the total districts in the State, HDIs of 27 districts were lower than that of the State HDI.
* * * * *

2Population

Economic Survey of Maharashtra 2015-16
2. POPULATION
Composition of the State Population 2.1 According to Census 2011 data, population of the State is 11.24 crore which constitutes 9.3 per cent population of the country and it ranks second after Uttar Pradesh in terms of population. The proportion of urban population is 45.2 per cent in 2011 as against 42.4 per cent in 2001. About 63 per cent of the State population belongs to working age group (15-59 years).
Religion 2.2 Office of the Registrar General of India (ORGI) has recently published religionwise population data, according to which, population Decadal Growth Rate (DGR) has decreased for all religions resulting in overall decline of 6.7 percentage points in DGR of population. Districtwise proportion of population and literacy rates classified by religions is shown in Annexure 2.4 and 2.5 respectively.
2.3 State has observed overall improvement of seven points in sex ratio from 922 in 2001 to 929 in 2011. Sex ratio in rural areas of the State has decreased from 960 in 2001 to 952 in 2011 whereas, it has increased in urban areas from 873 to 903 during the same period. Christian population has the highest sex ratio (1031) in 2011 whereas, Sikh population has the lowest (891). Table 2.1 Religionwise characteristics of population, 2011
Major religions Sector Proportion of population
Literacy Rate Sex Ratio#
State India State India State India Hindu Total 79.8 79.8 81.8 73.3 928 939
Rural 48.0 56.5 76.7 68.1 951 947 Urban 31.8 23.3 89.3 85.3 894 921
Muslim Total 11.5 14.2 83.6 68.5 911 951 Rural 3.1 8.5 79.1 63.0 959 958 Urban 8.4 5.7 85.2 76.5 893 942
Christian Total 1.0 2.3 92.3 84.5 1,031 1,023 Rural 0.1 1.4 83.0 78.7 982 1,008 Urban 0.9 0.9 93.3 92.9 1,037 1,046
Sikh Total 0.2 1.7 90.9 75.4 891 903 Rural 0.0 1.2 79.6 70.9 891 905 Urban 0.2 0.5 92.3 86.5 891 898
Buddhist Total 5.8 0.7 83.2 81.3 970 965 Rural 3.0 0.4 79.1 76.7 963 960 Urban 2.8 0.3 87.5 87.3 978 973
Jain Total 1.2 0.4 95.3 94.9 964 954 Rural 0.2 0.1 91.3 88.6 922 935 Urban 1.0 0.3 96.3 96.5 974 959
Source: ORGI # No. of females per thousand males

Economic Survey of Maharashtra 2015-16
14
Graph 2.3 : Proportion of non- by education levels
workers in the State seeking/available for work classified
0
5
10
15
20
25
30
35
I II III IV V VI VIIEducation level
Per
cent
2001 2011
1.3
7.2
13.8
28.6
21.5
25.8
1.2
6.5
3.3
10.1
20.2
15.7
23.2
4.0
I IlliterateII LiterateIII but below Matric/secondaryIV Matric/secondary but below graduateV Technical diploma/certification but not equal to degreeVI Graduate and above other than technical degreeVII Technical degree/diploma equal to degree/post-graduate degree
Literate
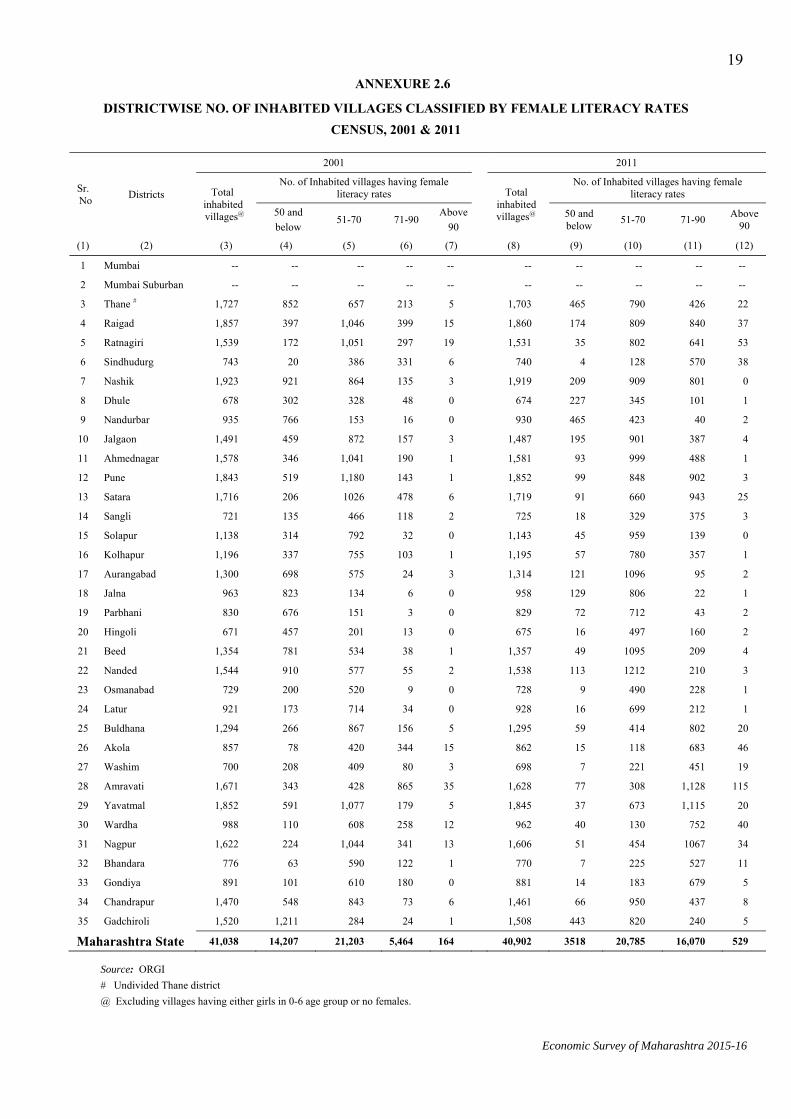
Literacy rate 2.4 Adult literacy rate of the State has increased to 82.3 per cent in 2011 from 76.9 per cent in 2001. Districtwise no. of villages classified as per the female literacy rates for 2001 and 2011 are given Annexure 2.6.
Work participation 2.5 There are 4.94 crore persons reported to be engaged in economic activities in 2011, among which 4.37 crore are main workers and 0.57 crore are marginal workers. Proportion of non-workers to the total population in the State has marginally decreased from 57.5 per cent to 56 per cent during the decade. 2.6 Population census also provides information regarding non-workers who are seeking / available for work, according to which, there are 30 lakh persons who were recorded as seeking / available for work in the State in 2011 as against 27.8 lakh in 2001.
Age at marriage 2.7 Legal age for marriage is 18 years for girls and 21 years for boys. There are 4.8 lakh females and 6.1 lakh males in 2011 in the State as against two lakh females and 2.9 lakh males in 2001 reported as currently married below legal age of marriage.
* * * * *

Economic Survey of Maharashtra 2015-16
15ANNEXURE 2.1
POPULATION OF MAHARASHTRA AND INDIA AS PER CENSUSES
Year Population (in crore) Decennial Growth Rate (per cent) Literacy Rate (per cent) ££
Maharashtra India Maharashtra India Maharashtra India
(1) (2) (3) (4) (5) (6) (7)
1961 … 3.96 43.92 23.60 21.51 35.1 28.3
1971 … 5.04 54.82 27.45 24.80 45.8 34.5
1981 … 6.28 68.52 24.54 25.00 55.8 43.7 §
1991 … 7.89 84.63£ 25.73 23.85£ 64.9 52.2@@
2001 … 9.69 102.86 22.73 21.54 76.9 64.8
2011 … 11.24 121.09 16.0 17.7 82.3 73.0
Source : ORGI £ Including projected population of Jammu & Kashmir. ££ Literacy rates for 1961 and 1971 relate to population aged 5 years and above. The literacy rates for the years 1981, 1991, 2001 and 2011 relate to population aged 7 years and above. § Literacy rate excludes Assam and Jammu & Kashmir. @@ Literacy rate excludes Jammu & Kashmir.
ANNEXURE 2.2
RURAL AND URBAN POPULATION IN MAHARASHTRA BASED ON CENSUSES
Year
Population (in crore) Percentage of urban
population to total
population
Sex Ratio Population density
(per sq. km)
Rural Urban Total Males Females Total Rural Urban
(1) (2) (3) (4) (5) (6) (7) (8) (9) (10) (11)
1961 2.84 1.12 3.96 2.04 1.91 28.2 936 995 801 129
1971 3.47 1.57 5.04 2.61 2.43 31.2 930 985 820 164
1981 4.08 2.20 6.28 3.24 3.04 35.0 937 967 850 204
1991 4.84 3.05 7.89 4.08 3.81 38.7 934 972 875 257
2001 5.58 4.11 9.69 5.04 4.65 42.4 922 960 873 315
2011 6.16 5.08 11.24 5.82 5.41 45.2 929 952 903 365
Source - ORGI Note - Figures may not add up to totals due to rounding.

Economic Survey of Maharashtra 2015-16
16ANNEXURE 2.3
DISTRICTWISE POPULATION CHARACTERISTICS
CENSUS 2011
Sr. No. District
Population (’000) Decennial
Growth Rate
(per cent) (2001-2011)
Literacy Rate (per cent) Sex
Ratio
Child Sex ratio (0-6
years) Male Female Total Male Female Total
(1) (2) (3) (4) (5) (6) (7) (8) (9) (10) (11)
1 Mumbai City 1,685 1,401 3,085 (-) 7.6 91.5 86.5 89.2 832 914
2 Mumbai Suburban 5,031 4,326 9,357 8.3 92.9 86.4 89.9 860 913
3 Thane # 5,865 5,195 11,060 36.0 88.7 79.8 84.5 886 924
4 Raigad 1,344 1,290 2,634 19.3 89.1 76.9 83.1 959 935
5 Ratnagiri 761 854 1,615 (-) 4.8 90.9 74.5 82.2 1122 936
6 Sindhudurg 417 432 850 (-) 2.2 91.6 79.8 85.6 1036 922
7 Nashik 3,157 2,950 6,107 22.3 88.2 76.1 82.3 934 890
8 Dhule 1,054 997 2,051 20.1 79.5 65.8 72.8 946 898
9 Nandurbar 833 815 1,648 25.7 72.2 56.5 64.4 978 944
10 Jalgaon 2,197 2,033 4,230 14.9 85.4 70.6 78.2 925 842
11 Ahmednagar 2,343 2,200 4,543 12.4 86.8 70.9 79.1 939 852
12 Pune 4,924 4,505 9,429 30.4 90.8 81.1 86.2 915 883
13 Satara 1,511 1,493 3,004 6.9 89.4 76.3 82.9 988 895
14 Sangli 1,436 1,386 2,822 9.2 88.2 74.6 81.5 966 867
15 Solapur 2,228 2,090 4,318 12.2 85.0 68.5 77.0 938 883
16 Kolhapur 1,981 1,895 3,876 10.0 88.6 74.2 81.5 957 863
17 Aurangabad 1,924 1,777 3,701 27.8 87.4 70.1 79.0 923 858
18 Jalna 1,011 948 1,959 21.5 81.5 61.0 71.5 937 870
19 Parbhani 943 893 1,836 20.2 82.6 63.6 73.3 947 884
20 Hingoli 606 571 1,177 19.3 86.9 69.0 78.2 942 882
21 Beed 1,349 1,236 2,585 19.6 85.6 67.8 77.0 916 807
22 Nanded 1,730 1,631 3,361 16.9 84.3 66.2 75.5 943 910
23 Osmanabad 862 796 1,658 11.5 85.8 70.5 78.4 924 867
24 Latur 1,273 1,181 2,454 18.0 84.4 69.6 77.3 928 889
25 Buldhana 1,338 1,249 2,586 15.8 90.5 75.8 83.4 934 855
26 Akola 932 882 1,814 11.3 92.3 83.5 88.0 946 912
27 Washim 620 577 1,197 17.3 90.5 75.5 83.2 930 863
28 Amaravati 1,481 1,408 2,888 10.8 91.5 83.1 87.4 951 935
29 Yavatmal 1,420 1,352 2,772 12.8 89.4 75.9 82.8 952 922
30 Wardha 668 632 1,301 5.2 91.9 81.8 87.0 946 919
31 Nagpur 2,385 2,269 4,654 14.4 92.1 84.5 88.4 951 931
32 Bhandara 606 595 1,200 5.6 90.4 77.1 83.8 982 950
33 Gondia 662 661 1,323 10.1 92.0 77.9 85.0 999 956
34 Chandrapur 1,124 1,080 2,204 6.4 86.8 73.0 80.0 961 953
35 Gadchiroli 541 532 1,073 10.6 82.3 66.3 74.4 982 961
Maharashtra State 58,243 54,131 1,12,374 16.0 88.4 75.9 82.3 929 894
Source : ORGI
Note - Figures may not add up to totals due to rounding. # Undivided Thane district

Economic Survey of Maharashtra 2015-16
17ANNEXURE 2.4
RELIGIONWISE POPULATION
CENSUS 2011
Sr. No District
Population
Hindu Muslim Christian Sikh Buddhist Jain Other
religions and persuasions
Religion not stated
(1) (2) (3) (4) (5) (6) (7) (8) (9) (10)
1 Mumbai 18,73,762 7,73,173 84,555 13,471 1,34,257 1,66,000 31,094 9,099
2 Mumbai Suburban 63,37,132 17,95,788 3,22,476 47,288 4,69,568 3,43,639 18,345 22,726
3 Thane # 87,16,055 13,55,630 2,80,700 39,149 4,49,617 1,72,052 9,862 37,083
4 Raigad 22,39,370 2,27,465 17,452 7,477 1,21,791 12,260 1,159 7,226
5 Ratnagiri 13,07,211 1,87,197 1,990 230 1,13,467 3,347 95 1,532
6 Sindhudurg 7,80,384 26,264 15,471 219 24,762 1,046 53 1,452
7 Nashik 52,37,009 6,93,052 23,946 8,912 94,783 38,212 1,795 9,478
8 Dhule 18,25,460 1,87,901 3,653 1,422 13,405 12,818 912 5,291
9 Nandurbar 15,21,618 96,182 8,467 685 4,969 6,191 2,907 7,276
10 Jalgaon 34,57,615 5,60,261 7,091 3,091 1,43,865 27,404 9,662 20,928
11 Ahmednagar 41,07,143 3,20,743 22,766 5,431 33,898 38,718 1,408 13,052
12 Pune 80,90,254 6,73,704 1,34,192 27,090 3,40,404 1,27,786 9,873 26,105
13 Satara 26,91,952 1,46,970 4,408 1,182 1,41,315 12,810 676 4,428
14 Sangli 24,40,312 2,39,607 9,098 1,260 38,210 87,453 769 5,434
15 Solapur 37,95,424 4,41,254 9,882 1,279 35,497 28,134 568 5,718
16 Kolhapur 33,79,906 2,86,558 15,573 1,570 29,766 1,54,882 1,274 6,472
17 Aurangabad 25,45,438 7,86,677 15,991 5,142 3,09,093 30,981 1,005 6,955
18 Jalna 15,04,641 2,74,221 12,542 1,629 1,52,540 9,619 336 3,518
19 Parbhani 13,28,385 3,06,364 2,081 1,371 1,87,899 6,238 262 3,486
20 Hingoli 8,63,199 1,27,552 992 643 1,76,679 5,278 103 2,899
21 Beed 21,74,672 3,20,395 2,097 824 68,482 8,719 399 9,461
22 Nanded 25,01,741 4,71,951 3,902 13,540 3,54,189 5,049 1,273 9,647
23 Osmanabad 14,37,623 1,78,925 942 340 28,216 4,530 195 6,805
24 Latur 20,06,984 3,67,664 2,387 935 66,535 6,387 310 2,994
25 Buldana 18,45,424 3,54,236 3,531 1,668 3,64,229 12,242 522 4,406
26 Akola 11,07,809 3,57,253 4,483 1,504 3,28,033 10,205 389 4,230
27 Washim 8,59,949 1,42,672 1,707 518 1,79,330 8,476 381 4,127
28 Amravati 20,55,177 4,21,410 7,223 2,242 3,83,891 11,360 3,288 3,854
29 Yavatmal 22,51,401 2,39,236 4,567 1,596 2,49,874 11,422 3,745 10,507
30 Wardha 10,57,096 53,854 2,696 2,147 1,75,417 5,663 2,254 1,647
31 Nagpur 34,92,202 3,90,974 34,667 20,469 6,68,050 24,528 12,181 10,499
32 Bhandara 10,09,352 26,502 2,145 831 1,54,458 1,017 3,555 2,474
33 Gondiya 11,53,861 26,157 1,827 2,160 1,25,282 1,568 5,080 6,572
34 Chandrapur 17,80,085 92,297 10,701 5,251 2,86,734 3,861 23,188 2,190
35 Gadchiroli 9,27,411 21,063 3,872 681 82,695 454 30,047 6,719
Maharashtra State 8,97,03,057 1,29,71,152 10,80,073 2,23,247 65,31,200 14,00,349 1,78,965 2,86,290
Source : ORGI # Undivided Thane district

Economic Survey of Maharashtra 2015-16
18ANNEXURE 2.5
RELIGIONWISE LITERACY RATE
CENSUS, 2011
Sr. No District
Literacy rate (per cent)
Total Hindu Muslim Christian Sikh Buddhist Jain
Other religions
and persuasions
Religion not
stated
(1) (2) (3) (4) (5) (6) (7) (8) (9) (10) (11)
1 Mumbai 89.2 90.0 85.0 93.0 94.1 89.4 96.2 95.9 87.0
2 Mumbai Suburban 89.9 90.8 85.2 94.0 94.9 87.0 97.1 89.6 83.3
3 Thane # 84.5 84.1 83.4 92.2 91.7 86.8 95.4 85.8 84.1
4 Raigad 83.1 82.1 90.2 94.1 92.8 85.4 95.7 85.8 82.5
5 Ratnagiri 82.2 80.9 91.2 90.4 91.9 81.5 95.0 88.8 80.1
6 Sindhudurg 85.6 85.6 86.1 88.1 86.6 82.5 90.6 88.5 86.8
7 Nashik 82.3 81.4 87.3 92.9 90.5 85.0 97.4 88.5 82.3
8 Dhule 72.8 71.5 83.5 76.2 81.3 79.0 95.4 49.3 72.4
9 Nandurbar 64.4 62.7 87.1 73.2 67.4 80.7 96.2 55.6 57.4
10 Jalgaon 78.2 78.4 77.1 86.4 82.0 75.6 94.7 65.0 68.7
11 Ahmednagar 79.1 78.5 82.5 92.2 89.7 79.4 96.5 85.5 82.0
12 Pune 86.2 85.9 86.1 94.1 92.5 84.9 96.1 90.2 84.6
13 Satara 82.9 82.7 86.8 89.8 83.4 81.2 95.5 83.3 84.3
14 Sangli 81.5 80.8 84.7 91.1 84.8 80.9 91.8 82.4 80.8
15 Solapur 77.0 76.6 79.2 87.7 78.8 79.6 95.0 80.2 78.6
16 Kolhapur 81.5 80.7 85.6 89.0 78.8 81.5 91.6 78.8 83.1
17 Aurangabad 79.0 78.6 79.4 88.3 89.9 79.2 95.3 82.5 75.2
18 Jalna 71.5 71.3 73.6 77.6 60.2 68.5 90.2 83.4 75.9
19 Parbhani 73.3 73.2 74.6 78.5 63.6 71.5 92.1 86.9 74.7
20 Hingoli 78.2 78.0 80.5 78.2 80.0 76.8 94.7 86.4 76.1
21 Beed 77.0 76.4 80.7 80.4 69.0 77.2 95.6 84.5 77.9
22 Nanded 75.5 74.6 78.3 82.0 87.7 76.9 92.9 75.5 74.2
23 Osmanabad 78.4 78.2 79.9 81.4 81.9 78.3 92.5 73.1 78.2
24 Latur 77.3 77.5 75.9 81.7 69.4 75.6 90.6 83.7 76.1
25 Buldana 83.4 84.0 84.2 85.3 85.4 79.4 95.9 77.1 79.8
26 Akola 88.0 89.1 88.6 90.0 90.2 83.6 96.7 85.2 85.7
27 Washim 83.2 83.2 84.4 89.2 87.2 81.8 95.7 86.6 83.4
28 Amravati 87.4 87.4 89.1 91.4 85.0 85.3 96.1 79.4 83.2
29 Yavatmal 82.8 82.1 87.3 89.0 89.5 84.6 96.9 82.7 81.7
30 Wardha 87.0 86.7 89.5 92.2 78.9 87.8 98.5 82.4 82.2
31 Nagpur 88.4 87.8 89.6 94.4 92.8 89.9 96.7 79.6 85.4
32 Bhandara 83.8 83.3 90.9 87.6 84.8 85.7 91.1 83.8 83.5
33 Gondiya 85.0 84.5 89.7 88.1 92.9 87.9 95.0 81.1 85.7
34 Chandrapur 80.0 79.1 85.8 88.4 85.8 84.0 94.5 72.7 79.1
35 Gadchiroli 74.4 73.5 87.3 74.2 85.4 83.1 92.5 67.5 71.5
Maharashtra State 82.3 81.8 83.6 92.3 90.9 83.2 95.3 81.0 80.1
Source: ORGI # Undivided Thane district
Economic Survey of Maharashtra 2015-16
19ANNEXURE 2.6
DISTRICTWISE NO. OF INHABITED VILLAGES CLASSIFIED BY FEMALE LITERACY RATES
CENSUS, 2001 & 2011
Sr. No Districts
2001 2011
Total inhabited villages@
No. of Inhabited villages having female literacy rates Total
inhabited villages@
No. of Inhabited villages having female literacy rates
50 and below
51-70 71-90 Above
90 50 and
below 51-70 71-90 Above 90
(1) (2) (3) (4) (5) (6) (7) (8) (9) (10) (11) (12)
1 Mumbai -- -- -- -- -- -- -- -- -- --
2 Mumbai Suburban -- -- -- -- -- -- -- -- -- --
3 Thane # 1,727 852 657 213 5 1,703 465 790 426 22
4 Raigad 1,857 397 1,046 399 15 1,860 174 809 840 37
5 Ratnagiri 1,539 172 1,051 297 19 1,531 35 802 641 53
6 Sindhudurg 743 20 386 331 6 740 4 128 570 38
7 Nashik 1,923 921 864 135 3 1,919 209 909 801 0
8 Dhule 678 302 328 48 0 674 227 345 101 1
9 Nandurbar 935 766 153 16 0 930 465 423 40 2
10 Jalgaon 1,491 459 872 157 3 1,487 195 901 387 4
11 Ahmednagar 1,578 346 1,041 190 1 1,581 93 999 488 1
12 Pune 1,843 519 1,180 143 1 1,852 99 848 902 3
13 Satara 1,716 206 1026 478 6 1,719 91 660 943 25
14 Sangli 721 135 466 118 2 725 18 329 375 3
15 Solapur 1,138 314 792 32 0 1,143 45 959 139 0
16 Kolhapur 1,196 337 755 103 1 1,195 57 780 357 1
17 Aurangabad 1,300 698 575 24 3 1,314 121 1096 95 2
18 Jalna 963 823 134 6 0 958 129 806 22 1
19 Parbhani 830 676 151 3 0 829 72 712 43 2
20 Hingoli 671 457 201 13 0 675 16 497 160 2
21 Beed 1,354 781 534 38 1 1,357 49 1095 209 4
22 Nanded 1,544 910 577 55 2 1,538 113 1212 210 3
23 Osmanabad 729 200 520 9 0 728 9 490 228 1
24 Latur 921 173 714 34 0 928 16 699 212 1
25 Buldhana 1,294 266 867 156 5 1,295 59 414 802 20
26 Akola 857 78 420 344 15 862 15 118 683 46
27 Washim 700 208 409 80 3 698 7 221 451 19
28 Amravati 1,671 343 428 865 35 1,628 77 308 1,128 115
29 Yavatmal 1,852 591 1,077 179 5 1,845 37 673 1,115 20
30 Wardha 988 110 608 258 12 962 40 130 752 40
31 Nagpur 1,622 224 1,044 341 13 1,606 51 454 1067 34
32 Bhandara 776 63 590 122 1 770 7 225 527 11
33 Gondiya 891 101 610 180 0 881 14 183 679 5
34 Chandrapur 1,470 548 843 73 6 1,461 66 950 437 8
35 Gadchiroli 1,520 1,211 284 24 1 1,508 443 820 240 5
Maharashtra State 41,038 14,207 21,203 5,464 164 40,902 3518 20,785 16,070 529
Source: ORGI # Undivided Thane district @ Excluding villages having either girls in 0-6 age group or no females.

3State Income

Economic Survey of Maharashtra 2015-16
3. STATE INCOME
3.1 The State has always been a major contributor to the national economy. As the agricultural economy is largely governed by monsoon, growth in this sector has plummeted this year. However, Industry and Services sectors have managed to drive the State economy to a fairly decent growth this year. 3.2 The Central Statistics Office (CSO), Ministry of Statistics and Programme Implementation, GoI revises the base year of the national accounts periodically to account for the structural changes in the economy. CSO has revised the base year of the national accounts from 2004-05 to 2011-12, revised the methodology of compilation and included new & recent data sources. As is the practice internationally, sector-wise estimates are being presented as ‘Gross Value Added (GVA) at basic prices’, while, Gross Domestic Product(GDP) is being referred to as ‘GDP at market prices’. Accordingly, Gross State Domestic Product(GSDP) is being referred to as ‘GSDP at market prices’. The improvements in the methodology for estimation and inclusion of new & revised data have notable effects on the estimates.
State Economy Forecast (2015-16) 3.3 The advance estimates of the Real Gross State Domestic Product (GSDP) i.e. ‘GSDP at constant (2011-12) market prices’ for 2015-16 is expected at ` 16,47,045 crore, with a growth of 8.0 per cent over 2014-15. The advance estimates of the Nominal GSDP i.e. ‘GSDP at current market prices’ is expected to be `19,69,184 crore. 3.3.1 Erratic rainfall with long dry spells in the monsoon season hampered the Crop sector plummeting the growth of its Real GSVA i.e. GVA at constant (2011-12) basic prices for the State, to about (-)5.3 per cent over the previous year. Overall, the growth of Real GSVA of ‘Agriculture & Allied Activities’ sector is expected to decline by 2.7 per cent over the previous year. The Real GSVA of Industry sector is expected to grow at 5.9 per cent over the previous year whereas, the Services sector is expected to grow at 10.8 per cent. Overall, the State economy is likely to grow at 8.0 per cent during 2015-16 over the previous year.
GSDP (2014-15) 3.4 First revised estimates of Nominal GSDP for 2014-15 are ` 17,92,122 crore. The Real GSDP is estimated at ` 15,24,846 crore resulting in expected growth of 5.8 per cent during 2014-15 over the previous year. 3.4.1 Deficit of monsoon and unseasonal rains had an adverse impact on the agricultural production during 2014-15. Production of foodgrains declined by nearly 24.9 per cent over the previous year. Production of cereals and pulses decreased by 18.7 per cent and 47.0 per cent respectively. Production of cotton and oilseeds dropped by nearly 59.5 per cent and 52.8 per cent respectively. Production of fruits and vegetables also decreased by nearly 15 per cent. However, there was increase of 19.0 per cent in the production of sugarcane. The Real GSVA of Crop sector, thereby, is expected to decline by 23.4 per cent. With negative growth of 3.0 per cent in ‘Forestry & Logging’ sector as well, growth in the Real GSVA of ‘Agriculture & Allied Activities’ sector is expected to be (-)16.0 per cent. 3.4.2 In the Industry sector, Real GSVA of ‘Mining & Quarrying’ is expected to increase by 22.6 per cent and that of Manufacturing is expected to increase by 4.6 per cent. Real GSVA of ‘Electricity, Gas, Water Supply & Other Utility Services’ is expected to grow at 18.7 per cent whereas, that of Construction sector is expected to grow at 1.2 per cent. During 2014-15, Real GSVA of Industry sector is expected to grow at 6.8 per cent over 2013-14.

22
Economic Survey of Maharashtra 2015-16
3.4.3 In the Services sector, Real GSVA of ‘Trade, Repairs, Hotels & Restaurants, Transport, Storage, Communication & Services related to Broadcasting’ sector is expected to grow at 9.0 per cent whereas, that of ‘Financial, Real Estate & Professional Services’ sector is expected to grow at 10.2 per cent. Thus, during 2014-15, Real GSVA of Services sector is expected to grow by 10.0 per cent over the previous year. Table 3.1 depicts sectoral annual growth rates of Real GSVA (at basic prices) and Real GSDP.
State Income (2014-15)
3.5 First revised estimates of Nominal State Income i.e. Net State Domestic Product (NSDP) at current market prices is estimated at ` 15,72,037 crore in 2014-15, as compared to ` 14,50,003 crore in 2013-14 showing an increase of 8.4 per cent. The Real State Income i.e. NSDP at constant (2011-12) market prices in 2014-15 is estimated at ` 13,29,308 crore, showing an increase of 5.3 per cent over previous year. Details of GSDP & NSDP are given in Annexure 3.1 to 3.4.
3.5.1 The Per Capita Net State Income (i.e. Per Capita NSDP) at current prices is estimated at ` 1,34,081 during 2014-15 as compared to ` 1,25,146 during 2013-14, depicting growth of 7.1 per cent over the previous year.
Table 3.1 Sectoral annual growth rates of Real GSVA (at basic prices) and Real GSDP (per cent)
Sector Growth rate
2012-13@ 2013-14@ 2014-15# 2015-16$ Agriculture and Allied Activities (-)1.9 12.6 (-)16.0 (-)2.7
i) Crops (-)3.6 19.6 (-)23.4 (-)5.3
ii) Livestock 3.8 1.1 4.1 4.0
iii) Forestry and Logging (-)1.8 (-)6.5 (-)3.0 (-)3.1 iv) Fishing and aquaculture 0.9 2.0 7.0 3.8
Industry 5.4 1.2 6.8 5.9 i) Mining & Quarrying 4.0 (-)20.2 22.6 2.4 ii) Manufacturing 8.4 5.7 4.6 6.2
iii) Electricity, Gas, Water supply & Other Utility Services 5.3 0.5 18.7 10.6
iv) Construction (-)2.8 2.4 1.2 5.3
Services 8.2 7.0 10.0 10.8 i) Trade, Repairs, Hotels & Restaurants, Transport, Storage, Communication & Services related to Broadcasting
9.6 2.2 9.0 10.6
ii) Financial, Real Estate & Professional Services 8.0 9.4 10.2 11.2 iii) Community & Personal Services 6.4 8.0 10.8 9.9
GSVA (at basic prices) 5.9 5.6 5.6 7.7
GSDP 6.6 6.2 5.8 8.0 @ Preliminary estimates # First revised estimates $ Advance estimates Note : GSDP = GSVA at basic prices + Taxes on products including import duties - subsidies on products Source : DES, GoM

23
Economic Survey of Maharashtra 2015-16
Sectoral share and growth in the current series 3.6 In the current series, i.e from 2011-12 to 2015-16, the GSVA of ‘Agriculture & Allied Activities’ sector has average share of 11.5 per cent in total GSVA for the State and its average growth at constant (2011-12) basic prices is (-)2.0 per cent. The average share of GSVA of Industry sector is 33.9 per cent and its average growth rate is 4.8 per cent. GSVA of Services sector, growing at 9.0 per cent on an average in this series, has an average share of 54.6 per cent in GSVA of the State economy.
3.6.1 At the sub sector level, Crop sector, growing at a pace of (-)3.2 per cent, has an average share of 7.6 per cent in total GSVA for the State. Manufacturing sector is growing at an average rate of 6.2 per cent with average contribution of about 21.3 per cent. With its average share of 9.9 per cent, ‘Trade, Repairs, Hotels & Restaurants’ is growing at an average rate of 7.1 per cent. ‘Communication & Services related to Broadcasting’ sector, though growing at highest pace amongst all the other sectors of the economy, contributes on an average 1.5 per cent in the State GSVA. ‘Financial services’ sector is growing at an average rate of 7.8 per cent and has its average share of 10.3 per cent. ‘Real Estate, Ownership of dwellings & Professional Services’ sector with average share of 18.5 per cent is growing at an average rate of 10.8 per cent over the period.
District Income
3.7 District Income is one of the important barometers to measure growth and trends in economic development. Estimates of District Domestic Product (DDP) are compiled by the ‘Income Originating Approach’ and therefore, have all the inherent limitations. Because of the paucity of data, use of proxy indicators and various limitations in estimation procedure, the DDP may be used only to have a broad judgment of income at district level. Due to unavailability of data as per the revised methodology, the estimates of DDP and subsequently Per Capita Net District Income have not been compiled for Base year 2011-12 series.
Indian Economy Forecast (2015-16)
3.8 Advance estimates for 2015-16 published by CSO, GoI reveal that the Real GDP or GDP at constant (2011-12) prices is likely to attain a level of ` 1,13,50,962 crore with a growth of 7.6 per cent, whereas the Nominal GDP or GDP at current prices, is expected at ` 1,35,67,192 crore. Real GVA of ‘Agriculture & Allied Activities’, Industry and Services sector is expected to grow by 1.1 per cent, 7.3 per cent and 9.2 per cent respectively.
GDP (2014-15)
3.9 The Nominal GDP, during 2014-15, is estimated at ` 1,24,88,205 crore whereas Real GDP is estimated at `1,05,52,151 crore. Real GVA of ‘Agriculture & Allied Activities’, Industry and Services sector is expected to grow by (-) 0.2 per cent, 5.9 per cent and 10.3 per cent respectively. The growth of the economy during 2014-15 is expected to be 7.2 per cent over the previous year. Table 3.2 gives sectoral annual growth rates of Real GVA (at basic prices) and Real GDP over the previous year.

24
Economic Survey of Maharashtra 2015-16
National Income 3.10 Nominal Net National Income (NNI) for 2014-15 is estimated at ` 1,10,07,592 crore with an increase of 10.8 per cent over the previous year. Real NNI for 2014-15 is estimated at ` 92,35,026 crore which is more by 7.2 per cent over the previous year. 3.10.1 The Per Capita Net National Income in 2014-15 is estimated at ` 86,879 as against ` 79,412 in 2013-14. Sectoral share and growth in the current series 3.11 The average share of ‘Agriculture & Allied Activities’ sector in GVA at basic prices is 17.9 per cent and it is growing at an average rate of 1.6 per cent. Share of Industry sector is 31.0 per cent, with average growth rate of 5.5 per cent. Services sector with largest share of 51.1 per cent has average growth rate of 8.9 per cent. Details of GDP & NDP are given in Annexure 3.5 & 3.6.
* * * * *
Table 3.2 Sectoral annual growth rates of Real GVA (at basic prices) and Real GDP (per cent)
Sector Growth rate 2012-13## 2013-14## 2014-15# 2015-16$
Agriculture and Allied Activities 1.5 4.2 (-)0.2 1.1 i) Crops 0.2 4.2 (-)3.2 -
ii) Livestock 5.2 5.6 7.3 -
iii) Forestry and Logging 0.3 (-)1.5 (-)1.0 - iv) Fishing and aquaculture 4.9 7.6 5.0 -
Industry 3.6 5.0 5.9 7.3 i) Mining & Quarrying (-)0.5 3.0 10.8 6.9 ii) Manufacturing 6.0 5.6 5.5 9.5
iii) Electricity, Gas, Water supply & Other Utility Services 2.8 4.7 8.0 5.9
iv) Construction 0.6 4.6 4.4 3.7
Services 8.1 7.8 10.3 9.2 i) Trade, Repairs, Hotels & Restaurants, Transport, Storage & Communication & Services related to Broadcasting
9.7 7.8 9.8 9.5
ii) Financial, Real Estate & Professional Services 9.5 10.1 10.6 10.3 iii) Community & Personal Services 4.1 4.5 10.7 6.9
GVA (at basic prices) 5.4 6.3 7.1 7.3 GDP 5.6 6.6 7.2 7.6 Source : CSO, GoI ## Second revised estimates # First revised estimates $ Advance estimates

Economic Survey of Maharashtra 2015-16
25ANNEXURE 3.1
GROSS STATE VALUE ADDED AT BASIC PRICES BY INDUSTRY OF ORIGIN &
GROSS STATE DOMESTIC PRODUCT AT MARKET PRICES AT CURRENT PRICES
(` crore) Sr. No. Industry 2011-12@ 2012-13@ 2013-14@ 2014-15+
(1) (2) (3) (4) (5) (6)
1 Crops 98,516 1,01,822 1,30,792 1,04,351
2 Livestock 28,557 32,826 34,999 39,728
3 Forestry and Logging 15,166 16,268 16,221 15,926
4 Fishing and aquaculture 2,939 3,516 3,852 4,751
5 Agriculture & Allied Activities 1,45,178 1,54,432 1,85,864 1,64,757
(Sub-Total - 1+2+3+4) (12.8) (12.0) (12.8) (10.4)
6 Mining and Quarrying 56,493 59,023 52,057 52,827
7 Primary Sector ( Sub-Total - 5+6) 2,01,671 2,13,456 2,37,921 2,17,584
8 Manufacturing 2,46,032 2,82,032 3,12,674 3,36,603
9 Electricity, Gas and Water Supply, Other Utility Services 26,173 28,524 40,287 43,347
10 Construction 78,630 81,869 88,671 94,502
11 Secondary Sector (Sub-Total – 8+9+ 10) 3,50,835 3,92,425 4,41,632 4,74,452
12 Industry 4,07,328 4,51,449 4,93,689 5,27,279
(Sub-Total - 6 + 11) (35.8) (35.2) (34.0) (33.4)
13 Trade, Repair, Hotels & Restaurants 1,05,609 1,27,792 1,38,261 1,58,391
14 Railways 5,988 6,491 6,862 7,979
15 Transport by means other than Railways 41,696 49,331 54,225 62,170
16 Storage 925 1,019 1,162 1,312
17 Communication and Services related to Broadcasting 15,892 18,012 21,463 25,511
18 Financial Services 1,17,836 1,29,091 1,49,940 1,61,433
19 Real estate, Ownership of dwellings & Professional Services. 1,90,870 2,24,570 2,61,667 3,07,181
20 Public Administration 39,070 43,374 47,639 54,270
21 Other services 66,625 78,318 91,994 1,08,064
22 Tertiary / Services Sector 5,84,510 6,77,998 7,73,213 8,86,311
(Sub-Total-13 to 21) (51.4) (52.8) (53.2) (56.2)
23 Gross State Value Added 11,37,016 12,83,879 14,52,765 15,78,347
(5+12+22) (100.0) (100.0) (100.0) (100.0)
24 Taxes on Product 1,62,085 1,98,304 2,30,056 2,53,948
25 Less Subsidies on Product 26,134 33,717 35,315 40,173
26 Gross State Domestic Product (23+24-25) 12,72,967 14,48,466 16,47,506 17,92,122
27 Per capita GSDP (`) 1,12,500 1,26,502 1,42,192 1,52,853
Source : Directorate of Economics and Statistics, GoM, Mumbai.
@ Preliminary + First Revised Estimates
Note - Figures in brackets show percentages to GSVA. Figures may not add up due to rounding.

Economic Survey of Maharashtra 2015-16
26ANNEXURE 3.2
GROSS STATE VALUE ADDED AT BASIC PRICES BY INDUSTRY OF ORIGIN &
GROSS STATE DOMESTIC PRODUCT AT MARKET PRICES AT CONSTANT (2011-12) PRICES
(` crore) Sr. No. Industry 2011-12@ 2012-13@ 2013-14@ 2014-15+
(1) (2) (3) (4) (5) (6)
1 Crops 98,516 94,985 1,13,566 86,937
2 Livestock 28,557 29,638 29,956 31,180
3 Forestry and Logging 15,166 14,895 13,922 13,507
4 Fishing and aquaculture 2,939 2,965 3,026 3,239
5 Agriculture & Allied Activities 1,45,178 1,42,483 1,60,470 1,34,863
(Sub-Total - 1+2+3+4) (100.0) (98.1) (110.5) (92.9)
6 Mining and Quarrying 56,493 58,781 46,901 57,506
7 Primary Sector ( Sub-Total - 5+6) 2,01,671 2,01,264 2,07,371 1,92,368
8 Manufacturing 2,46,032 2,66,679 2,81,801 2,94,720
9 Electricity, Gas and Water Supply, Other Utility Services 26,173 27,548 27,687 32,868
10 Construction 78,630 76,414 78,220 79,169
11 Secondary Sector (Sub-Total – 8+9+ 10) 3,50,835 3,70,641 3,87,708 4,06,757
12 Industry 4,07,328 4,29,422 4,34,609 4,64,263
(Sub-Total - 6 + 11) (100.0) (105.4) (106.7) (114.0)
13 Trade, Repair, Hotels & Restaurants 1,05,609 1,16,843 1,17,005 1,26,832
14 Railways 5,988 6,192 6,368 6,815
15 Transport by means other than Railways 41,696 45,868 47,639 51,620
16 Storage 925 940 1,012 1,094
17 Communication and Services related to Broadcasting 15,892 16,675 18,614 21,449
18 Financial Services 1,17,836 1,26,527 1,37,253 1,47,615
19 Real estate, Ownership of dwellings & Professional Services. 1,90,870 2,06,982 2,27,689 2,54,432
20 Public Administration 39,070 39,822 40,550 43,802
21 Other services 66,625 72,606 80,875 90,744
22 Tertiary / Services Sector 5,84,510 6,32,454 6,77,005 7,44,403
(Sub-Total-13 to 21) (100.0) (108.2) (115.8) (127.4)
23 Gross State Value Added 11,37,016 12,04,359 12,72,084 13,43,529
(5+12+22) (100.0) (105.9) (111.9) (118.2)
24 Taxes on Product 1,62,085 1,84,050 2,00,544 2,15,391
25 Less Subsidies on Product 26,134 31,293 30,785 34,074
26 Gross State Domestic Product (23+24-25) 12,72,967 13,57,116 14,41,843 15,24,846
27 Per capita GSDP (`) 1,12,500 1,18,524 1,24,442 1,30,056
Source : Directorate of Economics and Statistics, GoM, Mumbai.
@ Preliminary + First Revised Estimates
Note - Figures in brackets show percentages to col. (3) Figures may not add up due to rounding.

Economic Survey of Maharashtra 2015-16
27ANNEXURE 3.3
NET STATE VALUE ADDED AT BASIC PRICES BY INDUSTRY OF ORIGIN &
NET STATE DOMESTIC PRODUCT AT MARKET PRICES AT CURRENT PRICES
(`crore) Sr. No. Industry 2011-12@ 2012-13@ 2013-14@ 2014-15+
(1) (2) (3) (4) (5) (6)
1 Crops 92,739 95,234 1,23,229 98,318
2 Livestock 28,153 32,360 34,509 39,171
3 Forestry and Logging 14,999 16,102 16,043 15,751
4 Fishing and aquaculture 2,591 3,118 3,435 4,238
5 Agriculture & Allied Activities 1,38,483 1,46,813 1,77,216 1,57,477
(Sub-Total - 1+2+3+4) (14.1) (13.3) (14.1) (11.6)
6 Mining and Quarrying 49,674 51,861 44,917 45,581
7 Primary Sector ( Sub-Total - 5+6) 1,88,157 1,98,674 2,22,132 2,03,058
8 Manufacturing 2,06,804 2,36,158 2,63,897 2,84,093
9 Electricity, Gas and Water Supply, Other Utility Services 17,389 18,652 26,962 29,010
10 Construction 74,919 77,549 83,877 89,393
11 Secondary Sector (Sub-Total – 8+9+ 10) 2,99,112 3,32,358 3,74,736 4,02,496
12 Industry 3,48,786 3,84,219 4,19,653 4,48,077
(Sub-Total - 6 + 11) (35.5) (34.7) (33.4) (33.0)
13 Trade, Repair, Hotels & Restaurants 98,061 1,18,598 1,27,416 1,45,967
14 Railways 5,126 5,552 5,866 6,820
15 Transport by means other than Railways 35,801 42,580 47,137 54,044
16 Storage 792 882 986 1,114
17 Communication and Services related to Broadcasting 12,883 14,745 18,059 21,465
18 Financial Services 1,15,976 1,26,804 1,47,097 1,58,372
19 Real estate, Ownership of dwellings & Professional Services. 1,41,087 1,65,493 1,94,524 2,28,359
20 Public Administration 27,844 31,318 34,743 39,580
21 Other services 58,403 69,424 82,565 96,987
22 Tertiary / Services Sector 4,95,973 5,75,398 6,58,393 7,52,708
(Sub-Total-13 to 21) (50.4) (52.0) (52.5) (55.4)
23 Net State Value Added 9,83,241 11,06,430 12,55,262 13,58,262
(5+12+22) (100.0) (100.0) (100.0) (100.0)
24 Taxes on Product 1,62,085 1,98,304 2,30,056 2,53,948
25 Less Subsidies on Product 26,134 33,717 35,315 40,173
26 Net State Domestic Product (23+24-25) 11,19,192 12,71,017 14,50,003 15,72,037
27 Per capita NSDP (`) 98,910 1,11,005 1,25,146 1,34,081
Source : Directorate of Economics and Statistics, GoM, Mumbai.
@ Preliminary + First Revised Estimates
Note - Figures in brackets show percentages to NSVA. Figures may not add up due to rounding.

Economic Survey of Maharashtra 2015-16
28ANNEXURE 3.4
NET STATE VALUE ADDED AT BASIC PRICES BY INDUSTRY OF ORIGIN &
NET STATE DOMESTIC PRODUCT AT MARKET PRICES AT CONSTANT (2011-12) PRICES
(`crore) Sr. No. Industry 2011-12@ 2012-13@ 2013-14@ 2014-15+
(1) (2) (3) (4) (5) (6)
1 Crops 92,739 88,883 1,07,156 82,030
2 Livestock 28,153 29,206 29,523 30,729
3 Forestry and Logging 14,999 14,741 13,765 13,355
4 Fishing and aquaculture 2,591 2,590 2,660 2,848
5 Agriculture & Allied Activities 1,38,483 1,35,420 1,53,105 1,28,962
(Sub-Total - 1+2+3+4) (100.0) (97.8) (110.6) (93.1)
6 Mining and Quarrying 49,674 51,961 40,429 49,570
7 Primary Sector ( Sub-Total - 5+6) 1,88,157 1,87,382 1,93,534 1,78,532
8 Manufacturing 2,06,804 2,22,534 2,36,312 2,47,146
9 Electricity, Gas and Water Supply, Other Utility Services 17,389 18,032 15,229 18,079
10 Construction 74,919 72,293 73,768 74,662
11 Secondary Sector (Sub-Total – 8+9+ 10) 2,99,112 3,12,859 3,25,309 3,39,888
12 Industry 3,48,786 3,64,821 3,65,739 3,89,458
(Sub-Total - 6 + 11) (100.0) (104.6) (104.9) (111.7)
13 Trade, Repair, Hotels & Restaurants 98,061 1,08,180 1,07,181 1,16,183
14 Railways 5,126 5,311 5,475 5,859
15 Transport by means other than Railways 35,801 39,399 41,078 44,511
16 Storage 792 811 852 922
17 Communication and Services related to Broadcasting 12,883 13,484 15,336 17,672
18 Financial Services 1,15,976 1,24,310 1,34,540 1,44,697
19 Real estate, Ownership of dwellings & Professional Services. 1,41,087 1,52,025 1,68,152 1,87,902
20 Public Administration 27,844 28,237 28,543 30,832
21 Other services 58,403 64,129 72,185 80,994
22 Tertiary / Services Sector 4,95,973 5,35,887 5,73,342 6,29,571
(Sub-Total-13 to 21) (100.0) (108.1) (115.6) (127.0)
23 Net State Value Added 9,83,241 10,36,128 10,92,185 11,47,991
(5+12+22) (100.0) (105.4) (111.1) (116.8)
24 Taxes on Product 1,62,085 1,84,050 2,00,544 2,15,391
25 Less Subsidies on Product 26,134 31,293 30,785 34,074
26 Net State Domestic Product (23+24-25) 11,19,192 11,88,885 12,61,944 13,29,308
27 Per capita NSDP (`) 98,910 1,03,832 1,08,915 1,13,379
Source : Directorate of Economics and Statistics, GoM, Mumbai.
@ Preliminary + First Revised Estimates
Note - Figures in brackets show percentages to col. (3) Figures may not add up due to rounding.

Economic Survey of Maharashtra 2015-16
29
ANNEXURE 3.5
GROSS VALUE ADDED AT BASIC PRICES BY INDUSTRY OF ORIGIN, GROSS DOMESTIC PRODUCT AT MARKET PRICES & GROSS NATIONAL INCOME
AT CURRENT PRICES (`crore)
Sr. No. Industry 2011-12++ 2012-13++ 2013-14++ 2014-15+
(1) (2) (3) (4) (5) (6)
1 Crops 9,82,026 10,90,587 12,32,116 12,52,412
2 Livestock 3,27,301 3,75,254 4,29,662 5,00,405
3 Forestry and Logging 1,24,461 1,35,048 1,43,084 1,38,137
4 Fishing and aquaculture 68,027 79,908 97,590 1,04,297
5 Agriculture & Allied Activities 15,01,816 16,80,797 19,02,452 19,95,251
(Sub-Total - 1+2+3+4) (18.6) (18.3) (18.4) (17.4)
6 Mining & quarrying 2,61,035 2,85,780 2,95,978 3,04,300
7 Primary Sector ( Sub-Total - 5+6) 17,62,851 19,66,577 21,98,430 22,99,551
8 Manufacturing 14,09,986 15,73,632 17,14,730 18,45,541
9 Electricity, Gas ,Water supply & Other Utility Services 1,86,668 2,15,538 2,55,812 2,88,935
10 Construction 7,77,363 8,47,573 9,31,680 10,03,903
11 Secondary Sector (Sub-Total – 8+9+ 10) 23,74,017 26,36,743 29,02,222 31,38,379
12 Industry 26,35,052 29,22,523 31,98,200 34,42,679
(Sub-Total - 6 + 11) (32.5) (31.8) (30.8) (30.0)
13 Trade, Repair, Hotels & Restaurants 8,83,582 10,54,598 11,97,668 13,52,240
14 Railways 61,150 72,297 78,799 92,213
15 Transport by means other than Railways 3,37,347 3,88,058 4,26,423 4,80,547
16 Storage 5,108 6,165 6,164 7,409
17 Communication and Services related to Broadcasting 1,25,930 1,42,969 1,79,782 2,07,959
18 Financial services 4,80,226 5,36,819 6,02,214 6,50,360
19 Real estate, Ownership of dwelling & Professional Services 10,50,465 12,43,348 14,80,551 17,08,919
20 Public administration & Defence 4,91,155 5,44,637 6,09,657 7,08,535
21 Other Services 5,34,827 6,17,811 6,98,905 8,26,296
22 Tertiary / Services Sector 39,69,790 46,06,702 52,80,163 60,34,478
(Sub-Total-13 to 21) (49.0) (50.1) (50.9) (52.6)
23 Gross Value Added 81,06,656 92,10,023 1,03,80,813 1,14,72,409
(5+12+22) (100.0) (100.0) (100.0) (100.0)
24 Taxes on products including import duties 8,90,060 10,57,977 12,01,322 13,50,361
25 Less subsidies on products 2,60,677 3,16,656 3,09,371 3,34,565
26 Gross Domestic Product (23+24-25) 87,36,039 99,51,344 1,12,72,764 1,24,88,205
27 Primary income receivable from ROW (-)76,824 (-)1,16,763 (-)1,39,887 (-)1,47,433
28 Gross National Income (26+27) 86,59,215 98,34,581 1,11,32,877 1,23,40,772
29 Per Capita Gross National Income (`) 70,977 79,632 88,992 97,402
Source : Central Statistical Office, GoI
+ First revised estimates + + Second revised estimates
Note - Figures in brackets show percentages to GVA Figures may not add up due to rounding.

Economic Survey of Maharashtra 2015-16
30
ANNEXURE 3.6
GROSS VALUE ADDED AT BASIC PRICES BY INDUSTRY OF ORIGIN, GROSS DOMESTIC PRODUCT AT MARKET PRICES & GROSS NATIONAL INCOME
AT CONSTANT (2011-12) PRICES (` crore)
Sr. No. Industry 2011-12++ 2012-13++ 2013-14++ 2014-15+
(1) (2) (3) (4) (5) (6)
1 Crops 9,82,026 9,83,873 10,25,082 9,92,159
2 Livestock 3,27,301 3,44,333 3,63,448 3,89,846
3 Forestry and Logging 1,24,461 1,24,830 1,22,946 1,21,681
4 Fishing and aquaculture 68,027 71,362 76,760 80,607
5 Agriculture & Allied Activities 15,01,816 15,24,398 15,88,237 15,84,293
(Sub-Total - 1+2+3+4) (100.0) (101.5) (105.8) (105.5)
6 Mining & quarrying 2,61,035 2,59,683 2,67,378 2,96,328
7 Primary Sector ( Sub-Total - 5+6) 17,62,851 17,84,081 18,55,615 18,80,621
8 Manufacturing 14,09,986 14,95,268 15,79,721 16,67,069
9 Electricity, Gas ,Water supply & Other Utility Services 1,86,668 1,91,876 2,00,861 2,16,970
10 Construction 7,77,363 7,82,256 8,18,494 8,54,636
11 Secondary Sector (Sub-Total – 8+9+ 10) 23,74,017 24,69,400 25,99,076 27,38,675
12 Industry 26,35,052 27,29,083 28,66,454 30,35,003
(Sub-Total - 6 + 11) (100.0) (103.6) (108.8) (115.2)
13 Trade, Repair, Hotels & Restaurants 8,83,582 9,80,398 10,51,089 11,63,083
14 Railways 61,150 68,958 73,100 78,752
15 Transport by means other than Railways 3,37,347 3,60,008 3,81,628 4,06,560
16 Storage 5,108 5,709 5,256 6,137
17 Communication and Services related to Broadcasting 1,25,930 1,34,534 1,58,771 1,79,465
18 Financial services 4,80,226 5,26,156 5,51,258 5,94,691
19 Real estate, Ownership of dwelling & Professional Services 10,50,465 11,49,436 12,92,812 14,44,769
20 Public administration & Defence 4,91,155 4,99,136 5,15,352 5,65,871
21 Other Services 5,34,827 5,68,734 6,00,414 6,68,866
22 Tertiary / Services Sector 39,69,790 42,93,069 46,29,680 51,08,194
(Sub-Total-13 to 21) (100.0) (108.2) (116.7) (128.7)
23 Gross Value Added 81,06,656 85,46,552 90,84,369 97,27,490
(5+12+22) (100.0) (105.4) (112.1) (120.0)
24 Taxes on products including import duties 8,90,060 9,74,172 10,25,799 11,08,339
25 Less subsidies on products 2,60,677 2,93,845 2,70,734 2,83,679
26 Gross Domestic Product (23+24-25) 87,36,039 92,26,879 98,39,434 1,05,52,151
27 Primary income receivable from ROW (-)76,824 (-)1,08,170 (-)1,22,372 (-)1,24,450
28 Gross National Income (26+27) 86,59,215 91,18,709 97,17,062 1,04,27,701
29 Per Capita Gross National Income (`) 70,977 73,836 77,674 82,302
Source : Central Statistical Office, GoI
+ First revised estimates + + Second revised estimates
Note - Figures in brackets show percentages to col. (3) Figures may not add up due to rounding.

Economic Survey of Maharashtra 2015-16
31
ANNEXURE 3.7
NET VALUE ADDED AT BASIC PRICES BY INDUSTRY OF ORIGIN, NET DOMESTIC PRODUCT AT MARKET PRICES & NET NATIONAL INCOME
AT CURRENT PRICES (` crore)
Sr. No. Industry 2011-12++ 2012-13++ 2013-14++ 2014-15+
(1) (2) (3) (4) (5) (6)
1 Crops 9,00,830 9,95,632 11,21,094 11,27,983
2 Livestock 3,22,150 3,69,219 4,22,764 4,92,840
3 Forestry and Logging 1,23,095 1,33,541 1,41,464 1,36,419
4 Fishing and aquaculture 60,039 70,953 87,278 92,690
5 Agriculture & Allied Activities 14,06,113 15,69,346 17,72,599 18,49,931
(Sub-Total - 1+2+3+4) (19.6) (19.3) (19.3) (18.3)
6 Mining & quarrying 2,29,186 2,49,982 2,53,496 2,56,653
7 Primary Sector ( Sub-Total - 5+6) 16,35,299 18,19,328 20,26,095 21,06,584
8 Manufacturing 11,46,921 12,90,236 14,13,015 15,27,003
9 Electricity, Gas ,Water supply & Other Utility Services 1,23,811 1,40,536 1,68,964 1,89,311
10 Construction 7,38,206 7,94,744 8,75,102 9,43,456
11 Secondary Sector (Sub-Total – 8+9+ 10) 20,08,938 22,25,516 24,57,081 26,59,770
12 Industry 22,38,124 24,75,499 27,10,577 29,16,422
(Sub-Total - 6 + 11) (31.2) (30.4) (29.6) (28.8)
13 Trade, Repair, Hotels & Restaurants 8,38,109 9,97,692 11,33,091 12,79,473
14 Railways 48,531 57,233 61,464 72,402
15 Transport by means other than Railways 2,88,060 3,29,298 3,64,858 4,19,728
16 Storage 4,351 5,338 5,214 6,194
17 Communication and Services related to Broadcasting 1,02,776 1,16,822 1,35,552 1,43,273
18 Financial services 4,73,399 5,28,366 5,92,217 6,38,588
19 Real estate, Ownership of dwelling & Professional Services 8,97,785 10,52,520 12,55,371 14,49,691
20 Public administration & Defence 4,05,592 4,53,271 5,11,277 6,02,264
21 Other Services 4,86,673 5,64,672 6,40,121 7,61,262
22 Tertiary / Services Sector 35,45,278 41,05,211 46,99,165 53,72,875
(Sub-Total-13 to 21) (49.4) (50.4) (51.2) (53.0)
23 Net Value Added 71,89,515 81,50,056 91,82,341 1,01,39,229
(5+12+22) (100.0) (100.0) (100.0) (100.0)
24 Taxes on products including import duties 8,90,060 10,57,977 12,01,322 13,50,361
25 Less subsidies on products 2,60,677 3,16,656 3,09,371 3,34,565
26 Net Domestic Product (23+24-25) 78,18,898 88,91,378 1,00,74,292 1,11,55,025
27 Primary income receivable from ROW (-)76,824 (-)1,16,763 (-)1,39,887 (-)1,47,433
28 Net National Income (26+27) 77,42,074 87,74,615 99,34,405 1,10,07,592
29 Per Capita Net National Income (`) 63,460 71,050 79,412 86,879
Source : Central Statistical Office, GoI
+ First revised estimates + + Second revised estimates
Note - Figures in brackets show percentages to NVA Figures may not add up due to rounding.

Economic Survey of Maharashtra 2015-16
32
ANNEXURE 3.8
NET VALUE ADDED AT BASIC PRICES BY INDUSTRY OF ORIGIN, NET DOMESTIC PRODUCT AT MARKET PRICES & NET NATIONAL INCOME
AT CONSTANT (2011-12) PRICES (`crore)
Sr. No. Industry 2011-12++ 2012-13++ 2013-14++ 2014-15+
(1) (2) (3) (4) (5) (6)
1 Crops 9,00,830 8,96,292 9,30,142 8,91,503
2 Livestock 3,22,150 3,38,734 3,57,334 3,83,331
3 Forestry and Logging 1,23,095 1,23,430 1,21,512 1,20,207
4 Fishing and aquaculture 60,039 62,915 67,712 70,879
5 Agriculture & Allied Activities 14,06,113 14,21,371 14,76,700 14,65,919
(Sub-Total - 1+2+3+4) (100.0) (101.1) (105.1) (104.3)
6 Mining & quarrying 2,29,186 2,25,460 2,28,471 2,54,194
7 Primary Sector ( Sub-Total - 5+6) 16,35,299 16,46,831 17,05,171 17,20,114
8 Manufacturing 11,46,921 12,22,383 12,97,724 13,75,201
9 Electricity, Gas ,Water supply & Other Utility Services 1,23,811 1,19,530 1,19,400 1,25,371
10 Construction 7,38,206 7,31,387 7,65,256 7,99,506
11 Secondary Sector (Sub-Total – 8+9+ 10) 20,08,938 20,73,300 21,82,379 23,00,077
12 Industry 22,38,124 22,98,761 24,10,850 25,54,271
(Sub-Total - 6 + 11) (100.0) (102.7) (107.8) (114.2)
13 Trade, Repair, Hotels & Restaurants 8,38,109 9,26,656 9,92,274 10,98,620
14 Railways 48,531 54,750 57,278 61,043
15 Transport by means other than Railways 2,88,060 3,03,622 3,24,467 3,51,014
16 Storage 4,351 4,928 4,393 5,069
17 Communication and Services related to Broadcasting 1,02,776 1,08,998 1,15,565 1,17,812
18 Financial services 4,73,399 5,17,971 5,41,746 5,83,771
19 Real estate, Ownership of dwelling & Professional Services 8,97,785 9,70,952 10,89,760 12,17,995
20 Public administration & Defence 4,05,592 4,11,317 4,23,593 4,69,053
21 Other Services 4,86,673 5,18,022 5,45,991 6,10,247
22 Tertiary / Services Sector 35,45,278 38,17,216 40,95,067 45,14,624
(Sub-Total-13 to 21) (100.0) (107.7) (115.5) (127.4)
23 Net Value Added 71,89,515 75,37,348 79,82,616 85,34,815
(5+12+22) (100.0) (104.8) (111.0) (118.7)
24 Taxes on products including import duties 8,90,060 9,74,172 10,25,799 11,08,339
25 Less subsidies on products 2,60,677 2,93,845 2,70,734 2,83,679
26 Net Domestic Product (23+24-25) 78,18,898 82,17,675 87,37,681 93,59,476
27 Primary income receivable from ROW (-)76,824 (-)1,08,170 (-)1,22,372 (-)1,24,450
28 Net National Income (26+27) 77,42,074 81,09,505 86,15,309 92,35,026
29 Per Capita Net National Income (`) 63,460 65,664 68,867 72,889
Source : Central Statistical Office, GoI
+ First revised estimates + + Second revised estimates
Note - Figures in brackets show percentages to col. (3) Figures may not add up due to rounding.

4Prices and Public Distribution System

Economic Survey of Maharashtra 2015-16
Graph 4.1 : CPI-Rural
255.
03
234.
29
261.
56
245.
50
230
240
250
260
270
APR
MA
Y
JUN
JUL
AU
G
SEP
OCT
NO
V
DEC
Month
Inde
x
2014-15 2015-16
4. PRICES AND PUBLIC DISTRIBUTION SYSTEM PRICES 4.1 Observation of prices and accurate measurement of their rate of change is crucial to every economic issue. The purpose of compilation of a price index is to measure changes in the prices of specified goods and services over a period of time. The Consumer Price Index (CPI) and the Wholesale Price Index (WPI) are designed to measure fluctuations in the retail and wholesale prices respectively.
Price Situation in Maharashtra
4.2 Different CPIs are being compiled according to their purpose and published by GoM and GoI. Directorate of Economics & Statistics, GoM collects retail prices of 106 items from 68 rural centres and 127 items from 74 urban centres on a weekly basis. Based on these prices, monthly CPIs (base year 2003) are constructed separately for rural and urban areas of the State.
4.3 The average CPI for rural and urban areas from April to December, 2015 was 257.2 and 246.7 respectively. It increased by 2.7 per cent and 3.0 per cent respectively over the corresponding period of the previous year. The rise in indices is mainly due to increase in prices of pulses in ‘Food’ group. During the same period, CPI for ‘Food’ group was 261.8 and 268.5 for rural and urban areas showing an increase of 4.8 per cent and 5.4 per cent over the corresponding period of the previous year. CPI for ‘Fuel, Power & Light’ group for rural and urban areas was 445.4 and 405.7 showing decrease of 4.2 per cent and 4.9 per cent respectively.
4.3.1 The year-on-year rate of inflation based on CPI for April and December, 2015, for rural areas was 4.8 per cent & 2.6 per cent respectively, whereas for urban areas it was 4.7 per cent & 3.5 per cent respectively. The year-on-year rate of inflation for ‘Food’ group for April and December, 2015, was 5.7 per cent & 5.9 per cent respectively for rural areas while it was 6.2 per cent & 7.3 per cent respectively for urban areas. The year-on-year rate of inflation for ‘Fuel, Power & Light’ group for April and December, 2015, was 2.1 per cent & (-) 4.3 per cent respectively for rural areas while it was 0.4 per cent & (-)4.5 per cent respectively for urban areas.

Economic Survey of Maharashtra 2015-16
34
4.4 The Central Statistics Office (CSO), GoI releases monthly CPI (base year 2012) for All-India and states/UTs separately for rural, urban and combined areas. For construction of these CPIs, prices are collected from 66 rural centres and 86 urban centres in the State. 4.5 Other three CPIs viz. CPI for Agricultural Labourers (CPI-AL), CPI for Rural Labourers (CPI-RL), CPI for Industrial Workers (CPI-IW) are compiled and published monthly by Labour Bureau, GoI. The CPI-AL and CPI-RL (base year 1986-87) are compiled monthly for 20 states in India including Maharashtra, which are used for fixation and revision of minimum wages in agriculture sector. For construction of these indices, the retail prices are collected from 600 centres in India, of which 54 centres are from the State. CPI-IW (base year 2001) is mainly used for the determination of Dearness Allowance (DA) being paid to millions of public sector employees besides fixation and revision of minimum wages in scheduled employment. It is based on retail prices of essential commodities and services in industrially developed 78 selected centres in India, of which five centres are from the State. In addition to these five centres, CPI-IW is also compiled separately for five more centres in the State by the Office of the Labour Commissioner, GoM. 4.6 Average rural, urban and combined CPI compiled by CSO for Maharashtra for the period April to December, 2015 was 125.4, 119.8 and 121.7 respectively. 4.7 The average CPI-AL and CPI-RL for the State from April to December, 2015 were 893.0 and 887.4 showing an increase of 5.8 per cent and 5.6 per cent respectively over the corresponding period of the previous year.
Price Situation at All-India Level 4.8 Average CPI for rural, urban and combined, compiled by CSO for All-India for the period April to December, 2015 was 125.5, 122.7 and 124.2 respectively. 4.9 The average CPI-AL and CPI-RL for All-India from April to December, 2015 were 831.6 and 835.8 showing an increase of 4.2 per cent and 4.4 per cent respectively over the corresponding period of the previous year.

Economic Survey of Maharashtra 2015-16
35
4.10 The average All-India CPI-IW during April to December, 2015 was 264.0 which showed an increase of 5.7 per cent over the corresponding period of the previous year.
Wholesale Price Index 4.11 The Office of the Economic Adviser, Ministry of Commerce & Industries, GoI releases WPI (base year 2004-05) on monthly basis. It is the primary measure used for ascertaining inflation. WPI measures the trend in wholesale prices across various groups viz. ‘Primary Articles’, ‘Fuel & Power’ and ‘Manufactured Products’ with weights 20.12 per cent, 14.91 per cent and 64.97 per cent respectively.
4.12 WPI for ‘All Commodities’ increased from 176.4 in April, 2015 to 177.4 in December, 2015. During the same period, it increased from 243.6 to 257.8 for ‘Primary Articles’ group while it decreased from 153.9 to 152.6 for ‘Manufactured Products’ group and from 184.3 to 176.8 for ‘Fuel & Power’ group.
4.12.1 The year-on-year rate of inflation based on WPI increased from (-)2.4 per cent in April, 2015 to (-)0.7 per cent in December, 2015. It was negative for 14 months in a row. For ‘Primary Articles’ group, it increased from 0.5 per cent to 5.5 per cent. For ‘Manufactured Products’ group, it decreased from (-)0.5 per cent to (-)1.4 per cent. For ‘Fuel & Power’ group, it increased from (-)13.0 per cent to (-)9.2 per cent. For ‘Food’ sub-group in ‘Primary Articles’ group, it increased from 5.9 per cent in April to 8.2 per cent in December, 2015. This was mainly due to high rise in the prices of pulses and onions.
4.13 Series of various indices are given in Annexures 4.1 to 4.8, whereas the inflation rates based on important price indices are given in Annexure 4.9.

36
Economic Survey of Maharashtra 2015-16
PUBLIC DISTRIBUTION SYSTEM 4.14 The public distribution system (PDS) is one of the main instruments of the Government to provide food security to economically weaker sections of the society. PDS involves management of procurement & supply of essential commodities and maintaining its uninterrupted flow at subsidised prices to the identified beneficiaries. Procurement, storage, transportation and bulk allocation of commodities are the responsibilities of GoI whereas, distributing the same to the beneficiary families through the established network of Fair Price Shops (FPSs) is the responsibility of the State government. State government is also responsible for operational part such as identification of families Below Poverty Line (BPL), issue of ration cards and supervising & monitoring the functions of FPSs. Major commodities distributed through a network of FPSs are wheat, rice, sugar and kerosene. FPS is opened taking into consideration the convenience of the card holders and topography of the area thus ensuring availability of foodgrains even in remote areas. 4.15 As on 31st December, 2015 there were 51,910 FPSs operating in the State, of which 5,427 were in tribal areas and 29 FPSs were mobile. 4.15.1 Regular inspections of FPSs are carried out to check the quality of foodgrains supplied and unauthorised slippage of foodgrains. During January to December, 2015, number of inspections carried out was 86,390 (83 per cent of the target) and licenses of 270 FPSs were cancelled and 522 were suspended. 4.15.2 Total number of ration cards issued upto December, 2015 was 2.47 crore, out of which about 0.49 crore were BPL card holders and about 0.25 crore were Antyodaya Anna Yojana (AAY) card holders. Districtwise details of number of card holders are given in Annexure 4.10. 4.15.3 Under PDS, kerosene is provided to the card holders excluding all card holders having gas connection. As per Maharashtra Scheduled Commodities Retail Dealers Licensing Order, 1979, a license is required for stock and trade of kerosene. There are 61,858 kerosene license holders in the State. Out of these, 786 are wholesalers, 1,537 semi wholesalers and 59,535 are retailers.
National Food Security Act, 2013 4.16 National Food Security Act, 2013 (NFSA) came into force from 1st February, 2014 in the State. Beneficiaries under the act are categorised as AAY beneficiaries and Priority Household (PH) beneficiaries. The Act stipulates providing rice at ` three per kg, wheat at ` two per kg and coarse grain at ` one per kg to the beneficiaries. As per the Act, AAY beneficiaries continue to receive 35 kg of foodgrains per family per month and PH beneficiaries get five kg of foodgrains per person per month.
Antyodaya Anna Yojana 4.16.1 Antyodaya Anna Yojana (AAY) was started in the State since 1st May, 2001 with the objective of providing relief to the poorest segment of BPL population. Beneficiary families covered under the scheme are all landless agriculture labours, marginal farmers, rural artisans/craftsmen, persons earning their livelihood on daily basis in the informal sector, households headed by widows or terminally ill person or disabled person or person aged 60 years or more with no assured means of subsistence or societal support and all primitive tribal households. AAY ration cards have been issued on priority to HIV/AIDS persons and leprosy affected persons whose names are included in BPL lists and not covered under other scheme. GoI fixed quota of 25.05 lakh AAY families to the State. Regionwise allotment, off-take and distribution of foodgrains to FPSs during 2014-15 and during 2015-16 upto December under AAY is given in Annexure 4.14 & 4.15.

37
Economic Survey of Maharashtra 2015-16
4.17 About 8.77 crore beneficiaries were getting subsidised food in the erstwhile Targeted Public Distribution System (TPDS). According to the Act, about seven crore (62.3 per cent) population in the State is entitled to get foodgrains at subsidised rates. This covers about 4.70 crore population in rural areas and about 2.30 crore population in urban areas. The State provided foodgrains at own cost to the remaining 1.77 crore Above Poverty Line (APL) beneficiaries (55.5 lakh saffron card holders) as per rates (` 9.60 per kg for rice and ` 7.20 per kg for wheat) and quantum (15 kg per month per family) prevailing under the TPDS during May to October, 2014.
4.18 All farmer beneficiaries from APL (saffron card holders) in all 13 districts from Aurangabad & Amravati regions and Wardha from Nagpur region covered under the erstwhile TPDS in the State who were not covered under NFSA because of the target given by GoI are being supplied foodgrains during 2015-16 at same rate and quantity as per PH beneficiaries under NFSA by the State. The number of beneficiaries under this scheme are about 68 lakh. Allotment, off-take and distribution of foodgrains to FPSs for PH and entitled beneficiaries are given in Table 4.1.
‘Annapurna’ Scheme
4.19 This scheme is being implemented in the State since 1st April, 2001. Under the scheme, 10 kg of foodgrains per month are provided free of cost to old destitute people of age 65 years & above who do not get benefit under ‘National old age pension scheme’ or ‘State pension scheme’. Allotment of rice and wheat during 2015-16 upto September was 1,800 MT and 2,934 MT of which, off-take was 1,701 MT & 2,093 MT and distribution to FPSs was 661 MT and 798 MT respectively.
Distribution of foodgrains to establishments holding ration card
4.20 GoI sanctions additional allocation of foodgrains to establishments (welfare institutes) holding ration card in the State at the rate of ` six per kg for rice and ` five per kg for wheat. Under the scheme, 15 kg foodgrains are distributed to establishments holding ration card per month per inmate. Number of establishments holding ration card is 4,482 with number of inmates 5.63 lakh. Allotment, off-take and distribution of foodgrains to FPSs for establishments holding ration card are given in Table 4.2.
Table 4.1 Allotment, off-take and distribution of foodgrains to FPSs for PH and entitled beneficiaries
(Lakh MT) Year Type of Beneficiaries Rice Wheat
Allotment by GoI
Off-take by GoM
Distribution to FPSs
Allotment by GoI
Off-take by GoM
Distribution to FPSs
2013-14# PH family 2.46 2.34 2.25 3.32 3.20 3.05 APL Non-NFSA family 0 0 0 0 0 0
2014-15 PH family 14.75 13.32 13.72 19.99 18.16 18.69 APL Non-NFSA family $ 1.79 1.53 1.45 2.19 1.93 1.83
2015-16 PH family++ 11.28 10.52 9.80 15.32 14.32 13.25 APL Non- NFSA
family@ + 0.42 0.39 0.39 0.64 0.60 0.59
# February & March $ May to October ++ Upto December @ Farmers + August to November Source: Food, Civil Supplies and Consumer Protection Department, GoM.

38
Economic Survey of Maharashtra 2015-16
Simhastha Kumbhmela 4.21 Kumbhmela was held during July to September, 2015 and about four lakh saints were present during the Kumbhmela. Sadhugram was constructed for saints to reside and temporary establishment cards were given to monasteries. Temporary supply centres were built to provide five kg per person per month foodgrains to them at APL rate. Allotment, off-take and distribution of foodgrains to FPSs during the Simhastha Kumbhmela is given in Table 4.3.
Sugar 4.22 GoI has fixed monthly allocation of about 13,917.5 MT sugar to the State on the basis of number of BPL card holders and their population. For two festival months (August or September and October or November) 18,371.1 MT sugar is allocated to the State. At present sale price of sugar is ` 13.50 per kg. Subsidy for sugar procurement received from GoI in the year 2014-15 was ` 175.48 crore and during 2015-16 upto September was ` 138 crore. Allotment, off-take and distribution of sugar to FPSs is given in Table 4.4.
Kerosene 4.23 Allotment of Kerosene to the State during 2014-15 was 7.13 lakh kilo litre and during 2015-16 upto December was 4.68 lakh kilo litre, of which, off-take was 7.13 lakh kilo litre and 4.15 lakh kilo litre respectively. This kerosene is made available at the retail rate varying from ` 15.14 to ` 17.22 per litre in different districts of the State.
Godowns 4.24 During 2015, number of godowns owned by the State was 1,086 with storage capacity of 6.31 lakh MT. Out of these, condition of 192 godowns with capacity of 0.83 lakh MT was not suitable for storage and 14 godowns with 0.06 lakh MT capacity were given on rental basis. For storage of foodgrains, the State has hired 104 godowns of capacity 0.72 lakh MT. To augment the storage capacity under PDS, construction of new godowns (5.95 lakh MT) has been undertaken by
Table 4.2 Allotment, off-take and distribution of foodgrains to FPSs for establishments holding ration card
(‘000 MT)
Year Rice Wheat
Allotment by GoI
Off-take by GoM
Distribution to FPSs Allotment by
GoI Off-take by
GoM Distribution
to FPSs 2013-14@ 11.40 5.74 5.46 27.00 10.48 9.65 2014-15 22.80 19.44 12.19 54.00 42.84 24.40 2015-16+ 11.40 7.50 7.00 27.00 16.08 13.31 Source: Food, Civil Supplies and Consumer Protection Department, GoM. @ April to September + Upto September
Table 4.3 Allotment, off-take and distribution of foodgrains during Simhastha kumbhmela
(‘000 MT)
Foodgrains Allotment by GoI
Off-take by GoM
Distribution to FPSs
Rice 1.40 1.12 1.03 Wheat 2.10 1.07 1.06
Source : Food, Civil Supplies and Consumer Protection Department, GoM.
Table 4.4 Allotment, off-take and distribution of sugar to FPSs
(Lakh MT) Sugar Allotment
by GoI Off-take by
GoM Distribution
to FPSs 2013-14 1.79 0.87 0.82 2014-15 1.48 1.34 1.34 2015-16+ 1.34 1.32 1.30
+ Upto December Source : Food, Civil Supplies and Consumer Protection Department, GoM.

39
Economic Survey of Maharashtra 2015-16
the State with the financial help from NABARD. Districtwise number of godowns available and their capacities are given in Annexure 4.13.
Foodgrain subsidy
4.25 The foodgrain subsidy is the financial assistance provided under the PDS for foodgrain distribution, meeting the expenditure on maintenance of reserve stock in case of adverse situation and the loss that the State Government has to bear due to difference in the cost of foodgrain procurement and sale price. As per budget estimates foodgrain subsidy for 2015-16 is ` 909.75 crore. Yearwise subsidy for foodgrains is given in Table 4.5.
Computerisation of PDS 4.26 The project of computerisation of PDS is being implemented in the State to distribute the foodgrains in timely and transparent manner to eligible beneficiaries only. Under this project, digitisation of 2.37 crore ration cards has been completed. Also Aadhar seeding in PDS database is in progress and 50 per cent work has been completed.
* * * * *
Table 4.5 Subsidy for foodgrains (` Crore)
Year Subsidy
2011-12 293.32 2012-13 312.60 2013-14 201.00 2014-15(RE) 907.80 2015-16(BE) 909.75
Source : Food, Civil Supplies and Consumer Protection Department, GoM.

Economic Survey of Maharashtra 2015-16
40ANNEXURE 4.1
GROUPWISE CONSUMER PRICE INDEX NUMBERS FOR RURAL MAHARASHTRA
(Base Year - 2003)
Year/ Month Food Pan, Supari &
Tobacco Fuel, Power &
Light
Clothing, Bedding & Footwear
Miscellaneous All
Commodities Year on Year Inflation rate
(1) (2) (3) (4) (5) (6) (7) (8)
Weight 52.85 2.15 10.67 8.53 25.80 100.00 --
2004-05 104 105 103 102 102 104 --
2005-06 109 109 108 103 105 107 3.8
2006-07 118 117 132 105 108 116 7.8
2007-08 128 126 176 107 115 128 10.3
2008-09 142 139 238 110 125 145 13.2
2009-10 166 156 261 111 136 163 12.8
2010-11 184 174 297 114 150 181 10.9
2011-12 201 205 326 119 162 198 9.1
2012-13 222 243 383 125 172 218 10.5
2013-14 242 264 434 131 192 241 10.2
2014-15 249 293 467 133 200 251 4.2
2015-16@ 262 322 445 135 205 257 2.7
April, 2015 245 317 423 133 203 246 4.8
May, 2015 250 316 427 135 203 249 1.9
June, 2015 259 317 452 134 207 257 4.0
July, 2015 258 321 451 134 207 257 2.7
August, 2015 267 322 450 135 205 260 3.0
September, 2015 266 324 453 134 205 260 1.1
October, 2015 270 326 451 136 206 262 2.1
November, 2015 271 327 450 136 206 263 2.6
December, 2015 269 326 450 136 205 262 2.6
Source - Directorate of Economics & Statistics, GoM, Mumbai. @ Average for 9 months
Note - Inflation rate = Percentage rise in the index of the current period over that of corresponding period of the previous year.

Economic Survey of Maharashtra 2015-16
41
ANNEXURE 4.2
GROUPWISE CONSUMER PRICE INDEX NUMBERS FOR URBAN MAHARASHTRA
(Base Year - 2003)
Year / Month Food Pan, Supari & Tobacco
Fuel, power & Light
Clothing, Bedding & Footwear
Miscellaneous All
Commodities Year on Year Inflation rate
(1) (2) (3) (4) (5) (6) (7) (8)
Weight 45.80 1.54 10.28 7.51 34.87 100.00 --
2004-05 105 103 103 102 104 104 --
2005-06 109 107 107 103 107 108 3.2
2006-07 120 112 124 105 110 115 7.2
2007-08 128 121 162 106 115 125 8.7
2008-09 142 134 224 109 123 141 12.9
2009-10 165 147 245 113 131 157 11.4
2010-11 186 169 278 118 143 175 11.4
2011-12 201 205 297 126 154 189 7.9
2012-13 224 233 349 132 160 208 10.1
2013-14 248 262 396 137 175 230 10.3
2014-15 254 288 429 139 185 240 4.5
2015-16@ 269 319 406 142 191 247 3.0
April, 2015 253 309 373 140 188 235 4.7
May, 2015 259 313 377 141 189 239 1.9
June, 2015 265 314 414 141 191 246 4.0
July, 2015 267 319 414 141 191 247 2.0
August, 2015 271 320 413 142 191 249 1.4
September, 2015 273 321 415 142 191 250 2.2
October, 2015 276 323 415 143 191 251 3.3
November, 2015 278 326 415 143 191 252 3.8
December, 2015 273 327 415 143 191 250 3.5
Source - Directorate of Economics & Statistics, GoM, Mumbai.
@ Average for 9 months

Economic Survey of Maharashtra 2015-16
42ANNEXURE 4.3
CONSUMER PRICE INDEX (CENTRAL) FOR MAJOR STATES
(Base Year 2012) (April – December)
States Rural Urban Combined
2014-15 2015-16 Per cent increase
2014-15 2015-16 Per cent increase
2014-15 2015-16 Per cent increase
(1) (2) (3) (4) (5) (6) (7) (8) (9) (10)
Andhra Pradesh 118.32 127.81 8.02 118.64 125.16 5.49 118.43 126.83 7.09
Bihar 122.90 128.13 4.26 118.83 122.80 3.34 122.31 127.36 4.12
Gujrat 117.83 125.23 6.28 116.24 120.49 3.65 116.94 122.56 4.80
Karnataka 118.64 128.69 8.47 121.91 128.20 5.16 120.39 128.43 6.68
Kerala 120.26 125.13 4.06 120.47 125.80 4.43 120.32 125.38 4.20
Madhya Pradesh 118.46 124.14 4.80 118.46 123.03 3.86 118.44 123.68 4.42
Maharashtra 117.42 125.37 6.77 116.00 119.81 3.29 116.47 121.67 4.46
Punjab 117.32 121.64 3.68 117.28 121.47 3.57 117.28 121.58 3.67
Rajasthan 119.01 126.67 6.43 117.01 122.73 4.89 118.31 125.26 5.87
Tamil Nadu 118.50 124.98 5.47 118.84 125.67 5.74 118.70 125.39 5.64
Uttar Pradesh 119.54 124.08 3.79 118.61 122.91 3.63 119.22 123.64 3.71
West Bengal 119.82 123.64 3.19 119.07 122.30 2.72 119.46 123.01 2.98
All India 119.10 125.52 5.39 117.91 122.67 4.03 118.53 124.21 4.79
Source - Central Statistics Office, GoI.
Note - Item basket for each state is different

Economic Survey of Maharashtra 2015-16
43
ANNEXURE 4.4
CONSUMER PRICE INDEX NUMBERS FOR AGRICULTURAL LABOURERS AND RURAL LABOURERS IN MAHARASHTRA AND ALL-INDIA
(Base year: 1986-87)
Consumer Price Index No. for Agricultural Labourers Consumer Price Index No. for Rural Labourers Year/Month Maharashtra All India Maharashtra All India
Food group
General Index
Food group
General Index
Food group
General Index
Food group
General Index
(1) (2) (3) (4) (5) (6) (7) (8) (9)
2000-01 316 305 303 305 316 305 303 307
2001-02 307 303 302 309 308 304 303 311
2002-03 322 317 312 319 322 317 313 321
2003-04 342 332 325 331 341 332 326 333
2004-05 357 346 333 339 356 346 334 341
2005-06 365 362 344 353 364 362 345 355
2006-07 402 394 376 380 400 392 376 382
2007-08 437 423 406 409 434 420 406 409
2008-09 484 464 452 450 480 460 452 451
2009-10 574 540 522 513 571 535 523 513
2010-11 633 600 572 564 629 595 573 564
2011-12 704 676 602 611 697 668 603 611
2012-13 770 744 658 672 763 737 660 673
2013-14 818 793 737 750 793 786 739 751
2014-15 873 848 778 800 861 841 782 801
2015-16@ 923 893 801 832 912 887 807 836
April, 2015 887 865 772 805 877 861 776 809
May, 2015 890 868 780 811 879 863 785 816
June, 2015 910 882 790 820 899 877 796 824
July, 2015 910 881 792 822 900 877 797 827
August, 2015 925 892 805 832 914 886 810 836
September, 2015 942 902 814 839 930 896 819 843
October, 2015 960 917 826 849 948 910 832 853
November, 2015 958 917 831 853 947 910 837 857
December, 2015 N.A. 913 N.A. 853 N.A. 907 N.A. 857
Source - Labour Bureau, Simla, GoI. N.A. Not Available
@ Average for 9 months

Economic Survey of Maharashtra 2015-16
44ANNEXURE 4.5
ALL-INDIA CONSUMER PRICE INDEX NUMBERS FOR INDUSTRIAL WORKERS
(Base year - 2001)
Year/Month Food Pan, supari, tobacco and intoxicants
Fuel & light Housing Clothing,
Bedding and footwear
Miscellaneous General index
(1) (2) (3) (4) (5) (6) (7) (8)
Weight 46.19 2.27 6.43 15.27 6.58 23.26 100.00
2005-06 115 112 123 118 110 120 117
2006-07 126 116 130 126 114 126 125
2007-08 136 128 133 131 118 131 133
2008-09 153 138 144 137 122 141 145
2009-10 176 150 149 166 128 149 163
2010-11 194 168 163 201 136 157 180
2011-12 206 194 188 222 155 168 195
2012-13 230 223 214 238 170 182 215
2013-14 259 249 230 254 181 195 236
2014-15 280 284 243 273 192 210 254
2015-16@ 292 301 248 282 197 215 264
April, 2015 278 293 244 277 195 212 256
May, 2015 283 296 245 277 196 214 258
June, 2015 288 297 244 277 196 215 261
July, 2015 289 299 247 285 196 215 263
August, 2015 292 302 248 285 196 215 264
September, 2015 296 303 249 285 197 216 266
October, 2015 301 305 250 285 197 216 269
November, 2015 302 307 251 285 198 217 270
December, 2015 299 311 252 285 199 218 269
Source - Labour Bureau, Simla, GoI.
@ Average for 9 months

Economic Survey of Maharashtra 2015-16
45
ANNEXURE 4.6
CONSUMER PRICE INDEX NUMBERS FOR INDUSTRIAL WORKERS AT SELECTED CENTRES IN MAHARASHTRA
(Base year - 2001) (CENTRAL CENTERS)
MUMBAI SOLAPUR NAGPUR PUNE NASHIK
Year/Month Food group
General index
Food group
General index
Food group
General index
Food group
General index
Food group
General index
(1) (2) (3) (4) (5) (6) (7) (8) (9) (10) (11)
Weight 48.9 100.00 54.7 100.00 43.1 100.00 39.8 100.00 41.4 100.00
2005-06 115 118 113 115 115 119 120 119 119 118
2006-07 126 128 126 127 133 134 134 130 131 126
2007-08 136 136 149 142 146 142 145 138 140 132
2008-09 151 148 159 151 166 155 160 150 155 142
2009-10 173 163 176 166 192 183 183 167 183 165
2010-11 191 178 189 182 205 207 203 185 202 186
2011-12 208 196 214 204 216 224 226 204 216 208
2012-13 232 218 228 220 244 246 247 221 233 228
2013-14 260 242 260 246 280 268 280 242 258 244
2014-15 284 262 283 265 294 281 299 257 280 261
2015-16@ 305 279 307 284 319 298 315 268 289 273
April, 2015 295 272 296 276 300 286 304 260 281 266
May, 2015 296 273 298 277 309 291 312 264 290 272
June, 2015 301 275 304 281 317 295 310 266 289 272
July, 2015 301 277 308 284 320 299 307 265 288 273
August, 2015 302 278 308 284 321 299 306 265 288 273
September, 2015 309 282 306 283 322 300 322 271 292 274
October, 2015 313 284 315 289 333 305 329 275 293 275
November, 2015 315 285 313 289 327 303 325 273 291 274
December, 2015 312 284 317 291 321 301 323 272 292 275
Source - Labour Bureau, Simla, GoI.
@ Average for 9 months

Economic Survey of Maharashtra 2015-16
46ANNEXURE 4.7
CONSUMER PRICE INDEX NUMBERS FOR INDUSTRIAL WORKERS AT
SELECTED CENTRES IN MAHARASHTRA
(Base year - 2001) (STATE CENTERS)
AKOLA KOLHAPUR JALGAON NANDED AURANGABAD
Year/Month Food
group General
index Food
group General
index Food
group General
index Food
group General
index Food
group General
index (1) (2) (3) (4) (5) (6) (7) (8) (9) (10) (11)
Weight … 45.88 100.00 48.22 100.00 47.76 100.00 49.05 100.00 40.79 100.00
2008-09 … 134 144 150 149 151 150 153 154 148 150
2009-10 … 156 161 169 164 172 167 169 174 171 164
2010-11 … 170 175 191 184 195 186 187 200 188 183
2011-12 … 183 188 217 207 218 206 215 227 212 206
2012-13 … 210 216 236 226 241 230 232 251 239 234
2013-14* … 231 238 258 245 262 251 261 275 266 258
2014-15* … 220 243 262 255 266 261 270 289 276 273
2015-16@* … 251 261 276 269 277 270 302 311 295 290
April, 2015* … 231 249 262 259 263 261 279 297 277 278
May, 2015* … 236 251 266 263 267 263 284 300 284 282
June, 2015* … 239 254 270 266 269 265 292 304 286 284
July, 2015* … 248 259 273 267 270 268 295 309 289 288
August, 2015* … 256 263 276 269 274 270 303 313 298 292
September, 2015* … 260 265 280 271 280 273 310 316 302 294
October, 2015* … 266 269 285 274 289 277 317 320 309 298
November, 2015* … 264 269 285 274 290 278 318 321 308 298
December, 2015* … 262 269 283 275 289 279 318 322 306 290
Source - Office of the Labour Commissioner, GoM, Mumbai.
@ Average for 9 months * Provisional

Economic Survey of Maharashtra 2015-16
47
ANNEXURE 4.8
ALL-INDIA WHOLESALE PRICE INDEX NUMBERS (Base year - 2004-05)
Year / Month Primary articles Fuel and power Manufactured products
All commodities
(1) (2) (3) (4) (5)
Weight 20.12 14.91 64.97 100.00
2005-06 104.3 113.6 102.4 104.5
2006-07 114.3 120.9 108.2 111.4
2007-08 123.9 121.0 113.4 116.6
2008-09 137.5 135.0 120.4 126.0
2009-10 154.9 132.1 123.1 130.8
2010-11 182.4 148.3 130.1 143.3
2011-12 200.3 169.0 139.5 156.1
2012-13 220.0 186.5 147.1 167.6
2013-14 241.6 205.4 151.5 177.6
2014-15 248.8 203.5 155.1 181.2
2015-16@* 250.3 182.9 153.5 177.3
April, 2015 243.6 184.3 153.9 176.4
May, 2015 244.2 192.1 154.3 178.0
June, 2015 249.1 193.5 154.2 179.1
July, 2015 246.4 189.8 153.6 177.6
August, 2015 250.2 179.3 153.0 176.5
September, 2015 251.9 175.6 153.3 176.5
October, 2015 253.4 176.4 153.3 176.9
November, 2015 256.2 178.1 153.0 177.5
December, 2015* 257.8 176.8 152.6 177.4
Source - Office of the Economic Adviser, Ministry of Commerce and Industry, GoI.
@ Average for 9 months * Provisional

Economic Survey of Maharashtra 2015-16
48
ANNEXURE 4.9
INFLATION RATES BASED ON IMPORTANT PRICE INDICES
Year/Month
Inflation Rates
All India wholesale price index number #
All India consumer price index number for
industrial workers +
All India consumer price index number for
agricultural labourers +
All India consumer price index number for rural labourers +
(1) (2) (3) (4) (5)
2000-01 7.13 3.82 (-) 0.33 0.03
2001-02 3.62 4.31 1.09 1.33
2002-03 3.38 3.98 3.16 3.13
2003-04 5.49 3.85 3.90 3.79
2004-05 6.48 3.83 2.60 2.58
2005-06 4.47 4.41 3.85 3.85
2006-07 6.59 6.83 7.85 7.52
2007-08 4.74 6.40 7.45 7.18
2008-09 8.05 9.09 10.23 10.19
2009-10 3.80 12.37 13.91 13.76
2010-11 9.56 10.45 10.00 10.01
2011-12 8.94 8.39 8.19 8.35
2012-13 7.36 10.44 10.03 10.19
2013-14 5.98 9.68 11.74 11.47
2014-15 2.00 7.86 6.64 6.88
2015-16@ (-) 3.00 5.65 4.18 4.40
April, 2015 (-) 2.43 5.79 4.41 4.66
May, 2015 (-) 2.20 5.74 4.38 4.62
June, 2015 (-) 2.13 6.10 4.46 4.70
July, 2015 (-) 4.00 4.37 2.88 3.25
August, 2015 (-) 5.06 4.35 2.97 3.21
September, 2015 (-) 4.59 5.14 3.45 3.69
October, 2015 (-) 3.70 6.32 4.43 4.66
November, 2015 (-) 2.04 6.72 4.92 5.00
December, 2015 (-) 0.73* 6.32 5.70 5.80
Source - # Office of Economic Adviser, Ministry of Commerce and Industry, GoI.
+ Labour Bureau, Simla, GoI.
@ Average for 9 months * Provisional

Economic Survey of Maharashtra 2015-16
49
ANNEXURE 4.10
DISTRICTWISE TOTAL NUMBER OF EXISTING RATION CARDS (As on 31st December, 2015)
District Yellow Saffron
Annapurna White Total ration cards BPL AAY APL
(1) (2) (3) (4) (5) (6) (7) Mumbai /Thane Rationing Area 28,327 16,889 33,24,622 9,241 8,48,159 42,27,238
Thane 69,005 47,460 82,665 286 7,478 2,06,894
Palghar 1,05,950 95,266 4,18,698 1,570 37,026 6,58,510
Raigad 99,838 80,006 4,22,274 1,658 1,04,825 7,08,601
Ratnagiri 72,568 42,840 2,65,822 840 41,118 4,23,188
Sindhudurg 47,689 23,633 1,40,772 398 22,182 2,34,674
Nashik 3,02,047 1,79,928 6,97,058 802 81,686 12,61,521
Dhule 1,42,913 76,409 2,05,332 1,686 10,457 4,36,797
Nandurbar 1,04,347 1,05,919 1,09,301 1,250 8,540 3,29,357
Jalgaon 2,15,728 1,36,974 5,20,297 1,996 72,301 9,47,296
Ahmednagar 6,10,757 93,558 3,00,220 2,701 51,354 10,58,590
Pune 1,61,766 70,947 14,86,394 918 1,93,093 19,13,118
Satara 1,24,901 35,240 4,93,265 1,594 53,621 7,08,621
Sangli 69,320 35,438 5,01,358 924 76,087 6,83,127
Solapur 2,20,082 85,010 6,18,070 1,098 72,341 9,96,601
Kolhapur 1,47,868 56,385 6,50,418 173 95,111 9,49,955
Aurangabad 1,76,942 70,207 5,12,651 2,362 9,916 7,72,078
Jalna 1,14,542 42,979 1,88,017 2,220 5,635 3,53,393
Parbhani 74,853 44,584 2,43,450 1,971 2,470 3,67,328
Hingoli 1,36,664 32,248 76,497 984 2,455 2,48,848
Beed 2,48,413 42,945 3,68,899 2,236 13,584 6,76,077
Nanded 1,42,710 82,173 4,19,403 2,025 9,740 6,56,051
Osmanabad 1,16,750 38,512 2,08,994 841 11,628 3,76,725
Latur 86,877 41,157 3,14,855 1,832 18,205 4,62,926
Buldhana 1,41,655 66,018 2,87,406 3,037 19,842 5,17,958
Akola 1,59,164 44,192 1,34,078 1,539 15,107 3,54,080
Washim 80,180 40,491 1,53,376 1,770 13,499 2,89,316
Amravati 2,07,125 1,33,799 2,99,871 3,291 15,570 6,59,656
Yavatmal 1,47,819 1,30,015 3,15,298 3,447 17,111 6,13,690
Wardha 47,700 44,241 2,11,224 1,320 19,576 3,24,061
Nagpur 1,34,933 1,04,585 7,36,103 4,264 70,888 10,50,773
Bhandara 79,572 64,249 89,721 773 20,328 2,54,643
Gondia 96,739 76,561 1,03,708 1,220 7,899 2,86,127
Chandrapur 1,03,816 1,32,612 2,03,532 166 37,645 4,77,771
Gadchiroli 46,196 91,742 75,364 0 10,663 2,23,965
Maharashtra State 48,65,756 25,05,212 1,51,79,013 62,433 20,97,140 2,47,09,554
Source - Food, Civil Supplies and Consumer Protection Department, GoM.

Economic Survey of Maharashtra 2015-16
50
ANNEXURE 4.11
QUANTITY OF RICE AND WHEAT ISSUED TO AUTHORISED RATION / FAIR PRICE SHOPS
(lakh MT)
Year
Rice Wheat Mumbai
rationing area Other districts Total.
(2) + (3) Mumbai
rationing area Other districts Total
(5) + (6) (1) (2) (3) (4) (5) (6) (7)
2001-02 (Total) 0.02 5.16 5.18 0.05 8.48 8.53
Of which, TPDS 0.02 5.00 5.02 0.04 8.27 8.31
2007-08 (Total) 0.12 11.16 11.28 0.32 12.62 12.94
Of which, TPDS 0.06 10.90 10.96 0.06 11.86 11.92
2011-12 (Total) 0.64 14.91 15.55 1.74 19.40 21.14
Of which, TPDS 0.14 13.30 13.44 0.07 13.94 14.01
2012-13 (Total) 1.01 15.53 16.54 1.85 20.28 22.13
Of which, TPDS 0.14 13.35 13.49 0.06 14.16 14.22
2013-14 (Total) 1.68 15.92 17.60 1.95 18.51 20.46
Of which, TPDS/NFSA, 2013 0.48 12.34 12.82 0.55 13.58 14.13
2014-15 (Total) 2.13 17.92 20.05 2.93 22.72 25.65
Of which, NFSA, 2013 1.83 16.77 18.60 2.60 21.22 23.82
2015-16 (Total) + 1.50 12.07 13.57 2.24 15.00 17.24
Of which, NFSA, 2013 1.50 11.68 13.18 2.24 14.41 16.65
+ Upto December
ANNEXURE 4.12
ALLOTMENT BY GOVERNMENT OF INDIA TO THE STATE
(lakh MT) Year Rice Wheat (1) (2) (3) 2001-02 (Total) 9.23 17.13
Of which, TPDS 6.55 12.16
2007-08 (Total) 13.69 15.46
Of which, TPDS 13.35 14.04
2011-12 (Total) 19.36 32.85
Of which, TPDS 16.23 16.96
2012-13 (Total) 20.74 31.45
Of which, TPDS 15.51 16.54
2013-14 (Total) 21.96 25.19
Of which, TPDS/NFSA, 2013 14.41 15.96
2014-15 (Total) 21.57 27.47
Of which, NFSA, 2013 19.78 25.28
2015-16 (Total) + 15.56 19.96
Of which, NFSA, 2013 15.14 19.32 + Upto December
Source - Food, Civil Supplies and Consumer Protection Department, GoM. Note - 1. Figures of Antyodaya Anna Yojana are included in Targeted Public Distribution System & NFSA, 2013 2. Since February, 2014 allotment is under NFSA ,2013 for PH and AAY beneficiaries.

Economic Survey of Maharashtra 2015-16
51
ANNEXURE 4.13
DISTRICTWISE NUMBER OF GODOWNS AVAILABLE, THEIR CAPACITY AND FAIR PRICE SHOPS
District Available godowns (upto June, 2015) Number of fair price shops
(upto December, 2015) Number Capacity (MT)
(1) (2) (3) (4)
Mumbai 9 7,807 3,720
Thane 13 6,500 593
Palghar 22 8,950 1,092
Raigad 31 25,825 1,322
Ratnagiri 26 11,550 941
Sindhudurg 18 8,090 428
Nashik 29 14,700 2,600
Dhule 20 11,490 984
Nandurbar 26 13,000 1,043
Jalgaon 43 20,930 1,921
Ahmednagar 41 32,050 1,675
Pune 43 37,580 3,019
Satara 43 15,490 1,614
Sangli 28 17,770 1,351
Solapur 65 53,124 1,871
Kolhapur 22 16,750 1,577
Aurangabad 29 30,206 1,779
Jalna 20 18,900 1,286
Parbhani 23 10,600 1,178
Hingoli 10 6,100 795
Beed 32 25,240 2,023
Nanded 45 23,240 1,973
Osmanabad 27 16,400 1,070
Latur 23 19,000 1,350
Buldhana 34 13,730 1,536
Akola 25 12,900 1,052
Washim 14 8,150 774
Amrawati 35 15,850 1,906
Yavatmal 34 17,000 2,010
Wardha 17 9,685 838
Nagpur 53 29,155 1,953
Bhandara 14 8,000 888
Gondia 11 10,050 1,003
Chandrapur 32 15,250 1,525
Gadchiroli 27 22,200 1,220
Maharashtra State 984 6,13,262 51,910
Source - Food, Civil Supplies and Consumer Protection Department, GoM.

Economic Survey of Maharashtra 2015-16
52
ANNEXURE 4.14
ALLOTMENT, OFF-TAKE & DISTRIBUTION OF FOODGRAINS TO FPSs DURING 2014-2015 UNDER ANTYODAYA ANNA YOJANA
(MT)
District Allocation Off-take Distribution to FPSs
Rice Wheat Total Rice Wheat Total Rice Wheat Total (1) (2) (3) (4) (5) (6) (7) (8) (9) (10)
Mumbai 5,628 2,256 7,884 5,133 2,027 7,160 5,133 2,027 7,160 Thane@ 42,384 16,956 59,340 40,927 16,004 56,931 41,429 16,300 57,729 Raigad 21,876 8,748 30,624 21,023 8,748 29,771 21,876 8,748 30,624 Ratnagiri 12,792 5,112 17,904 12,773 5,111 17,884 12,555 5,031 17,586 Sindhudurg 7,044 2,820 9,864 6,677 2,820 9,497 6,926 2,764 9,690 Kokan region 89,724 35,892 1,25,616 86,533 34,710 1,21,243 87,919 34,870 1,22,789 Nasik 32,352 43,140 75,492 30,920 41,048 71,968 30,979 40,956 71,935 Dhule 13,584 18,120 31,704 12,312 15,999 28,311 13,242 17,825 31,067 Nandurbar 31,776 12,708 44,484 31,177 12,852 44,029 29,427 12,039 41,466 Jalgaon 24,648 32,868 57,516 22,954 29,739 52,694 23,931 31,935 55,866 Ahmednagar 17,040 22,716 39,756 14,882 20,833 35,714 16,108 21,430 37,538 Nashik region 1,19,400 1,29,552 2,48,952 1,12,245 1,20,471 2,32,716 1,13,687 1,24,185 2,37,872 Pune Rural 10,044 13,392 23,436 8,951 11,946 20,897 8,733 11,734 20,467 Pune city 2,712 3,624 6,336 2,603 3,502 6,105 2,602 3,501 6,103 Satara 6,384 8,520 14,904 6,359 8,495 14,854 6,205 8,294 14,499 Sangli 6,444 8,592 15,036 6,079 8,217 14,295 6,105 8,183 14,288 Solapur Rural 14,004 18,672 32,676 11,960 17,601 29,561 13,950 18,594 32,544 Solapur City 1,296 1,728 3,024 1,296 1,728 3,024 1,233 1,612 2,845 Kolhapur 11,208 14,952 26,160 10,209 13,151 23,360 10,187 13,579 23,766 Pune region 52,092 69,480 1,21,572 47,457 64,640 1,12,096 49,015 65,497 1,14,512 Aurangabad 12,588 16,776 29,364 12,453 16,597 29,050 12,453 16,597 29,050 Jalna 7,740 10,320 18,060 7,151 9,587 16,738 7,151 9,587 16,738 Parbhani 7,920 10,560 18,480 7,920 10,320 18,240 7,920 10,320 18,240 Hingoli 4,920 6,552 11,472 4,920 6,552 11,472 4,920 6,552 11,472 Beed 7,764 10,356 18,120 7,559 10,322 17,881 7,559 10,322 17,881 Nanded 14,076 18,756 32,832 14,076 18,412 32,488 14,076 18,412 32,488 Osmanabad 7,044 9,396 16,440 6,663 8,827 15,490 6,663 8,827 15,490 Latur 7,380 9,828 17,208 7,380 9,828 17,208 7,380 9,828 17,208 Aurangabad region 69,432 92,544 1,61,976 68,122 90,445 1,58,567 68,122 90,445 1,58,567 Amravati 21,852 29,124 50,976 21,852 29,124 50,976 21,852 29,124 50,976 Akola 8,448 11,268 19,716 7,745 10,296 18,041 7,436 9,901 17,337 Washim 7,296 9,732 17,028 7,296 9,602 16,898 7,241 9,662 16,903 Buldana 11,592 15,468 27,060 11,059 14,583 25,642 12,052 16,072 28,124 Yavatmal 20,040 26,712 46,752 18,837 25,650 44,487 19,204 26,947 46,151 Amravati region 69,228 92,304 1,61,532 66,789 89,255 1,56,044 67,785 91,706 1,59,491 Nagpur Rural 12,372 16,500 28,872 12,372 15,941 28,313 12,372 15,941 28,313 Nagpur City 6,000 8,004 14,004 6,000 8,004 14,004 6,000 8,004 14,004 Wardha 7,788 10,380 18,168 7,788 10,380 18,168 7,623 10,303 17,926 Bhandara 12,020 14,547 26,567 12,020 14,547 26,567 12,020 14,547 26,567 Gondia 14,352 17,377 31,729 14,352 16,853 31,205 15,610 17,679 33,290 Chandrapur 23,604 31,464 55,068 22,943 31,148 54,091 22,931 31,136 54,067 Gadchiroli 27,228 10,884 38,112 9,856 26,066 35,922 26,720 10,682 37,402 Nagpur region 1,03,364 1,09,156 2,12,520 85,331 1,22,939 2,08,270 1,03,276 1,08,292 2,11,568 Maharashtra State 5,03,240 5,28,928 10,32,168 4,66,477 5,22,460 9,88,937 4,89,804 5,14,995 10,04,799
Source : - Food, Civil Supplies and Consumer Protection Department, GoM.
@ Thane includes Palghar District

Economic Survey of Maharashtra 2015-16
53
ANNEXURE 4.15
ALLOTMENT, OFF-TAKE & DISTRIBUTION OF FOODGRAINS TO FPSs DURING 2015-2016 UPTO DECEMBER UNDER ANTYODAYA ANNA YOJANA
(MT)
District Allocation Off-take Distribution to FPSs
Rice Wheat Total Rice Wheat Total Rice Wheat Total (1) (2) (3) (4) (5) (6) (7) (8) (9) (10)
Mumbai 3,360 2,665 6,025 2,782 2,181 4,963 2,782 2,181 4,963 Thane 12,896 5,154 18,050 12,497 5,154 17,651 11,788 4,764 16,552 Palghar 21,324 8,530 29,854 18,286 7,292 25,578 18,107 7,302 25,409 Raigad 17,043 6,811 23,854 16,693 6,312 23,005 16,671 6,303 22,974 Ratnagiri 9,325 3,727 13,052 8,807 3,588 12,395 8,820 3,559 12,379 Sindhudurg 7,490 5,510 13,000 6,353 4,388 10,741 6,847 4,340 11,187 Kokan region 71,438 32,397 1,03,835 65,418 28,915 94,333 65,015 28,449 93,464 Nasik 21,531 31,663 53,194 18,846 25,610 44,456 17,731 24,000 41,731 Dhule 11,263 13,698 24,961 11,262 13,698 24,960 11,229 13,303 24,532 Nandurbar 23,238 11,211 34,449 22,682 11,003 33,685 20,908 10,328 31,236 Jalgaon 16,893 22,194 39,087 16,724 19,380 36,104 16,189 18,604 34,793 Ahmednagar 11,420 16,757 28,177 11,103 15,286 26,389 11,276 15,562 26,838 Nashik region 84,345 95,523 1,79,868 80,617 84,977 1,65,594 77,333 81,797 1,59,130 Pune Rural 6,607 9,734 16,341 6,590 9,645 16,235 6,590 9,645 16,235 Pune city 2,291 3,315 5,606 2,022 2,913 4,935 1,968 2,870 4,838 Satara 4,583 6,697 11,280 4,492 6,542 11,034 4,391 6,364 10,755 Sangli 5,295 7,662 12,957 5,114 7,452 12,566 4,952 7,271 12,223 Solapur Rural 8,457 12,471 20,928 7,717 11,815 19,532 8,354 12,341 20,695 Solapur City 2,202 3,134 5,336 1,655 2,297 3,952 1,485 1,807 3,292 Kolhapur 8,087 11,800 19,887 7,258 10,710 17,968 7,258 10,790 18,048 Pune region 37,522 54,813 92,335 34,848 51,374 86,222 34,998 51,088 86,086 Aurangabad 8,932 13,122 22,054 8,240 11,997 20,237 8,240 11,992 20,232 Jalna 5,512 8,054 13,566 5,512 8,054 13,566 5,424 7,960 13,384 Parbhani 5,480 8,041 13,521 5,480 8,041 13,521 5,480 8,041 13,521 Hingoli 4,207 6,137 10,344 4,186 6,104 10,290 4,079 5,834 9,913 Beed 6,041 8,761 14,802 5,972 8,657 14,629 5,972 8,657 14,629 Nanded 9,810 14,421 24,231 9,810 14,421 24,231 9,741 14,317 24,058 Osmanabad 5,038 7,356 12,394 5,038 7,356 12,394 5,038 7,356 12,394 Latur 6,489 9,322 15,811 6,483 9,312 15,795 6,021 8,600 14,621 Aurangabad region 51,509 75,214 1,26,723 50,721 73,942 1,24,663 49,995 72,757 1,22,752 Amravati 15,505 18,565 34,070 15,505 16,416 31,921 14,858 15,582 30,440 Akola 6,247 7,396 13,643 5,527 6,918 12,445 5,605 6,600 12,205 Washim 5,942 7,924 13,866 5,384 7,403 12,787 5,627 7,573 13,200 Buldana 9,552 12,126 21,678 9,454 11,406 20,860 8,863 11,540 20,403 Yavatmal 14,699 19,596 34,295 14,390 19,313 33,703 13,366 17,811 31,177 Amravati region 51,945 65,606 1,17,551 50,260 61,456 1,11,716 48,319 59,106 1,07,425 Nagpur Rural 8,853 11,639 20,492 8,853 11,478 20,331 8,271 10,706 18,977 Nagpur City 4,796 6,397 11,193 4,796 6,397 11,193 4,677 6,145 10,822 Wardha 6,871 7,685 14,556 6,871 7,685 14,556 6,304 6,986 13,290 Bhandara 14,712 5,882 20,594 14,712 5,882 20,594 13,756 5,630 19,386 Gondia 17,254 8,733 25,987 17,252 7,891 25,143 16,983 8,626 25,609 Chandrapur 18,159 22,093 40,252 17,623 20,263 37,886 17,314 21,237 38,551 Gadchiroli 61,529 50,131 1,11,660 60,809 48,019 1,08,828 57,866 46,663 1,04,529 Nagpur region 1,32,174 1,12,560 2,44,734 1,30,916 1,07,615 2,38,531 1,25,171 1,05,993 2,31,164 Maharashstra State 4,28,933 4,36,114 8,65,047 4,12,780 4,08,279 8,21,059 4,00,831 3,99,190 8,00,021
Source : Food, Civil Supplies and Consumer Protection Department, GoM.

5Public Finance

Economic Survey of Maharashtra 2015-16
5. PUBLIC FINANCE
Budget 2015-16 5.1 The Budget 2015-16 was presented with expected total receipts and expenditure of ` 2,30,169 crore and ` 2,30,062 crore respectively and revenue deficit of ` 3,757 crore. In 2015-16, State’s fiscal deficit is expected to decrease to 1.6 per cent of GSDP which is within the limit laid down by 14th Finance Commission (FC). Budget at a glance is given in Table 5.1 and details are given in Annexure 5.1.
Revenue Receipts 5.2 The expected total revenue receipts are ` 1, 98,231 crore for 2015-16 which are expected to increase by 9.6 per cent over the previous year.
Tax Revenue
5.3 The tax revenue of the State is expected to increase by 16.9 per cent during 2015-16 over the previous year. The share of tax revenue in total revenue receipts is expected to be 80.6 per cent. Tax revenue is given in Table 5.2.
5.4 From 2010-11, the Own Tax Revenue (OTR) has increased at CAGR of 6.7 per cent during last five years. Share of OTR in the tax revenue and in total revenue receipts is expected to be 81.8 per cent and 65.9 per cent respectively for 2015-16. OTR is expected to increase by 9.8 per cent during 2015-16 over the previous year and its percentage to GSDP is expected to be 6.6 per cent. VAT has the highest share (57.1 per cent) in OTR followed by stamp duties & registration fees with 16.1 per cent. The details of OTR are given in Annexure 5.2.
5.5 As per 14th FC recommendations, share of tax devolution has increased from 32 per cent to 42 per cent of the total divisible pool. State’s share in devoluble amount (excluding service tax) from Central Taxes has increased from 5.199 per cent to 5.521 per cent and the share of service tax has increased from 5.281 per cent to 5.674 per cent. For 2015-16, State is expected to receive 65.1 per cent more share in central taxes over the previous year.
Table 5.1 Budget at a glance (` Crore)
Item 2013-14 (Actual)
2014-15 (RE)
2015-16 (BE)
1. Revenue Receipts 1,49,822 1,80,794 1,98,231
2. Revenue Expenditure 1,54,902 1,94,677 2,01,988
3. Revenue Deficit (2-1) 5,081 13,883 3,757
As per cent of GSDP 0.3 0.8 0.2
4. Capital Receipts# 27,513 37,633 31,939
5. Capital Expenditure# 21,666 24,398 28,074
6. Total Receipts (1+4)# 1,77,335 2,18,427 2,30,169
7. Total Expenditure (2+5)# 1,76,568 2,19,075 2,30,062
8. Budgetary Deficit (7-6) (-)767 648 (-)107
9. Fiscal Deficit 26,018 37,246 30,733
As per cent of GSDP 1.6 2.1 1.6 # Net of loan repayment RE - Revised Estimates BE-Budget Estimates Note-Figures may not add up to totals due to rounding Source : Finance Department, GoM
Table 5.2 Tax revenue (` Crore)
Year Own Tax Revenue
Share in central taxes
Total
2010-11 75,028 11,419 86,447
2011-12 87,648 13,304 1,00,952
2012-13 1,03,448 15,192 1,18,640
2013-14 1,08,641 16,588 1,25,228
2014-15 (RE) 1,19,008 17,607 1,36,615
2015-16 (BE) 1,30,635 29,062 1,59,697 Note-Figures may not add up to totals due to rounding Source : Finance Department, GoM

56
Economic Survey of Maharashtra 2015-16
Non-Tax Revenue
5.6 The non-tax revenue is expected to be ` 38,534 crore during 2015-16 with 19.4 per cent expected share in total revenue receipts. Due to change in the funding pattern of centrally sponsored schemes (as per 14th FC recommendations), there is an expected decrease of 41.7 per cent in central grants in 2015-16. Non-tax revenue is given in Table 5.3.
Grants-in-aid under 14th FC 5.7 Apart from increase in the share of tax devolution and change in the funding pattern of Centrally Sponsored Schemes, 14th FC has also recommended grants-in-aid as follows: Grants to states are to be divided into two broad categories on the basis of rural and urban
population, with the ratio of basic grants to performance grants being 90:10 for rural local bodies and 80:20 in case of urban local bodies .
After implementation of Goods and Services Tax (GST), the ratio of centre and state’s contribution to State Disaster Relief Fund (SDRF) will be 90:10.
5.7.1 For 2015-16, the State is expected to receive ` 1,623 crore and ` 1,191 crore as basic grants for rural and urban local bodies respectively whereas, the performance based grants will be given from 2016-17 onwards. State is expected to receive ` 1,112 crore as central share in SDRF in 2015-16.
Revenue Expenditure 5.8 The revenue expenditure is mainly incurred on salary & wages, pension and interest payments. Interest payments constitute perennial burden on the State’s revenue due to increase in debt stock. Composition of revenue expenditure is given in Table 5.4.
Table 5.3 Non-tax revenue (` Crore)
Year Interest receipts
Other non-tax revenue
Central grants
Total non-tax revenue
2010-11 1,422 6,803 11,196 19,421 2011-12 1,359 6,809 12,166 20,334 2012-13 2,465 7,520 14,322 24,307 2013-14 3,934 7,418 13,241 24,593 2014-15 (RE) 2,974 10,546 30,659 44,179 2015-16 (BE) 2,974 17,691 17,869 38,534 Source: Finance Department, GoM
Table 5.4 Composition of revenue expenditure ( ` Crore)
Year Salary & wages Pension Interest Other Total revenue expenditure
2010-11 41,746 (39.2)
9,886 (9.3)
15,648 (14.7)
39,179 (36.8)
1,06,459 (100.0)
2011-12 45,467 (36.8)
11,682 (9.5)
17,505 (14.2)
48,900 (39.6)
1,23,554 (100.0)
2012-13 53,295 (38.4)
13,430 (9.7)
19,076 (13.7)
52,935 (38.2)
1,38,736 (100.0)
2013-14 59,735 (38.6)
15,186 (9.8)
21,207 (13.7)
58,774 (37.9)
1,54,902 (100.0)
2014-15 (RE) 66,213 (34.0)
17,633 (9.1)
24,283 (12.5)
86,548 (44.5)
1,94,677 (100.0)
2015-16 (BE) 73,438 (36.4)
19,929 (9.9)
27,663 (13.7)
80,958 (40.1)
2,01,988 (100.0)
Note : Figures in bracket show percentage to total revenue expenditure Source : Finance Department, GoM

57
Economic Survey of Maharashtra 2015-16
5.9 For 2015-16, development expenditure is expected to constitute 63.4 per cent in the total revenue expenditure, of which , 66.3 per cent is expected to be made on social services such as education, health, water supply, etc. Non-development expenditure is expected to rise by 16.2 per cent over the previous year with its share in revenue expenditure being 36.6 per cent. The details of revenue expenditure are given in Annexure 5.3.
Subsidies
5.10 The GoM provides certain essential goods and services at subsidised rates to make them affordable to people. The provisions made for major subsidies in 2015-16 are:
` 4,963 crore as compensation to Maharashtra State Electricity Distribution Company Ltd. for subsidised tariffs to agriculture and powerlooms.
` 3,150 crore to industrial units including mega industrial projects.
` 1,613 crore to Maharashtra State Road Transport Corporation for compensating the losses incurred while providing concessional fares to certain categories of passengers such as senior citizens, students, freedom fighters, etc.
` 910 crore for distributing foodgrains to Below Poverty Line (BPL) , certain sections of Above Poverty Line (APL) of the society at less than procurement rate on implementing Food Security Act, 2013.
Tax realisation
5.11 During 2013-14, the total amount of tax raised but not realised was ` 48,668 crore which is 23.7 per cent higher than the previous year. Nearly half of the total amount of tax raised but not realised was under dispute.
5.12 Sales Tax / VAT (including taxes on motor spirits and lubricant) and Central Sales Tax have largest share of 67.7 per cent and 25.8 per cent respectively in non-realised taxes. Tax raised but not realised for 2013-14 is given in Table 5.5.
Revenue Receipts 2015-16
5.13 By the end of December, 2015 revenue receipts of the State were 63.8 per cent of 2015-16 (BE) as against 63.4 per cent for the corresponding period of 2014-15 (RE). The details of revenue receipts are given in Table 5.6.
Table 5.5 Tax raised but not realised - 2013-14 (` Crore)
Particulars Amount
Total under dispute
not under dispute
Sales Tax / VAT (including taxes on motor spirits and lubricant)
17,988 14,981 32,969
Central Sales Tax 4,866 7,709 12,575 Taxes on professions, trades and employment 5 802 807
Minor mineral, etc. 283 124 407 Electricity duties 462 14 476 Others 861 573 1,434
Total 24,465 24,203 48,668 Source: Finance Department, GoM

58
Economic Survey of Maharashtra 2015-16
Revenue Expenditure 2015-16 5.14 The total revenue expenditure of the State by the end of December, 2015 was ` 1,19,037 crore (58.9 per cent of 2015-16(BE)), of which plan expenditure was ` 16,094 crore (33.9 per cent of 2015-16(BE)). Development expenditure and expenditure incurred on social services by end of December, 2015 were ` 75,832 crore (59.2 per cent of 2015-16(BE)) and ` 51,615 crore (60.8 per cent of 2015-16 (BE)) respectively. Capital Receipts and Capital Expenditure 5.15 The major source of capital receipts is debt (borrowings and other liabilities). For 2015-16, the expected internal debt is 76.8 per cent of the total capital receipts. As per the 14th FC recommendations, State’s borrowings from special securities issued to National Small Savings Fund (NSSF) have been made limited. Accordingly, capital receipts for 2015-16 are expected to decrease by 9.3 per cent over the previous year. 5.16 The capital expenditure includes capital expenditure outside the revenue account, loans & advances given by the State Government and repayment of public debt. It is anticipated to be ` 41,038 crore in 2015-16 which is 16.9 per cent of the total expenditure. Capital expenditure outside the revenue account has the major share of 66 per cent in the total capital expenditure for 2015-16. Capital receipts and capital expenditure are given in Table 5.7.
Table 5.6 Revenue receipts (` Crore)
Item Actual receipts Per cent change
Percentage to
2015-16 (BE) 2014+ 2015+
A) Tax Revenue (1 + 2) 96,749 1,08,067 11.7 67.7 1) Own Tax Revenue ( i to ix) 83,898 89,386 6.5 68.4 i) Value Added Tax (VAT) 50,498 52,028 3.0 69.7 ii) Stamps & reg. fees 14,950 15,785 5.6 75.2 iii) State excise duties 7,822 8,468 8.3 62.7 iv) Taxes & duties on electricity 2,473 4,069 64.5 56.9 v) Land revenue 819 903 10.3 28.2 vi) Taxes on vehicles 3,925 4,339 10.5 76.2 vii) Other taxes on income & expenditure 1,540 1,546 0.4 67.0 viii) Taxes on goods & passengers 207 591 185.5 51.4 ix) Other taxes & duties on commodities & services 1,664 1,657 (-) 0.4 82.2
2) Share in central taxes 12,851 18,681 45.4 64.3 B) Non-Tax Revenue ( i + ii) 17,944 18,390 2.5 47.7 i) Non-tax revenue 7,347 7,491 2.0 36.2 ii) Grants-in-aid from centre 10,957 10,899 (-) 0.5 61.0 Total ( A+B ) 1,14,693 1,26,457 10.3 63.8
Source : Accountant General, Maharashtra + Upto December
Table 5.7 Capital receipts and capital expenditure (` Crore)
Year Capital receipts Capital expenditure Total Of which,
Internal debt
Total Of which Outside revenue
account Repayment of
public debt 2010-11 23,739 19,920 24,546 17,963 5,624 2011-12 28,336 24,146 25,674 17,880 6,958 2012-13 21,842 21,366 26,733 17,398 7,919 2013-14 38,928 26,923 33,080 20,020 11,414 2014-15 (RE) 49,491 36,049 36,255 23,342 11,858 2015-16 (BE) 44,903 34,507 41,038 27,104 12,964
Source : Finance Department., GoM

59
Economic Survey of Maharashtra 2015-16
Economic Classification of Expenditure 5.17 Expenditure of the State budget is classified into significant economic categories on the basis of the guidelines given by CSO, GoI. According to economic classification of the budget 2015-16, consumption expenditure and expenditure on gross capital formation is expected to be ` 70,667 crore and ` 22,158 crore respectively, which is more by 19 per cent and 40 per cent respectively, over the previous year. The details of consumption expenditure and capital formation are given in Annexure 5.5. Deficit Trends 5.18 The expected fiscal deficit of 1.6 per cent of GSDP of the State for 2015-16 is well within the limit of three per cent of GSDP set by the FRBM (Fiscal Responsibility and Budgetary Management Act, 2005) and also well within the limit of 2.8 per cent of GSDP set by the 14th FC. 5.19 The 14th FC has recommended following limits for borrowing; additional to three per cent, if there is no revenue deficit in the year for which the borrowing limits are to be fixed and the preceding year:
If state’s Debt-GSDP ratio is less than or equal to 25 per cent in the previous year, it will be entitled for flexibility of 0.25 per cent over and above the annual limit of three per cent of GSDP in a given year.
If state’s interest payments are less than or equal to 10 per cent of revenue receipts in the preceding year, then state is eligible for an additional borrowing limit of 0.25 per cent of GSDP in a given year.
5.19.1 Either or both above options can be availed by a state either separately or simultaneously if any or both the criteria are fulfilled. Thus, state can avail maximum borrowing limit of 3.5 per cent in a year. 5.19.2 The 14th FC has laid down the consolidated fiscal reform path for states for the period 2015-16 to 2019-20 and the same is given in Table 5.8. Debt Position 5.20 The liabilities (debt stock) of the State comprise of accumulated unpaid loan and other liabilities on the government. The debt stock of the State 2015-16 is expected to increase by 10.1 per cent over the previous year. It is expected to reach to ` 3,33,160 crore in 2015-16 which is 16.9 per cent of GSDP, well within the limit (21.9 per cent) laid down by the 14th FC. The average cost of borrowing is expected to be 9.1 per cent for 2015-16. Debt stock and interest payments are given in Table 5.9. 5.21 Open market borrowings and securities from National Small Savings Fund contribute about 75 per cent to the debt stock. Internal debt of the State has reached to ` 2,55,740 crore (76.8 per cent of debt stock), of which open market borrowings are expected to be ` 1,72,612 crore. As per budget estimates, the overall internal debt is ` 34,507 crore of which expected open market borrowings are ` 28,542 crore. Out of this internal debt, ` 11,888 crore will be used for repayment of loans.
Table 5.8 Consolidated fiscal reform path for states
(per cent of GSDP$)
Year Limits
Fiscal deficit
Debt Stock
2015-16 2.8 21.9 2016-17 2.8 22.1 2017-18 2.8 22.2 2018-19 2.7 22.3 2019-20 2.7 22.4
$ at current price as per base year 2004-05 Source : 14th FC, GoI
Table 5.9 Debt stock and interest payments (` Crore)
Year Debt stock
Interest payments
Average cost of
borrowings$
2010-11 2,03,097 15,648 8.6 2011-12 2,25,976 17,505 8.6 2012-13 2,46,692 19,076 8.4 2013-14 2,69,355 21,207 8.6 2014-15 (RE) 3,02,578 24,283 9.0 2015-16 (BE) 3,33,160 27,663 9.1
$ Average cost of borrowings is the percentage of interest payment to the outstanding liabilities in preceding year Source: Finance Department, GoM

60
Economic Survey of Maharashtra 2015-16
State Plan Performance 5.22 The projected outlay for XII FYP is ` 2,75,000 crore which is 70.7 per cent more than that of XI FYP. Annual planwise outlay and expenditure are given in Table 5.10.
Annual Plan 2015-16 5.23 Annual plan outlay for 2015-16 is of ` 54,999 crore, of which district plan is of ` 7,128 crore. Sectorwise FYP and annual plan is given in Table 5.11.
Table 5.10 Annual planwise outlay and expenditure
(` Crore) Year Plan
Outlay# Plan
expenditure Percentage to outlay
2012-13 45,000 35,867 79.7 2013-14 49,000 38,048 77.6 2014-15 51,223 51,575$ 100.7 2015-16 54,999 -- --
# proposed outlay $ anticipated Source: Planning Department, GoM
Table 5.11 Sectorwise FYP and annual plan (` Crore)
Sector XII FYP Annual Plan
2013-14 actual
expenditure
Annual Plan 2014-15 Annual Plan
2015-16 Outlay
Outlay Share in outlay (per cent)
Outlay Anticipated expenditure
Agriculture and Allied Activities 21,917 8.0 3,657 4,440 5,087 4,700 Rural Development 9,089 3.3 1,423 1,259 2,809 1,605 Special Area Development 1,141 0.4 159 329 329 155 Irrigation and Flood Control 47,990 17.5 6,743 9,022 8,791 7,620 Energy 20,695 7.5 3,353 4,016 3,105 3,726 Industry and Minerals 2,175 0.8 158 410 425 404 Transport 33,855 12.3 5,261 5,537 4,920 6,876 Science, Technology & Environment 169 0.1 27 62 61 67
General Economic Services 3,364 1.2 832 724 636 911 Social & Community Services 1,22,776 44.6 15,212 22,209 20,337 23,349 General Services 10,989 4.0 980 2,407 1,377 4,111 Other Programmes 840 0.3 244 808 3,698 1,474 Total 2,75,000 100.0 38,048 51,223 51,575 54,999 Source : Planning Department, GoM Note : Figures may not tally due to rounding

61
Economic Survey of Maharashtra 2015-16
Plan and Non-plan Expenditure 5.24 Out of total expenditure, non-plan expenditure is 70.5 per cent for 2015-16. Share of non-plan revenue expenditure in total non-plan expenditure is expected to be 90.2 per cent for 2015-16. Plan and non-plan expenditure (including central grants) is given in Table 5.12.
Government Guarantees
5.25 The outstanding guarantees given by the State at the end of 2013-14 reached to ` 7,709 crore. The highest guarantee of 34.7 per cent was given to the Co-operation, Marketing & Textile Department followed by 16.7 per cent to Water supply & sanitation, 16.3 per cent to Public works, 13.2 per cent to Industry, Energy & Labour (Energy) and 10 per cent to Planning Department. Guarantees given by the government during 2013-14 are given in Table 5.13.
* * * * *
Table 5.12 Budgeted plan and non-plan expenditure (including central grants) (` Crore)
Year Plan expenditure Non-plan
expenditure Total
expenditure Revenue Capital Total 2010-11 17,185 16,071 33,256 97,749 1,31,005 2011-12 22,035 15,472 37,507 1,11,721 1,49,228 2012-13 24,568 15,755 40,323 1,25,146 1,65,469 2013-14 25,907 19,246 45,153 1,42,830 1,87,982 2014-15 (RE) 40,594 20,991 61,585 1,69,348 2,30,933 2015-16 (BE) 47,479 24,158 71,637 1,71,389 2,43,026
Source: Finance Department, GoM
Table 5.13 Guarantees given by the government during 2013-14 (` Crore)
Name of the department Outstanding at the
beginning of the year
Additional guarantees Deletion (other than invoked)
in the year
Invoked and
discharged during
the year
Outstanding at the end of the year
During the year
Due to loan received on
revolving gurantees and amount
changed due to revised interest rate
Agriculture & ADF 146.00 140.00 0.00 205.00 0.00 81.00 Industry, Energy & Labour (Industry) 13.94 0.00 0.00 0.53 0.00 13.41 Social Justice & Special Assistance 293.18 50.00 41.80 146.57 9.08 229.33 Urban development 200.83 0.00 0.30 0.00 0.00 201.13 Industry, Energy & Labour (Energy) 1,249.04 0.00 68.50 296.78 0.00 1,020.76 Water resources 155.09 0.00 0.00 56.73 0.00 98.36 Public works 1,329.14 0.00 0.00 75.35 0.00 1,253.79 Revenue & forest 2.13 0.00 0.00 2.13 0.00 0.00 Tribal development 29.4 0.00 11.30 6.42 0.00 34.28 Co-operation, Marketing & Textile 3,579.75 285.00 432.67 1,618.93 0.00 2,678.49 Rural development & water conservation
0.18 0.00 0.00 0.18 0.00 0.00
Water supply & sanitation 1,378.10 0.00 0.00 87.13 0.00 1,290.97 Minority development 27.93 15.00 0.00 3.33 0.00 39.60 Planning 983.48 0.00 0.00 215.29 0.00 768.19 Total 9,388.19 490.00 554.57 2,714.37 9.08 7,709.31 Source: Finance Department, GoM

Economic Survey of Maharashtra 2015-16
62ANNEXURE 5.1
BUDGET AT A GLANCE
(` crore)
Item 2009-10 2010-11 2011-12 2012-13 2013-14 2014-15# 2015-16## (1) (2) (3) (4) (5) (6) (7) (8)
1. Revenue Receipts (a + b) 86,910 1,05,868 1,21,286 1,42,947 1,49,822 1,80,794 1,98,231 a) Tax Revenue 67,354 86,447 1,00,952 1,18,640 1,25,228 1,36,615 1,59,697
b) Non-Tax Revenue 19,556 19,421 20,334 24,307 24,593 44,179 38,534
2. Revenue Expenditure 94,916 1,06,459 1,23,554 1,38,736 1,54,902 1,94,677 2,01,988 of which a) Interest Payments 14,838 15,648 17,505 19,076 21,207 24,283 27,663
b) Administrative Services 8,173 9,798 10,848 12,472 14,008 16,871 20,739
c) Pensions & Misc. gen. Services 6,229 8,957 10,581 11,649 13,163 14,620 18,502
3. Revenue Deficit (2 - 1) 8,006 591 2,268 (-)4,211 5,081 13,883 3,757
4. Capital Receipts 30,383 23,739 28,336 21,842 38,928 49,491 44,903 of which a) Recovery of loans 515 640 559 863 728 1,035 1,098
b) Other capital receipts 25 17 456 0 850 0 0
c) Borrowings & Other Liabilities
26,018 18,308 20,863 13,935 26,785 36,599 30,840
5. Capital Expenditure 22,865 24,546 25,674 26,733 33,080 36,255 41,038 6. Total Receipts (1 + 4) 1,17,293 1,29,607 1,49,623 1,64,789 1,88,749 2,30,285 2,43,133
7. Total Expenditure (2 + 5) 1,17,781 1,31,005 1,49,228 1,65,469 1,87,982 2,30,933 2,43,026 8. Appropriation to Contingency
Fund 350 850 500 875 0 0 0
9. Budgetary Deficit (7 – 6 – 8) 138 549 (-)894 (-)195 (-) 767 648 (-) 107 10 Fiscal Deficit (9 + 4 C) 26,156 18,857 19,969 13,740 26,018 37,246 30,733
As per cent of G.S.D.P. (base year = 2011-12)
1. Revenue Receipts (a + b) 10.8 10.2 9.5 9.9 9.1 10.1 10.1 a) Tax Revenue 8.0 7.9 7.9 8.2 7.6 7.6 8.1
b) Non - Tax Revenue 2.8 2.3 1.6 1.7 1.5 2.5 2.0
2. Revenue Expenditure 10.0 11.1 9.7 9.6 9.4 10.9 10.3 of which a) Interest Payments 1.7 1.7 1.4 1.3 1.3 1.4 1.4
b) Administrative Services 0.9 1.0 0.9 0.9 0.9 0.9 1.1
c) Pensions & Misc. gen. Services
0.7 0.7 0.8 0.8 0.8 0.8 0.9
3. Revenue Deficit (2 - 1 ) (-)0.7 0.9 0.2 (-) 0.3 0.3 0.8 0.2
4. Capital Receipts 2.5 3.6 2.2 1.5 2.4 2.8 2.3 of which a) Recovery of loans 0.1 0.1 0.0 0.1 0.0 0.1 0.1
b) Other capital receipts 0.0 0.0 0.0 0.0 0.1 0.0 0.0
c) Borrowings & Other Liabilities 1.9 3.0 1.6 1.0 1.6 2.0 1.6
5. Capital Expenditure 3.2 2.7 2.0 1.8 2.0 2.0 2.1
6. Total Receipts (1 + 4) 13.3 13.7 11.8 11.4 11.5 12.8 12.3
7. Total Expenditure ( 2+5 ) 13.3 13.8 11.7 11.4 11.4 12.9 12.3
8. Appropriation to the contingency fund 0.0 0.0 0.0 0.1 0.0 0.0 0.0
9. Budgetary Deficit (7 – 6 – 8) 0.0 0.0 (-) 0.1 0.0 0.0 0.0 0.0 10 Fiscal Deficit (9 + 4 C) 1.9 3.1 1.6 0.9 1.6 2.1 1.6
Source - Finance Department, GoM.
# Revised Estimates ## Budget Estimates
Note - 1. For 2009-10 and 2010-11, G.S.D.P. figures are as per base year 2004-05.
2. Figures may not add up to totals due to rounding.

Economic Survey of Maharashtra 2015-16
63ANNEXURE 5.2
BUDGET: TRENDS IN RECEIPTS ON REVENUE AND CAPITAL ACCOUNTS
(` crore)
Item 2009-10 2010-11 2011-12 2012-13 2013-14 2014-15# 2015-16## (1) (2) (3) (4) (5) (6) (7) (8)
(A) Total Revenue Receipts (1+2+3+4) 86,910 1,05,868 1,21,286 1,42,947 1,49,822 1,80,794 1,98,231 (1) State's own Tax Revenue (1 to 9) 59,106 75,028 87,648 1,03,448 1,08,641 1,19,008 1,30,635 (1) Sales Tax 32,676 42,483 50,596 60,080 62,530 69,090 74,617 (2) Stamps and Registration Fees 10,774 13,516 14,408 17,548 18,676 19,421 21,000 (3) State Excise Duties 5,057 5,962 8,606 9,297 10,101 11,500 13,500
(4) Taxes and Duties on Electricity
3,289 4,730 4,831 5,896 6,084 6,874 7,150
(5) Other Taxes on Income & Expenditure
1,612 1,686 1,830 1,961 2,165 2,138 2,309
(6) Taxes on Vehicles 2,682 3,533 4,137 5,027 5,096 5,244 5,694
(7) Other Taxes & Duties on Commodities & Services
1,325 1,423 1,702 1,874 1,659 1,770 2,015
(8) Tax on Goods and Passengers 977 600 574 691 1,241 1,098 1,150 (9) Land Revenue 714 1,095 964 1,074 1,089 1,873 3,200
(2) Non-Tax Revenue (1+2) 8,353 8,225 8,168 9,985 11,352 13,520 20,665 (1) Interest Receipts 1,342 1,422 1,359 2,465 3,934 2,974 2,974
(2) Other non-tax revenue 7,011 6,803 6,809 7,520 7,418 10,546 17,691
(3) Share in Central Taxes (1 to 6) 8,248 11,419 13,304 15,192 16,588 17,607 29,062
(1) Taxes on Income other than Corporation Tax
1,891 2,359 2,660 3,267 3,673 4,351 7,100
(2) Corporation Tax 3,394 4,463 5,236 5,457 5,578 5,834 9,617 (3) Taxes on Wealth 8 9 20 9 15 16 0 (4) Customs 1,154 1,997 2,307 2,525 2,706 2,897 4,464
(5) Union Excise Duties 930 1,452 1,493 1,716 1,911 1,750 2,903 (6) Service Tax 871 1,139 1,588 2,218 2,703 2,759 4,977 (4) Grants in Aid from Central
Government 11,203 11,196 12,166 14,322 13,241 30,659 17,869
(B) Total Capital Receipts (1+2+3+4) 30,383 23,739 28,336 21,842 38,928 49,491 44,903 (1) Receipts from Public Debts (a+ b) 21,564 20,740 24,453 22,117 27,887 39,122 39,052
(a) Internal Debt of the State Govt.
20,812 19,920 24,146 21,366 26,923 36,049 34,507
(b) Loans & Advances from Central Govt.
752 820 306 751 964 3,073 4,545
(2) Loans & Advances by the State Government (Recoveries).
515 640 559 863 728 1,035 1,098
(3) Other Capital Receipts. (net) ‡ 24 9 467 (-) 10 850 0 0
(4) Public Account (net) (a+b +c+d ) 8,280 2,350 2,858 (-) 1,128 9,463 9,334 4,753
(a) Small Savings, Provident Funds, etc. (net)
1,790 2,022 2,260 2,188 1,894 2,689 1,949
(b) Reserve Funds (net) (1+2) (-) 351 (-) 126 (-) 400 38 (-) 381 (-) 832 1,770 (1) Interest Bearing 51 106 114 (-) 141 (-) 80 (-) 664 (-) 1,806 (2) Non-interest Bearing (-) 402 (-) 232 (-) 513 179 (-) 301 (-) 168 75 (c) Civil Deposits (net) (1+2) 3,502 6,259 4,532 6,442 6,772 6,578 7,163 (1) Interest Bearing 1,899 3,946 3,737 4,264 4,590 4,152 4,352 (2) Non-interest Bearing 1,603 2,313 794 2,178 2,182 2,426 2,811
(d) Others 3,339 (-) 5,805 (-) 3,534 (-) 9,795 1,178 899 (-) 2,628
Total Receipts (A + B) 1,17,293 1,29,607 1,49,623 1,64,789 1,88,749 2,30,285 2,43,133
Source - Finance Department, GoM.
‡ It comprises of inter-state settlement (net), appropriations to the contingency fund (net) and contingency fund (net).
# Revised Estimates ## Budget Estimates
Note - Figures may not add up to totals due to rounding.

Economic Survey of Maharashtra 2015-16
64
ANNEXURE 5.3
BUDGET: TRENDS IN EXPENDITURE ON REVENUE AND CAPITAL ACCOUNTS (` crore)
Item 2009-10 2010-11 2011-12 2012-13 2013-14 2014-15# 2015-16##
(1) (2) (3) (4) (5) (6) (7) (8) (A) Revenue Expenditure (1+2) 94,916 1,06,459 1,23,554 1,38,736 1,54,902 1,94,677 2,01,988 (1) Development Expenditure (a+b+c) 62,845 68,755 80,701 91,070 1,00,923 1,31,072 1,28,105 (a) Social Services (1 to 8) 41,005 48,282 54,812 62,039 70,879 87,271 84,944 (1) Education, Sport, Art & Culture 22,208 26,944 29,879 33,857 38,238 41,490 45,495 (2) Health & Family Welfare 3,696 4,474 5,002 5,936 6,816 10,307 9,490
(3) Water Supply Sani. Housing and Urban Development
6,939 6,509 7,438 7,114 6,952 10,758 11,085
(4) Information & Broadcasting 40 47 47 57 68 169 90 (5) Welfare of SC, ST & OBC 4,145 4,518 5,117 6,417 7,951 9,026 10,243
(6) Labour and Labour Welfare 599 646 721 730 767 1,092 1,017 (7) Social Welfare and Nutrition 3,325 5,076 6,541 7,855 9,996 14,287 7,349 (8) Others 53 68 68 74 92 140 175
(b) Economic Services (1 to 9) 20,372 19,285 24,869 27,551 27,991 41,074 40,833 (1) Agriculture and Allied activities 6,460 5,636 6,145 7,218 7,821 9,478 8,614
(2) Rural Development 2,493 2,243 2,524 4,399 3,130 7,346 12,823 (3) Special Area Programme 28 59 44 48 33 45 5
(4) Irrigation and Flood control 2,340 2,522 2,701 2,574 2,742 2,688 2,848
(5) Energy 4,138 3,619 5,527 5,471 5,726 10,928 6,306 (6) Industry and Minerals. 998 870 2,546 2,600 2,549 2,995 3,720
(7) Transport and Communication 3,227 3,418 4,199 4,216 4,729 6,085 4,643
(8) Science, Technology & Environment
72 61 67 72 84 78 96
(9) General Economic Services 616 856 1,116 952 1,177 1,431 1,779
(c) Grants-in-Aid & contributions to Local Bodies & P.R. Institutions
1,468 1,188 1,020 1,481 2,053 2,728 2,328
(2) Non-Development Expenditure (a+b) 32,071 37,704 42,853 47,666 53,979 63,605 73,883 (a) General Services ( 1 to 5) 17,129 21,155 24,340 27,346 31,180 37,432 44,000 (1) Organs of State 1,149 1,088 1,249 1,266 1,435 2,848 1,985 (2) Collection Charges 1,486 1,221 1,570 1,853 2,371 2,878 2,498 (3) Administrative Services 8,173 9,798 10,848 12,472 14,008 16,871 20,739
(4) Pensions and Miscellaneous General Services
6,229 8,956 10,581 11,649 13,163 14,620 18,502
(5) Transfers to Reserve Funds 92 92 92 106 204 214 277
(b) Interest Payments & Debt Services 14,942 16,549 18,513 20,320 22,799 26,173 29,883
(B) Capital Expenditure (1+2) 22,865 24,546 25,674 26,733 33,080 36,255 41,038
(1) Development Expenditure (a+b) 18,690 18,922 18,716 18,814 21,666 24,398 28,074
(a) Capital Expenditure outside the Revenue Account
17,429 17,963 17,880 17,398 20,020 23,342 27,104
(b) Loans and Advances given by the State Government
1,261 959 836 1,416 1,645 1,055 970
(2) Non-Development Expenditure (a+b+c) (Repayment of Public debt) 4,175 5,624 6,958 7,919 11,414 11,858 12,964
(a) Internal Debt of the State Government
3,398 4,291 5,838 6,351 10,543 10,943 11,888
(b) Loans & Advances from Central Govt. 427 483 620 693 871 914 1,076
(c) Appropriation to the Contingency Fund 350 850 500 875 0 0 0 Total Expenditure (A + B) 1,17,781 1,31,005 1,49,228 1,65,469 1,87,982 2,30,933 2,43,026
Source – Finance Department, GoM. # Revised Estimates ## Budget Estimates
Note - Figures may not add upto totals due to rounding.

Economic Survey of Maharashtra 2015-16
65 ANNEXURE 5.4
BORROWINGS & OTHER LIABILITIES DURING THE YEAR
(` crore) Item 2009-10 2010-11 2011-12 2012-13 2013-14 2014-15# 2015-16## (1) (2) (3) (4) (5) (6) (7) (8)
I Debt Receipts (1+2+3) (bearing interest)
21,479 22,040 24,106 21,383 22,876 33,441 30,582
1) Internal Debt of the State Government (net) 17,414 15,629 18,308 15,015 16,379 25,106 22,619
2) Loans & Advances from Central Government (net)
325 337 (-) 314 58 94 2,159 3,469
3) Interest bearing obligations (a + b + c) 3,740 6,074 6,112 6,311 6,403 6,176 4,494
a) Provident Fund (net) 1,790 2,022 2,260 2,188 1,894 2,689 1,949
b) Reserve Fund (net) 51 106 114 (-) 141 (-) 80 (-) 644 (-) 1,806
c) Civil Deposites (net) 1,899 3,946 3,737 4,264 4,590 4,152 4,352
II Debt Receipts (1+2 ) (Not bearing interest)
4,539 (-) 3,732 (-) 3,242 (-) 7,448 3,909 3,158 258
1) Net receipts on Public Account @ 4,540 (-) 3,724 (-) 3,254 (-) 7,438 3,059 3,158 258
2) Other capital receipts (net)$
(-) 1 (-) 8 11 (-) 10 850 0 0
Total Borrowings & other Liabilities (I + II) 26,018 18,308 20,863 13,935 26,785 36,599 30,840
Source - Finance Department, GoM.
@ Net Receipts on Public Accounts consist of Reserve Funds, Deposits, Suspense & Misc. and Remittances Accounts. $ It comprises of the receipts of Inter-State Settlement (net), Appropriation to the Contingency Fund (net) and Contingency Fund (net)
# Revised Estimates ## Budget Estimates
Note - Figures may not add up to totals due to rounding.

Economic Survey of Maharashtra 2015-16
66
ANNEXURE 5.5
FINAL CONSUMPTION EXPENDITURE AND EXPENDITURE ON CAPITAL FORMATION OF GOVERNMENT
(` crore)
Particular 2009-10 2010-11 2011-12 2012-13 2013-14 2014-15# 2015-16##
(1) (2) (3) (4) (5) (6) (7) (8)
A. Consumption Expenditure
1. Compensation to Employees (1.1+1.2) 18,322 23,788 26,355 29,791 33,591 39,545 44,092
1.1 Wages & Salaries 12,915 14,898 15,761 17,607 19,780 23,316 25,796
1.2 Pension 5,407 8,890 10,594 12,185 13,811 16,229 18,296
2. Net Purchases of Commodities & Services (2.1+2.2-2.3)
9,992 11,735 14,041 13,437 14,434 19,848 26,574
2.1 Purchases 8,614 10,231 12,876 11,459 8,498 12,054 19,903
2.2 Maintenances 2,938 3,465 3,088 3,678 4,334 5,508 4,099
2.3 Sales 1,560 1,961 1,923 1,700 1,602 2,287 2,572
Total Consumption Expenditure 28,314 35,523 40,396 43,228 48,024 59,393 70,667
B. Expenditure on Capital Formation
1. Buildings 1,139 1,092 1,758 1,791 2,080 2,775 9,318
2. Roads & Bridges 2,974 2,347 2,742 2,841 4,210 3,822 3,849
3. Other Capital Outlay 2,448 2,897 3,477 3,870 2,527 8,182 7,858
4. Transport Equipments 63 171 55 144 120 170 121
5. Machinery & Equipment 704 472 454 546 550 879 1,009
6. Cultivated Assets 86 0 0 0 0 0 0
7. Animal Stock 0 0 0 0 0 0 0
8. Expenditure on New Capital Formation ( 1 to 7 )
7,414 6,979 8,485 9,193 9,487 15,828 22,155
9. Change in Stock (-) 7 (-) 2 2 2 3 4 4
10. Gross Capital Formation (8 + 9) 7,407 6,977 8,487 9,195 9,489 15,832 22,158
Source - Directorate of Economics & Statistics, GoM. # Revised Estimates ## Budget Estimates
Note - Figures may not add up to totals due to rounding.

6Institutional Finance & Capital Market

Economic Survey of Maharashtra 2015-16
6. INSTITUTIONAL FINANCE AND CAPITAL MARKET
6.1 Financial institutions provide financial support to all sections of society and also to infrastructure projects. Banks are prime financial institutions. Non-banking financial institutions provide variety of financial products & services. These institutions supplement the role of banking sector in meeting the increasing financial needs of the corporate sector.
Scheduled Commercial Banks 6.2 Scheduled Commercial Banks (SCBs) comprise of the State Bank of India (SBI) & its associated banks, nationalised banks, private banks, Regional Rural Banks (RRBs) and foreign banks. As on 31st March, 2015, of the total banking offices (11,284) of SCBs in the State, about 27 per cent were located in rural areas. Deposits and credit of SCBs in the State are given in Table 6.1 and its series is given in Annexure 6.1.
6.3 As on 31st March, 2015, of the total banking offices of SCBs in India, about nine per cent were functioning in the State. Population served per bank office was 10,390 in the State as against 10,070 at national level. The share of State in aggregate deposits and gross credit in India was about 24 per cent and 28.7 per cent respectively. The Credit-Deposit (CD) ratio of the State was 92.6 per cent, whereas that of All-India was 77.4 per cent. 6.4 As on 31st March, 2015, the share of nationalised banks including SBI and its associates in the aggregate deposits and credit of SCBs in the State, was about 65 per cent and 66 per cent respectively. Per capita deposits and per capita credit of SCBs in the State were ` 1,81,988 and ` 1,68,541 respectively. The corresponding figures for All-India were ` 70,151 and ` 54,291. CD ratio of SBI and its associates was highest (132.9 per cent). Deposits and credit of SCBs in the State according to bank group are given in Table 6.2.
Table 6.1 Deposits and credit of SCBs in the State (as on 31st March)
Particulars 2014 2015 Per cent change of total over
previous year Rural Semi-
urban Urban Total
Rural Semi-urban Urban Total
No. of banking offices
2,855 2,307 5,478 10,640 3,093 2,462 5,729 11,284 6.1
Deposits (` '000 crore)
48.1 85.3 1,919.1 2,052.4 56.2 95.7 1,981.8 2,133.7 4.0
Credit (` '000 crore)
39.0 51.5 1,722.6 1,813.5 44.6 60.5 1,871.0 1,976.1 9.0
CD Ratio (per cent)
81.1 60.4 89.8 88.4 79.3 63.2 94.4 92.6 --
Source: RBI

Economic Survey of Maharashtra 2015-16
68
6.5 In the State, current, savings and term deposit accounts in SCBs increased by about 42 per cent, 16 per cent and 11 per cent respectively in 2014. Total amount of term deposits has increased by about 15 per cent in 2014. Deposits of SCBs in the State according to type of account are given in Table 6.3. Table 6.3 Deposits of SCBs in the State according to type of account
(as on 31st March) Type of account
2013 2014 No. of accounts
('000) Deposits
(` '000 crore) No. of accounts ('000)
Deposits (` '000 crore)
Current 4,242 205.7 6,009 218.0 Savings 91,850 233.1 1,06,572 263.1 Term deposit 21,239 1,340.1 23,481 1,547.7 Total 1,17,331 1,778.9 1,36,062 2,028.8
Source: RBI
6.6 RBI has directed all SCBs to provide advances to priority sector. Of the total advances given by SCBs in the State to priority sector, maximum (40 per cent) advances were outstanding towards ‘agriculture & allied activities’ sector followed by micro, small & medium enterprises (MSME) (31.7 per cent) at the end of March, 2015. Distribution of outstanding advances given by SCBs in the State to priority sector is given in Table 6.4.
Table 6.2 Bank groupwise deposits and credit of SCBs in the State (as on 31st March)
Bank Group 2014 2015 No. of
banking offices
Deposits (` '000 crore)
Credit (` '000 crore)
CD Ratio (per cent)
No. of banking offices
Deposits (` '000 crore)
Credit (` '000 crore)
CD Ratio (per cent)
SBI and its associates 1,780 251.6 326.3 129.7 1,873 255.3 339.2 132.9 Nationalised banks 6,058 1,128.7 917.6 81.3 6,389 1,137.0 961.0 84.5 Foreign banks 87 203.4 123.8 60.9 95 225.5 147.5 65.4 RRBs 680 7.2 5.0 69.4 699 8.4 5.9 70.7 Private banks 2,035 461.7 440.4 95.4 2,228 507.6 522.4 102.9 Total 10,640 2,052.6 1,813.1 88.4 11,284 2,133.7 1,976.1 92.6 Source: RBI
Table 6.4 Distribution of outstanding advances given by SCBs in the State to priority sector (as on 31st March)
Priority Sector 2014 2015 No. of
accounts ('000)
Amount outstanding (` '000 crore)
No. of
accounts ('000)
Amount outstanding (` '000 crore)
Agriculture & allied activities 4,001 175.0 4,511 176.8 Micro & Small Enterprises 1,509 134.6 1,653 140.0 Education 179 4.1 189 4.5 Housing 919 88.1 949 88.4 Others 196 20.1 248 12.0 Exports 1 17.1 1 22.8 Total 6,805 439.0 7,551 444.5 SHGs/JLGs 247 2.4 374 1.4 Source : RBI SHG-Self Help Group JLG -Joint Liability Group

Economic Survey of Maharashtra 2015-16
69
6.7 Total outstanding credit of SCBs in the State increased by about 15 per cent in 2014. Of the total outstanding credit, about 55 per cent was from nationalised banks (excluding SBI and its associates). Outstanding credit of SCBs in the State is given in Table 6.5.
6.8 As on 31st March, 2015, the maximum (27.7 per cent) outstanding credit of SCBs in the State was towards manufacturing and processing units. The percentage of outstanding credit towards personal loans was 13.8 and that of construction sector was 11.8. Sectorwise outstanding credit of SCBs in the State is given in Table 6.6.
Annual Credit Plan 6.9 RBI has adopted ‘Service Area Approach’ for making credit available in every village with district as the unit of service area. Accordingly, Annual Credit Plan of the State is prepared and monitored by the convener bank of State Level Bankers Committee (SLBC). Bank of Maharashtra (Lead bank) is designated as the convener bank for the State. Annual credit plan size for priority sector of the State for 2015-16 is ` 1.87 lakh crore. In this plan, the share of ‘Agriculture & allied activities’ is 36 per cent and that of ‘Rural artisans, village & cottage industries and SSI’ sector is 53 per cent. The credit disbursement to priority sector in the State under annual credit plan is given in Table 6.7 and districtwise annual credit plan is given in Annexure 6.2.
Table 6.7 Credit disbursement to priority sector in the State under annual credit plan (` '000 crore)
Priority Sector 2014-15 2015-16 Target
Achieve-
ment Percentage
of achievement
to target
Benefi-ciaries (lakh)
Target
Achieve-ment+
Percentage of
achievement to target
Benefi-ciaries+
(lakh)
Agriculture & allied activities
57.3 56.0 97.7 49.7 66.7 42.4 63.6 41.0
Rural artisans, village & cottage industries and SSI
77.2 84.6 109.6 8.9 98.7 61.9 62.7 6.2
Other sectors 22.8 5.5 24.1 1.8 21.2 11.1 52.9 5.2 Total 157.3 146.1 92.9 60.4 186.6 115.4 61.8 52.4 Source : Bank of Maharashtra, Convener, State Level Bankers Committee , + upto September
Table 6.5 Outstanding credit of SCBs in the State (as on 31st March)
Bank group Outstanding credit ( ` '000 crore)
Per cent change over
previous year 2013 2014
SBI and its associate banks 282.1 325.0 15.2 Nationalised banks 798.6 913.2 14.4 Foreign banks 97.5 110.6 13.4 RRBs 4.5 5.0 11.1 Private banks 255.3 295.8 15.9 Total 1,438.0 1,649.6 14.7 Source : RBI
Table 6.6 Sectorwise outstanding credit of SCBs in the State
(as on 31st March) Sector Amount outstanding
(` '000 crore) Per cent
change over previous year 2014 2015
Agriculture & allied activities 73.7 76.6 3.9 Mining & Quarrying 20.1 20.0 (-) 0.5 Manufacturing 521.5 527.6 1.2 Electricity, Gas & Water Supply 81.6 95.5 17.0 Construction 191.0 224.1 17.3 Transport 60.1 64.7 7.7 Professional & other services 162.1 166.2 2.5 Trade 152.8 177.9 16.4 Personal loans 233.6 262.2 20.4 Others@ 319.7 356.5 11.5 Total 1,816.3 1,904.3 4.8 Source : RBI @ Includes Personal loans other than Housing

Economic Survey of Maharashtra 2015-16
70
Micro Finance 6.10 Micro finance is one of the effective programmes for eliminating poverty and empowerment of poor. Financial services such as loans, savings, money transfers, insurance, etc. are covered under it. ‘Self Help Group (SHG) Bank Linkage Programme’ launched by NABARD helps to promote financial transactions between the formal rural banking system with the informal SHGs. As on 31st March, 2015 in the total savings by all SHGs, about 87 per cent share was of SHGs exclusively for women. The average outstanding loan per SHG with banks was ` 75,705 as against ` 64,606 in the previous year. Savings, loans disbursed and loans outstanding of SHGs in the State are given in Table 6.8.
Financial Inclusion 6.11 Financial Inclusion is about extending basic financial services viz. savings, credit, payment & remittance facilities and insurance services to the disadvantaged sections of the society and low income groups at a cost within their means. In order to ensure financial inclusion, various initiatives were taken up by GoI and RBI. Under Pradhan Mantri Jan-Dhan Yojana (PMJDY), as on 3rd February, 2016, total 1.35 crore accounts were opened in the State with deposits of ` 1,863.06 crore. Overdraft facility upto ` 5,000 is made available to accounts based on their savings/credit history of atleast six months after account opening. Out of total no-frill accounts opened upto March 2015, 2.1 per cent accounts availed this facility. As on 3rd February, 2016, the number of ‘RuPay cards’ issued has reached to 1.14 crore. Details of various banking facilities provided under financial inclusion by SCBs in the State are given in Table 6.9.
Table 6.8 Savings, loans disbursed and loans outstanding of SHGs in the State (as on 31st March, 2015)
Type of Bank Particulars Total SHGs Out of total
SHGs under NRLM/SGSY#
Exclusive women SHGs
No. Amount (` crore) No. Amount
(` crore) No. Amount (` crore)
Co-operative Total 3,50,760 683.58 45,693 114.01 3,13,672 257.48
Savings 2,93,679 453.53 39,062 53.14 2,61,777 432.96 Loans disbursed@ 14,886 96.45 2,459 19.70 14,640 93.01 Loans outstanding 42,195 133.60 4,172 41.17 37,255 121.51
Regional rural Total 1,60,648 541.85 27,538 85.74 1,38,150 481.22
Savings 1,15,329 156.64 18,627 16.85 99,889 135.11 Loans disbursed@ 9,467 115.07 1,958 22.03 8,512 106.39 Loans outstanding 35,852 270.14 6,953 46.86 29,749 239.72 Private commercial Total 1,43,172 1,064.12 37 0.18 1,43,039 1,063.61
Savings 60,845 60.11 11 0.00 60,724 59.90 Loans disbursed@ 32,205 452.71 0 0.00 32,201 452.58 Loans outstanding 50,122 551.30 26 0.18 50,114 551.13
Public commercial Total 3,39,924 1,037.61 1,62,151 340.48 2,61,666 772.32
Savings 2,48,007 233.53 1,30,282 68.22 1,92,598 162.50 Loans disbursed@ 17,614 226.30 7,165 83.84 13,282 176.38 Loans outstanding 74,303 577.78 24,704 188.42 55,786 433.44
Source: NABARD # NRLM – National Rural Livelihood Mission, SGSY- Swarnajayanti Gram Swarozgar Yojana @ 2014-15

Economic Survey of Maharashtra 2015-16
71
Table 6.9 Banking facilities provided under financial inclusion by SCBs in the State (as on 31st March)
Particulars 2014 2015 Total number of banking outlets in villages 21,215 33,600 No-Frill accounts Number (‘000) 14,962 26,644 Amount (` crore) 1,634.9 2,716.8 Overdraft availed in No-Frill Accounts Amount (` crore) 58.1 140.2 Kisan Credit Card Number (‘000) 2,759 2,953 Outstanding amount (` crore) 23,159.0 28,497.8 Source : RBI
6.12 GoI has lauched Pradhan Mantri MUDRA Yojana on 8th April, 2015. Under the scheme, hassle-free loans upto ` 10 lakh are provided to all non-farm micro & small enterprises engaged in income-generating activities. Loans under the scheme are catogorised as ‘Shishu’ (upto ` 50,000), ‘Kishore’ (` 50,000 - ` 5 lakh) and ‘Tarun’ (` 5 lakh - ` 10 lakh) according to the development stage/credit needs of the beneficiary units. Since inception upto 19th February, 2016 total loans of ` 9,776 crore were disbursed to about 26.4 lakh beneficiaries (about 24.9 lakh under ‘Shishu’, about 1.2 lakh under ‘Kishore’ and about 0.3 lakh under ‘Tarun’). Rural Infrastructure Development Fund 6.13 The GoI has created Rural Infrastructure Development Fund (RIDF) in NABARD to provide loans at low cost to state governments for development of rural infrastructure. There are 34 activities covered under RIDF which are classified into three broad categories viz. agriculture & allied activities, social sector and rural connectivity. Projects under these activities are eligible for loans upto 95 per cent, 85 per cent and 80 per cent of project cost respectively. Under RIDF, upto March, 2015, ` 8,125 crore loan has been disbursed. Projects sanctioned and loans disbursed under RIDF in the State are given in Table 6.10. Joint Stock Companies 6.14 Joint stock companies promote various ancillary industries, trade and ancillaries to trade. As on 31st March, 2015, of the total 10,15,601 joint stock companies in India, about 21 per cent were functioning in the State. The share of these companies in the State in total paid-up capital was about 23 per cent. Paid-up capital of joint stock companies in the State is given in Table 6.11.
Table 6.10 Projects sanctioned and loans disbursed under RIDF in the State
(` crore) Tranche Year Number of
projects sanctioned
Loans disbursed
XVIII 2012-13 827 289 XIX 2013-14 645 260 XX 2014-15 818 158 XXI 2015-16 261 0
Source: NABARD
Table 6.11 Paid-up capital of joint stock companies in the State (as on 31st March)
Item 2014 2015* Maharashtra India Maharashtra India
No. of companies
Paid-up capital (`'000
crore)
No. of companies
Paid-up capital (` '000 crore)
No. of companies
Paid-up capital (` '000 crore)
No. of companies
Paid-up capital (` '000 crore)
Private 1,57,105 192.8 7,91,831 785.4 2,02,196 211.3 9,52,490 874.3 Public 10,819 299.3 59,418 1,332.8 11,361 327.4 63,111 1,421.7
Total 1,67,924 492.1 8,51,249 2,118.2 2,13,557 538.7 10,15,601 2,296.0
Source: Ministry of Corporate Affairs, GoI * Provisional

Economic Survey of Maharashtra 2015-16
72
Capital market 6.15 Capital market is a mechanism through which the savings are channelised into effective long-term investments. Bombay Stock Exchange (BSE) and National Stock Exchange (NSE) are the major stock exchanges functioning in the State. Apart from that, there are five other stock exchanges functioning in the State viz. OTC Exchange of India, Inter-Connected Stock Exchange of India Ltd., United Stock Exchange of India Ltd., Pune Stock Exchange Ltd. and MCX Stock Exchange Ltd.
Primary market 6.15.1 During 2014-15, the amount raised through 26 issues in the State (20 public and six rights) was ` 5,605 crore as against ` 4,560 crore in the previous year raised through 16 issues (11 public and five rights). During 2015-16, upto November an amount of ` 10,296 crore was raised in the State through 19 issues (13 public and six rights).
Secondary market 6.15.2 The market capitalisation of equity shares of NSE and BSE available for trading on Indian bourses during 2014-15 was ` 99,30,122 crore and ` 1,01,49,290 crore respectively. The corresponding figures during 2013-14 were ` 72,77,720 crore and ` 74,15,296 crore respectively. Turnover of NSE and BSE are given in Table 6.12.
Mutual funds 6.15.3 Mutual fund is an investment tool that allows several investors to pool their resources for purchasing stocks, goods and other securities. During 2014-15, net amount mobilised by mutual funds in the State was ` 53,884 crore as against ` 1,03,433 crore in India. The amount mobilised through mutual funds is given in Table 6.13.
Commodity market
6.15.4 Three multi commodity exchanges viz. Multi Commodity Exchange of India Ltd. (MCX), National Commodity and Derivatives Exchange Ltd. (NCDEX) and National Multi-Commodity Exchange of India Ltd. (NMCE) are functioning to facilitate retail investors. Turnover of MCX and NCDEX are given in Table 6.14.
Table 6.12 Turnover of NSE and BSE (` '000 crore)
Stock Exchange 2014-15 2015-16+
NSE 4,330 2,847
BSE 855 492 Source: SEBI + upto November
Table 6.13 Amount mobilised through mutual funds (` '000 crore)
Year New Fund Offers Existing MFs
2013-14 136.3 9,632.1
2014-15 59.0 11,027.3
2015-16+ 21.3 7,910.6 Source: Association of Mutual Funds in India (AMFI) + upto October
Table 6.14 Turnover of MCX and NCDEX (` '000 crore)
Commoditiy Exchange
No. of commodities included
Turnover
2013-14 2014-15 2013-14 2014-15 MCX 35 29 17,223 10,367
NCDEX 27 28 1,146 904 Source : MCX and NCDEX

Economic Survey of Maharashtra 2015-16
73
Insurance 6.16 Insurance provides a safety net to enterprises & individuals and generates long term funds which are used for development purpose. There are 24 life insurance companies. The share of LIC in total underwritten business of life insurance in the State during 2014-15 was 68.8 per cent as against 72.3 per cent in the previous year. New individual life insurance policies underwritten are given in Table 6.15.
6.17 There are 28 non-life insurance companies, of which six are in public sector. During 2014-15, there was 8.7 per cent rise in gross direct premium undertaken by non-life insurance. Among non-life insurance, health insurance (30 per cent) reported highest premium collection, followed by motor -own damage (17 per cent). Sectorwise gross direct premium income of non-life insurance in the State is given in Table 6.16.
* * * * *
Table 6.15 New individual life insurance policies underwritten (` crore)
Particulars 2013-14 2014-15
No. ('000) Premium No. ('000) Premium
Maharashtra Private 1,006 3,222 940 9,184
LIC 4,261 8,416 2,476 20,287
Total 5,267 11,638 3,416 29,471
India Private 6,355 19,179 5,737 34,820
LIC 34,480 41,778 20,171 78,508
Total 40,835 60,957 25,908 1,13,328 Source: Insurance Regulatory Development Authority (IRDA)
Table 6.16 Sectorwise gross direct premium income of non-life insurance in the State
(` crore) Year Fire Marine Engi-
neering Motor Liabi-
lity insu-rance
Personal accident
Health insu-rance
Crop insu-rance
Miscell-aneous#
Grand total
Cargo Hull Own damage
Third party
2013-14 2,006 578 810 564 2,869 2,240 516 629 5,519 227 1,827 17,785
2014-15 1,952 545 697 464 3,282 1,098 517 718 5,842 2,306 1,920 19,341
Source : Insurance Regulatory Development Authority (IRDA ) # includes credit insurance, overseas mediclaim, etc.

Economic Survey of Maharashtra 2015-16
74ANNEXURE 6.1
DEPOSITS AND CREDIT OF ALL SCHEDULED COMMERCIAL BANKS
(` crore)
Year
Position as on last Friday of June of the year Total
deposits Total credit Rural Semi-Urban Urban/Metropolitan
Deposits Credit Deposits Credit Deposits Credit (1) (2) (3) (4) (5) (6) (7) (8) (9)
1971 NA. N.A. N.A. N.A. N.A. N.A. 1,460 1,291†
1981 309 226 714 384 6,568 5,321 7,590 5,931
1991 1,701 1,357 2,347 1,354 36,181 26,936 40,230 29,647
2001 6,769 5,029 10,034 4,138 1,59,199 1,34,340 1,76,001 1,43,507
2006 12,411 11,609 21,705 14,111 6,51,423 6,08,006 6,85,538 6,33,725
2010 23,555 17,437 40,526 21,878 11,03,423 9,53,799 11,67,504 9,93,114
2011 29,231 22,703 49,174 27,604 13,25,550 11,25,780 14,03,955 11,76,087
2012 34,454 26,712 58,586 31,829 15,00,654 13,29,287 15,93,694 13,87,827
2013# 41,119 31,527 70,052 41,135 16,73,872 15,03,827 17,85,043 15,76,490
2014# 48,115 39,009 85,322 51,510 19,19,090 17,22,604 20,52,527 18,13,123
2015# 56,214 44,578 95,688 60,479 19,81,815 18,71,000 21,33,718 19,76,057
Year Per Capita deposit (`)
Per Capita Credit (`)
No. of banking offices Number of banking offices
per lakh population
Rural and Semi- Urban
Urban/ Metropolitan
Total
(1) (10) (11) (12) (13) (14) (15)
1971 290 256 N.A. N.A. 1,471 2.9
1981 1,204 940 N.A. N.A. 3,627 5.8
1991 5,344 3,580 3,353 2,238 5,591 7.4
2001 18,106 14,763 3,380 2,914 6,294 6.5
2006 64,117 59,217 3,295 3,425 6,720 6.3
2010 1,04,571 88,978 3,718 4,319 8,037 7.2
2011 1,24,048 1,03,911 3,902 4,613 8,515 7.5
2012 1,39,572 1,21,543 4,196 4,857 9,053 7.9
2013# 1,54,286 1,36,260 4,585 5,189 9,774 8.5
2014# 1,75,147 1,54,718 5,162 5,478 10,640 9.1
2015# 1,81,988 1,68,541 5,555 5,729 11,284 9.6
Source - Reserve Bank of India † Data relate to the second Friday of June, 1971 # As on 31st March N.A. Not Available Note - Details may not add up to due to rounding .

Economic Survey of Maharashtra 2015-16
75
ANNEXURE 6.2
DISTRICTWISE ANNUAL CREDIT PLAN (2015-16)
(` crore)
Sr.
No. District
Priority Sector
NPS Total Plan Agriculture & allied activities
NFS OPS Total Total credit
Of which, crop loan
(1) (2) (3) (4) (5) (6) (7) (8) (9)
1 Mumbai City 4,021 0 46,797 3,599 54,416 1,14,450 1,68,866
2 Mumbai Suburban 85 0 16,000 1,250 17,335 33,750 51,085
3 Thane 373 210 3,649 1,340 5,362 1,579 6,941
4 Palghar 380 200 767 369 1,516 298 1,814
5 Raigad 323 150 1,117 35 1,475 664 2,139
6 Ratnagiri 653 329 548 522 1,722 305 2,027
7 Sindhudurg 424 220 500 46 970 368 1,338
8 Nashik 4,379 2,632 2,623 861 7,862 642 8,504
9 Dhule 1,442 989 318 256 2,015 100 2,115
10 Nandurbar 690 590 183 45 918 82 1,000
11 Jalgaon 3,155 2,511 1,365 270 4,789 139 4,928
12 Ahmednagar 4,652 3,068 895 1,746 7,293 908 8,200
13 Pune 4,956 2,752 10,757 5,817 21,530 6,089 27,619
14 Satara 3,234 1,999 1,087 830 5,150 650 5,800
15 Sangli 3,100 1,567 442 557 4,099 584 4,683
16 Solapur 7,000 5,000 2,500 100 9,600 400 10,000
17 Kolhapur 2,517 1,788 2,155 367 5,040 1,645 6,685
18 Aurangabad 1,569 1,097 1,663 988 4,220 843 5,062
19 Jalna 1,329 1,097 467 179 1,975 103 2,078
20 Parbhani 1,570 1,342 327 82 1,979 150 2,129
21 Hingoli 926 791 48 97 1,070 50 1,120
22 Beed 2,069 1,806 172 343 2,585 0 2,585
23 Nanded 1,837 1,553 418 53 2,308 0 2,308
24 Osmanabad 1,710 1,131 490 139 2,339 0 2,339
25 Latur 1,559 1,258 584 208 2,351 337 2,688
26 Buldhana 1,550 1,325 220 50 1,820 87 1,907
27 Akola 1,211 922 184 394 1,790 175 1,965
28 Washim 1,080 888 232 0 1,312 46 1,358
29 Amravati 2,421 2,063 337 161 2,918 173 3,091
30 Yavatmal 2,149 1,704 355 324 2,828 262 3,090
31 Wardha 952 605 229 0 1,181 136 1,317
32 Nagpur 1,453 1073 304 0 1,757 462 2,219
33 Bhandara 547 521 255 44 845 159 1,004
34 Gondia 327 247 136 42 504 67 572
35 Chandrapur 859 689 457 40 1,356 144 1,500
36 Gadchiroli 249 200 141 0 390 16 406
Maharashtra 66,748 44,319 98,721 21,151 1,86,620 1,65,862 3,52,481
Source - SLBC, Bank of Maharashtra NFS - Non Farm Sector, OPS - Other Priority Sector, NPS - Non Priority Sector
Note - Details may not add up to due to rounding.

7Agriculture and Allied Activities

Economic Survey of Manharashtra २०१५-१६
7. AGRICULTURE AND ALLIED ACTIVITIES
7.1 The agriculture sector has always remained a focal point of our economy. It embodies the three thrust areas viz. promotion of inclusive growth, enhancement in rural income and sustenance of food security. Since 1960, after the ‘green revolution’, the country has not witnessed any major technological breakthrough in agriculture. The food safety net for the millions of citizens requires enhanced agricultural production and productivity with special attention towards pulses, oilseeds, fruits and vegetables which are essential for nutritional security. Various schemes are being implemented to improve performance in agriculture. 7.1.1 Timely availability of water is the most critical element in raising the yields. Various schemes are being implemented to increase area under irrigation and also to improve existing irrigation system. GoM has launched an ambitious project viz. ‘Jalyukta Shivar Abhiyaan’ to make the State ‘a drought-free state by 2019’. Drip irrigation is also being promoted, especially for sugarcane, to face severe water scarcity. 7.1.2 Agricultural credit is one of the inputs for improving production & productivity and reducing farmers’ distress. The GoI is aiming to cover about 50 per cent of farmers in the next two-three years through the ambitious crop insurance scheme viz. ‘Prime Minister Fasal Bima Yojana’. The crop insurance schemes are useful to overcome the uncertainties in agriculture.
Monsoon 2015 7.2 Monsoon arrived on 8th June, 2015 in Ratnagiri and Sindhudurg districts of Konkan region and by 14th June, 2015 it reached all over the State. During June, July, August, September and October, the State received 103.5 per cent, 32.3 per cent, 54.9 per cent, 74.7 per cent and 49.9 per cent rainfall respectively as compared to the normal. Total rainfall in the State during 2015 was deficient (59.4 per cent of the normal). The agriculture department of GoM records rainfall data in all 355 talukas excluding those in Mumbai city & Mumbai Suburban districts. Out of 355 talukas in the State, 278 talukas received deficient rainfall, 75 talukas received normal and 2 talukas (Akole and Mahabaleshwar) received excess rainfall. The classification of districts and talukas according to broad category of rainfall received is given in Table 7.1 and monthwise classification of talukas according to rainfall received is given in Table 7.2.
Table 7.1 Classification of districts & talukas according to broad category of rainfall received
Broad category of rainfall (percentage to normal)
No. of districts# No. of talukas# 2013 2014 2015 2013 2014 2015
Excess (120 & more) 18 0 0 186 17 2
Normal (80 - 120) 15 10 5 153 112 75
Deficient (40 - 80) 0 23 28 16 213 254
Scanty (0 - 40) 0 0 1 0 13 24 # Excluding Mumbai City & Mumbai Suburban districts and talukas therein Source : Commissionerate of Agriculture, GoM
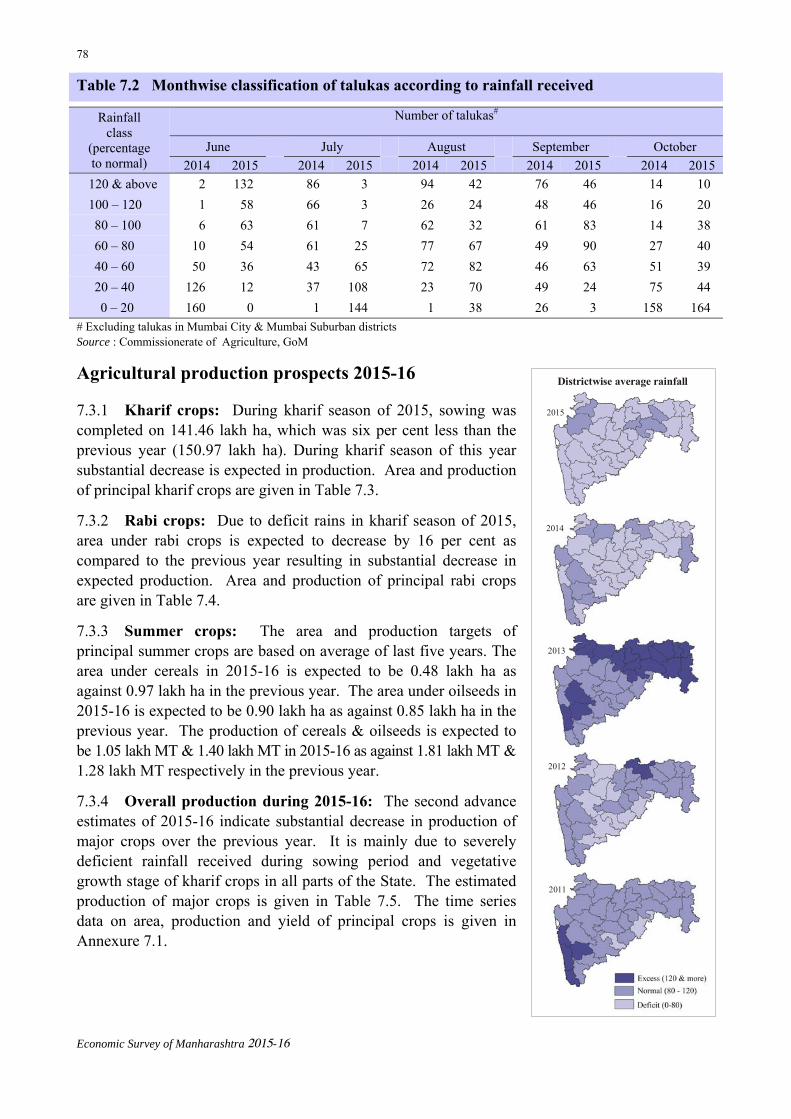
Economic Survey of Manharashtra २०१५-१६
78
Districtwise average rainfall
2015
2014
2013
2012
2011
Agricultural production prospects 2015-16
7.3.1 Kharif crops: During kharif season of 2015, sowing was completed on 141.46 lakh ha, which was six per cent less than the previous year (150.97 lakh ha). During kharif season of this year substantial decrease is expected in production. Area and production of principal kharif crops are given in Table 7.3.
7.3.2 Rabi crops: Due to deficit rains in kharif season of 2015, area under rabi crops is expected to decrease by 16 per cent as compared to the previous year resulting in substantial decrease in expected production. Area and production of principal rabi crops are given in Table 7.4.
7.3.3 Summer crops: The area and production targets of principal summer crops are based on average of last five years. The area under cereals in 2015-16 is expected to be 0.48 lakh ha as against 0.97 lakh ha in the previous year. The area under oilseeds in 2015-16 is expected to be 0.90 lakh ha as against 0.85 lakh ha in the previous year. The production of cereals & oilseeds is expected to be 1.05 lakh MT & 1.40 lakh MT in 2015-16 as against 1.81 lakh MT & 1.28 lakh MT respectively in the previous year.
7.3.4 Overall production during 2015-16: The second advance estimates of 2015-16 indicate substantial decrease in production of major crops over the previous year. It is mainly due to severely deficient rainfall received during sowing period and vegetative growth stage of kharif crops in all parts of the State. The estimated production of major crops is given in Table 7.5. The time series data on area, production and yield of principal crops is given in Annexure 7.1.
Table 7.2 Monthwise classification of talukas according to rainfall received
Rainfall class
(percentage to normal)
Number of talukas#
June July August September October 2014 2015 2014 2015 2014 2015 2014 2015 2014 2015
120 & above 2 132 86 3 94 42 76 46 14 10 100 – 120 1 58 66 3 26 24 48 46 16 20 80 – 100 6 63 61 7 62 32 61 83 14 38 60 – 80 10 54 61 25 77 67 49 90 27 40 40 – 60 50 36 43 65 72 82 46 63 51 39 20 – 40 126 12 37 108 23 70 49 24 75 44 0 – 20 160 0 1 144 1 38 26 3 158 164
# Excluding talukas in Mumbai City & Mumbai Suburban districts Source : Commissionerate of Agriculture, GoM

Economic Survey of Manharashtra २०१५-१६
79
Table 7.3 Area and production of principal kharif crops
Crop Area ('000 ha) Production ('000 MT)
2014-15
2015-16 (Tentative)
Per cent change
2014-15
2015-16 (Tentative)
Per cent change
Rice 1,508 1,497 (-) 1 2,835 2,548 (-)10 Jowar 680 441 (-)35 585 314 (-)46 Bajra 865 639 (-)26 538 304 (-)43 Ragi 112 97 (-)13 119 94 (-)21 Maize 801 766 (-) 4 1,496 1,184 (-)21 Other cereals 64 48 (-)25 24 16 (-)33 Total cereals 4,030 3,488 (-)13 5,597 4,460 (-)20 Tur 1,210 1,039 (-)14 353 407 15 Moong 315 385 22 84 74 (-)12 Udid 277 280 1 92 59 (-)36 Other pulses 77 118 53 29 36 24 Total pulses 1,879 1,822 (-) 3 558 576 3 Total foodgrains 5,909 5,310 (-)10 6,155 5,036 (-)18 Soyabean 3,640 3,774 4 1,821 1,853 2 Groundnut 244 186 (-)24 253 189 (-)25 Sesamum 20 21 5 4 3 (-)25 Nigerseed 16 14 (-)13 3 3 0 Sunflower 32 12 (-)63 10 2 (-)80 Other oilseeds 17 11 (-)35 4 2 (-)50 Total oilseeds 3,969 4,018 1 2,095 2,052 (-)2 Cotton (Lint)@ 4,190 3,827 (-) 9 3,577 4,202 17 Sugarcane** 1,030 987 (-) 4 91,538 72,089 (-)21 Total 15,098 14,146 (-) 6 -- -- --
Source : Commissionerate of Agriculture, GoM @ Production of cotton in '000 bales of 170 kg each ** Harvested area
Table 7.4 Area and production of principal rabi crops
Crop
Area ('000 ha) Production ('000 MT) 2014-15
2015-16
(tentative) Per cent change
2014-15
2015-16 (tentative)
Per cent change
Jowar 2,608 2,322 (-)11 1,524 1,383 (-)9 Wheat 1,067 593 (-)44 1,308 720 (-)45 Maize 240 210 (-)12 652 336 (-)48 Other cereals 17 15 (-)14 6 4 (-)33 Total cereals 3,932 3,140 (-)20 3,490 2,443 (-)30 Gram 1,427 1,404 (-)2 1,088 873 (-)20 Other pulses 103 82 (-)20 34 37 10 Total pulses 1,530 1,486 (-)3 1,122 911 (-)19 Total foodgrains 5,462 4,626 (-)15 4,612 3,353 (-)27 Sesamum 1 1 94 0.2 0.4 110 Safflower 74 47 (-)36 26 15 (-)42 Sunflower 48 17 (-)65 21 7 (-)67 Linseed 24 16 (-)35 5 4 (-)30 Rapeseed & mustard 10 7 (-)24 2 1 (-)33 Total oilseeds 157 88 (-)44 55 28 (-)50 Total 5,619 4,714 (-)16 -- -- -- Source : Commissionerate of Agriculture, GoM

Economic Survey of Manharashtra २०१५-१६
80
Index of agricultural production 7.4 The index number of agricultural production (Base: Triennial 1979-82) for the State compiled by Commissionerate of Agriculture, GoM is given in Table 7.6 and the time series data is given in Annexure 7.2.
Requirement of cereals and pulses 7.5 Estimated monthly per capita household consumption of cereals and pulses based on 68th round (2011-12) of National Sample Survey (NSS) are 9.08 kg and 0.98 kg respectively. The annual requirement of cereals and pulses for household consumption in the State based on mid-year projected population for 2015-16 is estimated to be about 131 lakh MT and 14 lakh MT respectively. Per capita household consumption of cereals and pulses based on state sample data of NSS 68th round (2011-12) are given in Table 7.7. Operational holdings 7.6 Agricultural Census 2010-11 indicates that out of 1.37 crore total operational holdings in the State, 78.6 per cent belonged to marginal and small farmers with land holding less than or equal to two ha. The proportion of operational holdings of SC & ST was 7.5 per cent & 6.3 per cent with area of operational holdings 6.6 per cent & 7.9 per cent respectively. The average size of land holding of SC & ST was 1.27 ha & 1.80 ha respectively as against 1.44 ha for all operational holdings. The operational holdings and area in the State as per Agricultural Census 2010-11 is given in Table 7.8 and the time series data is given in Annexure 7.3.
Land utilisation 7.7 The land utilisation statistics for 2013-14 depicts that out of the total 307.58 lakh ha geographical area of the State, the gross cropped area was 233.80 lakh ha while the net area sown was 173.68 lakh ha (56.4 per cent). The area under forest was 52.05 lakh ha (16.9 per cent), land
Table 7.5 Estimated Production of major crops
(Lakh MT) Major Crops 2014-15
(final forecast)
2015-16 (tentative)
Per cent change
Cereals 92.67 70.06 (-)24
Pulses 16.80 14.87 (-)11 Total foodgrains@ 109.47 84.93 (-)22
Oilseeds@ 22.78 22.21 (-)3
Cotton$ 35.77 42.02 17
Sugarcane** 915.38 720.89 (-)21 @ includes kharif, rabi and summer crops $ lakh bales (170 kg each) ** harvested area Source : Commissionerate of Agriculture, GoM
Table 7.6 Index number of agricultural production (Base: Triennial 1979-82)
Crop Weight 2013-14 2014-15 Per cent change
Cereals 42.22 120.6 98.5 (-)18.3 Pulses 10.44 316.1 144.6 (-)54.3 Total foodgrains 52.66 159.4 107.6 (-)32.5
Oilseeds 9.16 60.1 56.1 (-)6.6 Fibres 9.93 603.2 244.2 (-)59.5 Misc 28.25 266.5 317.3 19.0 Total non-foodgrains
47.32 297.2 251.4 (-)15.4
All 100.00 224.6 175.7 (-)21.8 Source : Commissionerate of Agriculture, GoM
Table 7.7 Per capita estimated household consumption of cereals & pulses
Crop
Per capita household consumption
Annual requirement for 2015-16# (lakh MT)
Monthly (kg)
Annual (kg)
Rice 2.96 36.01 42.73 Wheat 4.75 57.79 68.57 Jawar 0.94 11.44 13.57 Bajara 0.38 4.62 5.49 Other Cereals 0.05 0.61 0.72 Total Cereals 9.08 110.47 131.07 Total Pulses 0.98 11.92 14.15 # For mid-year projected population (as on 1st October, 2015) Source : Directorate of Economics & Statistics, GoM

Economic Survey of Manharashtra २०१५-१६
81
not available for cultivation was 31.83 lakh ha (10.3 per cent), other uncultivated land was 24.06 lakh ha (7.8 per cent) and fallow land was 25.93 lakh ha (8.4 per cent). The time series data of land utilisation is given in Annexure 7.4.
Irrigation projects 7.8 The irrigated area in command area under the jurisdiction of Water Resources Department, GoM is 31.37 lakh ha in 2014-15. Number of irrigation projects, irrigation potential created and utilised are given in Table 7.9.
Table 7.8 Operational holdings and area as per Agricultural Census 2010-11
Size Class (ha) No. of operational
holdings ('000) Area of operational holdings ('000 ha)
Average size of holding (ha) 2005-06 2010-11
Upto 1.0 6,709 3,186 0.46 0.47 1.0 - 2.0 4,052 5,739 1.26 1.42 2.0 - 5.0 2,473 7,155 2.73 2.89 5.0 - 10.0 396 2,603 6.16 6.57 10.0 - 20.0 59 752 10.89 12.75 20.0 & above 9 332 32.52 36.89 Total 13,698 19,767 1.46 1.44 Source : Commissionerate of Agriculture, GoM
Table 7.9 Number of irrigation projects, irrigation potential created and utilised
Item
Projects of Water Resources Dept Minor Projects (Local sector) Major and Medium
Minor (State sector)
Total K.T. Weirs
Perco- lation tanks
Lift irriga- tion
M.I. tanks
Others Total Minor (Local)
(A) No. of projects as on 30th June, 2015 (i) Completed
403*$ 3,506*$ 3,909*$ 11,006 21,317 2,652 2,608 37,714 75,297
(ii) Ongoing 1,658 1,178 89 566 4,440 7,931 (B) Irrigation potential (lakh ha) (i) Created upto June, 2014
34.30*@ 14.36*@ 48.66*@ 3.13 6.48 0.39 2.29 3.96 16.25
(ii) Area under irrigation by canal in 2014-15
15.53++ 4.81++ 20.34++ 1.09 -- 0.14 0.80 -- 2.03
(iii) Area under irrigation by wells in command area during 2014-15
9.88 1.15 11.03 -- -- -- -- -- --
Total irrigation potential utilised
25.41* 5.96* 31.37* 1.09 -- 0.14 0.80 -- 2.03
$ completed & ongoing components together * provisional @ As per the recommendations of Chitale Committee, the data has been complied by MWRDC, based on information from all Chief Engineers of WRD. ++ Includes actual irrigation by project, canals, lift & water released in rivers and nallahas Source : i) Water Resources Department, GoM ii) Office of the Chief Engineer, Minor Irrigation (local), GoM

Economic Survey of Manharashtra २०१५-१६
82
Reforms in irrigation sector 7.9 In all 5,077 Water Users Associations (WUA) have been formed upto the end of September, 2015. The time series data on water charges levied, recovered and outstanding is given in Annexure 7.6. Reservoir storage 7.10 The total live storage as on 15th October, 2014 in the major, medium and minor irrigation (State sector) reservoirs taken together was 25,001 million cubic meters, which was nearly 61.4 per cent of the storage capacity as per the project design. Live storage of water is given in Table 7.10.
Jalyukta Shivar Abhiyaan 7.11 The Jalyukta Shivar Abhiyaan, launched by GoM, primarily aims at making Maharashtra ‘a drought-free state by 2019’. It involves deepening and widening of streams, construction of cement and earthen stop dams, work on nullahs and digging of farm ponds. Micro irrigation systems are also being encouraged for efficient use of water to increase the irrigated area. It is targeted to make 5,000 villages free of water scarcity every year. This programme is being implemented as a mission through consolidation of funds for different schemes of water conservation from different departments, district annual plan, NGOs, public participation and corporates. 7.11.1 During 2014-15 and 2015-16, in all 6,205 villages from 34 districts have been selected to free them from water scarcity. By the end of October, 2015, in all 1,30,761 works of water conservation in the selected villages have been completed, 34,989 works are under progress and an expenditure of ₹ 1,544.20 crore has been incurred. Soil and water conservation 7.12 Completed and ongoing watersheds are given in Table 7.11.
Table 7.10 Live storage of water (in MCM)
Year Storage capacity as per project design
Live storage as on 15th
October
Percentage of live storage
2012-13 35,838 20,406 56.9 2013-14 40,313 29,232 72.5 2014-15* 40,729 25,001 61.4 * Provisional MCM : Milllion cubic metres Source : Water Resources Department, GoM
Table 7.11 Completed and ongoing watersheds ( ₹ crore )
Scheme Number of Watersheds Expenditure on
selected watersheds
selected completed under execution
expected incurred+
National watershed development programme (micro watershed) 324 235 270 # 137.84
River Basin development programme (micro watershed) 271 226 45 @ 294.29
Western Ghat development programme (mega watershed) 16 0 16 @ 136.56
Integrated watershed area development programme (micro watershed), 32,734 12,426 26,243 861.89 6,682.70
NABARD assisted watershed (mega watershed) 43 0 32 17.50 53.43
Integrated watershed management programme (IWMP) 1,171 0 1,171 1,080.00 2,020.85
Total 34,559 12,887 27,777 1,959.39 9,325.67 + upto October, 2015 since inception @ Grant not sanctioned # 2014-15 is last year of the scheme Source: Commissionerate of Agriculture, GoM

Economic Survey of Manharashtra २०१५-१६
83
Sprinkler and drip irrigation 7.13 The State gives 60 per cent subsidy to small & marginal farmers and 50 per cent subsidy to other farmers for purchase of sprinkler and drip irrigation equipments. Yearwise sprinkler & drip irrigation sets distributed and expenditure incurred are given in Table 7.12.
Subsidy for agricultural pumps 7.14 There are about 38.82 lakh agricultural pumps in the State. A provision of ` 4,519.10 crore is proposed for 2015-16 for giving subsidiable electricity to agricultural pumps as against ` 3,552.99 crore in the previous year.
Electrification of agricultural pumps 7.15 During 2014-15, MAHAVITARAN has provided electricity connection to 1.48 lakh agricultural pumps. During 2015-16 against the target of 2.04 lakh, 0.83 lakh agricultural pumps have been energised upto December. To remove the backlog of electrification of agricultural pumps in backlog notified districts, a provision of ` 220 crore has been made for 2015-16 as against ` 150 crore for 2014-15.
Use of improved seeds 7.16 Maharashtra State Seed Corporation (MSSC) and National Seed Corporation (NSC) are the major public sector organisations in production and distribution of quality seeds. Besides these, private seed producers are also involved in retail sale of seeds of various crops. The public and private sectors are distributing seeds in the ratio of 42:58. The GoI has fixed seed replacement targets of 35 per cent for self pollinated crops (like paddy, wheat, tur, moong, udid, etc.), 50 per cent for cross pollinated crops (like maize, jowar, bajra, sunflower, etc.) and 100 per cent for hybrid crops. Distribution of improved seeds is given in Table 7.13.
Table 7.12 Yearwise sprinkler & drip irrigation sets distributed & expenditure incurred (` crore)
Year Sprinkler Drip Expenditure incurred No. of sets Area (ha) No. of sets Area (ha)
2012-13 79,630 79,630 1,78,310 1,62,100 574.85 2013-14 30,296 30,296 89,108 81,008 305.57 2014-15 52,180 43,098 2,00,496 1,70,719 688.41
Source : Commissionerate of Agriculture, GoM
Table 7.13 Distribution of improved seeds ('000 quintals)
Sector Crops
Year Per cent change in 2015
over 2014 2011 2012 2013 2014 2015*
Public Kharif 859 747 778 284 500 76.0 Rabi 242 341 370 263 255 (-)3.0 Total 1,101 1,088 1,148 547 755 38.0
Private Kharif 1,061 1,128 1,283 911 508 (-)44.2 Rabi 310 289 401 121 150 23.9 Total 1,371 1,417 1,684 1,032 658 (-)36.2
Total Kharif 1,920 1,875 2,061 1,195 1,008 (-)15.6 Rabi 552 630 771 384 405 (-)23.4 Total 2,472 2,505 2,832 1,579 1,413 (-)18.0
Source : Commissionerate of Agriculture, GoM * Provisional for rabi season

Economic Survey of Manharashtra २०१५-१६
84
Use of fertilizers and pesticides
7.17 Consumption of chemical fertilizers in the State for 2015-16 was anticipated to be 58.25 lakh MT with per hectare consumption of 107 kg. The fertilizer consumption for the year 2014-15 was 60.13 lakh MT which was 125.9 kg per hectare. During 2014-15, the distribution of fertilizers was effected through 0.5 lakh fertilizer distribution outlets, out of which, 8.1 per cent were in co-operative sector, 0.3 per cent in public sector and 91.6 per cent in private sector. The yearwise use of chemical fertilizers is given in Table 7.14. Use of chemical and bio-pesticides is given in Table 7.15.
Flagship programmes 7.18 The erstwhile Planning Commission had declared 15 flagship programmes in the agriculture & allied activities sector which include nine centrally sponsored schemes and six schemes through additional central assistance/central sector schemes. Rashtriya Krishi Vikas Yojana (RKVY) is being implemented through additional central assistance. In addition to RKVY, five programmes viz. National Food Security Mission, National Horticulture Mission, National Mission on Sustainable Agriculture, National Oilseed & Oil Palm Mission and National Mission on Agriculture Extension & Technology are approved. The financial performance of RKVY is given in Table 7.16.
National Food Security Mission 7.18.1 During 2014-15, an expenditure of ` 37.98 crore for rice, ` 5.65 crore for wheat, ` 224.49 crore for pulses and ` 39.41 crore for coarse grains has been incurred for area expansion and productivity enhancement under National Food Security Mission (NFSM). During 2015-16 upto November, an expenditure of ` 7.90 crore for rice, ` 0.31 crore for wheat, ` 28.40 crore for pulses and ` 5.17 crore for coarse grains has been incurred.
Table 7.14 Yearwise use of chemical fertilizers
Year Total
consumption (lakh MT)
Per hectare consumption
(kg)
2013-14 59.90 119.4 2014-15 60.13 125.9 2015-16$ 58.25 107.0
$ expected use Source : Commissionerate of Agriculture, GoM
Table 7.15 Use of chemical & bio-pesticides (MT)
Year Pesticides
Chemical Bio
2013-14 10,969 1,433
2014-15 11,239 1,124
2015-16$ 11,280 4,292 $ estimated Source: Commissionerate of Agriculture, GoM
Table 7.16 Financial performance of RKVY ( ₹ crore )
Year Cost of projects sanctioned by SLSC
Administrative approvals of GoI
Grants received from GoI Expenditure
2013-14 948.22 1,154.54 959.69 959.69
2014-15 1,013.49 1,025.99 942.09 934.45
2015-16+ 623.24 386.62 386.62 70.17
Source : Commissionerate of Agriculture, GoM, + Upto November SLSC State Level Sanctioning Committee

Economic Survey of Manharashtra २०१५-१६
85
Horticulture 7.18.2 The National Horticulture Mission (NHM) has been launched with the main objective of increasing the area & productivity under horticulture and also to promote post-harvest management. Maharashtra State Horticulture & Medicinal Plant Board (MSHMPB) was established to implement schemes of NHM and National Medicinal Plants Board (NMPB). The mission is implemented as Mission for Integrated Development of Horticulture (MIDH). Since inception, the MSHMPB received grants of ₹ 1,462.90 crore and expenditure incurred is ₹ 1,462.65 crore upto November, 2015. 7.18.3 The area under various fruit crops during 2014-15 was estimated to be 18.46 lakh ha, out of which the area under mango was 5.27 lakh ha, orange 1.69 lakh ha, sweet orange 1.46 lakh ha, pomegranate 1.78 lakh ha, banana 0.83 lakh ha, sapota 0.85 lakh ha and grapes 0.90 lakh ha. 7.18.4 The GoM has undertaken a programme to promote horticulture development through establishment of nurseries and granting capital subsidy to small & marginal as well as SC & ST farmers, to encourage them to grow selected fruit crops. The area under fruit crops has increased to 18.46 lakh ha by March, 2015. An expenditure of ₹ 1,913.00 crore was incurred under this scheme upto March, 2015.
Organic farming 7.18.5 For promotion of organic farming, various activities like providing guidance, getting certification, marketing of the organic farm products are included in National Mission on Sustainable Agriculture (NMSA). Under organic farming about 7.51 lakh ha area of the State is covered. There are more than 17,704 organic farming groups, of which 1,683 organic farming groups (comprising of more than 44,551 farmers) are certified.
Agricultural finance 7.19 Financial assistance is provided to farmers by way of short-term loans, credit, etc. by government through various banks and co-operative agencies. The National Bank for Agriculture and Rural Development (NABARD) is the apex bank for agricultural & rural development in the country. The loans are disbursed through Commercial Banks (CB), Regional Rural Banks (RRB), Maharashtra State Co-operative Bank (MSCB), District Central Co-operative Banks (DCCB) and Land Development Banks (LDB). Loans disbursed by CB, RRB, MSCB/DCCB/LDB are given in Table 7.17.
7.20 The financial institutions directly associated with agricultural finance at grass root level in the State are Primary Agricultural Credit Co-operative Societies (PACS) which provide short-term crop loans to their cultivator members. The PACS advanced loan of ₹ 14,030 crore during 2014-15, of which loan advanced to small & marginal farmers was ₹ 6,388 crore. The corresponding figures during 2013-14 were ₹ 12,826 crore and ₹ 4,829 crore respectively.
Table 7.17 Loans disbursed by CB, RRB, MSCB/DCCB/LDB (` crore)
Activity CBs$ RRBs MSCB/DCCB/LDB Total
2013-14 2014-15 2013-14 2014-15 2013-14 2014-15 2013-14 2014-15
Crop loan 16,461.61 17,986.56 1,610.90 1,690.53 13,353.62 14,423.30 31,426.13 34,100.39
Agriculture term loan 14,217.96 18,358.65 643.77 948.10 3,841.10 3,884.86 18,702.83 23,191.61
Total 30,679.57 36,345.21 2,254.67 2,638.63 17,194.72 18,308.16 50,128.96 57,292.00
Source : State Level Bankers’ Committee, Maharashtra State $ Including nationalised banks

Economic Survey of Manharashtra २०१५-१६
86
Kisan Credit Card Scheme 7.21 The cumulative number of Kisan Credit Cards (KCC) issued in the State by the end of March, 2015 was 90.80 lakh, out of which co-operative banks issued 65.30 lakh, RRB issued 4.25 lakh and CB issued 21.25 lakh cards and the amount of loan sanctioned was ` 9,478 crore and ₹ 17,135 crore respectively. The agriculture loans to farmers by MSCB linked to KCC are given in Table 7.18.
Agricultural marketing
7.22 The Maharashtra State Agricultural Marketing Board (MSAMB) is mainly entrusted with activities such as keeping necessary coordination in working of market committees, development & promotional activities of Agriculture Produce Marketing Committee (APMC), establishment of agro-export zones, horticultural training centres and grading & packing facilities, etc. The quantity and value of arrivals in all the market committees are given in Table 7.19.
7.22.1 Under the Maharashtra Agricultural Produce Marketing (Development & Regulation) Act, 236 direct marketing licenses have been issued upto December, 2015, of which 128 are functional. Apart from these, 41 private market licenses have also been issued, of which 32 markets are functioning and the National Commodity & Derivatives Exchange (NCDEX) is operating through internet.
Minimum Support Price Scheme
7.23 To make the agricultural activity viable as well as to protect the farmers’ economy from natural calamities and low prices offered by traders, GoI declares Minimum Support Price (MSP) for selected crops. Under this scheme, procurement in the State is undertaken by the Maharashtra State Co-operative Marketing Federation, Maharashtra State Co-operative Tribal Development Corporation, National Agricultural Co-operative Marketing Federation and Maharashtra State Co-operative Cotton Growers Federation. The MSP of major crops are given in Table 7.20.
National Agricultural Insurance Scheme 7.24 Under the National Agricultural Insurance Scheme (NAIS), 16 kharif and eight rabi crops are covered. The yearwise farmers covered under NAIS are given in Table 7.21.
Table 7.18 Agriculture loans to farmers by MSCB linked to KCC (₹ crore)
Year Short term loans Long term loans
No of beneficiaries ('000)
Amount
No of beneficiaries ('000)
Amount
2013-14 3,299 12,124 3.6 18 2014-15 3,467 13,166 26.5 353 2015-16+
3,190 12,286 14.8 243 Source : Maharashtra State Co-op. Bank Ltd. + up to October
Table 7.19 Quantity & value of arrivals in all the market committees
Year Quantity (lakh MT)
Values (₹ crore)
2012-13 360.50 38,895.19
2013-14 242.65 44,977.48
2014-15 219.58 65,367.63
Source : Maharashtra State Agricultural Marketing Board

Economic Survey of Manharashtra २०१५-१६
87
Gopinath Munde Farmer Accident Insurance Scheme 7.25 The ‘Farmers Janata Personal Accident Insurance Scheme’ was launched in 2005-06 to give financial assistance to the aggrieved family members of the ill-fated farmers. The insurance coverage is provided for 13 perils. The scheme is renamed as ‘Gopinath Munde Farmer Accident Insurance Scheme’ (GMFAIS) from 2015-16. The amount of insurance cover is increased from ₹ one lakh to ₹ two lakh. During 2015-16, the government paid premium of ₹ 27.25 crore to insurance companies. The details of the scheme are given in Table 7.22.
Scarcity and natural calamity 7.26 During February to March, 2015 about 2.78 lakh ha area in the State was affected by untimely rain and hailstorm for which a compensation of ₹ 481.74 crore was sanctioned against the estimated loss of ₹ 502.5 crore. Scarcity situation during kharif season of 2015-16 affected nearly 53.11 lakh ha area for which an amount of ₹ 2,000 crore was sanctioned against the estimated loss of ` 3,578.43 crore. During April to November, 2015, about 1.45 lakh ha area was affected by various natural calamities such as untimely rain, hailstorm, stormy wind, excessive rain and flood situation, etc. and estimated amount of loss was ` 160.17 crore.
Table 7.20 MSP of major crops
Crop MSP ( ₹/quintal ) 2013-14 2014-15
Paddy (FAQ) 1,360 1,410 Paddy (Gr.A) 1,400 1,450 Jowar (Hybrid) 1,530 1,570 Jowar (Maldandi) 1,550 1,590 Wheat 1,450 1,450 Maize 1,310 1,325 Bajra 1,250 1,275 Gram 3,175 3,175 Tur 4,350 4,625 Moong 4,600 4,850 Udid 4,350 4,625 Sunflower 3,750 3,800 Soyabean (yellow) 2,560 2,600 Soyabean (black) 2,500 2,500 Groundnut-in -shell 4,000 4,030 Cotton (Medium Staple) 3,750 3,800 Cotton (Long Staple) 4,050 4,100 Safflower 3,050 3,050 Masoor 3,075 3,075 Ragi 1,550 1,650 Sesamum 4,600 4,700 Nigerseed 3,600 3,650 Mustard 3,100 3,100 FAQ : Fair Average Quality Source : The Maharashtra State Co-operative Marketing Federation limited
Table 7.22 Details of GMFAIS ( ₹ crore)
Year Insurance Premium paid by Govt.
Total Insurance proposals received
(no.)
Insurance proposals sanctioned
(no.)
Compensation to farmers
2010-11 19.18 3,244 2,604 25.90 2011-12 19.18 3,107 2,286 22.73 2012-13 37.52 3,572 2,435 24.28 2013-14 20.36 2,805 2,269 22.56 2014-15 16.47 2,198 1,190 11.88
Source: Commissionerate of Agriculture, GoM
Table 7.21 Yearwise farmers covered under NAIS ( ₹ crore)
Year Farmers covered Compensation No. of farmers
(in lakh) Insured amount Insurance
Premium No. of farmers
(in lakh) Amount
2012-13 23.22 2,410.49 92.91 13.17 767.27 2013-14 17.42 2,247.51 117.00 3.55 103.24 2014-15 55.95 5,484.03 198.06 41.71 1,806.57
Source : Commissionerate of Agriculture, GoM

Economic Survey of Maharashtra 2015-16
88
Graph 7.2 : Categorywise share of livestock in different censuses
0
100
200
300
400
1992 1997 2003 2007 2012Census year
Cattle Buffaloes Sheep & Goats Other livestock
Live
stock
in la
kh
Graph 7.1 : Total livestock per lakh population
4650
36 37
29
20
25
30
35
40
45
50
55
1992 1997 2003 2007 2012
Tota
lliv
esto
ckpe
rlak
hpo
pula
tion
in'0
00
Census year
ANIMAL HUSBANDRY 7.27 Livestock plays an important role in the development of agrarian rural economy. It also supplements farm income, resulting in growth of rural economy by creating employment opportunities. Flow of income to the owners through livestock production is continuous throughout the year irrespective of season. Animal Husbandry and the livestock production are thus, playing a vital role in the sustainable economic upliftment of the rural masses, besides providing essential proteinaceous nutrition at affordable prices.
Livestock Census 7.28 Livestock Census is carried out quinquennialy. According to 19th Livestock Census 2012, the State ranks sixth at national level with total livestock of about 325 lakh, which is less by 9.7 percent as compared to that reported in 18th Livestock Census 2007. The State ranks third at national level with poultry population of about 778 lakh which is 10.7 percent of the total poultry population of India. This population has increased by 20.1 per cent as compared to that reported in 18th Livestock Census 2007. The livestock as per 19th Livestock Census 2012 is given in Table 7.23 and details in Annexure 7.7.
Table 7.23 Livestock as per 19th Livestock Census 2012 ( '000)
Veterinary region Cattle Buffaloes Sheep and
Goats
Other Live stock
Total Live stock
Total Poultry Birds
Konkan 1,106 397 365 16 1,884 10,512 Nashik 3,688 889 3,268 126 7,971 27,575 Pune 2,488 2,202 2,913 56 7,659 30,997
Aurangabad 1,936 510 1,163 59 3,668 2,207 Latur 1,643 683 781 39 3,146 1,507
Amravati 2,248 453 1,338 44 4,083 1,773 Nagpur 2,375 461 1,188 54 4,078 3,224
Total 15,484 (8.1)
5,595 (5.1)
11,016 (5.5)
394 (3.3)
32,489 (6.3)
77,795 (10.7)
India 1,90,904 1,08,702 2,00,242 11,834 5,12,057 7,29,209 State Rank 4 8 6 25 6 3
Source : Office of the Commissioner of Animal Husbandry, GoM Note : Figures in bracket show percentage to India

Economic Survey of Maharashtra 2015-16
89
Veterinary Infrastructure 7.29 The GoM has created infrastructure facilities to render health care services to livestock in the State. Regionwise veterinary infrastructure is given in Table 7.24.
7.30 The State provides medical facilities for various diseases and also implements vaccination programmes. Regionwise cases treated and vaccinated during 2015-16 upto December are given in Table 7.25.
Artificial Insemination 7.31 The Artificial Insemination (AI) facility has been provided in 4,861 centers. Three laboratories of Frozen Semen (FS) are located at Pune, Nagpur and Aurangabad where semen straws are prepared for further distribution to 33 DAI centers and other AI centers in the State. Regionwise AI performed in the year 2015-16, upto December is given in Table 7.26
Table 7.24 Regionwise veterinary infrastructure (as on 31st march ,2015)
Veterinary region
District Artificial
Insemination (DAI)centers
Polyclinics$ Mini polyclinics
Veterinary dispensaries
Mobile
Veterinary clinics Grade I Grade II
Konkan 4 4 20 142 354 12 Nashik 5 5 25 345 515 6 Pune 5 5 26 460 559 7 Aurangabad 4 3 20 160 288 2 Latur 4 4 20 165 290 3 Amravati 5 5 27 193 379 17 Nagpur 6 6 30 283 463 18 Total 33 32 168 1,748 2,848 65 $ Including six polyclinics of Maharashtra Animal and Fishery Science University. Source : Office of the Commissioner of Animal Husbandry, GoM
Table 7.25 Regionwise cases treated and vaccinated 2015-16+ ('000)
Veterinary region No of cases treated
General Treatments Castration Operations Vaccination (Including poultry) Major Minor
Konkan 988 53 1 47 4,996 Nashik 2,716 157 6 149 12,989 Pune 2,962 89 10 122 11,374 Aurangabad 1,047 58 2 40 5,041 Latur 906 62 6 64 4,918 Amravati 1,468 70 3 66 5,528 Nagpur 1,513 80 4 68 6,752 Total 11,600 569 32 556 51,598
Source: Office of the Commissioner of Animal Husbandry, GoM + upto December
Table 7.26 Regionwise AI performed 2015-16+ ('000)
Veterinary region
Artificial Insemination performed No. of Calves born Cow
Buffalo Total
Cross breed Indigenous Buffalo Total Exotic Cross
breed Indigenous
Konkan 17 18 1 27 63 15 Neg. 11 26 Nashik 89 191 10 54 344 114 3 21 138 Pune 46 291 54 258 649 141 22 98 261 Aurangabad 29 69 18 35 151 32 5 11 48 Latur 13 39 55 61 168 14 18 19 51 Amravati 30 26 16 34 106 19 5 12 36 Nagpur 32 60 9 11 112 34 3 6 43 Total 256 694 163 480 1,593 369 56 178 603 Source : Office of the Commissioner of Animal Husbandry, GoM Neg. Negligible + upto December

Economic Survey of Maharashtra 2015-16
90
National Project for Cattle and Buffalo Breeding 7.32 The National Project for Cattle and Buffalo Breeding (NPCBB) is a 100 per cent centrally sponsored programme implemented by Maharashtra Livestock Development Board (MLDB) for strengthening and expansion of animal breeding services, preservation of indigenous breed and generation of self employment for rural youths. 7.33 During 2014-15 an expenditure of ` 42.70 lakh was incurred from unspent balance of last year. The expenditure was mainly incurred on modernisation and strengthening of four DAI centres, two frozen semen laboratories, three bull-mother farms. Under this scheme for preservation and conservation of indigenous breeds, 42 male calves were supplied to farmers for natural services on 100 per cent subsidy. For better AI services, milk production and animal management training programmes were conducted for 272 existing AI workers /farmers/animal holders. During 2015-16, upto October, an expenditure of ` 1.95 lakh was incurred. GoI has discontinued the NPCBB and a new programme named as National Programme for Bovine Breeding and Dairy Development (NPBBDD) is initiated from 2014-15. The Maharashtra Livestock Development Board (MLDB), Akola is the implementing agency in the State. 7.34 During 2014-15 under the NPBBDD, GoI sanctioned a grant of ` 54.39 crore to MLDB for genetic upgradation of indigenous cow and buffalo breeds for a period of three years. A grant of ` 100 lakh has been released by GoI of which ` 80 lakh are for Rashtriya Gokul mission and ` 20 lakh as a managerial grant. National Livestock Mission 7.35 National livestock Mission was launched by GoI in the year 2014-15, by merging various schemes of sheep, goat, poultry and pigs for socially and financially backward classes. GoI share is 75 per cent and State share is 25 per cent. Seven proposals are posed to GoI amounting ` 137.24 crore, of these three proposals (rural backyard poultry, livestock insurance and distribution of power driven chaff cutter) are sanctioned. GoI has released ` 13.27 crore. Livestock Insurance Scheme 7.36 Livestock insurance is a centrally sponsored scheme implemented by MLDB since 2006-07. The main objective of the scheme is to provide protection to the cattle holders against any eventual losses due to death of animal because of natural calamity, accident or disease. Initially the scheme was implemented in six districts and was extended to 18 districts in 2010-11. In 2014-15 an expenditure of ` 13.63 lakh was incurred for settling claims. 7.37 In 2014-15 the GoI approved implementation of the scheme to all districts (excluding Mumbai and Suburban) and grant of ` 892.32 lakh (for Schedule Caste Sub-plan ` 472.86 lakh and General Plan ` 419.46 lakh) is received. In naxalite area 80 per cent subsidy is given to BPL and SC/ST whereas, 60 per cent is given to above poverty line (APL). In non-naxalite area 70 per cent subsidy is given to BPL and SC/ST whereas, 50 per cent is given to APL. The scheme is being implemented in the State from 1st December, 2015. Poultry Development 7.38 Poultry activities in the State are mainly carried out by private poultry owners. The National Institute of Nutrition has recommended per capita per annum consumption of 180 eggs and 11 kg of meat. In way of this, State has decided to promote poultry activity through Navinyapurna Yojana. During 2014-15, an expenditure of ` 14.05 crore was incurred covering 1,021 beneficiaries. Number of poultry birds supplied through central hatcheries and per capita per annum availability of eggs are given in Table 7.27.
Table 7.27 No. of poultry birds supplied through central hatcheries and availability of eggs
Year No. of poultry birds supplied
(in lakh)
Availability of eggs (per capita per annum) State All-India
2010-11 3.87 38 53 2011-12 8.84 39 55 2012-13 8.68 40 57 2013-14 9.87 41 58 2014-15 15.79 43 61
Source: Office of the Commissioner of Animal Husbandry, GoM

Economic Survey of Maharashtra 2015-16
91
Graph 7.3 : Average collection of by Co-operative & Govt. dairies
milk
50.52
38.5740.47
39.19
45.45
38404244
46485052
2011
-12
2012
-13
2013
-14
2014
-15
2015
-16
+
Year +Upto December
Lakh
litre
sper
day
Dairy Development 7.39 Dairy is a supplementary activity to Agriculture, which offers the potential for generating additional income & employment opportunities for the rural households besides improving nutritional standards. The State ranks seventh in milk production in India. Under RKVY, during 2015-16 grant of ` 9.90 crore has been given to four dairy projects upto December, 2015. Milk production and per capita availability are given in Table 7.28.
7.40 During 2014-15, under government and co-operative sectors together there were 99 milk processing plants and 159 chilling centres with capacity of 88.08 lakh litre and 26.98 lakh litre per day respectively. The average daily collection of milk by the government and co-operative dairies taken together was 45.45 lakh litre during 2014-15 and 50.52 lakh litre during 2015-16 upto December. There are 192 cold storage centres with capacity of 7,618.77 MT, of which 167 cold storage centres with capacity of 7,172.12 MT are with private sector. By-products of milk from government dairies are given in Table 7.29.
Fisheries 7.41 The State has a coastline of 720 km with 173 fish landing centres and the area suitable for marine fishing is 1.12 lakh sq km. There are 15,686 marine fishing boats in operation, of which 12,831 are mechanised. In addition to this, the area suitable for inland and brackish water fishing in the State is 3.17 lakh ha and 0.10 lakh ha respectively. There are 30 fish seed production centres in the State with 2,414 lakh spawn production capacity per year for catering to inland fishing. During 2014-15, State’s contribution in marine, inland and total fish production (provisional) of India was 13.1 per cent, 2.2 per cent and 6.0 per cent respectively. Details of fish production and exports are given in Table 7.30.
Table 7.28 Milk production and per capita availability
Year Milk production
(MMT)
Per capita availability
(grams per day) State All-India State All-India
2011-12 8.5 127.9 206 290
2012-13 8.7 132.0 210 295
2013-14 9.1 137.7 215 296
2014-15 9.5 146.3 223 307
2015-16# 9.9 160.4 228 NA MMT million metric ton NA Not available # Anticipated Source: Animal Husbandry, Dairy Development & Fisheries Deptt., GoM
Table 7.29 By-products of milk from Government dairies
By-product Unit 2013-14 2014-15 2015-16+ Skimmed milk powder MT 138.46 944.48 4,499.93 White butter MT 82.04 483.20 2,391.98 Ghee MT 47.80 47.98 2.17 Energee lakh bottles 44.33 0.50 1.03 Lassi lakh bottles 30.66 9.34 1.49 Masala milk lakh bottles 14.71 1.56 0.38
Source : Office of the Commissioner of Dairy Development, GoM. + upto December

92
Economic Survey of Maharashtra 2015-16
7.42 Under National Agricultural Development scheme, since 2011-12, the development of 19 jettis worth ` 70 crore has been undertaken, of which work of seven jetties is completed. Upto 2014-15, funds of ` 56.83 crore were disbursed to Harbour Engineer, Konkan Bhavan, Ratnagiri and Sindhudurg.
Sericulture 7.43.1 Mulberry silk development programme is implemented in 25 districts of the State. Details of Mulberry plantation and production are given in table 7.31
7.43.2 Tasar silk development programme is implemented in four districts viz. Gadchiroli, Chandrapur, Bhandara and Gondia. Area under plantation of Ain and Arjun trees (on which Tasar silkworms are grown) is 18,866 ha in these four districts. During 2014-15, production of raw Tasar silk was 18.97 MT while during 2015-16 upto December, it was 5.41 MT.
Forest 7.44 Forest is the second largest land use after agriculture in the State. At the end of year 2014-15, the total forest area of the State was 61,573 sq km (provisional) constituting about 20.01 per cent of geographical area of the State as against the target of 33 per cent set under National Forest Policy, 1988. The jurisdiction of the total forest area (provisional) in the State is divided amongst Forest Department (55,250 sq km), Forest Development Corporation of Maharashtra (FDCM) (3,690 sq km), Private forest brought under possession of Forest Department (1,180 sq km) and Revenue Department (1,453 sq km). As per “India State of Forest Report- 2015”, very dense forest
Table 7.30 Fish production and exports
Item Unit 2013-14 2014-15 Per cent change 2015-16*+
Fish production lakh MT Marine 4.67 4.64 (-)0.6 3.40 Inland 1.35 1.44 6.7 1.25 Total 6.02 6.08 1.0 4.65 Gross value of fish production `crore Marine 3,606 4,482 24.3 3,230 Inland 1,173 1,418 20. 9 1,250 Total 4,779 5,900 23.5 4,480 Export of fish produce Quantity lakh MT 1.47 1.52 3.4 NA Value ` crore 3,986 4,273 7.2 NA
Source : Office of the Commissioner of Fisheries, GoM. * Provisional + upto December NA Not available
Table 7.31 Details of Mulberry Plantations and Production
Item Unit 2013-14 2014-15 2015-16*+
Area under Plantation (New) Ha 603 1,581 1,531 Area under Plantation (Old) Ha 902 1,225 2,977 Total area under Plantation Ha 1,505 2,806 4,508 No. of beneficiary (farmers) No. 3,057 5,397 8,677 Supply of Layings Lakh 13.53 23.05 18.26 Cocoon Prodution MT 761 1,318 1,027 Production of raw silk MT 112 203 158 Procurement of cocoon by Govt MT 7.86 1.15 3.95 Employment generated mandays Lakh 12.32 22.33 17.37 Source : Directorate of Sericulture, GoM. * Provisional + upto December

Economic Survey of Maharashtra 2015-16
93
constitutes 15.9 per cent, moderately dense forest 37.9 per cent, open forest 38.6 per cent and scrub 7.6 per cent of the total forest in the State. Out of the total forest area 51,170 sq km was reserved, 6,681 sq km was protected and 3,722 sq km was unclassed forest. Regionwise forest area of the State is given in Table 7.32.
Table 7.32 Regionwise Forest Area of the State (Area in sq.km.)
Region Reserved Protected Unclassed Total Forest Area
Percentage to Total Forest area
Vidharbha 27,727.25 4,599.40 1,541.75 33,868.40 55.0 Marathwada 2,792.41 129.23 170.56 3,092.20 5.0 Western Maharashtra
20,650.46 1,951.98 2,009.99 24,612.43 40.0
Total 51,170.12 6,680.61 3,722.30 61,573.03 100
Source : Office of the Principal Chief Conservator of Forest, GoM
Wild Life and National Parks, Sanctuaries 7.45 There are six National parks, 48 sanctuaries and four conservation reserves in the State. During 2014-15 about 25 lakh tourists visited various protected areas generating revenue of ` 10.11 crore to the parks and sanctuaries. According to ‘Status of Tigers in India, 2014’ report, number of estimated tigers in the State is 190 as against 169 in 2010. Area of Tiger projects and national parks, sanctuaries & expenditure incurred thereon are given in Table 7.33.
Forest Produce 7.46 Forest provides major products like timber, firewood and minor products like bamboo, tendu leaves, gum, grass, etc. All these forest produce are of great value in terms of generating revenue and providing livelihood to local people. Production and value of forest produce are given in Table 7.34.
Table 7.33 Area of Tiger projects and national parks, sanctuaries & expenditure incurred thereon
( `crore)
Project Area(sq km) Expenditure Core Buffer 2013-14 2014-15 2015-16+
Tiger Project Melghat 1,500.49 1,268.03 21.04 27.37 17.11 Tadoba-Andhari 625.82 1,101.77 31.52 6.62 5.60 Pench 257.26 483.95 6.49 4.82 3.56 Sahyadri 690.64 1,626.76 1.73 4.81 6.68 Navegaon-Nagzira 653.67 NN 0.83 1.69 2.67 Bor 138.12 NN 0.38 0.77 0.31 Development of National Parks/ Sanctuaries 6,185.55 140.95$ 136.64$ NA
Elephant Project Kolhapur NN 0.20 0.38 0.06 NN Not yet notified NA Not available + Upto January $ Includes expenditure under compensatory afforestation fund management and planning authority Source : Office of the Principal Chief Conservator of Forest, GoM

94
Economic Survey of Maharashtra 2015-16
Tree Plantation 7.47 Tree plantation, which is a part of 20 point programme, is mainly implemented through Forest Department, FDCM and Directorate of Social Forestry. The State Government has decided to carry out plantation of 100 crore plants per year since 2012. During 2014-15 expenditure of ` 111.77 crore was incurred by Forest Department and FDCM. Area under tree plantation and expenditure are given in Table 7.35.
Table 7.35 Area under tree plantation and expenditure
Year
Forest Dept. FDCM Social Forestry Area
(in ha) Expenditure
( `crore)
Area (in ha)
Expenditure (`crore)
Area (in ha)
Expenditure (`crore)
Plants supplied (in crore)
2011-12 31,369 67.90 4,011 9.47 3,916 13.67 1.32 2012-13 70,157 133.97 4,847 10.36 2,106 14.29 0.77 2013-14 58,646 109.76 3,969 8.57 2,528 16.06 2.14 2014-15 85,356 102.90 3,314 8.87 1,453 21.37 0.89 2015-16*+ 51,866 29.47 2,898 8.55 1,029 12.24 0.38
Source : Office of the Principal Chief Conservator of Forests & Director General, Social Forestry, GoM * Provisional + upto December
Sant Tukaram Vangram Yojana 7.48 Sant Tukaram Vangram Yojana was launched in 2006-07 with a view to create awareness about the importance of forest & wild life, to protect the forest from illegal tree cutting, encroachments, etc. Under this scheme, total 12,517 Joint Forest Management Committees (JFMC) with nearly 29.70 lakh members were constituted in 15,500 villages. JFMC manages 27.04 lakh ha of forest area.
Table 7.34 Production and value of forest produce (Value in ` crore)
Forest Produce Unit of production
2013-14 2014-15* 2015-16++ Production Value Production Value Production Value
(A) Major forest produce Timber LCM** 1.12 293.30 1.11 187.52 1.14 245.61 Firewood LCM** 3.43 55.14 1.89 20.57 1.95 35.38 Total (A) 4.55 348.44 3.00 208.09 3.09 280.99
(B) Minor forest produce Bamboo LMT@ 0.34 18.90 0.23 30.26 1.58 30.24 Tendu LSB # 4.54 62.92 4.62 56.21 2.14 64.72 Grass MT 656 0.11 483 0.13 403 0.04 Gum Quintal 4,231 1.34 2,022 2.76 2,272 2.94 Others (Lac, Hirda, Shikekai, etc.)
-- 10.76 -- 9.59 -- 10.57
Total (B) 94.03 98.95 108.51 Total (A + B) 442.50 307.04 389.50 ++ anticipated * Provisional ** LCM Lakh Cubic Metre @ LMT Lakh Metric Tonnes # LSB Lakh Standard Bags Source : Office of the Principal Chief Conservator of Forest, GoM

Economic Survey of Maharashtra 2015-16
95
Social Forestry 7.49 During 2014-15, under 20 Point Programme, the Social Forestry Department has planted 16.12 lakh seedlings on about 530 ha and 1,716 kms of community land and supplied 73.16 lakh plants for plantations on private land. During 2015-16 upto December, the Social Forestry Department has planted 22 lakh seedlings on about 432 ha and 1,110 km of community land and supplied 16 lakh plants for plantations on private land. Yearwise plantation under major schemes is given in Table 7.36.
Table 7.36 Yearwise plantation under major schemes (Area in ha)
Scheme 2012-13 2013-14 2014-15 2015-16+
Mahatma Gandhi Rural Employment Guarantee Scheme - Block plantation 629 631 234 211
Mahatma Gandhi Rural Employment Guarantee Scheme- Road side plantation (in Km) 1,179 1,346 1,672 928
Integrated Watershed Management Programme 185 573 0 0
National Bamboo Mission 130 241 39 30
Plantation programme on non forest community land in selected watersheds 231 338 125 147
Source : Office of the Principal Chief Conservator of Forests & Director General,Social Forestry, GoM + upto December
* * * * *

Economic Survey of Maharashtra 2015-16
96
ANNEXURE 7.1
AREA UNDER PRINCIPAL CROPS, PRODUCTION AND YIELD PER HECTARE IN THE STATE
Area :'000 ha Production : '000 MT Yield : Kg per ha. Foodgrains
Sr. No. Year
Rice Wheat Jowar Area Production Yield Area Production Yield Area Production Yield
(1) (2) (3) (4) (5) (6) (7) (8) (9) (10) (11) 1 1960-61 1,300 1,369 1,054 907 401 442 6,284 4,224 672 2 1970-71 1,352 1,662 1,229 812 440 542 5,703 1,557 273 3 1980-81 1,459 2,315 1,587 1,063 886 834 6,469 4,409 681 4 1990-91 1,597 2,344 1,467 867 909 1,049 6,300 5,929 941 5 2000-01 1,512 1,930 1,277 754 948 1,256 5,094 3,988 783 6 2010-11 1,516 2,691 1,775 1,307 2,301 1,761 4,060 3,452 850 7 2012-13 1,559 3,078 1,974 785 1,199 1,527 3,290 2,108 641 8 2013-14 1,605 3,108 1,936 1,028 1,480 1,439 3,585 2,848 794 9 2014-15 1,551 2,946 1,900 1,067 1,308 1,225 3,288 2,109 641
Sr. No. Year
Bajra Other Cereals All Cereals Area Production Yield Area Production Yield Area Production Yield
(1) (2) (12) (13) (14) (15) (16) (17) (18) (19) (20) 1 1960-61 1,635 489 299 480 272 567 10,606 6,755 637 2 1970-71 2,039 824 404 414 254 614 10,320 4,737 459 3 1980-81 1,534 697 454 451 340 754 10,976 8,647 788 4 1990-91 1,940 1,115 575 432 443 1,025 11,136 10,740 964 5 2000-01 1,800 1,087 604 664 544 819 9,824 8,497 865 6 2010-11 1,035 1,123 1,086 1,068 2,749 2,575 8,985 12,317 1,371 7 2012-13 788 502 637 1,020 1,993 1,954 7,442 8,882 1,193 8 2013-14 762 788 1,035 1,129 3,295 2,919 8,109 11,519 1,421 9 2014-15 865 538 622 1,288 2,366 1,838 8,059 9,267 1,150
Sr. No. Year
Tur Gram Moong Area Production Yield Area Production Yield Area Production Yield
(1) (2) (21) (22) (23) (24) (25) (26) (27) (28) (29) 1 1960-61 530 468 883 402 134 333 0 0 0 2 1970-71 627 271 432 310 87 281 0 0 0 3 1980-81 644 319 495 410 137 335 0 0 0 4 1990-91 1,004 419 417 668 355 532 0 0 0 5 2000-01 1,096 660 602 676 351 519 714 244 341 6 2010-11 1,302 976 750 1,438 1,300 904 554 372 672 7 2012-13 1,214 1,006 829 1,135 868 765 431 211 490 8 2013-14 1,141 1,034 906 1,520 1,401 922 431 200 465 9 2014-15 1,210 353 292 1,427 1,088 762 315 84 268
Sr. No. Year
Udid Other Pulses All Pulses Area Production Yield Area Production Yield Area Production Yield
(1) (2) (30) (31) (32) (33) (34) (35) (36) (37) (38) 1 1960-61 0 0 0 1,417 387 273 2,349 989 421 2 1970-71 0 0 0 1,629 319 196 2,566 677 264 3 1980-81 0 0 0 1,661 369 222 2,715 825 304 4 1990-91 0 0 0 1,585 667 421 3,257 1,441 442 5 2000-01 574 205 357 497 177 356 3,557 1,637 460 6 2010-11 482 329 682 262 119 455 4,038 3,096 767 7 2012-13 360 214 593 182 61 335 3,323 2,360 710 8 2013-14 334 206 617 227 100 438 3,653 2,941 805 9 2014-15 277 92 333 184 64 346 3,413 1,681 493
(Contd.)

Economic Survey of Maharashtra 2015-16
97
ANNEXURE 7.1 (Contd.) Area :'000 ha Production : '000 MT Yield : Kg per ha. Foodgrains
Sr. No. Year Total Foodgrains Groundnut Soyabean
Area Production Yield Area Production Yield Area Production Yield (1) (2) (39) (40) (41) (42) (43) (44) (45) (46) (47)
1 1960-61 12,955 7,744 598 1,083 800 739 0 0 0
2 1970-71 12,886 5,414 420 904 586 649 0 0 0
3 1980-81 13,691 9,472 692 695 451 648 0 0 0
4 1990-91 14,393 12,181 846 864 979 1,132 201 190 947
5 2000-01 13,382 10,133 757 490 470 958 1,142 1,266 1,109
6 2010-11 13,023 15,413 1,183 395 470 1,290 2,729 4,316 1,581
7 2012-13 10,765 11,242 1,044 308 337 1,094 3,064 4,690 1,531
8 2013-14 11,762 14,460 1,229 326 417 1,280 3,520 4,273 1,214
9 2014-15 11,472 10,948 954 327 379 1,160 3,640 1,821 500
Sr. No. Year Safflower Other Oilseeds All Oilseeds
Area Production Yield Area Production Yield Area Production Yield (1) (2) (48) (49) (50) (51) (52) (53) (54) (55) (56)
1 1960-61 331 0 0 454 0 0 1,868 0 0
2 1970-71 406 102 252 408 65 159 1,718 753 438
3 1980-81 480 174 363 605 103 170 1,780 728 426
4 1990-91 634 258 408 1,127 455 404 2,826 1,882 666
5 2000-01 296 122 412 631 241 382 2,559 2,099 820
6 2010-11 173 94 544 331 176 532 3,628 5,056 1,394
7 2012-13 105 58 549 214 74 349 3,691 5160 1,398
8 2013-14 126 82 654 209 94 450 4,182 4,866 1,163
9 2014-15 74 26 353 169 51 302 4,211 2,278 541 Cash crops
Sr. No.
Year
Sugarcane Cotton (lint) Tobacco
Harvested Area
Area Production Yield (in MT)
Area Production Yield Area Production Yield
(1) (2) (57) (58) (59) (60) (61) (62) (63) (64) (65) (66)
1 1960-61 155 155 10,404 66.92 2,500 1,673 114 25 12 480
2 1970-71 167 204 14,433 86.53 2,750 484 30 12 5 448
3 1980-81 258 319 23,706 91.74 2,550 1,224 82 12 8 648
4 1990-91 442 536 38,154 86.40 2,721 1,875 117 8 8 1,039
5 2000-01 595 687 49,569 83.27 3,077 1,803 100 8 9 1,148
6 2010-11 965 1,041 85,691 88.85 3,942 7,473 322 1 1 994
7 2012-13 938 1,067 75,335 80.00 4,187 6,793 276 1 1 1,050
8 2013-14 937 1,048 83,954 90.00 4,160 8,835 361 2 2 1,147
9 2014-15 1,030 987 91,538 89.00 4,190 3,577 145 1 2 1,608
Source – Commissionerate of Agriculture, GoM
Note – (1) Information is based on final forecast.
(2) Production of cotton in 170 kg/bale in 'ooo bales.

Economic Survey of Maharashtra 2015-16
98ANNEXURE 7.2
CROPWISE INDEX NUMBERS OF AGRICULTURAL PRODUCTION IN THE STATE
(Triennial average - Base: 1979-82=100)
Groups/Crops Weight 1982-83 1990-91 2000-01 2010-11 2012-13 2013-14 2014-15
(1) (2) (3) (4) (5) (6) (7) (8) (9)
1. Foodgrains—
(a) Cereals—
(i) Rice 9.49 87.4 106.1 87.4 122.1 138.4 141.3 133.4
(ii) Wheat 5.92 80.6 93.9 97.9 237.7 123.9 165.5 135.1
(iii) Jowar 22.16 95.5 121.1 81.4 70.5 43.0 50.7 43.1
(iv) Bajra 3.08 64.2 154.3 150.5 155.5 69.5 109.1 74.5
(v) Barley 0.02 37.7 17.0 13.2 188.7 N.A. N.A. N.A.
(vi) Maize 0.46 36.9 105.2 253.8 2,180.5 1,528.5 2,715.1 1,844.6
(vii) Ragi 0.85 92.0 98.4 60.8 55.5 65.7 67.1 56.3
(viii) Kodra 0.05 73.7 66.6 43.6 23.6 N.A. N.A. N.A.
(ix) Other cereals 0.19 76.7 150.8 162.5 26.1 48.2 46.6 70.8
Total - Cereals 42.22 88.5 115.7 91.9 134.2 94.3 120.6 98.5
(b) Pulses—
((i) Gram 1.47 78.4 215.8 213.3 790.7 527.9 986.4 661.4
(ii) Tur 5.45 96.1 105.2 166.0 245.3 252.9 259.9 88.8
(iii) Other pulses 3.52 112.5 160.0 150.0 196.5 116.5 123.2 15.1
Total - Pulses 10.44 99.2 139.2 167.3 305.6 245.6 316.1 144.6
Total - Foodgrains 52.66 90.6 120.4 106.8 168.2 124.3 159.4 107.6
2. Non-Foodgrains (a) Oil Seeds— (i) Groundnut 7.23 71.4 158.9 76.2 74.3 38.3 163.8 61.5
(ii) Sesamum 0.57 94.2 223.7 88.9 58.9 32.4 32.4 12.2
(iii) Rape, mustard and linseed 0.78 73.4 86.5 30.8 5.1 3.4 20.3 9.0
(iv) Castor seed 0.01 25.0 166.7 358.3 333.3 416.7 416.7 525.6
(v) Sunflower 0.57 76.8 609.8 352.3 267.3 68.3 88.4 88.4
Total - Oil seeds 9.16 73.3 184.8 90.6 79.8 37.3 60.1 56.1
(b) Fibres—
(i) Cotton 9.89 110.4 128.6 123.6 512.3 465.7 605.6 245.2
(ii) Mesta 0.04 44.5 38.0 36.5 26.4 29.2 N.A. N.A.
Total - Fibres 9.93 110.1 128.2 123.2 510.4 463.9 603.2 244.2
(c) Miscellaneous—
(i) Sugarcane 25.97 114.3 158.2 186.9 297.2 292.5 289.9 345.1
(ii) Tobacco 0.14 68.3 117.3 138.1 32.7 0.0 N.A. N.A.
(iii) Potato 0.22 84.2 120.9 121.9 N.A. N.A. N.A. N.A.
(iv) Chilli 1.92 107.1 102.2 82.0 N.A. N.A. N.A. N.A.
Total- Miscellaneous 28.25 113.3 153.9 179.0 273.4 268.9 266.5 317.3
Total — Non - Foodgrains 47.34 104.9 154.5 150.2 285.6 265.0 297.2 251.4
All Crops 100.00 97.4 136.5 127.4 223.8 190.9 224.6 175.7
Source - Commissionerate of Agriculture, GoM N.A. Not Available
Note – Index numbers for 2010-11 to 2014-15 are provisional

Economic Survey of Maharashtra 2015-16
99
ANNEXURE 7.3
TOTAL NUMBER, AREA AND AVERAGE SIZE OF OPERATIONAL HOLDINGS IN THE STATE ACCORDING TO AGRICULTURAL CENSUSES
Sr. No.
Size class (ha)
Number of operational holdings ('00)
1970-71 1980-81 1990-91 1995-96 2000-01 2005-06 2010-11
(1) (2) (3) (4) (5) (6) (7) (8) (9)
1 Below 0.5 6,834 9,914 16,672 22,409 27,462 31,658 36,457
2 0.5—1.0 5,585 9,345 16,075 20,252 25,595 29,525 30,633
3 1.0—2.0 8,783 15,409 27,276 31,755 36,056 41,503 40,523
4 2.0—3.0 6,266 10,275 13,969 14,745 15,791 17,020 15,463
5 3.0—4.0 4,606 6,583 7,289 6,774 6,949 7,496 6,128
6 4.0—5.0 3,576 4,601 4,469 3,874 3,780 4,037 3,142
7 5.0—10.0 8,715 9,316 7,241 5,558 4,873 5,214 3,964
8 10.0—20.0 4,180 2,819 1,530 1,029 773 622 590
9 20.0 and above 961 363 176 132 97 81 89
Total 49,506 68,625 94,697 1,06,528 1,21,376 1,37,156 1,36,989
Sr. No.
Size class (ha)
Area of operational holdings ('00 ha)
1970-71 1980-81 1990-91 1995-96 2000-01 2005-06 2010-11
(1) (2) (10) (11) (12) (13) (14) (15) (16)
1 Below 0.5 1,634 2,630 4,119 5,746 7,328 7,740 9,180
2 0.5—1.0 4,142 7,103 12,057 15,120 19,159 20,274 22,680
3 1.0—2.0 12,842 23,337 39,833 46,059 51,271 52,476 57,390
4 2.0—3.0 15,386 25,363 33,689 35,420 37,414 37,542 36,681
5 3.0—4.0 15,920 22,815 25,108 23,303 23,676 23,756 20,974
6 4.0—5.0 15,961 20,556 19,864 17,210 16,717 16,717 13,901
7 5.0—10.0 61,213 63,937 48,700 37,150 32,084 32,135 26,027
8 10.0—20.0 56,302 37,213 19,749 13,514 9,961 6,776 7,524
9 20.0 and above 28,394 10,662 6,129 5,274 3,418 2,634 3,314
Total 2,11,794 2,13,616 2,09,248 1,98,796 2,01,028 2,00,050 1,97,671
Sr. No.
Size class (ha)
Average size of holdings (ha)
1970-71 1980-81 1990-91 1995-96 2000-01 2005-06 2010-11
(1) (2) (17) (18) (19) (20) (21) (22) (23)
1 Below 0.5 0.24 0.27 0.25 0.26 0.27 0.24 0.25
2 0.5—1.0 0.74 0.76 0.75 0.75 0.75 0.69 0.74
3 1.0—2.0 1.46 1.51 1.46 1.45 1.42 1.26 1.42
4 2.0—3.0 2.46 2.47 2.41 2.40 2.37 2.21 2.37
5 3.0—4.0 3.46 3.47 3.44 3.44 3.41 3.17 3.42
6 4.0—5.0 4.46 4.47 4.44 4.44 4.42 4.14 4.42
7 5.0—10.0 7.02 6.86 6.73 6.68 6.58 6.16 6.57
8 10.0—20.0 13.47 13.20 12.91 13.13 12.89 10.89 12.75
9 20.0 and above 29.55 29.37 34.82 39.95 35.24 32.52 37.24
Total 4.28 3.11 2.21 1.87 1.66 1.46 1.44
Source - Commissionerate of Agriculture, GoM

Economic Survey of Maharashtra 2015-16
100
ANNEXURE 7.4
LAND UTILISATION STATISTICS OF THE STATE
(Area '000 ha)
Year
Geogra- phical area
Area under forests
Land not available for cultivation Other uncultivated land Fallow lands Cropped Area
Gross cropped
area Barren
and unculti-vable land
Land put to non-
agricul- tural uses
Cultur- able
waste land
Perma- nent
pastures and
grazing land
Land under
miscel- laneous
tree crops and
groves
Current fallows
Other fallows
Net area sown
Area sown more than once
(1) (2) (3) (4) (5) (6) (7) (8) (9) (10) (11) (12) (13)
1986-87 30,758 5,350 1,679 1,152 1,044 1,367 196 909 1,057 18,004 2,320 20,324
1990-91 30,758 5,128 1,622 1,091 966 1,125 301 898 1,063 18,565 3,295 21,859
1995-96 30,758 5,148 1,544 1,349 960 1,166 292 1,072 1,248 17,980 3,524 21,504
2000-01 30,758 5,150 1,544 1,364 959 1,168 327 1,126 1,276 17,844 3,775 21,619
2005-06 30,758 5,212 1,720 1,407 914 1,252 249 1,327 1,204 17,473 5,083 22,556
2010-11 30,758 5,216 1,731 1,449 919 1,242 250 1,366 1,179 17,406 5,769 23,175
2011-12 30,758 5,211 1,728 1,451 919 1,244 250 1,378 1,192 17,386 5,720 23,106
2012-13 30,758 5,207 1,722 1,456 916 1,245 251 1,418 1,200 17,344 5,772 23,116
2013-14 30,758 5,205 1,723 1,460 915 1,242 249 1,401 1,192 17,368 6,012 23,380
Source - Commissionerate of Agriculture, GoM
Note - Figures for the years 2010-11 to 2013-14 are provisional.

Economic Survey of Maharashtra 2015-16
101
ANNEXURE 7.5
AREA UNDER IRRIGATION IN THE STATE
('000 ha)
Sr. No. Year
Area irrigated Intensity of irrigated cropping
No. of irrigation
Wells ('000)
Net area irrigated per well
(ha.)
Gross cropped
area
Percentage of gross irrigated area to gross cropped area
Wells Other sources Net Gross
(1) (2) (3) (4) (5) (6) (7) (8) (9) (10) (11)
1 1960-61 595 477 1,072 1,220 114 542 1.10 18,823 6.5
2 1970-71 768 579 1,347 1,570 117 694 1.11 18,737 8.4
3 1980-81 1,055 780 1,835 2,415 132 826 1.28 19,642 12.3
4 1990-91 1,672 999 2,671 3,319 124 1,017 1.64 21,859 15.2
5 2000-01 2,262 987 3,249 3,852 119 1,318 1.72 21,619 17.8
6 2001-02 2,146 990 3,136 3,727 119 1,322 1.52 20,991 17.8
7 2002-03 2,145 1,071 3,216 3,806 118 1,331 1.61 20,915 18.2
8 2003-04 1,914 1,030 2,944 3,636 123 N.A. N.A. 22,190 16.4
9 2004-05 1,942 1,001 2,993 3,665 125 N.A. N.A. 22,376 16.4
10 2005-06 2,077 1,070 3,147 3,810 118 N.A. N.A. 22,556 16.9
11 2006-07 2,109 1,137 3,246 3,958 122 N.A. N.A. 22,557 17.6
12 2007-08 2,151 1,160 3,311 4,037 122 N.A. N.A. 22,655 17.8
13 2008-09 2,115 1,140 3,255 3,970 122 N.A. N.A. 22,454 17.7
14 2009-10 2,159 1,162 3,321 4,050 122 N.A. N.A. 22,612 17.9
15 2010-11 N.A. N.A. N.A. N.A. N.A. N.A. N.A. 23,175 N.A.
16 2011-12 N.A. N.A. N.A. N.A. N.A. N.A. N.A. 23,106 N.A.
17 2012-13 N.A. N.A. N.A. N.A. N.A. N.A. N.A. 23,115 N.A.
18 2013-14 N.A. N.A. N.A. N.A. N.A. N.A. N.A. 23,380 N.A.
Source - Commissionerate of Agriculture, GoM
Note - (1) Details may not add up to the totals due to rounding.
(2) Intensity under Col. No. 7 is worked out by using the formula (Col. No. 6 ÷ Col. No. 5) x 100.
(3) Figures for the years 2003-04 to 2013-14 are provisional.
(4) As per the recommendations of SIT, various committees /sub-committees are formed to decide further line of action.
N. A. Not Available

Economic Survey of Maharashtra 2015-16
102
ANNEXURE 7.6
IRRIGATION & NON-IRRIGATION WATER CHARGES LEVIED, RECOVERED AND OUTSTANDING
(` crore)
Year Water charges levied Recovery Outstanding at the end of year
Irrigation Non-
Irrigation
Total Irrigation Non-
Irrigation
Total Irrigation Non-
Irrigation
Total
(1) (2) (3) (4) (5) (6) (7) (8) (9) (10)
2000-01 74.48 362.60 437.08 41.23 153.99 195.22 223.39 571.30 794.69
2001-02 84.72 368.83 453.55 43.57 208.12 251.69 264.54 732.01 996.55
2002-03 83.17 360.68 443.85 42.02 335.50 377.52 303.79 751.99 1,055.78
2003-04 93.03 360.26 453.29 42.89 335.20 378.09 376.63 353.06 729.69
2004-05 78.69 418.44 497.13 45.78 402.57 448.35 415.59 378.59 794.18
2005-06 68.25 350.28 418.53 64.03 349.45 413.48 410.18 282.09 692.27
2006-07 90.70 408.75 499.45 74.72 420.26 494.98 427.01 245.82 672.82
2007-08 110.35 563.89 674.24 70.47 556.54 627.01 473.70 275.20 748.90
2008-09 112.95 695.37 808.32 71.05 602.11 673.16 531.10 466.38 1,004.61
2009-10 95.00 715.11 810.11 69.94 732.69 802.63 561.77 466.38 1,028.15
2010-11 96.24 670.46 766.70 79.03 666.87 745.90 745.90 468.62 1,047.90
2011-12 109.73 541.06 650.79 79.13 541.13 620.26 608.87 461.74 1,070.61
2012-13 82.98 670.12 753.10 63.10 443.05 506.15 618.78 656.52 1275.30
2013-14 70.37 536.67 607.04 57.57 457.20 514.77 631.49 728.24 1,359.73
2014-15 78.15 593.59 671.74 61.97 574.53 636.50 648.29 695.80 1,344.09
Source – Water Resource Department, GoM.

Economic Survey of Maharashtra 2015-16
103
ANNEXURE 7.7
LIVESTOCK AND POULTRY IN MAHARASHTRA STATE
('000)
Sr. No.
Livestock Census Year
Cattle Buffaloes Sheep and goats
Other
live stock+
Total live
stock
Sheep and goats per hundred
hectares of grazing and
pasture land (No.)
No. of Livestock
per hundred
hectares of net area cropped
(No.)
Livestock per lakh of population
Total poultry$
(1) (2) (3) (4) (5) (6) (7) (8) (9) (10) (11)
1 1961 . . 15,328 3,087 7,273 360 26,048 512 144 66 10,578
2 1966 . . 14,729 3,042 7,326 352 25,449 522 140 57 9,902
3 1972 . . 14,705 3,301 8,038 317 26,361 491 164 52 12,217
4 1978 . . 15,218 3,899 10,199 326 29,642 650 162 51 18,751
5 1982 . . 16,162 3,972 10,376 409 30,919 673 175 48 19,845
6 1987 . . 16,983 4,755 12,068 449 34,255 950 189 48 24,830
7 1992 . . 17,441 5,447 13,016 489 36,393 940 202 46 32,187
8 1997 . . 18,071 6,073 14,802 692 39,638 1,104 223 50 35,392
9 2003 . . 16,738 6,084 13,624 612 37,058 1,016 213 36 34,596
10 2007 . . 16,184 6,073 13,301 397 35,954 1,064 206 37 64,800@
11 2012 . . 15,484 5,594 11,016 395 32,489 885 187 29 77,795@
Source - Livestock Census
Note - Details may not add up to totals due to rounding.
+ 'Other livestock' includes pigs, horses and ponies, mules, camels, donkeys.
$ Total poultry includes Turkey, Quail & other birds. @ Total poultry includes birds in poultry farm.

8Industry & Co-operation

Economic Survey of Maharashtra 2015-16
8. INDUSTRY AND CO-OPERATION
INDUSTRY 8.1 Maharashtra is one of the most industrialised states in the country. The State has identified industrial sectors like Auto, Engineering, Electronics, Textile and Defence as focus sectors considering the national and international trends and potential of the resources in the State. Recently, the State has formulated Retail Trade Policy-2016, Electronics Policy-2016, Single Window Policy-2016, Policy for SC / ST Entrepreneurs and Policy for IT & ITeS-2015. MAITRI (Maharashtra Industry, Trade and Investment facilitation) cell has been set up at Mumbai to facilitate clearances and help in expediting setting up of industrial units. Such cell has also been set up at each Regional Headquarter to assist MSMEs. 8.1.1 The State has been proactive in expediting reforms and clearances for setting up and running of industries. To showcase the strengths of manufacturing sector in India to the world, a ‘Make in India’ event was organised in Mumbai. The event created a renewed enthusiasm and overwhelming response from the investors for making investments in the State.
Annual Survey of Industries
8.2 The Annual Survey of Industries (ASI), the major source of industrial statistics, provides estimates of various aggregates like fixed & working capital, input, output, value added, employment etc. pertaining to organised manufacturing sector. ASI covers all factories registered under the sections 2 m(i) and 2m(ii) of the Factories Act, 1948 and Beedi & Cigar units registered under Beedi & Cigar Workers (Conditions of Employment) Act, 1966.
8.2.1 ASI 2013-14 provisional results reveal that Maharashtra is at the top position in terms of Gross value added and wages to workers with share of 21.2 per cent and 16.1 per cent at All-India level. The State is at second position in number of factories, number of workers and fixed capital with share of 13 per cent, 12.6 per cent and 13.8 per cent respectively.
8.2.2 The contribution of the State in total value of output, working capital and in the Net Value Added (NVA) in the country was 16.2 per cent, 18.2 per cent & 22 per cent respectively. Selected indicators of industries are given in Table 8.1.
Table 8.1 Selected indicators of industries (` crore)
Particulars 2012-13 2013-14* Maharashtra India Percentage
to India Maharashtra India Percentage
to India Industries (no.) 28,949 2,22,120 13.0 29,123 2,24,574 13.0 Fixed capital 3,44,930 21,80,260 15.8 3,26,362 23,74,383 13.8 Working capital 1,01,692 6,03,411 16.9 1,20,418 6,62,980 18.2 Total output 10,22,032 60,25,945 17.0 10,65,925 65,71,052 16.2 Total input 8,19,454 50,18,665 16.3 8,37,427 54,91,031 15.3 Gross value added 2,02,578 10,07,279 20.1 2,28,498 10,80,021 21.2 Net value added 1,78,729 8,51,949 21.0 2,00,440 9,09,629 22.0 Employment (in lakh) 12.33 100.52 12.3 13.12 104.28 12.6 Profit 1,01,640 4,44,262 22.9 1,19,537 4,53,789 26.3 Source : Central Statistics Office, GoI * Provisional

Economic Survey of Maharashtra 2015-16
106
8.2.3 Major industries in terms of total value of output during 2013-14 are coke, refined petroleum products (15.2 per cent), food products (11.4 per cent), basic metals (10.9 per cent), chemicals & chemical products (9 per cent) and motor vehicles, trailers (7.5 per cent). These industry groups accounted for 54 per cent value of output of all industries and 47.7 per cent of fixed capital during 2013-14. Important characteristics of industries in the State according to ASI are given in Annexure 8.1.
8.2.4 ASI 2013-14 reveals that per factory ‘value of goods & services produced’ and ‘net value added’ in the State are higher by 3.7 and 11.5 per cent respectively than the previous year. Important indicators are given in Table 8.2.
Index of Industrial Production 8.3 The growth of the industrial sector is measured using Index of Industrial Production (IIP). The present index of industrial production covers mining, manufacturing and electricity sectors. The Central Statistics Office (CSO) compiles and releases monthly All-India IIP. The average All-India IIP (base year 2004-05) has increased from 172.7 in April-December, 2014 to 178.1 in April-December, 2015. As per this index, the average growth during April-December, 2015 was 3.1 per cent as against 2.6 per cent for the corresponding period of the previous year. Detailed information of IIP at All-India is given in Annexure 8.2. Groupwise All-India IIP is given in Table 8.3.
Table 8.2 Important indicators (` lakh)
Indicator 2012-13 2013-14*
Maharashtra India Maharashtra India a) Per factory Investment in fixed capital 1,192 982 1,121 1,057 Value of goods & services produced 3,530 2,713 3,660 2,926 Net value added 617 384 688 405 Employment (no.) 43 45 45 46 b) Per worker Net value added 14.5 8.5 15.3 8.7 Annual wages 1.4 1.1 1.6 1.2 Source : Central Statistics Office, GoI * Provisional

Economic Survey of Maharashtra 2015-16
107
Industrial Investment 8.4 During the ‘Make in India’ event, 2,594 MoUs (Memorandum of Understanding) with proposed investment of ` 7,94,057 crore and expected employment of 30.9 lakh were signed by the State. The energy sector has attracted proposals with highest investment of ` 2,30,627 crore (29 per cent), followed by manufacturing sector ` 1,65,909 crore (20.9 per cent).
8.4.1 The State has attracted highest number of industrial proposals having maximum employment potential. Since August, 1991 to October, 2015, in all 19,053 industrial proposals with an investment of ` 10,97,337 crore were approved. Out of these, 8,497 projects (44.6 per cent) with an investment of ` 2,62,631 crore (23.9 per cent) with proposed employment of 11.24 lakh were commissioned and 2,108 projects with an investment of ` 87,701 crore & proposed employment of 3.98 lakh are under execution. Of the total proposals received in the country, the State’s share in number of proposals & investment is about 18 per cent and 10 per cent respectively. During 2014-15, in all 279 projects with an investment of ` 45,010 crore with proposed employment of 0.7 lakh were approved. During 2015-16, upto October, 218 projects with an investment of ` 18,759 crore were approved. Of these, 16 projects with an investment of ` 1,069 crore were commissioned.
8.4.2 The IT industry has attracted 453 proposals with highest investment of ` 3,86,711 crore (35.2 per cent), followed by fuel industry with an investment of ` 1,42,839 crore (13 per cent). These two industries accounted for almost 50 per cent of the total approved investment.
8.4.3 Of the total approved proposals, the major industries by number are chemical & fertilizer (14.9 per cent), textiles (10.5 per cent), metallurgical (10 per cent), sugar (8 per cent), electrical & electronics (6.2 per cent), processed food (5.5 per cent) and photographic raw film & papers (5.2 per cent). These seven industries together accounted for almost 61 per cent of total approved and commissioned proposals. However, their share in investment was 29.2 per cent in approved and 42.6 per cent in commissioned proposals.
8.4.4 The total investment in commissioned projects was ` 2,62,631 crore, of which share of investment of IT industry (20.7 per cent) was highest, followed by metallurgical (14 per cent), fuel (10.7 per cent), transportation (9.4 per cent) and chemical & chemical fertilizers (8.5 per cent). These five industries together accounted for 63.3 per cent of total investment. The industrywise projects approved and commissioned in the State are given in Table 8.4.
Table 8.3 Groupwise Index of Industrial Production in India (Base year 2004-05=100)
Item Weight April to December Per cent change 2014-15 2015-16@
General Index 100.00 172.7 178.1 3.1 Mining 14.16 122.5 125.3 2.3 Manufacturing 75.53 181.0 186.6 3.1 Electricity 10.31 180.4 188.5 4.5
Source : Central Statistics Office, GoI @ quick estimates

Economic Survey of Maharashtra 2015-16
108
Investment in Mega Projects 8.4.5 During 2005 to 31st October, 2015, the State has approved 454 mega projects with an investment of ` 3,54,680 crore and proposed employment of about 3.88 lakh by issuing offer letters. Of these, 137 projects with an investment of ` 53,018 crore and proposed employment of 0.84 lakh were issued eligibility certificates. Investment in Micro, Small and Medium Enterprises 8.4.6 The manufacturing and services categories of enterprises have been classified into micro, small and medium enterprises (MSMEs) based on their investments in plant & machinery for manufacturing enterprises and on equipments in case of enterprises providing services. As per fourth census of MSME 2006-07, as on 31st March, 2007, in all 86,635 MSMEs were working in the State with an investment of ` 14,859 crore and employment of 10.95 lakh. Upto September, 2015, in all 2,43,721 MSME units, with an investment of ` 56,552 crore, generating employment of 29.19 lakh were functioning. Yearwise investment & employment in MSMEs and divisionwise information of MSMEs is given in Table 8.5 & Table 8.6.
Table 8.4 Industrywise approved proposals and commissioned projects (August, 1991 to October, 2015)
Industry type Approved proposals Commissioned projects
No. Investment ( ` crore)
No. Investment ( ` crore)
IT Industry 453 3,86,711 243 54,251 Fuel 815 1,42,839 195 28,025 Metallurgical 1,909 1,00,997 935 36,709 Chemical & Fertilizer Textiles
2,839 1,998
59,901 49,981
1,386 933
22,248 16,939
Sugar 1,532 38,424 235 8,402 Transportation 421 32,149 285 24,554 Photographic Raw Film & Papers 981 28,419 570 13,988 Cement Gypsum 368 24,578 148 5,597 Industrial Machinery 851 24,204 509 8,802 Electrical & Electronics 1,174 22,429 683 7,814 Processed Food 1,046 20,258 440 5,782 Vegetable Oil & Vanaspati 373 16,091 203 2,332 Pharmaceuticals 854 16,028 496 4,341 Paper & paper products 538 15,826 271 7,586 Engineering 344 12,367 193 4,144 Machine Tools/Ceramics/Misc.Inds. 457 7,961 282 4,161 Others 2,100 98,174 490 6,956 Total 19,053 10,97,337 8,497 2,62,631 Source : Directorate of Industries, GoM
Table 8.5 Yearwise Investment & Employment in MSMEs
Year MSMEs
Investment (` crore)
Employment (in lakh)
2007-08 2008-09
10,244 11,682
2,281 3,295
1.39 1.71
2009-10 11,896 3,028 1.50 2010-11 14,496 5,563 1.87 2011-12 15,606 4,443 2.07 2012-13 16,136 5,455 2.06 2013-14 19,814 6,358 2.48 2014-15 36,992 7,180 3.50 2015-16+ 20,220 4,090 1.66 Source: Directorate of Industries, GoM + upto September
Table 8.6 Divisionwise Information of MSMEs (upto September, 2015)
Division MSMEs Per cent share
Employment (in lakh)
Per cent share
Mumbai 24,786 10.2 4.05 13.9 Konkan (Excl. Mumbai)
39,269 16.1 6.32 21.7
Nashik 27,458 11.3 3.15 10.8 Pune 92,233 37.8 10.05 34.4 Aurangabad 18,751 7.7 1.93 6.6 Amravati 14,510 5.9 1.14 3.9 Nagpur 26,714 11.0 2.55 8.7 Total 2,43,721 100.0 29.19 100.0
Source: Directorate of Industries, GoM

KPNAAN
T
Exports 8.5 Thegems & garments, agro-basedpharmaceurecognise boost the giving awimplementindustries Exports frTable 8.7. Financia8.6 Staand centrafinancial aAnnexure Special E8.7 The2006 and 70 SEZs wcrore on anapproved a
IT Parks8.8 MaTechnologinvestment8.8.1 Foprivate IT ` 3,642 cinvestmentprivate IT (4), Auran
Table 8.8
Division
Ap
Konkan Pune Nashik Aurangabad Amravati Nagpur
Total Source : Direc
from Mae main pro jeweller
cotton yd productsuticals andthe effortsexports, th
wards baseting space rfor particip
from Maha
al Assistanate level finaal level insassistance t8.3.
Economice State has has receive
were denotifn area of 3
and notified
s aharashtra gy Parks of ts of ` 18,0r getting prparks have
crores creatts of ` 8,96parks are lo
ngabad (3) a
Approved
No. of SE
pproved Notified
31 22 22 19
2 1 6 5 2 1 6 4
69 52 ctorate of Indus
aharashtraoducts expory, petrocyarn, metals, engineerd plastic put up byhe State is ed on exprent subsidypation in inarashtra and
nce to Indancial institstitutions likto industrie
c Zones adopted the
ed 241 SEZfied or with3,059 ha whSEZs is giv
Industrial f India (STP000 crore gerivate partice been apprting 4.86 l62 crores arocated in Pu
and Wardha
d and notifi
EZ
d Executed A
6 14
0 2 1 2
25 stries, GoM
a rted from t
chemicals, l & metaring items& plastic y the expo
taking iniport perfory scheme fornternational d India ar
dustries tutions like ke LIC of es in the S
e Special EZ proposals
hdrawn and hich generaen in Table
DevelopmPI) have deenerating 2.cipation in roved. Of thakh employre expectedune (172), G(1) districts
fied SEZs
Area (
Approved Notifi
8,977 2,51797 76
1,107 1,00 576 47 200 152,850 1,74
14,507 6,65
the State arreadymad
al products, drugs &
items. Trters and titiatives likrmance anr small scalexhibitions
re given i
SICOM LtdIndia, GIC
State. The
Economic Zos upto Octo25 SEZs we
ated employ8.8.
ment Corpveloped 3768 lakh empcreating wohese 160 ITyment. Th
d to generateGreater Mus.
(ha)
ied Executed
17 261 67 724 07 0 74 225 50 150 40 1,699
55 3,059
re de s, &
To to ke nd le s. in
d., MaharasC of India, e informati
one (SEZ) pober, 2015.ere executed
yment of abo
oration (M7 public IT ployment. orld class iT parks are he remainie 11.95 lakh
umbai (158)
Table 8
Year
2011-12
2012-13
2013-14
2014-152015-16
Source : Di
Employm
Approved Not
14.85 87.61 71.75 0.63 00.45 05.41 3
30.70 20
Economic Su
shtra State FIFCI Ltd.,
on about t
policy with As on 31
d with total iout 3.59 lak
MIDC), CIparks whic
infrastructurfunctioning
ng 312 ITh employm, Thane (12
8.7 Export and Ind
Maha
2 3,9
3 3,6
4 4,3
5 4,46+ 2,8
rectorate of Indu
ment (lakh)
tified Executed
8.22 1.64 7.08 1.78 1.25 0 0.23 0.16 0.05 0 3.87 0.01
0.70 3.59
urvey of Mahara
Financial Co, SIDBI, etthe same i
effect from1st October investment okh. The info
IDCO andch are funct
re for IT ing with inv
T parks witment opportu29), Nagpur
s from Madia
arashtra
4,005
1,460
4,591
5,349
7,007
stries, GoM +
(upt Investme
Approved
49,557 35,131 1,843 1,774 800 8,519
97,624
ashtra 2015-16
109
orporationstc. provides given in
m February,2015, total
of ` 32,255ormation of
d Softwaretioning with
ndustry, 472vestments oth proposedunities. Ther (5), Nashik
harashtra
( crore)
India
14,59,280
15,46,766
18,31,009
18,65,589
11,12,616
upto November
to October, 201nt (` crore)
Notified Execu
33,868 7,334,426 12,7
1,380 1,275 4,2
300 23,871 7,7
75,120 32,2
6
n
l
f
e h
2 f d e k
15)
uted
366 702
0 252 235 700
255

Economic Survey of Maharashtra 2015-16
110
Bio-technology Parks 8.9 Bio-technology (BT) policy was declared by the State in 2001. Two public BT parks are developed in the State at MIDC Jalna and MIDC Hinjewadi (Pune). Upto October, 2015, six BT-SEZs were notified in the State and in all 50 MSME & 16 large units are registered with an investment of ` 261 crore and ` 1,120 crore respectively.
Co-operative Industrial Estates 8.10 The State has undertaken a programme of developing industrial estates in areas other than MIDC on co-operative basis. The State Government is providing contribution to share capital and technical guidance for establishing industries. To meet the cost of establishing co-operative industrial estates, the funding pattern is 20 per cent of project cost from the State, 60 per cent loans to be raised from bank/financial institutions and remaining 20 per cent is the contribution of the members of the society as share capital. As on 30th November, 2015, total 142 co-operative industrial estates were registered, of which 102 are functioning, 34 estates are yet to be commissioned and remaining six are in liquidation. In 102 co-operative industrial estates, 7,745 units were in operation with 1.64 lakh employment. The State has provided financial assistance to 93 co-operative industrial estates. Status of co-operative industrial estates is given in Table 8.9.
Package Scheme of Incentives
8.11 In order to encourage the dispersal of industries to the industrially less developed areas, the GoM has been giving a package of incentives for new/expansion units located in such regions. The scheme was amended from time to time and the State has declared Package Scheme of Incentives-2013(PSI), which will remain in operation from April, 2013 to March, 2018. Eligible units in the private sector, state public sector/joint sector, co-operative sector and only mega projects of central public sector are considered for providing incentives under PSI-2013. Under the scheme during 2015-16 upto December, an amount of ` 2,305 crore was disbursed as an incentive to eligible MSMEs, large scale industries and mega projects. The disbursements under the package scheme of incentives are given in Table 8.10.
8.11.1 Disbursement of industrial promotion subsidy & other incentives under PSI to mega, large projects and MSMEs in the last three years are given in Table 8.11.
Table 8.9 Status of co-operative industrial estates ( upto November, 2015)
Division Sanctioned Functioning Industrial units in operation
Share capital (` crore)
Employment
Greater Mumbai 4 3 479 neg. 24,400 Konkan (excluding Greater Mumbai)
14 12 602 1.01 12,888
Nashik 33 29 2,109 4.92 38,573 Pune 45 38 3,321 7.87 77,978 Aurangabad 26 13 631 1.03 5,946 Amravati 10 3 161 0.03 599 Nagpur 10 4 442 0.97 3,940 Maharashtra 142 102 7,745 15.83 1,64,324 Source: Directorate of Industries, GoM
Table 8.10 Disbursements under package scheme of incentives
(` crore) Year Disbursement
2010-11 700 2011-12 2,366 2012-13 2,480 2013-14 2014-15
2015-16+
2,250 2,500
2,305 Source: Directorate of Industries, GoM + upto December

Economic Survey of Maharashtra 2015-16
111
Industrial Cluster Development Programme 8.12 As a key strategy for enhancing the productivity and competitiveness of MSMEs, GoI has announced scheme for development of potential clusters to facilitate deployment of available resources for effective implementation and more sustainable results in medium to long term.
8.12.1 Micro, Small Enterprises - Cluster Development Programme (MSE-CDP): Under this programme, GoI has approved 16 cluster projects of which two projects have been completed. So far total grants of ` 73.73 crore have been released by GoI. 8.12.2 Industrial Infrastructure Upgradation Scheme: The scheme aims at enhancing competitiveness of industries by providing quality infrastructure through PPP in selected functional clusters. Central assistance upto 75 per cent of the project cost subject to a ceiling of ` 60 crore is given for each approved project. Five cluster projects are approved by GoI, of which three projects are completed and two projects are in various stages of implementation. Under the scheme, upto March, 2015, grants of ` 189.55 crore are released by GoI.
Maharashtra Industrial Development Corporation 8.13 As on 31st March, 2015 about 90 per cent developed plots are allotted to entrepreneurs. Information regarding industrial units in MIDC is given in Table 8.12.
Table 8.11 Industrial promotion subsidy and other incentives under PSI (` crore)
Item Disbursement
2013-14 2014-15 2015-16 + Industrial Promotion subsidy Mega Projects 2,007 2,159 1,972 Large Scale Industries 51 113 89 MSMEs 84 100 134 Other Incentives Large Scale Industries 47 63 51 MSMEs 61 65 59 Total 2,250 2,500 2,305
Source: Directorate of Industries, GoM + upto December
Table 8.12 Industrial units in MIDC (As on 31st March, 2015)
Division Units (no.)
Investment (` crore)
Employment (lakh)
No. of plots
Percentage of allotted plots to developed
plots Developed Allotted
Mumbai 1,012 8,378 1.32 342 339 99.1 Konkan (Excl. Mumbai)
12,076 34,829 3.59 19,715 17,980 91.2
Nashik 7,598 5,846 0.73 11,296 10,426 92.3 Pune 11,067 53,948 4.38 19,176 17,231 89.9 Aurangabad 6,495 7,484 0.65 11,443 10,304 90.0 Amravati 1,937 6,208 0.26 4,820 3,610 74.9 Nagpur 3,486 14,755 0.79 7,168 6,386 89.1 Total 43,671 1,31,448 11.72 73,960 66,276 89.6
Source: MIDC, GoM

Economic Survey of Maharashtra 2015-16
112
Maharashtra Small Scale Industries Development Corporation
8.14 The Maharashtra Small Scale Industries Development Corporation (MSSIDC) assists entrepreneurs for the development of small scale industries. The turnover of MSSIDC is given in Table 8.13.
Maharashtra State Khadi and Village Industries Board
8.15 The main functions of the Maharashtra State Khadi and Village Industries Board (MSKVIB) are to organise, develop and expand activities of Khadi and Village Industries (KVI) in the State. Financial assistance of ` 28.43 crore in the form of subsidy was given to KVI units in 2014-15 and ` 29.02 crore are proposed to be disbursed in 2015-16. Performance of KVI in the State is given in Table 8.14.
8.15.1 Under Artisan Employment Guarantee Scheme, employment opportunities were provided to 2.32 lakh artisans in 2014-15. It is expected that during 2015-16, employment opportunities will be provided to 2.45 lakh artisans.
Minerals 8.16 Amravati, Bhandara, Chandrapur, Gadchiroli, Nagpur and Yavatmal districts in Vidarbha region, Kolhapur & Satara districts in Western Maharashtra and Raigad, Ratnagiri, Sindhudurg & Thane districts in Konkan region have deposits of minerals like coal, limestone, manganese ore, bauxite, iron ore, dolomite, laterite, kyanite, fluorite (graded), chromite, silica sand, quartz, etc. The total potential mineral area in the State is about 58 thousand sq km, which is about 19 per cent of the State’s total geographical area. As on 31st March, 2015, in all 290 mines of major minerals with about 0.6 lakh employment were operational in the State. The total value of minerals extracted during 2014-15 was ` 7,381 crore, of which value of coal extracted was ` 6,083 crore (82.4 per cent). The production of major minerals alongwith their values is given in Annexure 8.4.
Maharashtra Tourism Development Corporation 8.17 Maharashtra Tourism Development Corporation (MTDC) is the nodal agency for implementation of tourism policy in the State. During 2013-14, under centrally sponsored scheme (100 per cent) for five projects ` 67.70 crore were sanctioned and an expenditure of ` 4.57 crore was incurred since then. During 2013-14, for six projects GoM has sanctioned ` 282.45 crore and since then an expenditure of ` 40.93 crore has been incurred. During 2014-15, GoI has not sanctioned any project.
Table 8.13 Turnover of MSSIDC (` crore)
Item 2013-14 2014-15 2015-16+ Marketing assistance 155.24 80.24 49.62 Others 3.78 2.93 1.98 Total 159.02 83.17 51.60
Source : MSSIDC + upto November
Table 8.14 Performance of KVI units
Year Units assisted (lakh)
Value of production (` crore)
Employment (lakh)
2010-11 2.18 1,470 4.3 2011-12 2.15 1,506 4.3 2012-13 2013-14
1.91 1.93
1,376 1,495
3.7 3.4
2014-15 1.60 3,161 1.3 Source : MSKVIB

Economic Survey of Maharashtra 2015-16
113
Graph 8.3 : Working capital & loan in co-operative societies
outstanding
1590
1000
2000
3000
4000
1971
1981
1991
2001
2011
2012
2013
2014
2015
Year
`00
’cro
re
Working capital Outstanding loans
1,48
53,
381
Graph 8.4 : Groupwise composition of co-operative societies and their working capital
Apex & central-Agricultural and non-agricultural credit societiesNon-agricultural credit societiesAgro-processing enterprises
Co-operative societies
Primary agricultural credit societiesMarketing societiesSocial services & other co-op. societies
Working capital 2014-15
9%
10%1%18%
62%
neg.
7%
47%
32%
12%
2%
neg.
CO-OPERATION 8.18 Co-operation plays a distinct and significant role in the process of socio-economic development of the State, particularly in employment generation and social integration. Initially, the movement was confined mainly to the field of agricultural credit, but later spread rapidly in other areas like non-agricultural credit, housing, agro-processing & marketing, industries, labour, transport, etc. However, after globalisation, this sector is facing serious challenges like competition from multinationals, lack of professionalism, resource constraints, etc. In view of this GoM has taken important steps like appointment of subject expert as Director on co-operative institutes; ban on Board of Directors of co-operative banks to contest election for next two terms, if dissolved on corruption charges; performance based awards; etc. 8.19 As on 31st March, 2015 there were about 2.26 lakh co-operative societies in the State, with about 539.30 lakh members. Co-operative societies at a glance is given in Table 8.15 and decadal series is given in Annexure 8.5. Table 8.15 Co-operative societies at a glance
(` crore) Particulars As on 31st March Per cent change
over 2014 2013 2014 2015* Societies (no) 2,30,673 2,30,295 2,25,721 (-)2.0 Members (lakh) 523 523.99 539.30 2.9 Paid-up share capital 17,419 18,892 22,119 17.1 Of which, State Govt. 3,177 5,808 4,214 (-)27.4 Working capital 2,68,713 3,14,922 3,38,074 7.4 Deposits 1,50,344 1,59,322 1,70,739 7.2 Gross loan 1,22,813 1,31,242 1,35,078 2.9 Societies in loss (no) 59,801 59,355 53,242 (-)10.3 Amount of loss 5,087 5,677 6,208 9.4 Loans outstanding 1,29,941 1,33,064 1,48,489 11.6
Source: Office of the Commissioner for Co-operation and Registrar Co-operative Societies, GoM. * Provisional

Economic Survey of Maharashtra 2015-16
114
Agricultural credit 8.20 Agricultural credit co-operative banks have three tier structure and play a lead role in finance and promotion of agriculture & allied activities in the State. Performance of agricultural co-operative banks is given in Table 8.16.
8.21 Primary Agricultural Credit Societies (PACS) provide short-term agricultural credits mainly for seasonal agricultural operations. PACS also include Farmers Service Societies and Adivasi Co-operative Societies. As on 31st March, 2015, about 55.2 per cent PACS were in loss. As compared to last year, number of PACS in loss has decreased by 3.4 per cent and number of loanee members has decreased by 2.7 per cent. Performance of PACS is presented in Table 8.17.
Table 8.16 Performance of agricultural co-operative banks (` crore)
Particulars As on 31st March Per cent change over
2014 2013 2014 2015*
The Maharashtra State Co-operative Bank Ltd. Members (no) 2,000 2,122 2,115 (-)0.3 Working capital 23,923 23,657 20,947 (-)11.5 Deposits 15,426 13,475 9,993 (-)25.8 Gross loans 13,733 16,060 11,743 (-)26.9 Loans outstanding 11,605 10,731 12,007 11.9 Overdues 1,825 1,436 1,259 (-)12.3 District Central Co-operative Banks (31) Members (lakh) 1.63 1.73 1.82 5.2 Working capital 72,610 77,782 84,528 8.7 Deposits 53,382 57,378 61,529 7.2 Gross loan 40,872 40,463 44,231 9.3 Loans outstanding 40,195 40,357 48,147 19.3 Overdues 7,166 9,907 10,674 7.7 Maharashtra State Co-operative Agriculture Rural Multipurpose Development Bank Ltd.@
Members (no) 827 827 827 0.0 Working capital 2,208 2,099 2,110 0.5 Deposits 0.01 0.00 0.00 0.0 Gross loan 0.00 0.00 0.00 0.0 Loans outstanding 1,155 1,043 1,065 2.1 Overdues 1,139 1,042 1,065 2.2 District Co-operative Agriculture Rural Multipurpose Development Banks (29)@
Members (lakh) 11.43 11.23 6.81 (-)39.4 Working capital 1,315 1,023 1,512 47.8 Deposits 0.39 0.3 0.3 0.0 Gross loans - - - - Loans outstanding 304 290 286 (-)1.4 Overdues 278 285 284 (-)0.4 * Provisional @ Under liquidation, hence stopped advancing loans Source: Office of the Commissioner for Co-operation and Registrar Co-operative Societies, GoM

Economic Survey of Maharashtra 2015-16
115
Sugar factories53%
Cotton ginning & pressing
3%
Spinning mills
11%Handloom
1%Powerloom1%
Dairy soci.22%
Dairy unions2%
Fisheries7%
Graph 8.5 : Members in agro-processing co-operatives
2014-15
Dr. Punjabrao Deshmukh Interest Rebate Scheme
8.22 Interest subsidy is given to motivate farmers for timely repayment of the short term crop loan. Under this scheme, three per cent interest subsidy is given for the loan up to ` one lakh and one per cent interest subsidy is given for loan amount exceeding ` one lakh but less than ` three
lakh. The farmer has to repay the loan by 30th June of each year. For 2014-15 an expenditure of ` 127.99 crore is incurred and 11.84 lakh beneficiaries are covered whereas, in 2015-16 (upto January) an expenditure of ` 67.29 crore is incurred and 1.08 lakh beneficiaries are covered.
Agro-Processing Co-operatives 8.23 Agro-processing co-operatives play an important role in the development of rural economy, ensuring reasonable returns to the farmers and also in development of rural industry, thereby generating employment. The State provides financial assistance to societies for setting up agro-processing units. Co-operative sugar factories, cotton ginning & pressing, spinning mills, handloom & powerloom, dairy societies & dairy unions and fisheries societies are the major constituents of agro-processing co-operatives.
Table 8.17 Performance of PACS (` crore)
Particulars As on 31st March Per cent change
over 2014 2013 2014 2015*
Societies (no) 21,238 21,185 21,064 (-)0.6 Members (lakh) 161 151 144 (-)4.6 Working capital 16,617 20,309 22,603 11.3 Own funds 2,901 3,488 4,696 34.6 Share capital 1,973 2,407 2,636 9.5 Of which, State Government 6 7 6 (-)14.3 Loanee members (lakh) 36.41 37.95 36.91 (-)2.7 Of which, percentage of 1) Marginal farmers (up to 1 ha) 28.3 28.8 31.5 NA 2) Small farmers (1 to 2 ha) 24.3 23.9 25.1 NA Loans disbursed 8,547 12,826 14,030 9.4 Of which, given to Small & Marginal farmers 4,221 4,829 6,388 32.3 Loans outstanding 10,710 13,604 14,584 7.2 Loans recovered 7,730 9,931 10,769 8.4 Loans overdue 4,094 4,893 5,414 10.7 Societies in loss 11,435 12,037 11,629 (-)3.4 * Provisional NA Not Applicable Source : Office of the Commissioner for Co-operation and Registrar Co-operative Societies, GoM

Economic Survey of Maharashtra 2015-16
116
8.24 There were 119 co-operative cotton ginning & pressing societies in the State as on 31st March, 2015. The contribution of the GoM to the share capital of these societies was 16.7 per cent. About 63 per cent societies were in loss. Performance of co-operative cotton ginning & pressing societies is given in Table 8.18. 8.25 There were 131 co-operative spinning mills in the State as on 31st March, 2015. The contribution of the GoM to the share capital of these societies was 84.9 per cent. About 81.8 per cent spinning mills out of those engaged in production were in loss. Performance of co-operative spinning mills is given in Table 8.19.
8.26 There were 646 co-operative handloom and 2,091 powerloom societies in the State as on 31st March, 2015. The contribution of the GoM to the share capital of co-operative handloom and powerloom societies was 6.5 and 77.7 per cent respectively. About 46.6 per cent co-operative handloom and 55.9 per cent powerloom societies were in loss. Performance of co-operative handloom & powerloom societies is given in Table 8.20.
Table 8.18 Performance of co-operative cotton ginning & pressing societies
(` crore ) Particulars As on 31st March Per cent
change 2014 2015* Societies (no) 142 119 (-)16.2 Of which, in production 105 105 0.0 Members (no. in ’00) 1,765 1,586 (-)10.1 Share capital 7 6 (-)14.3 Of which, State Govt 1 1 0 Working capital 91 61 (-)33.0 Raw cotton ginned (MT) 139 111 (-)20.1 Societies in loss (no) 95 75 (-)21.1 Amount of loss 2 1 (-)50.0 * Provisional Source : Office of the Commissioner for Co-operation and Registrar Co-operative Societies, GoM
Table 8.19 Performance of co-operative spinning mills
(` crore ) Particulars As on 31st March Per cent
change 2014 2015* Number of mills 149 131 (-)12.1 Of which, in production 65 66 1.5 Members (’00) 5,398 5,375 (-)0.4 Share capital 1,940 1,983 2.2 Of which, State Govt 1,616 1,683 4.1 No. of spindles (lakh) 14.63 14.72 0.6 Value of Yarn produced 2,665 3,154 18.3 Mills in loss (no) 56 54 (-)3.6 Amount of loss 773 323 (-)58.2 * Provisional Source : Office of the Commissioner for Co-operation and Registrar Co-operative Societies, GoM
Table 8.20 Performance of co-operative handloom & powerloom societies (` crore )
Particulars As on 31st March Handloom Per cent
change Powerloom Per cent
change 2014 2015* 2014 2015* Societies (no) 672 646 (-)3.9 2,136 2,091 (-)2.1 Members (’00) 357 339 (-)5.0 619 625 1.0 Share capital 84.4 80.1 (-)5.1 124.6 123.1 (-)1.2 Of which, State Govt 5.00 5.17 3.4 95.7 95.7 0 No. of looms (’000) 257 242 (-)5.8 182 182 0 Production value 75 72 (-)4.0 70.5 68.0 (-)3.5 Societies in loss (no) 317 301 (-)5.0 1,175 1,170 (-)0.4 Amount of loss 12.09 11.48 (-)5.0 41.25 42.3 2.5
Source : Office of the Commissioner for Co-operation and Registrar Co-operative Societies, GoM * Provisional

Economic Survey of Maharashtra 2015-16
117
Sugar Factories 8.27 Of the total sugar factories in the country, 33 per cent are located in the State followed by 22 per cent in Uttar Pradesh. As on 31st March, 2015, out of the total sugar production in the country, the share of State was 37 per cent followed by 25 per cent of Uttar Pradesh. Performance of co-operative sugar factories is given in Table 8.21.
Dairy 8.28 At the end of March, 2015, there were 24,762 co-operative dairy societies and 88 co-operative dairy unions in the State. About 43 per cent co-operative dairy societies and about 51 per cent dairy unions were in loss. Performance of co-operative dairy societies and dairy unions is given in Table 8.22.
Table 8.21 Performance of co-operative sugar factories
Particulars As on 31st March Per cent change over
2014 2013 2014 2015*
Registered co-operative factories (no) 202 202 202 0 Factories in production (no) 108 96 99 3.1
Members (’00) 24,500 26,340 26,120 (-)0.8 Share capital of State Govt (` crore) 1,211.69 1,244.30 1,253.83 0.8 Average capacity (TCD # lakh MT) 3.34 3.22 3.40 5.6 Sugarcane crushed (lakh MT) @ 504.63 486.72 589.47 21.1 Average sugarcane price (`/MT) a) Purchased (FRP) 1,700 2,100 2,200 4.8 b) Actual paid by factories 2,450 2,467 2,315 (-)6.2 Sugar produced (lakh MT) @ 58.40 56.52 67.79 19.9 Average extraction (per cent) 11.57 11.61 11.50 (-)0.9 Molasses (lakh MT) 36.40 27.04 37.20 37.6 No. of factories having : a) Distillery plants 68 69 69 0 b) Co-generation plants 39 46 47 2.2 Installed capacity of co-generation (MW) 628 827 843 1.9
Factories in loss (no) 38 29 NA ---- * Provisional # TCD - Tonnes Crushed per Day @ for October to September FRP - Fair Remuneration Price NA - Not Available Source : Office of the Commissioner for Co-operation and Registrar Co-operative Societies, GoM
Table 8.22 Performance of co-operative dairy societies and dairy unions (` crore)
Particulars As on 31st March Co-operative dairy societies Co-operative dairy unions
2014 2015* Per cent change
2014 2015* Per cent change
Societies (no) 26,577 24,762 (-)6.8 78 88 12.8 Members (lakh) 11.18 10.60 (-)5.2 0.82 1.10 34.1 Share capital 10.35 10.10 (-)2.4 89.60 94.10 5.0 Working capital 27.71 26.67 (-)3.8 86.08 97.10 12.8 Milk procured (value) 306.96 301.91 (-)1.6 712.02 765.30 7.5 Milk & milk products sold (value)
405.23 399.10 (-)1.5 930.70 1,010.20 8.5
Societies in loss (no) 12,310 10,653 (-)13.5 34 45 32.4 Amount of loss 22.03 20.10 (-)8.8 86.30 116.22 34.7
Source : Office of the Commissioner for Co-operation and Registrar Co-operative Societies, GoM *Provisional

Economic Survey of Maharashtra 2015-16
118
Fisheries 8.29 There are 3,484 primary fisheries co-operative societies, 37 fisheries co-operative unions and two federations working in the State as on 31st March, 2015. Number of members in these institutions is 3.45 lakh with working capital of ` 268.15 crore. These societies sold fish and fish products worth ` 559.25 crore in 2014-15, as against ` 453.56 crore in 2013-14.
Co-operative Marketing Societies 8.30 Co-operative marketing societies have a three-tier organisational structure. The Maharashtra State Co-operative Marketing Federation Ltd. is the apex body. The District Co-operative Marketing Societies and the Primary Co-operative Marketing Societies are functioning at district and village level respectively. About 36 per cent co-operative marketing societies were in loss at the end of March, 2015 as compared to 39 per cent at the end of March, 2014. Performance of co-operative marketing societies is given in Table 8.23.
Non-Agricultural Credit Societies
8.31 As on 31st March, 2015, there were 517 urban co-operative banks, 14,577 urban co-operative credit societies and 7,232 salary earners’ co-operative credit societies in the State. About 22 per cent of the total non-agricultural credit societies were in loss. Performance of non-agricultural credit societies is given in Table 8.24.
8.31.1 Out of the 1,583 total urban co-operative banks in the country, 32 per cent are located in the State. As on 31st March, 2015, in all 109 banks in the State are under liquidation. The Deposit Insurance Credit Guarantee Corporation has approved reimbursement of deposits up to ` one lakh (in insured banks) and the disbursement for 102 banks is in process, one bank has made appeal to GoI and the process for submitting claims of remaining banks is in progress.
Other Co-operative Societies
8.32 As on 31st March, 2015, there were 1,02,265 co-operative housing societies in the State with 25.29 lakh members and 11,365 labour contract societies having 8.14 lakh members. There were 307 forest labour societies with 73,138 members of which, 176 (57.3 per cent) were in profit.
Table 8.23 Performance of co-operative marketing societies
(` crore ) Particulars As on 31st March Per cent
change 2014 2015* Societies (no) 1,602 1,518 (-)5.2 Members (lakh) 14.69 14.61 (-)0.5 Share capital 89 86 (-)3.4 Of which, State Govt 25 25 0.0 Working capital 1,343 1,372 2.2 Sales (a) Agriculture produce 716 644 (-)10.1 (b) Fertilizers 652 721 10.6 (c) Seeds 50 45 (-)10.0 (d) Consumer goods 320 336 5 Societies in loss (no) 679 599 (-)11.8 Amount of loss 22 20 (-)9.1 * Provisional Source : Office of the Commissioner for Co-operation and Registrar Co-operative Societies, GoM
Table 8.24 Performance of non-agricultural credit societies
(` crore) Particulars As on 31st March Per cent
change 2014 2015* Societies (no) 22,737 22,326 (-)1.8 Members (lakh) 231.12 240.64 4.1 Deposits 85,970 95,264 10.8 Own funds 23,528 26,057 10.7 Share capital 7,876 8,423 6.9 Of which, State Govt 0.7 0.7 0.0 Working capital 1,42,843 1,59,935 12.0 Loans advanced 60,232 62,926 4.5 Loans outstanding 60,993 64,792 6.2 Loans overdue 9,189 10,091 9.8 Loans recovered 62,949 69,359 10.2 Societies in loss (no) 4,958 4,963 0.1 Amount of loss 1,340 1,393 4.0
* Provisional Source : Office of the Commissioner for Co-operation and Registrar Co-operative Societies, GoM

Economic Survey of Maharashtra 2015-16
119
Co-operative Housing Finance Corporation 8.33 Maharashtra State Co-operative Housing Finance Corporation Ltd. is the central housing credit institution functioning in the State. Performance of Maharashtra State Co-op. Housing Finance Corporation Ltd. is given in Table 8.25.
Co-operative Consumer Federation 8.34 Maharashtra State Co-operative Consumer Federation is the apex body which controls the functions of the wholesale consumer stores working at district level. These wholesale consumer stores distribute goods to primary consumer stores working at village level. As on 31st March, 2015, besides the apex consumer federation, there were 153 wholesale consumer stores and 2,386 primary consumer stores working in the State. Performance of consumer federation, wholesale and primary co-operative consumer stores is given in Table 8.26.
Private Money Lenders 8.35 Apart from agriculture and non-agricultural credit societies, the State allowed private money lenders to provide loans to individuals. The licenses are issued by the Commissionerate of Co-operation. The information of private money lenders is given in Table 8.27.
* * * * *
Table 8.25 Performance of Maharashtra State Co-op. Housing Finance Corporation Ltd.
(` crore) Particulars As on 31st March Per cent
change 2014 2015* Members (no) 10,578 6,518 (-)38.4 Deposits 0.02 0.00 (-)100 Working capital 95.19 92.73 (-)2.6 Gross loan 644 644 0.0 Loans outstanding 65.06 59.49 (-)8.6 Loans overdue 22.78 21.90 (-)3.9 Loans recovered 6.65 5.57 (-)16.2 * Provisional Source: Maharashtra State Co-op. Housing Finance Corporation Ltd.
Table 8.26 Performance of consumer federation, wholesale and primary co-operative consumer stores
(` crore)
Particulars As on 31st March
Consumer federation Wholesale consumer stores Primary consumer stores
2014 2015* 2014 2015* 2014 2015* Number 1 1 160 153 2,601 2,386 Member (’00) 6 6 3,480 3,227 17,161 15,401 Share capital 1.65 1.65 19.44 17.15 31.76 28.97 Of which, State Government 1.14 1.14 3.88 3.41 1.56 1.16 Amount of loss 1.17 0.09 3.91 4.20 6.53 5.60 Consumer stores in loss (no) 3# 3# 60 75 1,185 942 Source : Office of the Commissioner for Co-operation and Registrar Co-operative Societies, GoM * Provisional # Branches out of 19
Table 8.27 Information of Private money lenders
Particulars As on 31st March Per cent change 2014 2015*
License holders (no) 10,761 12,022 11.7 New licenses issued (no) 1,804 1,628 (-)9.8 Renewed licenses (no) 8,925 7,952 (-)10.9 Licenses cancelled (no) 450 686 52.4 No. of loanee members (traders/non- traders/ cultivators)
8,51,564 5,47,204 (-)35.7
Loans disbursed (` crore) 719.81 691.85 (-)3.9 * Provisional Source : Office of the Commissioner for Co-operation and Registrar Co-operative Societies, GoM

Economic Survey of Maharashtra 2015-16
120
ANNEXURE 8.1
IMPORTANT CHARACTERISTICS OF INDUSTRIES IN MAHARASHTRA
(` crore)
Activity
(at two digit level)
NIC 2008 Year No. of
Ind. Fixed capital
Working capital
Wages to
workers Total output
Material consumed
Total input
Net value
added
(1) (2) (3) (4) (5) (6) (7) (8) (9) (10)
(1) Cotton ginning, cleaning etc. (01) 2012-13 944 1,020 949 62 13,721 10,627 11,892 1,721
2013-14* 594 882 1,805 75 15,079 11,676 13,923 1,059
(2) Extraction of salt (08) 2012-13 50 7 7 1 28 4 25 2
2013-14* 43 2 7 6 14 2 5 9
(3) Food products and beverages (10,11) 2012-13 3,077 27,577 9,301 1,783 1,20,407 86,303 1,09,710 8,702
2013-14* 3,038 32,445 11,235 2,046 1,30,556 82,197 1,16,237 11,941
(4) Tobacco products (12) 2012-13 124 1,410 982 153 4,539 1,439 1,839 2,575
2013-14* 110 1,301 1,842 156 5,032 1,408 2,344 2,545
(5) Textiles (13) 2012-13 2,000 15,224 3,738 1,179 39,070 17,740 27,070 10,468
2013-14* 2,068 12,213 4,017 1,334 37,503 21,495 31,707 4,512
(6) Wearing apparel (14) 2012-13 1,093 6,631 1,054 350 6,106 2,604 4,587 1,359
2013-14* 1,045 1,705 1,996 480 11,176 6,166 8,890 2,133
(7) Tanning and dressing of leather (15) 2012-13 126 115 107 33 652 333 497 142
2013-14* 116 182 490 36 1,747 721 1,138 585
(8) Wood and wood products (16) 2012-13 290 262 (-)108 29 831 376 640 169
2013-14* 259 253 218 29 927 445 658 245
(9) Paper and paper products (17) 2012-13 941 7,694 1,489 259 10,465 6,611 8,595 1,446
2013-14* 1,000 8,528 693 331 14,081 8,543 11,465 2,104
(10) Printing and reproduction
of recorded media (18)
2012-13 995 3,713 480 307 7,742 3,629 5,875 1,482
2013-14* 988 3,465 (-) 11,778 366 6,467 3,697 5,490 624
(11) Coke, refined petroleum
products, etc. (19)
2012-13 204 12,379 4,135 456 1,50,414 1,01,208 1,05,275 44,388
2013-14* 197 21,375 4,549 457 1,62,316 1,02,456 1,07,555 53,842
(12) Chemicals and chemical products (20,21)
2012-13 2,789 37,109 20,334 1,965 1,20,981 66,865 89,357 28,470
2013-14* 2,752 45,682 43,619 2,456 1,46,037 73,870 1,04,740 36,560
(13) Rubber and plastic products (22) 2012-13 1,731 13,752 11,704 864 37,365 23,606 31,814 4,580
2013-14* 1,912 21,924 9,488 1,064 48,097 29,517 36,200 10,492
(14) Other non-metallic mineral products (23)
2012-13 1,073 7,752 2,714 362 17,124 9,201 13,050 3,360
2013-14* 992 7,896 1,987 366 12,801 6,040 9,693 2,464
(15) Basic metals (24)
2012-13 1,514 73,286 10,183 1,416 1,25,260 93,359 1,18,452 3,789
2013-14* 1,517 50,270 13,532 1,472 1,16,348 78,081 1,00,948 12,235
(16) Fabricated metal (25) 2012-13 3,571 12,269 7,965 1,423 40,153 23,083 31,607 7,459
2013-14* 3,580 11,486 (-) 1,041 1,394 38,962 22,188 29,421 8,412
(Contd.)

Economic Survey of Maharashtra 2015-16
121ANNEXURE 8.1 ( Contd.)
Activity
(at two digit level)
NIC 2008)
Year No. of Ind.
Fixed capital
Working capital
Wages to workers
Total output
Material consumed
Total input
Net value
added
(1) (2) (3) (4) (5) (6) (7) (8) (9) (10)
(17) Office, accounting and computing
machinery, Radio, T.V.
and communication equipments & apparatus.
Medical, precision and optical instruments (26)
2012-13 489 4,555 8,805 344 18,744 11,127 14,375 3,821
2013-14* 570 5,311 10,282 526 20,796 11,004 16,707 3,733
(18) Electrical machinery and apparatus (27)
2012-13 1,335 8,080 6,023 844 42,832 25,585 33,815 8,063
2013-14* 1,334 8,998 6,031 945 41,781 26,311 32,709 8,018
(19) Machinery and equipments repair& installation (28,33)
2012-13 2,419 18,777 11,510 1,743 72,477 35,609 48,711 21,961
2013-14* 2,360 19,154 7,094 2,020 59,815 32,120 44,947 13,023
(20) Motor vehicles, trailers (29) 2012-13 1,331 29,637 697 2,595 86,422 61,940 74,157 8,953
2013-14* 1,414 30,131 (-) 9,002 2,503 80,128 48,406 64,910 9,894
(21) Other transport equipments (30)
2012-13 332 5,125 298 450 29,080 20,667 23,031 5,599
2013-14* 369 7,348 809 531 28,497 19,611 22,133 5,897
(22) Furniture (not elsewhere classified (31,32)
2012-13 1,344 4,610 7,902 667 36,493 23,749 31,654 4,525
2013-14* 1,323 4,608 20,049 811 50,245 38,474 45,006 4,847
(23) Others 2012-13 1,177 53,946 (-)8,576 516 41,125 12,099 33,425 5,697
2013-14* 1,542 31,203 2,493 891 37,522 6,092 30,602 5,267
Total 2012-13 28,949 3,44,930 1,01,692 17,803 10,22,032 6,37,764 8,19,454 1,78,729
2013-14* 29,123 3,26,362 1,20,418 20,297 10,65,925 6,30,521 8,37,427 2,00,440
Source - Annual Survey of Industries, Central Statistics office, GoI. * Provisional

Economic Survey of Maharashtra 2015-16
122ANNEXURE 8.2
INDEX NUMBERS OF INDUSTRIAL PRODUCTION IN INDIA
(Base year 2004-05 = 100)
Sr.
No. Item Weight 2005-06 2010-11 2011-12 2012-13 2013-14 2014-15 2015-16++*
(1) (2) (3) (4) (5) (6) (7) (8) (9) (10)
I General Index 100.00 108.6 165.5 170.3 172.2 172.0 176.9 178.1
II Mining and quarrying 14.16 102.3 131.0 128.5 125.5 124.7 126.5 125.3
III Manufacturing 75.53 110.3 175.7 181.0 183.3 181.9 186.1 186.6
Industry groups 1 Food products and Beverages 7.28 113.2 142.9 164.8 169.5 167.7 175.7 149.1
2 Tobacco products 1.57 101.0 104.1 109.7 109.2 110.2 111.2 104.8
3 Textiles 6.16 108.3 135.9 134.0 142.0 148.3 152.4 154.7
4 Wearing apparel, dressing and dyeing of fur
2.78 114.1 142.2 130.1 143.6 171.6 180.4 185.3
5 Luggage, handbags, saddlery harness & footwear, tanning and dressing of leather products
0.58 90.9 114.3 118.5 127.1 133.7 147.5 146.8
6 Wood and products of wood and cork except furniture, articles of straw & plating
1.05 106.8 156.5 159.2 147.9 144.6 150.9 154.2
7 Paper and paper products 1.00 106.3 131.4 138.0 138.7 138.6 143.1 146.5
8 Publishing, printing & reproduction of recorded media
1.08 113.7 148.8 192.8 183.0 183.4 175.9 161.2
9 Coke, refined petroleum products & nuclear fuel
6.72 100.6 121.5 125.8 136.4 143.5 144.7 149.7
10 Chemicals and chemical products 10.06 101.0 123.1 122.7 127.3 138.6 138.2 143.7
11 Rubber and plastic products 2.03 112.3 185.2 184.6 185.0 181.1 189.3 187.9
12 Other non-metallic mineral products
4.31 107.8 151.4 158.6 161.6 163.3 167.4 165.3
13 Basic metal 11.34 115.5 176.7 192.1 195.8 196.4 221.4 223.0
14 Fabricated metal products (except machinery & equipment)
3.09 111.1 182.8 203.3 193.8 180.2 179.1 176.8
15 Machinery & equipment n.e.c. 3.76 126.1 256.3 241.3 230.0 219.2 227.9 216.0
16 Office, accounting & computing machinery
0.31 145.3 146.3 148.7 128.1 108.0 67.0 66.4
17 Electrical machinery & apparatus 1.98 116.8 472.1 367.1 369.2 422.6 511.6 501.3
18 Radio, T.V. and communication equipment & apparatus
0.99 122.7 911.5 950.5 1,003.7 730.1 332.7 349.5
19 Medical, precision & optical instrument, watches & clocks
0.57 95.4 107.8 119.5 117.1 111.1 108.6 98.4
20 Motor vehicles, trailers & semi-trailers
4.06 110.1 233.3 258.6 244.8 221.3 226.8 236.2
21 Other transport equipment 1.83 115.3 210.7 235.8 235.7 249.5 265.5 265.4
22 Furniture , manufacturing n.e.c. 3.00 116.2 141.2 138.6 131.5 113.3 121.7 173.5
IV Electricity 10.31 105.2 138.0 149.3 155.2 164.7 178.6 188.5
Source - Central Statistics office, GoI * Provisional
+ + April, 2015 to December, 2015

Economic Survey of Maharashtra 2015-16
123
ANNEXURE 8.3
FINANCIAL ASSISTANCE SANCTIONED AND DISBURSED BY FINANCIAL INSTITUTIONS TO INDUSTRIES IN MAHARASHTRA
(` crore)
Sr. No.
Financial Institutions
1990-91 2000-01 2010-11 2014-15*
Sanctioned Disbursed Sanctioned Disbursed Sanctioned Disbursed Sanctioned Disbursed
(1) (2) (3) (4) (5) (6) (7) (8) (9) (10)
1 Industrial Finance Corporation of India Ltd.
407.77 251.93 275.60 288.49 3,610.00 2,937.01 3,876.00 3,107.00
2 Small Industries Development Bank of India
306.73 227.24 2,081.87 1,320.79 N.A. N.A. N.A. N.A.
3 Industrial Investment Bank of India Ltd.
33.54 25.54 576.59 560.27 N.A. N.A. N.A. N.A.
4 Export-Import Bank of India
N.A. N.A. N.A. N.A. 8,362.00 7,235.00 3,252.42 3,634.40
5 Life Insurance Corporation of India
254.55 110.58 5,150.65 3,919.12 20,746.94 19,345.27 22,628.22 21,061.22
6
General Insurance Corporation of India$
108.34 52.25 61.41 88.60 627.40 627.40 N.A. 1,059.83
7 Maharashtra State Financial Corporation
157.97 94.61 68.63 47.12 Nil Nil Nil Nil
8 SICOM Ltd. 85.40 68.87 593.00 463.00 4,947.00 5,340.00 4,457.00 2,670.00
9 Others# 3,391.38 1,961.03 61,220.09 35,886.75 -- -- -- --
Source - Financial institutions mentioned in this table
Note : 1) # Includes the financial assistance given by ICICI, IDBI, UTI which have stopped giving assistance to industries.
2) $ Includes Bonds of Financial Institutions and Government guarantee Bonds.
* Provisional N.A. Not Available
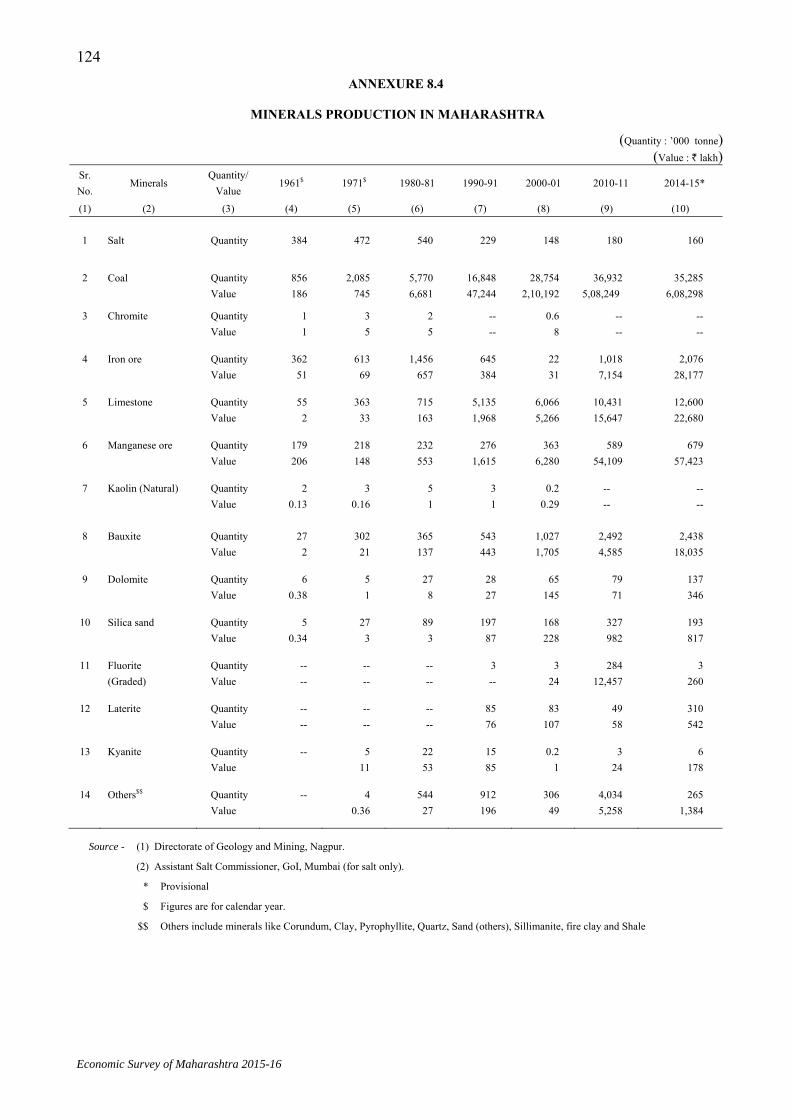
Economic Survey of Maharashtra 2015-16
124ANNEXURE 8.4
MINERALS PRODUCTION IN MAHARASHTRA
(Quantity : ’000 tonne) (Value : ` lakh)
Sr. No.
Minerals Quantity/
Value 1961$ 1971$ 1980-81 1990-91 2000-01 2010-11 2014-15*
(1) (2) (3) (4) (5) (6) (7) (8) (9) (10)
1 Salt Quantity 384 472 540 229 148 180 160
2 Coal Quantity Value
856 186
2,085 745
5,770 6,681
16,848 47,244
28,754 2,10,192
36,932 5,08,249
35,285 6,08,298
3 Chromite Quantity Value
1 1
3 5
2 5
-- --
0.6 8
-- --
-- --
4 Iron ore Quantity Value
362 51
613 69
1,456 657
645 384
22 31
1,018 7,154
2,076 28,177
5 Limestone Quantity Value
55 2
363 33
715 163
5,135 1,968
6,066 5,266
10,431 15,647
12,600 22,680
6 Manganese ore Quantity Value
179 206
218 148
232 553
276 1,615
363 6,280
589 54,109
679 57,423
7 Kaolin (Natural) Quantity Value
2 0.13
3 0.16
5 1
3 1
0.2 0.29
-- --
-- --
8 Bauxite Quantity Value
27 2
302 21
365 137
543 443
1,027 1,705
2,492 4,585
2,438 18,035
9 Dolomite Quantity Value
6 0.38
5 1
27 8
28 27
65 145
79 71
137 346
10 Silica sand Quantity Value
5 0.34
27 3
89 3
197 87
168 228
327 982
193 817
11 Fluorite (Graded)
Quantity Value
-- --
-- --
-- --
3 --
3 24
284 12,457
3 260
12 Laterite
Quantity Value
-- --
-- --
-- --
85 76
83 107
49 58
310 542
13 Kyanite Quantity Value
--
5 11
22 53
15 85
0.2 1
3 24
6 178
14 Others$$ Quantity Value
--
4 0.36
544 27
912 196
306 49
4,034 5,258
265 1,384
Source - (1) Directorate of Geology and Mining, Nagpur.
(2) Assistant Salt Commissioner, GoI, Mumbai (for salt only).
* Provisional
$ Figures are for calendar year.
$$ Others include minerals like Corundum, Clay, Pyrophyllite, Quartz, Sand (others), Sillimanite, fire clay and Shale

Economic Survey of Maharashtra 2015-16
125ANNEXURE 8.5
DETAILS OF CO-OPERATIVE SOCIETIES IN MAHARASHTRA
Item 1970-71 1980-81 1990-91 2000-01 2010-11 2013-14 2014-15* (1) (2) (3) (4) (5) (6) (7) (8)
I. Number of co-operative societies
(1) Apex and central- Agricultural and non- agricultural credit societies
29 31 34 34 34 35 35
(2) Primary Agricultural credit societies
20,420$ 18,577 19,565 20,551 21,451 21,185 21,064
(3) Non-agricultural credit societies
2,964 5,474 11,291 22,014 23,434 22,737 22,326
(4) Marketing societies 410 423 931 1,115 1,719 1,602 1,518
(5) Agro-processing enterprises@
6,810 14,327 28,954 39,070 48,848 48,147 39,781
(6) Social services & other co-op. societies@
11,964 21,915 43,845 75,232 1,28,760 1,36,589 1,40,997
Total 42,597 60,747 1,04,620 1,58,016 2,24,306 2,30,295 2,25,721 II. Number of members
(’000)
(1) Apex and central- Agricultural and non- agricultural credit societies $$
70 1,014 1,485 1,371 247 186 195
(2) Primary Agricultural credit societies
3,794 5,416 7,942 10,125 15,001 15,060 14,437
(3) Non-agricultural credit societies
2,438 3,759 9,302 18,467 21,618 23,112 24,064
(4) Marketing societies 282 471 745 840 1,337 1,469 1,461
(5) Agro-processing enterprises
959 2,124 3,974 6,339 8,010 5,878 7,176
(6) Social services & other co-op. societies
1,038 1,999 3,455 5,880 6,809 6,694 6,597
Total 8,581 14,783 26,903 43,022 53,022 52,399 53,930
III. Working capital (` crore)
(1) Apex and central- Agricultural and non- agricultural credit societies
613 1,831 8,806 39,267 89,719 1,03,633 1,07,578
(2) Primary Agricultural credit societies
343 527 1,851 6,988 18,987 20,309 22,603
(3) Non-agricultural credit societies
168 1,209 7,508 66,887 1,04,814 1,42,843 1,59,935
(4) Marketing societies 39 188 340 1,518 1,300 1,373 1,356
(5) Agro-processing enterprises
219 1,029 4,588 13,288 28,717 39,871 40,492
(6) Social services & other co-op. societies
107 426 1,191 6,492 4,897 6,894 6,109
Total 1,489 5,210 24,284 1,34,440 2,48,434 3,14,923 3,38,074
IV. Gross loan (` crore) (1) Apex and central-
Agricultural and non- agricultural credit societies
751 1,528 9,085 28,709 40,436 57,166 56,651
(2) Primary Agricultural credit societies
133 250 800 3,734 8,060 12,826 14,030
(3) Non-agricultural credit societies
204 1,129 5,178 39,268 49,907 60,233 62,926
(4) Marketing societies 3 3 8 18 11 7 7
(5) Agro-processing enterprises
3 12 17 103 2,052 737 1,189
(6) Social services & other co-op. societies
4 12 60 235 215 273 275
Total 1,098 2,934 15,148 72,067 1,00,681 1,31,242 1,35,078 (Contd.)

Economic Survey of Maharashtra 2015-16
126ANNEXURE 8. 5 ( Concld.)
Item 1970-71 1980-81 1990-91 2000-01 2010-11 2013-14 2014-15*
(1) (2) (3) (4) (5) (6) (7) (8) V. Outstanding loans
(` crore)
(1) Apex and central- Agricultural and non- agricultural credit societies
478 1,137 5,889 23,120 42,385 52,196 61,279
(2) Primary Agricultural credit societies
284 384 1,310 5,308 12,024 13,604 14,584
(3) Non-agricultural credit societies
105 731 4,594 35,908 47,863 60,993 64,792
(4) Marketing societies 2 4 9 182 5,032 4,988 5,002
(5) Agro-processing enterprises
6 30 69 236 3,724 640 2,156
(6) Social services & other co-op. societies
8 25 191 2,899 834 644 676
Total 883 2,311 12,062 67,653 1,11,862 1,33,065 1,48,489
VI. Turnover-Value of produced goods sold (` crore)
(1) Apex and central- Agricultural and non- agricultural credit societies
N.A. N.A. N.A. N.A. N.A. N.A. N.A.
(2) Primary Agricultural credit societies
51 146 239 1,012 593 763 832
(3) Non-agricultural credit societies
3 10 -- 38 76 N.A N.A
(4) Marketing societies 214 979 2,602 3,205 1,368 2,378 2,179
(5) Agro-processing enterprises
194 1,031 3,467 7,496 46,112 20,797 19,708
(6) Social services & other co-op. societies
69 187 330 1,588 4,076 4,556 3,671
Total 531 2,353 6,638 13,339 52,225 28,494 26,390
Source - Office of the Commissioner for Co-operation and Registrar Co-operative Societies, GoM.
Note - Figures upto 1990-91 are at the end of June.
* Provisional
$ Includes primary agricultural credit societies, primary land development banks and grain banks upto 1970-71. $$ Excludes Nominal Members. @ Lift Irrigation societies are classified in Social Services & Other Co-op. Societies category instead of 'Agro-processing' category since 2000-01.
N.A. Not Applicable.

9Inf rastructure

Economic Survey of Maharashtra 2015-16
Public SectorPrivate SectorPPP
Graph 9.1 : Sectorwise installed in the State
capacity
05000
1000015000
20000250003000035000
2010
-11
2011
-12
2012
-13
2013
-14
2014
-15
Year
Inst
alle
d ca
paci
ty (M
W)
9. INFRASTRUCTURE
9.1 Development and management of infrastructure are key aspects for sustainable development and prosperity of society. Infrastructure is an accelerator of the economic growth as it directly impacts quality of life. The physical infrastructure mainly comprises of power, transport and telecommunication which in turn supports trade & industrial development.
ENERGY 9.2 Energy is utilised and consumed by society in various forms. One of its significant forms is Electricity. It lights up homes, supports business operations and extends productivity hours. The electricity is generated through non-renewable (coal, lignite, petroleum, natural gas, etc.) and renewable (wind, solar, small hydro, biomass, co-generation bagasse, etc.) sources. A brief account of the electricity sector in the State is given below.
Installed Capacity
9.3 The installed capacity has increased by 4.8 per cent during 2014-15, whereas the Central sector allocation to the State was unchanged as compared to the previous year. The total installed capacity as on 31st March, 2015 in the State comprises of public sector 36.5 per cent, private sector 56.4 per cent (35 per cent non-renewable & 21.4 per cent renewable) and PPP (Ratnagiri Gas Power Project Ltd-RGPPL) 7.1 per cent. The sourcewise installed capacity is given in Table 9.1.
Table 9.1 Sourcewise installed capacity (MW)
Source
As on 31st March As on 31st December,
2015
Per cent change in 2014-15
over 2013-14
2014 2015
In the State 29,849 31,281 32,706 4.8
Thermal 17,206 18,436 19,636 7.1
Renewable 6,465 6,707 6,932 3.7
Hydro 3,066 3,066 3,066 0.0
Natural Gas 3,112 3,072 3,072 (-)1.3
Central sector allocation 6,627 6,627 6,776 Nil
Source : MAHAGENCO, Tata Power, Reliance Infrastructure, MEDA (for renewable energy), MAHADISCOM, Central Electricity Authority (for Central sector allocation & private companies)

Economic Survey of Maharashtra 2015-16
128
Graph 9.2 : Sectorwise electricity generated in the State
0
20000
40000
60000
80000
100000
120000
2010
-11
2011
-12
2012
-13
2013
-14
2014
-15
Year
Elec
trici
tyge
nera
ted
(MU
s)
Public SectorPrivate SectorPPP
Electricity Generated 9.4 Total electricity generated (including renewable sources) in the State was 1,03,779 Million Units (MUs) during 2014-15 which was 12.8 per cent higher than the previous year. During 2014-15, the State has received 30,401 MUs electricity from the Central sector.
9.5 MAHAGENCO accounted for 47.5 per cent followed by Adani Power Ltd. 15.9 per cent, renewable energy 7.8 per cent, Tata Power 7.5 per cent, JSW Energy 7.4 per cent, Reliance Infrastructure, VIP Butibori, Emco Power 3.5 per cent each and others 3.4 per cent of the total generation.
9.6 During 2015-16 upto December, the total electricity generated in the State was 84,558 MUs, 8.1 per cent higher than that for the corresponding period of 2014-15. During 2015-16 upto December, the State has received 21,993 MUs electricity from the Central sector.The sourcewise electricity generated is given in Table 9.2.
Electricity Purchased
9.7 During 2014-15, MAHADISCOM has purchased 1,12,577 MUs electricity costing ` 49,089 crore, as against 1,00,115 MUs electricity costing ` 39,526 crore in 2013-14. During 2015-16 upto December, 89,441 MUs electricity costing ` 35,055 crore was purchased. BEST has purchased 4,728 MUs electricity costing ` 2,718 crore during 2014-15 and 3,808 MUs electricity costing ` 1,989 crore during 2015-16 upto December.
Table 9.2 Sourcewise electricity generated (MU)
Source 2013-14 2014-15 2015-16+* Per cent change in
2014-15 over 2013-14
In the State 91,987 1,03,779 84,558 12.8
Thermal 71,686 84,882 71,425 18.4
Natural Gas 6,055 4,626 3,144 (-) 23.6
Hydro 6,763 5,856 4,174 (-) 13.4
Renewable $ 7,483 8,415 5,815 12.5
Central sector receipt to State 31,525 30,401 21,993 (-) 3.6 + upto December * Provisional $ including captive Note : 1 Unit = 1 Kilo Watt Hour Source: MAHAGENCO , Tata Power, Reliance Infrastructure, MAHADISCOM (for RGPPL, Central Sector Receipt) Renewable - projects selling electricity to MAHADISCOM, Central Electricity Authority (for other private companies)

129
Economic Survey of Maharashtra 2015-16
05000
1000015000200002500030000350004000045000
2010
-11
2011
-12
2012
-13
2013
-14
2014
-15
Year
MU
s
Industrial Agriculture DomesticCommercial Public Services
Graph 9.3 : Sectorwise consumption of electricity
Electricity Consumed
9.8 Aggregate consumption of electricity in the State during 2014-15 was 1,12,855 MUs, higher by 9.6 per cent over the previous year and 78,383 MUs in 2015-16 upto December, which was slightly higher than that for the corresponding period of 201415. The consumption of electricity by the industrial sector was largest (36.8 per cent), followed by agriculture (23.4 per cent) and domestic sector (22.5 per cent) in the State. These three sectors together accounted for 82.7 per cent of the total electricity consumption. Sectorwise electricity consumed is given in Table 9.3.
9.9 Major sectorwise per capita ultimate consumption of electricity in India (2013-14) and Maharashtra (2013-14 & 2014-15) is given in Table 9.4. The time series data regarding installed capacity, electricity generated, sectorwise electricity consumed and per capita ultimate consumption of electricity is given in Annexure 9.1.
Table 9.3 Sectorwise electricity consumed (MU)
Sector
April-March April-December*
2013-14 2014-15 2014-15 2015-16 Per cent change in 2015-16 over
2014-15 Industrial 38,949 41,522 24,756 25,526 3.3
Agriculture 21,725 26,407 14,469 14,951 2.4
Domestic 23,679 25,428 20,133 21,374 3.1
Commercial 12,469 12,504 9,724 9,956 6.2
Public Services@ 3,634 4,183 3,064 3,351 9.4
Railways 2,389 2,443 1,842 1,680 (-)8.8
Miscellaneous 144 368 3,664 1,545 (-)57.8
Total 1,02,989 1,12,855 77,652 78,383 0.9
@ Public Lighting & Public Water Works * Provisional Source : MAHADISCOM, Tata Power, Reliance Infrastructure, BEST
Table 9.4 Per capita ultimate consumption of electricity
(Unit)
Sector India Maharashtra
2013-14 2013-14 2014-15
All Sectors 609.2 888.9 962.6
Industrial 212.5 336.2 354.1
Domestic 162.0 204.4 216.9
Agriculture 123.5 187.5 225.2
Note: The consumption of electricity from four distribution utilities in the State added together and divided by mid-year calibrated projected population based on 2011 census by Central Statistics Office, GoI to arrive at per capita ultimate consumption of electricity. Source: Central Electricity Authority, GoI; MAHADISCOM, Reliance Infrastructure, Tata Power, BEST

Economic Survey of Maharashtra 2015-16
130
Demand and Supply of Electricity 9.10 The capacity addition by various sources, improvement in the network infrastructure, reduction of Transmission & Distribution (T & D) losses and energy conservation measures have improved supply position. During 2014-15, the average peak demand of MAHADISCOM was 15,812 MW with load shedding of 420 MW. During 2015-16 upto December, the average peak demand was 15,893 MW with load shedding of 143 MW. The supply & shortfall of electricity at average peak demand is given in Table 9.5. Transmission and Distribution Network Infrastructure 9.11 The contribution of MAHADISCOM to the distribution utilities in the State was 84 per cent followed by Reliance Infrastructure 6.8 per cent, Tata Power 5.3 per cent and BEST 3.9 per cent for 2014-15. 9.12 Improvement in the T & D network infrastructure and reduction in the T & D losses (both technical & non-technical) is the ongoing process which involves measures like modernisation of Extra High Voltage (EHV) sub-stations, replacement of faulty meters, load reduction on overloaded HT & LT circuits by providing additional transformers and erection & commissioning of new sub-stations and lines under various schemes alongwith anti-theft drive undertaken by MAHATRANSCO and MAHADISCOM. The transmission capacity of MAHATRANSCO was 1,05,112 Mega Volt Ampere (MVA) with the network of 41,591 circuit km transmission lines and 609 sub-stations by 2014-15. During 2014-15, the transmission capacity of 1,750 MVA was added through the line length of 1,628 circuit km and one sub-station. With the addition of 110 substations, 23,845 circuit km line length and 30,017 distribution transformers during 2014-15, the distribution network of MAHADISCOM has 2,925 substations, 9,49,791 circuit km line length and 5,23,583 distribution transformers by the end of 2014-15. Upto 2014-15, meters were installed at 16,804 feeders & 2,32,730 distribution transformer centres and 15,80,347 meters were replaced during 2014-15. During 2015-16, meters were installed at 217 feeders & 4,346 distribution transformer centres and 10,17,290 meters were replaced upto December. Under anti-theft drive, 61,219 cases were detected during 2014-15 and amount of ` 57.08 crore was recovered. During 2015-16 upto December, 28,344 cases were detected and amount of ` 8.73 crore was recovered. The losses are given in Table 9.6 and 9.7.
Table 9.5 Supply & shortfall of electricity at average peak demand
(MW)
Year Average peak demand Supply Shortfall
2011-12 14,043 12,841 1,202 2012-13 14,032 13,309 723 2013-14 14,406 13,830 576 2014-15 15,812 15,392 420 2015-16+ 15,893 15,750 143 Source: MAHADISCOM + upto December
Table 9.6 Transmission losses (per cent)
Licensee 2013-14 2014-15 2015-16+
MAHATRANSCO 4.08 3.89 3.95
Tata Power 4.18 3.89 4.01# Reliance Infrastructure 4.09 3.89 3.89
+ upto December # upto November Source : MAHATRANSCO, Tata Power, Reliance Infrastructure

131
Economic Survey of Maharashtra 2015-16
Capacity Addition 9.13 Thermal Power : Projects of around 2,570 MW capacity are under execution & commissioning, 1,570 MW capacity projects are proposed and projects of 4,000 MW are under planning by MAHAGENCO. The details are given in Table 9.8.
9.14 Renewable Energy : Wind, solar, biomass, biogas, sea waves, geo-thermal, etc. are the renewable, clean and eco-friendly energy sources. GoM has notified Maharashtra Energy Development Agency (MEDA) as the designated agency to co-ordinate, regulate and enforce the provisions of the Energy Conservation Act, 2001. MEDA is actively engaged in propagation & promotion of renewable energy and implementation of energy conservation programmes. 9.15 GoM has adopted the policy of achieving the target of renewable purchase obligation upto 10 per cent in line with GoI. Accordingly, policies and incentives have been announced for grid connected electricity generation through renewable energy sources. The State ranks second in the country in terms of installed capacity of renewable power generation projects. Upto December, 2015 projects of 6,932 MW capacity have been installed. Potential and installed capacity of renewable energy is given in Table 9.9. Table 9.9 Potential and installed capacity of renewable energy
(MW)
Renewable energy source Potential Installed capacity
As on 31st March As on 31st December, 2015 2014 2015
Wind 9,400 4,080 4,444 4,636 Small Hydro Projects (SHPs)# 732 271 284 284 Bagasse co-generation 1,500 1,355 1,415 1,415 Biomass 781 190 200 200 Urban waste 287 3 3 3 Industrial Waste 350 26 32 34 Solar Thermal 35/sq.km$ 230 329 360 Solar Photovoltaic (PV) 49/sq.km$ Total 13,050 6,155 6,707 6,932 Source : MEDA # SHPs (less than 25 MW capacity) installed by Water Resource Department $ Not included in total potential
Table 9.7 Distribution and AT & C losses (per cent)
Licensee Distribution Losses AT & C Losses
2013-14 2014-15 2015-16+ 2013-14 2014-15 2015-16+ MAHADISCOM 14.00 14.17 15.77# 17.68 18.71 21.83# Tata Power 1.10 0.58 1.13# 1.08 0.58 1.13# Reliance Infrastructure 9.50 9.53 9.36 9.50 9.53 9.36 BEST 5.90 6.53 5.90 7.05 8.36 -- # upto November + upto December -- Not available. Source: MAHADISCOM, Tata Power, Reliance Infrastructure, BEST
Table 9.8 Projects proposed by MAHAGENCO (MW)
Projects Capacity Anticipated commissioning Parali Unit-8 250 March, 2016 (subject to availability of water) Chandrapur Unit - 8 & 9 (500 MW each) 1,000 March, 2016 Koradi Unit - 9 & 10 (660 MW each) 1,320 Unit-9 by March, 2016 and Unit-10 by May, 2016 Paras Unit-5 250 September, 2019 Bhusawal Unit-6 660 October, 2019 Nashik Unit-6 660 April, 2020
Source : MAHAGENCO

Economic Survey of Maharashtra 2015-16
132
9.16 Sourcewise renewable energy projects in the State are given below.
9.16.1 Wind Power : Demonstration projects of 11.09 MW have been installed by MEDA in the State. The attractive policy and incentives announced by GoM have facilitated private investment of more than ` 23,200 crore in the wind power sector.
9.16.2 Solar Thermal & Solar Photovoltaic Power : Solar photovoltaic power projects of 360.25 MW have been commissioned in the State through MEDA upto December, 2015. Solar power projects of aggregate 895 MW capacity are proposed by MAHAGENCO.
9.16.3 Bagasse Co-generation Power: In all 84 bagasse co-generation projects have been commissioned as on 31st December, 2015 in the State. To encourage investors in this sector, GoI gives capital subsidy to co-gen projects based on boiler configuration and GoM also gives financial assistance.
9.16.4 Biomass Power : MEDA has conducted the biomass assessment studies in 39 talukas of the State with financial support of Ministry of New & Renewable Energy (MNRE), GoI. As a result of the attractive policy for private participation, 19 biomass projects have been commissioned and 17 projects have been approved upto December, 2015.
9.16.5 Small Hydro Power Projects (SHPs) : Water Resource Department, GoM has installed SHPs of 284.30 MW capacity out of the total identified potential of 732 MW in the State upto December, 2015. Under the Government hydel policy to boost the development of SHPs through privatisation, 25 projects of 108.10 MW are commissioned and 16 projects having aggregate installed capacity of 52 MW are under construction upto November, 2015.
9.17 The GoM has announced “Comprehensive policy for grid-connected power projects based on new and renewable energy sources-2015” considering the importance of these sources and their potential of power generation in the State. The policy targets 14,400 MW capacity power projects based on new and renewable energy sources to be installed in the next five years. Regulatory Measures and Electricity Tariffs
9.18 Maharashtra Electricity Regulatory Commission (MERC) has been set up for determination of tariff, regulation of power purchase and procurement process of transmission & distribution utilities, promotion of competition, efficiency & economy in the electricity sector. Under the Electricity Act, 2003, the commission has been entrusted with additional functions of facilitation of intra-state transmission and wheeling of electricity, issue of licenses for electricity transmission, distribution & trading, promotion of co-generation and renewable energy generation.
9.19 The MERC has taken proactive measures like Multi Year Tariff determination, Promotion of Renewable Energy, Parallel Licensing, Consumer Advocacy, Demand Side Management, etc. Under parallel licensing, Mumbai became a metropolis with two parallel licensees (BEST and Tata Power in Mumbai City, Reliance Infra and Tata Power in Mumbai Suburban) having rights to distribute electricity in the same geographical area, enabling the consumer to change over from one licensee to other through the changeover protocol provided by the Commission. Consumer grievance redressal forum and electricity ombudsman at Mumbai and Nagpur have been notified by the Commission through regulations to protect the interest of consumers. Tariffs of electricity in 2015-16 are given in Table 9.10.

133
Economic Survey of Maharashtra 2015-16
Table 9.10 Tariffs of electricity in 2015-16 (` per unit)
Category of user MAHADISCOM Reliance Infrastructure Tata Power BEST
LT - Domestic/Residential
BPL 1.42 -- -- 1.22
0-100 Units 4.33 4.49 2.32 4.12
101-300 Units 7.75 6.39 4.29 8.68
301-500 Units 10.50 7.79 8.20 11.63
500-1,000 Units 11.87 9.23 10.15 14.14
Above 1,000 Units 12.99 9.23 10.15 14.14
LT - Commercial/Non-Residential
(a) 0-20 kW
0-200 Units 7.89 8.07 8.86 13.51
Above 200 Units 10.99 8.07 8.86 13.51
(b) > 20 kW & <= 50 kW 12.43 9.06 9.34 14.67
(c) Above 50 kW 15.07 9.85 9.55 15.18
LT - Industry
below 20 kW load 5.83 8.18 7.83 12.24
LT - Industry
(a) 20-100 kW load 8.39 8.27 8.86 12.84
(b) Above 100 kW load 8.39 8.27 8.86 12.49
LT - Agriculture (a) Un-Metered – Pumpsets (b) Metered – Pumpsets (c) Metered – Others
3.53 2.81 4.17
-- -- --
-- -- --
-- -- --
LT - Street Lights (Public lighting)
(a) Grampanchayat and A, B & C class Municipal Councils
4.89 -- -- --
(b) Municipal Corporation areas 5.98 8.19 -- 12.18
HT - Industry 7.76 8.49 8.79 12.22
HT - Railways
(a) 33/22/11/6.6 kV – All units 8.46 -- 9.19 --
(b) 100 kV – All units 8.46 -- 8.98 --
HT- Agriculture Pumps 3.56 -- -- --
Source: MERC -- Not Applicable

Economic Survey of Maharashtra 2015-16
134
9.20 Village electrification, network improvement and energy conservation: Out of total 40,959 inhabited villages (as per census 2011) 40,898 villages are electrified upto December, 2015 in the State. The important schemes undertaken for village electrification, network improvement and energy conservation are given below.
9.20.1 Rajeev Gandhi Gramin Vidyutikaran Yojana : Electrification of 4,709 non-electrified villages was completed and free electricity connections were provided to 12,11,041 rural BPL households, under this scheme.
9.20.2 Deen Dayal Upadhyay Gram Jyoti Yojana : GoI has launched the scheme for rural area and sanctioned ` 2,163.44 crore for the State. Separation of agriculture and non-agriculture feeders, strengthening & augmentation of sub-transmission and distribution infrastructure in rural areas including metering, creation of infrastructure for connecting unconnected rural households including BPL beneficiaries, modernisation & strengthening of infrastructure in villages selected under Sansad Adarsh Gram Yojana are the works covered under this scheme.
9.20.3 Remote Village Electrification Programme : Under this programme of GoI and GoM, electrification of 543 villages and 694 hamlets are covered upto 2014-15 by MEDA using renewable energy sources.
9.20.4 Separate feeder scheme : Separate feeders for gaothan and agricultural pumps were provided to 17,334 villages upto 2014-15.
9.20.5 Energisation of agricultural pumps : Energisation of 1,47,993 agricultural pumps was done during 2014-15 and 83,415 during 2015-16 upto December. The cumulative agricultural pumps energised were 38,96,113 upto December, 2015 which excludes permanently disconnected agriculture connections.
9.20.6 Atal Saur Krushi Pump Yojana : The new scheme of providing solar agricultural pumps has been launched in the State during 2015. It is being implemented by MAHADISCOM and MEDA. A target of installation of 7,540 solar agricultural pumps has been set.
9.20.7 Restructured Accelerated Power Development & Reforms Programme : Towns and cities with population of more than 30,000 are covered under this scheme. It covers establishment of baseline data, fixation of accountability, reduction of AT & C losses, and Supervisory Control and Data Acquisition / Data Management System control centre. Power Finance Corporation released ` 1,400.87 crore to the State and expenditure of ` 1,490.26 crore was incurred upto December, 2015.
9.20.8 Domestic Efficient Lighting Programme : Under this programme, launched in June 2015, the existing CFLs and incandescent lamps of domestic consumers are to be replaced by LEDs. The programme is being implemented by Energy Efficient Services Ltd., a joint venture of PSUs of Ministry of Power, GoI and facilitated by MAHADISCOM in the State. MERC approved project design document for 3.86 crore LED distribution to MAHADISCOM with estimated expenditure of ` 553.93 crore, leading to estimated annual savings of 750 MUs with expected demand reduction of about 293 MW. A target of distributing 3.00 crore LEDs within two financial years has been set. During 2015-16, upto 15th February, about 92 lakh LEDs have been distributed in the State.

Economic Survey of Maharashtra 2015-16
135
TRANSPORT AND COMMUNICATION 9.21 A well-knit transport and communication system brings people of different regions within the country and the world closer to one another. It also facilitates movement of goods and services from their locations of supply and demand. The transport routes are, thus, the main arteries of our economy. An efficient means of transport and communication are, therefore, prerequisites of fast development. The transport system comprises of surface, water and air transport whereas, main components of communication systems are posts, telephones and internet services.
Transport
Road Network
9.22 The road network consists of national highways, major state highways, state highways, major district roads, other district roads, village roads and internal city roads. The road development agencies in the State are Public Works Department (PWD) of the State Government, Zilla Parishads (ZP), Forest Department, Urban Local Bodies, Cantonment Boards (CB), Maharashtra State Road Development Corporation (MSRDC), Maharashtra Industrial Development Corporation (MIDC), City & Industrial Development Corporation (CIDCO) and Mumbai Metropolitan Region Development Authority (MMRDA).
9.23 Road Development Plan 2001-21 is being implemented in the State with a target to develop 3.37 lakh km roads. The total road length maintained by PWD and ZP (excluding road length maintained by other agencies) at the end of March, 2015 was 2.99 lakh km, of which surfaced road length was 2.45 lakh km (81.9 per cent). As on 31st March, 2015 about 99 per cent villages were connected by all-weather roads and fair-weather roads. During 2014-15, an outlay of ` 3,820 crore was approved and an expenditure of ` 2,677 crore was incurred. The road length maintained by PWD and ZP is given in Table 9.11. The yearwise road length by type of road in the State is given in Annexure 9.2 and classification of districtwise road length according to breadth in 2014 & 2015 is given in Annexure 9.3.
Table 9.11 Road length maintained by PWD and ZP (km)
Statutory Development
Board
As on
31st March
Type of roads
National Highways
Major State
Highways
State Highways
Major District Roads
Other District Roads
Village Roads
Total
Vidarbha 2014 1,298 2,137 9,727 11,478 14,768 26,511 65,919
2015 1,599 1,639 9,604 11,899 14,642 26,281 65,664
Marathwada 2014 1,297 1,757 7,778 11,527 12,251 24,720 59,330
2015 816 1,757 7,778 11,527 12,251 31,368 65,497
Rest of Maharashtra 2014 3,263 2,443 16,458 27,227 25,742 63,326 1,38,459
2015 2,351 2,767 16,478 27,159 31,222 88,230 1,68,207
Total 2014 5,858 6,337 33,963 50,232 52,761 1,14,557 2,63,708
2015 4,766 6,163 33,860 50,585 58,115 1,45,879 2,99,368
Source: PWD, GoM

Economic Survey of Maharashtra 2015-16
136
Graph 9.5 : Achievement of road development plan (2001-21)
2,99,368
2,41,7122,31,4302,16,946
150
200
250
300
350
2000-01 2005-06 2010-11 2014-15
Year
Road
lean
gth
('000
km)
Target as per road development plan (km)Total road leangth
337
Pradhan Mantri Gram Sadak Yojana
9.24 The primary objective of Pradhan Mantri Gram Sadak Yojana (PMGSY) is to provide all-weather road connectivity to the un-connected habitations in the rural areas with a population of 500 & above (250 & above for tribal areas). A target of 24,439 km of road length for connecting 8,315 habitations in the State has been set under PMGSY. As against the target, 22,898 km of road length has been created by connecting 8,009 habitations, upto 31st December, 2015. Cumulative road length constructed & habitations connected under PMGSY since inception are given in Table 9.12 and the physical & financial achievement of PMGSY are given in Table 9.13.
9.25 The GoI has sanctioned PMGSY-II for the states achieving 100 per cent target of new connections to the habitations and 75 per cent target of upgradation. Under this programme, only upgradation of roads can be undertaken. A target of 2,620 km road length has been set by GoI for the State. PMGSY-II was implemented in the State since 2013 with the share of GoI and GoM 75:25 & 90:10 in non-tribal and tribal areas respectively upto 2014-15. From 2015-16 GoI has modified this sharing pattern as 60:40.
Maharashtra State Road Development Corporation 9.26 MSRDC has completed 19 projects incurring an expenditure of ` 7,791 crore upto December, 2015. The total toll collected from the partially and fully completed projects upto December, 2015 was ` 6,885 crore as against the total expenditure of ` 8,581 crore. On-going projects of MSRDC are given in Table 9.14.
Table 9.12 Cumulative road length constructed and number of habitations connected under PMGSY since inception
Statutory Development
Board
Physical Target Cumulative Physical Achievement +
Road length ( km)
Habitations (no)
Road length ( km)
Habitations connected
(no)
Vidarbha 7,782 2,921 7,289 2,688 Marathwada 5,026 1,863 4,909 1,820 Rest of Maharashtra 11,631 3,531 10,700 3,501 Total 24,439 8,315 22,898 8,009
Source: RDD, GoM + upto December, 2015
Table 9.13 Annual Physical and financial achievement of PMGSY
Year Number of habitations connected
Road length created (km)
Expenditure incurred (` crore)
2013-14 203 449 384.20
2014-15 155 367 410.00
2015-16+ 75 84 185.94
Source: RDD, GoM + upto December, 2015

Economic Survey of Maharashtra 2015-16
137
Mumbai Metropolitan Region Development Authority
9.27 Mumbai Metropolitan Region (MMR) comprises of area under eight municipal corporations, nine municipal councils and about one thousand villages of Thane & Raigad districts. MMRDA has undertaken various infrastructure projects in MMR. Mumbai Metro Rail project is the Mass Rapid Transport System project being implemented on Public Private Partnership (PPP) basis. Status of outgoing transport projects in MMR are given in Table 9.15.
Table 9.14 Status of on-going projects of MSRDC upto December, 2015
Name of project
Commen-cement Year
Estimated project cost (` crore)
Expenditure (` crore)
Expected year of completion
Road Works in Nagpur 2001-02 422 460.90 2015-16
Road Works in Aurangabad 2001-02 142 277.68 2015-16
Widening of Nagpur-Katol-Jalalkheda Road 2008-09 31 3.64 2015-16
Versova- Bandra Sea Link Project 2007-08 4,419 14.90 NA
Modernisation of Border Check Post 2008-09 1,000 48.94 NA
Western Freeway Sealink 1998-99 4,143 16.56 NA
Mumbai Urban Transport Project(MUTP) 2003-04 472 321.06 2015-16
Mumbai Urban Infrastructure Project (MUIP) 2005-06 393 167.87 2015-16
Extended – MUIP 2008-09 2,065 428.07 2015-16
Increasing capacity of Mumbai-Pune Express Way (MPEW)
2009-10 5,000 3.17 2019-20
Way side amenities on MPEW 2014-15 200 1.68 2015-16
Pedder Road Flyover 2012-13 380 -- NA
Source: MSRDC NA Not Available

Economic Survey of Maharashtra 2015-16
138
Table 9.15 Status of on-going transport projects in MMR (` crore)
Name of project Commen-
cement year
Cost of Project
Expenditure upto October,
2015 Current status
Expected year of
completion
Mumbai Metro Rail Project$:
Phase IIA : Dahisar-D.N. Nagar (18.6 km)
2015 6,410 -- Commencement by February, 2016
March, 2019
Phase III : Colaba-Bandra-SEEPZ (33.5 km)
-- 23,136 140.00 General consultant appointed, tendering for civil work in progress
2020-21
Phase IV : Wadala-Ghatkopar-Thane-Kasarwadavli (32 km)
-- 19,100 -- The Feasibility study report submitted
NA
Phase VII: Andheri (E)-Dahisar (E) (16.5 km)
-- 6,208 -- Process for appointment of interim consultant in progress
March, 2019
Mumbai Mono Rail Project: Wadala to Chembur & Sant Gadge Maharaj Chowk (Jacob circle) to Wadala (20 km)
2008 2,460 2,261.00 Phase I completed, Phase II Sant Gadge Maharaj Chowk (Jacob circle) to Wadala 90 per cent work completed
2016
MUIP : Roads, Flyovers, Subways, etc.
2003 3,207 4,683.54 Work of elevated road between BKC & Eastern Express Highway started from BKC side, remaining all works are completed and handed over to respective authorities
2017
EXTENDED MUIP: Project to complement the MUIP. Phase- I & II: 35 sub-projects are undertaken. (276 km roads, 14 flyovers, 3 creek bridges and 2 ROB)
2007
2,607
1,835.90†
214 km roads & seven flyovers completed, remaining works in progress
May, 2018
Phase –III : 17 sub- projects (32 bridges, 3 tunnels & 133 km roads)
3,629 Work of five sub-projects are in progress & preliminary work of remaining in progress
May, 2018
Multi-Modal Corridor from Virar to Alibaug: Construction of freeway having eight lanes for the vehicles besides dedicated lanes for buses (140 km)
2010 9,500@
6.26 Preliminary work in progress 2019
Mumbai Trans – Harbour link : Link from sea front at Sewri to Nhava (22 km)
2011 11,370 7.95 Preliminary work in progress 2021
MUTP: Mumbai Urban Transport Project, MUIP: Mumbai Urban Infrastructure Project @ Excluding land acquisition cost NA Not Available $ Phase-I : Varsova-Andheri-Ghatpoar (14 km) was completed † including phase-III Source: MMRDA

Economic Survey of Maharashtra 2015-16
139
Maharashtra Brihanmumbai
Accidents
Killed & injured
persons Maharashtra
Brihanmumbai 80000
70000
60000
50000
40000
30000
20000
10000
0
Year2010 2011 2012 2013 2014 2015
Num
ber
Graph 9.6 : Number of accidents and persons killed & injured in the Maharashtra and Brihanmumbai
Surface Transport Motor Vehicles
9.28 The total number of motor vehicles on road in the State as on 1st January, 2016 was 2.7 crore (23,009 vehicles per lakh population), showing an increase of eight per cent over previous year. Of the total vehicles in the State, about 27.3 lakh vehicles (10.1 per cent) were in Brihanmumbai. The number of vehicles per km road length in the State is 90. The categorywise number of motor vehicles on road are given in Table 9.16 and yearwise series of motor vehicles on road are given in Annexure 9.4.
9.29 The number of valid motor driving licenses in the State at the end of March, 2015 was three crore, showing an increase of 5.9 per cent over the previous year. The number of learning licenses issued in the State during 2014-15 was 19.7 lakh.
9.30 Road Safety fortnight was observed in January, 2016 with the theme “Road safety-time for action”. Plays and lectures based on theme of road safety were organised in the State. The number of accidents per ten thousand vehicles in Maharashtra & Brihanmumbai during 2015 are 24 & 86 respectively. The number of accidents, persons killed & injured in the State and Brihanmumbai are given in Table 9.17.
Table 9.16 Category wise number of motor vehicles on road ('000)
Category
As on 1st January Maharashtra# Brihanmumbai
2015 2016* Per cent change
2015 2016* Per cent change
Two wheelers (motorcycles, scooters & mopeds)
18,151.4 19,705.5 8.6 1,416.5 1,566.3 10.6
Auto rickshaws 719.3 724.1 0.7 124.3 128.6 3.4 LMV (cars, jeeps, station wagons & taxis)
3,749.8 4,053.4 8.1 868.7 947.0 9.0
Buses (stage carriages, contract carriages, school buses & PSV)
115.5 116.0 0.5 12.7 13.5 6.1
Goods vehicles {Articulated/Multiaxel vehicles, trucks & lorries, tankers, delivery vans (3 & 4 wheelers), etc}
1,338.2 1,420.0 6.1 66.8 71.3 6.7
Tractors 557.6 599.1 7.4 0.2 0.2 neg Trailers 370.5 382.6 3.3 0.1 0.1 neg Ambulances 13.6 14.3 4.9 1.5 1.6 5.3 Other vehicles 43.6 49.5 13.5 1.2 1.2 neg Total 25,059.5 27,064.5 8.0 2,492.0 2,729.8 9.5
* Provisional LMV–Light Motor Vehicles PSV - Public Service Vehicles # including Brihanmumbai neg Negligible Source : Transport Commissioner’s Office, GoM

Economic Survey of Maharashtra 2015-16
140
Public Passenger Road Transport Facility Maharashtra State Road Transport Corporation
9.31 On an average, Maharashtra State Road Transport Corporation (MSRTC) carried 67.28 lakh passengers per day during 2014-15. Effective kms operated per day has increased by about 1.9 per cent and the percentage load factor (including value of concession) has decreased by 1.3 percentage points over the previous year. The percentage of villages and percentage of population served by MSRTC is given in Table 9.18. The operational statistics of MSRTC is given in Table 9.19 and number of accidents & compensation paid by MSRTC is given in Table 9.20.
Table 9.19 Operational statistics of MSRTC
Item 2013-14 2014-15 Per cent change Total vehicles held 18,055 17,956 (-) 0.5 Average no. of buses on road per day 16,437 16,625 1.1 Total number of employees 1,07,709 1,07,500 (-) 0.2 Average effective km operated per day (lakh) 56.07 57.12 1.9 Average no. of passengers carried per day (lakh) 70.22 67.28 (-) 4.2 Vehicle productivity (km) 310.54 318.09 2.4 KPTL# 47.69 47.63 (-) 0.1 Crew productivity (km) 226.51 227.61 0.5 Bus Staff ratio (on schedule) (as on 31st March) 6.52 6.44 (-) 1.2 Average seating capacity 44.08 43.95 (-) 0.3 Percentage load factor (excluding value of concession) 58.28 57.16 (-) 1.1@ Percentage load factor (including value of concession) 72.18 70.86 (-) 1.3@
Source : MSRTC # kilometers per ten liters (Diesel) @ Point
Table 9.17 Number of accidents, persons killed & injured in the State and Brihanmumbai
Year Number of accidents Number of persons killed Number of persons injured State# Brihan-
mumbai Perce-ntage@
State# Brihan-mumbai
Perce-ntage@
State# Brihan-mumbai
Perce-ntage@
2011 68,438 25,471 37.2 13,057 563 4.3 45,616 5,059 11.1
2012 66,316 24,592 37.1 13,333 488 3.7 43,847 4,543 10.4
2013 61,890 23,512 38.0 12,194 496 4.1 41,106 4,250 10.3
2014 61,627 22,557 36.6 12,803 529 4.1 40,455 3,936 9.7
2015 63,805 23,347 36.6 13,212 520 3.9 39,606 4,037 10.2 Source: Motor Transport Statistics of Maharashtra @ percentage of Brihanmumbai to State # including Brihanmumbai
Table 9.18 Percentage of villages covered and population served by MSRTC bus services
Particulars Villages covered Population served
2013-14 2014-15 2013-14 2014-15
Direct 73.0 73.8 90.9 90.4
Upto 3 km 16.7 16.4 5.9 6.3
Between 3 to 5 km 6.1 5.6 1.9 1.9
Beyond 5 km 4.2 4.2 1.3 1.4
Source: MSRTC

Economic Survey of Maharashtra 2015-16
141
Graph 9.7 : MSRTC- Earning per km (`)
(including prior period adjustment)
23.6
6
34.8
236
.69
23.2
8
20
25
30
35
40
2009
-10
2010
-11
2011
-12
2012
-13
2013
-14
2014
-15
Year
`
Earning per km ( )`Cost per km (including prior period adjustment) ( )`
(`)and cost per km
9.32 Apart from regular operations, MSRTC provides special services for fairs and casual contracts. The operational details of fair and casual contracts are given in Table 9.21
9.33 MSRTC gives various types of concessions in the bus fares to students, senior citizens (above 65 years), cancer patients, freedom fighters, etc. The concession amount is reimbursed by GoM. During 2014-15 value of concession given by MSRTC is ` 1,334 crore. For 2014-15 both total receipts and expenditure were higher by about 7.7 per cent over the previous year. Financial status of MSRTC is given in Table 9.22.
9.34 Share capital of GoI and GoM in MSRTC as on 31st March, 2015 was ` 56.77 crore and ` 1,341.21 crore respectively.
Table 9.20 Number of accidents and compensation paid by MSRTC
Particulars 2010-11 2011-12 2012-13 2013-14 2014-15
Accidents (no) 3,407 3,437 3,078 3,154 3,172 Persons killed (no) 547 570 445 533 494 Persons injured (no) 6,523 7,062 6,163 6,366 6,276 Accidents per lakh km 0.18 0.17 0.15 0.15 0.15 On the spot payment (` lakh) 32.00 39.95 49.93 37.27 62.57 Final compensation (` lakh) 3,549.20 4,388.00 4,022.81 3,778.21 4,607.24
Source : MSRTC
Table 9.21 Fair & casual contracts operation details
Particulars Fair Casual contracts 2013-14 2014-15 2013-14 2014-15
Conces-sional
Non-conces-sional
Total
Conces -sional
Non-conces-sional
Total
Effective km operated (lakh)
197.42 199.49 128.07 89.99 218.06 136.80 108.85 245.65
Income earned (` lakh )
5,773.58 6,150.12 2,981.73 4,296.17 7,277.90 3,429.77 6,554.73 9,984.50
Earning per km (`) 29.25 30.83 23.28 47.74 33.38 25.07 60.22 40.64
Source: MSRTC
Table 9.22 Financial status of MSRTC ( ` crore)
Particulars 2012-13 2013-14 2014-15 (A) Receipts Revenue from passengers
5,921.07 6,519.84 7,061.69
Other revenue 174.72 217.70 196.97 Total 6,095.79 6,737.54 7,258.66 (B) Expenditure Passenger, Motor vehicle, Municipal Taxes and Octroi
796.97 862.98 932.85
Depreciation 364.57 408.17 372.95 Others 5,322.42 6,060.59 6,594.46 Total 6,483.96 7,331.74 7,900.26 Profit (A – B) (-) 388.17 (-) 594.20 (-) 641.60 Prior period adjustment (-) 40.66 21.55 250.60 Net profit (-) 428.83 (-) 572.65 (-) 391.00 Source: MSRTC

Economic Survey of Maharashtra 2015-16
142
9.35 The toll charges paid by MSRTC for the year 2013-14, 2014-15 and 2015-16 (upto December) were ` 133 crore, ` 146 crore and ` 93 crore respectively. 9.36 Rate of passenger tax on income from rural passenger transport, air-conditioned passenger transport and urban passenger transport as on 31st March, 2015 were 17.5 per cent, 5.5 per cent and 3.5 per cent respectively. The GoM has allowed MSRTC to retain 5.5 per cent passenger tax from payable passenger tax on mofussil services in the form of interest bearing capital contribution at the rate of six per cent per annum from April, 2000. The MSRTC has received ` 1,380.33 crore on account of interest bearing capital contribution from April, 2009 to March, 2015. The GoM has discontinued six per cent interest charge on interest bearing capital contribution w.e.f. 1st April, 2012.
City Public Transport 9.37 The public road transport is the major mode of transport in cities. This facility is available in 22 cities in the State. Of these, MSRTC provides local transport facility in seven cities (Aurangabad, Nanded, Nashik, Sangli-Miraj, Ratnagiri, Chandrapur and Vasai-Virar-Nalasopara), BEST in Brihanmumbai, PMPML in Pune & Pimpri-Chinchwad Municipal Corporation area and in remaining 13 cities respective Municipal Council/Corporations are providing such facilities. Operational statistics of public transport services in cities is given in Table 9.23.
Table 9.23 Operational statistics of public transport in cities ( As on 31st March)
Transport service provider
Average no. of buses
on road per day
Average no. of passengers
carried per day (lakh)
Average effective
kms operated per day (lakh)
Net profit/ loss (` lakh)
2014 2015 2014 2015 2014 2015 2014 2015 Brihanmumbai Electricity Supply & Transport (BEST)
3,753 3,636 35.80 33.47 6.99 6.68 (-) 59,038 (-) 85,802
Pune Mahanagar Parivahan Mahamandal Ltd
1,295 1,364 11.64 12.17 3.00 3.14 (-) 9,941 (-)16,769
MSRTC (City operations) 497 482 3.03 2.44 0.97 0.91 (-) 2,397 (-) 2,688 Nagpur Municipal Transport 240 240 1.31 1.35 0.45 0.42 (-) 2,488 (-) 2,534 Navi Mumbai Municipal Transport
222 243 2.04 2.19 0.63 0.67 (-) 2,132 (-) 3,209
Thane Municipal Transport 189 174 2.01 1.71 0.39 0.34 (-) 2,733 (-) 3,796 Kolhapur Municipal Transport
120 92 0.98 0.71 0.29 0.21 (-) 86 NA
Vasai-Virar Municipal Transport
105 110 0.94 0.96 0.21 0.22 (-) 177 (-) 396
Kalyan-Dombivli Municipal Transport
71 75 0.46 0.40 0.13 0.13 (-) 507 (-) 1,764
Solapur Municipal Transport 67 69 0.45 0.48 0.15 0.16 (-) 767 (-) 378 Mira-Bhayander Municipal Transport
47 39 0.48 0.24 0.11 0.09 (-) 40 (-) 216
Amravati Municipal Transport
33 33 0.03 0.03 0.08 0.08 7 7
Ahmednagar Municipal Transport
-- 18 -- 0.11 -- 0.02 -- (-) 72
Khopoli Municipal Transport 21 17 0.17 0.17 0.03 0.03 (-) neg (-) neg
Jalgaon Municipal Transport 10 5 0.03 0.01 0.02 0.01 NA NA Akola Municipal Transport 10 † 0.07 † 0.02 † (-) 28 †
NA: Not Available neg Negligible † city transport service closed during 2015-16 Source: Concerned Municipal Council/Corporations, BEST, PMPML & MSRTC

Economic Survey of Maharashtra 2015-16
143
Railways 9.38 Railway is the most effective mass transport system in India. Freight and passenger traffic are the two major segments of the railways. The railway route length in the State as on 31st March, 2015 was 6,103 km (including 378 km of Konkan railway), which is 9.2 per cent of the total railway route length of 66,030 km in the country. The status of on-going railway works is given in Table 9.24.
Mumbai Suburban Railway
9.39 Suburban rail network is the principal mode of mass transport in Mumbai. Two zonal railways, viz. Western Railway (36 stations) and Central Railway (62 stations) operate Mumbai suburban railway system. The Harbour line with 38 stations is part of the Central Railway. A fleet of 205 local trains (rakes) are utilised to run 2,811 train services, carrying 79.4 lakh passengers per day. The yearwise number of local trains is given in Table 9.25.
9.40 Mumbai Railway Vikas Corporation Ltd (MRVC) is implementing rail component of MUTP II. The status of on-going projects of MUTP II is given in Table 9.26.
Table 9.24 Status of on-going railway works (As on 31st January, 2015)
Name of route Route length (km)
Total project cost
(` crore) Status
Ahmednagar-Narayandoh -Beed-Parli- Vaijnath
261 2,786.18 Ahmednagar-Narayandoh 11.6 km track linking completed, remaining in progress.
Baramati-Lonand (new line) 54 138.48 Lonand- Phaltan 27 km completed, out of remaining 50 per cent completed
Belapur-Seawood-Uran (new line) 27 2,298.61 15 per cent
Wardha-Nanded (new line) 284 3,000.35 10 per cent
Panvel-Pen (doubling) 35 260.16 Completed
Pen-Roha (doubling) 40 203.00 Pen-Kasu 14 km completed, out of remaining 93 per cent completed
Godhani-Kalmuna (doubling) 13 59.13 65 per cent
Kalyan-Kasara 3rd line (doubling) 68 279.70 5 per cent
Bhusawal-Jalgaon 3rd line (doubling) 24 184.06 10 per cent
Wardha-Sewagram-Nagpur 3rd line (doubling)
76 297.85 10 per cent
Source: South Eastern, Central, South Central & Western Railway and Konkan Railway Corporation.
Table 9.25 Yearwise number of local trains (rakes)
Year 9 car 12 car 15 car Total
2011-12 47 147 1 195
2012-13 41 157 3 201
2013-14 37 165 3 205
2014-15 37 165 3 205
Source : Mumbai Railway Vikas Corporation

Economic Survey of Maharashtra 2015-16
144
Navi Mumbai Metro Rail Project 9.41 CIDCO has finalised six metro rail corridors for development in phases. CBD Belapur-Pendhar-Taloja MIDC-Kalamboli-Khandeshwar-Navi Mumbai International Airport corridor shall be executed in the first phase in three stages, of which, the work of first stage, Belapur-Pendhar (11.1 km) is in progress with estimated project cost of ` 3,043 crore. An expenditure of ` 794.70 crore has been incurred upto December, 2015. CBD Belapur-Pendhar (first stage) is expected to be completed by 2017.
Water Transport Major Ports 9.42 The State has 720 km long coastline with two major ports, operated by Mumbai Port Trust (MbPT) and Jawaharlal Nehru Port Trust (JNPT). During 2015-16 up to January, MbPT and JNPT handled 514.01 lakh MT and 535.47 lakh MT cargo traffic respectively. The operating surplus for MbPT in 2014-15 was ` 331.68 crore which was 2.2 per cent less than the previous year. The operating surplus for JNPT in 2014-15 was ` 836.57 crore which was 13.9 per cent more than the previous year. Operational statistics of major ports is given in Table 9.27.
Table 9.26 Status of on-going projects of MUTP II (As on 31st October, 2015)
Name of project Commen-
cement Year
Estimated cost
(` crore)
Expenditure (` crore) Physical progress
Expected year of
completion Additional 5th & 6th line (CST-Kurla) 2008-09 891 16.55 Work in
progress March, 2021
Additional 5th & 6th line (Thane-Diva) 2008-09 288 189.81 69 per cent 2017 Additional 6th line (Mumbai Central-Borivali)
2008-09 919 159.97 17 per cent March, 2019
Extension of Harbour line (Andheri- Goregaon)
2008-09 154 161.58 74 percent June, 2016
Running of 12 car on Harbour line 2012-13 a) Procurement of 153 coaches 519 -- Under process 2018 b) Platform extension for 12
coaches 195 55.53 55 per cent March, 2017
Source : Mumbai Railway Vikas Corporation
Table 9.27 Operational statistics of major ports
Item MbPT Per cent change
JNPT Per cent change 2013-14 2014-15 2013-14 2014-15
Total cargo capacity (lakh MT) 492.50 502.50 2.0 658.80 658.80 0.0 No. of employees Cargo traffic handled (lakh MT)
12,017 10,897 (-)9.3 1,697 1,669 (-)1.6
A) Import 389.50 406.16 4.3 313.03 345.68 10.4 B) Export 202.34 210.44 4.0 310.30 292.33 (-)5.8 Total 591.84 616.60 4.2 623.33 638.01 2.4 Passenger traffic handled (in '000) 2.96 7.92 167.6 NA NA NA No. of Vessels handled 4,611 4,584 (-)0.6 2,526 2,642 4.6 Operating income (` crore) 1,304.88 1,399.78 7.3 1,345.29 1,508.08 12.1 Operating expenditure (` crore) 965.82 1,068.10 10.6 611.03 671.51 9.9 Operating surplus/profit (` crore) 339.06 331.68 (-)2.2 734.27 836.57 13.9 Source : MbPT & JNPT NA Not Applicable

Economic Survey of Maharashtra 2015-16
145
Non-Major Ports 9.43 As per the State Port Policy 2010, Maharashtra Maritime Board (MMB) has undertaken development of six non-major ports. Of these ports, Dhamankhol-Jaigad, Dighi and Lavgan-Jaigad (Angre Port) ports were commissioned. Pre-construction activities are in progress for Rewas-Aware, Vijaydurg and Redi ports. Apart from these ports, there are number of captive and multi-purpose jetties set up within the limits of non-major ports, which also do the cargo handling. The non-major ports together handled 170.33 lakh MT cargo traffic and 113.52 lakh passenger traffic during 2015-16 upto November. In addition to this, Jaigad handled 95 container TEU during 2015-16 upto November. Operational information of non-major ports is given in Table 9.28. Air Transport 9.44 There are three international and eight domestic airports in the State. Passenger and cargo traffic by airports are given in Table 9.29.
9.45 Airports Authority of India (AAI) alongwith Mumbai International Airport Ltd. has undertaken a mega project to build new integrated terminal T2 for modernisation of Chhatrapati Shivaji International Airport (CSIA), Mumbai. The new terminal T2 is a state-of-the-art world class terminal with a capacity to handle 40 million passengers per annum. The new terminal T2 has been commissioned and started operations. 9.46 Ojhar airport, Nashik carried about 41,150 MT and 42,783 MT EXIM cargo during 2014-15 and 2015-16 (upto December) respectively.
Table 9.28 Operational information of non-major ports
Item 2013-14 2014-15 Per cent change
Cargo traffic handled (lakh MT) A) Import 218.99 230.13 5.1 B) Export 28.75 43.45 51.1 Total 247.74 273.58 10.4 Passenger traffic handled (lakh)
A) By mechanised vessels
165.99 167.03 0.6
B) By non- mechanised vessels
12.02 11.32 (-)5.8
Total 178.01 178.35 0.2
Source : Maharashtra Maritime Board
Table 9.29 Airportwise passenger and cargo traffic (As on 31st March)
Airport Passengers (lakh) Per cent change
Cargo (MT) Per cent 2014 2015 2014 2015 change
Domestic Mumbai 218.81 252.05 15.2 1,81,101 2,07,720 14.7 Pune 34.96 40.68 16.4 21,135 27,390 29.6 Nagpur 12.20 13.56 11.1 5,108 5,595 9.5 Aurangabad 4.41 4.24 3.9 843 1,250 48.3 Kolhapur # # 535.0 0 0 0 Juhu 1.65 1.56 (-) 5.5 417 407 (-) 2.4 Nanded 0.07 # (-) 98.4 0 0 0 Solapur 0.00 0.02 0 0 0 0 Total 272.10 312.12 14.7 2,08,604 2,42,362 16.2 International Mumbai 100.93 112.03 11.0 4,67,641 4,86,540 4.0 Nagpur 0.44 0.45 2.3 416 436 4.8 Pune 1.01 1.23 21.8 10 0 0 Aurangabad@ 0.06 0.02 (-) 66.7 0 0 0 Total 102.44 113.73 11.0 4,68,067 4,86,976 4.0
Source : Airport Authority of India @ Passenger traffic by chartered plane. # Passengers less than five hundred

Economic Survey of Maharashtra 2015-16
146
9.47 The Multimodal International Passenger and Cargo Hub Airport at Nagpur (MIHAN) project comprises of developing existing airport as an international and cargo hub airport. This is being implemented through MIHAN India Ltd. (MIL), a joint venture company comprising of Maharashtra Airport Development Company Ltd. (MADC) and AAI. Consultant has been appointed to assist MIL for up-gradation and modernisation of Dr. Babasaheb Ambedkar International Airport, Nagpur.
9.48 To reduce congestion in Mumbai International Airport, an additional airport has been proposed in four phases through PPP at Navi Mumbai with estimated cost of about ` 16,704 crore. Project cost for phase-I is about ` 7,277 crore (including pre-development cost ` 3,144 crore ). It is expected to be commissioned by 2019 with an initial capacity of ten million passengers per annum.
9.49 Five airports viz. Nanded, Latur, Osmanabad, Yavatmal and Baramati were awarded to Reliance Airports Developers Private Limited by MIDC to develop, upgrade, operate, manage and maintain for 95 years of lease in November, 2009. Only non-scheduled /charter flights operate from these airports and passengers handled by these airports during 2014-15 were 2,674.
Communications 9.50 Posts, telephones, voice-video and data telecommunication are major components of the communication system. The operational statistics of postal services is given in Table 9.30. 9.51 The total number of landline connections at the end of September, 2015 in the State was 51.11 lakh. The landline and cell phone connections per lakh population were 4,308 & 92,766 respectively. Data of landline and cell phone connections is given in Table 9.31.
9.52 The internet subscriber base in the State as on 30th September, 2015 was 4.30 crore which is highest among all States.
* * * * *
Table 9.30 Operational statistics of postal services
(no.) Item Area 2013-14 2014-15
Post offices Rural 11,355 11,362 Urban 1,243 1,239 Total 12,598 12,601
Letter boxes Rural 40,199 35,570 Urban 8,629 8,087 Total 48,828 43,657
Delivery postmen (including Gramin Dak Sevak in Rural)
Rural 19,034 21,134 Urban 6,474 6,161 Total 25,508 27,295
Source : General Post Office, Mumbai
Table 9.31 Landline and cell phone connections ( lakh)
Operator 2013-14 2014-15 2015-16+ Landlines Cell phones Landlines Cell phones Landlines Cell phones
MTNL 19.40 10.65 19.42 11.74 19.17 12.54 BSNL 18.82 65.83 16.82 51.07 16.10 51.41 Bharati 4.26 151.27 4.09 167.46 4.16 175.11 Idea/Spice -- 223.26 -- 257.96 -- 266.88 Reliance 3.33 131.66 3.19 109.04 3.25 103.56 Tata 7.80 97.98 8.06 103.13 8.16 97.91 Vodafone 0.13 230.41 0.22 258.68 0.27 264.65 Aircel-Dishnet -- 34.63 -- 43.29 -- 51.33 Telewings/Telenor -- 60.13 -- 73.50 -- 77.28 Loop -- 28.96 -- -- -- -- Total 53.74 1,034.78 51.80 1,075.87 51.11 1,100.59
Source : Telecom Regulatory Authority of India + upto September

Economic Survey of Maharashtra 2015-16
147ANNEXURE 9.1
ELECTRICITY SUPPLY & CONSUMPTION IN THE STATE
Item 1960-61 1970-71 1980-81 1990-91 2000-01 2010-11 2014-15
(1) (2) (3) (4) (5) (6) (7) (8) A. Installed capacity (MW)
A - 1 Installed Capacity in the State
(1) Thermal 477$ 1,065$ 2,771 6,462 8,075 9,665 18,436 (2) Renewable Energy -- -- -- -- -- 3,408 6,707 (3) Hydro 282 844 1,317 1,552 2,874 3,066 3,066 (4) Natural Gas -- -- -- 672 1,820 2,714 3,072 Total (A-1) 759 1,909 4,088 8,686 12,769 18,853 31,281
A - 2 State’s share in Installed Capacity of -
(1) National Thermal Power Corp. N.A. N.A. N.A. N.A. 2,048@ 4,686 5,937 (2) Nuclear Power Corporation N.A. N.A. N.A. N.A. 137 690 690 Total (A-2) N.A. N.A. N.A. N.A. 2,185 5,376 6,627 Total (A-1 + A-2) 759 1,909 4,088 8,686 14,954 24,229 37,908 B. Generation (MU) - (1) Thermal 1,903$ 3,392 11,416 28,085 49,377 52,796 84,882 (2) Natural Gas -- -- -- 2,730 6,943 18,729 4,626 (3) Hydro 1,365 4,533 6,448 5,615 4,889 6,374 5,856 (4) Renewable Energy # -- -- -- -- -- 5,118 8,415 Total 3,268 7,925 17,864 36,430 61,209# 83,017 1,03,779 C. Consumption (MU) - (1) Industrial 1,853 5,312 8,130 14,706 18,363 34,416 41,522 (2) Domestic 260 732 1,779 5,065 11,172 19,546 25,428 (3) Agriculture 15 356 1,723 6,604 9,940 16,257 26,407 (4) Commercial 198 547 949 2,068 4,105 11,527 12,504 (5) Railways 339 421 766 970 1,581 2,188 2,443 (6) Public Water works 35 146 330 NA 1,199 1,983 2,600 (7) Public lighting 20 74 159 291 551 846 1,583 (8) Miscellaneous -- 62 198 267 378 633 368 Total 2,720 7,650 14,034 29,971 47,289 87,396 1,12,855 D. Per capita ultimate consumption
of electricity (Units) (1) Industrial 46.8 105.4 129.5 195.4 191.2 307.2 354.1 (2) Commercial 5.0 10.9 15.1 27.5 42.7 102.9 106.6
Source - (1) CEA - Central Electricity Authority, GoI, New Delhi. (2) MAHAGENCO (3) MAHADISCOM
(4) BEST (5) TATA Power
(6) Reliance Infrastructure Note - (1) The above figures are related to public utilities only. (2) @ This includes additional share of 323 MW from NTPC/ NPC which was unallocated share and surplus from Goa. (3) # This includes captive power and Renewable Energy (sold to MAHADISCOM) . (4) $ The figures for Oil is included in Thermal (5) Installed capacity & Generation for private companies other than Tata Power & Reliance Infrastructure are taken from CEA
website reports. (6) 1 Unit = 1 Kilo Watt Hour.
N.A. - Not available.

Economic Survey of Maharashtra 2015-16
148ANNEXURE 9.2
ROAD LENGTH BY TYPE OF ROADS IN MAHARASHTRA STATE
(MAINTAINED BY PUBLIC WORKS DEPARTMENT AND ZILLA PARISHADS)
(km)
Serial No. Year National
highways Major State highways
State highways
Major district roads
Other district roads
Village roads
All roads
(1) (2) (3) (4) (5) (6) (7) (8) (9)
1 1965-66 2,364 -- 10,528 12,628 8,744 17,524 51,788
2 1970-71 2,445 -- 14,203 17,684 11,012 20,020 65,364
3 1980-81 2,945 -- 18,949 25,233 25,404 68,600 1,41,131
4 1990-91 2,959 -- 30,975 38,936 38,573 61,522 1,72,965
5 2000-01 3,688 -- 33,212 46,751 43,696 89,599 2,16,946
6 2005-06 4,367 -- 33,571 48,987 45,226 99,279 2,31,430
7 2006-07 4,367 -- 33,675 49,147 45,674 1,00,801 2,33,664
8 2007-08 4,367 -- 33,800 49,393 45,886 1,02,149 2,35,595
9 2008-09 4,367 -- 33,933 49,621 46,143 1,03,604 2,37,668
10 2009-10 4,376 -- 34,102 49,901 46,817 1,04,844 2,40,040
11 2010-11 4,376 -- 34,103 49,936 46,897 1,06,400 2,41,712
12 2011-12 4,376 -- 34,157 50,256 47,529 1,06,601 2,42,919
13 2012-13 4,376 6,694 27,528 50,256 47,573 1,06,745 2,43,172
14 2013-14 5,858 6,337 33,963 50,232 52,761 1,14,557 2,63,708
15 2014-15 4,766 6,163 33,860 50,585 58,115 1,45,879 2,99,368
Source - Public Works Department, GoM, Mumbai.
Note - (1) The classification of road length upto 1987 was according to "Road Development Plan (RDP), 1961-81” and 1987-88 onwards it is according to "RDP 1981-2001."
(2) State highways includes major State highways for 1965-66 to 2011-12.
(3) The classification of road length from 2012-13 is according to “RDP 2001-21”.

Economic Survey of Maharashtra 2015-16
149
ANNEXURE 9.3
CLASSIFICATION OF DISTRICT-WISE ROAD LENGTH ACCORDING TO BREADTH
(MAINTAINED BY PWD AND ZP)
(km)
Sr. No.
District Achievement in Length 2013-14 Achievement in Length 2014-15 Breadth (mt.) 7.0 5.5 3.75 Other Total 7.0 5.5 3.75 Other Total
(1) (2) (3) (4) (5) (6) (7) (8) (9) (10) (11) (12)
1 Brihan Mumbai 49 0 0 0 49 49 0 0 0 49 2 Thane 582 775 2,069 4,164 7,590 583 774 4,140 4,160 9,656 3 Raigad 781 480 1,787 2,377 5,425 782 481 2,614 2,360 6,237 4 Ratnagiri 415 997 6,943 0 8,355 449 872 8,053 0 9,374 5 Sindhudurg 132 752 4,722 0 5,606 120 713 7,070 0 7,903 Konkan 1,959 3,004 15,521 6,541 27,025 1,982 2,840 21,877 6,520 33,219
6 Pune 868 1,139 14,231 225 16,463 785 1,227 16,614 61 18,688 7 Satara 363 848 7,886 1,850 10,947 371 969 8,838 2,170 12,348 8 Sangli 408 934 6,001 2,902 10,245 407 1,045 6,449 4,247 12,147 9 Kolhapur 450 900 3,753 2,655 7,758 448 859 3,759 3,501 8,566 10 Solapur 1,399 1,048 9,467 1,908 13,822 1210 1,077 11,858 2,928 17,073
Western Maharashtra 3,488 4,869 41,338 9,540 59,235 3,221 5,177 47,518 12,906 68,822 11 Ahmednagar 1,151 1,047 9,276 3,525 14,999 1,050 1,309 10,980 7,304 20,662 12 Nashik 1,076 1,149 8,079 3,658 13,962 1,003 1,488 11,707 4,825 19,024 13 Dhule 371 577 4,009 1,224 6,181 390 537 4,488 156 6,658 14 Nandurbar 108 431 3,795 1,460 5,794 121 404 4,756 1,815 7,096 15 Jalgaon 574 1,140 4,311 5,238 11,263 589 1,274 4,342 6,523 12,727
North Maharashtra 3,280 4,344 29,470 15,105 52,199 3,154 5,012 36,274 20,624 66,166 16 Aurangabad 534 562 6,155 1,363 8,614 543 634 6,922 2,015 10,114 17 Jalna 286 424 4,574 1,469 6,753 286 424 4,937 1,754 7,401 18 Parbhani 181 507 3,295 929 4,912 181 513 3,789 929 5,412 19 Hingoli 220 190 3,005 17 3,432 139 191 3,505 17 3,852 20 Nanded 689 719 7,815 1,351 10,574 439 733 8,306 1,846 11,324 21 Beed 767 598 7,030 3,467 11,862 748 598 7,519 3,497 12,362 22 Osmanabad 427 773 3,847 1,478 6,525 389 789 4,831 1,488 7,497 23 Latur 524 748 4,216 1,170 6,658 401 837 4,632 1,665 7,535
Marathwada 3,628 4,521 39,937 11,244 59,330 3,126 4,719 44,441 13,211 65,497 24 Buldhana 347 802 2,644 1,563 5,356 347 826 2,635 1,585 5,393 25 Akola 336 491 1,542 961 3,330 284 503 1,533 968 3,288 26 Washim 329 447 1,134 1,110 3,020 282 450 1,119 1,119 2,970 27 Amravati 527 922 1,893 4,841 8,183 555 965 1,793 4,909 8,222 28 Yawatmal 771 884 6,407 506 8,568 643 920 4,327 2,523 8,413
Amravati 2,310 3,546 13,620 8,981 28,457 2,111 3,664 11,407 11,104 28,286 29 Wardha 319 439 1,224 2,194 4,176 282 421 1,231 2,291 4,225 30 Nagpur 831 642 6,899 548 8,920 775 652 3,099 4,122 8,647 31 Bhandara 98 343 4,535 309 5,285 98 347 3,821 962 5,228 32 Gondia 109 389 4,415 617 5,530 113 431 2,326 2,683 5,552 33 Chandrapur 392 1,442 2,345 3,605 7,784 362 1,484 2,345 3,600 7,792 34 Gadchiroli 409 529 2,136 2,693 5,767 403 631 2,048 2,853 5,935
Nagpur 2,158 3,784 21,554 9,966 37,462 2,033 3,967 14,869 16,510 37,378 Maharashtra State 16,823 24,068 1,61,440 61,377 2,63,708 15,628 25,379 1,76,386 80,875 2,99,368
Source - Public Works Department, GoM, Mumbai.

Economic Survey of Maharashtra 2015-16
150
ANNEXURE 9.4
CATEGORYWISE NUMBER OF MOTOR VEHICLES ON ROAD IN MAHARASHTRA STATE (As on 1st January) Sr. No. Class of vehicles 1971 1981 1991 2001 2011 2015 2016*
(1) (2) (3) (4) (5) (6) (7) (8) (9)
1 Motor-cycles, scooters & mopeds 83,930 3,46,826 16,96,157 44,09,906 1,20,60,990 1,81,51,386 1,97,05,511
2 Motor cars, Jeeps & Station wagons
1,22,508 2,24,752 4,23,505 9,01,278 23,82,789 35,46,653 38,36,294
3 Taxi cabs 17,806 31,302 43,168 86,438 1,82,676 2,03,180 2,17,062
4 Auto rickshaws 3,049 29,474 1,26,049 4,07,660 6,44,037 7,19,341 7,24,080
5 Stage carriages 10,250 13,789 18,203 27,286 34,061 37,630 38,219
6 Contract carriages -- 1,498 3,980 13,975 31,459 39,662 43,782
7 Lorries—
(i) Diesel engined 34,987 87,079 1,80,883 3,41,344 8,78,239 12,96,116 13,75,538
(ii) Petrol engined 21,791 18,005 13,774 57,317 77,189 36,969 39,036
(iii) Others (CNG, LPG, etc.) -- -- -- N.A. N.A. 5,094 5,417
8 Ambulances 441 925 2,233 4,025 9,600 13,625 14,295
9 School buses 491 594 1,025 1,714 6,117 27,046 22,402
10 Private service vehicles 810 2,171 4,622 5,815 9,421 11,163 11,640
11 Trailers 7,075 23,173 60,858 1,67,856 2,84,696 3,70,452 3,82,591
12 Tractors 7,821 24,079 61,088 1,72,578 3,58,556 5,57,622 5,99,099
13 Others 810 1,319 5,040 9,872 29,829 43,610 49,487
Total 3,11,769 8,04,986 26,40,585 66,07,064 1,69,89,659 2,50,59,549 2,70,64,453
Motor vehicles per lakh of population
618 1,309 3,353 7,186 15,119 21,374 23,009
Number of vehicles per km. road length
5 6 15 31 71 95 90
Ambulances per lakh of Population
0.9 1.5 2.8 4.4 8.5 11.6 12.0
Source - Transport Commissioner, GoM, Mumbai N.A. Not Available * Provisional

10Social Sector

Economic Survey of Maharashtra 2015-16
10. SOCIAL SECTOR
10.1 Social Sector is an important sector for economic development and includes those components which contribute to human resource development. The main contributors to human development are education, health & medical care, water supply & sanitation, employment, etc. For sustainable development, the focus of our planning is to help weaker sections, the disadvantaged, the disabled and the discriminated sections of the society.
EDUCATION 10.2 Education opens up opportunities leading to both individual and group entitlements. It is the most crucial input for empowering people with skills & knowledge and giving them access to productive employment which ultimately helps to boost economic growth of the State. Equitable and inclusive quality education is the ‘Sustainable Development Goal’ for education. According to the Census 2011, the State ranks 12th in the country with literacy rate 82.3 per cent which is well above the national average (73 per cent).
School Education
10.3 Universalisation of Elementary Education (UEE) requires schooling facilities within a reasonable reach of all children. Educational institutions & enrolment therein are given in Table 10.1.
Sarva Shiksha Abhiyan 10.4 Sarva Shiksha Abhiyan (SSA) is a flagship programme of GoI being implemented in collaboration with states for achievement of UEE in a time bound manner. The programme seeks to open new schools in those habitations which do not have schooling facilities and strengthening existing school infrastructure by providing additional class rooms, toilets, drinking water, etc. The expenditure incurred on SSA during 2014-15 was ` 1,067.61 crore while during 2015-16 upto January, it was ` 731.31 crore. Some important indicators of elementary education are given in Table 10.2.
Table 10.1 Educational institutions and enrolment therein (Enrolment and teachers in ’000)
Educational Level
2014-15 2015-16*
No. of schools
Enrolment No. of
teachers
PTR
No. of schools
Enrolment No. of
teachers PTR
Total of
which girls
Total of
which girls
Primary (I to VIII) 1,04,551 16,172 7,576 506 31.9 1,05,489 16,017 7,509 515 31.1
Secondary & higher
secondary (IX to XII) 24,497 6,181 2,827 219 28.2 25,013 6,414 2,920 221 29.1
Source : Maharashtra Prathamik Shikshan Parishad, Mumbai * Provisional PTR : Pupil Teacher Ratio

Economic Survey of Maharashtra 2015-16
152
10.5 ‘Inclusive Education of Disabled’ programme is being implemented in the State to ensure quality education to Children With Special Needs (CWSN) in normal set up with normal peer group for their emotional progress and to integrate them socially. This programme includes identification and medical assessment of CWSN, providing rehabilitation and educational support services like Braille books, spectacles, hearing aids & appliances, speech trainer, etc. During 2014-15, in all 2.95 lakh children were benefited and an expenditure of ` 61.40 crore was incurred as against 3.08 lakh children with an expenditure of ` 58.57 crore for 2013-14. Girls’ Education 10.6 To promote girls education, various schemes are being implemented. Performance of some of them is given in Table 10.3.
Source : Directorate of Primary Education, GoM and Maharashtra Prathamik Shikshan Parishad, Mumbai
Schemes to encourage education 10.7 To encourage the participation of children in education and to ease the financial burden of parents, the GoM is providing concessions through various schemes to the students. The schemewise number of beneficiaries and expenditure incurred is given in Table 10.4.
Table 10.2 Some important indicators of elementary education (as on 30th September)
Indicator 2012-13 2013-14* 2014-15* No. of classrooms constructed 10,005 6,817 5,307 No. of computer application laboratories established 743 129 0
No. of students received free text books (in lakh) 133.49 128.42 123.86 No. of teachers trained (in lakh) 3.7 3.6 2.4 Density of schools/sections per 10 sq. km (a) Primary 2.69 2.71 2.74
(b) Upper primary 1.47 1.40 1.42 Primary schools / sections per thousand child population (6 to 11 yr) 8 8 8 Upper primary schools / sections per thousand child population (11 to 14 yr)
7 7 7
Average Student - Class room Ratio (all schools) 33 32 31 Percentage of schools having facilities
Drinking water 98.4 99.3 99.6 Boundary wall 68.3 76.4 82.7 Functional girl’s toilet 77.0 97.3 98.6 Computers 47.4 50.6 54.3 Ramp@ 86.7 89.2 91.9 Electricity connection 85.0 86.0 93.8
Percentage share of private to total schools 26.3 29.3 30.0 Source : Maharashtra Prathamik Shikshan Parishad, Mumbai and Elementary Education in India Progress towards UEE Flash Statistics report @ School requiring and having ramp. * Provisional
Table 10.3 Beneficiaries and expenditure incurred on various schemes for girls education
Scheme 2013-14 2014-15
Beneficiaries (lakh)
Expenditure (` crore)
Beneficiaries (lakh)
Expenditure (` crore)
Attendance Allowance Scheme
4.91 10.81 3.89 8.55
Ahilyabai Holkar Scheme 19.50 57.85 16.09 57.60 Free education to girls studying in XI & XII
3.70 2.07 2.87 2.02
Kasturba Gandhi Balika Vidyalaya
0.04 16.42 0.04 19.23

Economic Survey of Maharashtra 2015-16
153
Annual Status of Education Report (ASER)-2015 for the State In 2015, survey was conducted by Pratham in 984 villages of 33 districts in the State to assess children schooling status and basic learning levels in reading and arithmetic. Total 19,772 households were surveyed and information was collected from 26,833 children of age-group 3 to 16 years. Following are the important observations of the survey.
• Percentage of children in the age-group 6 to 14 years enrolled in school in rural areas was 98.7 per cent. • Percentage of children enrolled in private schools remains the same for Std I to V (23.1 percent) in 2014
& 2015 wheras for Std VI to VIII it reduced to 50.3 per cent in 2015 from 55.2 per cent in 2014. The basic learning levels of children is shown below
Indicator 2014 2015 Reading Ability
Percentage of children in Std III who can read at least Std I level text 54.1 63.3 Percentage of children in Std V who can read at least Std II level text 53.5 61.8
Arithmetic Percentage of children in Std III who can do at least subtraction 18.7 23.6 Percentage of children in Std V who can do at least division 18.9 24.4
Mid Day Meal Scheme 10.8 With a view of enhancing enrollment, attendance & retention and simultaneously improving nutritional levels among children studying in primary schools, the GoI launched the ‘Mid Day Meal Scheme’, in which cooked meal with nutritional contents of 450 calories and 12 gm proteins is provided to the children studying in class I to V. During 2014-15, number of students benefited were 65 lakh and an expenditure incurred was ` 920 crore as against 69 lakh students with an expenditure ` 735 crore in 2013-14. In year 2008-09, the scheme was extended to the students of VI to VIII in which cooked meal with nutritional contents of 700 calories and 20 gm proteins is provided. During 2014-15, number of students benefited was 39 lakh and an expenditure incurred was ` 451 crore as against 40 lakh students with an expenditure of ` 416 crore in 2013-14.
Maharashtra Cadet Corps 10.9 The main objective of this scheme is to inculcate qualities like leadership, brotherhood, sportsmanship, national unity, social service, etc. amongst the students. The scheme is being implemented on optional basis for students of standard VIII and IX. During 2014-15, about 19.01 lakh students participated in this scheme and an expenditure incurred was ` four crore as against 19.02 lakh students with an expenditure of ` five crore for 2013-14.
Table 10.4 Beneficiaries and expenditure incurred on the schemes to encourage education
Scheme 2013-14 2014-15
Beneficiaries (lakh)
Expenditure (` crore)
Beneficiaries (lakh)
Expenditure (` crore)
Providing free uniform and writing material to poor children of standard I to IV
18.39 13.0 18.70 14.5
Fee concession to students of standard I to X studying in government aided and unaided schools
25.36 3.7 30.54 4.4
Free education to the students belonging to economically weaker section (XI & XII)
2.00 1.4 1.88 1.4
Exam fee exemption/reimbursement to EBC students of X & XII from drought prone area
2.04 9.1 5.63 17.8
Stipend to tribal students 0.04 0.2 0.03 0. 1
Source : Directorate of Primary Education, GoM

Economic Survey of Maharashtra 2015-16
154
Sainiki Schools 10.10 There are 42 Sainiki schools at primary, secondary and higher secondary levels in 33 districts of the State, of which, five schools are exclusively for girls, 33 schools are exclusively for boys and four are for co-education. During 2015-16, total enrolment in these schools is 15,345. Sports Education 10.11 The State Government has established ‘Shiv Chhatrapati Kridapeeth’ at Pune with the motive of promoting sports and develop excellence by upgrading the skills of sports persons. This Kridapeeth conducts sports skill tests for the students of age group 8 to 14 years and imparts specific training for about 8 to 10 years to selected students for 17 different games. There are 11 sports academies under the Kridapeeth. The State spends on an average ` 9,000 per trainee per month. For 2015-16, in all 593 trainees were selected. The achievements of students of sports academies are given in Table 10.5.
Table 10.5 Achievements of students of sports academies
Year No. of trainees
International level medals National level medals State level medals
Gold Silver Bronze Total Gold Silver Bronze Total Gold Silver Bronze Total 2012-13 772 2 7 7 16 126 80 46 252 152 124 69 345 2013-14 665 2 2 4 8 44 49 33 126 143 128 85 356 2014-15 563 2 2 3 7 66 63 46 175 148 116 116 380 Source : Directorate of Sports and Youth Services, GoM
Education Development Index 10.12 The National University of Educational Planning & Administration (NUEPA) and the Ministry of Human Resource & Development (Department of School Education and Literacy) compute Education Development Index (EDI) for primary & upper primary levels of education and also a composite index for the entire elementary education which is exclusively based on the ‘District Information System for Education (DISE)’. EDI is computed by considering various dimensions of elementary education including State specific indicators. In all 24 indicators are regrouped into four subgroups viz. access, infrastructure, teachers and outcome for computing EDI. According to ‘Elementary Education in India and Progress towards Universal Elementary Education Report (Flash Statistics 2013-14)’, the State ranks 13th at primary, 16th at upper primary & 13th at composite levels with EDI 0.63, 0.67 and 0.65 respectively. Statewise sub-group index and composite EDI for the year 2013-14 are given in Annexure 10.1.
Higher & Technical Education 10.13 Higher education covers education in agriculture, veterinary, medical, pharmaceutical, engineering, technical and vocational trades, etc. alongwith general higher education. Apart from universalising elementary education, the Government is taking efforts to expand opportunities in higher education also. There are 21 universities in the State of which four are agriculture universities, one university for health science course, one university for veterinary science, one for technology and 14 other general universities (including Shreemati Nathibai Damodar Thackersey University, Mumbai which is exclusively for women, Yashwantrao Chavan Open University, Nashik for non-formal education and Kavi Kulguru Kalidas University, Nagpur for conduct of studies, research, development and spread of Sanskrit language). In addition to these, there are 21 deemed universities in the State. Details of streamwise institutions, their intake capacity and number of students admitted in first year of the course for the year 2015-16 are given in Annexure 10.2, 10.3, 10.4 & 10.5.

Economic Survey of Maharashtra 2015-16
155
Graph 10.1 : Selected health indicators
32.2
16.512.36.2
105
24
4.6
1.8
0
20
40
60
80
100
120
1971 1981 1991 2001 2011 2013
Oth
ernd
icat
ors
0
1
2
3
4
5
Year
TFR
CBR CDRIMR TFR
i
PUBLIC HEALTH 10.14 The State has health infrastructure and trained health personnel in public, private and voluntary sectors which provide basic as well as advanced health services. Public health services aims at providing reliable, accountable, adequate, qualitative, preventive and curative health care to the people of the State with focus on improving maternal and child health. 10.15 The GoM has created three-tier health infrastructure to provide comprehensive health services to the people especially in rural areas. The primary tier comprises of Sub-Centres, Primary Health Centres (PHC) and Community Health Centres (CHC). The sub-district hospitals spread across rural & semi-urban areas and district based hospitals constitute secondary tier. Whereas, medical colleges with well equipped super-speciality hospitals provide both basic and advanced treatments in all fields of medicine and surgery at tertiary level located in major cities. The details of public health infrastructure in the State are given in Table 10.6 whereas, the detailed series of medical facilities available (public and government aided) are given in Annexure 10.6. The series of selected health indicators is given in Annexure 10.7. 10.15.1 In addition, medical services are also provided by medical hospitals affiliated to medical colleges under Directorate of Medical Education and Research (DMER). There are 29 hospitals attached to 15 medical colleges with 13,512 beds. A total of 2,150 students are being enrolled for MBBS in government medical colleges in the State every year while 837 students are being enrolled for post-graduate courses every year. 10.16 The State has been leading in health care manpower and providing trained doctors to meet its health care needs. The State has the largest number of medical colleges both in allopathy and Indian system of medicine. Based on the data of Registered Medical Practitioners (RMP) in the State for Allopathy, Ayurveda, Unani, and Homeopathy estimated doctor population ratio was 1:600 in 2011 and same was 1:536 in 2014. Table 10.7 gives the doctor population ratio for allopathy RMPs in the State.
National Health Mission 10.17 The National Health Mission (NHM) was launched in 2013 to enable universal access to affordable, accountable and quality health care services. The NHM subsumes the National Rural Health
Table 10.6 Public health infrastructure in the State
(December, 2015)
Type of health institution No.
Sub-Centres 10,580
Mobile medical units 13
Primary health centres 1,811
Rural hospitals (30 beds) 360
Sub district hospitals with capacity of
a) 50 beds 58
b) 100 beds 28
General hospitals 4
Orthopedic hospitals 1
District hospitals 23
Super speciality hospitals 2
Mental health institutes 4
Women hospitals 11
TB hospitals 4
Leprosy Hospitals 4
Health and family welfare training institutions 8
Source : Directorate of Health Services, GoM

Economic Survey of Maharashtra 2015-16
156
Mission (NRHM) and National Urban Health Mission (NUHM). The NUHM covers slum dwellers and other marginalised groups of all cities / towns with a population above 50,000. GoI has approved project implementation plan of ` 283.09 crore (for Mumbai city ` 51.69 crore and for rest of Maharashtra ` 231.40 crore) for the State for 2015-16. The total outlay under NHM for 2015-16 is ` 2,278.38 crore.
Maharashtra Emergency Medical Services 10.17.1 Maharashtra Emergency Medical Services (MEMS) under NHM provide pre-hospital health services to patients through life support ambulances while transporting them to nearby hospitals for further treatment. There are 233 ambulances with advanced life support system and 704 equipped with basic life support system. Number of cases served in 2015-16 upto December was 3.25 lakh as against 2.60 lakh in 2014-15.
Reproductive and Child Health Programme – II 10.17.2 Under the umbrella of NHM, Reproductive and Child Health Programme (RCH) - II is being implemented to enhance child health status and population stabilisation thereby reducing Maternal Mortality Rate (MMR), Infant Mortality Rate (IMR) and Total Fertility Rate (TFR). Expenditure incurred under RCH-II is given in Table 10.8.
Family Welfare Programme 10.17.3 The main objective of the Family Welfare Programme (FWP) is to stabilise population. Sterilisation and spacing between the births of two children are important aspects of the programme. More emphasis is given on propagation of spacing methods like Copper-T (IUD), conventional contraceptives, etc. Details of family welfare sterilisation programme are shown in Table 10.9.
Table 10.7 The doctor population ratio
Year Number of allopathy RMPs
Estimated doctor population ratio$
2011 63,731 1:1775 2012 67,636 1:1693 2013 73,847 1:1569 2014 79,399 1:1477 2015 83,668 1:1418
$ estimation based on population projected by CSO, GoI Source : Directorate of Medical Education and Research, GoM
Table 10.8 Expenditure incurred under RCH-II (` crore)
Year Outlay Expenditure Percentage of expenditure to
outlay 2011-12 400.22 341.35 85.3 2012-13 453.37 368.00 81.2 2013-14 632.77 474.02 75.0 2014-15 655.86 471.37 71.9 2015-16 620.75 273.52+ 44.0+
Source : State Family Welfare Bureau, GoM + upto December
Table 10.9 Details of family welfare sterilisation programme (In ’000)
Year Sterilisation Intra-uterine device Expenditure (` crore) Target Achievement Target Achievement
Vasectomy Tubectomy Total 2011-12
550 20.3 474.3 494.6 (89.9)
450 366.8 (81.5)
32.67
2012-13
550 18.9 486.2 505.1 (91.8)
450 376.9 (83.8)
37.00
2013-14
560 17.3 486.9 504.2 (90.0)
450 411.9 (91.5)
33.03
2014-15
565 13.9 458.6 472.5 (83.6)
450 391.5 (87.0)
29.17
2015-16+ 565 11.0 318.8 329.8 (58.4)
460 292.6 (63.6)
18.01
Source : State Family Welfare Bureau, GoM Note : Figures in brackets indicate percentages of the achievement to target + upto December

Economic Survey of Maharashtra 2015-16
157
Navsanjivani Yojana 10.17.4 With an objective to reduce maternal & infant mortality in tribal areas of 16 districts of the State Navsanjivani Yojana (NSY) is being implemented covering 8,419 villages through 173 Mobile Squads. Under NSY various schemes are being implemented.
10.17.4.1 Under Matrutva Anudan Yojana (MAY) a tribal pregnant woman is paid ` 400 in cash for visiting health centre for antenatal check-up and medicines worth ` 400 are provided for better health. Number of beneficiary mothers and expenditure incurred under MAY are given in Table 10.10
Janani Suraksha Yojana
10.17.5 Janani Suraksha Yojana (JSY) a 100 per cent centrally sponsored scheme, aims to promote institutional deliveries in rural & urban areas to reduce infant and maternal mortality in BPL, SC and ST families. Under the scheme, an amount of ` 600 per beneficiary in urban areas and ` 700 per beneficiary in rural areas is given within seven days of institutional delivery, while for delivery at home by skilled birth attendant, ` 500 is given to beneficiary belonging to BPL family only. For the delivery by caesarean section upto ` 1,500 is given to the beneficiary as reimbursement of the expenditure. Number of beneficiaries and expenditure incurred under JSY is given in Table 10.11.
Universal Immunisation Programme 10.17.6 Universal Immunization Programme (UIP) is being implemented with the aim to provide high quality immunisation services to pregnant women, infants and children in various age groups in order to prevent mortality, morbidity and disability from vaccine preventable diseases such as tuberculosis, diphtheria, whooping cough, tetanus, polio, Hepatitis B, measles, etc. Number of beneficiaries and expenditure incurred are given in Table 10.12.
Table 10.10 Number of beneficiary mothers and expenditure incurred under MAY
(₹ crore) Year Outlay Expenditure
incurred Beneficiary
mothers 2011-12 8.27 7.77 81,496 2012-13 9.51 5.38 66,300 2013-14 5.34 4.45 71,773 2014-15 5.63 3.06 61,352 2015-16 3.56 0.54+ 11,233+
Source : State Family Welfare Bureau, GoM + upto December
Table 10.11 Number of beneficiaries and expenditure incurred under JSY
( ` crore) Year Outlay Expenditure Number of
beneficiaries (lakh)
2011-12 34.94 35.28 4.05 2012-13 30.23 34.41 3.64 2013-14 44.82 44.55 4.03 2014-15 52.64 46.53 3.48 2015-16 49.82 27.96+ 2.47+
Source : State Family Welfare Bureau, GoM + upto December
Table 10.12 Number of beneficiaries and expenditure incurred under UIP
(fig. in lakh) Vaccine 2014-15 2015-16+
Target Achievement Target Achievement BCG 19.73 19.34 20.87 15.04 DPT III 19.73 19.21 20.87 14.00 OPV III 19.73 19.15 20.87 14.00 Hepatitis B III 19.73 19.13 20.87 13.92 Measles 19.73 18.82 20.87 14.27 DPT (booster) 19.32 18.16 20.46 13.63 OPV (booster) 19.32 18.05 20.46 13.62 DT (5 years) 19.32 16.64 20.46 13.15 TT (10 years) 21.15 18.61 21.32 14.31 TT (16 years) 21.86 19.03 22.03 14.93
TT (Pregnant women)
21.71 17.10 22.96 12.54
Expenditure (` crore)
31.82 20.22
Source : State Family Welfare Bureau, GoM + upto December

Economic Survey of Maharashtra 2015-16
158
Pulse Polio Programme 10.17.7 Children below five years of age irrespective of earlier receipt of number of doses of Oral Polio Vaccine are immunised on specific day, all over the nation, which effectively prevents infection. The State has made good progress in controlling the spread of polio virus as no polio case was reported after 2010-11. On 27th March, 2014 India was declared as polio free nation. Performance of pulse polio programme is given in Table 10.13.
Rashtriya Baal Swasthya Karyakram 10.17.8 Rashtriya Baal Swasthya Karyakram (RBSK) is being implemented to protect and promote child health with a systematic approach of screening and early intervention, if required. Performance of RBSK is given in Table 10.14.
National Vector Borne Disease Control Programme
10.18 National Vector Borne Disease Control Programme (NVBDCP) is being implemented in the State for prevention, diagnosis, treatment and control of vector borne diseases like Malaria, Lymphatic Filariasis, Dengue, Japanese Encephalitis, Chikungunya, Chandipura, etc. Information of NVBDCP is given in Table 10.15.
Other Programmes 10.19 Many other health programmes are being implemented in the State. Performance of some programmes is as follows:
Table 10.13 Performance of pulse polio programme
Year No. of children
covered ( lakh)
Expenditure incurred (`crore)
2011-12 119.98 15.60 2012-13 120.83 34.43 2013-14 121.23 34.67 2014-15 123.26 10.92 2015-16+ 77.97 2.07
Source : State Family Welfare Bureau, GoM + upto December
Table 10.14 Performance of RBSK (Number)
Year Schools/
anganwadis covered
Students (in lakh) Major operations
carried
No. of Heart operations Examined Treated Referred
2014-15
84,066 122.36 15.09 0.79
8,133 1,419 1,02,096# 63.34 6.48 0.85
1,01,835## 63.34 5.98 0.64
2015-16+
84,424 101.73 11.11 0.74
8,686 848 1,04,479# 63.75 6.10 0.41
1,02,595## 27.15 2.56 0.22 Source : State Family Welfare Bureau, GoM $ SHP + upto December # anganwadi phase I, ## anganwadi phase II
Table 10.15 Information of NVBDCP
Disease 2014-15 2015-16+
Cases Deaths reported
Cases Deaths reported
Malaria 55,598 66 48,013 29 Lymphatic Filariasis 3,303 0 1,811 0 Dengue 8,524 139 4,807 24 Japanese Encephalitis 1 0 7 0 Chikungunya 224 0 171 0 AES/Chandipura 5 2 1 1 Expenditure (` crore)
31.74 22.35
AES : Acute Encephalitis Syndrome + upto December Source : Directorate of Health Services, GoM

Economic Survey of Maharashtra 2015-16
159
Revised National TB Control Programme: During 2015, suspected TB patients per lakh population were 214 and cure rate was 82 per cent, while during 2014, suspected TB patients per lakh population were 209 and cure rate was 83 per cent.
National Programme for Control of Blindness: During 2015-16, against the target of 7.50 lakh cataract surgeries, 71 per cent target was achieved upto December, while during 2014-15, against the same target, achievement exceeded the target (108 per cent).
National Leprosy Eradication Programme: During 2015-16 till December, number of new and active leprosy cases are 11,877 and 11,019 respectively. Corresponding figures during 2014-15 were 16,415 and 11,379 respectively.
Rajiv Gandhi Jeevandayi Arogya Yojana 10.20 Rajiv Gandhi Jeevandayi Arogya Yojana (RGJAY) is being implemented in collaboration with the National Insurance Company to provide cashless medical facilities for treating patients (belonging to BPL families holding yellow ration card and APL families holding orange ration card including antyodaya and annapurna ration card) with indentified diseases. The premium per year per family is paid by the GoM and the sum insured is ` 1.5 lakh per family per year. This scheme was implemented in phased manner and now covers entire State. The scheme provides 971 types of surgeries/therapies/procedures. During 2014-15 total number of surgeries and therapies covered under schemes are 2.73 lakh incurring an expenditure of ` 661.56 crore. During 2015-16 upto December 2.61 lakh surgeries and therapies have been conducted with an expenditure of ` 623.52 crore. National AIDS Control Programme 10.21 Maharashtra State AIDS Control Society is established to implement National AIDS Control Programme (NACP) effectively in the State. The focus of the NACP is on awareness campaigns and education & surveillance of specific groups of population. Surveillance is undertaken through screening of blood samples of patients from the clinics of sexually transmitted diseases and women seeking antenatal care. Details of HIV/AIDS cases are shown in Table 10.16.
State Blood Transfusion Council
10.22 The primary objective of State Blood Transfusion Council is to provide adequate & safe blood and its components, at reasonable rates. Since 2000, free blood is being provided to Sickle Cell children as well as, Thalassaemia and Hemophilia patients. The details of blood collection are given in Table 10.17.
Table 10.16 Details of HIV/AIDS cases
Item 2011 2012 2013 2014 2015+ Persons screened from risk groups (’000) 2,818 3,067 3,274 4,116 4,371 HIV positive by three tests (’000) 57 61 46 39 30 HIV positivity rate (per cent)@ 2.0 2.0 1.0 0.9 0.7 AIDS cases 10,750 19,389 10,670 20,880 15,784 Deaths due to AIDS 1,580 3,270 3,168 2,521 2,552 Source : Maharashtra State AIDS Control Society + upto December @ wrt persons screened
Table 10.17 Details of blood collection (in lakh units)
Year Blood banks (no.)
Total collection
Of which voluntarily
donated 2011 282 13.44 11.92 2012 291 14.41 13.29 2013 300 14.75 13.90 2014 313 15.62 14.92 2015 317 15.66 15.16
Source : State Blood Transfusion Council, GoM

Economic Survey of Maharashtra 2015-16
160
Epidemic Control Programme
10.23 Under this programme, outbreaks as well as sporadic cases of water borne diseases like cholera, gastro, acute diarrhoea/dysentery, infective hepatitis, typhoid, etc are monitored. To control occurrences and deaths due to these diseases, containment measures are taken. Number of attacks and deaths due to sporadic and outbreaks of these diseases are given in Table 10.18.
Transplantation of Human Organs
10.24 GoI has enacted the Transplantation of Human Organs (THO) Act, 1994 to regulate removal, storage and transplantation of human organs for therapeutic purposes and for prevention of commercial dealings in human organs. There are 111 centres registered in the State for single organ transplantation, 22 for multiple organ transplantation and 259 for eye donation, eye bank & for keratoplasty. Number of transplantations performed during 2014-15 and 2015-16 is given in Table 10.19.
Table 10.18 Number of attacks and deaths due to sporadic and outbreaks of diseases
Disease 2011-12 2012-13 2013-14 2014-15 2015-16+
Attack Deaths Attack Deaths Attack Deaths Attack Deaths Attack Deaths
Cholera 6,070 2 1,991 0 4,093 6 108 1 168 2
Gastro 1,30,548 11 1,01,855 14 2,65,448 5 54,897 6 72,089 3
Diahorrea 7,03,361 2 3,68,198 3 10,33,519 6 9,18,999 3 9,48,164 1
Inf. Hepatitis
5,529 31 9,495 42 6,323 3 5,711 4 4,801 5
Typhoid 68,735 0 51,693 0 2,01,680 0 36,160 0 36,720 0
Leptospirosis 454 29 497 14 338 20 232 20 246 22
Total 9,14,697 75 5,33,729 73 15,11,401 40 10,16,107 34 10,62,188 33
Source : Directorate of Health Services, GoM + upto December
Table 10.19 Number of transplantations
Transplantation 2014-15 2015-16+
Live Kidney 664 426
Live Liver 99 53
Cadaver organ transplantation
a) Kidney 99 40
b) Liver 47 21
Keratoplasty 2,600 2,371 + upto December Source : Directorate of Health Services, GoM

Economic Survey of Maharashtra 2015-16
161
WOMEN AND CHILD DEVELOPMENT 10.25 Women empowerment and child development are one of the indispensable agenda of the government with regard to the economic and social development of the country. Empowerment of women can be achieved only when their education, health and financial conditions are improved. Maharashtra is the first State in India to formulate Women Policy in 1994, which was revisited in 2001 and new Women Policy has been announced in 2013. Numerous initiatives are being taken to empower women, including formulation of women specific schemes. 10.26 Performance of selected women development schemes is given in Table 10.20.
10.27 Women specific centrally sponsored schemes implemented in the State are as follows:
Hostels for Working Women: The GoI has laid down the limit of annual income for admission to these hostels as ` 30,000 for metropolitan cities and ` 25,000 for other cities. There are 127 such hostels with 9,172 inmates.
Support to Training and Employment Programme (STEP): The main objectives of the programme are to mobilise women in small groups, provide training for self-employment and skill up-gradation to take up employment-cum-income generating projects. There are 16 projects functioning with total intake capacity 1,050.
Swaadhar: Under this scheme, financial assistance is provided for protection, care, education & vocational training for the rehabilitation of women in difficult situation. There are 46 projects run by voluntary organisations covering 2,500 beneficiaries.
Ujjwala: To prevent the trafficking of women for commercial sexual exploitation and to facilitate rescue, rehabilitation & re-integration of victims, 52 institutions are functioning of which, 16 institutions are residential.
Participation in decision making 10.28 The GoI has decided to provide one-third reservation for women in Local Self Institutions. However, the State Government has extended this reservation upto 50 per cent in Local Self Institutions. Reservation for women in local bodies in the State is given in Table 10.21.
Table 10.20 Performance of selected women development schemes ( ` Crore)
Schemes 2014-15 2015-16+
Outlay Expenditure Beneficiaries Outlay Expenditure+ Beneficiaries+
Government women hostels/Protective homes/ Voluntary supportive homes
12.36 12.36 1,368 13.35 8.05 2,015
Counselling centres 4.20 3.15 136 1.51 1.06 136
Shubhmangal Samuhik Vivah Yojana
2.10 1.58 1,311 0.61 0.21 176
Manodhairya 35.11 29.90 1,317 21.89 15.28 510
Source : Commissionerate of Women and Child Development, GoM. + upto December

Economic Survey of Maharashtra 2015-16
162
Mahila Aarthik Vikas Mahamandal 10.29 Mahila Aarthik Vikas Mahamandal (MAVIM) is the apex body for implementation of various development schemes promoted by the GoI and GoM for women empowerment. It acts as a liaisoning agency between concerned government departments and SHGs, financial institutions, voluntary organisations. MAVIM received funds of ` 19.35 crore in 2015-16 under the various schemes and an expenditure of ` 12.86 crore was incurred upto December. Schemes implemented by MAVIM are given Table 10.22.
10.29.1 SHG is a good medium for economic empowerment of women. The total savings of SHG’s was about ` 348.35 crore and the total internal loan disbursed was ` 967.18 crore. SHGs received loan of ` 989.45 crore from various financial institutions. Information of women SHGs is given in Table 10.23.
Table 10.21 Reservation for women in local bodies in the state ( no)
Local Bodies No No of Seats Seats reserved for Women
Municipal Corporation 26 2,624 1,318
Muncipal Council 230 5,023 2,595
Nagar Panchayat 110 1,870 990
Zilla Parishad 34 2,006 1,013
Pancayat Samiti 351 4,012 2,006
Grampanchayat 27,920 2,23,857 1,11,929
Total 28,671 2,39,392 1,19,851
Source : State Election Commission, GoM
Table 10.22 Schemes implemented by MAVIM ( ` Crore)
Schemes 2014-15 2015-16+
Outlay Expenditure Beneficiaries Outlay Expenditure+ Beneficiaries+
Tejaswini 5.60 3.36 7,01,330 8.77 6.00 10,49,754
Women Empowerment (four per cent Interest Subsidy for Loans)
2.10 2.10 53,784
0.03 0 10,725
Women Empowerment (SCP) 2.00 2.00 2,42,999
0.75 0 2,49,400
Women Empowerment (Assit.to MAVIM) 12.11 12.11 NA
9.80 6.86 NA
Grant in aid to give skilled training to women 1.75 0 0
0.00 0.00 0
Source : MAVIM, GoM. NA Not Applicable + upto December

Economic Survey of Maharashtra 2015-16
163
Child Development 10.30 The GoM is implementing various schemes for child development which are as follows: Observation Homes: There are 12 observation homes run by government in 11 districts
with intake capacity of 600 children. In addition to this , there are 48 observation homes (19 for girls and 29 for boys) run by NGOs with intake capacity of 4,275 children. Orphan, abandoned, missing, working children are admitted in these homes as per recommendations of Child Welfare Committees/Juvenile Justice Boards. The government provides grant-in-aid of ` 900 per month per inmate.
Children Homes: Children upto 18 years of age are admitted in these homes. There are 28 children homes run by government having total capacity of 2,990 children. In addition to this, there are 994 aided children homes run by NGO with total intake capacity of 82,859 and 63 un-aided children homes with intake capacity of 3,840 children. Government provides ` 1,215 per month per inmate and ` 1,305 per month for AIDS affected child, to these homes as grant-in-aid. During 2014-15, an expenditure of ` 26.60 crore was incurred on 77,774 beneficiaries under the scheme, whereas during 2015-16, upto December an expenditure of ` 17.53 crore has been incurred.
Table 10.23 Information of women SHGs ( no)
Division Sector Villages/Cities 2014-15 2015-16+ SHGs Members SHGs Members
Kokan Rural 968 6,470 76,706 6,827 81,046 Urban 2 861 10,647 940 12,940 Total 970 7,331 87,353 7,767 93,986 Pune Rural 1,039 9,409 1,27,789 10,335 1,38,965 Urban 2 452 5,761 430 5,905 Total 1,041 9,861 1,33,550 10,765 1,44,870 Nashik Rural 1,600 9,814 1,49,058 10,285 1,54,243 Urban 1 237 2,812 249 3,412 Total 1,601 10,051 1,51,870 10,534 1,57,655 Aurangabad Rural 2,510 11,655 1,89,812 12,355 1,98,122 Urban 3 732 9,513 737 10,123 Total 2,513 12,387 1,99,325 13,092 2,08,245 Amravati Rural 1,942 10,480 1,33,124 11,196 1,40,815 Urban 1 200 2,419 213 2,758 Total 1,943 10,680 1,35,543 11,409 1,43,573 Nagpur Rural 2,436 14,216 2,09,058 15,070 2,19,187 Urban 1 201 2,549 201 2,714 Total 2,437 14,417 2,11,607 15,271 2,21,901 RNGO - - 12,952 1,60,391 12,952 1,60,391 TOTAL Rural 10,495 74,996 10,45,938 79,020 10,92,769 Urban 10 2,683 33,701 2,770 37,852 Total 10,505 77,679 10,79,639 81,790 11,30,621
Source :MAVIM, GoM, RNGO-Regional NGO + upto December

Economic Survey of Maharashtra 2015-16
164
After care Hostels: Under the scheme adolescent children from observation homes who have completed 18 years of age are rehabilitated. Residential facilities, food, clothes, education, medical facilities, counselling, vocational guidance, etc. are provided to the inmates till completion of education or getting employment. At present there are six Government & three NGO after-care hostels in the State with total intake capacity of 600 & 110 respectively. The Government provides grant-in-aid of ` 1,215 per month per inmate to hostels.
Foster Care Scheme (BalSangopan Yojana): This scheme is implemented in the State to provide family life to needy children who are deprived of home. At present 137 NGO provide foster care to 13,004 children. During 2014-15, an expenditure of ` 4.45 crore was incurred under the scheme, whereas during 2015-16, upto December an expenditure of ` 1.06 crore has been incurred.
Sukanya: Under the scheme, on the birth of a girl child on or after 1st January, 2014 in BPL family, an amount of ` 21,200 is deposited in LIC of India. On attaining 18 years of age she gets an amount of ` one lakh. Besides this, scholarship of ` 100 per month is given for her education from 9th std. to 12th std. During 2014-15, an expenditure of ` 326 lakh was incurred on 13,393 beneficiaries.
Integrated Child Development Services 10.31 ICDS programme aims at providing services to pre-school children in an integrated manner so as to ensure proper growth and development of children belonging to rural, tribal and slum areas. The programme is implemented through 97,475 Anganwadi Centres (AWCs), 11,084 mini AWCs and 553 Child Development Projects.
Nutrition Programme 10. 31.1 To meet the minimum nutritional requirements of children, pregnant women and lactating mothers and to provide health care to them, the ‘Supplementary Nutrition Programme’ (SNP) is implemented under the ICDS. The SNP aims to provide nutritious diet to the children below six years of age and improve the health of pregnant women and lactating mothers belonging to the disadvantaged sections of the society. It also aims to control malnourishment in remote and sensitive areas to minimise infant mortality. According to the World Health Organisation standards, since 2010-11, children are classified as normal, moderately underweight and severely underweight. Percentage of children (0-5 years) according to nutrition grades is given in Table 10.24. Progress of SNP is given in Table 10.25.
Table 10.24 Percentage of children (0-5 years) according to nutrition grades
Year Area Normal Moderately under-weight Severely under-weight
2014-15
Rural 92.5 6.4 1.1
Tribal 80.6 15.6 3.8
Urban 83.4 15.4 1.2
Total 89.2 9.6 1.5
2015-16+ Rural 92.5 6.3 1.1
Tribal 81.2 15.2 3.6
Urban 83.9 15.8 1.1
Total 89.5 9.10 1.4
Source : Commissionerate of ICDS, GoM + Upto November

Economic Survey of Maharashtra 2015-16
165
10.31.2 The centrally sponsored schemes implemented through ICDS in the State are as follows : Rajiv Gandhi scheme for empowerment of adolescent girls (Sabla) : This scheme is
being implemented since 2011 to empower the adolescent girls in the age group of 11 to 18 years, through 207 projects in 11 districts. The number of beneficiaries for SNP under the scheme was 10.44 lakh during 2014-15 and 9.08 lakh during 2015-16 upto November.
Indira Gandhi Matritva Sahayog Yojana (IGMSY) : This scheme is being implemented since 2011 to improve health and nutrition levels of pregnant women and lactating mothers in Bhandara and Amaravati districts on pilot basis. A cash incentive of ` 6,000 is provided to each beneficiary during pregnancy and lactating period in two installments. During 2014-15, number of beneficiaries was 0.57 lakh and during 2015-16 upto November, number of beneficiaries was 0.43 lakh.
Crime against Women and Children 10.32 ‘Crime against Women’ is direct or indirect physical or mental cruelty to women and the offences committed against the children or the crimes in which children are the victims are termed as Crime against Children. Crimes reported in which women are victims are given in Table 10.26 and Crimes reported in which children are victims are given in Table 10.27.
Table 10.25 Progress of SNP
Area Year Beneficiaries (In lakh) Expenditure ( ` crore)
Rural (incl. Tribal)
2014-15 59.94 1,091.96
2015-16+ 58.67 551.33
Urban 2014-15 11.98 217.63
2015-16+ 11.78 26.04
Source : Commissionerate of ICDS, GoM + Upto November
Table 10.27 Crimes reported in which children are victims
(no)
Type of Crime 2013 2014 2015+
Murder (Total) 197 207 143
i) Infanticide 6 12 31
ii) Other 191 195 112
Child rape 1,546 1,714 1,988
Kidnapping and abduction 1,698 2,616 6,576
Abandonment 259 225 89
Others 2,710 3,353 2,880
Total 6,410 8,115 11,676
Source : State Crime Record Bureau, GoM + Upto December
Table 10.26 Crimes reported in which women are victims
(no)
Type of offence 2013 2014 2015+
Rape 3,063 3,438 4,176 Kidnapping & abduction 1,874 2,457 4,864
Dowry deaths 320 279 262 Cruelty by husband & relatives
8,542 7,696 7,435
Molestation 8,132 10,001 11,696 Sexual harassment 2,632 1,575 986 Immoral Traffic Prevention Act 289 202 400
Others 1,277 1,045 1,028 Total 26,129 26,693 30,847 Source : State Crime Record Bureau,GoM + Upto December

Economic Survey of Maharashtra 2015-16
166
EMPLOYMENT AND POVERTY EMPLOYMENT 10.33 Employment generation is one of the priorities of the government & economic planners as it is an integral part of development. As per Census 2011, nearly one-fifth population of the State belongs to age group of 15-24 years. To address the requirements of all sectors, focus needs to be given on training of the workforce and linking them to job opportunities and markets.
10.34 The major sources of data on employment & unemployment are Population Census (PC), Economic Census (EC), surveys conducted by National Sample Survey Office (NSSO) & Labour Bureau, GoI, mandatory returns of factories registered under Factory Act, 1948 and Employment Market Information Programme (EMIP). Sourcewise employment situation is given below.
Population Census 10.35 Population Census provides an inventory of employment structure and workforce besides demographic data. As per Population Census 2011, there were 4.94 crore workers in the State, of which 3.26 crore were male. The Work Participation Rate (WPR) for the State was 44, as against 39.1 for All-India. Division and areawise WPR are given in Table 10.28. Economic classification of workers based on population census 2011 is given in Annexure 10.8.
Table 10.28 Division and areawise WPR -Census 2011 (per cent)
Division Area Main workers Marginal Workers Total Workers
Male Female Total Male Female Total Male Female Total Kokan Rural 44.7 22.0 33.3 10.9 12.1 11.5 55.6 34.1 44.8 Urban 55.1 15.5 36.8 3.2 2.4 2.8 58.3 17.9 39.6 Total 52.9 17.0 36.0 4.8 4.7 4.7 57.7 21.7 40.7 Pune Rural 53.6 31.8 43.0 3.5 6.5 5.0 57.1 38.3 48.0 Urban 51.9 16.2 34.7 3.0 2.2 2.6 54.9 18.4 37.3 Total 52.9 25.5 39.6 3.3 4.8 4.0 56.2 30.3 43.6 Nashik Rural 52.0 39.8 46.1 4.0 6.7 5.3 56.0 46.5 51.4 Urban 48.1 12.2 30.9 3.6 2.5 3.1 51.7 14.7 34.0 Total 50.8 31.4 41.4 3.9 5.4 4.6 54.7 36.8 46.0 Aurangabad Rural 52.1 39.0 45.7 3.1 5.6 4.3 55.2 44.6 50.0 Urban 44.8 11.4 28.6 4.2 2.8 3.5 49.0 14.2 32.1 Total 50.1 31.5 41.1 3.4 4.8 4.1 53.5 36.3 45.2 Amravati Rural 52.6 35.8 44.5 5.0 7.2 6.1 57.6 43.0 50.6 Urban 47.9 11.4 30.1 4.2 2.1 3.2 52.1 13.5 33.3 Total 51.3 29.0 40.5 4.8 5.7 5.3 56.1 34.7 45.8 Nagpur Rural 48.4 30.4 39.5 11.8 16.5 14.1 60.2 46.9 53.6 Urban 48.7 12.6 31.1 4.6 3.2 3.9 53.3 15.8 35.0 Total 48.5 23.0 36.0 8.7 10.9 9.8 57.2 33.9 45.8 State Rural 51.3 34.4 43.1 5.4 8.1 6.7 56.7 42.5 49.8 Urban 51.7 14.3 34.0 3.5 2.5 3.0 55.2 16.8 37.0
Total 51.5 25.4 38.9 4.5 5.6 5.0 56.0 31.1 44.0 Source : RGI

Economic Survey of Maharashtra 2015-16
167
Economic Census 10.36 As per the Sixth EC results, number of establishments in the State is 61.3 lakh with employment of 145.1 lakh. The employment in the State has increased by 36.5 per cent as compared to Fifth EC. Of the total employment, 41.8 per cent were in rural and 58.2 per cent in urban areas. The details of sixth EC are given in ‘Special Studies’ chapter of this publication.
National Sample Survey 10.37 NSSO conducts comprehensive quinquennial surveys on employment and unemployment. During 2011-12, the percentage of usually working persons was 53.6. Percentage of usually working persons by broad industry division is given in Table 10.29.
10.37.1 Percentage distribution of workforce in the age group 15-59 years according to current weekly activity status is given in Table 10.30.
Table 10.29 Percentage of usually working persons by broad industry division
Broad Industry Division
July, 2004 – June, 2005 (61st Round)
July, 2009 – June, 2010 (66th Round)
July, 2011 – June, 2012 (68th Round)
Rural Urban State
Rural Urban State Rural Urban State Agriculture 78.3 5.0 54.0 77.9 5.0 49.1 74.0 3.9 47.2
Mining & quarrying
0.2 0.4 0.3 0.5 0.2 0.4 0.3 0.2 0.2
Manufacturing 5.7 22.0 11.1 5.8 22.2 12.3 5.9 21.9 12.0
Electricity, gas & water supply
0.1 0.3 0.2 0.1 0.5 0.2 0.1 0.4 0.2
Construction 2.7 8.5 4.6 3.1 10.5 6.0 4.8 10.8 7.1
Trade 5.5 25.2 12.1 4.7 24.2 12.4 5.1 17.0 9.7
Transport 2.1 10.3 4.8 2.4 11.4 6.0 2.5 9.7 5.3
Services 5.4 28.3 12.9 5.5 26.0 13.6 7.3 36.1 18.3
All 100.0 100.0 100.0 100.0 100.0 100.0 100.0 100.0 100.0
Source : DES, GoM
Table 10.30 Percentage distribution of workforce in the age group 15-59 years according to current weekly activity status
Type of workforce
July, 2004 – June, 2005 (61st Round)
July, 2009 – June, 2010 (66th Round)
July, 2011 – June, 2012 (68th Round)
Rural Urban State
Rural Urban State Rural Urban State
Self employed / helper in household enterprise
49.0 37.4 45.1 48.5 37.4 44.1 49.5 32.1 42.7
Regular wage / salaried employee
8.1 51.6 22.8 9.3 50.9 25.8 11.1 55.0 28.2
Casual labour 42.9 11.0 32.1 42.2 11.7 30.1 39.4 12.9 29.1
All 100.0 100.0 100.0 100.0 100.0 100.0 100.0 100.0 100.0
Source : DES, GoM

Economic Survey of Maharashtra 2015-16
168
+ upto September
Graph 10.2 : Details of employment as per EMIP
Female Male
Female Male
Public Sector Private Sector
Num
ber‘
000
653 68
8
656
632
4 18
500
1000
1500
2000
2500
3000
3500
4000
2011
-12
2012
-13
2013
-14
2014
-15
554
2,26
9
1,96
7
2,27
0
2,51
0
2,38
2
1,06
1 1,16
5
1,18
1
1,14
3
1,71
2
1,46
5
1,75
8
1,58
6
1,59
020
15-1
6+
Factory Employment
10.38 Provisional results indicate that during 2013, the average daily employment in 38,326 working factories registered under Factory Act, 1948 was about 20.2 lakh. This showed a growth of 2.6 per cent in number of factories and decline in employment by 1.7 per cent over corresponding figures for the year 2012. Of the total working factories in 2013, about 22 per cent had 50 or more workers. Maximum workers were employed in ‘Manufacture of basic metal and metal products’ (17.6 per cent) followed by ‘Machinery and equipments (other than transport equipments)’ (12.9 per cent) factories. The percentage distribution of average daily factory employment in the State is given in Table 10.31 and the factory statistics is given in Annexures 10.9 and 10.10.
Employment Market Information Programme
10.39 Employment Market Information Programme (EMIP) is a centrally sponsored programme implemented in the State. The main objective of EMIP is to provide information about the structure of employment in public & private sectors to monitor the changes in the level of employment. Under EMIP, data is collected on quarterly basis. The programme covers all establishments in the public sector irrespective of their size and non-agricultural establishments in the private sector employing 10 or more persons. However, in Greater Mumbai only those non-agricultural establishments which are employing 25 or more employees are covered. Total employment in the State, at the end of September, 2015 was 57.46 lakh, of which 22.21 lakh (40.1 per cent) was in public sector. Of the total employment, 31per cent were female employees.
Skill Development, Employment and Entrepreneurship Guidance Centres 10.40 Skill Development, Employment and Entrepreneurship Guidance Centres (SDE&EGC) have been established in each district of the State to counsel, guide & help the job seekers in the State regarding employment & self-employment. In all 50 such centres are functioning in the State, of which, 35 are at district level, six in universities, eight for tribal candidates and one special centre for physically handicapped persons.
Table 10.31 Percentage distribution of average daily factory employment
Type of Industry Year 2011 2012 2013 2014*
Consumer goods 28.5 28.9 27.8 28.0
Intermediate goods 36.6 35.6 35.6 36.1
Capital goods 27.7 28.3 28.2 27.0
Others 7.2 7.2 8.4 8.9
All 100.0 100.0 100.0 100.0 * provisional Source : Directorate of Industrial Safety and Health, GoM

Economic Survey of Maharashtra 2015-16
169
10.40.1 The number of persons on the live register of these centres as on 31st December, 2015 was 34.02 lakh. During 2015, number of persons registered with these centres was 4.62 lakh. About 0.70 lakh persons were placed against 5.71 lakh notified vacancies during 2015. Notified vacancies, placement and persons on the live register according to educational qualification are given in Annexure 10.11 and 10.12 respectively.
Programmes for promotion of employment 10.41 The following programmes for promotion of employment are implemented by the State Government. Performance of programmes for promotion of employment is given in Table 10.32.
10.41.1 The State Government is organising job fairs in all districts since 2009-10 to provide employment opportunities to skilled labour and also to provide skilled labour to industries. Yearwise job fairs organised and employment provided are given in Table 10.33.
Employment Generation and Poverty Alleviation Programmes 10.42 Poverty reduction has been an important goal of development policy. To achieve inclusive development, several poverty alleviation and employment generation programmes are being implemented by GoI as well as GoM. Information of some of these programmes is given below.
Mahatma Gandhi National Rural Employment Guarantee Act 10.42.1 Maharashtra Rural Employment Guarantee Act, 1977 (Amendment, 2006) is implemented in rural areas of 34 districts in the State.The performance of MGNREGA, Maharashtra is shown in Table 10.34 while, the categorywise number of works and expenditure incurred is given in Annexure 10.13.
Table 10.32 Performance of programmes for promotion of employment
Programmes 2011-12 2012-13 2013-14 2014-15 2015-16+
Employment promotion @ 18,956 18,466 15,868 19,833 13,857
Apprenticeship training $ 44,737 46,706 45,972 43,396 54,050 Entrepreneurial development training #
35,076 42,002 40,051 40,486 12,739
+ upto December Source: @ Directorate of Employment & Self-Employment, GoM # Directorate of Industries, GoM $ Directorate of Vocational Education and Training, GoM
Table 10.33 Yearwise job fairs organised and employment provided (no)
Year Job fairs Entrepreneurs present
Unemployed youths who attended
job fairs
Of which, employment
provided
2011-12 159 981 63,185 21,767
2012-13 145 906 61,986 19,312
2013-14 155 1,042 69,823 20,834
2014-15 156 853 50,950 15,625
2015-16+ 131 733 54,975 15,248
Source : Directorate of skill Development, Employment and Entrepreneurship, GoM + upto December

Economic Survey of Maharashtra 2015-16
170
National Rural Livelihood Mission
10.42.2 The State has initiated Maharashtra State Rural Livelihood Mission (MSRLM) since 2011 under National Rural Livelihood Mission (NRLM). The mission aims towards poverty eradication by building strong institutions for the poor so that the poor get enhanced opportunities for self-employment and skill based livelihood, resulting in income generation in a sustainable manner. During 2015-16 upto December, total credit linkage of ` 294.45 crore was disbursed to 82,817 SHGs. The performance of the mission is given in Table 10.35.
National Urban Livelihood Mission 10.42.3 National Urban Livelihood Mission (NULM) is being implemented in the State since August, 2014. NULM is a centrally sponsored scheme on 75:25 basis, in which, 53 Municipal corporations/Municipal Councils of the State have been included. The GoI has made available an amount of ` 128 crore during 2015-16, where as GoM has disbursed ` 41.57 crore under this programme. Under skill training & placement programme no. of beneficiaries was 17,210 against the target of 76,956 incurring an expenditure of ` 12.18 crore. Under self employment programme no. of beneficiaries was 10,028 against the target of 19,500 incurring an expenditure of ` 0.38 crore.
Table 10.34 Performance of MGNREGA, Maharashtra
Particulars 2011-12 2012-13 2013-14 2014-15 2015-16+
No. of households provided employment (lakhs)
13.76 16.25 11.44 11.60 9.79
Total expenditure incurred ( `crore) 1,588.14 2,170.29 1,274.68 1,617.85 1,394.62
Number of works completed 6,433 77,084 78,807 1,47,224 67,162
Person days generated (crore) 6.51 8.72 5.17 6.14 4.96
Average employment per household (days) 47 54 45 53 51
Percentage share in employment of
(i) SC 5.8 8.9 9.9 10.1 9.3
(ii) ST 17.1 16.9 19.7 18.7 17.5
(iii) Women 46.0 44.6 43.7 43.5 43.8
Cost of generating one day of employment (`) 244 249 247 263 281
Source: Employment Guarantee Scheme Division, Planning Department, GoM. + as on 1st February
Table 10.35 Performance of NRLM, Maharashtra
Particulars 2014-15 2015-16+
No. of SHGs provided with assistance 46,048 82,817 Total no. of members of SHGs 12,71,808 15,73,567 Total grants (`crore) 53.61 14.91 Total loan (`crore) 527.78 294.45 Total expenditure (`crore) 160.02 63.86 Source: Rural Development Department, GoM. + upto December

Economic Survey of Maharashtra 2015-16
171
Prime Minister’s Employment Generation Programme
10.42.4 Prime Minister’s Employment Generation Programme is a centrally sponsored programme being implemented in the State. The main objectives of this programme are :
To generate employment opportunities through setting up of new self-employment ventures of traditional artisans / unemployed youths to reduce migration to urban areas,
To increase employment opportunities by increasing wage earning capacity of artisans.
In 2014-15, total margin money of ` 72.55 crore was disbursed to 3,239 projects, thereby generating employment of 14,380, whereas, during 2015-16 upto December, total margin money of ` 36.58 crore was disbursed to 1,719 projects, thereby generating employment of 14,026.
Seed Money Scheme 10.43 This scheme is being implemented by GoM to encourage unemployed youth to take up self-employment ventures through industry, service and business by providing soft loans from institutional finance to meet part of the margin money. Local unemployed person or a group of persons of age 18 to 50 years who have passed standard VII are eligible under the scheme. During 2014-15 seed money amounting to ` 15.73 crore was disbursed to 1,835 projects, whereas during 2015-16 upto December, seed money amounting to ` 8.40 crore was disbursed to 954 projects.
Industrial Relations 10.44 During 2015, number of work stoppages (strikes and lockouts) was 215, which affected 1,19,598 employees against 192 work stoppages affecting 95,901 employees in the previous year. The number of person-days lost due to work stoppages during 2015 was 30.10 lakh as against 24.99 lakh during 2014. The industrial disputes in the State are given in Annexure 10.14.
POVERTY 10.45 The erstwhile Planning Commission periodically estimated poverty lines and poverty ratios on the basis of large sample surveys on ‘Household Consumer Expenditure’ conducted quinquennially by the NSSO, GoI. Based on NSS 68th round data of ‘Household Consumer Expenditure’ survey, poverty estimates for the year 2011-12 have been estimated as per recommendations of Tendulkar Committee.
10.45.1 For 2011-12, the national poverty line is estimated at ` 816 per capita per month for rural areas and ` 1,000 per capita per month in urban areas. For Maharashtra, poverty line is estimated at ` 967 per capita per month in rural areas and ` 1,126 per capita per month for urban areas.

Economic Survey of Maharashtra 2015-16
172
HOUSING
10.46 Housing is one of the very important factors which indicate the socio-economic development. Safe, secure and affordable housing is essential for better quality of life and a better civil society. The State has specified certain objectives in its housing policy which include construction of houses for people belonging to the lower income group & economically weaker sections and providing houses to the people belonging to BPL category, for which various housing schemes are being implemented. 10.46.1 Growing concentration of people in urban areas has resulted in an increase in the number of people living in slums. Due to exorbitant land costs, providing houses at affordable prices in these areas is a big challenge. In order to ensure effective implementation of the housing schemes in urban areas, the State has established Maharashtra Housing and Area Development Authority (MHADA) and City & Industrial Development Corporation (CIDCO) Maharashtra Limited. Besides this, the State has formed Slum Rehabilitation Authority (SRA) for redevelopment and construction of houses for slum dwellers in selected cities.
Urban Housing Maharashtra Housing & Area Development Authority 10.47 MHADA was established in the year 1977 for providing houses in Mumbai and some parts of the State. Since inception, MHADA has constructed and redeveloped 4,50,000 dwelling units upto December, 2015. Dwelling units constructed & plots owned by MHADA are given in Table 10.36.
Table 10.36 Dwelling units constructed & plots owned by MHADA (no)
Year EWS LIG MIG HIG Others T/s Tc
Total dwelling units$
No. of plots Expenditure@ (` Crore)
2011-12 815 2,941 238 388 122 -- 4,504 794 928.94 2012-13 124 1,298 318 197 378 -- 2,315 224 465.45 2013-14 1,542 4,627 687 469 99 356 7,424 433 850.42 2014-15 2015-16+
915 339
1,136 182
1,290 251
196 --
71 --
855 --
3,608 772
-- --
424.38+ 488.31
EWS–Economically Weaker Section LIG-Low Income Group MIG – Middle Income Group HIG-High Income Group @ including plots + upto December T/s-Tenements Tc-Transit camps $ excluding Transit camps Source : MHADA, Mumbai
10.48 Dwelling units constructed by various boards of MHADA during 2014-15 are given in Table 10.37. Table 10.37 Dwelling units constructed by various boards of MHADA during 2014-15 (no)
Board EWS LIG MIG HIG Other Total$ T/s Tc
Mumbai 467 232 393 129 24 855 1,245 Konkan 0 40 74 16 20 0 150 Pune 448 59 39 18 0 0 564 Nashik 0 268 374 0 4 0 646 Aurangabad 0 501 278 0 17 0 796 Amravati 0 26 23 3 6 0 58 Nagpur 0 10 109 30 0 0 149
Total 915 1,136 1,290 196 71 855 3,608 Source : MHADA, Mumbai $ excluding Transit camps

Economic Survey of Maharashtra 2015-16
173
City and Industrial Development Corporation of Maharashtra Ltd. 10.49 CIDCO is implementing development programmes covering housing for all sections of the society and providing infrastructures like roads, schools, hospitals, community centres, etc. To meet the fast growing housing demand, housing policy of CIDCO incorporates self-financing principle using land as a prime resource. Since inception CIDCO has constructed total 1,82,942 tenements in Navi Mumbai, Aurangabad, Nashik and Nanded upto December, 2015. Details of tenements constructed by CIDCO are given in Table 10.38.
Table 10.38 Tenements constructed by CIDCO@ (no)
Place EWS/LIG MIG HIG Total tenements
Expenditure ( ` Crore)
Navi Mumbai 64,473 35,245 28,736 1,28,454 2,447 Aurangabad 19,501 2,127 432 22,060 56 Nashik 21,343 2,619 582 24,544 42 Nanded 7,758 126 0 7,884 9 Total 1,13,075 40,117 29,750 1,82,942 2,554 Source: CIDCO @ since inception upto December, 2015
Jawaharlal Nehru National Urban Renewal Mission 10.50 The Jawaharlal Nehru National Urban Renewal Mission is a massive city modernisation programme. Under this mission, two schemes viz. Basic Services to Urban Poor (BSUP) and Integrated Housing and Slum Development Programme (IHSDP) are being implemented in the State through MHADA.
Basic Services to Urban Poor 10.50.1 The objective of the scheme is to develop residential colonies with infrastructure for slum dwellers in urban areas. The GoI has extended this scheme upto March, 2017 for implementation of projects sanctioned upto March, 2012. This scheme is being implemented in 10 cities viz. Mumbai, Thane, Pune, Pimpri-Chinchwad, Nagpur, Nashik, Nanded, Kalyan-Dombivali, Mira-Bhayander and Kulgaon-Badlapur.
Integrated Housing and Slum Development Programme 10.50.2 Under this scheme, 119 projects are being implemented in 87 cities excluding 10 cities covered under BSUP scheme. The progress of BSUP and IHSDP is given in Table 10.39.
Slum Rehabilitation Scheme 10.51 Under the Slum Rehabilitation scheme, shelter has been provided to families residing in slum. Since inception (1995) number of projects completed is 1,512 and 1,62,502 slum families have been rehabilitated upto December 2015.
Shivshahi Punarvasan Prakalp Ltd. 10.52 Shivshahi Punarvasan Prakalp Ltd. was set up with an objective of accelerating slum rehabilitation. Since inception, upto October, 2015, in all 111 buildings comprising of 10,672 tenements were constructed (of which 10,192 tenements have been allotted) incurring an expenditure of ` 469 crore.
Table 10.39 Progress of BSUP and IHSDP@ (no)
Description BSUP IHSDP Projects sanctioned by GoI 55 119 Target of dwelling units 99,387 77,885 Total cost of projects (` Crore) 4,143 2,290 Dwelling units constructed 71,970 44,038 Dwelling units under construction 23,077 28,309
Source : MHADA, Mumbai @ upto December, 2015

Economic Survey of Maharashtra 2015-16
174
Pradhan Mantri Awas Yojana 10.53 In order to achieve ‘Housing for All by 2022’ GoI has launched a comprehensive scheme ‘Pradhan Mantri Awas Yojana’ for urban areas which envisages that by the time the nation completes 75 years of independence, every family should have pucca house with water connection, toilet facilities, uninterrupted electricity supply and access. GoM has decided to implement this scheme in 51 cities of the State.
Rural Housing Indira Awas Yojana 10.54 Indira Awas Yojana (IAY) is being implemented in the State since April, 1989 to construct houses for houseless BPL families in the rural areas. It is a centrally sponsored scheme with Central and State share in the ratio 60:40. A target of constructing 1,57,260 houses is fixed for 2015-16 for which GoI has sanctioned ` 693.48 crore and the State has made a provision of ` 306.38 crore. During 2014-15 in all 1,00,870 houses were constructed incurring an expenditure of ` 1,368 crore. From 2015-16, the funds are being transferred directly to the beneficiary account through Public Financial Management System. Revised Rajiv Gandhi Gramin Niwara Yojana-II 10.55 Revised Rajiv Gandhi Gramin Niwara Yojana – II is being implemented for APL beneficiaries in low income category. The cost of each house is fixed at ` one lakh of which, a loan of ` 90,000 is provided through the apex bank in the district and the remaining ` 10,000 is borne by the beneficiary. The interest component of the loan is borne by the GoM as a subsidy. Under this scheme interest of ` 34 crore was disbursed to banks through MHADA upto December, 2015. Shabari Adivasi Gharkul Yojana 10.56 Shabari Adivasi Gharkul Yojana is being implemented in rural as well as in urban areas for the people belonging to ST community who are houseless or having kaccha house. The total cost of house in rural areas is ` one lakh, in Municipal Council areas ` 1.5 lakh and ` two lakh for the areas which are covered under Municipal corporation & MMRDA. For construction of houses share of grant provided by GoM in rural, Municipal council and Municipal corporation area is 100 per cent, 92.5 per cent and 90 per cent respectively. The remaining is the share of the beneficiary. Ramai Awas Yojana 10.57 Ramai Awas Yojana is being implemented in rural as well as urban areas for the people belonging to SC & Neo Buddhist community who are houseless or having kaccha house. The total cost of house in rural, Municipal Council and Municipal Corporation areas is ` one lakh, ` 1.5 lakh and ` two lakh respectively. Under this scheme for construction of houses in rural, Municipal council and Municipal corporation area share of grant provided by GoM is 100 per cent, 92.5 per cent and 90 per cent respectively and remaining is the share of the beneficiary. Upto 2014-15 in all 1,84,146 houses were constructed and construction of 55,050 houses was in progress incurring a total expenditure of ` 1,771 crore. Pandit Dindayal Upadhyaya Gharkul Jaga Kharedi Arthasahayya Yojana 10.58 The Government has accorded priority for providing shelter to families under poverty line in the State. At present there are over two lakh eligible families in the State who do not have their own land for construction of house and so are not able to take benefit of the shelter schemes. For those families GoM has launched a new scheme Pandit Dindayal Upadhyaya Gharkul Jaga Kharedi Arthasahayya Yojana in 2015-16, which is applicable for the families eligible for Indira Awas Yojana, Ramai Awas Yojana and Shabri Awas Yojana. Under this scheme for the beneficiaries of Indira Awas Yojana GoI will provide ` 10,000 & GoM will provide ` 40,000. For Ramai Awas Yojana and Shabri Awas Yojana ` 50,000 will be provided by GoM to the beneficiaries.

Economic Survey of Maharashtra 2015-16
175
WATER SUPPLY AND SANITATION 10.59 Availability of safe drinking water and sanitation facilities are the basic minimum requirements for healthy living. Such facilities are being provided by State Government and Local bodies. The supply of drinking water in rural as well as urban areas has become serious problem because of deficient rainfall. Various schemes for water supply and sanitation are being implemented in the State.
WATER SUPPLY 10.60 The GoM has made available an amount of ` 300.35 crore (including Central fund) during 2015-16 upto December, to tackle the drought situation. Out of this ` 9.25 crore has been disbursed to Konkan division, ` 17.30 crore to Pune division, ` 50.23 crore to Nashik division, ` 181.85 crore to Aurangabad division, ` 27.32 crore to Amravati division and ` 14.40 crore to Nagpur division. The State has taken various measures such as temporary piped water supply, rejuvenation of bore wells & other water sources, water supply by tankers, etc. for scarcity affected 2,378 villages and 3,263 wadis.
Water Scarcity Programme 10.61 Scarcity Programme is implemented every year from October to June in villages and wadis facing water scarcity. Due to uneven rainfall in 2014-15 and scanty rainfall in 2015-16 scarcity programme was extended upto September, 2015 and an expenditure of ` 210.43 crore was incurred. Number of villages/wadis covered under water scarcity programme is given in Table 10.40 and weekly drinking water supply by tankers (as reported on 15th February 2016) is given in Table 10.41.
Table 10.40 Villages/ wadis covered under water scarcity programme (no)
Measures / works Villages Wadis 2013 -14@ 2014-15+ 2013-14@ 2014-15+
New bore wells 1,697 2,327 1,168 1,656
Temporary piped water supply - special repairs 365 700 85 301
Special repairs of bore wells 1,104 1,724 233 202
Temporary supplementary pipe connection 58 147 10 94
Water supply by tankers/ bullock-carts 1,594 2,523 4,608 3,372
Requisition of private wells 1,878 4,269 1,520 1,458
Deepening/desiltation of wells 87 206 6 120
Construction of budkies 0 5 0 11
@ October, 2013 to September, 2014 + October, 2014 to September, 2015 Source: Water Supply & Sanitation Department, GoM

Economic Survey of Maharashtra 2015-16
176
National Rural Drinking Water Programme
10.62 The National Rural Drinking Water Programme (NRDWP) is a flagship programme of GoI, being implemented in the State since April, 2009. This programme aims at permanently providing safe and adequate drinking water in rural areas. During 2014-15, under this programme, 3,748 villages/wadis were tackled against the target of 4,200, incurring an expenditure of ` 1,565.77 crore. During 2015-16 upto January, against the target of 1,611 villages/wadis, 1,088 villages/wadis were tackled. Progress of NRDWP is given in Table 10.42.
Shivkalin Pani Sathvan Yojana 10.62.1 Shivkalin Pani Sathvan Yojana (SPSY), a component of NRDWP, is being implemented with an objective of conservation of water by conventional and non-conventional measures for strengthening sources of drinking water viz. roof top rainwater harvesting, construction of tanks in hilly areas for storage of rainwater and similar other measures for availability of drinking water on sustainable basis. Since inception (2002) upto December 2015, in all 15,170 habitations were
Table 10.41 Weekly drinking water supply by tankers (no)
Division District Villages Wadis Tankers Nashik Nashik 50 95 47
Dhule 2 0 2 Jalgaon 17 0 10 Ahmadanagar 121 620 182
Pune Pune 36 244 50 Satara 21 137 20 Sangli 59 456 72 Solapur 9 5 10 Aurangabad Aurangabad 236 4 300
Jalana 96 28 130 Beed 263 218 351 Parbhani 68 23 83 Hingoli 9 0 8 Nanded 157 95 235 Osamanabad 160 4 225 Latur 110 29 137
As reported on 15thFebruary, 2016
Table 10.42 Progress of NRDWP
Year Villages/wadis tackled Expenditure
(`crore) Target Achievement
2011-12 6,502 6,364 1,252.92
2012-13 5,940 4,637 1,169.27
2013-14 5,066 4,065 1,225.22
2014-15 4,200 3,737 1,565.77
2015-16 + 1,611 1,088 711.63
+ upto January Source: Water Supply & Sanitation Department, GoM

Economic Survey of Maharashtra 2015-16
177
selected under this scheme to implement 44,772 measures, of which, 34,913 measures were completed in 12,503 habitations incurring total expenditure of ` 492.50 crore. 10.62.2 Rainwater harvesting is one of the important methods of conserving water. Under SPSY in rural areas, upto December 2015, in all 11,085 rainwater harvesting structures were built. Of these, 1,034 structures were in Konkan, 1,279 in Pune, 654 in Nashik, 4,013 in Aurangabad, 2,114 in Amravati and 1,991 in Nagpur division.
SANITATION 10.63 Adequate sanitation enables one to lead a healthy and dignified life. Various schemes are being implemented by the State to improve sanitation.
Maharashtra Sujal and Nirmal Abhiyan 10.64 The primary objective of Maharashtra Sujal and Nirmal Abhiyan is to overcome water scarcity and to meet growing demands of providing potable water and good sanitation facilities to all. To make technical, economical & administrative improvements, service charges are levied. Since inception (2008-09) upto December 2015, administrative approval was given to 258 water supply and sanitation works costing ` 1,248.97 crore and so far an amount of ` 916.32 crore has been disbursed. An expenditure of ` 46.90 crore was incurred during 2014-15 and ` 39.19 crore during 2015-16 upto December.
Swachh Bharat Mission (Gramin)
10.65 Nirmal Bharat Abhiyan has been renamed as Swachh Bharat Mission (SBM) on 2nd October, 2014. The goal of SBM is to make India Open Defecation Free (ODF) by 2019. The State ranks first is no. of Grampanchayats in All-India, with 4,303 Grampanchayats in June 2015. In 2015-16 upto January, 5.46 lakh individual toilets (for BPL and APL families) and seven community sanitary complexes were constructed and total expenditure incurred was ` 533.70 crore. During 2015-16, number of toilets constructed is given in the Table 10.43.
Sant Gadge Baba Urban Sanitation Campaign 10.66 Sant Gadge Baba Urban Sanitation Campaign is being implemented in all ULBs of the State from 2002-03. The campaign is helpful in continuous improvement and strengthening of water supply, sewerage, solid waste management etc. Under this scheme the expenditure incurred was ` 16.25 lakh in 2014-15 and ` 200 lakh has been budgeted for year 2015-16.
Integrated Low Cost Sanitation Scheme 10.67 Integrated low cost sanitation scheme aims at covering all households having dry latrine as well as those not having sanitation facilities, including those in slum and squatter colonies. The GoI has sanctioned 21 proposals of 16 ULBs for construction of 39,663 individual toilets, of which 27,184 toilets have been constructed and work of 2,189 toilets is under progress.
Table 10.43 Number of Toilets constructed
Category 2015-16
Target Achievement+ Percentage
Individual household latrine - BPL 5,55,258 1,42,609 25.68
Individual household latrine - APL 11,88,006 4,04,013 34.01
Source: Water Supply & Sanitation Department, GoM + upto January

Economic Survey of Maharashtra 2015-16
178
ENVIRONMENT CONSERVATION 10.68 Pollution occurs when ecosystems cannot get rid of harmful substances introduced into the environment. Human health, quality of ecosystem and aquatic & terrestrial biodiversity may be affected and altered temporarily or even permanently by pollution. 10.69 Maharashtra Pollution Control Board (MPCB) was established as per the constitutional provisions and is the enforcing agency for the various acts & rules pertaining to environment in the State. It plays a key role in abatement and control of pollution by generating relevant data, providing scientific information, giving technical inputs for policy formulation, training of manpower and organising activities for promoting awareness at different levels.
Air Pollution 10.70 Air pollution occurs when the air contains gases, dust, odor in harmful amount. Air (Prevention & Control of Pollution) Act, 1981 has been enacted for the prevention, control and abatement of air pollution. The present air monitoring network in the State consists of eight Continuous , 71 National and four State Ambient Air Quality Monitoring Stations. Use of less sulphur content diesel, lead free petrol, CNG/ LPG as an alternative fuel, making PUC mandatory, banning 15 years old vehicles and converting eight year old vehicles to CNG/LPG are some of the important measures being taken to restrict air pollution. As on 31st March, 2015, out of 77.26 lakh CNG/LPG convertible vehicles in the State, number of vehicles fitted with LPG kit was 1.25 lakh and number of vehicles fitted with CNG kit was 4.03 lakh as against 1.19 lakh and 3.47 lakh in the previous year. The data on ambient air quality at major monitoring stations, during 2015 is given in Table 10.44.
Table 10.44 Ambient air quality at major monitoring stations, during 2015
Concentration of air pollutants (µg/m3)
Station
Sulphur Dioxide (SO2)
Nitrogen Oxides (NOx)
Respirable suspended particulate matter
(Limit 50) (Limit 40) (Limit 60) Min Max Average Min Max Average Min Max Average
Mumbai (Sion)
1 (2)
41 (86)
13 (10)
11 (5)
189 (208)
87 (93)
23 (36)
379 (390)
131 (129)
Pune (Swargate)
6 (12)
55 (51)
22 (23)
13 (16)
167 (105)
67 (45)
18 (8)
286 (268)
101 (79)
Nashik (NMC Building)
3 (5)
29 (34)
16 (25)
9 (16)
48 (46)
23 (27)
22 (34)
359 (138)
82 (73)
Aurangabad (CADA office)
9 (7)
18 (37)
12 (12)
34 (26)
57 (77)
41 (39)
21 (15)
161 (153)
68 (77)
Amravati (Govt. college of Eng.)
5 (5)
14 (14)
11 (11)
6 (6)
15 (16)
13 (12)
38 (42)
97 (108)
74 (77)
Nagpur (Reg. office of MPCB)
6 (7)
42 (14)
9 (9)
16 (16)
62 (45)
29 (26)
36 (27)
144 (117)
55 (64)
Source : MPCB Note: Figures in brackets show Ambient air quality for 2014 µg/m3 Microgram per cubic meter
Water Pollution 10.71 Water (Prevention & Control of Pollution) Act, 1974, has been enacted for the prevention & control of water pollution and maintaining or restoring the water quality. Under National Water Quality Monitoring Programme (NWMP), MPCB is executing Global Environmental Monitoring System (GEMS) and Monitoring of Indian National Aquatic Resources (MINARS) projects. In the

Economic Survey of Maharashtra 2015-16
179
State, the monitoring network covers 156 rivers, 34 creeks/seawater, 10 drains / industrial drains and 50 wells. Amongst these 250 stations, 200 locations are for surface water and 50 are for ground water. Monitoring of surface water quality is done on monthly basis and of ground water on half yearly basis. Samples are analysed for nine core parameters and 19 general parameters and the trace metals are also analysed at few locations. Water quality of major rivers viz. Godavari, Krishna & Panchganga and Bhima at 39 locations during 2014-15 is given in Table 10.45.
10.72 By the end of March, 2015, sewage treatments and disposal arrangements have been made by 14 municipal corporations with capacity of 4,408.5 million liters/day and 13 municipal councils with capacity of 74.69 million liters/day.
10.73 Municipal solid waste treatment process involves both mechanical and biological treatment. Solid waste generated and treated (MT/day) in the jurisdiction of local bodies for the year 2014-15 is given in Table 10.46. Noise Pollution 10.74 As per Noise Pollution (Regulation & Control) Rules, 2000, zonewise standards of noise level limits are given in Table 10.47.
10.75 In order to assess the impact of noise pollution, Ambient Noise Level Monitoring Programme is conducted for two (working and non working) days every year by MPCB in five major cities (Mumbai, Nashik, Aurangabad, Nagpur and Kolhapur)
Table 10.45 Water quality of major rivers Godavari, Krishna & Panchganga and Bhima at 39 locations during 2014-15
Parameters
pH value
Biochemical Oxygen Demand (BOD)
Dissolved Oxygen (DO)
Fecal Coliform
6.0 to 8.5# 5mg/l# 4.0mg/l# Not greater than 5,000#
Range Locations Range Locations Range Locations Range Locations
5.5 - 6.5 0 2.5 - 5.5 0 3 - 5 7 0 - 100 25
6.5 - 7.5 0 5.5 - 8.5 38 5 - 7 32 100 - 200 8
7.5 - 8.5 39 8.5 - 11.5 0 7 - 9 0 200 - 300 5
8.5 - 9.5 0 11.5 & above 1 9 & above 0 300 & above 1 Source :MPCB Except pH value, all parameters in milligram/liter # Water quality standard
Table 10.46 Solid Waste generated and treated (MT/day) in the jurisdiction of local bodies for the year 2014-15
Type of Local Body No. MSW Generated (MT/Day)
MSW Treated
(MT/Day) Municipal Corporation 26 23,921.00 4,002.00
‘ A’ Class Municipal Council 12 559.00 109.00
‘ B’ Class Municipal Council 61 1,102.46 396.74
‘ C’ Class Municipal Council 146 1,106.33 432.76
Nagar Panchayat /Cantoment Board
12 131.50 96.00
Total 257 26,820.29 5,036.50 Source : MPCB
Table 10.47 Zonewise standards of noise level limits (in decibels)
Area Code Category of Zone Limits
Day time Night time
A Industrial 75 70
B Commercial 65 55
C Residential 55 45
D Silence zone 50 40 Source : MPCB

Economic Survey of Maharashtra 2015-16
180
for a period of 24 hours. The monitoring was carried at the same locations on both days during the same period. As compared to the standard limits, it was observed that, the noise levels exceeded the permissible limit on both, non working day & working day, in all the five cities. Day-night noise levels in residential areas in major cities for the year 2013 to 2016 are given in Table 10.48.
Industrial Pollution
10.76 At the end of March, 2015, out of the total 82,720 industries under the purview of MPCB, 13 per cent were air pollution prone, 23 per cent were water pollution prone and six per cent were hazardous waste prone.
10.77 During 2014-15, MPCB issued directions to 1,548 industries under Section 33A of Water (Prevention & Control of Pollution) Act, 1974 and 335 industries under Section 31A of Air (Prevention & Control of Pollution) Act 1981. MPCB filed 789 cases in the court against the defaulter industries, out of which convicted, dismissed and pending cases are 287, 226 and 221 respectively and results of 55 cases are decided against MPCB.
10.78 Under Common Effluent Treatment Plant (CETP) scheme, financial support is provided to install pollution control equipment for treatment and disposal of hazardous solid waste generated from small scale industrial units. CETP’s are commissioned in 26 industrial areas covering 8,352 industries. As on 31st March, 2015 effluent quantity treated was about 192.85 million liters/day.
Table 10.48 Day- night noise levels in residential areas in major cities for the year 2013 to 2016 (in decibles)
Location Non working Day Working Day
22-12-2013 14-12-2014 10-01-2016 23-12-2013 15-12-2014 11-01-2016
Day Night Day Night Day Night Day Night Day Night Day Night
Mumbai (Antop Hill) 67.1 63.4 70.0 61.0 67.1 62.1 63.6 60.1 67.0 66.0 72.6 59.6
Mumbai (Shivaji Park) 67.9 57.6 69.0 66.0 83.8 63.5 68.3 57.0 65.0 48.0 68.5 52.0
Nashik (Pandit Colony) 67.3 66.1 70.0 67.0 63.3 57.2 68.1 67.3 73.0 66.0 57.5 60.0
Nashik (Pavan Nagar) 76.5 69.6 73.0 65.0 57.5 60.9 69.3 71.1 74.0 67.0 58.1 54.3
Aurangabad
(CIDCO N-4) 65.1 55.1 63.0 52.0 64.2 52.9 64.5 64.1 65.0 52.0 66.1 54.9
Nagpur (Shivaji Nagar) 62.9 54.4 61.0 54.0 61.8 48.2 64.1 66.1 59.0 54.0 65.3 44.1
Kolhapur (Collector
Office) 52.8 44.3 55.0 46.0 68.6 54.7 68.6 55.6 58.0 47.0 65.1 50.7
Source : MPCB

Economic Survey of Maharashtra 2015-16
181
Hazardous Waste 10.79 There are 6,637 hazardous waste generating industries in the State of which 5,844 industries are sharing common hazardous waste management facility centers. Common facilities for management of hazardous waste have been set up at four major sites, namely Taloja & Trans Thane Creek industrial areas of MIDC in Thane, Ranjangaon in Pune and Butibori in Nagpur. Information about Hazardous waste treated at Common facility centers is given in Table 10.49.
10.80 Installation of Global Positioning System (GPS) for tracking of hazardous waste transporting vehicles has been made mandatory in the State. At the end of November, 2015 in all 101 hazardous waste transporters are authorised by MPCB. e-Waste 10.81 As on 30th November 2015, for recycling of e-waste MPCB has been authorised 45 e-waste collection centers and 32 industries having environmentally sound technology with total recycling/dismantling capacity of 48,060 MT per year under e-Waste (Management & Handling) Rules, 2011.
Bio-Medical Waste 10.82 There are 37 Common Bio-medical Waste Treatment and Disposal Facilities in the State, of which 34 facilities are operating on incineration basis and remaining on deep burial basis. During 2014 on an average about 44,026 kg of bio-medical waste was treated per day.
Environmental Clearance 10.83 Under the Environment (Protection) Act, 1986, the Central Government constituted Maharashtra Coastal Zone Management Authority(1998), State Level Environment Impact Assessment Authority(2008) and State Level Expert Appraisal Committee (SEAC) in the State for CRZ recommendations and environmental clearances respectively. The State has constituted three SEACs to speed up the processing of the proposals. 10.84 During 2015, in all, 217 proposals from building and construction, 36 from mining, three from irrigation and 43 from industry sectors were granted clearances while 378 proposals from building and construction, 68 from mining, three from irrigation and 37 proposals from industry sectors were granted environmental clearance in year 2014. 10.85 During year 2011 to 2015, Maharashtra Coastal Zone Management Authority issued CRZ recommendations to 661 projects under Coastal Regulation Zone (CRZ) Notification, 2011.
Lake Conservation Plan 10.86 Under National Lake Conservation Plan conservation of 14 lakes has been completed. The State also provides funds for conservation of degraded lakes. Under the conservation of degraded lake scheme 38 lakes are covered and amount of ` 107.32 crore has been sanctioned and expenditure incurred upto December, 2015 was ` 30.49 crore.
Table 10.49 Hazardous waste treated at Common facility centers
(lakh MT)
Year Type of Treatment Total Direct
Land fill Land fill
after treatment
Incinerable
2012-13 2.26 0.76 0.45 3.47
2013-14 0.81 0.99 0.46 2.26
2014-15 2.08 0.87 0.49 3.44
Source : MPCB

Economic Survey of Maharashtra 2015-16
182
SOCIAL JUSTICE 10.87 Justice exercised by the society for giving fair treatment and equal share of social benefits to all, especially to Scheduled Castes (SC), Scheduled Tribes (ST), Other Backward Classes (OBC), minorities, persons with disabilities and senior citizens, etc is termed as Social Justice. The directive principles of State Policy are inducted in the Constitution of India and accordingly various development programmes have been taken up for equalisation of the weaker sections with other sections. GoM formulates two separate sub-plans viz. Scheduled Caste Sub-Plan (SCSP) for SC and Tribal Sub-Plan (TSP) for ST. Under SCSP & TSP, the funds and benefits are provided to respective communities in proportion to their population over & above those made available through General Plan.
Scheduled Caste Sub-Plan 10.88 The outlay earmarked for SCSP under XII FYP (2012-17) is ` 28,050 crore, which is 10.2 per cent of the State’s total outlay. The outlay provided for SCSP for 2015-16 is ` 6,490 crore, out of which ` 4,090 crore (63 per cent) is for state level and remaining for district level schemes. The major share of expenditure during 2015-16 upto December is on ‘Social and Community Services’ sector. The important sub-sectors under this sector are Education, Health, Housing, Water supply, Women & Child development, Welfare of Backward Classes, etc. Under SCSP, in all 197 schemes (114 state level and 83 district level) were implemented in 2014-15 and 205 schemes (119 state level and 86 district level) are being implemented in 2015-16. The outlay and expenditure under SCSP are given in Table 10.50.
Table 10.50 Outlay and Expenditure under SCSP (` crore)
Sector
2014-15 2015-16 Outlay Expenditure
Percentage of expenditure to
outlay
Outlay Expenditure+
A) State level schemes 4,044.26 1,720.47 42.5 4,090.00 744.58
Agriculture & allied activities 64.28 27.13 42.2 61.30 10.78
Rural development 13.68 0.00 0.0 20.00 10.58
Industry & minerals 21.26 10.07 47.4 30.03 0.00
General economic services 60.00 33.53 55.9 0.00 0.00
Social & community services 3,875.04 1,648.01 42.5 3,945.36 707.57
General services 10.00 1.73 17.3 33.31 15.65
B) District level schemes 2,000.00 1,862.82 93.1 2,400.00 1,272.74
Agriculture & allied activities 270.69 269.19 99.4 294.00 162.66
Rural development 0.00 0.00 0.0 0.00 0.00
Energy 74.97 0.00 0.0 76.69 10.99
Industry & minerals 11.56 11.00 95.2 11.89 2.73
Transport 32.25 25.99 80.6 55.60 20.23
Social & community services 1,610.52 1,556.64 96.7 1,961.73 1,076.13
Total (A + B) 6,044.26 3,583.29 59.3 6,490.00 2,017.32
Source : Department of Social Justice and Special Assistance, GoM + upto December

183
Economic Survey of Maharashtra 2015-16
Sant Rohidas Leather Industries and Charmakar Development Corporation Ltd. 10.89 The Sant Rohidas Leather Industries and Charmakar Development Corporation Ltd (SRLICDC) is set up for welfare of charmakar community and is authorised as State’s channelising agency to implement various schemes of National Scheduled Castes Finance and Development Corporation (NSFDC). The authorised share capital of this Corporation is ` 73.21 crore and paid up capital is ` 306.21 crore (100 per cent share of GoM). The performance of some major schemes implemented by this Corporation is given in Table 10.51.
Sahityaratna Lokshahir Annabhau Sathe Development Corporation Ltd.
10.90 The GoM has established Sahityaratna Lokshahir Annabhau Sathe Development Corporation Ltd. (SLASDC), for economic, educational and social development of 12 sub-castes in Matang community. The authorised share capital of this Corporation is ` 300 crore and paid up capital is ` 394.60 crore, of which 51 per cent share is of GoM and rest is of GoI. SLASDC also works as State’s channelising agency of NSFDC. The performance of some major schemes implemented by this Corporation is given in Table 10.52.
Table 10.51 Performance of major schemes implemented by SRLICDC (` lakh)
Name of the Scheme 2014-15 2015-16+
No. of beneficiaries
Amount disbursed
No. of beneficiaries
Amount disbursed
Twenty per cent seed money 162 15.10 112 10.70
Term loan 470 38.50 264 21.70
Fifty per cent subsidy 353 35.25 204 20.40
Micro finance 301 30.10 206 20.60
Mahila Samruddhi 571 57.10 230 23.00
Mahila Kisan 38 3.20 8 0.60
Source: SRLICDC Ltd + upto December
Table 10.52 Performance of major schemes implemented by SLASDC (` lakh)
Name of Scheme 2014-15 2015-16+
No. of beneficiaries
Amount disbursed
No. of beneficiaries
Amount disbursed
Seed Money 18,342 7,962.26 6 1.87
Subsidy 16,095 1,609.50 5 0.50
Term loan 956 924.26 5 3.15
Micro finance 8 1.70 0 0.00
Mahila Samruddhi 3,421 1,367.00 0 0.00
Education loan 3 4.66 1 6.50
Source : SLASDC Ltd. + upto December

Economic Survey of Maharashtra 2015-16
184
Mahatma Phule Backward Class Development Corporation Ltd. 10.91 Mahatma Phule Backward Class Development Corporation Ltd. (MPBCDC) is set up by the GoM for the economic development of SC and Nav-Buddha communities. At present, authorised share capital of this Corporation is ` 500 crore and paid up capital is ` 632 crore, of which 51 per cent share is of GoM and rest is of GoI. The Corporation also works as State’s channelising agency of NSFDC & National Safai Karmachari Finance and Development Corporation (NSKFDC). The performance of some major schemes implemented by this Corporation is given in Table 10.53.
Table 10.53 Performance of major schemes implemented by MPBCDC (` lakh)
Name of Scheme 2014-15 2015-16+
No. of beneficiaries
Amount disbursed
No. of beneficiaries
Amount disbursed
Seed money 2,225 1,080.21 1,355 745.21
Fifty per cent subsidy 4,438 702.03 1,964 313.48
NSFDC’s Term loan 2 3.74 0 0.00
NSFDC’s Education loan 14 11.56 0 3.11
NSKFDC’s Term loan 467 1,956.94 81 345.76
NSKFDC’s Education loan 1 14.07 1 3.24
NSKFDC’s Training 300 20.81 0 0.00
Source : MPBCDC Ltd. + upto December.
Tribal Sub-Plan 10.92 The tribal population in the State is largely concentrated in the western hilly districts viz. Dhule, Nandurbar, Jalgaon, Nashik, Palghar, Thane, Raigad, Ahmadnagar & Pune (Sahyadri region) and in the eastern forest districts viz. Chandrapur, Gadchiroli, Gondia, Nagpur, Amravati, Yavatmal & Nanded (Gondwana region). Based on concentration of tribal population 29 Integrated Tribal Development Projects (ITDP), 43 Modified Area Development Approach (MADA) and 24 mini-MADA have been formed as per directives of GoI. Under TSP, infrastructure facilities are provided to the tribals living in the ITDP, MADA and mini-MADA pockets as well as outside the tribal areas.
10.93 The outlay earmarked for TSP under XII FYP is ` 24,475 crore, which is 8.9 per cent of the State’s total outlay. The outlay provided for TSP for 2015-16 is ` 5,170 crore, out of which ` 2,326 crore (45 per cent) is for state level and ` 2,844 crore (55 per cent) for district level schemes. Under TSP, 311 schemes (105 state level, 205 district level & one at both level) are being implemented in 2015-16 and in all 350 schemes were implemented in 2014-15 out of which 32 schemes are both at state and district level. The major share of expenditure for the year 2015-16 is on social and community services (58 per cent), followed by rural development (20 per cent) and agriculture & allied activities (10 per cent) of the total expenditure under TSP. The outlay and expenditure under TSP are given in Table 10.54.

185
Economic Survey of Maharashtra 2015-16
Table 10.54 Outlay and Expenditure under TSP
(` crore)
Sector
2014-15 2015-16 Outlay Expenditure
Percentage
of expenditure
to outlay
Outlay Expenditure+
Agriculture & allied activities 299.69 321.65 107.3 316.75 164.71
Rural development 211.61 189.25 89.4 457.54 328.80
Irrigation & flood control 268.09 138.19 51.5 210.12 42.98
Energy 95.53 111.63 116.9 130.32 48.35
Industry & minerals 1.07 0.94 87.9 1.45 0.33
Transport 506.46 660.31 130.4 545.14 134.75
General economic services 17.73 9.93 56.0 17.22 0.56
Social & community services 3,414.74 2,600.78 76.2 3,491.46 997.64
Other programmes 0.00 0.00 0.0 0.00 0.00
Total 4,814.92 4,032.68 83.8 5,170.00 1,718.12
Source : Tribal Development Department, GoM. + upto December
Shabari Aadiwasi Vitta Va Vikas Mahamandal Maryadit 10.94 Shabari Aadiwasi Vitta Va Vikas Mahamandal Maryadit (SAVVM) is established by GoM for economic welfare of tribal community. At present, authorised share capital of this Corporation is ` 200 crore and paid up capital is ` 77.11 crore, of which 51 per cent share is of GoM and rest is of GoI. This Corporation works as the State’s channelising agency of National Scheduled Tribes Finance and Development Corporation (NSTFDC). The performance of the major schemes implemented by this Corporation is given in Table 10.55.
Welfare of Vimukta Jati & Nomadic Tribes, Other Backward Classes and Special Backward Classes 10.95 GoM has established separate Directorate for welfare of the people belonging to Vimukta Jati & Nomadic Tribes (VJNT), OBCs and SBCs. Various development programmes are being implemented for upliftment of the weaker sections of these communities. During 2014-15 an expenditure of ` 209.12 crore was incurred against an outlay of ` 345.54 crore. For 2015-16, an outlay of ` 345.54 crore has been provided and an expenditure of ` 94.71 crore has been incurred upto December.
Table 10.55 Performance of major schemes implemented by SAVVM (` lakh)
Name of Scheme 2014-15 2015-16+
No. of beneficiaries
Amount disbursed
No. of beneficiaries
Amount disbursed
Term Loan 289 527.35 241 297.00
Mahila Sabalikaran 284 142 235 103.26
Source : SAVVM Maryadit + upto December

Economic Survey of Maharashtra 2015-16
186
Vasantrao Naik Vimukta Jati & Nomadic Tribes Development Corporation Ltd. 10.96 Vasantrao Naik Vimukta Jati & Nomadic Tribes Development Corporation Ltd. (VNVJNTDC) has been established for upliftment of VJNT and SBC communities. This Corporation is authorised as the State’s channelising agency of National Backward Classes Finance & Development Corporation (NBCFDC). The authorised share capital of this Corporation is ` 200 crore and paid up capital is ` 189.23 crore (100 per cent share of GoM). The performance of the major schemes implemented by this Corporation is given in Table 10.56.
Maharashtra State Other Backward Class Finance and Development Corporation Ltd.
10.97 Maharashtra State Other Backward Class Finance and Development Corporation Ltd. (MSOBCFDC) has been established for the welfare of OBC people in the State. At present, authorised share capital of this Corporation is ` 250 crore and paid up capital is ` 85.46 crore (100 per cent share of GoM). This Corporation also works as the State’s channelising agency of NBCFDC. The performance of major schemes implemented by this Corporation is given in Table 10.57.
Welfare of Persons with Disability 10.98 Various schemes for persons with disabilities are being implemented by GoM to identify their potentials, develop their skills, give them equal opportunities, protect their rights so as to empower & involve them in the main stream of the society. Three per cent seats are reserved for them in recruitment and in-service promotion in group C and D. The qualifying upper age limit is relaxed upto 45 years for appointment in the Government service. During 2014-15 an expenditure of ` 4.73 crore was incurred against an outlay of ` 6.12 crore. For 2015-16, an outlay of ` 7.12 crore has been provided and an expenditure of ` 1.75 crore has been incurred upto December.
Table 10.56 Performance of major schemes implemented by VNVJNTDC (` lakh)
Name of Scheme 2014-15 2015-16+
No. of beneficiaries
Amount disbursed
No. of beneficiaries
Amount disbursed
Direct Loan 1,065 266.25 210 52.50 Seed money 582 708.75 128 157.50 Term loan 0 0.00 5,050 1,000.00
Source : VNVJNTDC Ltd. + upto December
Table 10.57 Performance of major schemes implemented by MSOBCFDC (` lakh)
Name of Scheme 2014-15 2015-16+
No. of beneficiaries
Amount disbursed
No. of beneficiaries
Amount disbursed
Twenty per cent seed money 427 205.02 248 123.48 Direct Loan 0 0 327 80.80 Term loan 404 600.59 186 186.91 Margin money 19 35.77 12 22.60 Mahila Samruddhi 10 2.25 20 4.75 Swarnima 35 20.75 12 8.50 Education loan 395 134.47 329 111.25
Source : MSOBCFDC Ltd. + upto December

187
Economic Survey of Maharashtra 2015-16
Maharashtra State Handicapped Finance and Development Corporation Ltd. 10.99 The Maharashtra State Handicapped Finance and Development Corporation Ltd. (MSHFDC) is established in the State to bring persons with disabilities in the main stream of the society. The Corporation works as State’s channelising agency of National Handicapped Finance and Development Corporation (NHFDC). At present, the authorised share capital of this Corporation is ` 50 crore and paid up capital is ` 40.52 crore (100 per cent share of GoM). The performance of major schemes implemented by this Corporation is given in Table 10.58.
Minority Development 10.100 The State has established separate Minority Development Department for the development of minority community. In the XII FYP an outlay of ` 1,685 crore is earmarked for this department. During 2014-15, an expenditure of ` 250.62 crore was incurred against an outlay of ` 362.05 crore. For 2015-16, an outlay of ` 330.05 crore has been provided and an expenditure of ` 110.54 crore has been incurred upto December.
Maulana Aazad Alpasankhyank Aarthik Vikas Mahamandal Ltd. 10.101 Maulana Aazad Alpasankhyank Aarthik Vikas Mahamandal Ltd. (MAAAVM) has been set up for the welfare of minority community in the State. The authorised share capital of this Corporation is ` 500 crore and paid up capital is ` 300.69 crore (100 per cent share of GoM). This Corporation also works as State’s channelising agency of National Minority Development & Finance Corporation (NMDFC). The performance of major schemes implemented by this Corporation is given in Table 10.59.
Table 10.58 Performance of major schemes implemented by MSHFDC (` lakh)
Name of Scheme 2014-15 2015-16+
No. of beneficiaries
Amount disbursed
No. of beneficiaries
Amount disbursed
Direct Loan 251 50.20 148 29.60
Term loan 856 1,319.32 765 1,584.10
Source : MSHFDC Ltd. . + upto December
Table 10.59 Performance of major schemes implemented by MAAAVM (` lakh)
Name of Scheme 2014-15 2015-16+
No. of beneficiaries
Amount disbursed
No. of beneficiaries
Amount disbursed
Direct loan 11,036 4,414.40 2,610 1,043.60
Education loan 2,861 2,045.00 1,607 1,208.08
Other loans (SHG) 265 506.00 154 291.30
Term Loan 0 0.00 337 318.54
Source : MAAAVM Ltd. + upto November

Economic Survey of Maharashtra 2015-16
188
Important Schemes for Social Security 10.102 The State implements various schemes for social security. Beneficiaries & expenditure incurred on important social security schemes are given in Table 10.60.
Wasti/Area Development Schemes 10.103 The State implements various schemes for wasti/area development. Outlay & expenditure of major schemes of wasti/area development are given in Table 10.61.
Table 10.60 Beneficiaries & expenditure incurred on important social security schemes (` crore)
Name of Scheme
2014-15 2015-16+
No. of beneficiaries
(in lakh)
Expenditure
No. of beneficiaries
(in lakh)
Expenditure
Sanjay Gandhi Niradhar Anudan 7.82 591.37 8.54 524.47
Shravanbal Seva Rajya Nivruttivetan 18.25 983.11 19.06 875.03
Indira Gandhi National Old Age Pension 12.03 283.14 11.96 232.35
Indira Gandhi National Widow Pension 0.44 9.26 0.46 9.45
Indira Gandhi National Disability Pension 0.07 1.72 0.07 1.54
National Family Benefit 0.15 29.88 0.13 25.18
Aam Aadmi Bima 53.00 36.09 56.30 3.98
Source : Department of Social Justice and Special Assistance, GoM. + upto December
Table 10.61 Outlay & expenditure of major schemes of wasti/area development (` crore)
Name of Scheme 2014-15 2015-16+
Outlay Expenditure Outlay Expenditure
Dalit Wasti Sudhar++ 621.58 621.58 753.46 753.46
Nagari Dalit Wasti Sudhar @ 358.19 358.11 467.76 248.36
Nagari Adiwasi Wasti Sudhar @ 6.00 4.50 6.00 0.00
Thakkar Bappa Adiwasi Wasti Sudharana Ekatmik
Karyakram# 261.49 247.50 255.75 36.24
Tanda/Wasti Sudhar++ 21.00 15.53 21.00 1.31
Area Development Schemes in Minority Concentrated Urban Areas$
15.00 4.87 25.00 1.19
Area Development Schemes in Minority Concentrated Rural Areas$
40.00 16.56 25.00 0.00
+ upto December Source : ++ Social Justice and Special Assistance Department, @ Urban Development Department, # Tribal Development Department, $ Minority Development Department

Economic Survey of Maharashtra 2015-16
189
HUMAN DEVELOPMENT
10.104 The three essential key parameters considered in human development are healthy and long life, knowledge and access to the resources needed for a decent standard of living.The office of the United Nations Development Programme (UNDP) published Human Development Report (HDR) 2015 in December, 2015. As per this report, Norway tops the list with HDI of 0.944 while India is placed at 130th position with HDI 0.609. As per India Human Development Report (IHDR) 2011, Kerala (HDI 0.790) ranks first followed by Delhi (HDI 0.750), Himachal Pradesh (HDI 0.652), Goa (HDI 0.617), Punjab (HDI 0.605) and Maharashtra (HDI 0.572). As per the Maharashtra Human Development Report (MHDR) 2012, among 34 districts nine are very highly developed (HDI 0.742 and above), eight are highly developed ( HDI 0.720 to 0.742), eight are medium developed (HDI 0.678 to 0.718) and nine districts are low developed (HDI 0.671 and less). Districtwise HDI 2011 as per MHDR 2012 is given in Annexure 10.15.
Maharashtra Human Development Programme
10.105 Maharashtra Human Development Programme is being implemented in 125 most backward talukas and all ‘C’ class municipalities. To implement this Programme a budget of ` 156.25 crore was allocated for 2014-15 and an expenditure of ` 128.67 crore was incurred while for 2015-16, budget provision of ` 192 crore is made and expenditure incurred upto December, 2015 was ` 105.14 crore.
Taluka specific schemes
10.106 Taluka specific schemes are undertaken considering socio-economic & geographical conditions and local needs. During 2014-15, total number of taluka specific schemes sanctioned for education was 17, for health 14 and for income was seven. Out of these, works of four schemes for education, five schemes for health and two schemes for income have been completed and expenditure incurred upto December, 2015 was ` 2.53 crore, ` 1.67 crore and ` 3.70 crore respectively. During 2015-16, administrative sanction of ` 0.72 crore has been given to a scheme for education.
10.107 The physical progress of schemes implemented under Maharashtra Human Development Programme is given in Table 10.62.

Economic Survey of Maharashtra 2015-16
190
Table 10.62 Physical progress of schemes implemented under Maharashtra Human Development Programme
Scheme Type of beneficiaries
Physical progress 2014-15 2015-16 +
a) Education
Abhyasika in secondary & higher secondary schools– Number of sanctioned study rooms 2,889
Students benefited 1,67,615 1,34,546
Free of cost school bus service for girls in rural areas (625 buses provided)
Regular 5 buses per taluka (` 7.04 lakh per bus per year paid to MSRTC)
Girls availing the facility
76,396 79,349
Additional 2 buses per taluka in 122 talukas (` 20 lakh per year per bus paid to MSRTC)
Girls availing the facility
NA 21,205
Establishment of ‘Bal Bhavan’ science centres (123 centres)
Students visited 2,57,064 1,38,772
Extending scope of Kasturaba Gandhi Balika Vidyalaya Yojana upto Xth std. (Administrative sanction to 32 schools)
Girls studying 1,803 1,890
Distribution of bicycles to the needy girls studying in class VIIIth to XIIth and living at five kilometers from school
Bicycles distributed to girls
21,760 out of 23,241
selected beneficiaries
17,437 beneficiaries
(distribution in progress)
Construction of Anganwadis (867 sanctioned, of which 576 outside tribal and 291 in tribal area)
- 236 (constructions
completed)
214 (constructions
completed)
b) Health
Health camps organised for pregnant women, lactating mothers and infants (0-6 months):
Women and infants benefited
6,31,658 (6,549
camps)
1,49,501 (1,746 camps)
Health related training to adolescent girls by prerikas Adolescent girls 2,85,541 (5,593
prerikas)
1,38,906 (5,345
prerikas)
Lapsed wages to SC/ST/BPL pregnant women Beneficiary women
1,07,854 34,345
Construction of Health Sub-Centres (Sanctioned 30) - - 1 (construction
completed )
c) Income
Mobile soil testing laboratories (33 laboratories) - 24,867 (tested soil
samples)
23,103 (tested soil
samples)
Source : Maharashtra Human Development Programme, GoM + Upto December

Economic Survey of Maharashtra 2015-16
191
Millennium Development Goals
10.108 Ministry of Statistics and Programme Implementation, GoI has published Millennium Development Goals India Country Report 2015 in February, 2015 to access the Country’s progress with respect to the goals. Targets and likely achievements for indicators of Millennium Development Goals (MDG) for the State are given in Table 10.63.
* * * * *
Table 10.63 Targets and likely achievements for indicators of MDG for the State
Indicators Target 2015 Likely achievement 2015
Poverty estimates$ (per cent) 25.4 16.4
Underweight Children (< 3 years) (per cent) 26.1 25.4
Net Enrolment Ratio (Primary) 100.0 86.4
Under 5 Mortality Rate 25.0 25.2
Infant Mortality Rate 19.3 22.8
Percentage of one year old children (12-23 months) immunised against Measles
100.0 96.0
Maternal mortality ratio (Deaths per 100,000 live births)
58.6 64.5
Note: $ Poverty estimates derived using Tendulkar Methodology Source: Millennium Development Goals India Country Report 2015

Economic Survey of Maharashtra 2015-16
192ANNEXURE 10.1
STATEWISE SUB-GROUP INDEX AND COMPOSITE EDUCATION DEVELOPMENT INDEX (EDI) FOR
THE YEAR 2013-14 ALL SCHOOLS: ALL MANAGEMENTS
Sr no States / UT
Access Index Infrastructure Index Teachers Index Outcome Index Composite Primary &
Upper Primary
Primary Upper Primary Primary Upper
Primary Primary Upper Primary Primary Upper
Primary
EDI Rank
(1) (2) (3) (4) (5) (6) (7) (8) (9) (10) (11) (12)
1 A & N Islands 0.25 0.23 0.74 0.68 0.85 0.96 0.74 0.69 0.668 12
2 Andhra Pradesh 0.26 0.28 0.57 0.60 0.67 0.81 0.78 0.75 0.603 19
3 Arunachal Pradesh 0.43 0.37 0.50 0.66 0.33 0.65 0.65 0.80 0.548 28
4 Assam 0.38 0.22 0.52 0.41 0.35 0.64 0.82 0.78 0.524 30
5 Bihar 0.19 0.26 0.52 0.65 0.42 0.61 0.69 0.61 0.491 34
6 Chandigarh 0.20 0.50 0.69 0.66 0.98 0.99 0.44 0.68 0.680 11
7 Chattisgarh 0.31 0.32 0.76 0.76 0.46 0.47 0.81 0.76 0.571 26
8 D & N Haveli 0.23 0.25 0.73 0.74 0.69 0.79 0.52 0.73 0.606 18
9 Daman & Diu 0.14 0.35 0.83 0.85 0.84 0.89 0.44 0.60 0.642 15
10 Delhi 0.52 0.58 0.72 0.67 0.84 0.95 0.50 0.66 0.705 6
11 Goa 0.25 0.21 0.72 0.55 0.76 0.86 0.50 0.68 0.601 20
12 Gujarat 0.15 0.34 0.88 0.93 0.86 0.90 0.72 0.68 0.696 8
13 Haryana 0.15 0.34 0.81 0.80 0.72 0.79 0.71 0.73 0.646 14
14 Himachal Pradesh 0.48 0.44 0.90 0.85 0.68 0.79 0.77 0.74 0.714 4
15 Jammu & Kashmir 0.40 0.40 0.58 0.68 0.54 0.76 0.61 0.57 0.570 27
16 Jharkhand 0.29 0.28 0.65 0.67 0.35 0.49 0.78 0.60 0.505 33
17 Karnataka 0.26 0.35 0.91 0.93 0.78 0.88 0.82 0.69 0.710 5
18 Kerala 0.14 0.27 0.87 0.82 0.97 0.95 0.58 0.72 0.696 9
19 Lakshadweep 0.26 0.46 0.86 0.78 0.99 0.93 0.64 0.77 0.741 2
20 Madhya Pradesh 0.30 0.32 0.78 0.75 0.43 0.24 0.74 0.71 0.519 31
21 Maharashtra 0.18 0.27 0.88 0.83 0.68 0.80 0.74 0.73 0.650 13
22 Manipur 0.36 0.34 0.71 0.69 0.60 0.82 0.68 0.72 0.628 17
23 Meghalaya 0.56 0.46 0.32 0.36 0.45 0.72 0.64 0.74 0.541 29
24 Mizoram 0.32 0.60 0.67 0.69 0.56 0.81 0.50 0.57 0.597 22
25 Nagaland 0.22 0.37 0.69 0.66 0.63 0.71 0.67 0.67 0.586 24
26 Odisha 0.32 0.39 0.70 0.72 0.57 0.66 0.75 0.68 0.599 21
27 Puducherry 0.28 0.45 0.89 0.83 0.95 0.97 0.75 0.80 0.762 1
28 Punjab 0.23 0.37 0.86 0.84 0.81 0.87 0.70 0.72 0.693 10
29 Rajasthan 0.29 0.42 0.80 0.81 0.56 0.66 0.65 0.55 0.592 23
30 Sikkim 0.46 0.39 0.85 0.75 0.71 0.88 0.76 0.84 0.722 3
31 Tamil Nadu 0.21 0.23 0.87 0.82 0.90 0.84 0.79 0.79 0.701 7
32 Tripura 0.33 0.37 0.62 0.62 0.43 0.71 0.76 0.74 0.577 25
33 Uttar Pradesh 0.20 0.30 0.82 0.82 0.52 0.12 0.62 0.46 0.462 35
34 Uttarakhand 0.35 0.32 0.86 0.82 0.64 0.64 0.77 0.70 0.639 16
35 West Bengal 0.31 0.05 0.72 0.66 0.47 0.44 0.72 0.74 0.515 32
Source - Elementary Education in India Progress towards UEE Report (as on 30th September).

Economic Survey of Maharashtra 2015-16
193
ANNEXURE 10.2
NUMBER OF HEALTH SCIENCE INSTITUTIONS, THEIR INTAKE CAPACITY AND STUDENTS
ADMITTED IN THE FIRST YEAR OF THE COURSE FOR THE YEAR 2015-16
Faculty
Government Government aided Unaided Total
Insti-tutions
Intake capacity
Admitted students
Insti-
tutions Intake
capacity Admitted students
Insti-
tutions Intake
capacity Admitted students
Insti-
tutions Intake capacity
Admitted students
(1) (2) (3) (4) (5) (6) (7) (8) (9) (10) (11) (12) (13)
Allopathy
Graduate 22 3,050 2,989 -- -- -- 16 1,870 1,620 38 4,920 4,609
Post-Graduate 21 1,888 1,453 01 100 69 16 391 314 38 2,279 1,836
Ayurvedic
Graduate 04 350 346 16 880 840 43 2,570 2,600 63 3,800 3,786
Post-Graduate 04 191 175 13 255 124 20 843 837 37 1,289 1,136
Homeopathy
Graduate -- -- -- -- -- -- 46 3,445 3,398 46 3,445 3,398
Post-Graduate -- -- -- -- -- -- 18 354 295 18 354 295
Unani
Graduate -- -- -- 03 180 180 03 160 160 06 340 340
Post-Graduate -- -- -- 03 25 17 -- -- -- 03 25 17
Dental
Graduate 04 260 241 -- -- -- 25 2,300 2,180 29 2,560 2,421
Post-Graduate 05 158 64 -- -- -- 20 392 360 25 550 424
Physiotherapy
Graduate 04 90 90 -- -- -- 28 995 704 32 1,085 794
Post-Graduate 05 72 47 -- -- -- 14 122 66 19 194 113
Occupational
Therapy
Graduate 04 90 87 -- -- -- 02 40 0 06 130 87
Post-Graduate 05 65 31 -- -- -- -- -- -- 05 65 31
Audiology & Speech Language Pathology
Graduate 02 53 46 -- -- -- 02 40 0 04 93 46
Post-Graduate 02 30 29 -- -- -- -- -- -- 02 30 29
Prostetics & Orthotics
Graduate 01 31 17 -- -- -- -- -- -- 01 31 17
Post-Graduate 01 04 03 -- -- -- -- -- -- 01 04 03
Nursing
Graduate 06 350 280 -- -- -- 94 4,300 2,838 100 4,650 3,118
Post-Graduate 03 62 25 -- -- -- 18 270 150 21 332 175
B.P.M.T
Graduate 19 1,290 493 -- -- -- 02 129 0 21 1,419 493
Source - Maharashtra University of Health Sciences, Nashik

Economic Survey of Maharashtra 2015-16
194ANNEXURE 10.3
NUMBER OF TECHNICAL INSTITUTIONS, THEIR INTAKE CAPACITY AND STUDENTS ADMITTED
IN THE FIRST YEAR OF THE COURSE FOR THE YEAR 2015-16
Faculty
Government Government aided Unaided Total
Insti-tutions
Intake capacity
Admitted students
Insti-
tutions Intake
capacity Admitted students
Insti-
tutions Intake
capacity Admitted students
Insti-
tutions Intake
capacity Admitted students
(1) (2) (3) (4) (5) (6) (7) (8) (9) (10) (11) (12) (13)
Engineering
Diploma 43 18,150 16,460 18 5,140 3,971 429 1,50,020 69,094 490 1,73,310 89,525
Graduate 7 2,740 2,695 12 3,357 3,195 348 1,47,770 83,352 367 1,53,867 89,242
Post-Graduate 6 919 722 12 1,395 1,165 218 17,024 4,096 236 19,338 5,983
Architecture
Graduate -- -- -- 3 207 206 55 3,340 2,728 58 3,547 2,934
Post-Graduate -- -- -- -- -- -- 16 216 26 16 216 26
Management Sciences
MMS/MBA 2 180 134 14 1,140 725 386 36,870 28,250 402 38,190 29,109
PGDM 1 60 60 1 150 0 84 10,980 176 86 11,190 236
Hotel management & catering technology
Diploma 2 120 116 -- -- -- 2 120 18 4 240 134
Graduate -- -- -- 1 40 25 9 490 429 10 530 454
Post-Graduate -- -- -- -- -- -- 1 24 11 1 24 11
Pharmacy
Diploma 4 210 208 20 1,240 1,234 192 12,365 11,981 216 13,815 13,423
Graduate 4 220 216 7 330 318 150 10,220 9,988 161 10,770 10,522
Post-Graduate 3 84 73 6 336 273 98 4,306 2,263 107 4,726 2,609
Pharma D 2 60 60 -- -- -- -- -- -- 2 60 60
Master in Computer application
2 90 89 9 510 283 118 10,790 4,766 129 11,390 5,138
Industrial training institutes
417 93,875 81,778 -- -- -- 407 40,892 27,114 824 1,34,767 1,08,892
Source - Directorate of Technical Education, Mumbai. Directorate of Vocational Education and Training, , Mumbai.

Economic Survey of Maharashtra 2015-16
195
ANNEXURE 10.4
NUMBER OF INSTITUTIONS FOR ARTS, SCIENCE, COMMERCE, NON A.I.C.T.E COURSES, LAW,
EDUCATION, FINE ARTS, THEIR INTAKE CAPACITY AND STUDENTS ADMITTED IN FIRST YEAR OF THE COURSE FOR THE YEAR 2015-16
Faculty Government Government aided Unaided Total
Insti- tutions
Intake capacity
Admitted students
Insti- tutions
Intake capacity
Admitted students
Insti- tutions
Intake capacity
Admitted students
Insti- tutions
Intake capacity
Admitted students
(1) (2) (3) (4) (5) (6) (7) (8) (9) (10) (11) (12) (13)
Arts
Graduate 741 700 2,85,235 2,34,119 43,992 31,143 3,29,968 2,65,962
Post-Graduate 542 461 76,760 36,573 1,822 856 79,124 37,890
Science
Graduate 1,149 1,093 1,66,513 1,37,431 35,546 21,181 2,03,208 1,59,705
Post-Graduate 774 598 24,367 18,963 2,899 1,885 28,040 21,446
Commerce 15 1,098 1,136 2,249
Graduate 1,098 1,035 2,26,374 1,89,383 60,749 44,540 2,88,221 2,34,958
Post-Graduate 445 408 30,239 22,728 2,331 1,335 33,015 24,471
Non-A .I.C.T.E
Courses
Graduate 288 284 16,243 11,341 12,479 7,730 29,010 19,355
Post-Graduate -- -- 1,817 655 1,768 578 3,585 1,233
Law
Graduate 1 320 320 47
9,386 8,010 59
3,600 2,894 107
13,306 11,224
Post-Graduate -- -- -- 1,836 963 335 156 2,171 1,119
Education
B. Ed 12
595 521 38
2,804 2,581 539
18,326 11,478 589
21,725 14,580
M. Ed 50 21 657 357 1,550 633 2,257 1,011
Fine Arts
Diploma 3 145 134 31 800 774 172 2,560 751 206 3,505 1,659
Graduate 4 300 300 -- -- -- -- -- -- 4 300 300
Post-Graduate 3 92 59 -- -- -- -- -- -- 3 92 59
Source - Directorate of Higher Education, Pune Directorate of Art, Mumbai

Economic Survey of Maharashtra 2015-16
196
ANNEXURE 10.5
NUMBER OF INSTITUTIONS FOR AGRICULTURE, VETERINARY AND FISHERY SCIENCE COURSES, THEIR INTAKE CAPACITY AND STUDENTS ADMITTED IN FIRST YEAR OF THE COURSE
FOR THE YEAR 2015-16
Faculty Government Government aided Unaided Total
Insti- tutions
Intake capacity
Admitted students
Insti- tutions
Intake capacity
Admitted students
Insti- tutions
Intake capacity
Admitted students
Insti- tutions
Intake capacity
Admitted students
(1) (2) (3) (4) (5) (6) (7) (8) (9) (10) (11) (12) (13)
Agriculture Graduate 16 1,708 1,721 2 244 231 74 7,470 7,365 92 9,422 9,317 Post-Graduate 11 885 797 -- -- -- -- -- -- 11 885 797 PhD 4 162 148 -- -- -- -- -- -- 4 162 148 Horticulture Graduate 5 200 203 -- -- -- 10 560 545 15 760 748 Post-Graduate 10 116 108 -- -- -- -- -- -- 10 116 108 Forestry Graduate 2 64 63 -- -- -- -- -- -- 2 64 63 Post-Graduate 2 21 20 -- -- -- -- -- -- 2 21 20 Fishery Science Graduate 3 122 108 -- -- -- -- -- -- 3 122 108 Post-Graduate 1 28 30 -- -- -- -- -- -- 1 28 30 PhD 1 11 8 -- -- -- -- -- -- 1 11 8 Food Technology Graduate 1 64 67 -- -- -- 26 1,580 1,532 27 1,644 1,599 Post-Graduate 1 25 27 -- -- -- -- -- -- 1 25 27 PhD 1 5 5 -- -- -- -- -- -- 1 5 5 Bio-Technology Graduate 2 80 76 -- -- -- 16 1,000 975 18 1,080 1,051 Post-Graduate 1 8 7 -- -- -- 3 24 24 4 32 31 PhD 1 3 3 -- -- -- -- -- -- 1 3 3 Agriculture Engineering
Graduate 4 247 252 -- -- -- 15 840 809 19 1,087 1,061 Post-Graduate 4 60 56 -- -- -- -- -- -- 4 60 56 PhD 4 25 14 -- -- -- -- -- -- 4 25 14 Home Science Graduate 1 40 37 -- -- -- -- -- -- 1 40 37 Post-Graduate 1 12 4 -- -- -- -- -- -- 1 12 4 PhD 1 2 0 -- -- -- -- -- -- 1 2 0 Agriculture Business Management
Graduate -- -- -- -- -- -- 14 680 604 14 680 604 Post-Graduate 1 35 35 -- -- -- 3 90 90 4 125 125 Animal Husbandry Graduate -- -- -- -- -- -- 1 30 30 1 30 30 Post Harvest Management
Post-Graduate 1 30 20 -- -- -- -- -- -- 1 30 20 Veterinary Graduate 5 287 281 -- -- -- -- -- -- 5 287 281 Post-Graduate 6 249 111 -- -- -- -- -- -- 6 249 111 PhD 4 63 16 -- -- -- -- -- -- 4 63 16 Dairy Technology Graduate 2 82 68 -- -- -- -- -- -- 2 82 68 Post-Graduate 1 8 0 -- -- -- -- -- -- 1 8 0
Source - Maharashtra Council of Agriculture Education and Research, Pune. Maharashtra Animal and Fishery Sciences University, Nagpur

Economic Survey of Maharashtra 2015-16
197ANNEXURE 10.6
MEDICAL FACILITIES AVAILABLE IN MAHARASHTRA STATE
(Public and Government aided)
Serial No.
Year Hospitals
(no.) Dispensaries
(no.)
Primary health centres (no.)
Primary health units
(no.)
T. B. Hospitals and
clinics (no.)
Beds in @@
institutions (no.)
Beds per @
lakh of population
(1) (2) (3) (4) (5) (6) (7) (8) (9)
1 1971 299 1,372 388 1 72 43,823 88
2 1981 530 1,776 454 400 90 71,385 114
3 1991 768 1,896 1,672 81 1,977 1,09,267 144
4 2001 981 1,629 1,768 169 2,520 1,01,670 105
5 2011 1,368 3,012 1,816 191 2,520 1,18,116 103
6 2012 1,393 3,087 1,816 193 2,520 1,19,355 106
7 2013 1,395 3,087 1,811 193 3,062## 1,20,576 107
8 2014 1,402 3,087 1,811 193 3,062## 1,21,066 108
Source - (1) State Family Welfare Bureau, GoM
(2) Directorate of Health Services, GoM
(3) State Bureau of Health Intelligence and Vital Statistics, GoM
@@ Includes beds in General and Government Aided Hospitals only. Beds in Private hospitals not included.
@ Based on mid year projected population of respective year.
## It includes T.B. Hospitals, centres, treatment units, etc. PHI.

Economic Survey of Maharashtra 2015-16
198ANNEXURE 10.7
BIRTH RATES, DEATH RATES, INFANT MORTALITY RATES AND TOTAL FERTILITY RATES
BASED ON SAMPLE REGISTRATION SCHEME, MAHARASHTRA STATE
Year Birth rate Death rate Infant mortality rate Total fertility rate
Rural Urban Total Rural Urban Total Rural Urban Total Rural Urban Total (1) (2) (3) (4) (5) (6) (7) (8) (9) (10) (11) (12) (13)
1971 33.7 29.0 32.2 13.5 9.7 12.3 111 88 105 4.9 3.9 4.6
(38.9) (30.1) (36.9) (16.4) (9.7) (14.9) (138) (82) (129) (5.4) (4.1) (5.2)
1981 30.4 24.5 28.5 10.6 7.4 9.6 90 49 79 4.0 3.0 3.7
(35.6) (27.0) (33.9) (13.7) (7.8) (12.5) (119) (62) (110) (4.8) (3.3) (4.5)
1991 * 28.0 22.9 26.2 9.3 6.2 8.2 69 38 60 3.4 2.5 3.0
(30.9) (24.3) (29.5) (10.6) (7.1) (9.8) (87) (53) (80) (3.9) (2.7) (3.6)
2001 21.1 20.2 20.7 8.5 5.9 7.5 55 28 45 2.6 2.2 2.4
(27.1) (20.3) (25.4) (9.1) (6.3) (8.4) (72) (42) (66) (3.4) (2.3) (3.1)
2007 18.7 17.3 18.1 7.3 5.7 6.6 41 24 34 2.2 1.8 2.0
(24.7) (18.6) (23.1) (8.0) (6.0) (7.4) (61) (37) (55) (3.0) (2.0) (2.7)
2008 18.4 17.2 17.9 7.4 5.6 6.6 40 23 33 2.1 1.7 2.0
(24.4) (18.5) (22.8) (8.0) (5.9) (7.4) (58) (36) (53) (2.9) (2.0) (2.6)
2009 18.1 16.9 17.6 7.6 5.5 6.7 37 22 31 2.1 1.7 1.9
(24.1) (18.3) (22.5) (7.8) (5.8) (7.3) (55) (34) (50) (2.9) (2.0) (2.6)
2010 17.6 16.4 17.1 7.5 5.3 6.5 34 20 28 2.0 1.7 1.9
(23.7) (18.0) (22.1) (7.7) (5.8) (7.2) (51) (31) (47) (2.8) (1.9) (2.5)
2011 17.3 15.8 16.7 7.3 5.1 6.3 30 17 25 1.9 1.6 1.8
(23.3) (17.6) (21.8) (7.6) (5.7) (7.1) (48) (29) (44) (2.7) (1.9) (2.4)
2012 17.4 15.5 16.6 7.3 5.0 6.3 30 17 25 2.0 1.6 1.8
(23.1) (17.4) (21.6) (7.6) (5.6) (7.0) (46) (28) (42) (2.6) (1.8) (2.4)
2013 17.2 15.4 16.5 7.1 5.0 6.2 29 16 24 1.9 1.6 1.8
(22.9) (17.3) (21.4) (7.5) (5.6) (7.0) (44) (27) (40) (2.5) (1.8) (2.3)
Source - Sample Registration Scheme Bulletin, Registrar General of India, New Delhi Note - (1) Bracketed figures are for India.
(2) * Excludes Jammu & Kashmir.
(3) Birth rates and Death rates are per thousand population.
(4) Infant mortality rates are per thousand live births.

Economic Survey of Maharashtra 2015-16
199
ANNEXURE 10.8
ECONOMIC CLASSIFICATION OF WORKERS AS PER POPULATION CENSUS 2011
(in thousand)
Class of workers Main/
Marginal/ Total
Maharashtra India#
Males Females Total Males Females Total
(1) (2) (3) (4) (5) (6) (7) (8)
(A) Workers
1. Cultivators Main 7,181 4,297 11,478 73,018 22,823 95,841
Marginal 411 680 1,091 9,689 13,163 22,851
Total 7,592 4,977 12,569 82,707 35,986 1,18,692
2. Agricultural labourers Main 5,847 5,222 11,069 55,255 30,912 86,167
Marginal 928 1,489 2,417 27,485 30,678 58,163
Total 6,775 6,711 13,486 82,740 61,590 1,44,330
3. In Household Industries Main 607 385 991 7,540 4,791 12,331
Marginal 84 150 234 2,236 3,769 6,005
Total 691 535 1,225 9,776 8,560 18,336
4. Other Main 16,355 3,870 20,225 1,37,336 30,771 1,68,107
Marginal 1,204 718 1,922 19,307 12,971 32,278
Total 17,559 4,588 22,147 1,56,643 43,742 2,00,385
Total (A) Main 29,989 13,774 43,763 2,73,149 89,297 3,62,446
Marginal 2,628 3,037 5,665 58,717 60,580 1,19,297
Total 32,617 16,811 49,428 3,31,866 1,49,877 4,81,743
(B) Non-Workers Total 25,626 37,320 62,946 2,91,256 4,37,570 7,28,826
Total (A+B) 58,243 54,131 1,12,374 6,23,122 5,87,447 12,10,569
Source - Registrar General and Census Commissioner, GoI
# Excludes Mao-Maram, Paomata and Purul sub-divisions of Senapati district of Manipur state.
Note - Figures may not add up to totals due to rounding.

Economic Survey of Maharashtra 2015-16
200
ANNEXURE 10.9
AVERAGE DAILY EMPLOYMENT IN DIFFERENT INDUSTRIES IN MAHARASHTRA (in hundred)
Sr. No
Industry Group Average daily employment
1961 1971 1981 1991 2001 2011 2012 2013 2014
(1) (2) (3) (4) (5) (6) (7) (8) (9) (10) (11)
(A) Consumer Goods Industries 5,103 5,020 5,168 4,535 4,533 5,164 5,939 5,615 5,650
1 Food products, beverages and tobacco products
902 921 965 1,330 1,662 1,991 2,348 2,186 2,344
2 Textiles (including wearing apparels) 3,691 3,516 3,554 2,527 2,167 2,182 2,509 2,426 2,283
3 Wood and wood product 109 75 75 152 154 217 216 216 212
4 Paper, paper products, printing and publishing etc. 390 494 549 491 525 736 816 741 760
5 Tanning and dressing of leather and leather products 11 14 25 35 25 38 50 47 51
(B) Intermediate goods
Industries 1,297 2,435 3,193 3,421 3,462 6,648 7,313 7,201 7,299
6 Chemicals and chemical products 340 760 1,059 1,215 1,299 1,802 2,014 1,994 1,999
7 Petroleum, rubber, plastic products 174 349 421 482 535 1,087 1,144 1,119 1,197
8 Non-metallic mineral products 284 402 403 423 317 465 538 532 560
9 Basic metals, metal products 499 924 1,310 1,301 1,311 3,294 3,617 3,556 3,543
(C) Capital goods Industries 1,220 2,110 2,898 2,712 3,140 5,033 5,827 5,696 5,467
10 Machinery and equipments (other than transport equipments) 594 1,322 1,786 1,614 1,720 2,407 2,667 2,603 2,532
11 Transport equipments 469 608 903 867 1,025 1,785 2,139 2,112 1,982
12 Other manufacturing industries 157 180 209 231 395 841 1,021 981 953
(D) Others 256 412 663 1,016 870 1,301 1,485 1,711 1,801
Total 7,873 9,977 11,922 11,684 12,005 18,146 20,564 20,222 20,217
Source - Directorate of Industrial Safety and Health, GoM
Note - (1) Details may not add up to totals due to rounding.
(2) Bidi factories are covered under separate Act from 1974.

Economic Survey of Maharashtra 2015-16
201
ANNEXURE 10.10
WORKING FACTORIES AND FACTORY EMPLOYMENT IN MAHARASHTRA
Employment (in thousand)
Year Item* *
Section 2m (i) Section 2m (ii) & Section 85 All Factories
Employing less than
50 workers
Employing 50 or more workers
Total Section 2m (i)
Employing less than
50 workers
Employing 50 or more workers
Total Section
2m (ii) & Section 85
Employing less than 50 workers
Employing 50 or more workers
Total all factories
(1) (2) (3) (4) (5) (6) (7) (8) (9) (10) (11) 1961 Factories 5,097 1,781 6,878 1,004 351 1,355 6,101 2,132 8,233
Employment 99 626 725 21 41 63 120 667 787
1971 Factories 6,341 2,701 9,042 856 343 1,199 7,197 3,044 10,241
Employment 123 824 947 15 36 51 138 860 998
1981 Factories 10,238 3,132 13,370 3,154 70 3,224 13,392 3,202 16,594
Employment 183 983 1,166 20 6 26 203 989 1,192
1991 Factories 13,139 3,199 16,338 7,743 38 7,781 20,882 3,237 24,119
Employment 215 910 1,124 40 4 44 254 914 1,169
2001 Factories 15,977 3,929 19,906 8,393 25 8,418 24,370 3,954 28,324
Employment 266 891 1,157 42 2 44 308 893 1,201
2009 Factories 18,668 6,112 24,780 9,263 17 9,280 27,931 6,129 34,060
Employment 345 1,103 1,448 50 2 52 395 1,105 1,500
2010 Factories 19,173 6,517 25,690 9,183 15 9,198 28,356 6,532 34,888
Employment 363 1,231 1,594 52 1 53 415 1,233 1,647
2011 Factories 19,410 7,373 26,783 9,067 26 9,093 28,477 7,399 35,876
Employment 367 1,394 1,761 51 3 54 418 1,397 1,815
2012 Factories 19,818 8,664 28,482 8,816 41 8,857 28,634 8,705 37,339
Employment 399 1,599 1,998 54 4 58 453 1,603 2,056
2013 Factories 21,224 8,345 29,569 8,728 29 8,757 29,952 8,374 38,326
Employment 406 1,595 1,971 48 3 51 454 1,568 2,022
2014 Factories 18,122 8,010 26,132 10,633 28 10,661 28,755 8,038 36,793
Employment 402 1,561 1,963 57 2 59 459 1,563 2,022
Source - Directorate of Industrial Safety and Health, GoM
Note - (1) Employment includes estimated average daily employment of factories not submitting returns. (2) Figures pertain to the factories registered under the Factories Act, 1948. (3) Details may not add up to totals due to rounding in respect of employment.
* * Factories - Number of working factories, Employment - Average Daily Employment. Bidi factories are deregistered and covered under separate Act from 1974.

Economic Survey of Maharashtra 2015-16
202
ANNEXURE 10.11
REGISTRATIONS IN THE EMPLOYMENT AND SELF EMPLOYMENT GUIDANCE CENTRES IN THE STATE, THE VACANCIES NOTIFIED AND
PLACEMENTS EFFECTED
(In thousand) Year Number of registrations
during reference Year Number of vacancies
notified Number of placements during reference year
Number of persons on live register at the end
of the year (1) (2) (3) (4) (5)
1991 591.8 64.8 30.3 3,159.8
1992 596.6 55.9 29.1 3320.5
1993 599.7 55.4 24.1 3,349.6
1994 635.8 52.1 24.7 3,439.2
1995 720.1 49.7 18.7 3,634.3
1996 688.7 53.7 22.6 3787.2
1997 692.8 47.4 22.9 3,933.1
1998 729.3 37.9 16.8 4,109.6
1999 861.1 50.9 16.2 4,183.8
2000 750.8 43.9 18.1 4,348.8
2001 623.2 32.3 12.5 4,419.7
2002 622.7 30.9 9.5 4,203.3
2003 819.1 59.6 16.4 4,044.1
2004 880.3 43.4 15.1 4,105.7
2005 645.2 44.2 13.9 4,000.3
2006 608.1 68.3 14.8 3,608.5
2007 616.7 97.5 9.2 3,213.8
2008 721.5 99.2 11.8 3,007.2
2009 698.3 176.6 17.2 2,875.9
2010 892.9 378.8 353.9 2,682.4
2011 747.5 346.2 191.0 2,596.2
2012 612.3 259.2 134.2 2,404.0
2013 630.3 118.9 114.6 3034.8
2014 536.4 841.1 84.7 3,571.5
2015+ 461.9 571.4 70.4 3,401.5
Source - Directorate of Employment and Self - Employment, GoM + Upto December

Economic Survey of Maharashtra 2015-16
203
ANNEXURE 10.12
NUMBER OF PERSONS ON THE LIVE REGISTER OF EMPLOYMENT AND SELF-EMPLOYMENT GUIDANCE CENTRES AS ON 31st DECEMBER, 2014
Sr. No. Educational Qualification Persons Of which, females Percentage of females
Percentage of persons to grand
total (1) (2) (3) (4) (5) (6)
1. Below S.S.C. (including illiterates) 2,68,595 61,777 23.0 7.8
2. S.S.C. Passed 10,73,111 2,25,353 21.0 29.6
3. H.S.C. Passed 10,70,962 2,83,805 26.5 29.6
4. I.T.I. trained and Apprentices 2,25,522 23,680 10.5 3.2
5. Diploma holder
5.1 Engineering/Technology 68,485 17,190 25.1 1.9
5.2 Medicine, DMLT and Pharmacy 17,008 6,123 36.0 0.5
5.3 Others 1,42,311 67,598 47.5 3.9
Total (5.1 to 5.3) 2,27,804 90,911 40.0 6.3
6. Graduate
6.1 Engineering/Technology 55,065 14,042 25.5 1.5
6.2 Medicine 2,762 1,271 46.0 0.1
6.3 Others 5,93,274 2,07,645 35.0 16.4
Total (6.1 to 6.3) 6,51,101 2,22,958 34.2 18.0
7. Post-Graduate
7.1 Engineering/Technology 2,853 919 32.2 0.1
7.2 Medicine 356 135 37.9 Neg.
7.3 Others 1,03,406 45,499 43.8 2.8
Total (7.1 to 7.3) 1,06,615 46,593 43.7 2.9
Grand Total 36,23,710 9,55,037 26.4 100.0
Source - Directorate of Employment and Self-Employment, GoM
Neg. - Negligible

Economic Survey of Maharashtra 2015-16
204
ANNEXURE 10.13
CATEGORYWISE NUMBER OF WORKS COMPLETED AND EXPENDITURE INCURRED THEREON UNDER THE MAHATMA GANDHI NATIONAL RURAL EMPLOYMENT
GUARANTEE ACT (MGNREGA) IN MAHARASHTRA
( ` in lakh)
2011-12 2012-13 2013-14 2014-15 2015-16+
Sr. No.
Category of work works
Expen-diture
works Expen-diture
works Expen-diture
works Expen-diture
works
Expen-diture
(1) (2) (3) (4) (5) (6) (7) (8) (9) (10) (11) (12)
1. Rural Connectivity
644 594.46 4,876 19,120.71 2,867 9,486.74 3,586 14,616.00 3,416 4,155.70
2. Flood Control and Protection
17 44.98 105 288.93 213 849.79 174 1,197.00 107 391.05
3. Water Conservation and Water Harvesting
3,018 1,416.79 27,413 22,217.45 10,646 7,980.60 14,755 12,003.48 13,300 5,425.91
4. Drought Proofing 548 37.71 16,230 14,291.46 14,751 5,914.65 10,095 3,730.36 7,338 403.88
5. Micro Irrigation Works
15 8.55 816 347.73 538 282.63 530 360.58 232 275.36
6. Provision of Irrigation facility to SC/ST Land Owners
192 104.50 12,482 14,788.05 11,765 8,897.50 18,928 14,697.69 24,885 10,599.0
7. Renovation of Traditional Water Bodies
1,068 271.74 6,027 3,375.19 2,341 1,785.14 1,802 1,349.20 1,571 657.00
8. Land Development
801 125.93 4,160 2,360.32 2,900 1,798.50 1,487 1,953.50 2,271 721.84
9. Rajiv Gandhi Seva Kendra
0 0.00 38 291.11 72 201.37 73 276.24 98 33.87
10. Other works 130 22.78 4,937 600.27 33,514 2,385.64 9,579.4 5,755.95 13,944 633.79
Total 6,433 2,627.44 77,084 77,681.22 78,807 3,956.96 1,47,224 55,950.00 67,962 23,297.40
Source - Planning Department, GoM
+ Upto 10th November, 2015

Economic Survey of Maharashtra 2015-16
205
ANNEXURE 10.14
INDUSTRIAL DISPUTES IN MAHARASHTRA**
(Workers participated in ‘00 and person days lost in lakh)
Item 1971 1981 1991 2001 2011 2012 2013 2014 2015
(1) (2) (3) (4) (5) (6) (7) (8) (9) (10)
1. Textile mills —
(a) No. of strikes and lockouts 156 66 10 12 7 5 15 8 4
(b) Workers participated 3,197 564 61 86 26 19 52 24 89
(c) Person days lost 9.70 47.36 2.37 4.53 1.73 2.43 1.38 0.63 2.32
2. Engineering factories —
(a) No. of strikes and lockouts 211 119 59 28 8 8 42 35 51
(b) Workers participated 469 412 110 65 71 47 469 437 438
(c) Person days lost 5.64 16.21 14.46 25.79 12.90 12.57 12.17 11.36 10.75
3. Miscellaneous —
(a) No. of strikes and lockouts
323 451 148 19 18 14 133 149 160
(b) Workers participated 841 1,031 423 85 38 35 440 498 669
(c) Person days lost 5.18 31.49 29.66 15.90 7.80 8.45 11.24 13.00 17.03
4. Total —
(a) No. of strikes and lockouts 690 636 217 59 33 27 193 192 215
(b) Workers participated 4,507 2,007 594 237 135 100 962 959 1,196
(c) Person days lost. 20.53 95.05 46.49 52.31 22.43 23.45 24.78 24.99 30.10
Source - Commissioner of Labour, GoM
Note - (1) Figures against item No. 4 (b) and 4 (c) may not tally against actual totals due to rounding. (2) ** Under State Industrial Relations Machinery.
(3) Information January to December.

Economic Survey of Maharashtra 2015-16
206
ANNEXURE 10.15
DISTRICTWISE HUMAN DEVELOPMENT INDEX 2011
District Human Development
Index (HDI) 2011 HDI Status
(1) (2) (3)
Nandurbar 0.604 Low
Gadchiroli 0.608
Washim 0.646
Hingoli 0.648
Osmanabad 0.649
Nanded 0.657
Jalna 0.663
Latur 0.663
Dhule 0.671
Beed 0.678 Medium
Parbhani 0.683
Buldhana 0.684
Yavatmal 0.700
Gondia 0.701
Amravati 0.701
Bhandara 0.718
Chandrapur 0.718
Ahmednagar 0.720 High
Akola 0.722
Wardha 0.723
Jalgaon 0.723
Aurangabad 0.727
Solapur 0.728
Ratnagiri 0.732
Satara 0.742
Sangli 0.742 Very High
Nashik 0.746
Sindhudurg 0.753
Raigad 0.759
Kolhapur 0.770
Nagpur 0.786
Thane 0.800
Pune 0.814
Mumbai 0.841
Maharashtra State 0.752 Source - Maharashtra Human Development Report 2012

11Special Studies

Economic Survey of Maharashtra 2015-16
Graph 11.1 : Establishments & employment
61.3
18.3
145.1
67.6
0
20
40
60
80
100
120
140
160
Second Third Fourth Fifth SixthEconomic census
Establishments Employment
therein as per economic censuses
in la
kh
11. SPECIAL STUDIES Sixth Economic Census 11.1 Economic Census (EC) is the complete count of all establishments engaged in economic activities (involved in production and / or distribution of goods and services not meant for the sole purpose of own consumption) located within the geographical boundaries of the country. The EC is a 100 per cent centrally sponsored scheme implemented by Central Statistics Office, GoI in collaboration with States’ Directorate of Economics and Statistics. The EC provides data on number of establishments and persons working therein and helps to bridge the data gaps, provides base frame for follow-up surveys and also helps in development planning. The Sixth EC is conducted in 2013-14. In the past, ECs were conducted in 1977, 1980, 1990, 1998 and 2005. 11.2 Sixth EC covered all establishments excluding establishments engaged in crop & plantation, public administration, defense, compulsory social security, activities of household as employers of domestic personnel and activities of extra-territorial organisations & bodies and all illegal activities. The field work of Sixth EC was conducted during October, 2013 to April, 2014 by the Directorate of Economics and Statistics in the State. Sixth EC results of the State at a glance are given in Table 11.1 Table 11.1 Sixth EC results of the State at a glance
(in lakh) Items Rural Urban State
Number of establishments 32.9 28.4 61.3 of which, i) outside household with fixed
structure 11.0 17.8 28.8
ii) outside household without fixed structure 4.2 4.5 8.7 iii) inside household 17.8 6.1 23.9
Handicraft / handloom establishments 0.4 0.5 0.9 Growth of establishments over Fifth EC (per cent) 55.9 34.0 45.3 Number of persons employed 60.6 84.5 145.1 of which, i) hired male 14.0 41.3 55.3
ii) hired female 3.9 10.3 14.2 iii) non – hired male 30.6 27.5 58.1 iv) non – hired female 12.1 5.4 17.5
Growth in total employment over Fifth EC (per cent) 37.1 22.8 28.3 Source : DES, GoM

Economic Survey of Maharashtra 2015-16
208
Establishments
23%
35%12%
13%
7%10%
Kokan Pune Nashik Aurangabad Amaravati Nagpur
Graph 11.3 : Regionwise establishments & employment therein as per SixthEC
Employment
32%
32%
11%
10%
6% 9%
Establishments and employment 11.3 As per the Sixth EC results, number of establishments in the State is 61.3 lakh with employment of 145.1 lakh. The number of establishments and employment in the State has increased by 45.3 and 28.3 per cent respectively as compared to Fifth EC. Of the total establishments, 53.7 per cent were in rural areas with 41.8 per cent share in employment, whereas of the total establishments, 46.3 per cent were in urban areas with 58.2 per cent share in employment. The establishments and employment as per last five ECs are given in Table 11.2. The details based on Fifth and Sixth EC are given in Annexure 11.1 and number of establishments and persons working according to broad economic activities as per Sixth EC are given in Annexure 11.2.
Table 11.2 Establishments and employment as per economic censuses (in lakh)
Area Economic census Second Third Fourth Fifth Sixth
Est. Emp. Est. Emp. Est. Emp. Est. Emp. Est. Emp. Rural 9.7 21.5 13.1 28.5 16.1 36.9 21.1 44.2 32.9 60.6
Urban 8.7 46.1 13.1 61.1 16.2 67.6 21.2 68.9 28.4 84.5
State 18.4 67.6 26.2 89.6 32.3 104.5 42.3 113.1 61.3 145.1
Percentage change over previous census
-- -- 42.6 32.7 23.3 16.6 30.9 8.3 45.3 28.3
Source : DES, GoM Est. : Establishment Emp. : Employment

Economic Survey of Maharashtra 2015-16
209
Agricultural and non-agricultural establishments and employment 11.4 Of the total number of establishments (61.3 lakh), agricultural establishments were 15.9 lakh (25.9 per cent) showing an increase of 163.6 per cent over that reported in Fifth EC and non-agricultural establishments were 45.5 lakh (74.1 per cent) showing an increase of 25.5 per cent over that reported in Fifth EC. Of the total agricultural establishments in the State, 15.1 lakh (95.1 per cent) were without hired worker and 0.81 lakh (4.9 per cent) were with at least one hired worker and of the total non-agricultural establishments in the state, 29.0 lakh (63.8 per cent) were without hired worker and 16.5 lakh (36.2 per cent) were with at least one hired worker. Number of agricultural and non-agricultural establishments and employment therein are shown in Table 11.3 Table 11.3 Agricultural and non-agricultural establishments and employment therein
(in lakh) Item Type of Establishments
Without hired workers
With at least one hired worker
Total
Agri. Non-agri. Agri. Non-agri. Agri. Non-agri. Number of Establishments 15.1 29.0 0.8 16.5 15.9 45.5 Employment 23.5 35.5 2.9 83.2 26.4 118.7 Source : DES, GoM Agri.: Agricultural Non-Agri.: Non-agricultural
* * * * *

Economic Survey of Maharashtra 2015-16
210
ANNEXURE 11.1
FIFTH AND SIXTH ECONOMIC CENSUS AT A GLANCE
(In thousand)
Item Rural Urban Total
Fifth census
Sixth census
per cent change
Fifth census
Sixth census
per cent change
Fifth census
Sixth census
per cent change
(1) (2) (3) (4) (5) (6) (7) (8) (9) (10)
1. No. of Establishments
(a) Without Hired Workers
1,442 2,771 92.16 1,078 1,643 52.41 2,519 4,414 75.23
(b) With atleast one hired worker
668 523 (-) 21.71 1,037 1,200 15.72 1,706 1,723 1.00
(c) Total 2,110 3,294 56.11 2,115 2,843 34.42 4,225 6,137 45.25
2. Persons usually working in —
(a) Without Hired Workers 1,923 3,865 100.99 1,296 2,040 57.41 3,219 5,905 83.44
(b) With atleast one hired worker
2,501 2,197 (-) 12.16 5,589 6,410 14.69 8,090 8,607 6.39
(c) Total 4,424 6,062 37.03 6,885 8,450 22.73 11,309 14,512 28.32
3. Average no. of workers per establishment
2.1 1.8 -- 3.3 3.0 -- 2.7 2.4 --
4. Average no. of workers per establishment with atleast one hired worker
4.0 4.2 -- 5.4 5.3 -- 4.7 5.0 --
5. No. of establishment according to principal characteristics
(1) Seasonal . . 193 241 24.87 47 66 40.43 240 307 27.92
(2) Without premises . . 405 421 3.95 316 452 43.04 721 873 21.08
(3) Social group of owner . .
(a) Scheduled castes . . 148 267 80.41 151 237 56.95 299 504 68.56
(b) Scheduled tribes . . 102 143 40.20 85 84 (-) 1.18 187 227 21.39
(4) Type of ownership . .
(a) Private . . 1,876 3,145 67.64 2,032 2,783 36.96 3,908 5,928 51.69
(b) Co-operative . . 30 9 (-) 70.00 21 10 (-) 52.38 51 19 (-) 62.75
(c) Govt. & PSU . . 204 140@ (-) 31.37 62 50@ (-) 19.35 266 190@ (-) 28.57
Source - Directorate of Economics and Statistics, GoM
Note - Percentage may not tally due to rounding.
@ * Excluding public administration, defence and compulsory social security services activities.

Economic Survey of Maharashtra 2015-16
211
ANNEXURE 11.2
NUMBER OF ESTABLISHMENTS AND PERSONS WORKING ACCORDING TO BROAD ECONOMIC ACTIVITIES (SIXTH ECONOMIC CENSUS)
(In thousand)
Broad economic activity No. of establishments Persons working Hired persons working
Rural Urban Total Rural Urban Total Rural Urban Total
(1) (2) (3) (4) (5) (6) (7) (8) (9) (10)
1. Agriculture 1,523 69 1,592 2,512 127 2,639 246 39 285
2. Mining and quarrying 4 2 6 18 12 30 14 11 25
3. Manufacturing 373 547 920 927 1,991 2,918 540 1,632 2,172
4. Electricity, gas and water supply etc. activities
7 13 20 29 69 98 27 61 88
5. Construction 36 66 102 78 172 250 48 124 172
6. Sale, Maint. & Repair M/V & M/C
35 77 112 66 238 304 39 198 237
7. Wholesale trade 18 71 89 42 237 279 28 207 235
8. Retail trade 582 924 1,506 844 1,829 2,673 245 1,073 1,318
9. Accommodation and food service activities
88 160 248 204 566 770 126 464 590
10. Transport and storage 166 220 386 253 458 711 104 279 384
11. Informations and communications
7 29 37 14 320 334 10 305 316
12. Financial and insurance activities
31 52 83 96 343 439 62 323 385
13. Real estate activities
11 52 63 16 92 108 6 48 54
14 Professional, Scientific & Technical activities
16 73 89 31 320 351 19 285 304
15. Administrative and support service activities
34 54 88 66 246 312 38 218 256
16. Education 121 75 196 506 532 1,038 493 496 989
17. Human Health & Social work activities
41 78 120 97 369 466 72 337 409
18. Arts, entertainment, sports & amusement and recreation
14 20 34 27 62 89 18 51 69
19. Other service activities (not elsewhere classified)
186 260 446 237 468 705 63 258 321
Total 3,294 2,843 6,137 6,062 8,450 14,512 2,197 6,410 8,607
Source - Directorate of Economics and Statistics, GoM M/V – Motor Vehicle
Note - Details may not add up to totals due to rounding of figures in column No. 5 to 10. M/C – Motor Cycle

Economic Survey of Maharashtra 2015-16
GLOSSARY
Non-worker: Person who has not participated in any economically productive activity with or without compensation, wages or profit at any time during the reference period. Seeking or available for work: Persons who have registered themselves in the employment exchange or may be applying for jobs or may have made other efforts for a job, such as looking in the newspaper advertisements with a view to applying for a job with the intention to offer themselves for employment. For rural areas any marginal worker or Non-worker, if available when offered work, considered as seeking work. Gross Domestic Product (GDP): It is a measure in monetary terms of all the goods & services produced (without duplication) within the boundaries of any geographical area during a given period of time (generally, one year). Usually, geographical area is Nation. In case of the geographical boundaries being State, it is termed as Gross State Domestic Product (GSDP). In case of the geographical boundaries being district, it is termed as Gross District Domestic Product (GDDP). All Net Products such as Net Domestic Product, Net State Domestic Product & Net District Domestic Product are obtained by subtracting Consumption of Fixed Capital (CFC) from respective Gross Domestic Products. GVA at basic prices: Compensation of Employees + Operating surplus / Mixed Income + Consumption of Fixed Capital + Production taxes less production subsidies
Gross Domestic Product (GDP): Sum of GVA at basic prices for each industry + Taxes on products less Subsidies on Products
Gross National Income (GNI): It is an addition of Net Income from abroad & Gross Domestic Product of a Nation.
Net National Income (NNI): It is obtained by subtracting Consumption of Fixed Capital (CFC) from Gross National Income. It is also called as National Income (NI).
Per Capita Income (Per capita National Income, Per capita State Income & Per Capita District Income) is obtained by dividing Net Products of respective geographical area by mid year population of respective year.
Advance estimate: Estimates based on available suitable indicators.
Village Electrification: A village would be declared as electrified if (i) Basic Infrastructure such as distribution transformer and distribution lines are provided in the inhabited locality as well as the dalit vasti / hamlet where it exists. (For electrification through renewable sources, a distribution transformer may not be necessary), (ii) Electricity is provided to public places like schools, panchayat offices, health centers, dispensaries, community centers, etc. and (iii) The number of households electrified should be at least 10 per cent of the total number of households in the village.
(Definition as per the Rural Electrification Policy- 2006 of Ministry of Power, Govt. of India)
Vehicle Productivity : Average kilometers covered per day per vehicle.
Crew Productivity: Per day average duty in kilometers performed by drivers and conductors.
Percentage Load Factor: Actual passenger earning X 100
Expected passenger earning
Cargo Berth : A designated location where a vessel may be moored, usually for the purposes of loading and unloading cargo’s.

Economic Survey of Maharashtra 2015-16
214CWSN : Children With Special Needs refers to all those children who are challenged with various problems such as vision, hearing, movement, learning, cerebral palsy or mental retardation.
Variables used in Computing Education Development Index (EDI)
Component Indicator Access Density of schools per 10 sq km
Availability of schools per 1000 child population
Ratio of primary to upper primary schools/sections
Infrastructure Percentage of schools with student-classroom ratio: Primary > 30 & upper primary > 35
Percentage of schools with 1:1 classroom-teacher ratio
Percentage of schools with drinking water facility
Percentage of schools with boy's toilet
Percentage of schools with girl’s toilet
Percentage of schools required and have Ramp
Percentage of schools with kitchen-shed (Government & aided schools)
Teachers Percentage of schools with female teachers (in schools with 2 and more teachers)
Percentage of schools with Pupil-Teachers ratio: Primary > 30 & upper primary > 35
Percentage of single- teacher schools
Teachers without professional qualification
Outcomes Average number of instructional days
Average working hour for teachers
Percentage change in enrolment in Government schools over the previous year.
Gross enrolment ratio
Participation of Scheduled Castes children: Percentage SC population (2011 Census)- Percentage SC enrolment
Participation of Scheduled Tribes children: Percentage ST Population (2011 Census)- Percentage ST enrolment
Participation of Muslim children: Percentage Muslim Population (2001 Census)- Percentage Muslim enrolment
Ratio of girl's enrolment to boy's enrolment
Drop-out rate
Transition rate from primary to upper primary level
Crude Birth Rate (CBR) : It is the total number of live births during the year per 1,000 persons.
Crude Death Rate (CDR) : It is the total number of deaths during the year per 1,000 persons.
Infant Mortality Rate (IMR) : It is defined as the number of deaths of infants (one year of age or younger ) per 1,000 live births.
Neo-natal Mortality Rate (NMR) : It is the number of children dying under 28 days of age divided by the number of live births in that year.
Maternal Death : It is the death of a woman during or shortly after a pregnancy.
Maternal Mortality Ratio (MMR) : It is the ratio of the number of maternal deaths per 100,000 live births. The MMR is used as a measure of the quality of a health care system.
Total Fertility Rate : It is defined as the average number of children that would be born alive to a woman during her life time.

215
Economic Survey of Maharashtra 2014-15
Main Workers: Main workers are those who worked for 6 months or more in the year preceding census.
Marginal Workers : Marginal workers are those who worked less than 6 months in the year preceding census.
Consumer goods : Items purchased by consumers for personal and household use.
Intermediate goods : Goods used as inputs in the production of other goods.
Capital goods : Goods such as machinery, used in production of commodities.
Methodology for Construction of State and District HDI (SHDR-2012) :
The dimension indices for Health, Education and Income are calculated using following formula. Actual value-Minimum value Ix= Dimension Index of 'X' =
Maximum value-Minimum value
Education index has been calculated by allocating 2/3rd weight to literacy and 1/3rd weight to GER. An aggregate HDI for a given district has been calculated as a simple arithmetic mean of the normalised scores for these dimensions. Average Annual Drop-out Rate : Average of grade-specific drop-out rates in Primary Grades and is calculated by considering grade-wise enrolment in 2013-14 and 2014-15 and grade-specific number of repeaters in 2014-15as per U-DISE.
* * * * *

Selected Socio-economic indicators of States in India

Economic Survey of Maharashtra 2015-16
218
C. SELECTED SOCIO-ECONOMIC INDICATORS OF STATES IN INDIA
State Geographical
area (lakh sq.km)
Population (lakh)
Density of population (per sq.km)
Percentage of urban
population to total
population
Percentage of State
population to all India
population
Decennial growth rate of
population (per cent)
Sex ratio
Child sex ratio (Age group 0-6
years)
Total Households
(lakh)
Reference Year or
Date (2011) (2011) (2011) (2011) (2011) (2001-11) (2011) (2011) (2011)
(1) (2) (3) (4) (5) (6) (7) (8) (9) (10)
Andhra Pradesh 2.75 845.81 308 33.36 7.00 10.98 993 939 210.23
Telangana^ -- -- -- -- -- -- -- -- --
Arunachal Pradesh 0.84 13.84 17 22.94 0.11 26.03 938 972 2.71
Assam 0.78 312.06 398 14.10 2.58 17.07 958 962 64.06
Bihar 0.94 1,040.99 1,106 11.29 8.60 25.42 918 935 189.14
Jharkhand 0.80 329.88 414 24.05 2.72 22.42 949 948 62.55
Delhi 0.01 167.88 11,320 97.50 1.39 21.21 868 871 34.36
Goa 0.04 14.59 394 62.17 0.12 8.23 973 942 3.44
Gujarat 1.96 604.40 308 42.60 4.99 19.28 919 890 122.48
Haryana 0.44 253.51 573 34.88 2.09 19.90 879 834 48.58
Himachal Pradesh 0.56 68.65 123 10.03 0.57 12.94 972 909 14.83
Jammu & Kashmir 2.22 125.41 124 27.38 1.04 23.64 889 862 21.20
Karnataka 1.92 610.95 319 38.67 5.05 15.60 973 948 133.57
Kerala 0.39 334.06 860 47.70 2.76 4.91 1,084 964 78.54
Madhya Pradesh 3.08 726.27 236 27.63 6.00 20.35 931 918 150.93
Chhatisgarh 1.35 255.45 189 23.24 2.11 22.61 991 969 56.51
Maharashtra 3.08 1,123.74 365 45.22 9.28 16.00 929 894 244.22
Manipur 0.22 28.56 128 29.21 0.24 24.50 985 930 5.58
Meghalaya 0.22 29.67 132 20.07 0.25 27.95 989 970 5.48
Mizoram 0.21 10.97 52 52.11 0.09 23.48 976 970 2.23
Nagaland 0.17 19.79 119 28.86 0.16 -0.58 931 943 3.96
Odisha 1.56 419.74 270 16.69 3.47 14.05 979 941 96.38
Punjab 0.50 277.43 551 37.48 2.29 13.89 895 846 55.13
Rajasthan 3.42 685.48 200 24.87 5.66 21.31 928 888 127.11
Sikkim 0.07 6.11 86 25.15 0.05 12.89 890 957 1.29
Tamil Nadu 1.30 721.47 555 48.40 5.96 15.61 996 943 185.25
Tripura 0.10 36.74 350 26.17 0.30 14.84 960 957 8.56
Uttar Pradesh 2.41 1,998.12 829 22.27 16.50 20.23 912 902 334.48
Uttarakhand 0.53 100.86 189 30.23 0.83 18.81 963 890 20.57
West Bengal 0.89 912.76 1,028 31.87 7.54 13.84 950 956 203.80
India$ 32.87 12,108.55 382 31.14 100.00 17.70 943 919 2,495.02
$ Includes Union Territories ^ Included in Andhra Pradesh unless specifically mentioned

Economic Survey of Maharashtra 2015-16
219
SELECTED SOCIO-ECONOMIC INDICATORS OF STATES IN INDIA
N A Not Applicable
Female headed
households (lakh)
Number of cultivators (In lakh)
Per cent of households
having access to safe
drinking water
Percentage of scheduled caste and scheduled
tribe population to total
population
Percentage of disabled
population to total population
Percentage of slum population (All towns) to
urban population
Percentage of main workers
to total population
Percentage of agricultural
workers to total workers
Female workers
participation rate
(2011) (2011) (2011) (2011) (2011) (2011) (2011) (2011) (2011)
(11) (12) (13) (14) (15) (16) (17) (18) (19)
31.27 64.92 90.5 23.41 2.68 36.10 39.06 59.51 36.16
-- -- -- -- -- -- -- -- --
0.35 3.03 78.6 68.79 1.93 4.90 34.60 57.67 35.44
8.53 40.62 69.9 19.60 1.54 4.48 27.84 49.35 22.46
19.75 71.96 94.0 17.20 2.24 10.53 20.52 73.55 19.07
6.82 38.15 60.1 38.29 2.33 4.70 20.67 62.99 29.10
3.95 0.33 95.0 16.75 1.40 10.91 31.61 1.30 10.58
0.80 0.31 85.7 11.98 2.26 2.89 32.64 10.07 21.92
12.35 54.48 90.3 21.50 1.81 6.53 33.70 49.61 23.38
5.66 24.81 93.8 20.17 2.16 18.80 27.67 44.96 17.79
3.05 20.62 93.7 30.90 2.26 8.90 30.05 62.85 44.82
2.04 12.45 76.8 19.28 2.88 19.28 21.08 41.48 19.11
22.69 65.81 87.5 24.10 2.17 13.93 38.30 49.28 31.87
19.83 6.70 33.5 10.55 2.28 1.27 27.93 17.15 18.23
15.04 98.44 78.0 36.71 2.14 28.35 31.26 69.79 32.64
7.35 40.05 86.3 43.44 2.45 31.98 32.26 74.68 39.70
31.36 125.69 83.4 21.17 2.64 23.32 38.94 52.71 31.06
0.83 5.74 45.4 44.29 1.89 N.A. 33.26 52.81 39.88
1.27 4.95 44.7 86.73 1.49 9.64 31.06 58.45 32.67
0.37 2.30 60.4 94.54 1.38 13.74 37.83 55.76 36.16
0.53 5.38 53.8 86.48 1.50 14.42 37.46 61.66 44.74
12.02 41.04 75.3 39.98 2.96 22.28 25.51 61.82 27.16
7.96 19.35 97.6 31.94 2.36 14.04 30.46 35.59 13.91
11.77 136.19 78.1 31.31 2.28 12.13 30.72 62.10 35.12
0.17 1.17 85.3 38.43 2.98 20.43 37.73 46.53 39.57
29.65 42.48 92.5 21.11 1.64 16.61 38.73 42.13 31.80
1.21 2.96 67.5 49.59 1.75 14.54 29.32 44.20 23.57
40.07 190.58 95.1 21.27 2.08 14.02 22.34 59.25 16.75
3.93 15.80 92.2 21.66 1.84 16.00 28.46 51.23 26.68
26.15 51.17 92.2 29.32 2.21 22.06 28.14 44.04 18.08
327.83 1,188.09 85.5 25.27 2.21 17.37 29.94 54.61 25.51

Economic Survey of Maharashtra 2015-16
220
SELECTED SOCIO-ECONOMIC INDICATORS OF STATES IN INDIA
State
Basic Indicators of Human Development
Human Development
Index Literacy percentage ††
Life expectancy at birth (years)
Birth rate
Death rate
Infant mortality
rate @
Per capita income
at current prices* #
(`)
Male Female Total Male Female
Reference Year or Date (2011) (2011) (2011) (2016-20) (2016-20) (2013) (2013) (2013) (2014-15) (2011)
(1) (20) (21) (22) (23) (24) (25) (26) (27) (28) (29)
Andhra Pradesh 74.88 59.15 67.02 68.4 72.1 17.4 7.3 39 90,517 0.473
Telangana ^ -- -- -- -- -- -- -- -- 1,03,889 --
Arunachal Pradesh 72.55 57.70 65.38 N.A. N.A. 19.3 5.8 32 96,199 N.A.
Assam 77.85 66.27 72.19 65.6 66.8 22.4 7.8 54 49,480 0.444
Bihar 71.20 51.50 61.80 69.6 70.2 27.6 6.6 42 36,143 0.367
Jharkhand 76.84 55.42 66.41 68.5 68.0 24.6 6.8 37 52,147 0.376
Delhi 90.94 80.76 86.21 73.0 76.6 17.2 4.1 24 2,40,849 0.750
Goa 92.65 84.66 88.70 N.A. N.A. 13.0 6.6 9 NA 0.617
Gujarat 85.75 69.68 78.03 70.7 73.7 20.8 6.5 36 NA 0.527
Haryana 84.06 65.94 75.55 69.9 72.5 21.3 6.3 41 1,47,076 0.552
Himachal Pradesh 89.53 75.93 82.80 71.6 75.3 16.0 6.7 35 1,04,943 0.652
Jammu & Kashmir 76.75 56.43 67.16 68.0 71.3 17.5 5.3 37 58,888 0.529
Karnataka 82.47 68.08 75.36 69.0 73.5 18.3 7.0 31 1,01,594 0.519
Kerala 96.11 92.07 94.00 74.2 78.1 14.7 6.9 12 NA 0.790
Madhya Pradesh 78.73 59.24 69.32 66.5 67.3 26.3 8.0 54 59,770 0.375
Chhatisgarh 80.27 60.24 70.28 65.0 68.0 24.4 7.9 46 64,442 0.358
Maharashtra 88.38 75.87 82.34 69.9 73.7 16.5 6.2 24 1,29,235 0.572
Manipur 82.27 72.37 79.21 N.A. N.A. 14.7 4.0 10 48,330 N.A.
Meghalaya 75.95 72.89 74.43 N.A. N.A. 23.9 7.6 47 69,516 N.A.
Mizoram 93.35 89.27 91.33 N.A. N.A. 16.1 4.3 35 NA N.A.
Nagaland 82.75 76.11 79.55 N.A. N.A. 15.4 3.1 18 85,544 N.A.
Odisha 81.59 64.01 72.87 66.3 69.6 19.6 8.4 51 59,229 0.362
Punjab 80.44 70.73 75.84 70.7 73.8 15.7 6.7 26 99,578 0.605
Rajasthan 79.19 52.12 66.11 68.6 71.9 25.6 6.5 47 72,156 0.434
Sikkim 86.55 75.61 81.42 N.A. N.A. 17.1 5.2 22 NA N.A.
Tamil Nadu 86.77 73.44 80.09 69.6 73.0 15.6 7.3 21 1,28,366 0.570
Tripura 91.53 82.73 87.22 N.A. N.A. 13.7 4.7 26 NA N.A.
Uttar Pradesh 77.28 57.18 67.68 67.5 69.2 27.2 7.7 50 40,373 0.380
Uttarakhand 87.40 70.01 78.82 67.5 71.0 18.2 6.1 32 1,15,632 0.490
West Bengal 81.69 70.54 76.26 70.2 73.3 16.0 6.4 31 78,903 0.492
India$ 80.88 64.63 72.98 68.8 71.1 21.4 7.0 40 86,879 0.467
$ Includes Union Territories ^ Included in Andhra Pradesh unless specifically mentioned * Provisional N.A. Not Available †† The literacy rates related to the population aged seven years and above @ Infant mortality rates for smaller States and Union Territories are based on three years period 2011-13 # All States Figures are as per base year 2004-05 while India’s figure are as per base year 2011-12

Economic Survey of Maharashtra 2015-16
221
SELECTED SOCIO-ECONOMIC INDICATORS OF STATES IN INDIA
Financial Indicators
Per capita revenue
receipts of the State (`)
Share of State’s own
Tax Revenue in Total revenue receipts
(per cent)
Per capita share in
central taxes (`)
Per capita grants from
centre (`)
Share of development
expenditure in total expenditure
(per cent)
Percentage of plan
expenditure to Total
expenditure
Percentage of annual
plan outlay to GSDP
Percentage of revenue
deficit(+)/ surplus (-) to
GSDP
Percentage of fiscal
deficit(+)/ surplus(-) to
GSDP
Percentage of outstanding liabilities to
GSDP
(2014-15) (2014-15) (2014-15) (2014-15) (2014-15) (2014-15) (2014-15) (2014-15) (2014-15) (31-3-2015)
(30) (31) (32) (33) (34) (35) (36) (37) (38) (39)
19,704 21.7 3,043 5,785 67.9 24.1 N.A. 1.2 2.3 23.2
-- 44.2 -- -- 75.4 48.7 N.A. -0.1 4.0 --
67,904 6.2 9,154 49,482 61.5 56.6 31.6 -10.3 3.5 28.2
16,513 21.5 4,420 7,191 67.3 41.2 9.8 -2.2 2.2 19.1
9,969 25.2 4,085 3,073 70.9 49.3 13.7 -2.5 2.8 24.3
13,156 27.2 3,295 4,781 72.1 53.1 11.0 -2.0 2.5 22.7
17,819 86.7 N.A. 1,798 72.0 48.1 4.5 -2.0 -0.4 6.1
41,637 50.4 5,234 3,175 70.9 42.5 N.A. N.A. N.A. N.A.
16,681 61.2 1,884 3,049 68.9 48.8 N.A. N.A. N.A. N.A.
17,717 63.7 1,490 2,764 68.0 35.9 5.0 1.2 2.6 20.6
23,553 32.3 4,796 9,169 59.2 18.7 2.7 3.4 5.6 38.4
32,056 19.1 4,243 18,776 58.8 27.2 10.4 -7.7 2.7 52.2
18,038 62.9 2,690 3,271 69.2 42.4 8.0 Neg. 2.9 22.3
18,322 65.5 2,646 1,885 52.1 20.1 N.A. N.A. N.A. N.A.
13,567 37.7 3,629 3,941 71.6 44.4 10.1 -0.9 2.6 20.9
19,137 36.8 3,887 5,767 80.7 63.5 15.6 -1.2 2.7 15.2
15,273 65.8 1,716 2,368 66.1 30.6 3.8 0.2 1.8 20.1
34,614 7.0 6,873 24,179 59.7 46.7 29.7 -7.3 3.4 44.9
40,769 10.8 5,812 28,041 80.3 62.4 19.5 -4.8 2.1 25.7
56,214 4.6 9,855 41,107 70.5 47.1 N.A. N.A. N.A. N.A.
40,717 4.1 5,134 33,045 59.1 43.2 14.2 -8.1 2.9 36.8
15,988 29.6 4,355 4,993 71.4 49.2 11.8 -1.4 3.1 20.0
15,620 63.4 1,879 2,864 55.2 21.5 3.1 1.2 3.0 32.3
14,826 38.3 3,179 3,881 75.1 43.5 9.4 -0.1 3.5 25.1
95,918 8.1 15,010 55,900 64.4 52.6 N.A. N.A. N.A. N.A.
18,494 72.1 2,760 1,228 59.8 33.4 5.0 Neg. 2.6 20.0
28,643 11.8 4,871 19,622 66.7 51.7 N.A. N.A. N.A. N.A.
10,616 35.8 3,587 2,283 62.6 35.9 8.4 -3.0 2.9 30.1
23,430 32.8 3,958 10,063 65.8 39.5 7.0 -0.5 2.9 24.8
11,471 42.9 3,009 3,331 58.7 33.2 6.3 -- 1.9 36.7
-- -- -- -- -- -- -- -- -- -- N.A. Not Available Neg. Negligible

Economic Survey of Maharashtra 2015-16
222
SELECTED SOCIO-ECONOMIC INDICATORS OF STATES IN INDIA
State
Scheduled Commercial Banks Yield per hectare (kg.)
Number of
banking offices
per lakh population
@
Per capita deposits@
(`)
Per capita credit@
(`)
Credit –Deposit Ratio
(per cent)
Share of priority sector
advances in total
credit of scheduled
commercial banks
(per cent)
All cereals
All pulses
All foodgrains
All oilseeds
Cotton (lint)
Sugarcane (Tonne)
Reference Year or
Date (31-03-2015) (31-03-2015) (31-03-2015) (31-03-2015) (31-03-2015) Triennial average (2010-11 to 2012-13)
(1) (40) (41) (42) (43) (44) (45) (46) (47) (48) (49) (50)
Andhra Pradesh 12.1 58,752 60,857 103.6 41.9 3,259 715 2,573 787 481 80
Telangana ^ -- -- -- -- -- -- -- -- -- -- --
Arunachal Pradesh 10.3 61,655 16,558 26.9 37.7 1,764 1,094 1,734 948 -- 19
Assam 6.4 30,365 11,198 36.9 56.2 1,871 575 1,810 581 Neg. 37
Bihar 5.9 21,110 7,021 33.3 68.2 2,071 969 1,981 1,071 -- 51
Jharkhand 8.1 42,824 12,409 29.0 54.3 1,873 899 1,644 697 -- 69
Delhi 15.7 4,26,742 4,41,968 103.6 12.1 3,602 1,882 3,581 1,272 -- --
Goa 33.2 2,64,337 70,552 26.7 48.9 2,569 931 2,299 2,590 -- 53
Gujarat 11.2 76,969 56,125 72.9 40.5 2,152 831 1,896 1,468 654 69
Haryana 15.8 82,258 61,115 74.3 51.2 3,812 802 3,698 1,654 667 73
Himachal Pradesh 20.4 85,050 29,706 34.9 65.5 1,877 1,193 1,849 536 Neg. 20
Jammu & Kashmir 12.8 59,987 25,305 42.2 62.2 1,800 541 1,764 812 -- 2
Karnataka 14.6 1,02,628 69,880 68.1 44.8 2,103 536 1,601 698 394 89
Kerala 16.9 90,212 59,103 65.5 57.2 2,576 851 2,547 1,102 Neg. 97
Madhya Pradesh 7.6 36,207 19,991 55.2 64.1 1,851 810 1,450 1,149 540 41
Chhatisgarh 8.5 38,809 23,879 61.5 39.9 1,604 646 1,438 653 Neg. 3
Maharashtra 9.5 1,79,830 1,66,542 92.6 22.6 1,304 722 1,126 1,318 326 81
Manipur 5.3 22,379 7,597 33.9 55.0 2,364 925 2,189 763 -- 58
Meghalaya 10.6 60,709 15,734 25.9 37.4 1,921 922 1,891 722 Neg. 2
Mizoram 13.8 50,626 19,057 37.6 64.0 1,488 1,328 1,461 1,083 Neg. 5
Nagaland 6.1 29,507 9,654 32.7 32.9 2,043 1,082 1,929 1,043 Neg. 43
Odisha 10.2 44,901 18,949 42.2 44.7 1,624 490 1,442 660 562 65
Punjab 20.1 90,783 68,099 75.0 56.2 4,349 841 4,330 1,349 693 67
Rajasthan 8.7 32,717 27,998 85.6 55.0 1,669 611 1,359 1,247 489 70
Sikkim 18.9 89,312 22,884 25.6 62.2 1,574 906 1,494 845 -- --
Tamil Nadu 13.7 79,002 94,397 119.5 41.3 3,096 451 2,562 2,220 622 106
Tripura 9.8 40,855 13,760 33.7 74.8 2,699 703 2,640 663 Neg. 50
Uttar Pradesh 7.1 31,339 14,084 44.9 53.1 2,687 937 2,475 853 Neg. 59
Uttarakhand 17.6 84,437 29,146 34.5 74.4 1,986 861 1,916 1,110 -- 60
West Bengal 7.6 59,651 34,633 58.1 32.4 2,716 852 2,655 1,068 Neg. 94
India$ 10.0 70,900 54,870 77.4 34.7 2,373 726 2,046 1,165 492 70 $ Includes Union Territories ^ Included in Andhra Pradesh unless specifically mentioned @ Projected Population as on 1st March, 2015 Neg. Negligible

Economic Survey of Maharashtra 2015-16
223
SELECTED SOCIO-ECONOMIC INDICATORS OF STATES IN INDIA
N.A. Not Available + All Lands, more than one ha. in area, with a tree canopy density of more than 10 per cent irrespective of ownership and legal status, it also includes orchards, bamboo and palm. ++ It comprises of tree patches outside the recorded forest area exclusive of forest cover and less than the minimum mappable area (1 ha)
Per capita foodgrains production
(kg.)
Consumption of fertilizers
per hectare cropped area (kg.)
Percentage of gross
irrigated area to
gross cropped area
Net area sown per cultivator
(ha)
Percentage of net area sown to total geographical area
Cropping intensity
Percentage of forest cover +
to total geographical area
Percentage of tree cover ++ to total
geographical area
(2012-13) (2012-13) (2012-13) (2012-13) (2012-13) (2012-13) (2015) (2015)
(51) (52) (53) (54) (55) (56) (57) (58)
217.2 201.3 45.9 1.7 40.4 122.8 15.3 2.5
-- -- -- -- -- -- 18.8 2.2
292.4 2.0 19.9 0.7 2.6 131.7 80.3 0.9
169.4 65.7 3.8 0.7 35.8 149.3 35.2 2.1
159.7 196.3 68.5 0.8 57.4 144.0 7.7 2.3
141.7 119.3 14.2 0.4 17.6 117.9 29.5 3.5
4.7 24.6 67.4 0.7 14.9 220.2 12.7 7.5
71.4 33.1 22.4 4.2 35.6 123.2 60.1 8.8
117.1 106.5 46.9 1.9 52.5 122.3 7.5 4.0
621.7 211.8 89.0 1.4 79.5 181.5 3.6 3.1
214.8 50.4 20.6 0.3 9.8 174.2 26.4 1.4
153.3 94.4 41.9 0.6 3.4 156.0 10.3 3.8
179.9 130.3 34.1 1.5 51.1 120.0 19.0 2.9
14.6 106.9 17.7 3.1 52.7 126.5 49.5 7.6
320.1 80.8 38.8 1.6 49.8 150.7 25.1 2.5
308.5 105.7 30.3 1.2 34.6 121.8 41.1 2.7
95.4 113.0 N.A. 1.4 56.4 126.1 16.5 3.1
135.0 35.1 15.7 0.7 13.8 100.0 76.1 1.1
99.3 14.3 36.8 0.6 12.7 119.0 76.8 3.2
40.8 15.2 12.6 0.5 5.5 100.0 88.9 2.5
262.3 4.4 18.9 0.7 22.9 128.5 78.2 2.3
193.9 96.7 29.5 1.1 28.2 115.6 32.3 2.6
1013.6 250.6 98.4 2.1 82.4 189.6 3.5 3.1
264.2 56.1 39.5 1.3 51.1 137.0 4.7 2.4
170.1 0.0 13.5 0.7 10.9 185.7 47.3 0.5
82.1 184.2 58.2 1.1 34.9 113.1 20.3 3.5
196.9 69.1 34.9 0.9 24.4 144.1 74.5 2.2
246.0 180.1 78.2 0.9 68.8 155.9 6.0 2.9
179.8 135.6 49.3 0.4 13.2 159.2 45.3 1.4
182.2 161.2 63.1 1.0 58.6 185.9 19.0 2.4
211.2 131.4 47.6 1.2 42.6 138.9 21.3 2.8

Economic Survey of Maharashtra 2015-16
224
SELECTED SOCIO-ECONOMIC INDICATORS OF STATES IN INDIA
State
Annual Survey of Industries* Percentage of employed persons#
Unemployment Rate @
Labour force participation Rate# Percentage
of women employment
to total employment in organised
sector
Factories (no.)
Workers ('000)
Gross output Per worker
(`'000)
Net value added Per
worker (`'000)
Rural Urban Rural Urban Rural Urban
Reference Year or
Date (2013-14) (2013-14) (2013-14) (2013-14) (2011-12) (2011-12) (2011-12) (2011-12) (2011-12) (2011-12) (31-3-2012)
(1) (59) (60) (61) (62) (63) (64) (65) (66) (67) (68) (69)
Andhra Pradesh 15,719 415 6,328 449 52 36 1.2 4.3 52.8 38.0 21.2
Telangana ^ 14,110 629 2,720 478 -- -- -- -- -- -- --
Arunachal Pradesh N.A. N.A. N.A. N.A. 38 30 1.7 4.8 38.9 31.8 N.A.
Assam 3,518 158 3,654 508 34 33 4.5 5.6 35.9 34.8 33.0
Bihar 3,419 96 5,753 536 28 25 3.2 5.6 28.4 26.7 5.1
Jharkhand 2,688 130 8,306 1,568 37 28 2.1 5.1 37.8 30.0 7.6
Delhi 3,918 75 7,840 1,047 34 34 7.8 3.5 37.1 34.9 15.9
Goa 618 40 8,529 1,928 38 34 5.1 4.6 39.9 35.3 16.8
Gujarat 22,876 1,050 11,723 1,218 45 38 0.3 0.8 44.8 38.7 14.5
Haryana 6,117 468 6,331 789 36 32 2.4 4.2 36.5 33.1 15.6
Himachal Pradesh 2,806 133 7,549 1,763 53 42 1.0 4.0 53.8 43.3 19.3
Jammu & Kashmir 943 53 4,419 785 41 34 2.5 7.0 41.5 36.2 10.7
Karnataka 12,107 706 6,299 784 45 38 0.9 2.9 45.4 38.8 32.9
Kerala 7,132 290 4,518 464 38 36 6.8 6.1 41.0 38.6 41.2
Madhya Pradesh 4,047 239 7,056 754 41 33 0.4 2.6 40.7 33.4 14.1
Chhatisgarh 2,534 131 8,089 1,622 49 38 0.8 4.3 49.0 39.3 14.2
Maharashtra 29,123 1,312 8,127 1,528 49 37 0.7 2.3 49.0 37.4 19.7
Manipur 145 5 757 104 39 32 2.6 7.1 40.0 34.7 24.1
Meghalaya 108 11 3,468 431 46 34 0.4 2.8 46.1 35.0 31.1
Mizoram N.A. N.A. N.A. N.A. 50 37 1.8 5.0 50.5 38.6 25.5
Nagaland 134 3 1,202 231 41 29 15.1 23.8 48.3 37.6 24.1
Odisha 2,714 207 5,918 1,032 42 38 2.2 3.5 42.7 39.5 16.1
Punjab 12,278 486 3,839 496 41 37 1.9 2.8 41.4 37.9 19.2
Rajasthan 8,820 356 6,109 832 42 33 0.7 3.1 42.7 33.6 17.7
Sikkim 66 10 6,945 4,021 53 45 1.0 2.3 53.9 46.3 N.A.
Tamil Nadu 37,378 1,641 4,135 537 49 39 2.0 2.7 49.5 40.3 34.9
Tripura 552 27 496 119 40 32 10.5 25.2 44.9 42.7 20.1
Uttar Pradesh 14,463 702 5,916 795 34 32 0.9 4.1 34.1 33.1 12.6
Uttarakhand 2,936 312 5,679 1,213 38 31 2.5 5.3 39.0 32.2 15.0
West Bengal 8,857 522 5,292 430 39 40 2.7 4.8 40.0 41.9 13.9
India$ 2,24,574 10,428 6,302 872 40 36 1.7 3.4 40.6 36.7 20.5
$ Includes Union Territories ^ Included in Andhra Pradesh unless specifically mentioned * Provisional N.A. Not Available # Based on National Sample Survey, 68th Round (2011-12),Central Sample. Percentage with respect to total population {usual status [principal +subsidiary] (all)}
@ Based on National Sample Survey , 68th Round (2011-12), Central Sample. Percentage with respect to labour force {usual status [principal +subsidiary] (all)}

Economic Survey of Maharashtra 2015-16
225
SELECTED SOCIO-ECONOMIC INDICATORS OF STATES IN INDIA
Economic Census* Installed
capacity of electricity per lakh
population (MW)
Per capita generation of
electricity (kwh.)
Annual per capita ultimate consumption of electricity (kwh.)
Percentage of rural!
electrification
No. of establish- ments per
lakh population
Employment in
establish- ment per
lakh population
Growth Rate
(%) Total
Domestic
Industrial
Agriculture
Establish-ment
Employ-ment
6th Economic
Census
6th Economic
Census
(5th Economic Census -6th
Economic Census ) (31-03-2014) (2013-14) (2013-14) (2013-14) (2013-14) (2013-14) (2013-14)
(70) (71) (72) (73) (74) (75) (76) (77) (78) (79) (80)
7,489 16,621 60.84 31.23 16.69 625.57 841.44 194.27 259.66 252.22 100.0
-- -- -- -- -- -- -- -- -- -- --
2,645 7,018 34.09 17.73 9.33 227.68 375.41 109.72 27.08 0.05 68.0
6,261 11,968 100.17 78.84 1.63 61.53 151.01 61.54 45.05 1.14 85.3
1,648 2,876 41.66 39.15 0.32 3.25 78.98 32.47 18.16 3.18 88.3
1,937 4,315 32.38 35.06 6.84 247.21 557.68 127.59 347.86 2.84 92.5
5,320 17,780 18.35 -12.22 10.28 221.58 1208.10 589.80 153.51 1.47 100.0
6,673 20,161 34.05 38.95 2.51 127.15 1623.79 425.26 926.42 11.05 100.0
6,603 14,996 67.07 56.47 39.16 1331.11 1095.99 184.96 572.26 241.39 100.0
4,621 12,746 42.34 53.44 22.66 973.69 1097.04 236.82 345.30 321.96 100.0
6,044 14,009 60.98 68.81 39.85 1586.70 1100.65 255.36 647.66 6.85 99.7
4,046 8,646 59.87 66.40 9.15 352.14 475.57 200.80 32.45 23.20 97.4
4,713 11,245 14.97 15.24 20.58 846.45 880.88 159.03 263.33 296.45 99.9
10,105 20,714 21.33 26.49 7.11 249.88 512.50 251.00 134.81 9.04 100.0
2,884 5,952 23.63 17.92 12.56 399.36 489.29 121.59 109.43 157.80 99.0
3,029 7,374 24.19 33.42 32.90 1132.79 589.29 163.23 230.33 99.29 94.0
5,451 12,792 47.52 36.54 25.47# 788.99$ 888.87@ 204.37@ 336.16@ 187.50@ 100.0
7,622 13,582 109.37 83.29 2.01 6.05 157.92 84.89 14.05 0.66 80.2
3,598 9,528 31.34 41.11 11.62 329.29 489.45 162.50 204.79 0.07 85.1
4,943 10,434 16.58 37.11 8.50 98.76 293.97 194.32 6.87 0.06 86.9
3,081 7,843 78.74 30.34 1.36 35.85 170.04 106.90 10.34 0.02 93.4
4,964 10,435 15.43 26.39 14.47 479.18 345.93 112.66 156.67 4.12 91.8
5,451 12,839 42.47 40.69 22.87 1051.60 1320.10 363.59 419.69 359.35 100.0
4,241 8,979 51.20 53.55 16.69 638.25 597.84 131.13 139.62 237.69 98.8
6,183 15,253 102.92 77.14 24.66 693.07 642.40 234.30 245.58 0.00 100.0
7,003 14,983 16.11 13.22 24.78 773.39 1047.77 294.91 378.38 179.49 100.0
6,475 11,002 28.28 21.67 5.09 207.54 193.64 104.66 9.15 7.92 97.0
3,354 6,882 67.80 75.26 4.32 224.92 282.06 103.31 74.39 48.67 98.4
3,989 10,480 26.08 57.10 17.97 520.53 930.83 256.06 493.95 33.36 99.5
6,466 12,648 41.26 20.35 8.47 359.97 399.52 122.97 178.65 12.92 99.9
4,829 10,547 41.73 34.35 19.80 832.84 609.18 161.96 212.53 123.51 96.3 * Provisional #MAHAGENCO, Tata power, Reliance Infrastructure, MAHADISCOM ,MEDA, CEA/WRPC $ MAHAGENCO, Tata power, Reliance Infrastructure, MAHADISCOM,CEA/WRPC @ MAHADISCOM, Tata power, Reliance Infrastructure, BEST ! Number of Villages taken as per Census 2011

Economic Survey of Maharashtra 2015-16
226
SELECTED SOCIO-ECONOMIC INDICATORS OF STATES IN INDIA
State Motor vehicles
per lakh population *
(no.)
Total road length per hundred sq. km. of area*
(km)
Railway route length per
hundred sq. km. of area*
(km)
Teledensity State’s share
in total value of mineral
production
Enrolment in primary
and secondary schools per thousand
population Wireline Wireless
Reference Year or Date (31-3-2013) (31-3-2013) (2014-15) (30-9-2015) (30-9-2015) (2014-15) (2014-15)
(1) (81) (82) (83) (84) (85) (86) (87)
Andhra Pradesh 14,971 95 2.24 2.07 83.19 1.12 151
Telangana ^ -- -- 1.50 -- -- 15.00 --
Arunachal Pradesh 10,913@ 34 0.01 N.A. N.A. 0.08 292
Assam 6,018 367 3.15 0.50 55.77 5.92 213
Bihar 3,475 209 3.88 0.25 53.77 0.01 246
Jharkhand 10,358 46 2.88 N.A. N.A. 15.94 229
Delhi 46,373 N.A. 12.36 15.00 225.11 0.00 178
Goa 64,311 313 4.83 N.A. N.A. 0.00 128
Gujarat 26,095 84 2.68 2.33 93.00 6.39 176
Haryana 26,034 96 3.69 1.40 81.42 0.00 179
Himachal Pradesh 12,761 96 0.53 2.58 118.68 0.11 175
Jammu & Kashmir 8,141 20 0.13 1.08 79.00 0.00 179
Karnataka 19,746 159 1.84 3.68 96.93 3.55 164
Kerala 23,523 476 2.70 7.00 92.11 0.04 146
Madhya Pradesh 12,062 74 1.62 1.03 60.82 7.89 210
Chhatisgarh 13,455 66 0.88 N.A. N.A. 10.67 218
Maharashtra 19,122 192 1.98 4.21 90.62 3.88 168
Manipur 10,365 93 0.01 N.A. N.A. 0.00 232
Meghalaya 7,415 55 0.04 N.A. N.A. 2.22 314
Mizoram 11,028 52 0.01 N.A. N.A. 0.00 244
Nagaland 15,719 231 0.08 N.A. N.A. 0.00 174
Odisha 10,044 178 1.62 0.75 68.77 16.20 181
Punjab 22,575@ 195 4.51 3.51 101.11 0.00 170
Rajasthan 14,693 66 1.72 1.10 78.32 13.76 200
Sikkim 5,896 93 -- N.A. N.A. 0.00 214
Tamil Nadu 26,657 183 3.10 3.85 111.91 3.56 167
Tripura 6,669 296 1.44 N.A. N.A. 0.48 192
Uttar Pradesh 8,532 181 3.71 0.42 60.95 1.18 204
Uttarakhand 14,475 110 0.65 N.A. N.A. 0.01 202
West Bengal 6,695 349 4.59 1.42 78.18 2.50 169
India$ 14,539 131 2.03 2.06 78.93 100.00 190 $ Includes Union Territories ^ Included in Andhra Pradesh unless specifically mentioned * Provisional N.A. Not Available # Data pertains to year 2012

Economic Survey of Maharashtra 2015-16
227
SELECTED SOCIO-ECONOMIC INDICATORS OF STATES IN INDIA
Gross Enrolment Ratio Ratio of Girls to Boys Pupil -Teacher Ratio
Elementary Level (Classes I –VIII) Elementary
Level (Classes I-VIII)
Secondary Level
(Classes IX-X)
Higher
Secondary Level
(Classes XI-XII)
Primary Level
(Classes I-V)
Upper Primary
level (Classes VI-
VIII)
Secondary Level
(Classes IX-X)
Higher
secondary Level
(Classes XI-XII) Boys Girls Total
(2014-15) (2014-15) (2014-15) (2014-15) (2014-15) (2014-15) (2014-15) (2014-15) (2014-15) (2014-15)
(88) (89) (90) (91) (92) (93) (94) (95) (96) (97)
84.89 84.86 84.88 0.94 0.96 0.93 21 15 19 35
98.36 99.12 98.73 0.95 0.99 1.00 23 16 19 44
126.01 126.66 126.33 0.98 0.94 0.97 13 8 22 35
105.26 111.51 108.31 1.01 1.09 0.95 24 14 13 20
95.45 105.37 100.14 0.99 0.96 0.82 35 23 59 61
103.72 107.56 105.58 0.97 0.97 0.88 29 20 61 68
112.47 121.34 116.43 0.87 0.86 0.91 24 18 30 25
101.59 103.60 102.54 0.92 0.86 1.02 21 16 13 19
96.05 97.58 96.75 0.86 0.70 0.77 20 13 34 31
94.41 100.29 97.00 0.83 0.78 0.77 22 14 14 18
99.93 101.79 100.81 0.91 0.86 0.90 12 10 19 15
79.35 81.48 80.35 0.91 0.87 0.83 9 6 16 32
98.34 98.86 98.59 0.94 0.92 1.05 18 13 16 28
95.71 95.90 95.80 0.95 0.94 1.08 17 14 17 20
98.49 100.55 99.46 0.92 0.87 0.80 22 19 40 40
102.40 102.39 102.40 0.96 1.02 0.95 21 18 33 26
98.60 99.24 98.90 0.88 0.84 0.85 25 17 23 43
126.88 131.78 129.26 0.98 0.97 0.93 12 8 13 20
129.00 137.68 133.26 1.03 1.14 1.23 21 13 12 21
125.70 122.17 123.97 0.93 0.99 0.99 14 5 9 15
97.67 101.74 99.62 0.96 1.01 0.94 11 7 16 22
100.72 98.75 99.76 0.94 0.98 0.86 19 14 20 20
99.98 104.44 101.94 0.82 0.77 0.80 19 12 17 28
95.36 92.62 94.09 0.85 0.72 0.66 17 10 23 39
122.87 121.70 122.30 0.96 1.12 1.23 6 6 19 20
99.01 100.46 99.71 0.95 0.95 1.13 18 15 21 26
112.58 114.41 113.47 0.96 0.98 0.80 10 8 29 10
83.14 93.18 87.79 0.97 0.89 0.90 39 33 57 106
94.08 95.69 94.84 0.90 0.92 0.95 19 17 18 32
99.68 105.77 102.64 1.00 1.16 0.97 25 28 37 56
94.78 99.24 96.89 0.94 0.90 0.89 24 17 27 38

Economic Survey of Maharashtra 2015-16
228
SELECTED SOCIO-ECONOMIC INDICATORS OF STATES IN INDIA
State
Average Annual Drop- Out Rate Composite Educational
Development Index at
primary and upper
primary level
Average number
of Teachers per school
Percentage of female Teachers
Primary Level
(Classes I-V)
Upper Primary Level
( Classes VI-VIII) Secondary Level (Classes IX-X)
Boys Girls Boys Girls Boys Girls
Reference Year or Date (2013-14) (2013-14) (2013-14) (2013-14) (2013-14) (2013-14) (2013-14) (2014-15) (2014-15)
(1) (98) (99) (100) (101) (102) (103) (104) (105) (106)
Andhra Pradesh 4.31 4.39 3.46 4.12 11.95 13.37 0.603 4.9 46.02
Telangana ^ 6.04 5.57 4.63 4.79 17.99 16.86 -- 5.6 49.46
Arunachal Pradesh 11.54 10.22 4.44 6.74 16.08 12.75 0.548 5.4 40.87
Assam 8.19 6.68 7.60 6.54 28.59 32.10 0.524 4.6 34.26
Bihar 2.38 1.79 2.77 3.19 24.67 26.05 0.491 5.7 34.99
Jharkhand 6.89 5.91 7.19 7.65 22.99 23.32 0.505 3.7 32.99
Delhi -- -- 3.13 2.37 10.80 6.64 0.705 23.1 72.53
Goa 0.08 0.33 -- -- 11.68 7.19 0.601 7.5 77.43
Gujarat 0.50 1.06 3.52 8.04 22.85 19.81 0.696 7.3 51.31
Haryana 0.22 0.63 1.97 3.25 11.92 13.27 0.646 9.2 54.49
Himachal Pradesh 0.57 0.34 0.60 0.98 9.32 8.83 0.714 5.2 46.65
Jammu & Kashmir 5.53 5.37 3.86 4.80 14.70 16.14 0.570 5.4 44.44
Karnataka 2.42 2.21 2.31 2.73 28.49 26.57 0.710 5.1 53.40
Kerala -- -- -- -- 17.30 11.40 0.696 15.0 76.21
Madhya Pradesh 9.91 10.40 9.88 13.57 25.21 27.91 0.519 3.7 41.85
Chhatisgarh 1.45 1.38 4.09 3.51 24.10 22.72 0.571 4.0 42.23
Maharashtra 0.51 0.59 -- 1.50 15.04 13.78 0.650 6.8 43.95
Manipur 17.27 18.74 7.48 6.54 12.35 15.28 0.628 7.8 48.59
Meghalaya 11.30 9.39 6.34 7.28 25.63 23.99 0.541 3.3 53.54
Mizoram 12.57 13.38 6.61 5.39 20.00 17.37 0.597 6.1 44.05
Nagaland 19.09 19.74 18.08 17.63 34.14 36.08 0.586 9.8 49.59
Odisha 2.83 3.05 3.11 2.48 49.39 49.57 0.599 4.4 42.18
Punjab 1.35 1.21 2.52 3.27 8.93 8.71 0.693 8.4 73.11
Rajasthan 7.76 9.12 4.49 7.95 17.85 20.06 0.592 5.9 33.85
Sikkim 5.55 3.49 6.35 3.98 13.74 12.14 0.722 10.7 53.32
Tamil Nadu 0.53 0.39 4.38 4.67 16.13 7.99 0.701 9.5 73.54
Tripura 3.63 3.52 3.21 2.20 24.51 25.70 0.577 9.8 28.91
Uttar Pradesh 7.91 6.21 -- 2.43 7.26 7.35 0.462 4.2 38.51
Uttarakhand 3.28 2.83 1.78 1.57 9.85 7.44 0.639 4.3 46.29
West Bengal 3.44 2.37 5.63 3.10 16.73 19.77 0.515 5.9 42.23
India$ 4.53 4.14 3.09 4.49 17.93 17.79 -- 5.5 46.69
$ Includes Union Territories ^ Included in Andhra Pradesh unless specifically mentioned

Economic Survey of Maharashtra 2015-16
229
SELECTED SOCIO-ECONOMIC INDICATORS OF STATES IN INDIA
Mean age at effective marriage (females)
Per cent of children fully immunised
Maternal Mortality Ratio#
Crimes against women
(no.)
Crimes against children
(no.)
Number of fair price /
ration shops per lakh
population
Percentage of population below
poverty Line
(2013) (2007-08) (2011-13) (2014) (2014) (30-6-2015) (2011-12)
(107) (108) (109) (110) (111) (112) (113)
20.7 67.1 92 16,512 2,059 52 9.20
-- -- -- 14,136 1,930 -- --
N.A. N.A. N.A. 351 134 120 34.67
21.4 50.9 300 19,139 1,385 115 31.98
21.1 41.4 208 15,383 2,255 43 33.74
20.5 54.1 -- 5,972 423 72 36.96
22.8 67.6 N.A. 15,265 9,350 12 9.91
N.A. 89.8 N.A. 488 330 22 5.09
21.6 54.9 112 10,837 3,219 28 16.63
21.1 59.6 127 8,974 2,540 34 11.16
22.5 82.3 N.A. 1,517 467 69 8.06
24.4 62.5 N.A. 3,321 211 52 10.35
21.3 76.7 133 13,914 3,416 34 20.91
23.1 79.5 61 11,380 2,391 40 7.05
20.6 36.2 221 28,678 15,085 29 31.65
20.3 59.3 -- 6,255 4,358 45 39.93
21.1 69.1 68 26,693 8,115 43 17.35
N.A. N.A. N.A. 337 137 80 36.89
N.A. 33.7 N.A. 388 213 158 11.87
N.A. 54.5 N.A. 258 178 412 20.40
N.A. N.A. N.A. 67 25 52 18.88
21.4 62.4 222 14,606 2,196 4 32.59
22.7 79.9 141 5,425 1,762 68 8.26
20.7 48.8 244 31,151 3,880 37 14.71
N.A. 77.8 N.A. 110 93 240 8.19
22.4 81.8 79 6,325 2,354 50 11.28
N.A. 38.5 N.A. 1,615 369 48 14.05
21.6 30.3 285 38,467 14,835 36 29.43
N.A. 62.9 -- 1,395 489 86 11.26
20.7 75.8 113 38,299 4,909 22 19.98
21.3 54.1 167 3,37,922 89,423 43 21.92
N.A. Not Available # Maternal Mortality Ratio for Jharkhand, Chhatisgarh and Uttarakhand are shown combined with the respective parent state