Major Primary Timber Processing Facilities in British Columbia
51
Major Primary Timber Processing Facilities in British Columbia 2016
Transcript of Major Primary Timber Processing Facilities in British Columbia

Major Primary Timber Processing Facilities in British Columbia
2016


Major Primary Timber Processing Facilities In British Columbia
2016
Timber Operations, Pricing and First Nations Division Ministry of Forests, Lands, Natural Resource Operations and
Rural Development Victoria, B.C.
January 2018

1
Foreword
This edition of the Major Primary Timber Processing Facilities in British Columbia summarizes the activity of timber processing mills that operated during 2016. It covers sawmills, veneer mills and panel plants, pulp and paper mills, chip mills, pellet mills, shake and shingle, and pole and post mills. Some do not have primary log processing capabilities and process residual fibre from other mills. For mills that produced more than one product (e.g. lumber and veneer), each operation is listed in the respective section of the report. This report does not include re-manufacturing plants. Most of the information contained in this report was gathered through 2016 and earlier surveys of individual processing mills. The 2016 surveys included small lumber mills with less than 40 million board feet capacity. If survey responses were not provided, the Ministry of Forests, Lands, Natural Resource Operations and Rural Development (the Ministry or FLNRORD) staff might use trade publications and corporate annual reports to make estimations. In some cases, ministry staff provided estimates based on their knowledge of the operation and information reported in previous years along with production information for selected forest products from Statistics Canada. This report is available free of charge online at:
http://www2.gov.bc.ca/gov/content/industry/forestry/competitive-forest-industry/forest-industry-economics/fibre-mill-information
Please note that all remaining errors are the responsibility of Economic Service Branch of the FLNRORD. Any comments or errors could be sent to the contact information at the website or by mail at the following location:
Economic Services Branch Ministry of Forests, Lands, Natural Resource
Operations and Rural Development PO Box 9515, STN PROV GOVT,
Victoria B.C. V8W 9C2

2
Acknowledgements
The co-operation of mill personnel who responded to the 2016 B.C. Mill List Survey is gratefully acknowledged.
The important roles played by FLNRORD’s district staff in verifying local mill information and the ministry’s contractor Lynette Stork in computer programming are also acknowledged. We highly acknowledged the significant contributions made by:
Lynne Christensen of the Cedar Shake and Shingle Bureau (CSSB);
Russ Cameron of the Independent Wood Processors Association (IWPA);
Michael Armstrong of the Council of Forest Industries (COFI);
Patti LeFrancois of the B.C. Log and Timber Building Industry Association (BCLTBIA); and
Gordon Murray of the Wood Pellet Associations of Canada (WPAC). The survey and analyses were conducted by Jiali (Julie) Leng and reviewed by Rebecca Ewing and Tim Bogle. Additional supports were provided by Patrick Russell, Stephen Davis, Alex Barnes, John Cook and Judith Elkins.

3
Table of Contents
Introduction ............................................................................................................ 5
Primary Log Use and Wood Fibre Supply in British Columbia, 2016 ..................... 5
Primary Log Use ................................................................................................. 5
Wood Fibre Supply ............................................................................................. 5
Product Recovery from Lumber Mills ................................................................. 8
Fibre Used by Pulp, Pellet and Panel Mills ......................................................... 8
Provincial Log Supply and Demand ..................................................................... 10
Provincial Chip Supply and Demand .................................................................... 11
Time Series Data ................................................................................................. 12
1) Lumber Mills ................................................................................................. 12
Number of Mills ............................................................................................. 12
Mill Capacity, Output, and Input .................................................................... 12
Average Capacity, Capacity Utilization, and Lumber Recovery Factor ......... 12
2) Veneer and Plywood Mills ............................................................................ 17
Number of Mills ............................................................................................. 17
Mill Input ....................................................................................................... 17
Average Capacity, Capacity Utilization, and Veneer Recovery .................... 17
3) Pulp and Paper Mills ................................................................................... 21
Number of Mills ............................................................................................. 21
Mill Input, Output, Harvest Residuals ............................................................ 21
4) Pellet Mills .................................................................................................... 26
Number of Mills ............................................................................................. 26
Mill Capacity, Input, Output, and Capacity Utilization ................................... 26
Related References ............................................................................................. 29
Appendix: List of Mills .......................................................................................... 30
Lumber Mills ..................................................................................................... 31
Pulp and Paper Mills ........................................................................................ 36
Veneer, Plywood, OSB and Other Panel Mills ................................................. 38
Chip Mills .......................................................................................................... 40
Pellet Mills ........................................................................................................ 42
Pole and Post Mills ........................................................................................... 44
Shake and Shingle Mills ................................................................................... 46

4
Abbreviations for Products
CHP - Chip
LBR - Lumber
LVL - Laminated Veneer Lumber
OSB - Oriented Strand Board
PLP - Pulp
PPR - Paper
SS - Shake and Shingle
PLE - Pole
PLT - Pellet
PLY - Plywood
PNL - Other Panel
PST - Fence Post
UTI - Utility Pole
VNR - Veneer
5
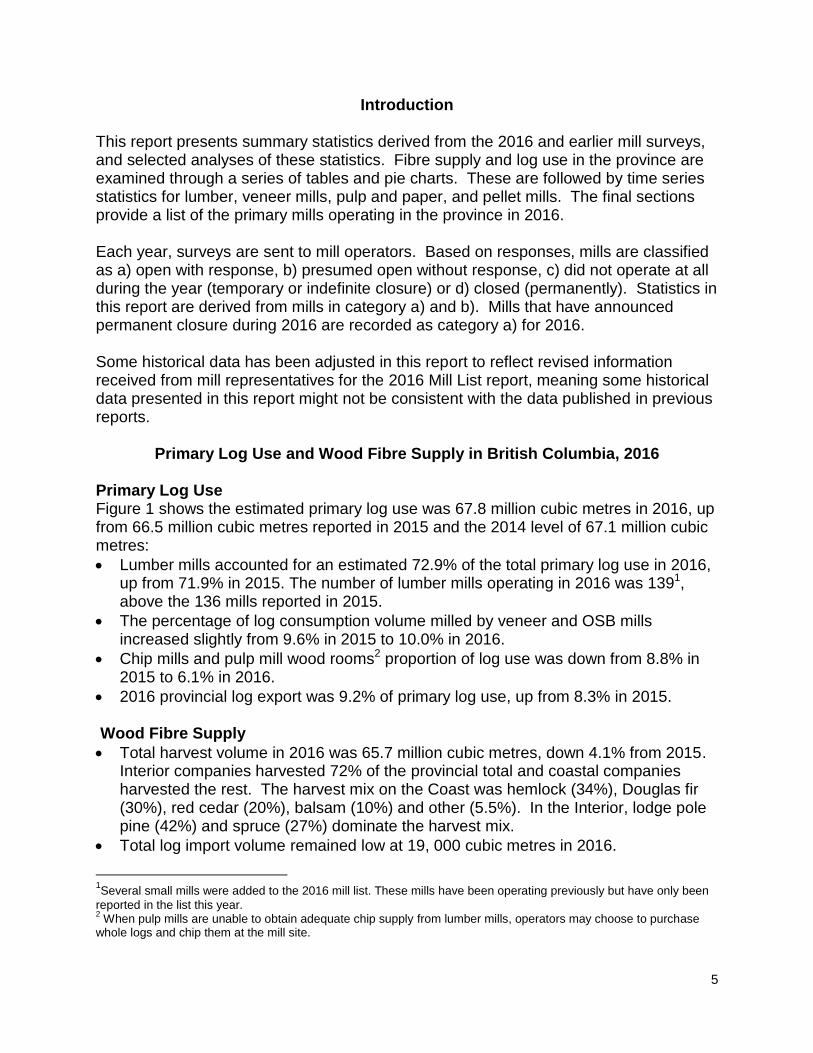
Introduction This report presents summary statistics derived from the 2016 and earlier mill surveys, and selected analyses of these statistics. Fibre supply and log use in the province are examined through a series of tables and pie charts. These are followed by time series statistics for lumber, veneer mills, pulp and paper, and pellet mills. The final sections provide a list of the primary mills operating in the province in 2016. Each year, surveys are sent to mill operators. Based on responses, mills are classified as a) open with response, b) presumed open without response, c) did not operate at all during the year (temporary or indefinite closure) or d) closed (permanently). Statistics in this report are derived from mills in category a) and b). Mills that have announced permanent closure during 2016 are recorded as category a) for 2016. Some historical data has been adjusted in this report to reflect revised information received from mill representatives for the 2016 Mill List report, meaning some historical data presented in this report might not be consistent with the data published in previous reports.
Primary Log Use and Wood Fibre Supply in British Columbia, 2016 Primary Log Use Figure 1 shows the estimated primary log use was 67.8 million cubic metres in 2016, up from 66.5 million cubic metres reported in 2015 and the 2014 level of 67.1 million cubic metres:
Lumber mills accounted for an estimated 72.9% of the total primary log use in 2016, up from 71.9% in 2015. The number of lumber mills operating in 2016 was 1391, above the 136 mills reported in 2015.
The percentage of log consumption volume milled by veneer and OSB mills increased slightly from 9.6% in 2015 to 10.0% in 2016.
Chip mills and pulp mill wood rooms2 proportion of log use was down from 8.8% in 2015 to 6.1% in 2016.
2016 provincial log export was 9.2% of primary log use, up from 8.3% in 2015.
Wood Fibre Supply
Total harvest volume in 2016 was 65.7 million cubic metres, down 4.1% from 2015. Interior companies harvested 72% of the provincial total and coastal companies harvested the rest. The harvest mix on the Coast was hemlock (34%), Douglas fir (30%), red cedar (20%), balsam (10%) and other (5.5%). In the Interior, lodge pole pine (42%) and spruce (27%) dominate the harvest mix.
Total log import volume remained low at 19, 000 cubic metres in 2016.
1Several small mills were added to the 2016 mill list. These mills have been operating previously but have only been
reported in the list this year. 2 When pulp mills are unable to obtain adequate chip supply from lumber mills, operators may choose to purchase
whole logs and chip them at the mill site.

6
Figure 1: Estimated British Columbia Primary Log Use - 2016
Number
of Mills
Est. Volume
Used (000 m³) Per Cent
Number of
Mills
Est. Volume
Used (000 m³) Per Cent
Number
of Mills
Est. Volume
Used (000 m³) Per Cent
Primary Log Use
Lumber Mills 48 7,991 44.9% 91 41,452 82.8% 139 49,443 72.9%
Veneer/OSB Mills 5 2,091 11.8% 12 4,722 9.4% 17 6,813 10.0%
Pulp Mill Wood Rooms 2 498 2.8% 2 309 0.6% 4 807 1.2%
Chip Mills 10 1,172 6.6% 12 2,178 4.4% 22 3,350 4.9%
Shake & Shingle Mills 32 590 3.3% 9 40 0.1% 41 630 0.9%
Other Mills 15 119 0.7% 33 407 0.8% 48 526 0.8%
Log Exports 5,326 29.9% 932 1.9% 6,257 9.2%
TOTAL 112 17,787 100% 159 50,040 100% 271 67,826 100%
Log Availability
Total Harvest 18,241 47,501 65,742
Log Imports 19
TOTAL 18,241 47,501 65,762
Difference 455 2.5% -2,539 -5.3% -2,065 -3.1%
Sources:
Note: Statistics above do not include mills that were closed or did not operate in 2016.
Coast Interior Province
*Total harvest includes all logs, special forest products, species and grades billed to crown, private and federal land. Waste, reject and Xmas trees were excluded.
B.C. Mill List Survey data; Natural Resources Canada's trade data for total provincial exports and imports; BC Ministry of Forests, Lands, Natural Resource Operations and Rural
Development log export statistics for the proportion of exports from the Coast versus Interior.
Lumber Mills72.9%
Veneer/OSB Mills10.0%
Pulp Mill Wood Rooms1.2%
Chip Mills4.9%
Shake & Shingle Mills0.9%
Other Mills0.8%
Log Exports9.2%
Total Primary Log Use 2016 - 67.826 million m3

7
3
3The provincial estimated lumber output in Figure 2 is within 1% of Statistics Canada’s sawmilling output for B.C...
Figure 2: Estimates of Product Recovery from Lumber Mills - 2016
Units Coast Interior Province
Number of Mills 48 91 139
Log Input (million m3) 7.99 41.45 49.44
Lumber Output
Lumber Output (nominal measure) (mmfbm) 1.80 11.60 13.40
Lumber Recovery Factor (mfbm/m3) 0.225 0.280 0.271
Conversion Factor * (m3/mfbm) 2.07 1.61 1.67
= Actual Volume of Lumber Produced (million m3) 3.73 18.68 22.40
As Per Cent of Log Input (%) 46.6% 45.1% 45.3%
Lumber Shrinkage
Shrinkage (5% of lumber production) (million m3) 0.19 0.93 1.12
As Per Cent of Log Input (%) 2.3% 2.3% 2.3%
By Product Chip Output (from Lumber Mills)
By Product Chip Output (million bdu) 1.20 5.60 6.80
By Product Chip Recovery Factor (bdu/'000 m3) 150 135 138
Conversion Factor* (m3/bdu) 2.86 2.75 2.77
= Volume of Chips Produced (million m3) 3.43 15.40 18.83
As Per Cent of Log Input (%) 42.9% 37.2% 38.1%
Sawdust and Shavings - Estimated Volume (million m3) 0.65 6.44 7.09
As Per Cent of Log Input (%) 8.1% 15.5% 14.3%
Notes:
* Conversion factors are used to convert lumber output or by-product chips in nominal measure to solid wood equivalent.
mmfbm = million board feet; mfbm = thousand board feet; m3 = cubic metres; bdu = bone dry unit = 2400 pounds.
Conversion factors used in the analysis are based on Forintek Canada Corp., "Conversion Factors for the Forest Products Industry
in Western Canada", Special Publication No. SP-24R, 1985 and "Major Primary Timber Processing Facilities in British Columbia
2007", Appendix 1, page 24.
Lumber 45.3%
By-product chips38.1%
Sawdust & Shavings14.3%Lumber shrinkage
2.3%
Estimated Product Recovery from Lumber Mills

8
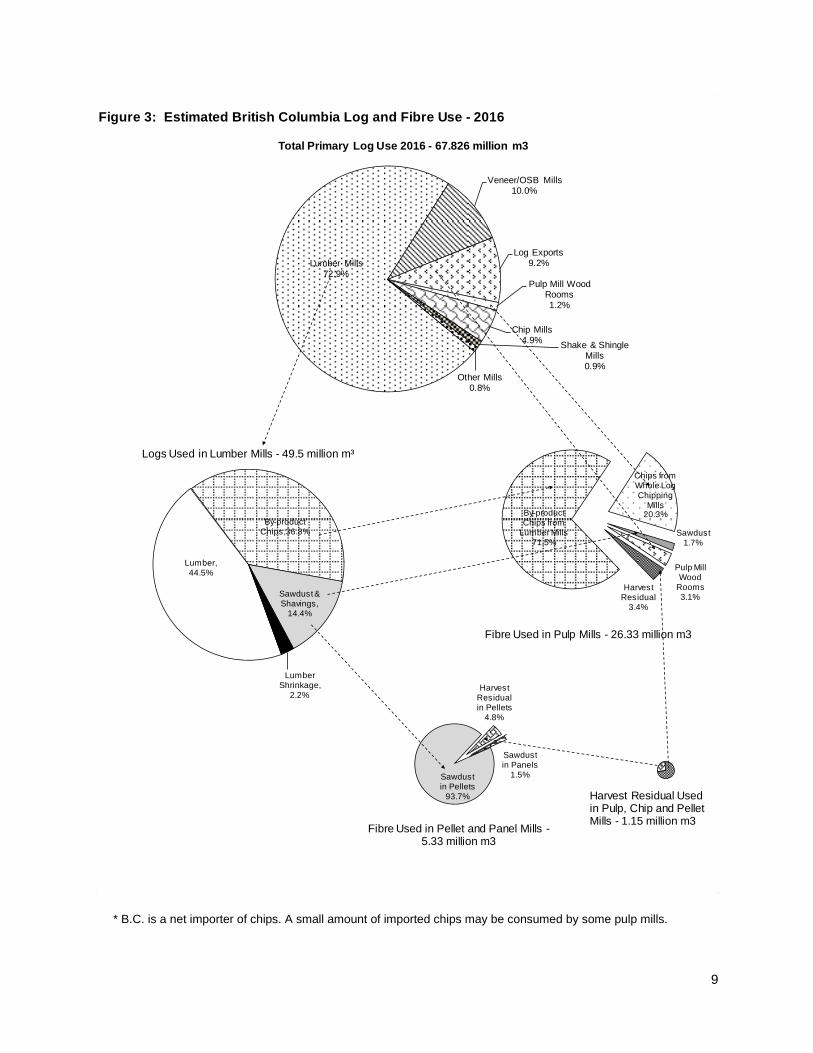
Product Recovery from Lumber Mills Figure 2 estimates product recovery from lumber mills. It shows that 45.3% of the volume of wood entering lumber mills was converted to lumber, 38.1% was converted to chips primarily used as input to pulp mills, and an estimated 14.4% was sawdust and shavings available for bio-energy (i.e. fuel for kilns, pellet/panel manufacturing, and electrical energy production). Fibre Used by Pulp, Pellet and Panel Mills Figure 3 combines information from Figures 1 and 2 with a chart showing the sources of fibre used by pulp, pellet and panel mills:
Pulp mills used an estimated 26.3 million cubic metres in solid wood equivalents, representing an increase of 3.4% from 2015. Residual chips from sawmills contributed 71.5% of pulp mill inputs while whole log chipping provided 20.3% of the fibre. Pulp mill use of fibre derived from harvest residuals4 expanded to 3.4% of total use from 2.9% last year.
Pellet and panel mills used an estimated 5.3 million cubic metres in solid wood equivalents, representing a 16.6% increase from 2015. This increase was mainly driven by the opening of two new pellet plants5 in 2016.
In 2016 versus 2015, there was a 10.4% increase of fibre produced from harvest residuals6. The largest consumers of harvest residuals were pulp mills followed by pellet and chip mills.
The harvest residual data is important for the B.C. government and the Forestry and Fibre Working Group to establish a baseline on fibre use to determine the effectiveness of policy changes and inform any necessary adjustments to achieve B.C.’s fibre use goals. These goals include generating more value from the forest resource and increasing fibre use in harvesting operations.
4 The ministry started collecting the harvest residual data through adding harvest residual consumption questions to
the mill list survey in 2015. This new data element may be underestimated because the residual fibre volume consumed by some major timber facilities may not be reported or inaccurately reported to the survey. 5 Canfor with its partner Pacific Bioenergy officially opened two new pellet plants in July 2016 at their existing sawmill
sites in Chetwynd and Fort St. John. 6 Harvest residuals in this report refer to fibre removed from the cut block following harvesting activities and
transported directly to pulp, chip or pellet mills (i.e. not a sawlog or a traditionally defined pulp log).
9
* B.C. is a net importer of chips. A small amount of imported chips may be consumed by some pulp mills.
Figure 3: Estimated British Columbia Log and Fibre Use - 2016
By-product Chips from
Lumber Mills71.5%
Chips from Whole Log Chipping
Mills20.3%
Sawdust1.7%
Pulp Mill Wood
Rooms3.1%
Harvest Residual
3.4%
Fibre Used in Pulp Mills - 26.33 million m3
Lumber, 44.5%
By-product Chips,36.8%
Sawdust & Shavings,
14.4%
Lumber Shrinkage,
2.2%
Logs Used in Lumber Mills - 49.5 million m³
Sawdust in Panels
1.5%Sawdust in Pellets
93.7%
Harvest Residual in Pellets
4.8%
Fibre Used in Pellet and Panel Mills -5.33 million m3
Harvest Residual Used in Pulp, Chip and Pellet Mills - 1.15 million m3
Lumber Mills72.9%
Veneer/OSB Mills10.0%
Log Exports9.2%
Pulp Mill Wood Rooms1.2%
Chip Mills4.9%
Shake & Shingle Mills0.9%
Other Mills0.8%
Total Primary Log Use 2016 - 67.826 million m3

10
Provincial Log Supply and Demand As shown in Figure 4, the primary provincial log use volume estimated in this report exceeded the harvest volume by 2.1 million cubic metres (3%) in 2016. This difference could be due to a number of factors, including the seasonality inherent in timber harvesting, log inventory changes, different company reporting years, or the estimates made for mills that did not complete the survey. Figure 4 monitors the trends of the primary log use and log supply for selected years over the period of 2006-2016: • Over the last 12 years, log use volume captured by the mill list survey
represented 96% of the total log supply. • The harvest and log use dipped in the recession and bounced back to lower
levels compared to pre-recession period. • Large and medium sawmills consumed most of the whole log inputs. • Veneer and OSB mills are the second-largest consumers of logs in the
province, followed by chip mills and pulp mills.
*Note: The ministry did not survey small lumber mills in 2009 and did not publish mill list reports in 2010 and 2012. Ministry staff selected the above years with published reports and consistent sample sizes to ensure the data accuracy and consistency over years. **The ministry did not survey shake and shingle mills in 2011 and 2013. Log use volume for those mills was estimated based on best available information.
0
10
20
30
40
50
60
70
80
90
2004 2006 2008 2011 2013 2015 2016
Figure 4: B.C. Primary Log Use and Log Supply For Selected Years*
Log Exports
Other Mills
Shake & ShingleMills**
Chip Mills
Pulp Mill - WoodRooms
Veneer/OSB Mills
Lumber Mills
Mil
lio
nC
ub
ic M
etr
es
Total Available Logs
Total Log Use

11
Provincial Chip Supply and Demand In B.C., the main sources of chip supply are residual chips produced by sawmills and veneer mills, followed by chips produced in pulp mills or in whole log chipping mills. A small amount of imported chips also contribute to the provincial chip supply. Pulp and paper mills are the major chip consumers, converting low-value wood chips into high-value pulp and paper products.
Table 1 summarizes provincial chip production and consumption by natural resource areas for 2015 and 2016:
The production of whole log chips on the Coast reduced by 33% due to increased use of residual chips.
The production of residual chips from sawmills and veneer mills slightly increased on the Coast and in the North.
About 30% of chips consumed by Coastal pulp mills were sourced from Interior mills.
B.C. is a net importer of chips. Those imported chips played an important role in filling the provincial chip supply and demand gaps in 2015 and 2016.
Table 1: B.C. Chip Production and Consumption by Natural Resource Areas for 2015-2016
2015 2016
Whole Log Chips Production from Pulp Wood Room and Chip Mills (000 BDUs)
Coast 1,012 678
North 521 316
South 659 508
Residual Chips from Sawmills and Veneer Mills (000 BDUs)
Coast 1,471 1,500
North 2,612 2,786
South 3,101 3,072
Total Provincial Chip Production (000BDUs)
Coast 2,482 2,179
North 3,133 3,101
South 3,760 3,580
Total Chip Consumption by Pulp Mills (000BDUs)
Coast 3,490 3,095
North 3,089 2,922
South 3,480 3,502
Differences Between Chip Production and Consumption (000BDUs)
Coast -1,007 -916
North 44 179
South 281 78
Provincial Net Import 580 328
Provincial Chip Balance -102 -331
Reporting Errors, etc. -1.02% -3.48%
12
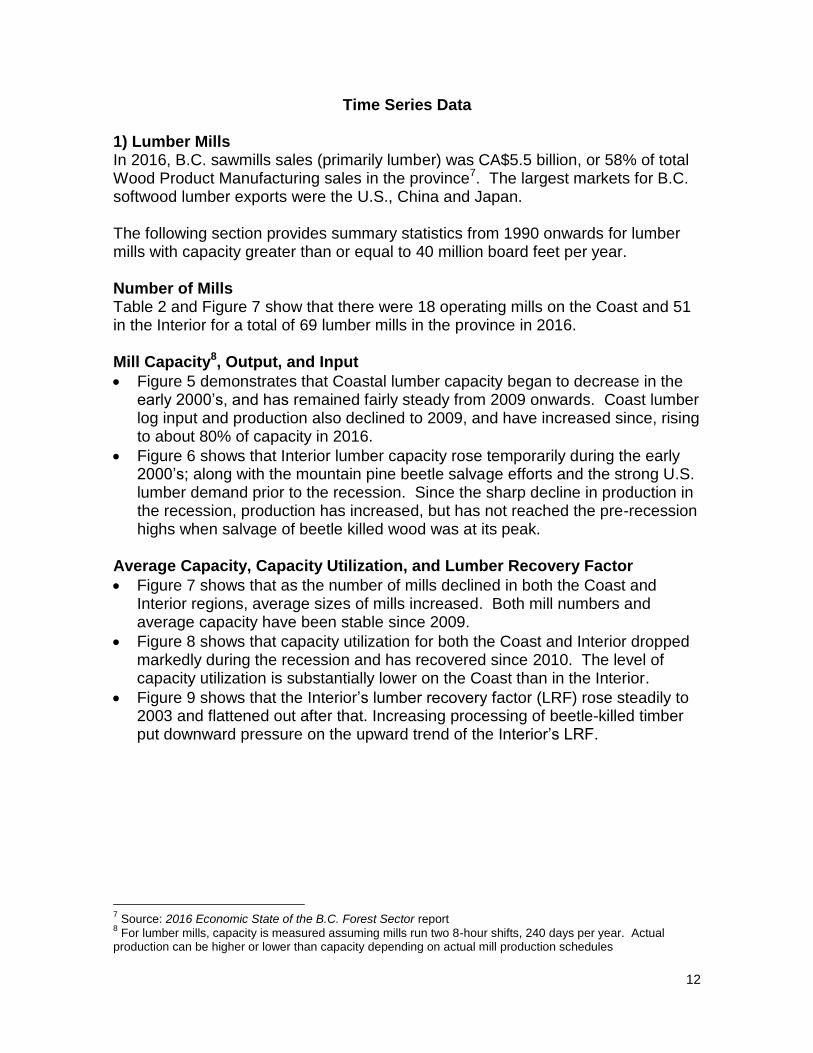
Time Series Data 1) Lumber Mills In 2016, B.C. sawmills sales (primarily lumber) was CA$5.5 billion, or 58% of total Wood Product Manufacturing sales in the province7. The largest markets for B.C. softwood lumber exports were the U.S., China and Japan. The following section provides summary statistics from 1990 onwards for lumber mills with capacity greater than or equal to 40 million board feet per year. Number of Mills Table 2 and Figure 7 show that there were 18 operating mills on the Coast and 51 in the Interior for a total of 69 lumber mills in the province in 2016. Mill Capacity8, Output, and Input
Figure 5 demonstrates that Coastal lumber capacity began to decrease in the early 2000’s, and has remained fairly steady from 2009 onwards. Coast lumber log input and production also declined to 2009, and have increased since, rising to about 80% of capacity in 2016.
Figure 6 shows that Interior lumber capacity rose temporarily during the early 2000’s; along with the mountain pine beetle salvage efforts and the strong U.S. lumber demand prior to the recession. Since the sharp decline in production in the recession, production has increased, but has not reached the pre-recession highs when salvage of beetle killed wood was at its peak.
Average Capacity, Capacity Utilization, and Lumber Recovery Factor
Figure 7 shows that as the number of mills declined in both the Coast and Interior regions, average sizes of mills increased. Both mill numbers and average capacity have been stable since 2009.
Figure 8 shows that capacity utilization for both the Coast and Interior dropped markedly during the recession and has recovered since 2010. The level of capacity utilization is substantially lower on the Coast than in the Interior.
Figure 9 shows that the Interior’s lumber recovery factor (LRF) rose steadily to 2003 and flattened out after that. Increasing processing of beetle-killed timber put downward pressure on the upward trend of the Interior’s LRF.
7 Source: 2016 Economic State of the B.C. Forest Sector report
8 For lumber mills, capacity is measured assuming mills run two 8-hour shifts, 240 days per year. Actual
production can be higher or lower than capacity depending on actual mill production schedules
13
Table 2: British Columbia Lumber Mill Summary Statistics for mills with estimated annual capacity of at least 40 million board feet
1990… 1995… 2000... 2005 2006 2007 2008 2009 2010 2011 2012 2013 2014 2015 2016
%
change
1990-
2016
COAST
Number of Mills 43 38 36 29 24 24 21 19 21 20 18 18 19 18 18 -58%
Total Capacity billion board feet per year 4.2 3.8 4.0 3.4 2.7 2.7 2.4 2.2 2.3 2.3 2.2 2.1 2.2 2.1 2.1 -51%
Total Output billion board feet per year 3.8 3.3 3.1 2.6 2.4 1.7 1.5 1.2 1.4 1.4 1.5 1.4 1.7 1.6 1.6 -57%
Total Input million cubic metres per year 17.1 15.0 13.8 11.2 10.3 7.6 6.5 4.9 5.9 6.2 6.4 6.4 7.3 7.0 7.0 -59%
Average Capacity million board feet per mill per year 99 100 111 117 114 111 114 116 110 115 122 117 116 117 117 18%
Capacity Utilization output divided by capacity 89% 88% 77% 76% 89% 65% 63% 55% 61% 61% 68% 67% 77% 76% 76% -14%
Lumber Recovery Factor '000 board feet per cubic metre 0.220 0.223 0.222 0.231 0.236 0.230 0.231 0.245 0.237 0.226 0.234 0.219 0.233 0.229 0.229 4%
INTERIOR
Number of Mills 88 83 77 71 72 72 62 53 52 56 54 52 53 52 51 -42%
Total Capacity billion board feet per year 10.7 10.3 10.7 12.8 12.8 12.4 11.3 10.7 10.4 11.1 10.9 10.6 10.8 10.4 10.6 -1%
Total Output billion board feet per year 10.0 10.0 10.5 14.1 14.2 13.3 9.7 7.9 9.5 10.5 10.8 11.2 10.9 11.2 11.5 15%
Total Input million cubic metres per year 42.2 40.8 39.9 50.2 50.5 47.4 34.7 28.2 34.1 37.0 38.6 39.9 39.3 39.4 40.7 -3%
Average Capacity million board feet per mill per year 121 124 139 180 177 172 182 202 200 198 202 204 204 200 208 71%
Capacity Utilization output divided by capacity 93% 97% 99% 111% 111% 107% 86% 74% 91% 95% 99% 106% 101% 108% 108% 16%
Lumber Recovery Factor '000 board feet per cubic metre 0.236 0.245 0.263 0.282 0.281 0.280 0.280 0.280 0.279 0.284 0.280 0.281 0.277 0.284 0.283 20%
PROVINCE
Number of Mills 131 121 113 100 96 96 83 72 73 76 72 70 72 70 69 -47%
Total Capacity billion board feet per year 14.9 14.1 14.7 16.2 15.5 15.1 13.7 12.9 12.7 13.4 13.1 12.7 13.0 12.5 12.7 -15%
Total Output billion board feet per year 13.7 13.3 13.6 16.7 16.6 15.0 11.2 9.1 10.9 11.9 12.3 12.6 12.6 12.8 13.1 -5%
Total Input million cubic metres per year 59.2 55.7 53.8 61.4 60.8 55.0 41.2 33.1 40.0 43.2 45.0 46.3 46.6 46.4 47.7 -19%
Average Capacity million board feet per mill per year 114 117 130 162 162 157 165 179 174 176 182 181 181 179 184 62%
Capacity Utilization output divided by capacity 92% 94% 93% 103% 107% 100% 82% 71% 86% 89% 94% 99% 97% 102% 103% 12%
Lumber Recovery Factor '000 board feet per cubic metre 0.232 0.239 0.253 0.272 0.273 0.273 0.272 0.275 0.273 0.275 0.273 0.272 0.270 0.276 0.275 18%
Source: Major Primary Timber Processing Facilities in British Columbia, ministry database, various years
Notes:
Includes only those lumber mills with a minimum estimated annual capacity of 40 million board feet per year.
Capacity estimated assuming two 8-hour shifts, 240 days per year.

14

15

16

17
2) Veneer and Plywood Mills Veneer is produced as a thin sheet of wood of uniform thickness by peeling or slicing logs, requiring higher grade logs with no branches. Plywood is produced by gluing and compressing together, three or more sheets of veneer, with the grain of alternate sheets usually laid crosswise9.Veneer is also used in other engineered wood products such as laminated veneer lumber. The following section gives a provincial overview of veneer mill statistics from 1990 onwards: Number of Mills
As shown in Table 3, there were 12 veneer mills operating in the province in 201610.
Three veneer mills were on the Coast and nine mills were in the southern Interior.
Seven veneer mills in B.C. operated plywood mills on the same sites. Mill Input
As shown in Figure 10, total log input to veneer mills moved downward over 2006-2010 and upward from 2012 onwards driven by strong demand in the US.
The total log input grew from 3.6 million cubic metres to 4.3 million cubic metres over 2012-2015. The input reached 4.9 million cubic metres in 2016, up 14% from 2015 or 20% from 1995. Particularly, Tolko’s Armstrong plant started veneer production in 2016.
Average Capacity, Capacity Utilization, and Veneer Recovery
Figure 11 shows that average capacity of veneer mills grew steadily between 1990 and 2009. There was a bump on average capacity in 2010-2011 caused by temporary mill closures11.
Figure 12 illustrates a steady upward trend for capacity utilization in veneer mills between 1991 and 2006 as mills shifted from two to three shifts per day. Capacity utilization dropped in 2007- 2009 due to the major market downturn. Operations in veneer mills were back to pre-recession rates of 130% capacity utilization from 2013 onwards.
Figure 13 shows the recovery factor in 2016 was comparable to the average recovery experienced by veneer mills from 1994 to 2006. The recovery factor declined over 2008-2010 due to the mountain pine beetle epidemic. The recovery factor climbed to a record high in 2013 due to the increasing supply of higher-quality logs to the veneer mills.
9 Source: Statistics Canada: https://strategis.ic.gc.ca/app/scr/sbms/sbb/cis/definition.html?code=32121&lang=eng
10 Small mills using an average of less than 25,000 cubic metres of logs per year were not included in these statistics.
11 Temporary closure of Aspen Planer’s veneer mill in 2010

18
Table 3: British Columbia Veneer Mill Summary Statistics
1990… 1995… 2000... 2005 2006 2007 2008 2009 2010 2011 2012 2013 2014 2015 2016
%
change
1990-
2016
Number of Mills 20 17 16 17 16 15 13 12 10 11 11 11 11 11 12 -40%
Total Capacity (billion square feet 3/8" basis) 2.1 2.1 2.0 2.6 2.5 2.3 2.0 2.1 2.0 2.2 1.9 1.8 1.8 1.9 2.1 0%
Total Output (billion square feet 3/8" basis) 2.3 2.4 2.6 3.7 3.3 2.9 2.3 1.9 2.0 2.2 2.2 2.4 2.4 2.6 2.8 22%
Total Log Input (million cubic metres) 4.4 4.1 4.4 6.3 5.7 5.1 4.0 3.4 3.6 3.8 3.6 3.8 3.9 4.3 4.9 11%
Average Capacity (million square feet per mill) 105 124 125 153 156 153 154 175 200 200 173 164 164 173 175 67%
Average Log Input (thousand cubic metres per mill) 220 244 274 371 356 340 308 283 360 345 327 345 355 391 408 86%
Capacity Utilization (output divided by capacity) 110% 112% 126% 141% 132% 126% 115% 90% 100% 100% 116% 133% 133% 137% 133% 22%
Recovery Factor (square feet per cubic metre log input) 523 585 591 587 579 569 575 559 556 579 611 632 615 605 571 9%
Source: Major Primary Timber Processing Facilities in British Columbia, ministry database, various years
Notes:
Output Capacity is estimated based on two 8 hour shifts, 240 days per year.
Small mills using an average of less than 25,000 cubic metres of logs per year are not included in these statistics.

19

20

21
3) Pulp and Paper Mills Pulp is used primarily as a raw material for paper and paperboard products, packaging as well as personal hygiene products and rayon. The main B.C. pulp products are currently bleached softwood kraft pulp and chemi-thermo-mechanical pulp (CTMP). Most of the paper produced in B.C.is newsprint. In 2016, B.C. pulp mills had sales of CA$2.4 billion, which accounted for 56% of total pulp and paper manufacturing sales in the province12. B.C. total pulp export value was CA$3 billion. China had a dominant share of total pulp exports (61%), followed by the U.S. (12%), Japan (5%) and other destinations (22%). Bleached softwood kraft pulp dominates B.C.’s pulp exports13. In 2016, Paper and paperboard sales were down 21%, and converted paper was up 7.2%14. Exports of finished paper products were CA$904 million. The following section provides a provincial overview of pulp and paper mill statistics from 1991 onwards: Number of Mills
Table 4 shows that 15 pulp mills and five paper mills operated in 2016. Five of the
15 pulp mills were on the Coast and 10 were in the Interior.
Neucel Specialty Cellulose’s Port Alice pulp mill has been idled since 2015.
Chetwynd Mechanical Pulp mill curtailed its operation in 2016.
There were no paper and thermo-mechanical pulp (TMP) operations at Howe
Sound’s pulp and paper mill in 2016 due to the closure of both operations in 2015.
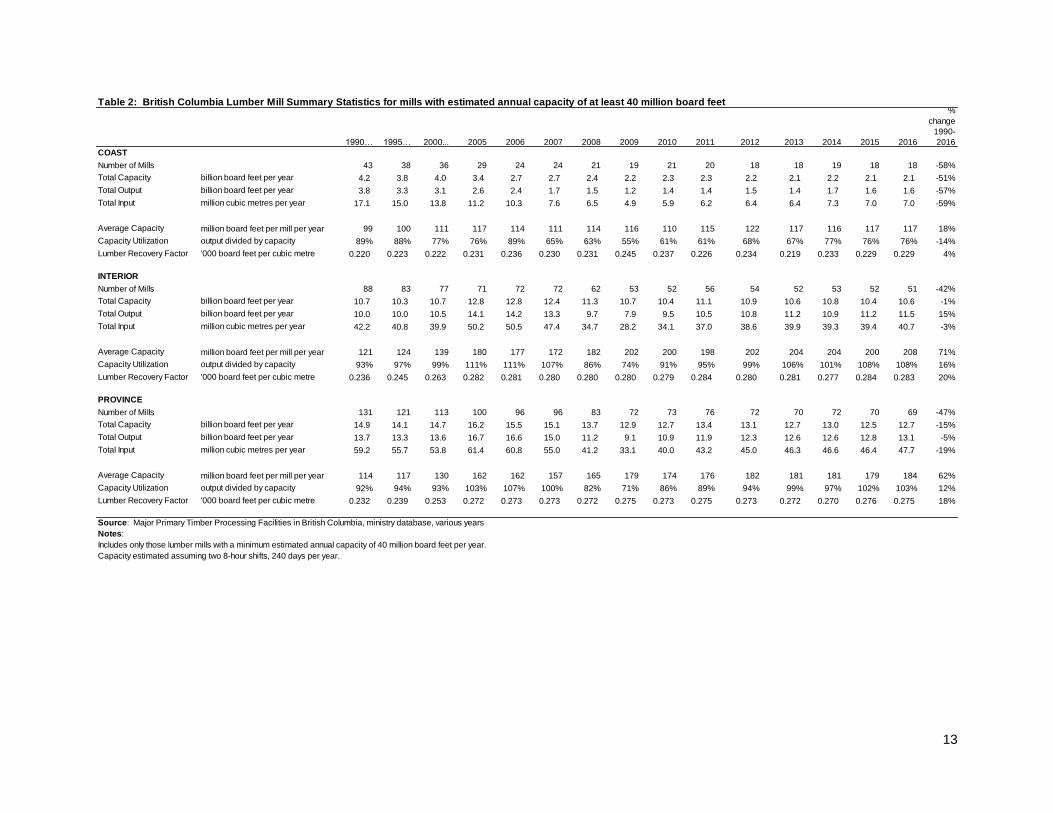
Mill Input, Output, Harvest Residuals Pulp Mills
Pulp mill input had been stable since recovering from the economic downturn at about 10 million BDUs versus 12 million BDUs between 1995 and 2005. Total pulp output declined similarly, from about 7 million tonnes in 1995-2005 to 5.7 million tonnes in 2007-2016.
Chips produced in pulp mills or in whole log chipping mills have historically been among the most expensive chips consumed by the pulp mill compared to by-product chips from sawmills. However, these chips play a critical role in maintaining a consistent overall chip supply to pulp mills. In 2016 vs.2015, whole log chips consumed by pulp mills substantially decreased by 2.9 million cubic metres. This decline resulted from the increased use of residual chips from sawmills. Only four pulp mills reported producing chips in 2016 vs. seven mills in 2015.
12
Pulp is a subcategory of the Paper Manufacturing NAICS code. Data source: Statistics Canada 13
Data source: Statistics Canada 14
Source: Statistics Canada and 2016 Economic State of the B.C. Forest Sector. Converted paper includes products created from purchased paper and paperboard.

22
Post-harvest residuals are an increasingly important source of fibre for pulp producers. Harvest residual volume used by pulp mills increased from 797,000 cubic metres in 2015 to 895,000 cubic metres in 2016.
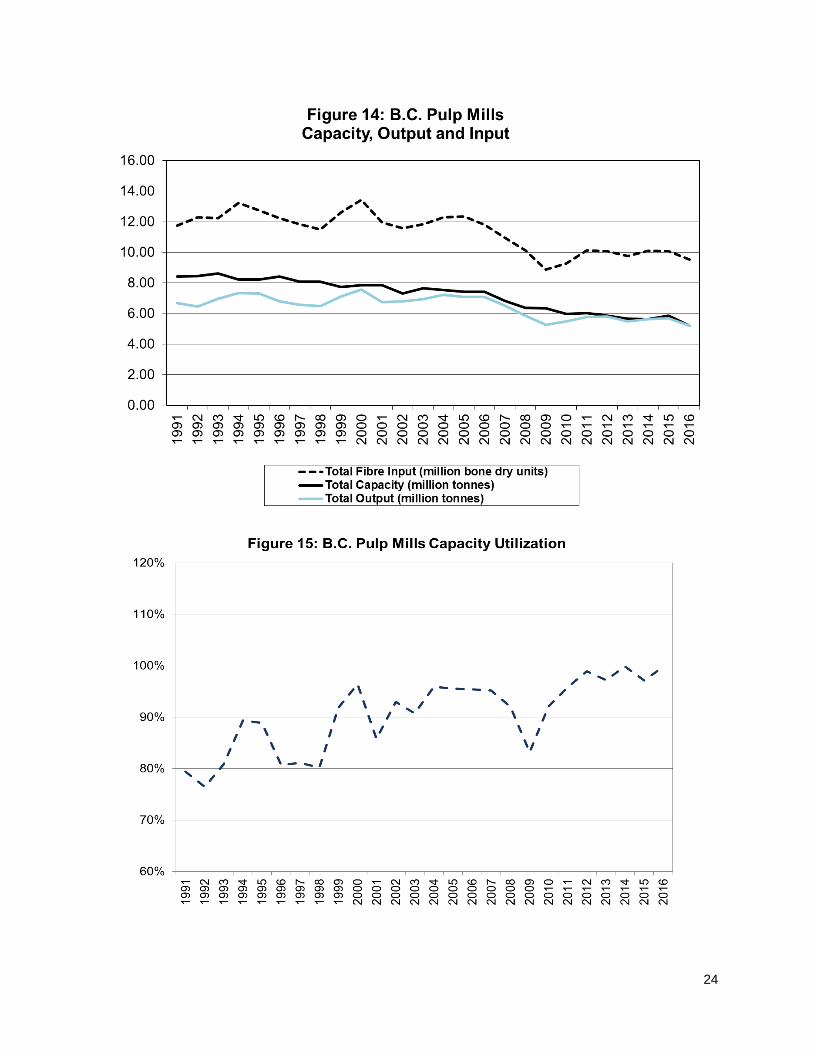
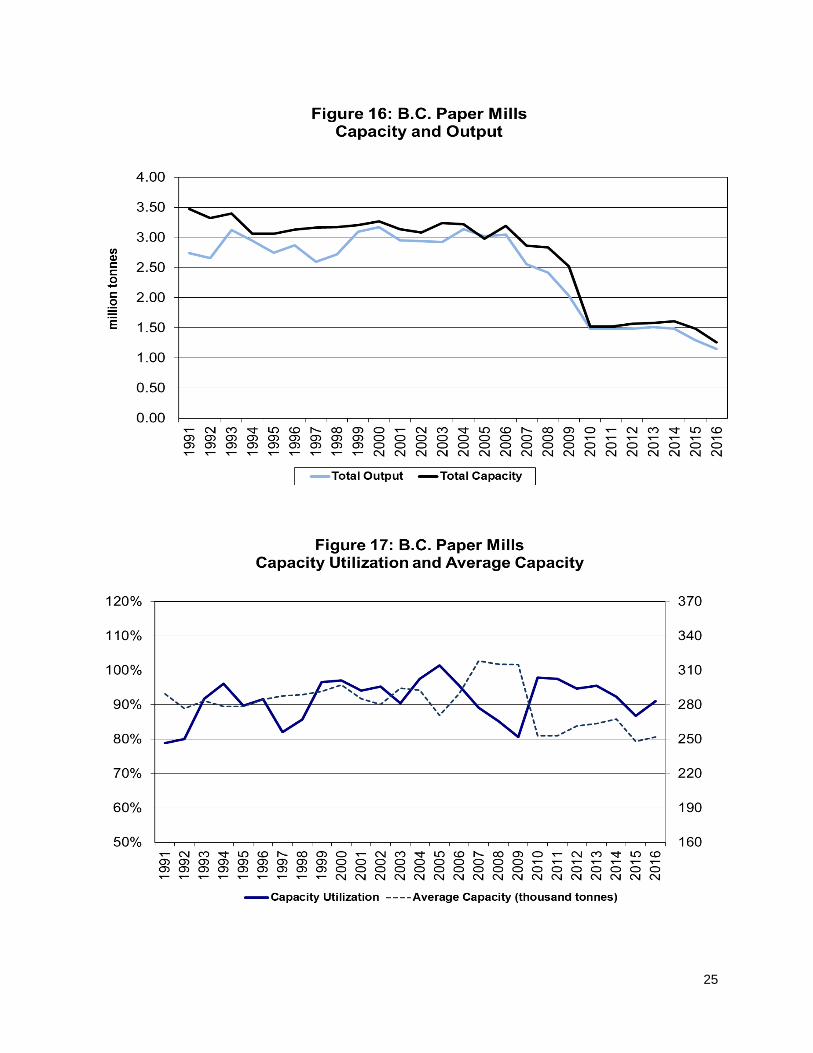
Paper Mills
As shown in Figure 16, total capacity and output of paper mills continues to decline in recent years after the large collapse of paper output beginning in 2006 due to economic downturn and significant reduced demand for printing and writing papers in global markets. The paper mill capacity and output had flattened out in 2011-2014 and declined in 2015-2016 due to mill closures.
As shown in Figure 17, paper mill capacity utilization remained above 90% between 2010 and 2014. Due to the closure of Howe Sound’s paper operation, the capacity utilization for all paper mills dropped to 87% in 2015 and slightly rose to 91% in 2016.

23
Table 4: British Columbia Pulp and Paper Mill Summary Statistics
1991… 1995… 2000... 2005 2006 2007 2008 2009 2010 2011 2012 2013 2014 2015 2016
%
change
1991-
2016
Number of Pulp Mills 24 24 23 22 21 21 19 19 18 18 18 16 16 17 15 -38%
Total Capacity (million tonnes) 8.42 8.21 7.84 7.42 7.42 6.84 6.36 6.33 5.96 6.02 5.87 5.66 5.64 5.85 5.21 -38%
Total Output (million tonnes) 6.68 7.30 7.56 7.09 7.08 6.51 5.85 5.27 5.49 5.76 5.80 5.50 5.63 5.69 5.20 -22%
Total Fibre Input (million bone dry units) 11.76 12.75 13.44 12.36 11.79 10.96 10.12 8.87 9.27 10.13 10.06 9.75 10.10 10.06 9.52 -19%
Average Capacity (thousand tonnes) 351 342 341 337 353 326 335 333 331 334 326 354 352 344 348 -1%
Average Fibre Input (thousand bone dry units) 490 531 584 562 562 522 532 467 515 563 559 610 631 592 635 29%
Capacity Utilization 79% 89% 96% 96% 95% 95% 92% 83% 92% 96% 99% 97% 100% 97% 100% 26%
Number of Paper Mills 12 11 11 11 11 9 9 8 6 6 6 6 6 6 5 -58%
Total Capacity (million tonnes) 3.47 3.06 3.27 2.98 3.19 2.86 2.84 2.52 1.52 1.52 1.57 1.58 1.61 1.49 1.26 -64%
Total Output (million tonnes) 2.74 2.75 3.17 3.02 3.04 2.55 2.42 2.03 1.49 1.48 1.49 1.51 1.48 1.29 1.15 -58%
Average Capacity (thousand tonnes) 289 278 297 271 290 318 315 315 253 253 261 264 268 248 252 -13%
Capacity Utilization 79% 90% 97% 101% 95% 89% 85% 81% 98% 98% 95% 96% 92% 87% 91% 15%
Source: Major Primary Timber Processing Facilities in British Columbia, ministry database, various years
Notes:
Estimated annual capacity is based on a standardized operation of 345 operating days per year, one 24-hour shift per day. Actual operations may vary from this schedule.
Pulp mills included in these statistics are those that use wood fibre input.
Historical data for some pulp mills have been adjusted to reflect new information received in 2017.
24
25
26
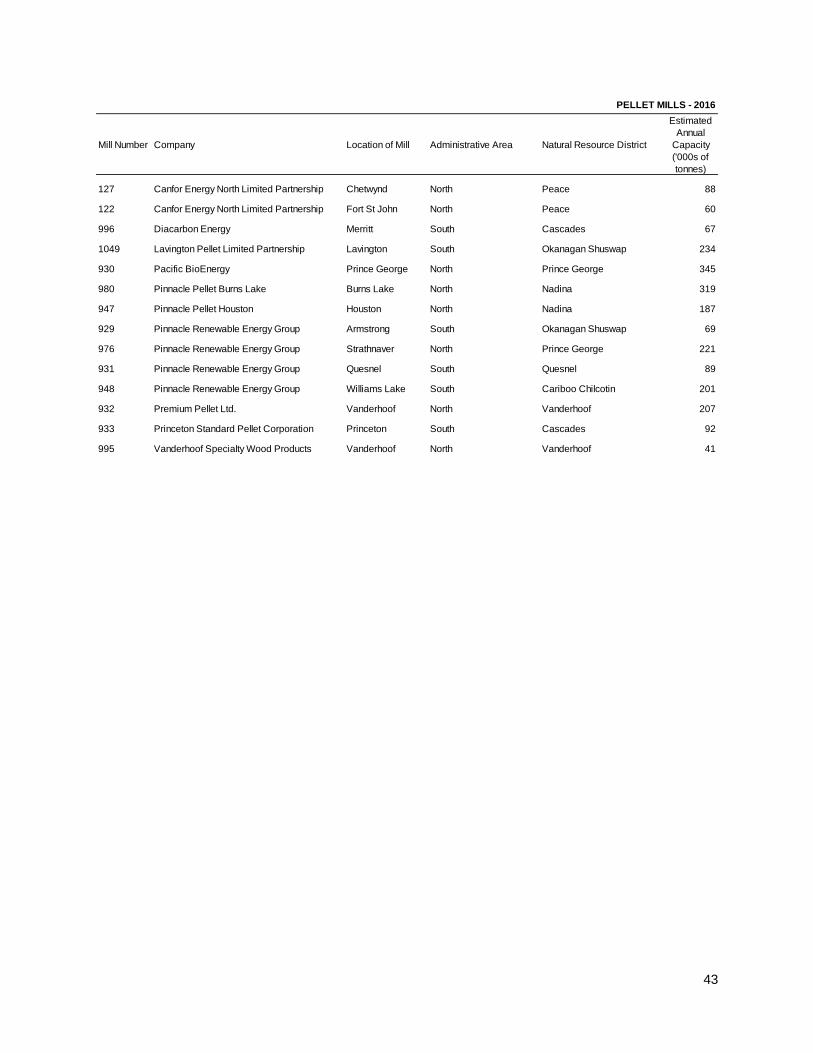
4) Pellet Mills Wood pellets are primarily used as wood fuel, and may also be used in niche markets such as animal bedding. Pellets are made from compacting fibre, usually sawdust, into the desired pellet diameter and length. Wood pellets are predominantly produced from sawmill residues. In 2016, foreign demand for wood pellets was strong and B.C. exports increased roughly 50%15. The province exported 1.93 million tonnes of wood pellets worth CA$319 million in 2016, as compared to 1.26 million tonnes of wood pellets worth CA$201 million in 2015. The U.K. was the primary destination by weight (71%), followed by Japan (14%), Belgium (7%) and Italy (3%). The following section provides an overview of pellet mill statistics for 2005-2016: Number of Mills
As noted in Table 5, there were 14 pellet plants in the southern and northern Interior of B.C.
Canfor with its partner Pacific Bioenergy officially opened two new pellet plants in July 201616 at their existing sawmill sites in Chetwynd and Fort St. John. The Chetwynd plant began testing its operation in 2015 and Fort St. John plant reached its full operation in early 2016.
Mill Capacity, Input, Output, and Capacity Utilization
As seen in Figure 18, the total capacity increased to 2.22 million tonnes in 2016 due to the new mill openings.
The total pellet production continues to climb with 2.06 million tonnes produced in B.C. in 2016 – an increase of 21% from 2015.
In 2015-2016, the increase of pellet input (mainly sawdust) was 19.8% - from 1.62 million bone dry units to 1.94 million bone dry units.
Figure 19 illustrated that capacity utilization for pellet mills was highly variable over 2005-2016 because new or reopened mills brought additional capacity while not necessarily operating for the entire year.
15
Source: 2016 and 2015 Economic State of the B.C. Forest Sector report 16
Chetwynd and Fort St. John plants started reporting survey data for 2015 mill list report during its testing phase prior to its official opening date in 2016.

27
Table 5: British Columbia Pellet Mill Summary Statistics
2005 2006 2007 2008 2009 2010 2011 2012 2013 2014 2015 2016
%
change
2005-
2016
Number of Mills 5 8 8 9 9 11 11 11 11 12 14 14 180%
Total Capacity (million tonnes) 0.36 0.81 0.99 1.07 0.96 1.31 1.99 1.67 1.69 1.77 2.05 2.22 517%
Total Output (million tonnes) 0.36 0.39 0.41 0.79 0.76 1.11 1.36 1.64 1.68 1.65 1.80 2.06 472%
Total Input (million bone dry units) 0.41 0.44 0.47 0.81 0.68 1.13 1.28 1.37 1.58 1.62 1.73 1.94 373%
Average Capacity (000s tonnes) 72 101 124 119 107 119 181 152 154 148 146 159 120%
Average Fibre Input (thousand bone dry units per mill) 82 55 59 90 76 103 116 125 144 135 124 139 69%
Capacity Utilization (output divided by capacity) 100% 48% 41% 74% 79% 85% 68% 98% 99% 93% 88% 93% -7%
Recovery Factor (Tonnes of output per tonne of bone dry input) 0.88 0.89 0.87 0.98 1.12 0.98 1.06 1.20 1.06 1.02 1.04 1.06 21%
Source: Major Primary Timber Processing Facilities in British Columbia, ministry database, various years
Notes:
Output Capacity is estimated based on three 8-hour shifts, 345 days per year.
Historical data may be adjusted to reflect the new information received in 2017.

28

29
Related References B.C. Ministry of Forests, Lands, Natural Resource Operations and Rural Development (2017, November). 2016 Economic State of the B.C. Forest Sector. Retrieved from https://www2.gov.bc.ca/assets/gov/farming-natural-resources-and-industry/forestry/forest-industry-economics/economic-state/2016_economic_state_of_bc_forest_sector-no_appendix.pdf
Cedar Shake and Shingle Bureau (n.d.).Retrieved from http://www.cedarbureau.org/purchasing/manufacturers.asp Industry Canada. Canadian Industry Statistics. Retrieved from www.ic.gc.ca/eic/site/cis-sic.nsf/eng/home Nielson, R.W.; Dobie, J. and Wright, D.M. (1985). Conversion factors for the forest products industry in Western Canada. Forintek Canada Corporation. Vancouver, British Columbia. Special Publication SP-24R. Retrieved from http://www.fpinnovations.ca/contact_e.htm Pulp and Paper Product Council.(n.d.).Retrieved from www.pppc.org. Spelter, Henry, Rocky Goodnow, and Crystal Gauvin. (2016). Profile 2016: Softwood Sawmills in the United States and Canada. Wood Pellet Association of Canada (n.d.). Retrieved from http://www.pellet.org/.

30
Appendix: List of Mills Figure 20: Administrative Areas and Natural Resource District Boundaries in 2016

31
Lumber Mills
(Listed Alphabetically By Company)
Mills producing lumber provided in separate tables, one for those with estimated annual capacity above 40 million board feet of lumber, and one for those below. The annual capacity reported in the following tables is estimated based on the same standard operating assumption for each mill (i.e. number and length of shifts and days per year as described below). Actual mill production can be higher or lower than estimated capacity if a mill runs on a different operating schedule than assumed here. Thus while capacity provides guidance on mill output, it is not a measure of the actual production level for the mill. For more information, please contact [email protected]. Notes:
1. Measurement units are in millions of board feet. 2. Estimated annual capacity is based on a standardized operation of 240 days per
year, two 8-hour shifts per day. Actual mill operations may vary from this schedule.
3. Administrative areas and natural resource districts were applied (see Figure 20
for details). 4. The List of Lumber Mills is available as an Excel spreadsheet online at: http://www2.gov.bc.ca/gov/content/industry/forestry/competitive-forest-
industry/forest-industry-economics/fibre-mill-information

32
LUMBER MILLS WITH CAPACITY GREATER THAN 40 MILLION BOARD FEET OF LUMBER IN 2016
Mill Number Company Location of Mill Administrative Area Natural Resource District
Estimated
Annual
Capacity
(millions of
board feet)
8 Andersen Pacific Forest Products Ltd Maple Ridge Coast Chilliwack 65
137 Apollo Forest Products Ltd. Fort St James North Fort St. James 125
498 Aspen Planers Ltd. Merritt South Cascades 192
213 Babine Forest Products Ltd. -Hampton Affiliates Burns Lake North Nadina 205
130 Canadian Forest Products Ltd. Mackenzie North Mackenzie 321
193 Canadian Forest Products Ltd. Houston North Nadina 483
90 Canadian Forest Products Ltd. Radium Hot Sprgs South Rocky Mountain 209
160 Canadian Forest Products Ltd. Bear Lake North Prince George 184
64 Canadian Forest Products Ltd. Vavenby South Thompson Rivers 217
166 Canadian Forest Products Ltd. Prince George North Prince George 359
82 Canadian Forest Products Ltd. Elko South Rocky Mountain 215
135 Canadian Forest Products Ltd. Isle Pierre North Prince George 220
140 Canadian Forest Products Ltd. Engen North Vanderhoof 481
127 Canadian Forest Products Ltd. Chetwynd North Peace 217
93 Canadian Forest Products Ltd. Wynndel South Selkirk 61
122 Canadian Forest Products Ltd. Fort St John North Peace 282
150 Carrier Lumber Ltd. Prince George North Prince George 247
133 Conifex Timber Inc. Fort St James North Fort St. James 280
129 Conifex Timber Inc. Mackenzie North Mackenzie 240
181 Decker Lake Forest Products - Hampton Affiliates Ltd. Burns Lake North Nadina 77
326 Delta Cedar Sawmill LP Delta Coast Chilliwack 55
45 Downie Timber Ltd. Revelstoke South Selkirk 120
158 Dunkley Lumber Ltd. Strathnaver North Prince George 528
86 Galloway Lumber Co. Ltd. Galloway South Rocky Mountain 72
66 Gilbert Smith For Prod Ltd. Barriere South Thompson Rivers 69
537 Goldwood Industries Ltd. Richmond Coast Chilliwack 53
14 Gorman Bros Lumber Ltd. Westbank South Okanagan Shuswap 101
1005 Halo Sawmill Manufacturing LP Pitt Meadows Coast Chilliwack 51
30 International Forest Products Ltd. Grand Forks South Selkirk 144
297 International Forest Products Ltd. Hammond Coast Chilliwack 140
70 International Forest Products Ltd. Adams Lake South Thompson Rivers 327
62 International Forest Products Ltd. Castlegar South Selkirk 203
283 International Forest Products Ltd. Delta Coast Chilliwack 123
88 J H Huscroft Ltd. Erickson South Selkirk 44
100 J.S. Jones Surrey Coast Chilliwack 192
50 Kalesnikoff Lumber Co. Ltd. Thrums South Selkirk 65
144 L & M Lumber Ltd. Vanderhoof North Vanderhoof 240
149 Lakeland Mills Ltd Prince George North Prince George 115
1000 Ledcor Chilliwack Coast Chilliwack 78
618 North Enderby Timber Ltd. Enderby South Okanagan Shuswap 70

33
LUMBER MILLS WITH CAPACITY GREATER THAN 40 MILLION BOARD FEET OF LUMBER IN 2016
Mill Number Company Location of Mill Administrative Area Natural Resource District
Estimated
Annual Capacity
(millions of
board feet)
626 Porcupine Wood Products Ltd. Salmo South Selkirk 50
183 ROC Holdings Terrace North Coast Mountain 82
454 S & R Sawmills Ltd. Surrey Coast Chilliwack 223
750 Sigurdson Forest Products Williams Lake South Cariboo Chilcotin 153
539 Stag Timber Ltd. Surrey Coast Chilliwack 86
540 Terminal Forest Products Ltd. Richmond Coast Chilliwack 245
396 Terminal Forest Products Ltd. Vancouver Coast Chilliwack 53
25 Tolko Industries Ltd. Merritt South Cascades 186
98 Tolko Industries Ltd. Quesnel South Quesnel 197
68 Tolko Industries Ltd. Armstrong South Okanagan Shuswap 223
20 Tolko Industries Ltd. Lavington South Okanagan Shuswap 245
67 Tolko Industries Ltd. Kelowna South Okanagan Shuswap 180
103 Tolko Industries Ltd. Williams Lake South Cariboo Chilcotin 227
107 Tolko Industries Ltd. Williams Lake South Cariboo Chilcotin 181
31 Vaagen Fibre Canada Midway South Selkirk 154
552 West Fraser Mills Ltd. Chetwynd North Peace 315
113 West Fraser Mills Ltd. Quesnel South Quesnel 427
214 West Fraser Mills Ltd. Clinton South 100 Mile House 226
95 West Fraser Mills Ltd. 100 Mile House South 100 Mile House 153
532 West Fraser Mills Ltd. LeJac North Vanderhoof 261
191 West Fraser Mills Ltd. Smithers North Skeena Stikine 257
114 West Fraser Mills Ltd. Williams Lake South Cariboo Chilcotin 168
320 Western Forest Products Cowichan Bay Coast South Island 172
528 Western Forest Products Port Alberni Coast South Island 138
392 Western Forest Products Port Alberni Coast South Island 65
546 Western Forest Products Duke Point Coast South Island 81
376 Western Forest Products Ladysmith Coast South Island 74
442 Western Forest Products Ladysmith Coast South Island 177
393 Western Forest Products Chemainus Coast South Island 72
29 Weyerhaeuser Company Ltd. Princeton South Cascades 214

34
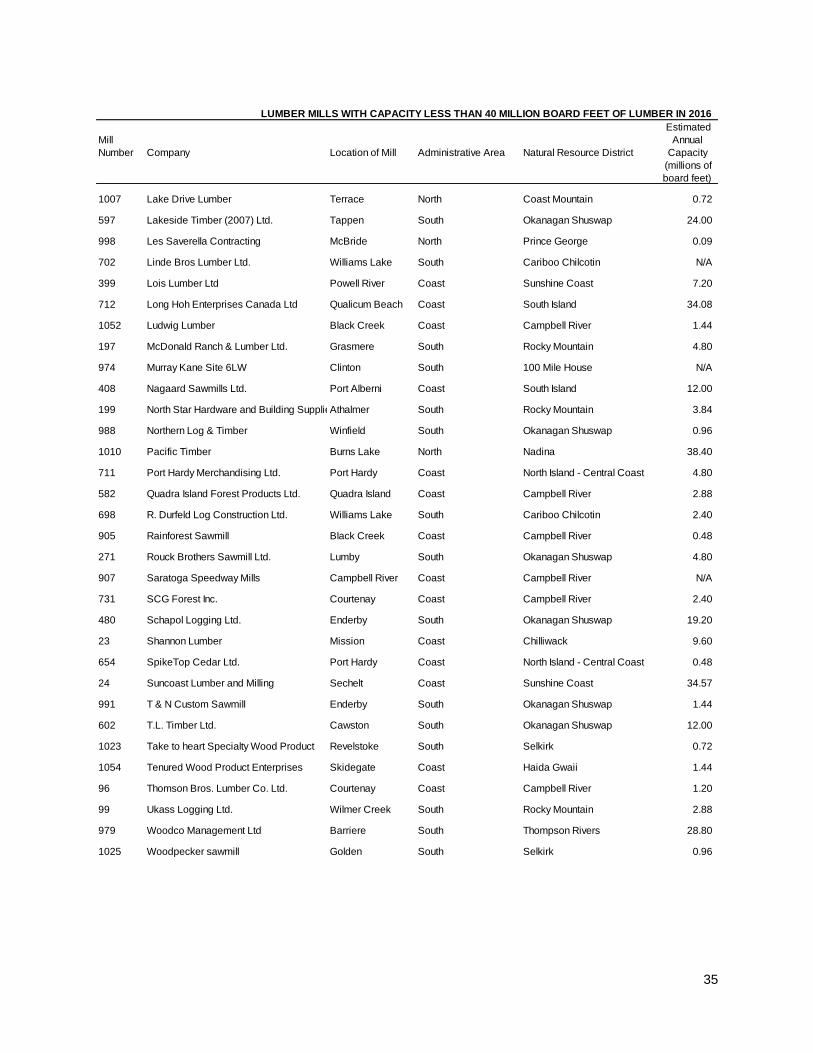
LUMBER MILLS WITH CAPACITY LESS THAN 40 MILLION BOARD FEET OF LUMBER IN 2016
Mill
Number Company Location of Mill Administrative Area Natural Resource District
Estimated
Annual
Capacity
(millions of
board feet)
715 100 Mile Wood Products 100 Mile House South 100 Mile House 3.84
9 A.J. Forest Products ltd. Brackendale Coast Sea to Sky 23.04
5 Abfam Enterprises Ltd. Port Clements Coast Haida Gwaii 9.12
990 Alan Hyde Sawmill Sicamous South Okanagan Shuswap 0.96
10 BC Custom Timber Products Ltd. Vanderhoof North Vanderhoof 14.40
643 Bear Lumber Ltd. Cranbrook South Rocky Mountain 3.84
986 Brasier Mill Masset Coast Haida Gwaii 0.48
255 Buff Lumber Ltd. Westwold South Okanagan Shuswap 12.00
252 C & C Wood Products Ltd. Quesnel South Quesnel 35.90
987 Cambie Cedar Products Ltd. Sicamous South Okanagan Shuswap 10.08
1014 Clarence Palumbo Sawmill Golden South Selkirk N/A
117 Continental Pole Ltd. Pemberton Coast Sea to Sky 1.92
377 Coulson Manufacturing Ltd Port Alberni Coast South Island 31.68
1051 COWICHAN LAKE TIMBER Lake Cowichan Coast South Island 3.36
1003 Duz Cho Forest Products Mackenzie North Mackenzie 25.44
1048 E Schuk contracting Ltd. Tatla Lake South Cariboo Chilcotin 0.16
1056 Eaglecrest Enterprises Port Clements Coast Haida Gwaii 1.44
717 Edgegrain Woss Coast North Island - Central Coast 1.20
732 Edgewater Holdings Ltd. Prince George North Prince George 27.84
1046 Entzminger Sawmill Quesnel South Quesnel N/A
301 Errington Cedar Products Ltd. Errington Coast South Island 16.12
714 Franklin Forest Products Ltd. Port Alberni Coast South Island 19.20
679 G.C. Williams Milling Malcolm Island Coast North Island - Central Coast 1.92
32 Gibbs Custom Sawmill McBride North Prince George 1.20
957 Gold Island Forest Products Ltd. Slocan South Selkirk 16.80
567 Green Forest Products Ltd. Merville Coast Campbell River 0.72
1016 Greenslide Cattle Co Ltd Revelstoke South Selkirk 0.96
955 Gudeit Bros. Cont. Ltd Lumby South Okanagan Shuswap 1.44
975 Harold Turner Pritchard South Thompson Rivers 0.82
1006 Harrop-Proctor Forest Products Horrop South Selkirk 1.92
172 Hauer Bros. Lumber Ltd. Tete Jaune Cache North Prince George 16.80
1058 JCI Touchwood Sawmills Terrace North Coast Mountain 3.60
512 Jemico Enterprises Ltd. Chemainus Coast South Island 10.56
47 Joe Kozek Sawmills Ltd. Revelstoke South Selkirk 14.40
743 John Salo Sointula Coast North Island - Central Coast N/A
184 Kitwanga Forest Products Kitwanga North Skeena Stikine 33.60
1055 Lagace Lumber Ltd Queen Charlotte Coast Haida Gwaii N/A
35
LUMBER MILLS WITH CAPACITY LESS THAN 40 MILLION BOARD FEET OF LUMBER IN 2016
Mill
Number Company Location of Mill Administrative Area Natural Resource District
Estimated
Annual
Capacity
(millions of
board feet)
1007 Lake Drive Lumber Terrace North Coast Mountain 0.72
597 Lakeside Timber (2007) Ltd. Tappen South Okanagan Shuswap 24.00
998 Les Saverella Contracting McBride North Prince George 0.09
702 Linde Bros Lumber Ltd. Williams Lake South Cariboo Chilcotin N/A
399 Lois Lumber Ltd Powell River Coast Sunshine Coast 7.20
712 Long Hoh Enterprises Canada Ltd Qualicum Beach Coast South Island 34.08
1052 Ludwig Lumber Black Creek Coast Campbell River 1.44
197 McDonald Ranch & Lumber Ltd. Grasmere South Rocky Mountain 4.80
974 Murray Kane Site 6LW Clinton South 100 Mile House N/A
408 Nagaard Sawmills Ltd. Port Alberni Coast South Island 12.00
199 North Star Hardware and Building Supplies LTDAthalmer South Rocky Mountain 3.84
988 Northern Log & Timber Winfield South Okanagan Shuswap 0.96
1010 Pacific Timber Burns Lake North Nadina 38.40
711 Port Hardy Merchandising Ltd. Port Hardy Coast North Island - Central Coast 4.80
582 Quadra Island Forest Products Ltd. Quadra Island Coast Campbell River 2.88
698 R. Durfeld Log Construction Ltd. Williams Lake South Cariboo Chilcotin 2.40
905 Rainforest Sawmill Black Creek Coast Campbell River 0.48
271 Rouck Brothers Sawmill Ltd. Lumby South Okanagan Shuswap 4.80
907 Saratoga Speedway Mills Campbell River Coast Campbell River N/A
731 SCG Forest Inc. Courtenay Coast Campbell River 2.40
480 Schapol Logging Ltd. Enderby South Okanagan Shuswap 19.20
23 Shannon Lumber Mission Coast Chilliwack 9.60
654 SpikeTop Cedar Ltd. Port Hardy Coast North Island - Central Coast 0.48
24 Suncoast Lumber and Milling Sechelt Coast Sunshine Coast 34.57
991 T & N Custom Sawmill Enderby South Okanagan Shuswap 1.44
602 T.L. Timber Ltd. Cawston South Okanagan Shuswap 12.00
1023 Take to heart Specialty Wood Product Revelstoke South Selkirk 0.72
1054 Tenured Wood Product Enterprises Skidegate Coast Haida Gwaii 1.44
96 Thomson Bros. Lumber Co. Ltd. Courtenay Coast Campbell River 1.20
99 Ukass Logging Ltd. Wilmer Creek South Rocky Mountain 2.88
979 Woodco Management Ltd Barriere South Thompson Rivers 28.80
1025 Woodpecker sawmill Golden South Selkirk 0.96

36
Pulp and Paper Mills
(Listed Alphabetically By Product) Mills producing pulp and paper are listed in this section. For integrated mills, pulp capacity includes pulp that is used internally to produce paper, and pulp that is shipped from the mill site as market pulp. The annual capacity reported in these tables is estimated based on the same standard operating assumption for each mill (number and length of shifts and days per year as described below). Actual mill production can be higher or lower than estimated capacity if a mill runs on a different operating schedule than assumed here. Thus while capacity provides guidance on mill output, it is not a measure of the actual production level for the mill. For more information, please contact [email protected]. Notes:
1. Measurement units are in thousands of tonnes. 2. Estimated annual capacity is based on a standardized operation of 345 operating
days per year, 24 hours per day. Actual operations may vary from this schedule. 3. Administrative areas and natural resource districts were applied (see Figure 20
for details). 4. The List of Pulp and Paper Mills is available as an Excel spreadsheet online at:
http://www2.gov.bc.ca/gov/content/industry/forestry/competitive-forest-industry/forest-industry-economics/fibre-mill-information

37
PULP AND PAPER MILLS - 2016
Mill
Number Company Location of Mill Product Administrative Area Natural Resource District
Estimated
Annual
Capacity
(000s of
tonnes)
960 Canadian Forest Products Ltd. Prince George PLP North Prince George 352
335 Canadian Forest Products Ltd. Taylor PLP North Peace 210
503 Canadian Forest Products Ltd. Prince George PLP North Prince George 568
500 Canadian Forest Products Ltd. Prince George PLP North Prince George 319
497 Cariboo Pulp & Paper Co. Ltd. Quesnel PLP South Quesnel 315
487 Catalyst Paper Port Alberni PLP Coast South Island 198
486 Catalyst Paper Powell River PLP Coast Sunshine Coast 281
483 Catalyst Paper Crofton PLP Coast South Island 648
2 Domtar Kamloops PLP South Thompson Rivers 351
484 Howe Sound Pulp & Paper Corporation Port Mellon PLP Coast Sunshine Coast 343
488 Nanaimo Forest Products Cedar PLP Coast South Island 358
505 Paper Excellence BV. Mackenzie PLP North Mackenzie 224
553 Quesnel River Pulp Company Quesnel PLP South Quesnel 363
1 Skookumchuk Pulp Inc Skookumchuk PLP South Rocky Mountain 254
501 Zellstoff Celgar Limited Partnership Castlegar PLP South Selkirk 427
500 Canadian Forest Products Ltd. Prince George PPR North Prince George 180
487 Catalyst Paper Port Alberni PPR Coast South Island 312
486 Catalyst Paper Powell River PPR Coast Sunshine Coast 319
483 Catalyst Paper Crofton PPR Coast South Island 391
491 Kruger Products LP New Westminster PPR Coast Chilliwack 57

38
Veneer, Plywood, OSB and Other Panel Mills
(Listed Alphabetically by Product) Mills producing veneer, plywood and other types of panel are listed in this section. For mills that produce both market veneer and plywood, veneer capacity includes market veneer and the veneer that is used within the mill to manufacture plywood. Panel mills that use wood residuals to produce panels or that do not have log-processing capability are also listed in this report. The annual capacity reported in these tables is estimated based on the same standard operating assumption for each mill (number and length of shifts and days per year as described below). Actual mill production can be higher or lower than estimated capacity if a mill runs on a different operating schedule than assumed here. Thus while capacity provides guidance on mill output, it is not a measure of the actual production level for the mill. For more information, please contact [email protected]. Notes:
1. Measurement units are in millions of square feet, 3/8" basis (mill. sq. ft., 3/8").
2. Estimated annual capacity for veneer mills is based on a standardized operation of 240 days per year, two 8-hour shifts per day. For plywood mills, estimated annual capacity is based on a standardized operation of 240 days per year, three 8-hour shifts per day. For OSB and other panel mills, estimated annual capacity is based on a standardized operation of 345 days per year, three 8-hour shifts per day. Actual operations may vary from these schedules.
3. Administrative areas and natural resource districts were applied (see Figure 20 for details).
4. The List of Veneer, Plywood, OSB and Other Panel Mills is available as an Excel spreadsheet online at: http://www2.gov.bc.ca/gov/content/industry/forestry/competitive-forest-industry/forest-industry-economics/fibre-mill-information

39
* Small mills using less than 25,000 cubic metres of logs per year were also included in the above list.
VENEER, PLYWOOD, OSB AND OTHER PANEL MILLS - 2016*
Mill
Number Company Location of Mill Product Administrative Area
Natural Resource
District
Estimated
Annual
Capacity
(million sq.
ft, 3/8"
basis)
109 Aspen Planers Ltd. Savona PLY South Thompson Rivers 121
115 Aspen Planers Ltd. Lillooet VNR South Cascades 134
51 Atco Wood Products Fruitvale VNR South Selkirk 131
34 B C Veneer Products Ltd Surrey VNR Coast Chilliwack 2
12 Canoe Forest Products Ltd. Canoe PLY South Okanagan Shuswap 138
12 Canoe Forest Products Ltd. Canoe VNR South Okanagan Shuswap 154
508 CIPA Lumber Co. Ltd. Annacis Island VNR Coast Chilliwack 216
244 Coastland Wood Industries Ltd. Nanaimo VNR Coast South Island 408
1044 Hardwood Lumber Maple Ridge VNR Coast Chilliwack N/A
650 Louisiana Pacific Canada Ltd. Dawson Creek OSB North Peace 345
84 Louisiana Pacific Canada Ltd. Golden PLY South Selkirk 122
84 Louisiana Pacific Canada Ltd. Golden VNR South Selkirk 138
411 Norbord Inc. 100 Mile House OSB South 100 Mile House 601
942 Peace Valley OSB Fort St John OSB North Peace 660
478 Richmond Plywood Corp. Ltd. Richmond PLY Coast Chilliwack 181
478 Richmond Plywood Corp. Ltd. Richmond VNR Coast Chilliwack 155
1042 Thompson River Veneer Products Ltd. Kamloops PLY South Thompson Rivers 115
394 Tolko Industries Ltd. Heffley Creek PLY South Thompson Rivers 189
68 Tolko Industries Ltd. Armstrong PLY South Okanagan Shuswap 259
68 Tolko Industries Ltd. Armstrong VNR South Okanagan Shuswap 177
394 Tolko Industries Ltd. Heffley Creek VNR South Thompson Rivers 171
35 Tolko Industries Ltd. Lumby VNR South Okanagan Shuswap 184
112 West Fraser Mills Ltd. Quesnel PLY South Quesnel 220
105 West Fraser Mills Ltd. Williams Lake PLY South Cariboo Chilcotin 212
113 West Fraser Mills Ltd. Quesnel PNL South Quesnel 190
105 West Fraser Mills Ltd. Williams Lake VNR South Cariboo Chilcotin 125
112 West Fraser Mills Ltd. Quesnel VNR South Quesnel 129

40
Chip Mills
(Listed Alphabetically By Company) Only mills that produce wood chips as a primary product are listed in this section. The annual capacity reported in these tables is estimated based on the same standard operating assumption for each mill (number and length of shifts and days per year as described below). Actual mill production can be higher or lower than estimated capacity if a mill runs on a different operating schedule than assumed here. Thus while capacity provides guidance on mill output, it is not a measure of the actual production level for the mill. For more information, please contact [email protected]. Notes:
1. Measurement units are in thousands of bone dry units (000 BDUs). 2. Estimated annual capacity is based on a standardized operation of 240 days per
year, two 8-hour shifts per day. Actual operations may vary from this schedule. 3. Administrative areas and natural resource districts were applied (see Figure 20
for details). 4. The List of Chip Mills is available as an Excel spreadsheet online at:
http://www2.gov.bc.ca/gov/content/industry/forestry/competitive-forest-industry/forest-industry-economics/fibre-mill-information

41
Mill
NumberCompany Location of Mill Administrative Area Natural Resource District
Estimated
Annual
Capacity
(000s of
BDUs)
1002 BC Ecochips Ltd Midway South Selkirk 96
252 C & C Wood Products Ltd. Quesnel South Quesnel 1
446 Campbell River Fibre Ltd. Campbell River Coast Campbell River 90
1 Canadian Forest Products Ltd. Skookumchuk South Rocky Mountain 105
166 Canadian Forest Products Ltd. Prince George North Prince George 496
924 Chips Ahoy Fibre Supply Mission Coast Chilliwack 112
345 DCT Chambers Trucking Ltd. Chemainus Coast South Island 142
356 East Fraser Fibre Co Ltd. Mackenzie North Mackenzie 185
409 Howe Sound Pulp & Paper Ltd. Vancouver Coast Chilliwack 256
1057 Jemi Fibre Corporation Lumberton South Rocky Mountain N/A
1013 Karlite Manufacturing Ltd. Cowichan Bay Coast South Island 62
1000 Ledcor Group Chilliwack Coast Chilliwack 109
1050 North Island Chipping Ltd. Port McNeill Coast North Island - Central Coast 75
1021 Pacific Bioenergy Quesnel South Quesnel 132
937 Pacific Fibre Port Mellon Coast Sunshine Coast 120
952 River City Fibre Kamloops South Thompson Rivers 553
18 Terminal Forest Products Ltd. Langdale Dryland Sort Coast Sunshine Coast 11
394 Tolko Industries Ltd. Heffley Creek South Thompson Rivers 96
68 Tolko Industries Ltd. Armstrong South Okanagan Shuswap 43
1024 Trace Resources Merritt South Cascades 142
1001 Valiant Log Sort Ltd. Port Coquitlam Coast Chilliwack 60
113 West Fraser Mills Ltd. Quesnel South Quesnel 269
CHIP MILLS - 2016

42
Pellet Mills
(Listed Alphabetically By Company)
Mills producing wood pellets for bio-energy are listed in this section. The annual capacity reported in these tables is estimated based on the same standard operating assumption for each mill (number and length of shifts and days per year as described below). Actual mill production can be higher or lower than estimated capacity if a mill runs on a different operating schedule than assumed here. Thus while capacity provides guidance on mill output, it is not a measure of the actual production level for the mill. For more information, please contact [email protected]. Notes:
1. Measurement units are in thousands of tonnes. 2. Estimated annual capacity for pellet mills is based on a standardized operation of
345 days per year, three 8-hour shifts per day. Actual operations may vary from these schedules.
3. Administrative areas and natural resource districts were applied (see Figure 20
for details).
4. The List of Pellet Mills is available as an Excel spreadsheet online at: http://www2.gov.bc.ca/gov/content/industry/forestry/competitive-forest-industry/forest-industry-economics/fibre-mill-information
43
PELLET MILLS - 2016
Mill Number Company Location of Mill Administrative Area Natural Resource District
Estimated
Annual
Capacity
('000s of
tonnes)
127 Canfor Energy North Limited Partnership Chetwynd North Peace 88
122 Canfor Energy North Limited Partnership Fort St John North Peace 60
996 Diacarbon Energy Merritt South Cascades 67
1049 Lavington Pellet Limited Partnership Lavington South Okanagan Shuswap 234
930 Pacific BioEnergy Prince George North Prince George 345
980 Pinnacle Pellet Burns Lake Burns Lake North Nadina 319
947 Pinnacle Pellet Houston Houston North Nadina 187
929 Pinnacle Renewable Energy Group Armstrong South Okanagan Shuswap 69
976 Pinnacle Renewable Energy Group Strathnaver North Prince George 221
931 Pinnacle Renewable Energy Group Quesnel South Quesnel 89
948 Pinnacle Renewable Energy Group Williams Lake South Cariboo Chilcotin 201
932 Premium Pellet Ltd. Vanderhoof North Vanderhoof 207
933 Princeton Standard Pellet Corporation Princeton South Cascades 92
995 Vanderhoof Specialty Wood Products Vanderhoof North Vanderhoof 41

44
Pole and Post Mills
(Listed Alphabetically by Product) Mills producing Pole and Post are listed in this section. The annual capacity reported in these tables is estimated based on the same standard operating assumption for each mill (number and length of shifts and days per year as described below). Actual mill production can be higher or lower than estimated capacity if a mill runs on a different operating schedule than assumed here. Thus while capacity provides guidance on mill output, it is not a measure of the actual production level for the mill. For more information, please contact [email protected]. Notes:
1. Measurement units are in thousands of pieces (‘000 pcs). 2. Estimated annual capacity is based on a standardized operation of 240 days per
year, one 8-hour shift per day, although actual mill operations may vary from this schedule.
3. Administrative areas and natural resource districts were applied (see Figure 20
for details). 4. The List of Pole and Post Mills is available as an Excel spreadsheet online at:
http://www2.gov.bc.ca/gov/content/industry/forestry/competitive-forest-industry/forest-industry-economics/fibre-mill-information

45
TYPES OF POLE MILLS - 2016
Mill
Number Company Location of Mill Product Administrative Area Natural Resource District
Estimated
Annual
Capacity
('000s of
pieces)
498 Aspen Planers Ltd. Merritt PLE South Cascades 960
117 Continental Pole Ltd. Pemberton PLE Coast Sea to Sky 12
250 Nicola Post and Rail Ltd. Merritt PLE South Cascades 120
677 Pacific Inland Pole & Piling Ltd. Nakusp PLE South Selkirk 12
498 Aspen Planers Ltd. Merritt PST South Cascades 480
390 Box Lake Lumber Prod Ltd Nakusp PST South Selkirk 600
117 Continental Pole Ltd. Pemberton PST Coast Sea to Sky N/A
1057 Jemi Fibre Corporation Lumberton PST South Rocky Mountain N/A
250 Nicola Post and Rail Ltd. Merritt PST South Cascades 720
725 O'Brien & Fuerst Logging Ltd Port Clements PST Coast Haida Gwaii 6
739 Panhandle Forest Products Lumberton PST South Rocky Mountain 720
232 Princeton Wood Preservers Ltd Princeton PST South Cascades 437
188 Bell Pole and Lumber LLC Rossland UTI South Selkirk 6
659 Brisco Wood Preservers Ltd. Brisco UTI South Rocky Mountain 24
556 Chinook Forest Products Ltd. Courtenay UTI Coast Campbell River 14
117 Continental Pole Ltd. Pemberton UTI Coast Sea to Sky 17
40 Gorman Bros Lumber Ltd. Lumby UTI South Okanagan Shuswap 25
181 Hampton Lumber Mills Canada Ltd. Burns Lake UTI North Nadina 10
1045 Northern Pressure Treated Wood Ltd Campbell River UTI Coast Campbell River N/A
725 O Brien & Fuerst Logging Ltd. Port Clements UTI Coast Haida Gwaii 5
999 Otter Point Timber Ltd. Ladysmith UTI Coast South Island 10
677 Pacific Inland Pole & Piling Ltd. Nakusp UTI South Selkirk 29
48 Stella Jones Inc. Salmon Arm UTI South Okanagan Shuswap 54
222 Stella-Jones Inc. Haney UTI Coast Chilliwack 19
648 STELLA-JONES INC. Galloway UTI South Rocky Mountain 23
637 Stella-Jones Inc. Prince George UTI North Prince George 48

46
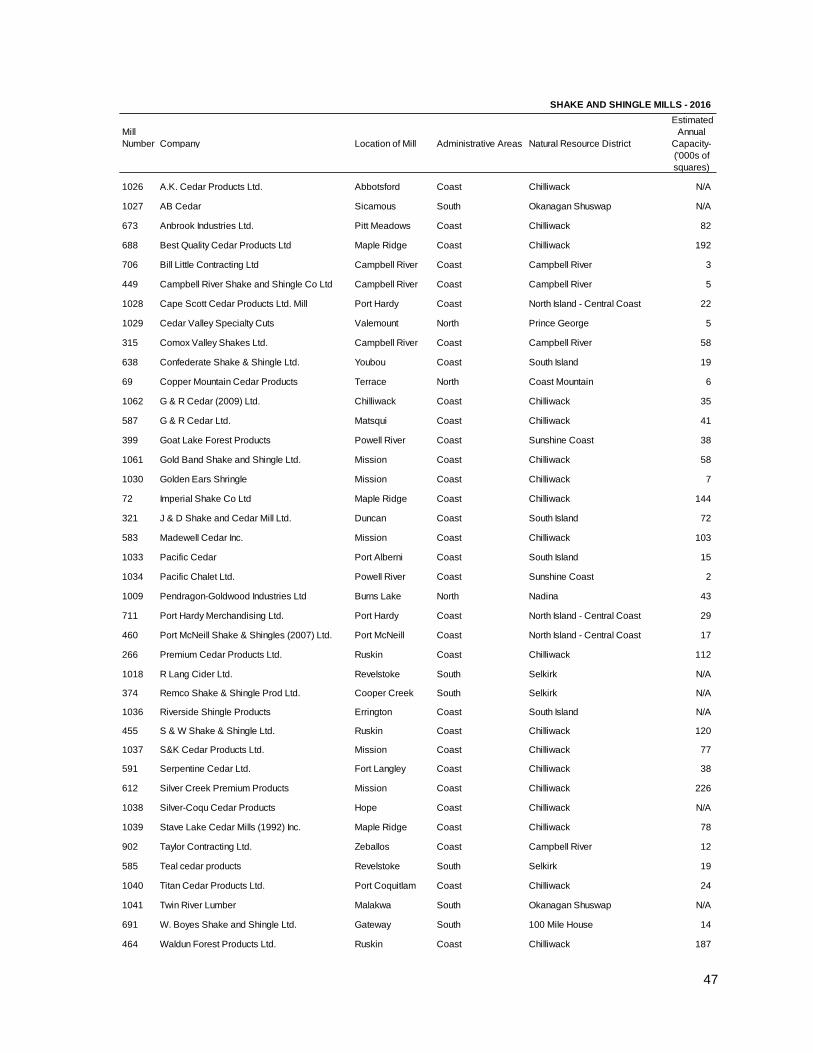
Shake and Shingle Mills
(Listed Alphabetically By Company)
Mills producing shake and shingle are listed in this section. The annual capacity reported in these tables is estimated based on the same standard operating assumption for each mill (number and length of shifts and days per year as described below). Actual mill production can be higher or lower than estimated capacity if a mill runs on a different operating schedule than assumed here. Thus while capacity provides guidance on mill output, it is not a measure of the actual production level for the mill. For more information, please contact [email protected]. Notes:
1. Measurement units are in thousands of roofing squares (000s of squares). A roofing square is approximately 100 square feet.
2. Estimated annual capacity is based on a standardized operation of 240 days per
year, two 8-hour shifts per day. Actual mill operations may vary from this schedule.
3. Administrative areas and natural resource districts were applied (see Figure 20
for details).
4. The List of Shake and Shingle Mills is available as an Excel spreadsheet online at:http://www2.gov.bc.ca/gov/content/industry/forestry/competitive-forest-industry/forest-industry-economics/fibre-mill-information
47
SHAKE AND SHINGLE MILLS - 2016
Mill
Number Company Location of Mill Administrative Areas Natural Resource District
1026 A.K. Cedar Products Ltd. Abbotsford Coast Chilliwack N/A
1027 AB Cedar Sicamous South Okanagan Shuswap N/A
673 Anbrook Industries Ltd. Pitt Meadows Coast Chilliwack 82
688 Best Quality Cedar Products Ltd Maple Ridge Coast Chilliwack 192
706 Bill Little Contracting Ltd Campbell River Coast Campbell River 3
449 Campbell River Shake and Shingle Co Ltd Campbell River Coast Campbell River 5
1028 Cape Scott Cedar Products Ltd. Mill Port Hardy Coast North Island - Central Coast 22
1029 Cedar Valley Specialty Cuts Valemount North Prince George 5
315 Comox Valley Shakes Ltd. Campbell River Coast Campbell River 58
638 Confederate Shake & Shingle Ltd. Youbou Coast South Island 19
69 Copper Mountain Cedar Products Terrace North Coast Mountain 6
1062 G & R Cedar (2009) Ltd. Chilliwack Coast Chilliwack 35
587 G & R Cedar Ltd. Matsqui Coast Chilliwack 41
399 Goat Lake Forest Products Powell River Coast Sunshine Coast 38
1061 Gold Band Shake and Shingle Ltd. Mission Coast Chilliwack 58
1030 Golden Ears Shringle Mission Coast Chilliwack 7
72 Imperial Shake Co Ltd Maple Ridge Coast Chilliwack 144
321 J & D Shake and Cedar Mill Ltd. Duncan Coast South Island 72
583 Madewell Cedar Inc. Mission Coast Chilliwack 103
1033 Pacific Cedar Port Alberni Coast South Island 15
1034 Pacific Chalet Ltd. Powell River Coast Sunshine Coast 2
1009 Pendragon-Goldwood Industries Ltd Burns Lake North Nadina 43
711 Port Hardy Merchandising Ltd. Port Hardy Coast North Island - Central Coast 29
460 Port McNeill Shake & Shingles (2007) Ltd. Port McNeill Coast North Island - Central Coast 17
266 Premium Cedar Products Ltd. Ruskin Coast Chilliwack 112
1018 R Lang Cider Ltd. Revelstoke South Selkirk N/A
374 Remco Shake & Shingle Prod Ltd. Cooper Creek South Selkirk N/A
1036 Riverside Shingle Products Errington Coast South Island N/A
455 S & W Shake & Shingle Ltd. Ruskin Coast Chilliwack 120
1037 S&K Cedar Products Ltd. Mission Coast Chilliwack 77
591 Serpentine Cedar Ltd. Fort Langley Coast Chilliwack 38
612 Silver Creek Premium Products Mission Coast Chilliwack 226
1038 Silver-Coqu Cedar Products Hope Coast Chilliwack N/A
1039 Stave Lake Cedar Mills (1992) Inc. Maple Ridge Coast Chilliwack 78
902 Taylor Contracting Ltd. Zeballos Coast Campbell River 12
585 Teal cedar products Revelstoke South Selkirk 19
1040 Titan Cedar Products Ltd. Port Coquitlam Coast Chilliwack 24
1041 Twin River Lumber Malakwa South Okanagan Shuswap N/A
691 W. Boyes Shake and Shingle Ltd. Gateway South 100 Mile House 14
464 Waldun Forest Products Ltd. Ruskin Coast Chilliwack 187
Estimated
Annual
Capacity-
('000s of
squares)

48