Major Hurricanes in the Gulf of Mexico: Their Potential...
22
Major Hurricanes in the Gulf of Mexico: Their Potential Impact on the Oil and Gas Supply Chain and the Stock Market Response to their Anticipated Landfall by Kirk Philipich Young K. Ro Vivek Sharma All from University of Michigan - Dearborn
Transcript of Major Hurricanes in the Gulf of Mexico: Their Potential...

Major Hurricanes in the Gulf of Mexico:Their Potential Impact on the Oil and Gas
Supply Chain and the Stock Market Response to their Anticipated Landfall
byKirk PhilipichYoung K. Ro
Vivek Sharma
All from University of Michigan - Dearborn
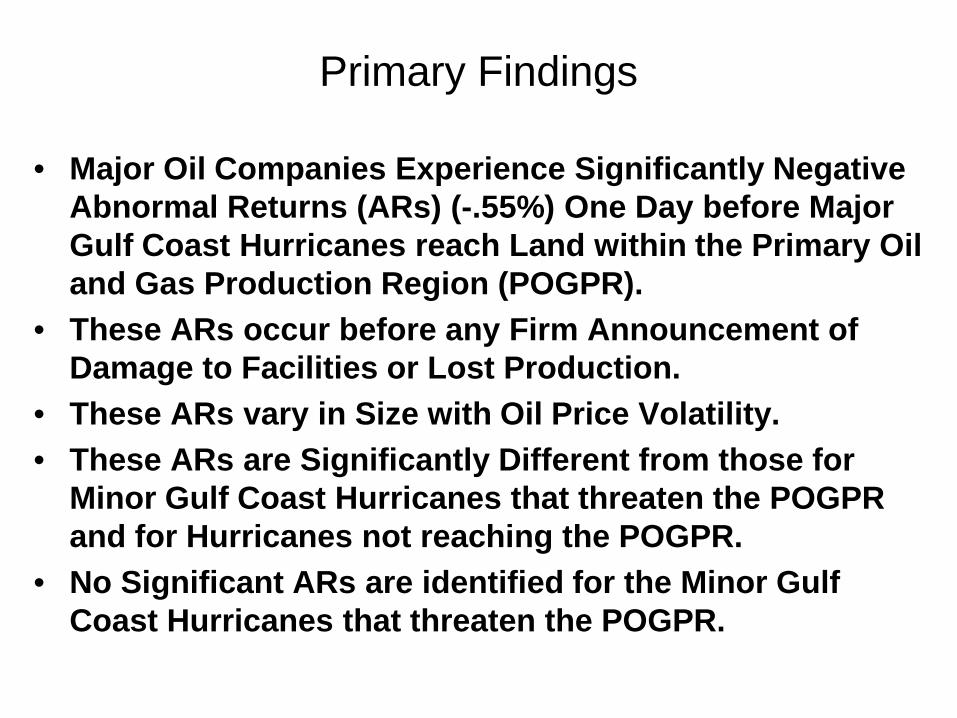
Primary Findings
• Major Oil Companies Experience Significantly Negative Abnormal Returns (ARs) (-.55%) One Day before Major Gulf Coast Hurricanes reach Land within the Primary Oil and Gas Production Region (POGPR).
• These ARs occur before any Firm Announcement of Damage to Facilities or Lost Production.
• These ARs vary in Size with Oil Price Volatility.• These ARs are Significantly Different from those for
Minor Gulf Coast Hurricanes that threaten the POGPR and for Hurricanes not reaching the POGPR.
• No Significant ARs are identified for the Minor Gulf Coast Hurricanes that threaten the POGPR.

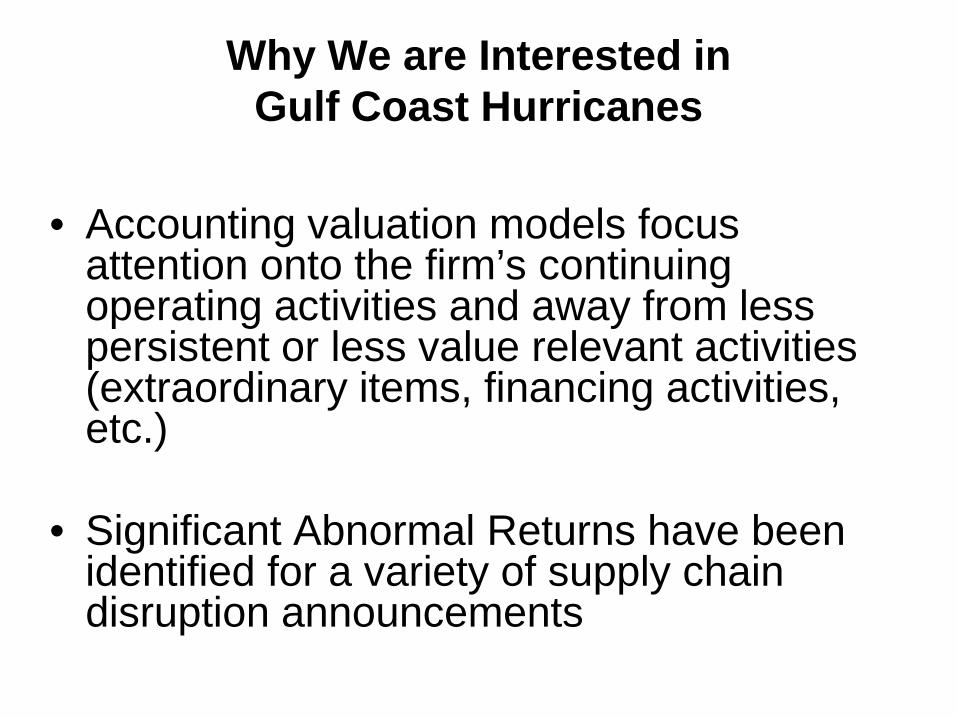
Why We are Interested inGulf Coast Hurricanes
• It is well established that when the accounting function delays the reportingof, or fails to report entirely, value relevant financial information to financial markets these markets attempt to identify alternative information sources (financial analysts, internet chat rooms, etc.). When alternative information sources are not available these decision-makers sometimes assume the worst possible outcome.
Why We are Interested inGulf Coast Hurricanes
• Accounting valuation models focus attention onto the firm’s continuing operating activities and away from less persistent or less value relevant activities (extraordinary items, financing activities, etc.)
• Significant Abnormal Returns have been identified for a variety of supply chain disruption announcements

Why We are Interested inGulf Coast Hurricanes
Should the corporate reporting function provide information to capital markets pertaining to the potential damage that could or actual damage that did occur to the firm’s continuing productive assets as quickly as possible or let the capital markets make their own estimates of the losses attributable to major Gulf Coast hurricanes? These events are NOT a secret!

Saffir-Simpson Hurricane Scale
Category One Hurricane (Winds 74-95 mph):No significant damage to building structures. Damage primarily to unanchored
mobile homes, shrubbery, and trees. Some damage to poorly constructed signs.
Category Two Hurricane (Winds 96-110 mph):Considerable damage to mobile homes, poorly constructed signs, and piers.
Considerable damage to shrubbery and trees with some trees blown down.
Category Three Hurricane (Winds 111-130 mph):Some structural damage to small residences and utility buildings. Mobile homesand poorly constructed signs are destroyed. Damage to shrubbery and trees withfoliage blown off trees and large trees blown down. Flooding near the coast destroyssmaller structures with larger structures damaged by battering from floating debris.
Category Four Hurricane (Winds 131-155 mph):Complete destruction of mobile homes. Major damage to lower floors
of structures near the shore. Some complete roof structure failureson small residences. Shrubs, trees, and all signs are blown down.
Category Five Hurricane (Winds greater than 155 mph):Some complete building failures with small utility buildings blown over or away.Complete destruction of mobile homes. Complete roof failure on many residences
and industrial buildings. All shrubs, trees, and signs blown down.

Major Hurricanes (Category 3 and Higher at Landfall) – 1961 to 2005 Panel A – Landfalls within the Corpus Christi to Apalachicola Corridor: Date of Landfall Day of # Days as Gulf # Firms Portfolio Hurricane Landfall Category Landfall Hurricane in Portfolio Avg. Beta Carla Sept. 11, 1961 4 Monday 4 19 0.88 Hilda Oct. 3, 1964 3 Saturday 4 29 0.79 Betsy Sept. 9, 1965 3 Thursday 2 28 0.89 Camille Aug. 17, 1969 5 Sunday 3 25 1.04 Celia Aug. 3, 1970 3 Monday 3 25 1.15 Carmen Sept. 8, 1974 3 Sunday 3 27 1.06 Eloise Sept. 23, 1975 3 Tuesday 2 27 0.91 Frederic Sept. 13, 1979 3 Thursday 4 25 1.11 Alicia Aug. 18, 1983 3 Thursday 2 22 0.93 Elena Sept. 2, 1985 3 Monday 5 19 0.51 Andrew Aug. 26, 1992 3 Wednesday 3 18 0.48 Opal Oct. 4, 1995 3 Wednesday 3 19 0.47 Ivan Sept. 16, 2004 4 Thursday 3 12 0.71 Dennis July 10, 2005 3 Sunday 2 12 1.02 Katrina Aug. 29, 2005 3 Monday 4 12 1.05 Rita Sept. 24, 2005 3 Saturday 4 11 1.05 Panel B - Landfall south of Apalachicola: Date of Landfall Day of # Days as Gulf # Firms Portfolio Hurricane Landfall Category Landfall Hurricane in Portfolio Avg. Beta Charley Aug. 13, 2004 4 Friday 1 11 0.65 Wilma Oct. 24, 2005 3 Monday 2 11 0.99 Panel C - Landfall south of Corpus Christi: Date of Landfall Day of # Days as Gulf # Firms Portfolio Hurricane Landfall Category Landfall Hurricane in Portfolio Avg. Beta Beulah Sept. 20, 1967 3 Wednesday 4 28 0.93 Allen Aug. 10, 1980 3 Sunday 3 25 1.59 Bret Aug. 23, 1999 3 Monday 4 17 0.47

2009 National Hurricane Center Forecast Verification Report
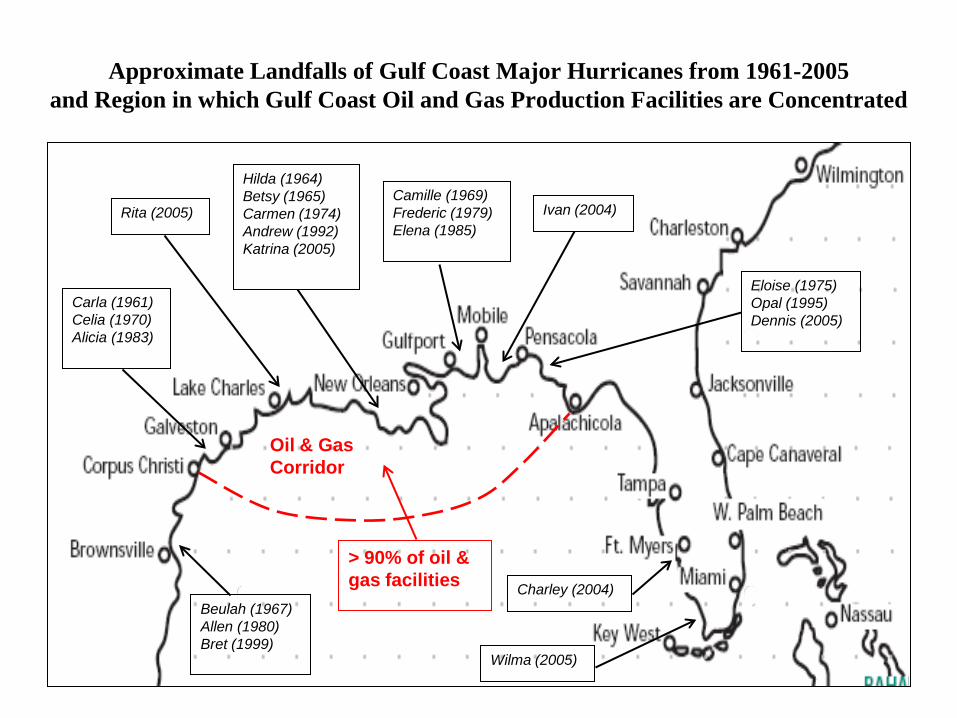
Approximate Landfalls of Gulf Coast Major Hurricanes from 1961-2005 and Region in which Gulf Coast Oil and Gas Production Facilities are Concentrated
Camille (1969)Frederic (1979)Elena (1985)
Ivan (2004)
Charley (2004)
Wilma (2005)
Carla (1961)Celia (1970)Alicia (1983)
Rita (2005)
Oil & Gas Corridor
Hilda (1964)Betsy (1965)Carmen (1974)Andrew (1992)Katrina (2005)
Beulah (1967)Allen (1980)Bret (1999)
Eloise (1975)Opal (1995)Dennis (2005)
> 90% of oil & gas facilities
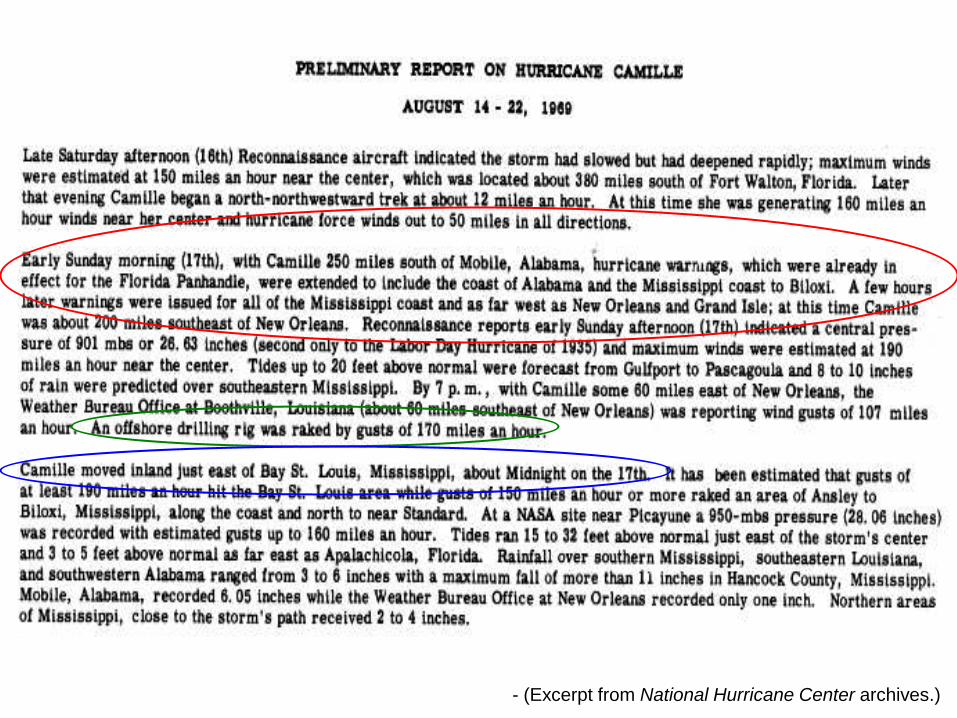
- (Excerpt from National Hurricane Center archives.)

Noise Issue #2 – Day of Landfall
Thursday Friday Saturday Sunday Monday Tuesday Wednesday
Landfall
Day -1 Day 0 Day +1 Calendar Days Day -1 Day 0
CRSP Days
Twenty-One Major Hurricanes – 1963 through 2008 Tuesday thru Saturday Monday Sunday and Labor Day Outside the Corridor 2 2 1 Inside the Corridor 9* 3 4 * Noise Issue #3: Two of these Hurricanes, Alicia and Opal, had major WSJ stories 1-2
days prior to the hurricanes’ landfalls citing future earnings increases for the industry naming several of the sample firms

Significant Abnormal Returns
Least Noisy SampleSeven Major Hurricanes with Landfalls within the Oil and Gas Corridor
(Hurricanes with Landfalls on Tuesday through Saturday)
Significant Mean Percentage Market Model Abnormal ReturnsDay (-1) => -.63* Days (-1,0) => -.63*
Significant Mean Percentage Market Adjusted Abnormal ReturnsDays (-1,0) => -.58*
Wilcoxon Two-Tail Significance Level: * p = 5%; ** p = 1%

Significant Abnormal Returns
Slightly Noisier SampleTen Major Hurricanes with Landfalls within the Oil and Gas Corridor
Hurricanes with Landfalls on Monday through Saturday(Excludes Labor Days)
Significant Mean Percentage Market Model Abnormal ReturnsDay (-1) => -.52** Days (-1,0) => -.60**
Significant Mean Percentage Market Adjusted Abnormal ReturnsDays (-1,0) => -.52**
Wilcoxon Two-Tail Significance Level: * p = 5%; ** p = 1%

Significant Abnormal Returns
Noisiest SampleFourteen Major Hurricanes with Landfalls within the Oil and Gas Corridor
Significant Mean Percentage Market Model Abnormal ReturnsDays (-1,0) => -.58*
Significant Percentage Market Adjusted Abnormal ReturnsDays (-1,0) => -.49*
Wilcoxon Two-Tail Significance Level: * p = 5%; ** p = 1%

What Results might be expected from Regressions on Abnormal Returns?
• Differentiate Abnormal Returns for Hurricanes within the Oil and Gas Corridor from those for Hurricanes outside the Oil and Gas Corridor
• Show a relationship between Abnormal Returns and Oil Price Volatility
• Differentiate Abnormal Returns for Major Hurricanes within the Oil and Gas Corridor from those for Minor Hurricanes within the Oil and Gas Corridor

Abnormal Return Regressions
AR = a + bDWSJ + b2OPV + b3(DC)(OPV) + b4(DDay)(DC)(OPV) + e
AR = a + bDWSJ + b2OPV + b3(DC)(OPV) + b4(DM)(DC)(OPV) + e
AR = Portfolio Abnormal ReturnDWSJ = Dummy => Equals 1 for Hurricanes Alicia and Opal,
0 otherwiseOPV = Oil Price Volatility => Standard Deviation (30 months) for
Producer Prices prior to HurricaneDC = Dummy => Equals 1 if Landfall was within the Oil and
Gas Corridor, 0 otherwiseDDay = Dummy => Equals 1 if Landfall on Tuesday through
Saturday, 0 otherwiseDM = Dummy => Equals 1 if Major Hurricane, 0 otherwise

Regression ResultsRegression Results – Market Model Abnormal Returns
All 21 Major Hurricanes with Landfalls on the U.S. Gulf CoastAR = a + bDWSJ + b2OPV + b3(DC)(OPV) + b4(DDay) (DC)(OPV) + e
Day (-1) Day (0)Constant 0.0012 -0.0035*
DWSJ 0.0200** 0.0015OPV 0.0002 0.0008**
(DC)(OPV) -0.0006** -0.0006**(DDay)(DC)(OPV) -0.0003 0.0003
F-Statistic 13.73** 6.45**Adjusted R2 71.8% 52.1%
All t-tests are two-tail and significance levels are: * p = 5%; ** p = 1%

Regression ResultsRegression Results – Market Model Abnormal Returns
Major Hurricanes (15 in total) with Landfalls on the U.S. Gulf Coast(Excludes Hurricanes before the 1973 Oil Embargo)
AR = a + bDWSJ + b2OPV + b3(DC)(OPV) + b4(DDay) (DC)(OPV) + e
Day (-1) Day (0)Constant 0.0042 -0.0054
DWSJ 0.0180** 0.0027OPV 0.0000 0.0009**
(DC)(OPV) -0.0006* -0.0007*(DDay)(DC)(OPV) -0.0003 0.0003
F-Statistic 10.55** 4.68*Adjusted R2 73.2% 51.2%
All t-tests are two-tail and significance levels are: * p = 5%; ** p = 1%

Minor Hurricanes - Summary• 27 Total => 23 had Landfalls Within the Oil and Gas
Corridor• No Significant Abnormal Returns – Some indication
that the market reaction is smaller (half) and later, perhaps Day (0) and/or Day (+1), than observed for the major hurricanes
Twenty-Seven Minor Hurricanes – 1963 through 2008 Tuesday thru Saturday Monday Sunday and Labor Day Outside the Corridor 4* 0 0 Inside the Corridor 18 4 1 * Noise Issue #3: One Hurricane, Dolly, had a major Senate vote to put in place a windfall
profits tax on integrated oil companies on the day of landfall

Regression ResultsRegression Results – Market Model Abnormal Returns
All Hurricanes (Excluded Dolly) with Landfalls on the U.S. Gulf CoastAR = a + bDWSJ + b2OPV + b3(DC)(OPV) + b4(DM)(DC)(OPV) + e
Day (-1) Day (0)Constant -0.0008 0.0019
DWSJ 0.0204** -0.0015OPV 0.0003 0.0005
(DC)(OPV) -0.0001 -0.0011**(DM)(DC)(OPV) -0.0007** 0.0006*
F-Statistic 7.68** 11.49**Adjusted R2 36.7% 47.7%
All t-tests are two-tail and significance levels are: * p = 5%; ** p = 1%

Regression ResultsRegression Results – Market Model Abnormal Returns
All Hurricanes (34 in total, Excluding Dolly) with Landfalls on the U.S. Gulf Coast(Excludes Hurricanes before the 1973 Oil Embargo)
AR = a + bDWSJ + b2OPV + b3(DC)(OPV) + b4(DM)(DC)(OPV) + e
Day (-1) Day (0)Constant -0.0015 0.0041
DWSJ 0.0209** -0.0031OPV 0.0003 0.0004
(DC)(OPV) -0.0001 -0.0011**(DM)(DC)(OPV) -0.0007** 0.0005*
F-Statistic 5.53** 8.97**Adjusted R2 35.5% 49.1%
All t-tests are two-tail and significance levels are: * p = 5%; ** p = 1%

Regression ResultsRegression Results – Market Model Abnormal Returns
All Hurricanes (39 in total) with Landfalls within the Oil and Gas CorridorAR = a + bDWSJ + b2OPV + b4(DM)(OPV) + e
Day (-1) Day (0)Constant -0.0008 0.0021
DWSJ 0.0204** -0.0017OPV 0.0002* -0.0006**
(DM)(OPV) -0.0007** 0.0006**
F-Statistic 8.23** 10.67**Adjusted R2 36.4% 43.3%
All t-tests are two-tail and significance levels are: * p = 5%; ** p = 1%


![[Drum] Charley Wilcoxon - The All American Drummer - 150 Rudimental Solos (New Version)](https://static.fdocuments.net/doc/165x107/55cf8637550346484b9560d1/drum-charley-wilcoxon-the-all-american-drummer-150-rudimental-solos-new.jpg)