Major and Medium Irrigation Join hands to conserve water · PDF fileMajor and Medium...
10
Join hands to conserve water Department of Water Resources Major and Medium Irrigation Department of Water Resources Major and Medium Irrigation An appeal to corporate sector Prof. Aravind Galagali, Director, KBJNL “One who solves the problem of water is worth two Nobel Prizes, one for Peace and another for Science.” -John F. Kennedy Save water for the future generations. If my parents and grandparents were thoughtful, my generation wouldn’t have faced water scarcity. Water Resources Group 2030
Transcript of Major and Medium Irrigation Join hands to conserve water · PDF fileMajor and Medium...

Join hands to conserve water
Department of Water ResourcesMajor and Medium Irrigation
Department ofWater Resources
Major and Medium Irrigation
An appeal to corporate sector
Prof. Aravind Galagali, Director, KBJNL
“One who solves the problem of water is worth two Nobel Prizes,
one for Peace and another for Science.”
-John F. Kennedy
Save water for the future generations.
If my parentsand grandparents
were thoughtful, mygeneration wouldn’t have
faced water scarcity.
WaterResourcesGroup
2030

Fresh Water - Natural, Precious and ScarceFresh water* is the world's most natural, precious, and scarce
resource. It constitutes less than 3 percent of the world's water.
Of this, only 33 percent is accessible; the remaining 67 percent is
tied up in icebergs, glaciers, and snowcaps (figure 1).
Worldwide, water use is growing twice as fast as the human
population, increasing the gap between supply and demand.
According to 2030 Water Resources Group (2030WRG), an
innovative and neutral public-private-civil society partnership,
by 2030 global freshwater demand is set to be 40 percent above
existing, reliable, and sustainable supplies of freshwater.
Severe water scarcity will lead to life threatening consequences;
water-borne diseases, low agricultural and industrial
productivity and drinking water shortages.
Global water use
70% Agriculture
8% Domestic
22% Industry
*Only fresh water is fit for human consumption. Salt water needs to be
desalinated before consumption. Also, desalination is an expensive
process.
Fig. 2
3
Freshwater 2.5%Surface/other
freshwater 1.2%
Atmosphere3.0%
Living things0.26%
Rivers0.49%
Swampsmarshes2.6%
Soilmoisture3.8%
Other salinewater 0.9%
Ground-water30.1%
Lakes20.9%
Oceans96.5%
Glaciersand
ice caps68.7%
Groundice and
permafrost69.0%
Total globalwater
Freshwater Surface water andother freshwater
Source: Igor Shiklomanov’s chapter “World fresh water resources” in Peter H. Gleick (editor),1993, Water in Crisis: A Guide to the Worlds Fresh Water Resources.
Note: Numbers are rounded, so percent summations may not add to 100.
Where is Earth’s Water?
"There will be constant competition over water, between farming families and urban dwellers,
environmental conservationists and industrialists, minorities living off natural resources and
entrepreneurs seeking to commodify the resources base for commercial gain"
-UNICEF report on Indian water.[1]
Fig. 1
2
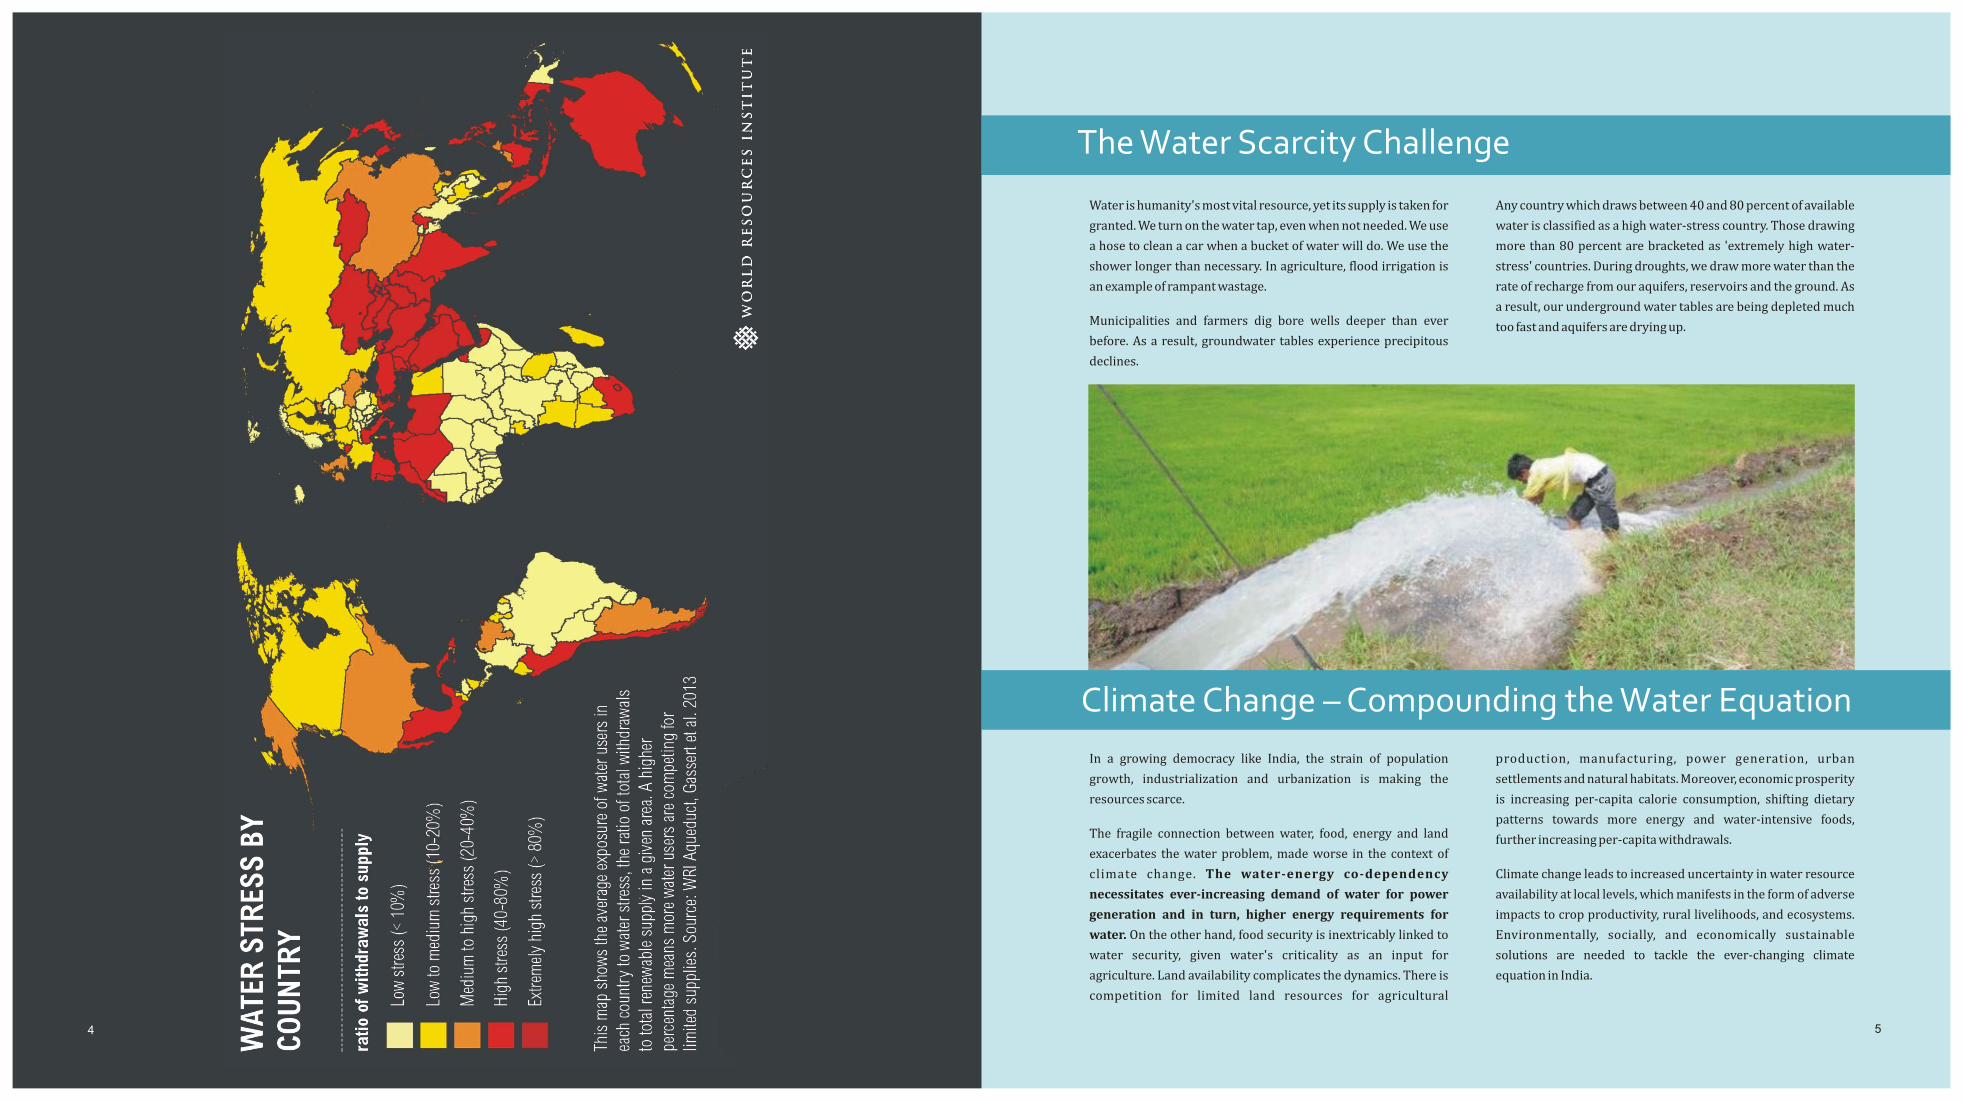
The Water Scarcity Challenge
Water is humanity's most vital resource, yet its supply is taken for
granted. We turn on the water tap, even when not needed. We use
a hose to clean a car when a bucket of water will do. We use the
shower longer than necessary. In agriculture, flood irrigation is
an example of rampant wastage.
Municipalities and farmers dig bore wells deeper than ever
before. As a result, groundwater tables experience precipitous
declines.
In a growing democracy like India, the strain of population
growth, industrialization and urbanization is making the
resources scarce.
The fragile connection between water, food, energy and land
exacerbates the water problem, made worse in the context of
climate change. The water-energy co-dependency
necessitates ever-increasing demand of water for power
generation and in turn, higher energy requirements for
water. On the other hand, food security is inextricably linked to
water security, given water's criticality as an input for
agriculture. Land availability complicates the dynamics. There is
competition for limited land resources for agricultural
Any country which draws between 40 and 80 percent of available
water is classified as a high water-stress country. Those drawing
more than 80 percent are bracketed as 'extremely high water-
stress' countries. During droughts, we draw more water than the
rate of recharge from our aquifers, reservoirs and the ground. As
a result, our underground water tables are being depleted much
too fast and aquifers are drying up.
Climate Change – Compounding the Water Equation
production, manufacturing, power generation, urban
settlements and natural habitats. Moreover, economic prosperity
is increasing per-capita calorie consumption, shifting dietary
patterns towards more energy and water-intensive foods,
further increasing per-capita withdrawals.
Climate change leads to increased uncertainty in water resource
availability at local levels, which manifests in the form of adverse
impacts to crop productivity, rural livelihoods, and ecosystems.
Environmentally, socially, and economically sustainable
solutions are needed to tackle the ever-changing climate
equation in India.
54

The Nature study, published by researchers at McGill and Utrecht University in the Netherlands, offers a map showing the regions
where the use of water from these aquifers vastly exceeds the rate at which they're being refilled by rain.
Are we drying up our groundwater sources?
ecosystems under threat. Major food producing regions of the
world are dependent on freshwater from huge groundwater
aquifers that were built up over thousands of years. These
aquifers are now being sucked dry by irrigation and other uses
faster than they are replenished by rainwater.
The imbalance in India is astounding. For example, the
underground reservoir of the Upper Ganges in northern India
needs 54 times as much rain as it receives to refill the water used
by farmers and the local population (gray “footprint” shown at
the bottom of figure 3).
India with 39 million ha equipped with groundwater irrigation,
stands first among the countries with largest groundwater
irrigated areas, followed by China with 19 million ha and USA
with 17 million ha. In India, groundwater use in irrigation is
increasing, both in absolute terms and as a percentage of total
irrigation. Uncontrolled groundwater extraction exceeds
recharge capacity. In the process, both agriculture and
ecosystems are under threat.
The size of the global groundwater footprint is estimated at
about 3.5 times the actual area of aquifers. About 1.7 billion
people rely on aquifers that are rapidly being depleted, placing
Fig. 3
6
Urban Areas - Rising thirst for waterAccording to a UN report, 200,000 people move into cities
every day. Every second, the world's urban population grows
by two. 91 percent of this migration happens in developing
countries. Today, half of the world's population (3.5
billion)lives in cities. Of this, 827 million live in slums, which
often lack adequate water and sanitation services.
The demand for water in cities is rising. Cities in Asia already face
problems related to water scarcity. An estimated 70 percent of
the world's population will live in urban areas by 2050 and the
demand for water will increase five-fold, according to a Citigroup
study.
India has 4 percent of the world's water resources, (figure. 4), but
supports 16 percent of its population and 15 percent of its
livestock. India's rapidly growing population, which is expected
to reach 1.6 billion by 2050, is putting pressure on its limited
water resources.
The demand for drinking water in India is divided between urban
and rural populations in the ratio of 4:6. People in cities consume
more potable water due to the intensive use of amenities such as
flush toilets and washing machines. The urban population, which
constitutes 30 percent of the total population, is expected to
grow to 50 percent of the total population by 2025. With
governments being unable to adequately meet the need for
potable water, people in cities are increasingly turning to
groundwater, steadily depleting underground aquifers.
Compared to the urban population, people in rural areas require
less water for their day-to-day living.
Bangalore's gross water demand, which was 1,556 MLD in 2010,
is expected to rise to 1,775 MLD in 2016 and 1,986 MLD in 2020.
While Bangalore's supply, with the completion of Cauvery Stage
4, Phase 2, went up from 900MLD to 1,400 MLD, it is inadequate
to meet even the current demand and the future looks anything
but certain.
7
Fig. 4
30000
27000
24000
21000
18000
15000
12000
9000
6000
3000
0
World Average
India China SE Asia US Brazil

The growth of industries and the corporate sector is steadily
increasing their percentage of overall consumption of water. In
light of this, they have a responsibility for sustainable water use
and contributing to water conservation initiatives. If industries
contribute to water conservation through their CSR initiatives,
they can benefit in the long run. A part of the conserved water in
various sectors can be made available to meet their water
requirements.
Industries/Corporateshave a responsibility insustainable water use
9
Rising water consumption in industries
According to the Ministry of Water Resources, the industrial
sector accounted for about 6 percent of total freshwater
abstraction at the beginning of this century, while the Central
Pollution Control Board (CPCB) pegs the figure at 8 percent.
According to World Bank estimates, current industrial water use
in India is about 13 percent of total freshwater withdrawal. Grail
Research(The India Story, March 2009) calculates that the
demand for industrial use will constitute 11 percent or 91.63
trillion liters in 2025 and 18 percent or 161.82 trillion liters in
2050 (figure 5).
Industries consume water and also pollute it. According to the
World Development Report (WDR) of 2003, 70 per cent of
industrial waste in developing countries is dumped without
treatment, thus polluting the usable water supply.
Future industrial water demand will inevitably put pressure on
available freshwater resources, both due to water consumption
and water pollution. To add to this, India scores poorly in terms of
industrial water productivity, which at $3.42/cubic meter is
among the lowest in the world.
Source: Water: The India Story. Grail Research, March 2009. Available online: http://www.grailresearch.com/pdf/ContenPodsPdf/Water-The_India_Story.pdf
89%
6%5%
81%
11%
8%
71%
18%
11%
681
833
899
1000
800
600
400
Agriculture
Industrial
Domestic
Water consumption by sector (Tri litres)
2000 2025E 2050E
Fig. 5
8

Water Gap – Why stakeholdersshould look to the irrigation industry?
2030 Water Resources Group (2030WRG) is an innovative public-
private-civil society platform for collaboration at the global,
national, and local levels. It mobilizes stakeholders from public and
private sectors, civil society, centers of academic expertise, and
financial institutions to engage in fact-based, analytical water
security approaches and coalition building. Its aim is to support
governments in their long-term development and economic growth
plans by catalyzing sustainable water sector transformations and
accelerating reforms. Select global 2030WRG partners include
Nestle, Pepsi Co, International Finance Corporation (IFC), United
Nations Development Program (UNDP), World Wildlife Fund
(WWF), and Swiss Agency for Development and Cooperation (SDC).
2030WRG's report entitled Charting Our Water Future (2009)
estimates that by 2030, global freshwater demand is set to be 40
percent above existing accessible, reliable and sustainable supply of
freshwater (figure 6).
The India analysis of the 2030WRG report (figure 7) outlines a 50
percent water demand-supply deficit by 2030, amounting to 755
billion cubic meters. Due to agriculture's high share in the country's
overall water consumption patterns, changes made here are the
lowest-cost measures to close the gap. Around 80 percent of the gap
can be addressed through a combination of agricultural water
productivity and crop yield enhancement measures.
Increasing water productivity of irrigated agriculture, including
improved water application through drip irrigation, provides a
significant opportunity to bridge the water supply-demand gap. This
entails either increasing efficiency of water use by producing the
same yield with less water, or increasing production using the same
amount of water – more crop per drop. This underscores the key role
expected to be played by the irrigation sector to drive innovation and
productivity gains to improve the country's overall water resources
situation.
Demand Deficit Supply8,000
7,000
6,000
5,000
4,000
3,000
2,000
1,000
0
2% CAGR
4,500
600
800
3,100
Existing1withdrawals
20302withdrawals
Basinswith deficits
Basinswith surplus
4,500
1,500
900
6,900
2,800
100 4,200
700
3,500
(40%)
Groundwater
Surfacewater
Existing accessiblereliable, sustainable
3supply
Agriculture Industry Municipal and domesticSource: 2030 Water Resources Group
‘00
0 G
L
Relevant supplyquantity is much lower
than the absoluterenewable water
availability in nature
Fig. 6
10
Cost of additional water availability in 2030
3Gap in 2030 = 755.800 mCost to close gap = USD 5.9 billion
Specified deficit inbetween supply andwater requirements2030
National river linkingproject (NRLP)
Pre-harvest treatmentMunicipal dams
Agriculture rainwater harvestingDeep groundwater
Aquifer recharge small
Large infrastructureShallow groundwater
Wastewater reuse
Infrastructure rehabilitationRain-fed germplasm
Irrigated integrated plantstress management
Irrigated germplasmDrip irrigation
Industrial leversRain-fed drainage
Irrigated drainageRain-fed fertilizer balance
System of rice intensification (SRI)
Irrigated fertilizer balanceReduced over irrigation
No-till farming
Increase fertilizer use
Reduce transport losses
Sprinkler irrigation
Artificial recharge
Small infrastructure
Genetic crop development – rain-fed
Rain-fed integrated plant stress management
Last mile infrastructure
Genetic crop development – irrigated
Incrementalavailability
3Billion m
Desalination (thermal)
Desalination (reverse osmosis)
On-farm canal lining
Post-harvest management
Rainwater harvesting
Municipal leakage
Source: 2030 Water Resources Group
0.80
0.10
0.08
0.06
0.04
0.02
0
-0.00
-0.04
-0.06
250 500 750 1,000 1,250
Karnataka - A water-stressed state
Karnataka is among India's most water-stressed states. Its
percentage of arid areas is next only to Rajasthan in the country. 68%
of the state's farmland is without irrigation. 54% of the its
geographical area is drought-prone and it has been a victim of
frequent droughts. 38% of its population is living in urban areas as
against 28% for the country as a whole. 26% of its ground water area
is over-exploited. All statistics paint a bleak picture of the state’s
water situation and make it imperative for the state to adopt better
water management practices.
Fig. 7
India-Water availability cost curve
11
Agricultural
Industry
Municipal & Domestic
Supply

Micro Irrigation for Sugarcane - A Water ConservationInitiative by the Government of Karnataka
The Department of Water Resources (Major and Medium
Irrigation), Government of Karnataka, is launching a state-
wide water conservation project in sugarcane cultivation
from January 2015. Under this project, around 4,34,000
hectares will be brought under drip irrigation over three
years. The project will be implemented through a multi-
party agreement among farmers, government, micro-
irrigation companies, banks, and sugar companies, with
2030 Water Resources Group as a key facilitator.
The project envisages a huge reduction in consumption of
water. According to rough estimates, the successful
implementation of the project will reduce water
consumption by 186 TMC at 100 percent implementation,
139 TMC at 75 percent implementation and 110 TMC at 60
percent implementation (of the around 300 TMC water
required for cultivation of sugarcane in the state every
year).
Reduction in consumption of water
Benefit 1
*TMC: Thousand million cubic feet
13
"The wars of the next century will be about Water.”
-Ismail Serageldin, Vice-President of the World Bank
12

Water requirementfor Sugarcanecultivation on4.34 lakh ha
Flood irrigation
330 tmcft
Drip irrigation
144 tmcft
Savings
186 tmcft(56 percent)
Savings in power
Rs. 450 crore
Additionalavailability ofco-generation
power
1,200 MW
Total sugarcane growing area in
Karnataka: 4.34 lakh ha
Average yield and revenue per hectare
Flood irrigation Drip irrigation
Totalyield
87tonnes
Totalyield
170tonnes
RevenueRs. 1.74 lakh
RevenueRs. 3.40 lakh
Incremental Revenue - Rs. 1.64 lakh per ha
Incremental Yield - 83 tonnes per ha
Total yield and revenue from 4.34 lakh ha
378 lakh tonnes
Rs. 7,500 cr
738 lakh tonnes
Rs. 14,700 cr
360 lakh tonnes
Rs. 7,200 cr
FloodIrrigation
DripIrrigation
TotalIncrease
Revenue through Taxes661 crore
15
Benefit 6
Benefit 5
Benefit 2
Under conventional/flood irrigation, an average of 87 tons of
sugarcane is produced in one hectare. Under drip irrigation,
the yield increases to around 170 tons. Thus, 7.38 million
tons of sugarcane can be produced in 434,000 hectares
under drip irrigation, as against 3.87 million tons under
conventional irrigation methods. Monetarily, this translates
to an incremental income of Indian rupees 7,204 crore. The
project will also result in huge reductions in consumption of
planting material, fertilizer and labor. Thus, at 100 percent
implementation, the total incremental income from 434,000
hectares for all the farmers together would be Indian rupees
8,763 crore.
Incremental income to farmers
Incremental benefit to Sugar Mills
Drip irrigation needs less power as pumps are not operated
for long hours. This will result in a saving of 7,492 lakh units
of power or Indian Rupees 449.52 crore at Indian Rupees 6
per unit across 434,000 hectares.
Savings in Power
The government will benefit by saving 186 TMC of water and
Indian rupees 450 crore worth of power. It will earn Indian
rupees 1,216 crore worth of additional power from
cogeneration and Indian rupees 661 crore in additional
taxes. Surplus water can be used to bring more area under
irrigation, distribute water to tail-end areas, and supply
more water to industries and for domestic consumption.
Benefits go Government
Surplus water can be used to meet demand from industries
and for drinking water requirements in rural and urban
areas.
Benefits to industries and citizens
Benefit 3
The project will result in a total incremental benefit of Indian
rupees 4,998 crore (Indian rupees 2,213 crore through
incremental sugar recovery at 1 percent+ Indian rupees
2,785 crore through byproducts, which include bagasse and
press mud).
Benefit 4
14
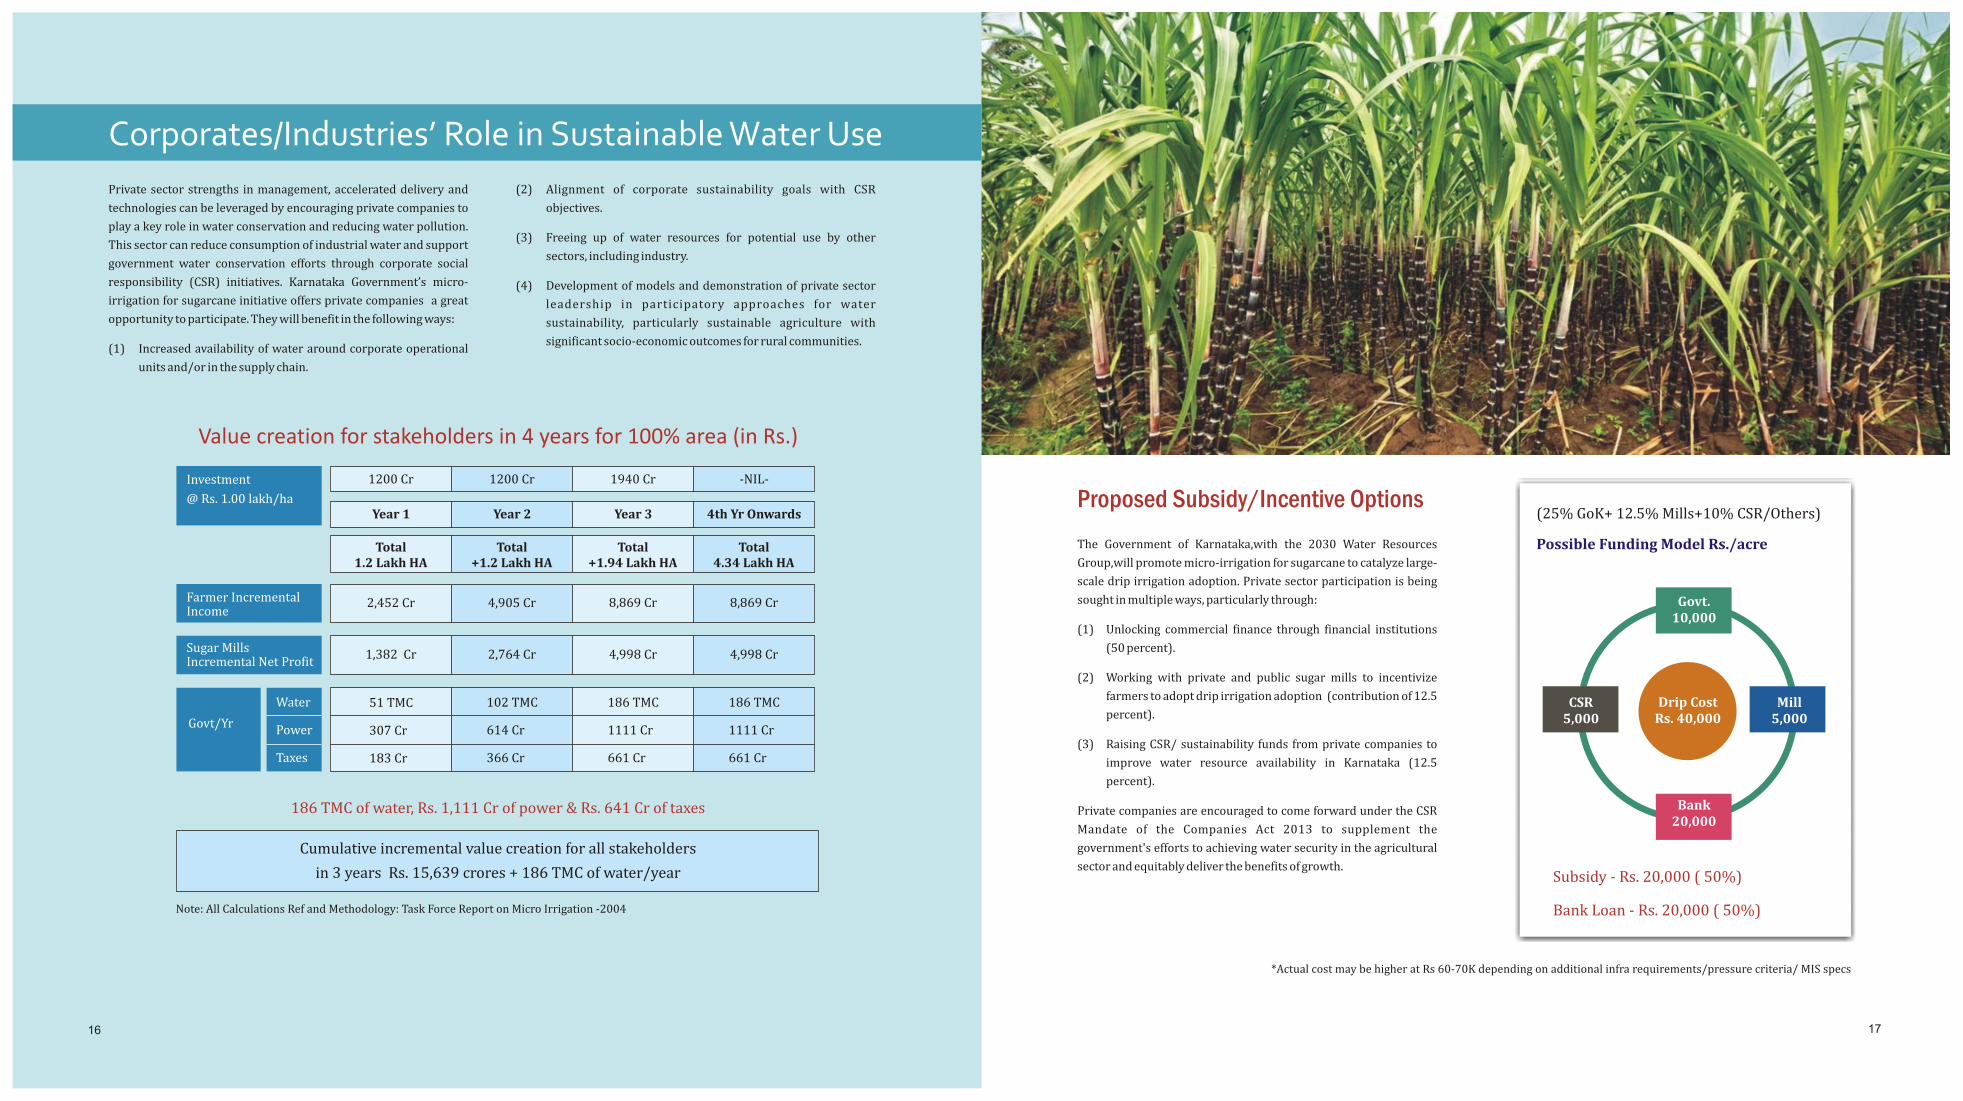
*Actual cost may be higher at Rs 60-70K depending on additional infra requirements/pressure criteria/ MIS specs
(25% GoK+ 12.5% Mills+10% CSR/Others)
Possible Funding Model Rs./acre
CSR5,000
Govt.10,000
Bank20,000
Drip CostRs. 40,000
Mill5,000
Subsidy - Rs. 20,000 ( 50%)
Bank Loan - Rs. 20,000 ( 50%)
Proposed Subsidy/Incentive Options
The Government of Karnataka,with the 2030 Water Resources
Group,will promote micro-irrigation for sugarcane to catalyze large-
scale drip irrigation adoption. Private sector participation is being
sought in multiple ways, particularly through:
(1) Unlocking commercial finance through financial institutions
(50 percent).
(2) Working with private and public sugar mills to incentivize
farmers to adopt drip irrigation adoption (contribution of 12.5
percent).
(3) Raising CSR/ sustainability funds from private companies to
improve water resource availability in Karnataka (12.5
percent).
Private companies are encouraged to come forward under the CSR
Mandate of the Companies Act 2013 to supplement the
government's efforts to achieving water security in the agricultural
sector and equitably deliver the benefits of growth.
17
Corporates/Industries’ Role in Sustainable Water Use
Private sector strengths in management, accelerated delivery and
technologies can be leveraged by encouraging private companies to
play a key role in water conservation and reducing water pollution.
This sector can reduce consumption of industrial water and support
government water conservation efforts through corporate social
responsibility (CSR) initiatives. Karnataka Government’s micro-
irrigation for sugarcane initiative offers private companies a great
opportunity to participate. They will benefit in the following ways:
(1) Increased availability of water around corporate operational
units and/or in the supply chain.
(2) Alignment of corporate sustainability goals with CSR
objectives.
(3) Freeing up of water resources for potential use by other
sectors, including industry.
(4) Development of models and demonstration of private sector
leadership in participatory approaches for water
sustainability, particularly sustainable agriculture with
significant socio-economic outcomes for rural communities.
Value creation for stakeholders in 4 years for 100% area (in Rs.)
Note: All Calculations Ref and Methodology: Task Force Report on Micro Irrigation -2004
Cumulative incremental value creation for all stakeholders
in 3 years Rs. 15,639 crores + 186 TMC of water/year
Year 1 Year 2 Year 3 4th Yr Onwards
Investment
2,452 Cr 4,905 Cr 8,869 Cr 8,869 CrFarmer IncrementalIncome
Sugar MillsIncremental Net Profit
Govt/Yr
1200 Cr 1200 Cr 1940 Cr
Total1.2 Lakh HA
Total +1.2 Lakh HA
Total +1.94 Lakh HA
Total 4.34 Lakh HA
1,382 Cr 2,764 Cr 4,998 Cr 4,998 Cr
Water
Power
Taxes
51 TMC
307 Cr
183 Cr
102 TMC
614 Cr
366 Cr
186 TMC
1111 Cr
661 Cr
186 TMC
1111 Cr
661 Cr
186 TMC of water, Rs. 1,111 Cr of power & Rs. 641 Cr of taxes
@ Rs. 1.00 lakh/ha
-NIL-
16
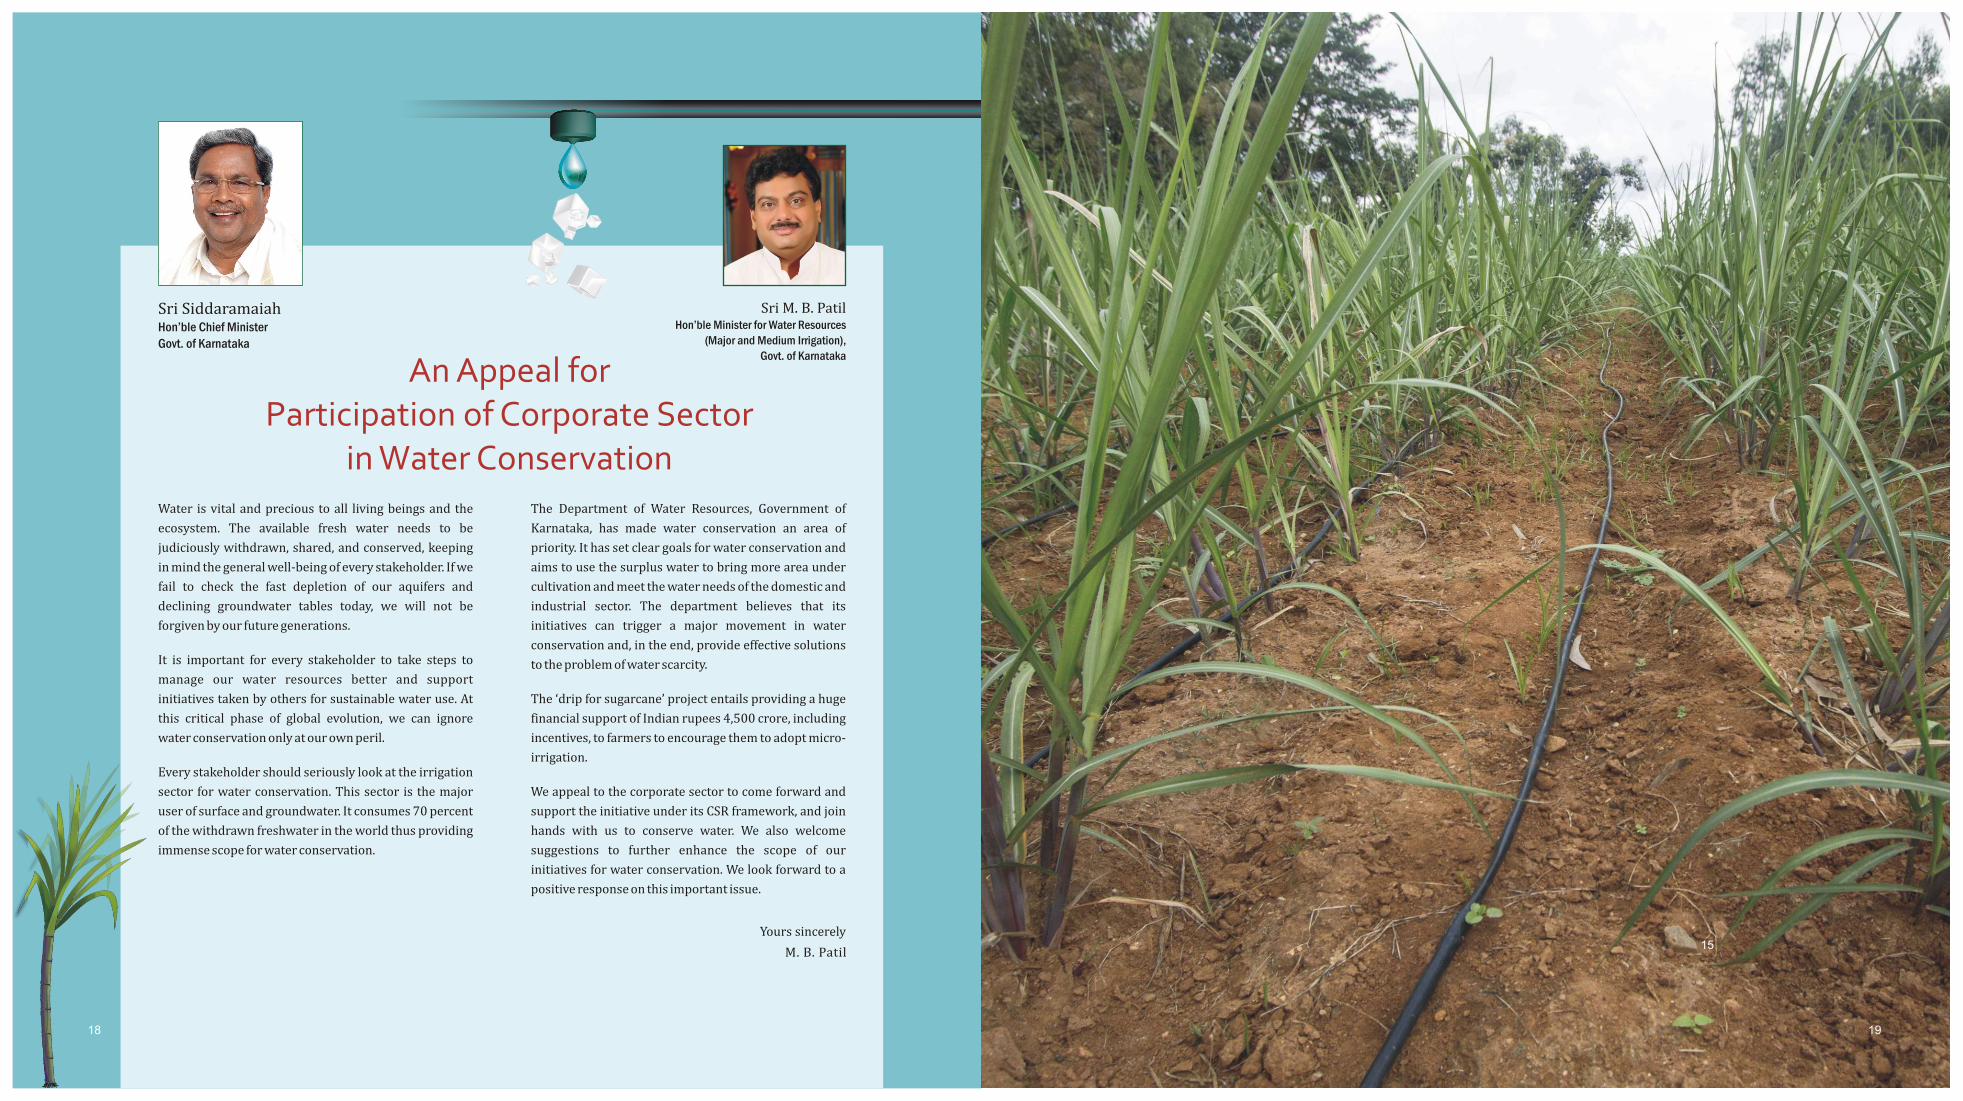
An Appeal forParticipation of Corporate Sector
in Water ConservationWater is vital and precious to all living beings and the
ecosystem. The available fresh water needs to be
judiciously withdrawn, shared, and conserved, keeping
in mind the general well-being of every stakeholder. If we
fail to check the fast depletion of our aquifers and
declining groundwater tables today, we will not be
forgiven by our future generations.
It is important for every stakeholder to take steps to
manage our water resources better and support
initiatives taken by others for sustainable water use. At
this critical phase of global evolution, we can ignore
water conservation only at our own peril.
Every stakeholder should seriously look at the irrigation
sector for water conservation. This sector is the major
user of surface and groundwater. It consumes 70 percent
of the withdrawn freshwater in the world thus providing
immense scope for water conservation.
The Department of Water Resources, Government of
Karnataka, has made water conservation an area of
priority. It has set clear goals for water conservation and
aims to use the surplus water to bring more area under
cultivation and meet the water needs of the domestic and
industrial sector. The department believes that its
initiatives can trigger a major movement in water
conservation and, in the end, provide effective solutions
to the problem of water scarcity.
The ‘drip for sugarcane’ project entails providing a huge
financial support of Indian rupees 4,500 crore, including
incentives, to farmers to encourage them to adopt micro-
irrigation.
We appeal to the corporate sector to come forward and
support the initiative under its CSR framework, and join
hands with us to conserve water. We also welcome
suggestions to further enhance the scope of our
initiatives for water conservation. We look forward to a
positive response on this important issue.
Sri M. B. PatilHon’ble Minister for Water Resources
(Major and Medium Irrigation),Govt. of Karnataka
Sri SiddaramaiahHon’ble Chief MinisterGovt. of Karnataka
18
Yours sincerely
M. B. Patil15
19