Maintenance - the key driver of railway infrastructure costs · 1 Maintenance - the key driver of...
27
1 Maintenance - the key driver of railway infrastructure costs Stasha Jovanovic, Ph.D. Faculty of Technical Sciences, Novi Sad, Serbia Euro Rail Consult, Belgrade, Serbia SEETO Transport Infrastructure Forum, Transport: A driver of growth, Sarajevo, March 22, 2016 [email protected]
Transcript of Maintenance - the key driver of railway infrastructure costs · 1 Maintenance - the key driver of...
1
Maintenance - the key driver of railway infrastructure costs
Stasha Jovanovic, Ph.D.
Faculty of Technical Sciences, Novi Sad, Serbia
Euro Rail Consult, Belgrade, Serbia
SEETO Transport Infrastructure Forum, Transport: A driver of growth, Sarajevo, March 22, 2016
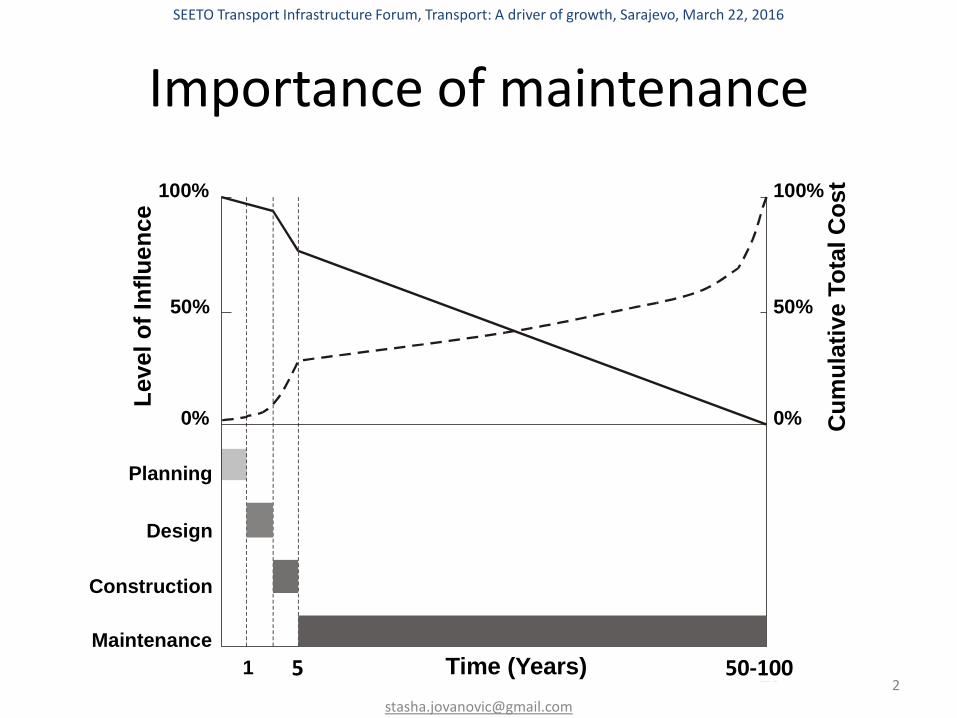
Importance of maintenance
2
Planning
Design
Construction
Maintenance
50%
100%
0%
50%
100%
0%
1 20Time (Years)
Level o
f In
flu
en
ce
Cu
mu
lati
ve T
ota
l C
ost
50-100 5
SEETO Transport Infrastructure Forum, Transport: A driver of growth, Sarajevo, March 22, 2016

Costs of Track maintenance
Mechanical
Maintenance 10 %
Renewal
70 %
Manual
maintenance
20 %
€ 250 million per year for 4.500 km track
Price level 2006
TOTAL MAINTENANCE AND RENEWAL COST on Dutch Railway
network (ProRail)
Average in Western Europe: ≈ 50,000 EUR/km/year on conventional lines
SEETO Transport Infrastructure Forum, Transport: A driver of growth, Sarajevo, March 22, 2016

Track Deterioration “Vicious Circle”
4
Short-wave
irregularities FORCES
Long-wave
track irregularities
Ballast crushing
(creation of “fines”)
Plastic behavior
of ballast
Tamping
Ineffectiveness and
decreased Durability
of Tamping
Rail Damage Sleeper Damage
Substructure Damage
MAIN CULPRITS
SEETO Transport Infrastructure Forum, Transport: A driver of growth, Sarajevo, March 22, 2016

Track Loads
5
• Wavelength • Frequency f
[m] Forces Passenger comfort
QI’s from Track recording cars
SEETO Transport Infrastructure Forum, Transport: A driver of growth, Sarajevo, March 22, 2016
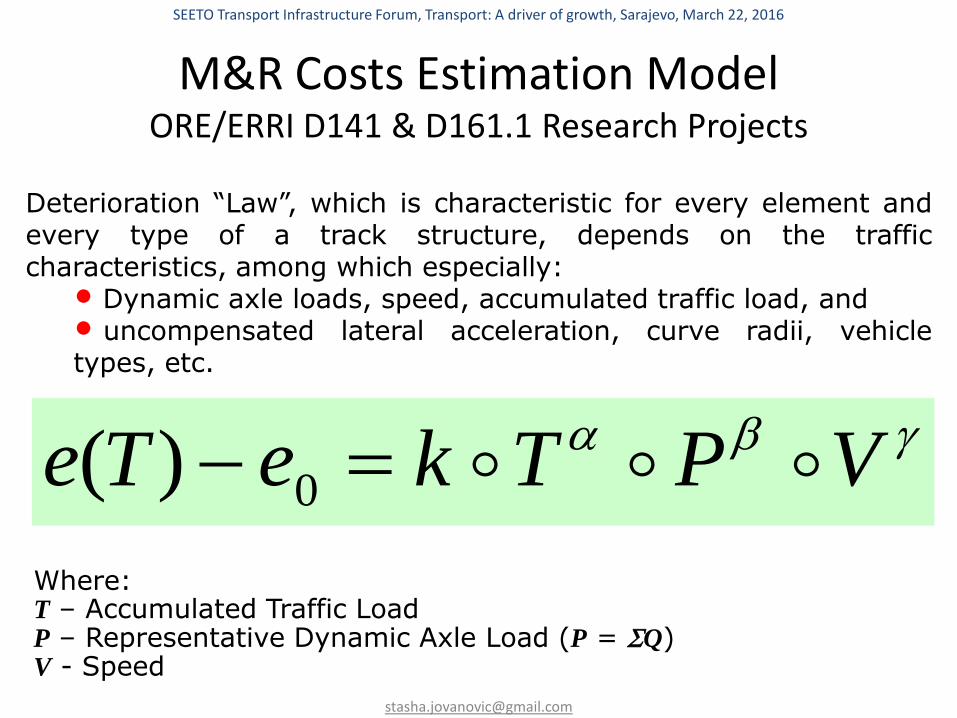
M&R Costs Estimation Model ORE/ERRI D141 & D161.1 Research Projects
Deterioration “Law”, which is characteristic for every element and every type of a track structure, depends on the traffic characteristics, among which especially:
• Dynamic axle loads, speed, accumulated traffic load, and • uncompensated lateral acceleration, curve radii, vehicle types, etc.
VPTkeTe 0)(
Where: T – Accumulated Traffic Load P – Representative Dynamic Axle Load (P = SQ) V - Speed
SEETO Transport Infrastructure Forum, Transport: A driver of growth, Sarajevo, March 22, 2016
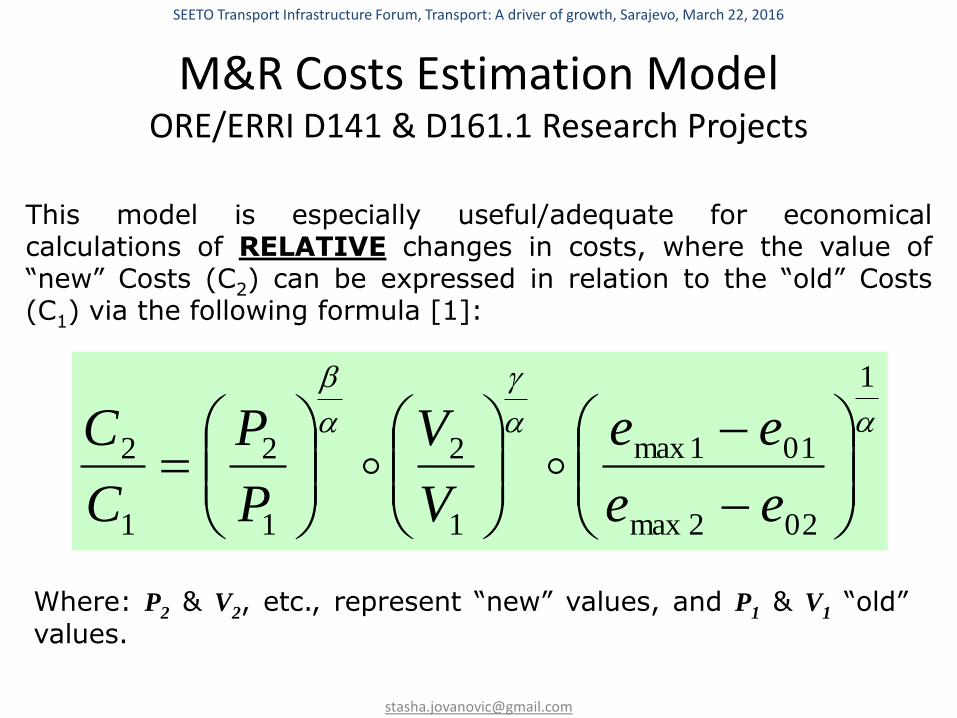
M&R Costs Estimation Model ORE/ERRI D141 & D161.1 Research Projects
This model is especially useful/adequate for economical calculations of RELATIVE changes in costs, where the value of “new” Costs (C2) can be expressed in relation to the “old” Costs (C1) via the following formula [1]:
Where: P2 & V2, etc., represent “new” values, and P1 & V1 “old”
values.
1
022max
011max
1
2
1
2
1
2
ee
ee
V
V
P
P
C
C
SEETO Transport Infrastructure Forum, Transport: A driver of growth, Sarajevo, March 22, 2016
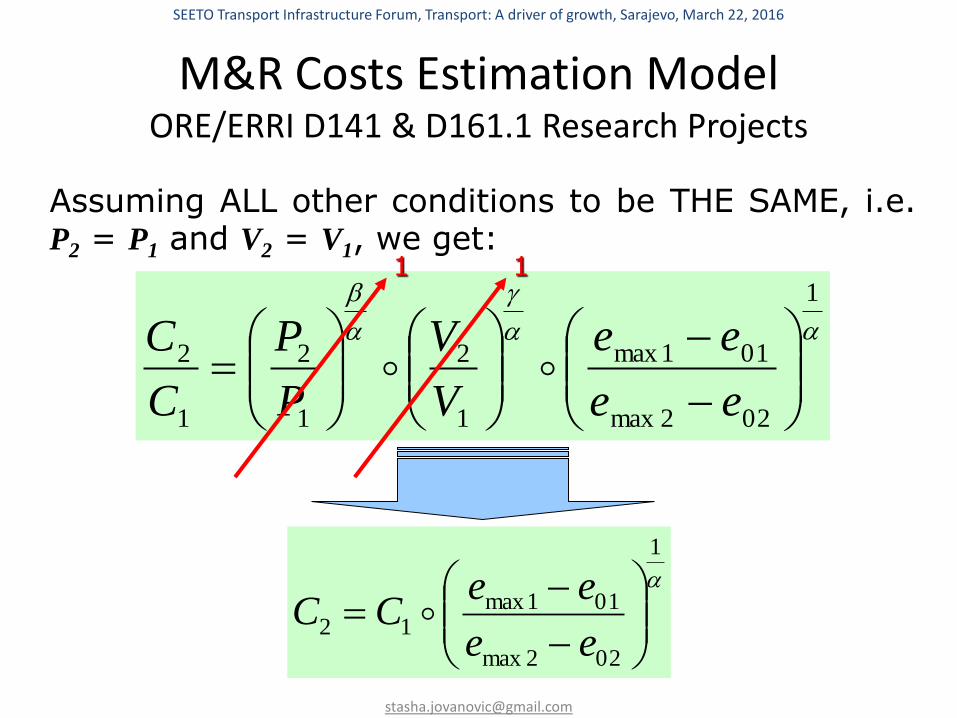
M&R Costs Estimation Model ORE/ERRI D141 & D161.1 Research Projects
Assuming ALL other conditions to be THE SAME, i.e. P2 = P1 and V2 = V1, we get:
1
022max
011max
1
2
1
2
1
2
ee
ee
V
V
P
P
C
C
1 1
1
022max
011max12
ee
eeCC
SEETO Transport Infrastructure Forum, Transport: A driver of growth, Sarajevo, March 22, 2016
M&R Costs Estimation Model ORE/ERRI D141 & D161.1 Research Projects
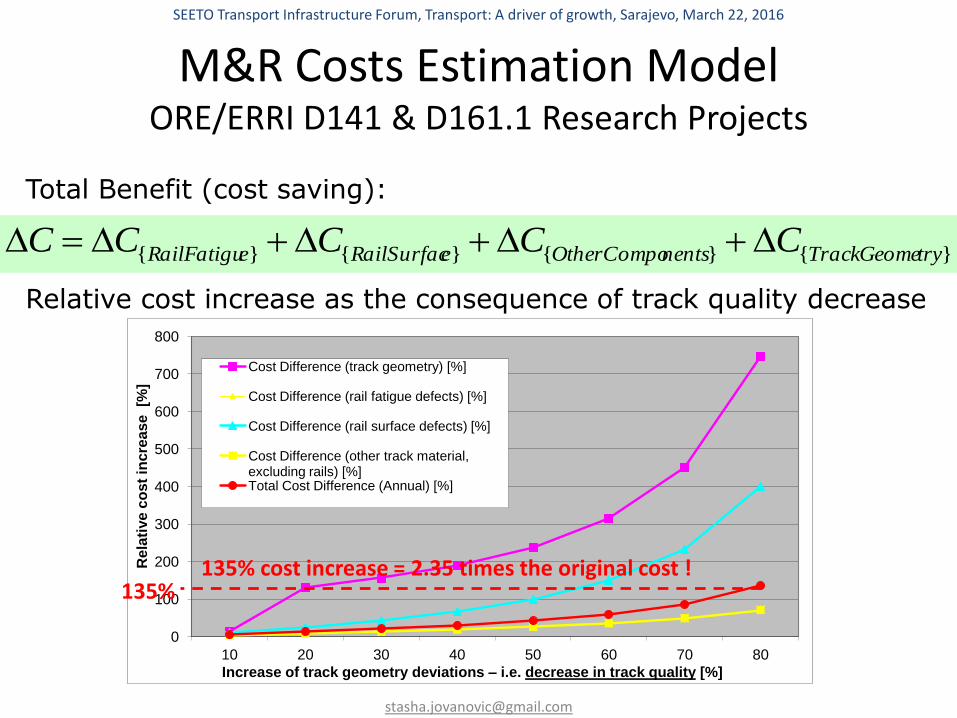
}{}{}{}{ tryTrackGeomenentsOtherCompoeRailSurfaceRailFatigu CCCCC
Total Benefit (cost saving):
0
100
200
300
400
500
600
700
800
10 20 30 40 50 60 70 80
Re
lati
ve
co
st
incre
as
e [%
]
Increase of track geometry deviations – i.e. decrease in track quality [%]
Cost Difference (track geometry) [%]
Cost Difference (rail fatigue defects) [%]
Cost Difference (rail surface defects) [%]
Cost Difference (other track material, excluding rails) [%] Total Cost Difference (Annual) [%]
Relative cost increase as the consequence of track quality decrease
135% cost increase = 2.35 times the original cost ! 135%
SEETO Transport Infrastructure Forum, Transport: A driver of growth, Sarajevo, March 22, 2016
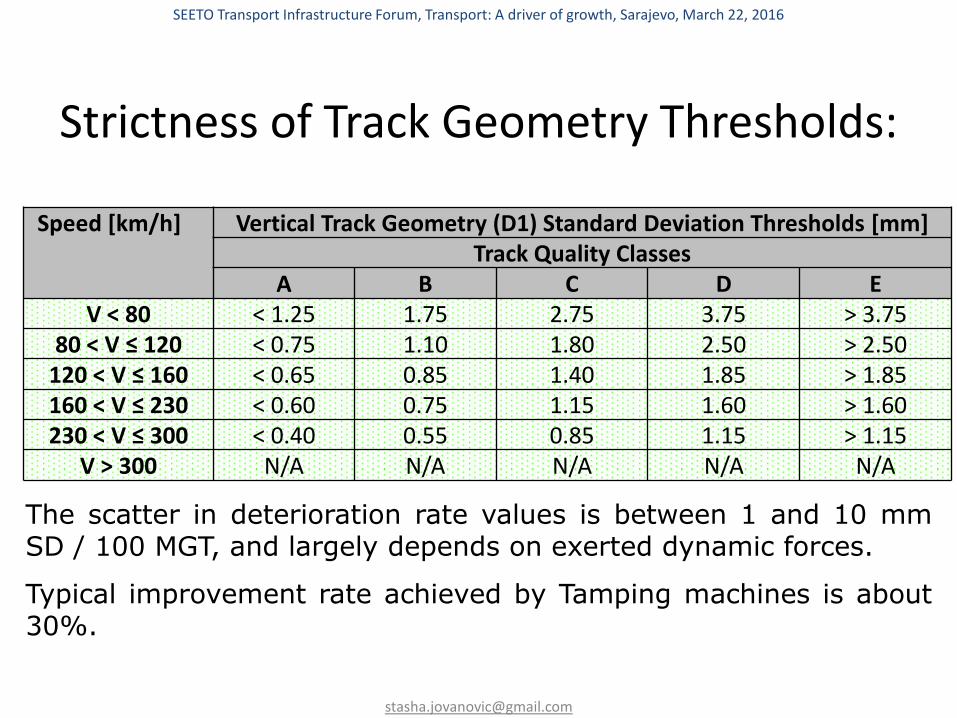
Strictness of Track Geometry Thresholds:
Speed [km/h] Vertical Track Geometry (D1) Standard Deviation Thresholds [mm] Track Quality Classes
A B C D E
V < 80 < 1.25 1.75 2.75 3.75 > 3.75
80 < V ≤ 120 < 0.75 1.10 1.80 2.50 > 2.50
120 < V ≤ 160 < 0.65 0.85 1.40 1.85 > 1.85
160 < V ≤ 230 < 0.60 0.75 1.15 1.60 > 1.60
230 < V ≤ 300 < 0.40 0.55 0.85 1.15 > 1.15
V > 300 N/A N/A N/A N/A N/A
The scatter in deterioration rate values is between 1 and 10 mm SD / 100 MGT, and largely depends on exerted dynamic forces.
Typical improvement rate achieved by Tamping machines is about 30%.
SEETO Transport Infrastructure Forum, Transport: A driver of growth, Sarajevo, March 22, 2016
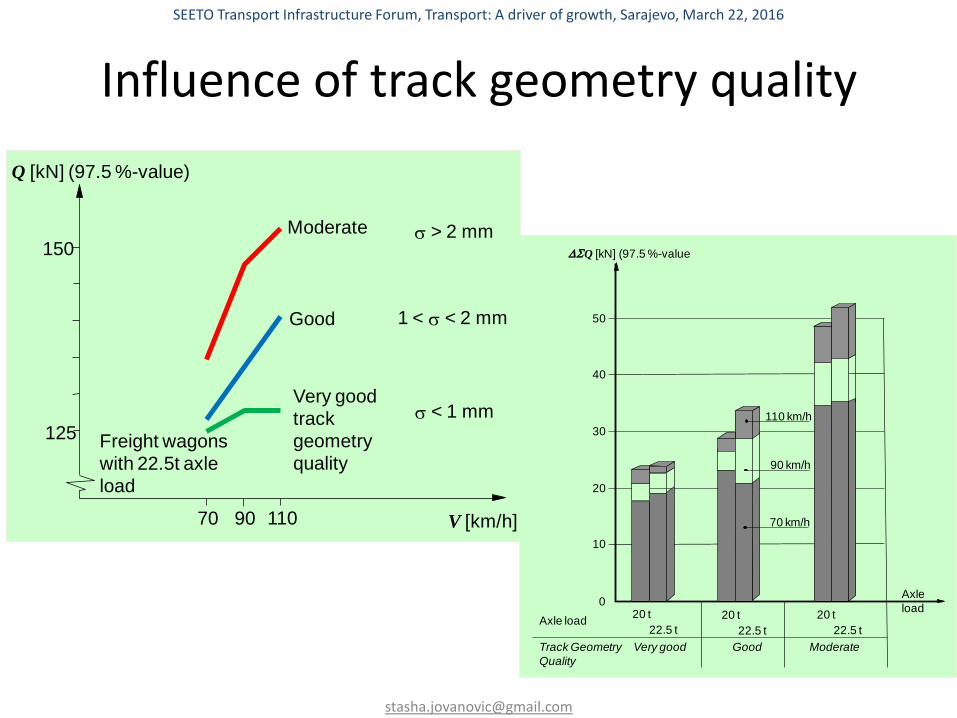
Influence of track geometry quality
150
125
Q [kN] (97.5 %-value)
V [km/h]70 90 110
Moderate
Good
Very good
track
geometry
quality
s > 2 mm
1 < s < 2 mm
s < 1 mm
Freight wagons
with 22.5t axle
load
0
10
20
30
40
50
SQ [kN] (97.5 %-value
Axle
load20 t
22.5 t
20 t
22.5 t
20 t
22.5 t
Very good Good ModerateTrack Geometry
Quality
110 km/h
90 km/h
70 km/h
Axle load
SEETO Transport Infrastructure Forum, Transport: A driver of growth, Sarajevo, March 22, 2016

Influence of rail welds quality
1
2
3
4
5
6
02 4 6 8 10 12 14 16 18 20 22
time [ms]
Q
Q= Dynamic amplificationDynamic amplification
Time t
P1 force
P2 force
6
5
4
3
2
1
0 20 40 60 80 100 120
Dynamic amplification
Q-force
speed [km/h]
Dynamic amplification
force
Speed V
SEETO Transport Infrastructure Forum, Transport: A driver of growth, Sarajevo, March 22, 2016
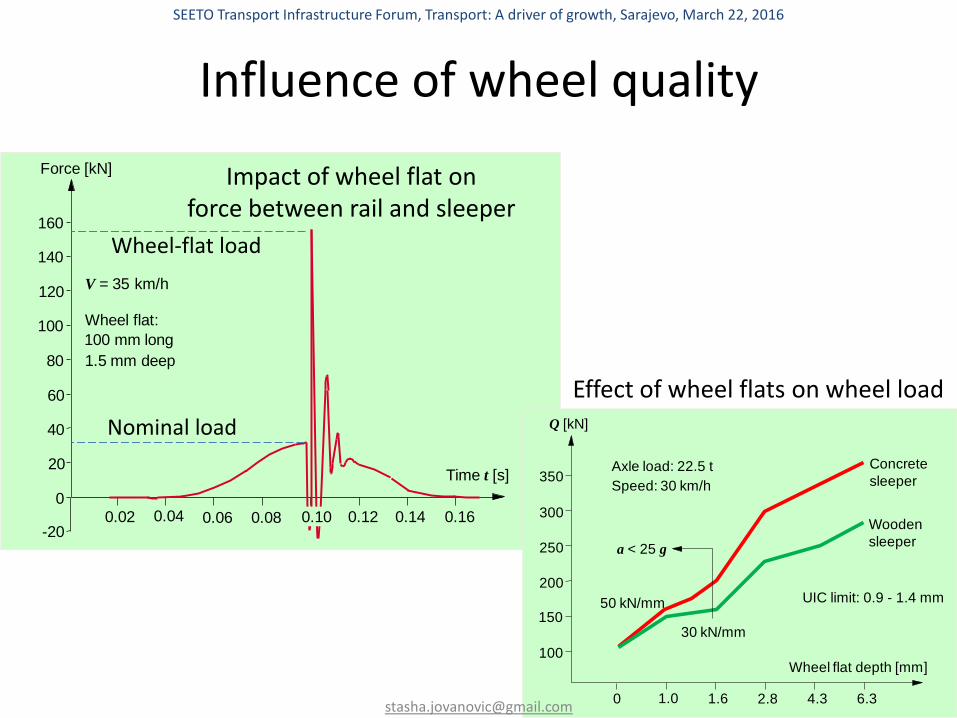
Influence of wheel quality
Time t [s]
Force [kN]
160
140
120
100
80
60
40
20
0
-200.02 0.04 0.06 0.08 0.12 0.14 0.16
V = 35 km/h
Wheel flat:
1.5 mm deep
0.10
100 mm long
Impact of wheel flat on force between rail and sleeper
100
150
200
250
300
350
Wheel flat depth [mm]
Q [kN]
0 1.0 1.6 2.8 4.3 6.3
Concrete
sleeperAxle load: 22.5 t
Speed: 30 km/h
Wooden
sleeper
50 kN/mm
30 kN/mm
a < 25 g
UIC limit: 0.9 - 1.4 mm
Effect of wheel flats on wheel load
Nominal load
Wheel-flat load
SEETO Transport Infrastructure Forum, Transport: A driver of growth, Sarajevo, March 22, 2016
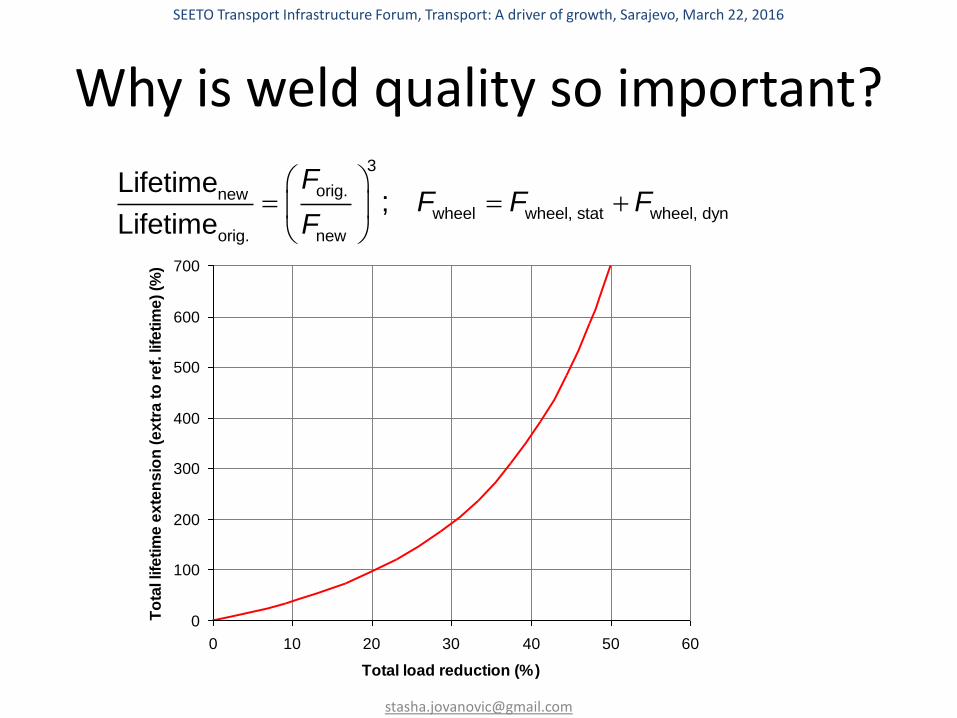
Why is weld quality so important?
0
100
200
300
400
500
600
700
0 10 20 30 40 50 60
Total load reduction (%)
To
tal life
tim
e e
xte
ns
ion
(e
xtr
a t
o r
ef.
lif
eti
me
) (%
)
3
orig.newwheel wheel, stat wheel, dyn
orig. new
Lifetime;
Lifetime
FF F F
F
SEETO Transport Infrastructure Forum, Transport: A driver of growth, Sarajevo, March 22, 2016

Expected Cost Savings
10 – 20 % of annual maintenance budget;
ProRail budget in The Netherlands: ~ € 250 mio for 4,500 single track;
Savings: € 25 – 50 mio total, or € 5 – 10,000 per km of single track every year.
TOTAL MAINTENANCE AND RENEWAL COST ON NS
Mechanical
Maintenance 10 %
Renewal
70 %
Manual
maintenance
20 %
€ 250 million per year for 4.500 km trackPrice level 2006
Due to impact load reduction at welds:
SEETO Transport Infrastructure Forum, Transport: A driver of growth, Sarajevo, March 22, 2016
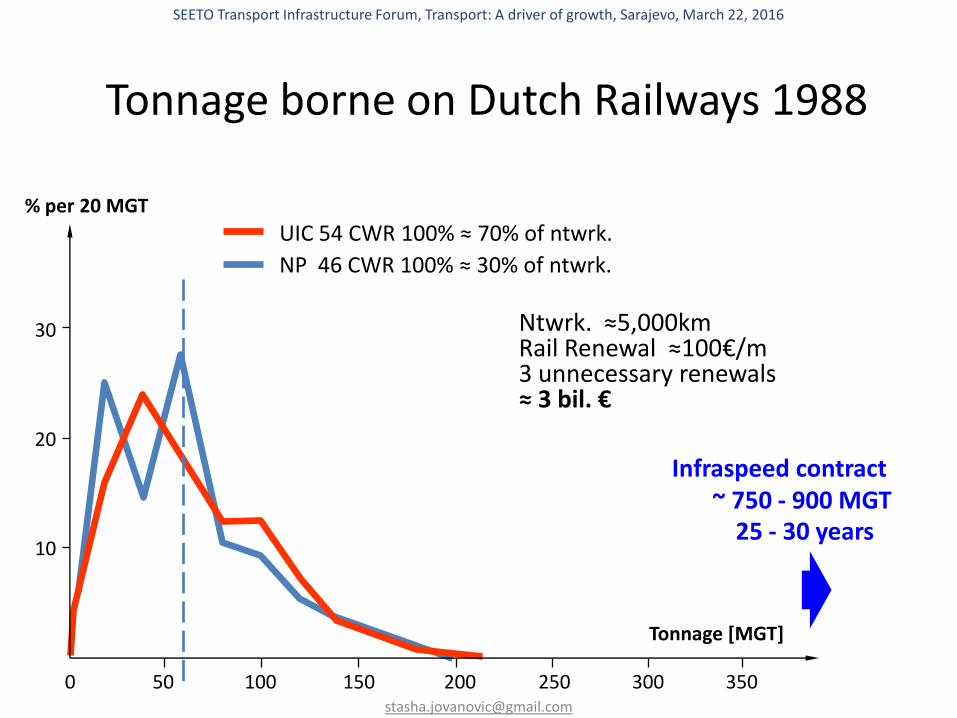
Tonnage borne on Dutch Railways 1988
Tonnage [MGT]
% per 20 MGT
UIC 54 CWR 100% ≈ 70% of ntwrk.
0 50 100 150 200 250 300 350
10
20
30
NP 46 CWR 100% ≈ 30% of ntwrk.
25 - 30 years
Infraspeed contract ~ 750 - 900 MGT
Ntwrk. ≈5,000km Rail Renewal ≈100€/m 3 unnecessary renewals ≈ 3 bil. €
SEETO Transport Infrastructure Forum, Transport: A driver of growth, Sarajevo, March 22, 2016
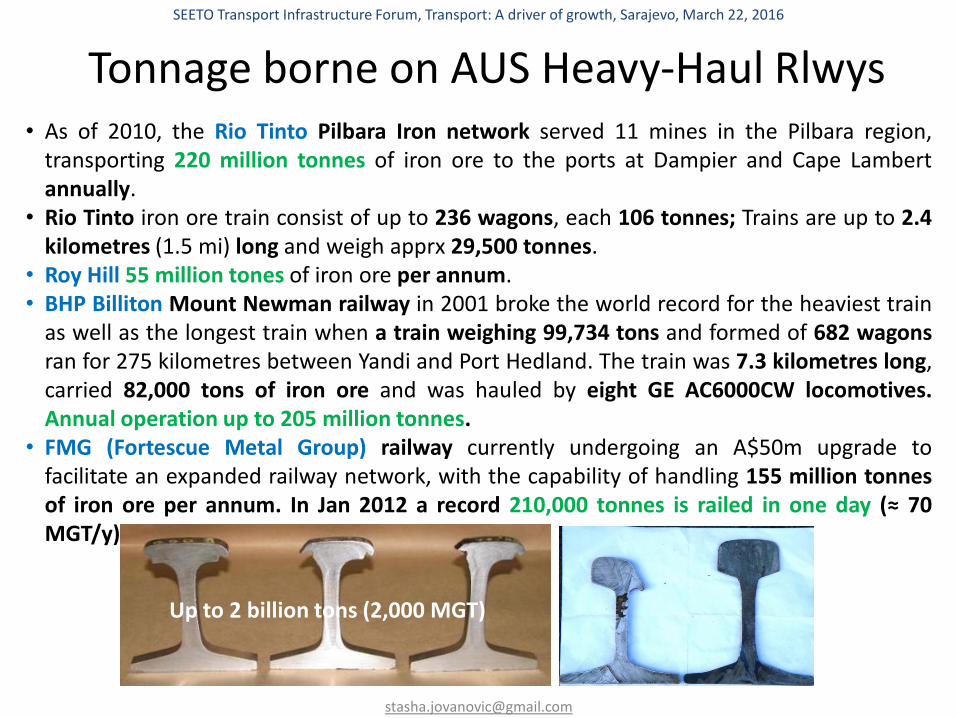
• As of 2010, the Rio Tinto Pilbara Iron network served 11 mines in the Pilbara region, transporting 220 million tonnes of iron ore to the ports at Dampier and Cape Lambert annually.
• Rio Tinto iron ore train consist of up to 236 wagons, each 106 tonnes; Trains are up to 2.4 kilometres (1.5 mi) long and weigh apprx 29,500 tonnes.
• Roy Hill 55 million tones of iron ore per annum. • BHP Billiton Mount Newman railway in 2001 broke the world record for the heaviest train
as well as the longest train when a train weighing 99,734 tons and formed of 682 wagons ran for 275 kilometres between Yandi and Port Hedland. The train was 7.3 kilometres long, carried 82,000 tons of iron ore and was hauled by eight GE AC6000CW locomotives. Annual operation up to 205 million tonnes.
• FMG (Fortescue Metal Group) railway currently undergoing an A$50m upgrade to facilitate an expanded railway network, with the capability of handling 155 million tonnes of iron ore per annum. In Jan 2012 a record 210,000 tonnes is railed in one day (≈ 70 MGT/y)
Up to 2 billion tons (2,000 MGT)
Tonnage borne on AUS Heavy-Haul Rlwys
SEETO Transport Infrastructure Forum, Transport: A driver of growth, Sarajevo, March 22, 2016
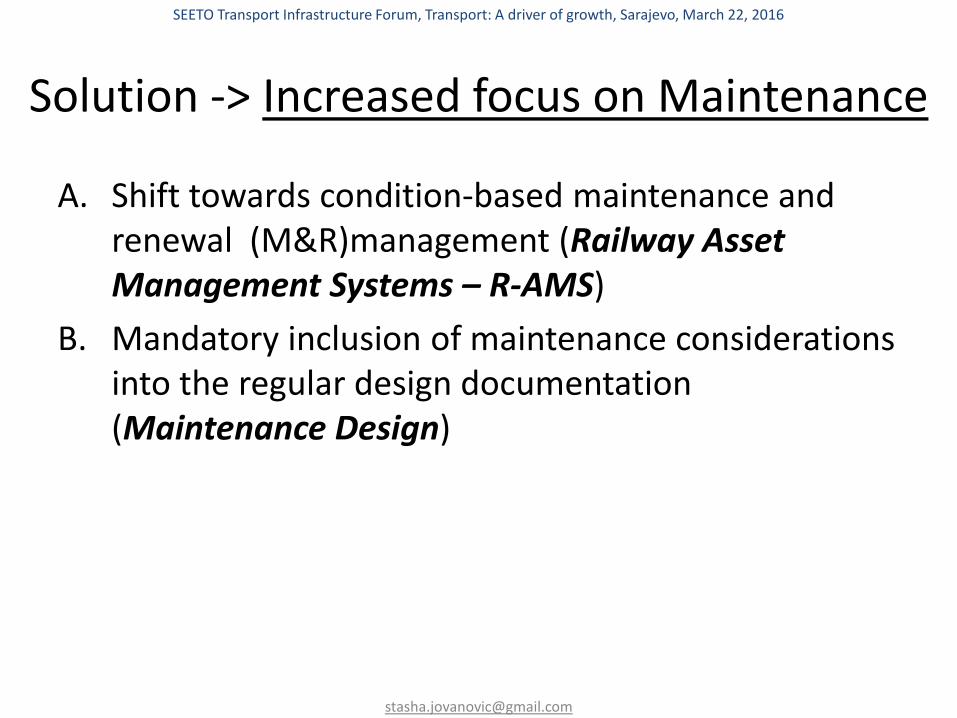
Solution -> Increased focus on Maintenance
A. Shift towards condition-based maintenance and renewal (M&R)management (Railway Asset Management Systems – R-AMS)
B. Mandatory inclusion of maintenance considerations into the regular design documentation (Maintenance Design)
SEETO Transport Infrastructure Forum, Transport: A driver of growth, Sarajevo, March 22, 2016

A vision of the future of maintenance
Over the next two decades, medicine will
change from its current reactive mode, in
which doctors wait for people to get sick, to a
mode that is far more preventive and rational.
What’s driving this change
are powerful new
measurement technologies
and the so-called systems
approach to medicine.
The average doctor’s office visit
might involve blood work and a
few measurements, such as
blood pressure and temperature;
in the near future physicians will
collect billions of bytes of
information about each
individual – genes, blood
proteins, cells and historical
data.
What is “Condition-based” approach?

“Condition-based” M&R Management
FROM: Diagnostic data used mostly for the controlling purposes
TO: Diagnostic data used as the driver for maintenance activities
Tomorrow
Planned preventive
maintenance
Corrective maintenance
Survey activities
Today
M&R Costs
SEETO Transport Infrastructure Forum, Transport: A driver of growth, Sarajevo, March 22, 2016
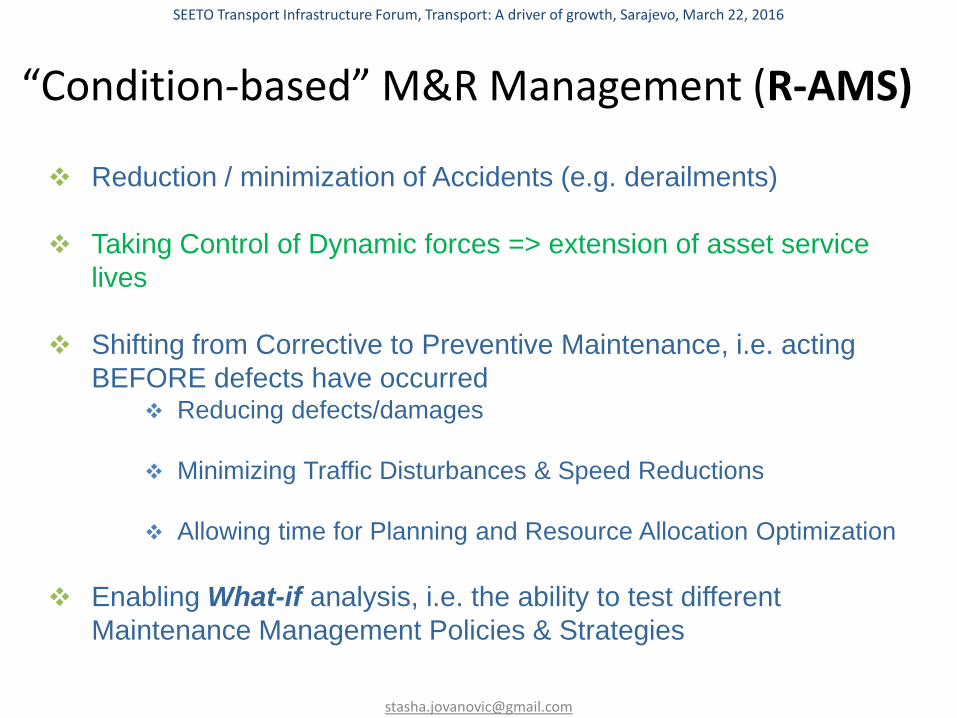
“Condition-based” M&R Management (R-AMS)
Reduction / minimization of Accidents (e.g. derailments)
Taking Control of Dynamic forces => extension of asset service
lives
Shifting from Corrective to Preventive Maintenance, i.e. acting
BEFORE defects have occurred Reducing defects/damages
Minimizing Traffic Disturbances & Speed Reductions
Allowing time for Planning and Resource Allocation Optimization
Enabling What-if analysis, i.e. the ability to test different
Maintenance Management Policies & Strategies
SEETO Transport Infrastructure Forum, Transport: A driver of growth, Sarajevo, March 22, 2016
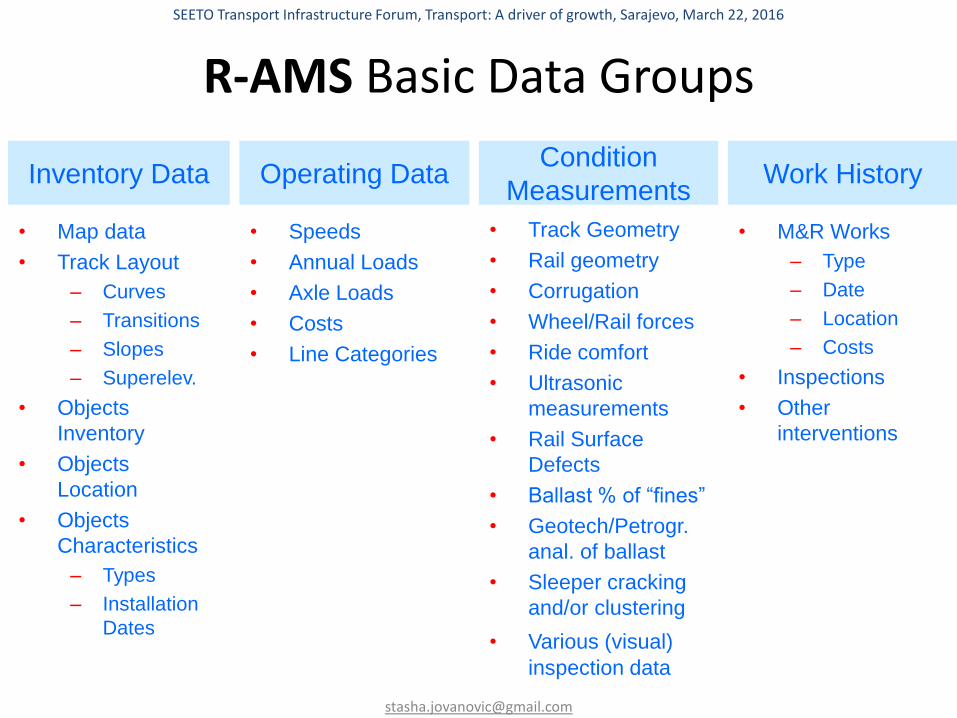
R-AMS Basic Data Groups
Inventory Data Operating Data Condition
Measurements Work History
• Map data
• Track Layout
– Curves
– Transitions
– Slopes
– Superelev.
• Objects
Inventory
• Objects
Location
• Objects
Characteristics
– Types
– Installation
Dates
• Speeds
• Annual Loads
• Axle Loads
• Costs
• Line Categories
• Track Geometry
• Rail geometry
• Corrugation
• Wheel/Rail forces
• Ride comfort
• Ultrasonic
measurements
• Rail Surface
Defects
• Ballast % of “fines”
• Geotech/Petrogr.
anal. of ballast
• Sleeper cracking
and/or clustering
• Various (visual) inspection data
• M&R Works
– Type
– Date
– Location
– Costs
• Inspections
• Other
interventions
SEETO Transport Infrastructure Forum, Transport: A driver of growth, Sarajevo, March 22, 2016
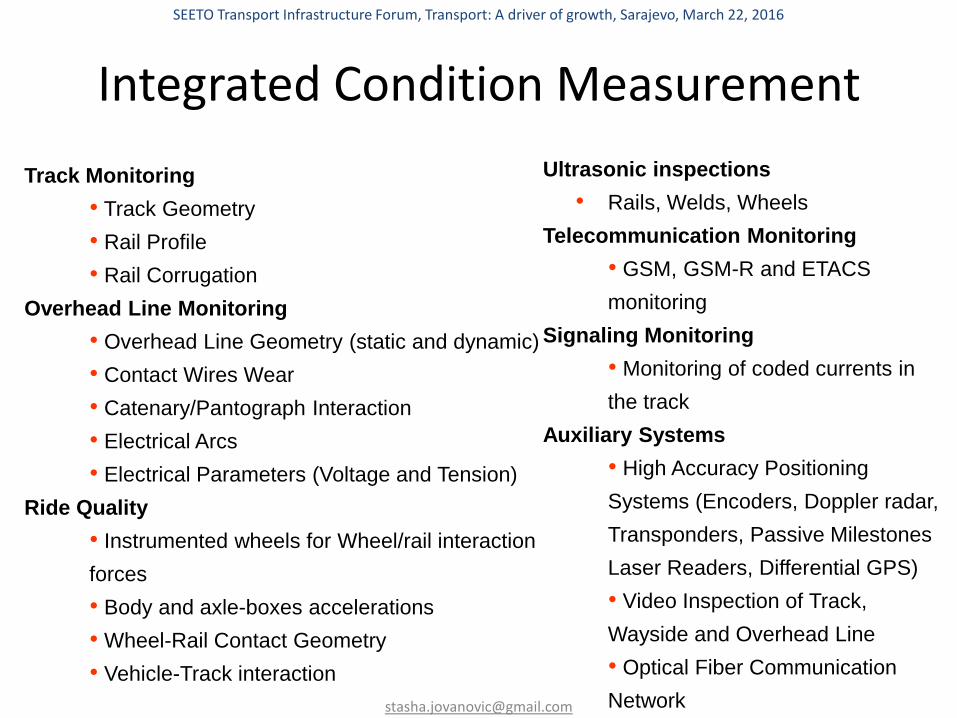
Integrated Condition Measurement
Track Monitoring
• Track Geometry
• Rail Profile
• Rail Corrugation
Overhead Line Monitoring
• Overhead Line Geometry (static and dynamic)
• Contact Wires Wear
• Catenary/Pantograph Interaction
• Electrical Arcs
• Electrical Parameters (Voltage and Tension)
Ride Quality
• Instrumented wheels for Wheel/rail interaction
forces
• Body and axle-boxes accelerations
• Wheel-Rail Contact Geometry
• Vehicle-Track interaction
Ultrasonic inspections
• Rails, Welds, Wheels
Telecommunication Monitoring
• GSM, GSM-R and ETACS
monitoring
Signaling Monitoring
• Monitoring of coded currents in
the track
Auxiliary Systems
• High Accuracy Positioning
Systems (Encoders, Doppler radar,
Transponders, Passive Milestones
Laser Readers, Differential GPS)
• Video Inspection of Track,
Wayside and Overhead Line
• Optical Fiber Communication
Network
SEETO Transport Infrastructure Forum, Transport: A driver of growth, Sarajevo, March 22, 2016

Typical measuring vehicle Operational Management
Total length of lines to survey About 10.000 km
Survey Frequency 1 week / 3 months
80.000 Km Total amount of km covered in 1 year
500 km Average length surveyed in 1 working day
Acquired data in 1 month 1 Tb 1 Tb
Need for a Railway Asset Management System (R-AMS)
SEETO Transport Infrastructure Forum, Transport: A driver of growth, Sarajevo, March 22, 2016
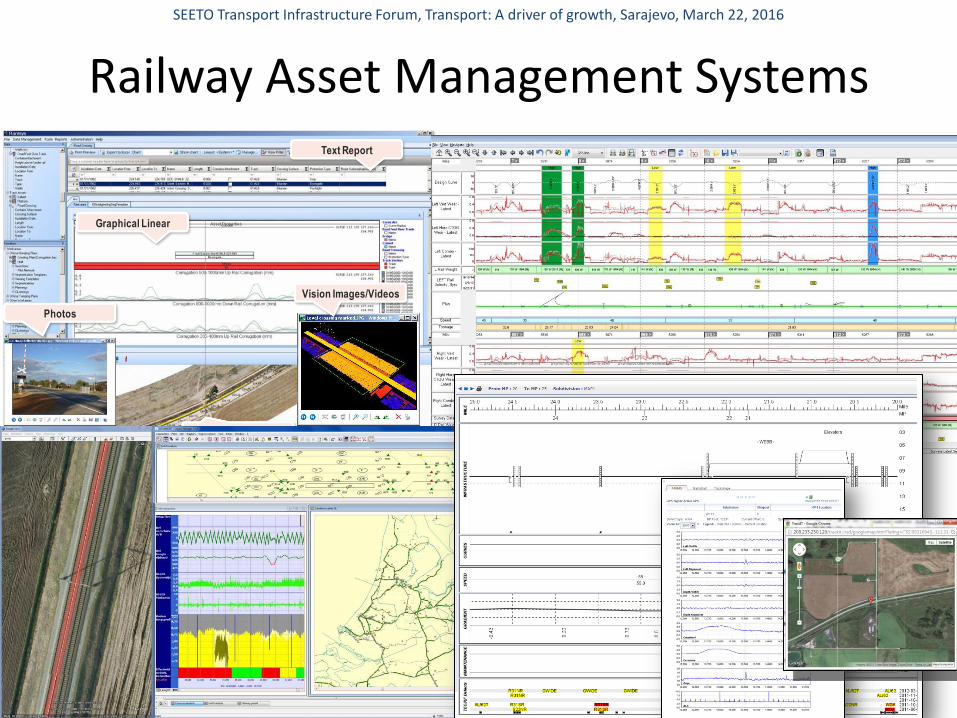
Photos
GIS
Graphical Linear
Text Report
Vision Images/Videos
Railway Asset Management Systems
SEETO Transport Infrastructure Forum, Transport: A driver of growth, Sarajevo, March 22, 2016
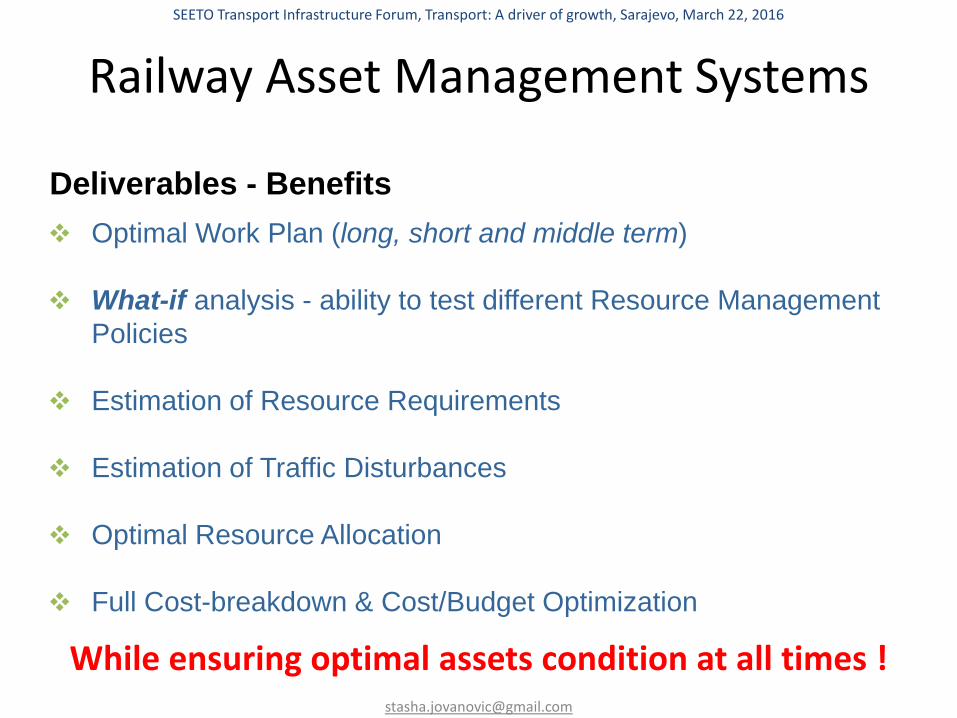
Railway Asset Management Systems
Optimal Work Plan (long, short and middle term)
What-if analysis - ability to test different Resource Management
Policies
Estimation of Resource Requirements
Estimation of Traffic Disturbances
Optimal Resource Allocation
Full Cost-breakdown & Cost/Budget Optimization
Deliverables - Benefits
While ensuring optimal assets condition at all times !
SEETO Transport Infrastructure Forum, Transport: A driver of growth, Sarajevo, March 22, 2016
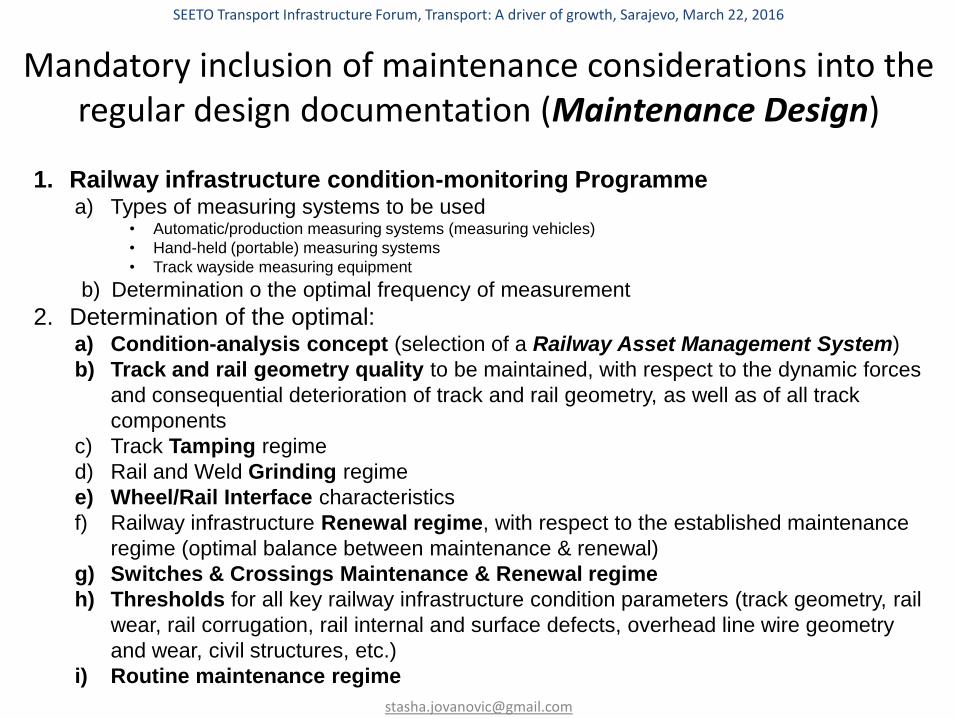
Mandatory inclusion of maintenance considerations into the regular design documentation (Maintenance Design)
1. Railway infrastructure condition-monitoring Programme a) Types of measuring systems to be used
• Automatic/production measuring systems (measuring vehicles)
• Hand-held (portable) measuring systems
• Track wayside measuring equipment
b) Determination o the optimal frequency of measurement
2. Determination of the optimal: a) Condition-analysis concept (selection of a Railway Asset Management System)
b) Track and rail geometry quality to be maintained, with respect to the dynamic forces
and consequential deterioration of track and rail geometry, as well as of all track
components
c) Track Tamping regime
d) Rail and Weld Grinding regime
e) Wheel/Rail Interface characteristics
f) Railway infrastructure Renewal regime, with respect to the established maintenance
regime (optimal balance between maintenance & renewal)
g) Switches & Crossings Maintenance & Renewal regime
h) Thresholds for all key railway infrastructure condition parameters (track geometry, rail
wear, rail corrugation, rail internal and surface defects, overhead line wire geometry
and wear, civil structures, etc.)
i) Routine maintenance regime
SEETO Transport Infrastructure Forum, Transport: A driver of growth, Sarajevo, March 22, 2016