
Maintenance System Graduate School of Engineering Hokkaido ... · Graduate School of Engineering...
24
Laboratory of Engineering for Maintenance System Graduate School of Engineering Hokkaido University
Transcript of Maintenance System Graduate School of Engineering Hokkaido ... · Graduate School of Engineering...

Laboratory of Engineering for Maintenance SystemGraduate School of Engineering Hokkaido University

2
Date Study Date Study Date Study
2010/8/23Departure 2010/9/20Listening Speech 2010/10/18Preparing – S3-G-SR instrumentation
2010/8/24Greeting to all lab member 2010/9/21Design of experimental program 2010/10/19Preparing – S3-G-SR instrumentation
2010/8/25Paper work 2010/9/22Design of experimental program 2010/10/20Material prop test
2010/8/26Surface preparation for RC cap 2010/9/23Design of experimental program 2010/10/21Test – S3-G-SR, Material prop test
2010/8/27Design of experimental program 2010/9/24Meeting with fyfo company 2010/10/22Preparing test for S4-P-SR
2010/8/30Anchorage design 2010/9/27Design of experimental program 2010/10/25Preparing test for S4-P-SR
Meeting
2010/8/31Anchorage design 2010/9/28Design of experimental program2010/10/26
Preparing test for S4-P-SR
2010/9/1Material prop test design 2010/9/29Apply PET primer2010/10/27TEST S4-P-SR
Preparing material prop test
2010/9/2Material prop test design 2010/9/30Apply PET putty & GFRP epoxy
2010/9/3Design of experimental program 2010/10/1Design of experimental program
2010/9/6Design of experimental program 2010/10/4Testing frame set uo
2010/9/7Design of experimental program 2010/10/5Set up C1 and set up string pots
2010/9/8Build masonry wall 2010/10/6Wire of string pots attached
2010/9/9Build masonry wall 2010/10/7Material prop test
2010/9/10Open bank account „& Social security
number2010/10/8Preparing – Cl instrumentation
2010/9/13Design of experimental program 2010/10/11Preparing – Cl instrumentation
2010/9/14Design of experimental program 2010/10/12Preparing – Cl
2010/9/15Meeting , Material prop test design 2010/10/13Test CL specimen
2010/9/16Design of experimental program 2010/10/14Preparing – S3-G-SR
2010/9/17Visit bank & Social Security office 2010/10/15Attend Master‟s defense, Preparing –
S3-G-SR

Conduct experimental program using full-scale wall specimens
Examine various anchorage systems
Simulate the simple boundary conditions and loading experienced by existing structures
Evaluate the effectiveness of a GFRP system to strengthen infill masonry walls
Twenty full-scale specimens
Two main FRP materials, anchorage systems
Experimental Testing of Full-Scale Wall Panels
The main objective of the proposed research program is to investigate the most
effective FRP anchorage system for strengthening masonry infill structures.
The study includes two types of FRP:
Glass Fiber Reinforced Polymer (GFRP) and Polyethylene Terephthalate (PET).
Each type of FRP system will be evaluated using five different types of anchorage.
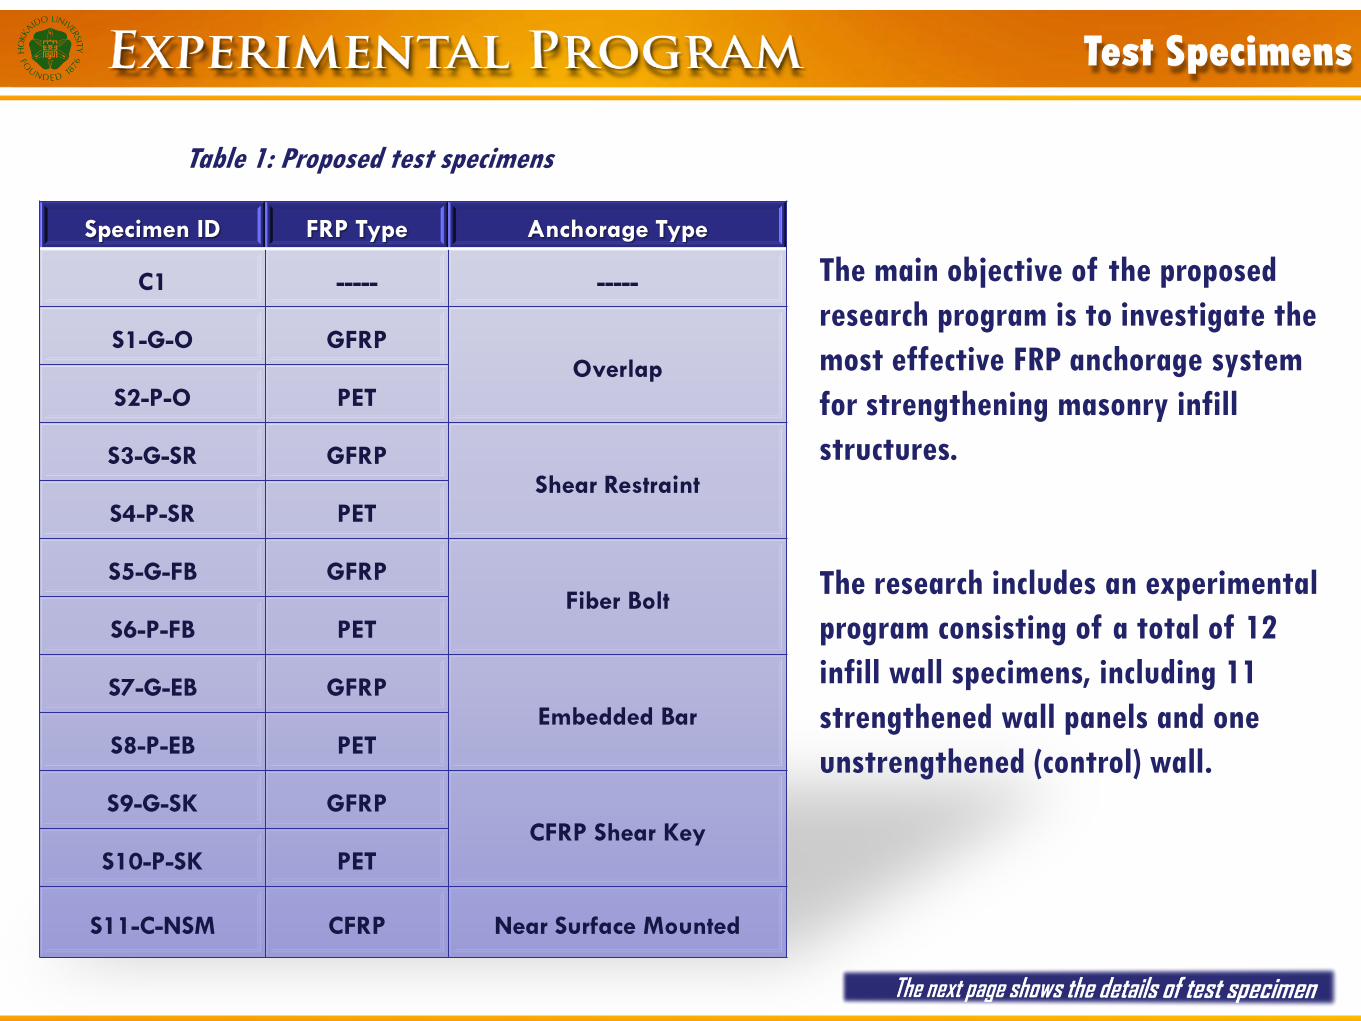
Specimen ID FRP Type Anchorage Type
C1 ----- -----
S1-G-O GFRPOverlap
S2-P-O PET
S3-G-SR GFRPShear Restraint
S4-P-SR PET
S5-G-FB GFRPFiber Bolt
S6-P-FB PET
S7-G-EB GFRPEmbedded Bar
S8-P-EB PET
S9-G-SK GFRPCFRP Shear Key
S10-P-SK PET
S11-C-NSM CFRP Near Surface Mounted
The main objective of the proposed
research program is to investigate the
most effective FRP anchorage system
for strengthening masonry infill
structures.
The research includes an experimental
program consisting of a total of 12
infill wall specimens, including 11
strengthened wall panels and one
unstrengthened (control) wall.
Table 1: Proposed test specimens

The test specimens are designed to determine the most effective anchorage system for FRP strengthening of
infill masonry walls. The specimens were strengthened with a different type of externally bonded FRP sheet.
Front view
5’
7’-6’’
1’
1’
6’’1’4’
1’-
6’’
3’
6 ½’’
3 5/8’’
Profile view
7’-6’’
5’
Glass Fiber Reinforced Polymer (GFRP) was supplied by Fyfe Co. LLC
Polyethylene terephthalate (PET) was supplied by Maeda Kosen Co. Ltd.
Figure 1: Details of test specimen
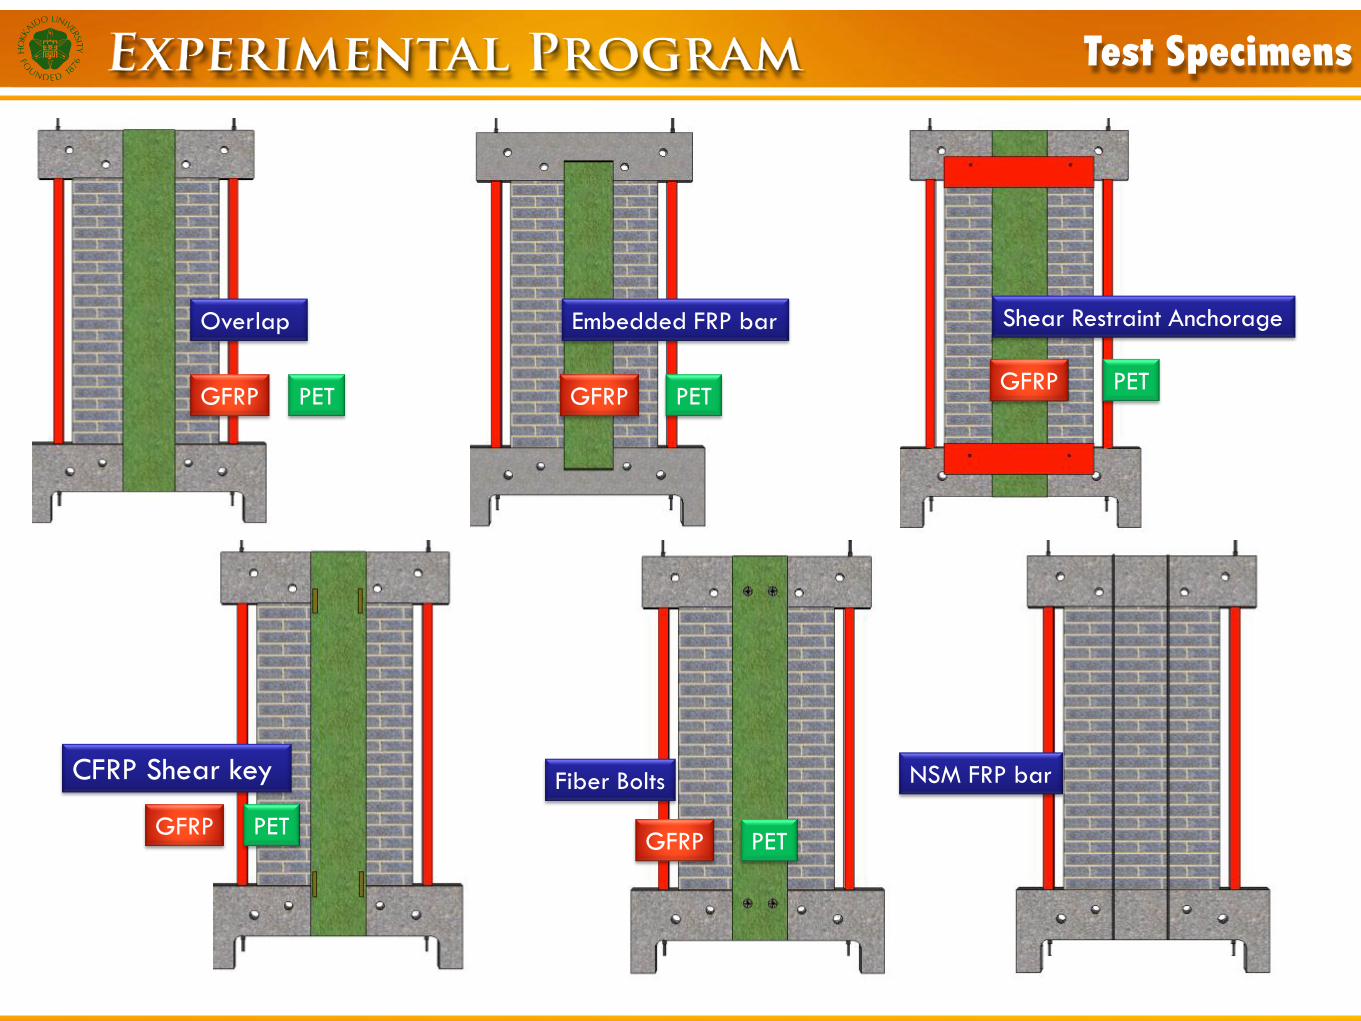
Overlap Embedded FRP bar Shear Restraint Anchorage
CFRP Shear key NSM FRP barFiber Bolts
GFRP GFRPGFRP
GFRPGFRP
PET PETPET
PETPET
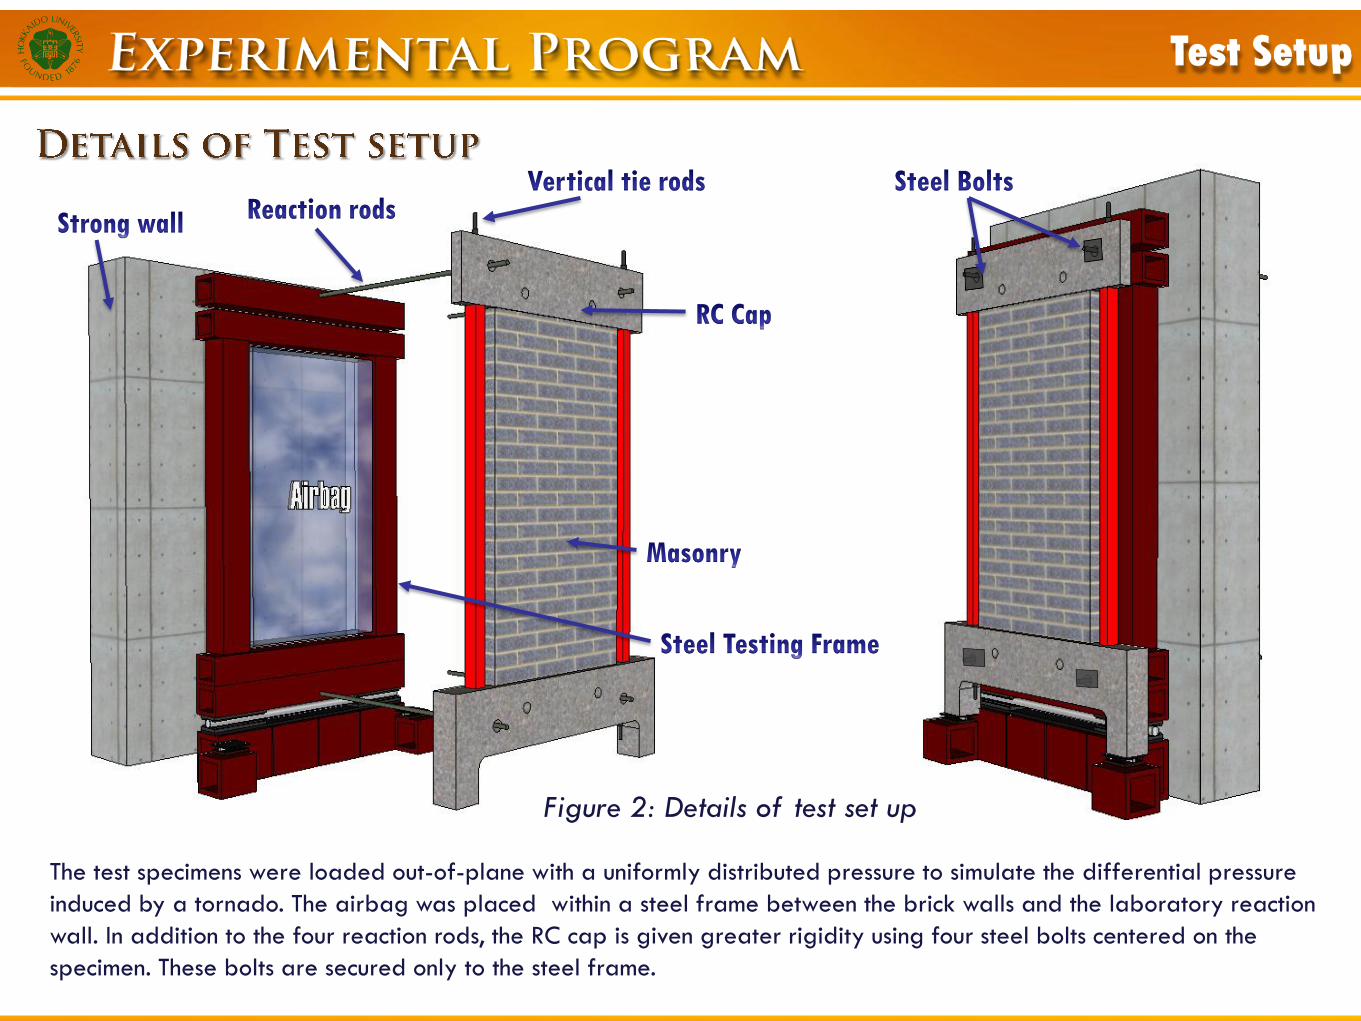
The test specimens were loaded out-of-plane with a uniformly distributed pressure to simulate the differential pressure
induced by a tornado. The airbag was placed within a steel frame between the brick walls and the laboratory reaction
wall. In addition to the four reaction rods, the RC cap is given greater rigidity using four steel bolts centered on the
specimen. These bolts are secured only to the steel frame.
Figure 2: Details of test set up
RTR
MTR
MBR
RBR
MBL
RBL
RTL
MTL
PTI
PTQ
PTM
PBQ
PBI
RT
M
MBI
MTI
MT
Q
MID
MBQ
RBI
RTI
RB
M
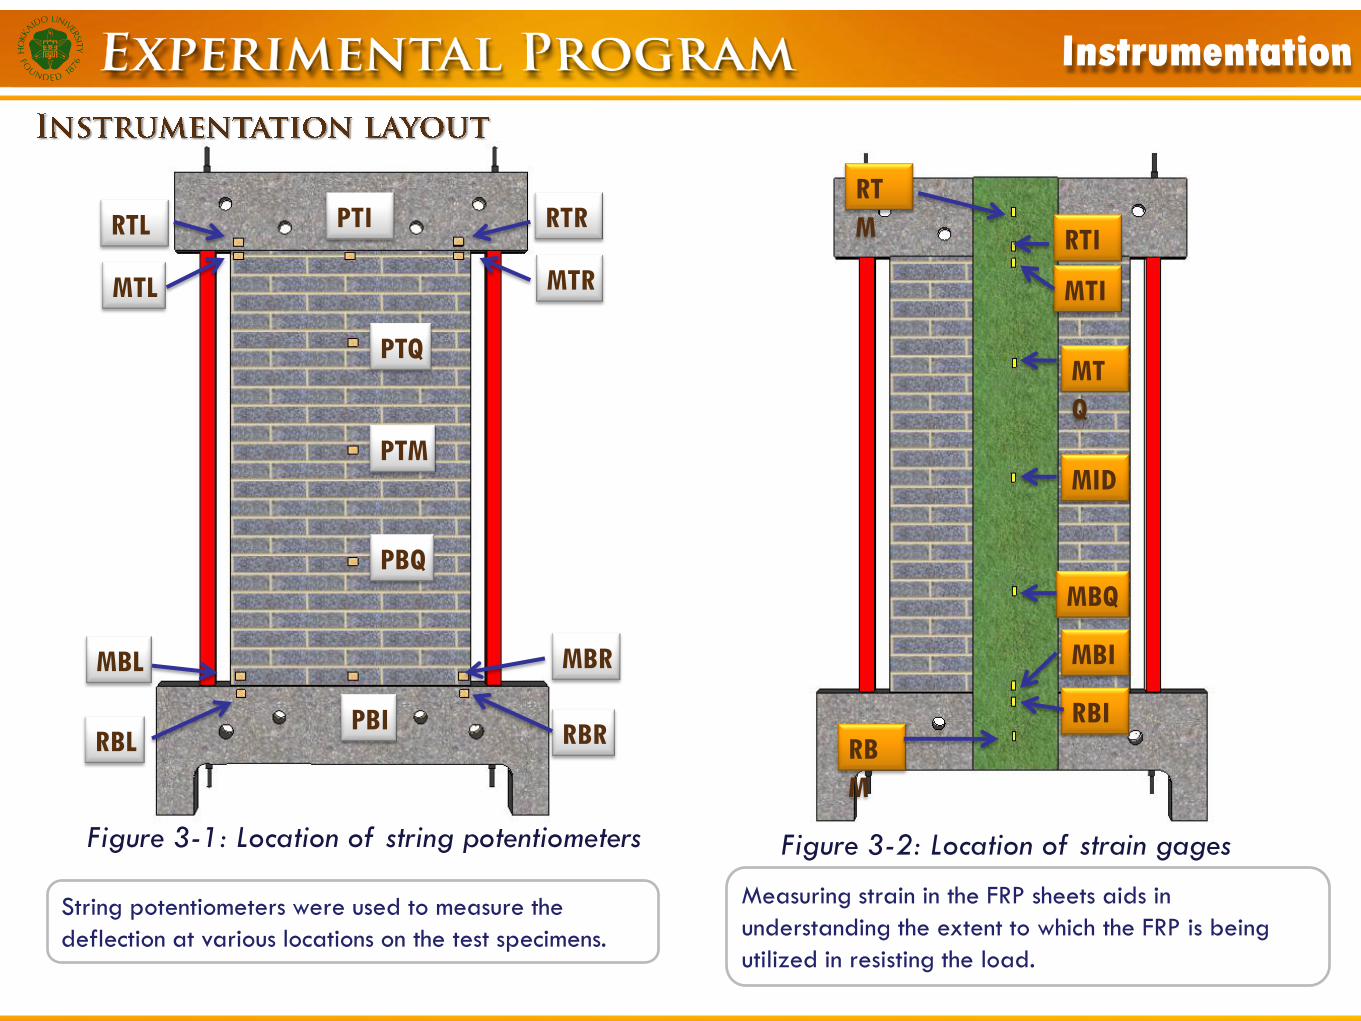
String potentiometers were used to measure the
deflection at various locations on the test specimens.
Measuring strain in the FRP sheets aids in
understanding the extent to which the FRP is being
utilized in resisting the load.
Figure 3-1: Location of string potentiometers Figure 3-2: Location of strain gages

Fixed Frame used for Instruments
String potentiometers were used at the locations shown to measure the out-of-plane displacement profile of the wall
and the frame.
Taking midspan as an example, as the walls deflect, the potentiometers measure the lateral displacement, allowing for
the determination, in this case, of the out-of-plane displacement profile at midspan.
Figure 4: String potentiometers set up
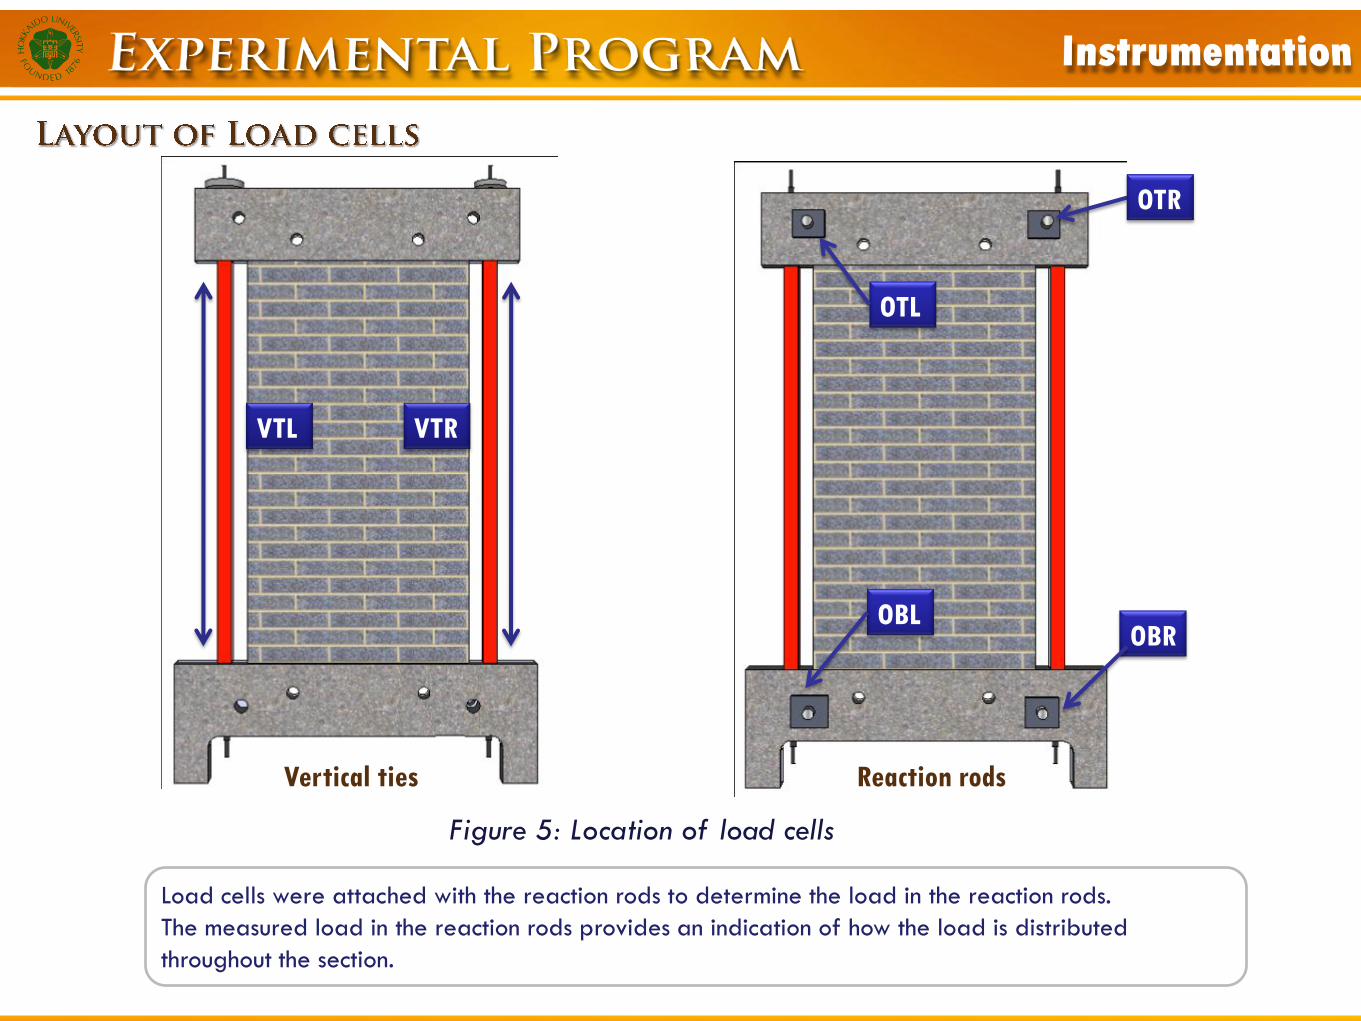
OTR
OBR
OTL
OBL
VTRVTL
Vertical ties Reaction rods
Load cells were attached with the reaction rods to determine the load in the reaction rods.
The measured load in the reaction rods provides an indication of how the load is distributed
throughout the section.
Figure 5: Location of load cells

Applying Primer for PET sheet
Applying Putty for PET sheet
RC cap with HSS (test frame) Build masonry infill Conducted by local mason
Masonry wall
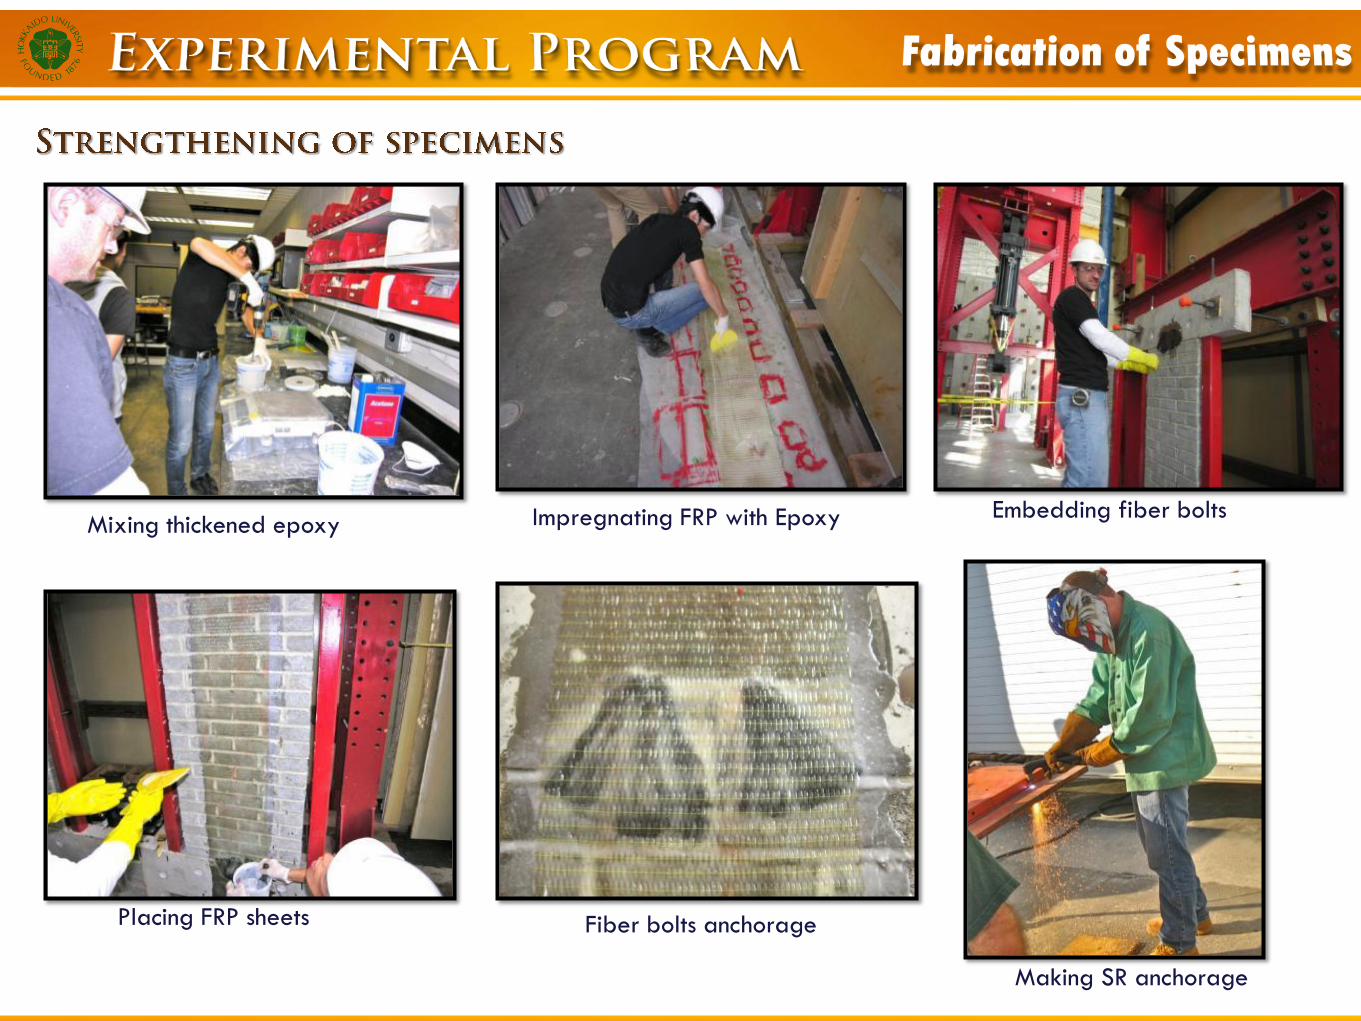
Impregnating FRP with EpoxyMixing thickened epoxyEmbedding fiber bolts
Placing FRP sheets
Making SR anchorage
Fiber bolts anchorage
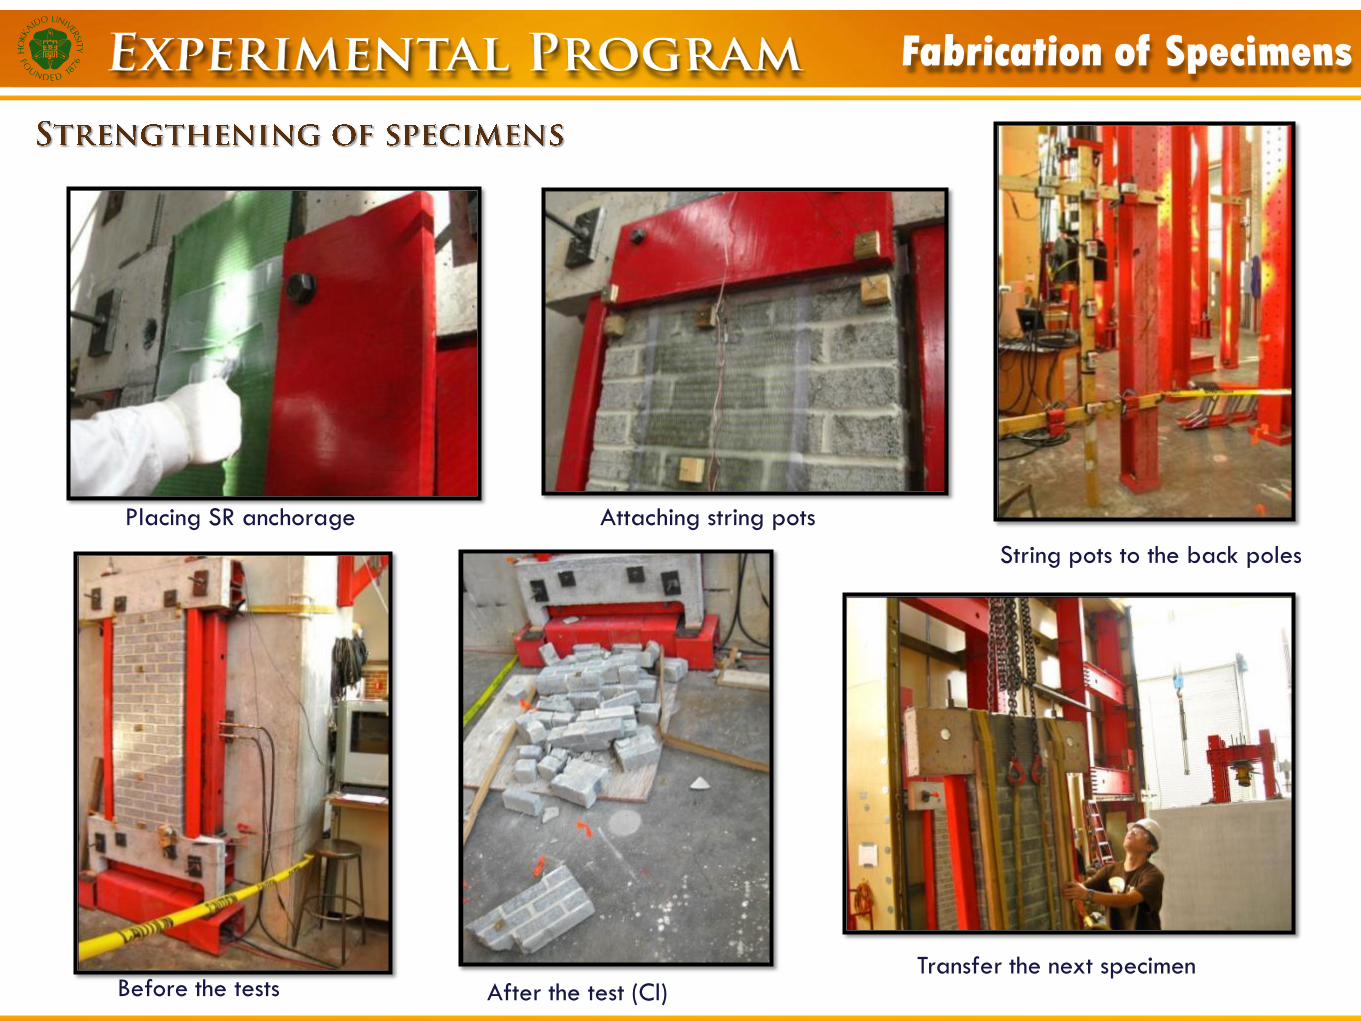
Attaching string potsPlacing SR anchorage
String pots to the back poles
Before the tests After the test (Cl)Transfer the next specimen

Once all instrumentation was attached, specimens were subjected to cycles of uniformly distributed
pressure according to the loading protocol shown. The pressure was increased in increments by
inflating the airbag. The load was held at each increment for 5 mins after which, the specimens were
unloaded to the service load of 1.2 psi before proceeding to the next increment.
0
1
2
3
4
5
6
7
8
9
10
11
0 20 40 60 80 100 120 140
Time (min)
Pre
ssu
re (
psi
)At each loading step, the
pressure load level will be
maintained constant for 5
minutes per ASTM E 72.
Figure 6: Typical loading sequences

A comparison between the total applied load and the total load measured by the reaction rods is given in below
figure.
The total measured load was not linearly related to the total applied load.
The 60-80% difference between the total applied load and the total measured load is likely due to frictional forces.
Figure 7-1: Load Comparison for CL
Friction parts
The specimen is put on this steel stand and friction is caused between the bottom of RC and
this steel stand.
Roller system might solve this problem “How do we reduce this frictional force?”
Figure 7-2: location of frictional forces

Revised
Low friction - Roller system -
Figure 7-4: close up view of roller system
The regions where the frictional force was
caused were substituted for the roller system.
The frictional forces can be extremely reduced
by this system. The closed up view of roller
system are shown in Fig 7-4.
The self-weight of the wall creates a friction
force along the bottom edge of the wall
panel that is not present along the top edge.

Figure 8-1: Load Comparison for S3-G-SR
After the above mentioned revise, the total applied load and
the total load measured by the reaction rods were compared
again.
The problem by the frictional force was mostly solved.
However, total measured load has exceeded total applied
pressure which should be an upper limit of line.
Uniform pressure was applied to the
masonry via an airbag. During
testing, the airbag was in full contact
with the surface of the masonry.
However, as deformation of masonry
wall progresses, a range which are
applied pressure might extend to RC
cap that is shown in Fig 8-2.
It should be one reason of excess of
upper limit of total applied load.
Figure 8-2: extension of applied
pressure zone
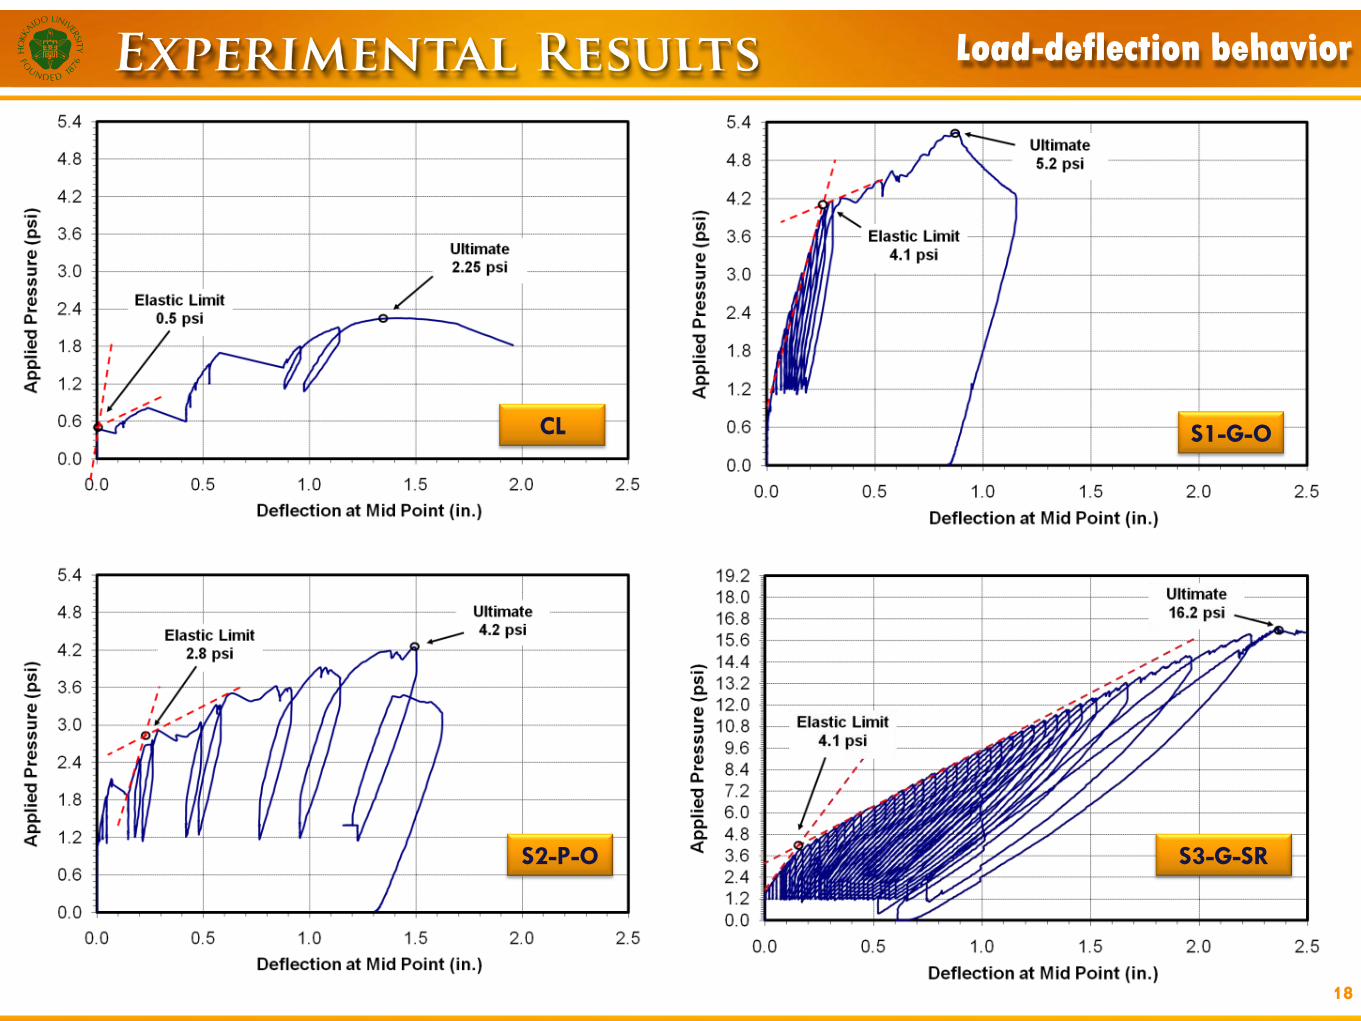
18
CL S1-G-O
S2-P-O S3-G-SR

The envelope of the pressure-deflection curves is
shown in Figure. 9. S3-G-SR recorded ultimate
pressure about 8 times larger than control specimen.
In the just overlap system, S1-G-O had the larger
ultimate pressure, while S2-P-O had more ductility.
Figure 9: Load-deflection behavior
8x
Figure 10: Out-of-plane displacement profiles
along vertical line
The measured out-of-plane displacement profiles for
applied pressures of Cl-2.24 psi, S1-5.25 psi, S2-
4.25 psi, and S3-16.26 psi are shown in Figure 10.
In this figure, a solid line connects the measured
values.

Figure 11: FRP strain profiles along vertical line
The measured strains in the FRP sheets at various locations are shown in Figure11. The strain profiles of the FRP
sheet along a vertical line at mid-width at various applied pressures are shown in Figure 3-2. In the specimens
S1-G-O and S2-P-O, the profiles clearly show that debonding initiated at the top interface between the PET
and the RC cap in the anchorage zone, with very large strains developing in the FRP in this region, but very
little strain developing just below the interface on the masonry itself. On the other hand, there are no observed
strain in the anchorage zone in S3-G-SR.

Date
From 10/27/2010 Strengthen & Anchorage – S6-P-FB
To 11/23/2010 Strengthen & Anchorage – S7-G-EB
Strengthen & Anchorage – S8-P-EB
Strengthen & Anchorage – S9-G-SK
Strengthen & Anchorage – S10-P-SK
Strengthen & Anchorage – S11-C-NSM
Test - S5-G-FB
Test - S6-P-FB
Test - S7-G-EB
Test - S8-P-EB
Test - S9-G-SK
Test - S10-P-SK
Test - S11-C-NSM
25days until the return day…….


![[Graduate School of Engineering]](https://static.fdocuments.net/doc/165x107/61aa5a82eafd6447e86260d7/graduate-school-of-engineering.jpg)

