Maintenance of Ontario’s Aquaculture Statistics Program 2013... · Maintenance of Ontario’s...
10
Maintenance of Ontario’s Aquaculture Statistics Program: AQUASTATS Final Report submitted to: Ontario Ministry of Natural Resources Submitted by: Richard D. Moccia and David J. Bevan Aquaculture Centre 7 th April 2014
-
Upload
nguyendien -
Category
Documents
-
view
215 -
download
0
Transcript of Maintenance of Ontario’s Aquaculture Statistics Program 2013... · Maintenance of Ontario’s...
Maintenance of Ontario’s Aquaculture Statistics Program:
AQUASTATS
Final Report submitted to:
Ontario Ministry of Natural Resources
Submitted by:
Richard D. Moccia and David J. Bevan
Aquaculture Centre
7th
April 2014
2
Introduction
The primary objective of this project was to conduct a survey of the geographical distribution and
production output of commercial aquaculture operations in Ontario for the calendar year 2013, in order
to maintain our well-established industry database which has been under development since 1988.
This database is utilized on an on-going basis to evaluate the performance characteristics of the
industry, with the ultimate goal of assisting with the orderly development of aquaculture in this
province. The information collected provides the content for the ongoing factsheet series
AQUASTATS – Ontario Aquacultural Production Statistics. OMNR will use the data to support the
Canadian Council of Fisheries and Aquaculture Ministers (CCFAM) aquaculture development
initiatives. More specifically, the data will support the Aquaculture Sustainability Reporting Initiative
(ASRI) led by Fisheries and Oceans Canada (DFO) to report to Canadians and Ontarians on progress
made toward the shared objective to set the conditions for an aquaculture sector that is
environmentally sound, socially responsible and economically competitive. Additionally, some of the
compiled information will be forwarded to Statistics Canada as a part of the national aquacultural
statistics summary.
Methods
A survey questionnaire has been developed to collect information on:
type of facility
species raised
employment
annual production
value of production
The survey frame was determined from previous surveys and knowledge of the industry participants.
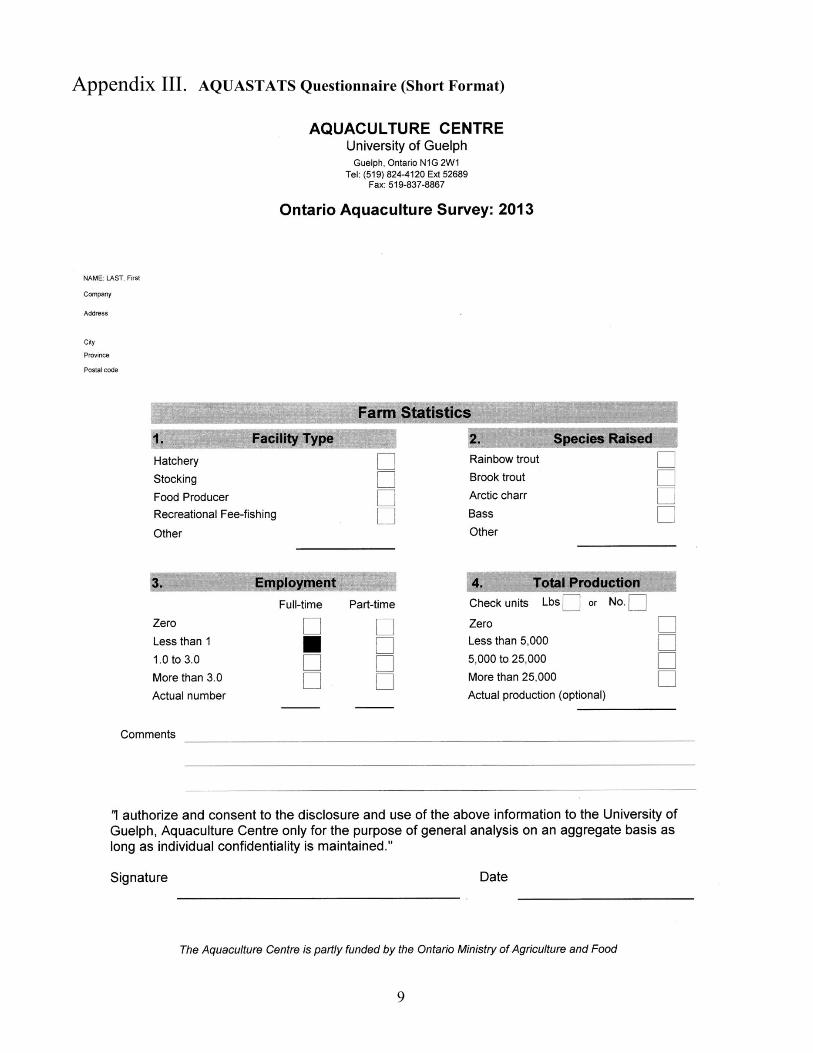
The frame was divided into two sections based upon expected scale of production. Facilities that were
expected to produce more than approximately 5,000 kg or $10,000 of sales per year were sent a
detailed questionnaire (Long Format Questionnaire). All others were sent a simplified version (Short
Format Questionnaire). A total of 154 surveys were distributed on Jan 16th
2014 (see Appendix I – III).
2) The OMNR Aquaculture Licence provides additional data with respect to the DFO Provincial
Aggregate Estimates:
3
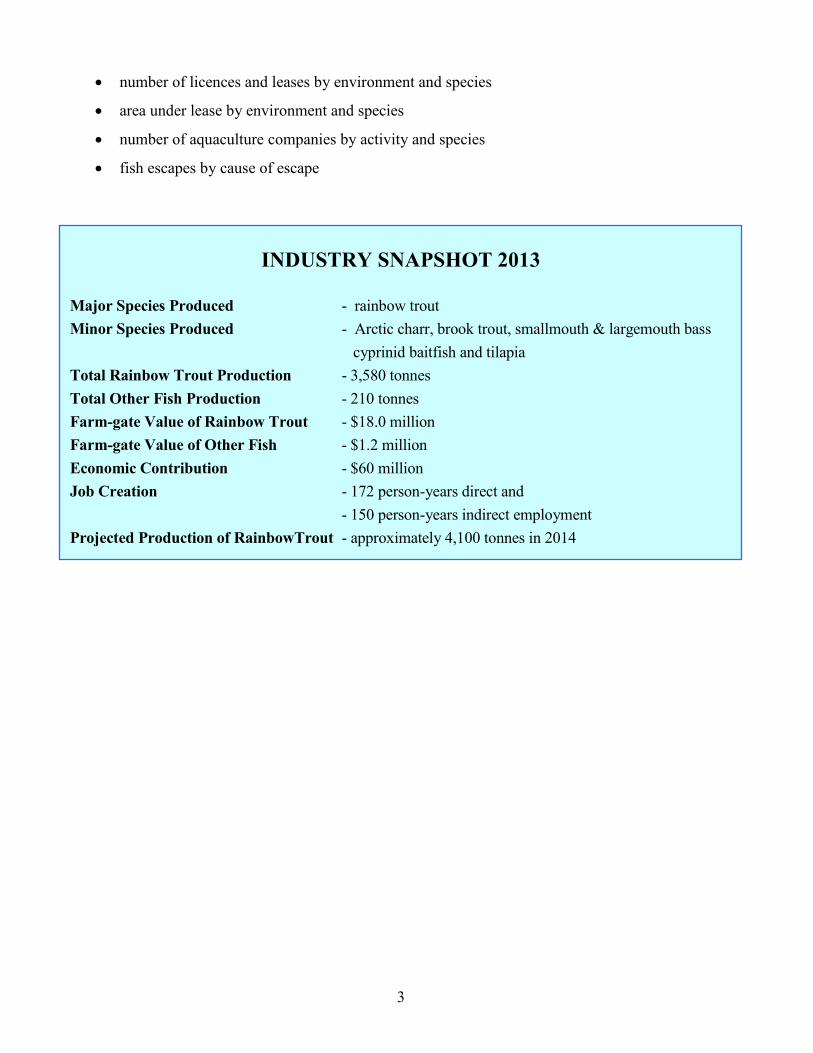
INDUSTRY SNAPSHOT 2013
Major Species Produced - rainbow trout
Minor Species Produced - Arctic charr, brook trout, smallmouth & largemouth bass
cyprinid baitfish and tilapia
Total Rainbow Trout Production - 3,580 tonnes
Total Other Fish Production - 210 tonnes
Farm-gate Value of Rainbow Trout - $18.0 million
Farm-gate Value of Other Fish - $1.2 million
Economic Contribution - $60 million
Job Creation - 172 person-years direct and
- 150 person-years indirect employment
Projected Production of RainbowTrout - approximately 4,100 tonnes in 2014
number of licences and leases by environment and species
area under lease by environment and species
number of aquaculture companies by activity and species
fish escapes by cause of escape
4
Results
In 2013, we estimate that Ontario fish farms produced 3,580 tonnes (7.89 million pounds) of rainbow
trout, primarily for human consumption. This is a 3.2% decrease from the 3,700 tonnes produced in
2012. Survey questionnaires were received from 47% of the facilities surveyed accounting for 95% of
the total production. Estimates for non-reporting facilities were based on prior surveys and personal
experience.
Lake-based cage production of rainbow trout in the Georgian Bay area continues to dominate other
land-based production systems, accounting for 89% of the total production (Figure 1). Land-based
production of Arctic charr and tilapia is limited to a few facilities in southern Ontario. The production
of brook trout, bass and other species is primarily geared towards pond stocking and recreational
purposes. These operations provide an important diversity to the industry although quantifiable
information is scarce. Our records suggest that approximately 55-60 facilities culture Arctic charr,
tilapia, brook trout, bass and other species, with an estimated total production of 210 tonnes in 2013.
The total farm-gate value of the 3,580 tonnes of rainbow trout produced is estimated to be $18.0
million, with an average price of $2.28/lb ($5.02/kg). The sale of Arctic charr, tilapia, brook trout, bass
and other fish species is estimated to be an additional $1.2 million. More than 40 facilities are involved
with pond stocking, typically rainbow trout, brook trout and bass. The value of this aquaculture sector
is conservatively estimated to be $1.5 million annually.
In 2013, the Ontario aquaculture industry is estimated to have generated a total of 172 person-years of
direct, on-farm employment. This consisted of 107 person-years of full-time employment (40 hours
per week for 12 months) and 65 person years of part-time employment. Indirect employment is
conservatively estimated at 150 person-years.
The total annual contribution that aquaculture makes to the Ontario economy is estimated to be $60
million, with additional economic value realised via the recreational and aquaria trade.

Figure 1. Comparison of Ontario land-based and cage aquaculture between 1988 and 2013.
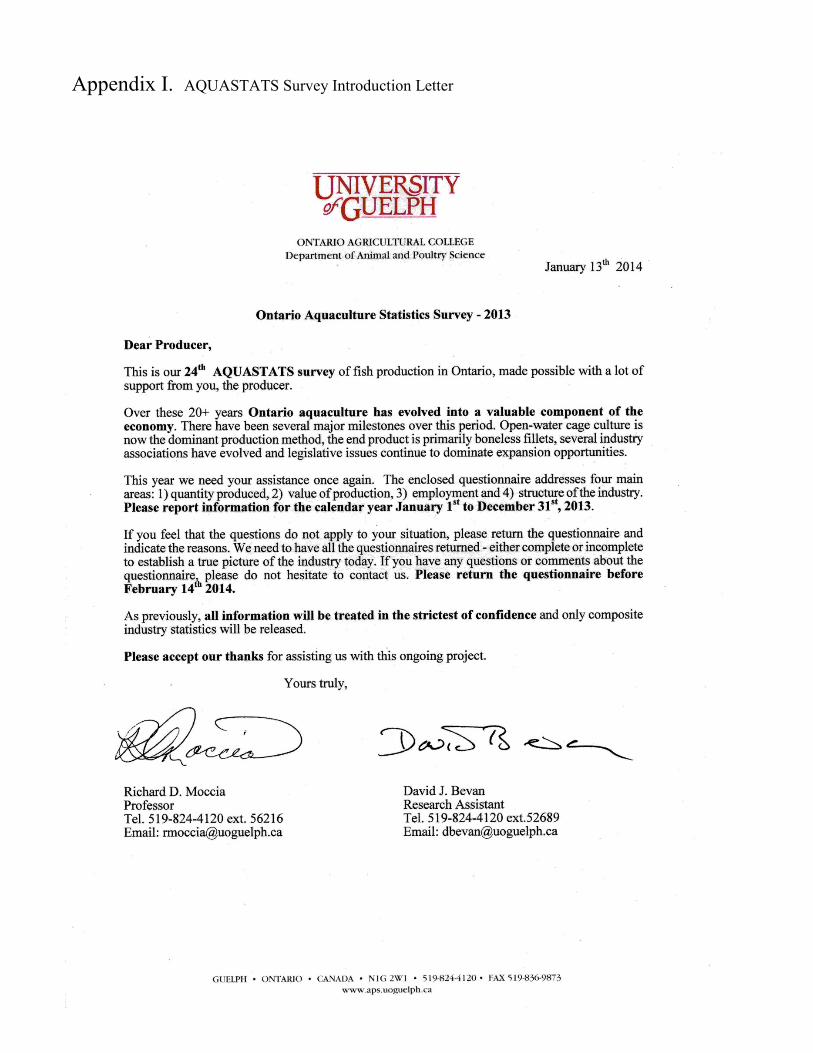
Appendix I. AQUASTATS Survey Introduction Letter
7
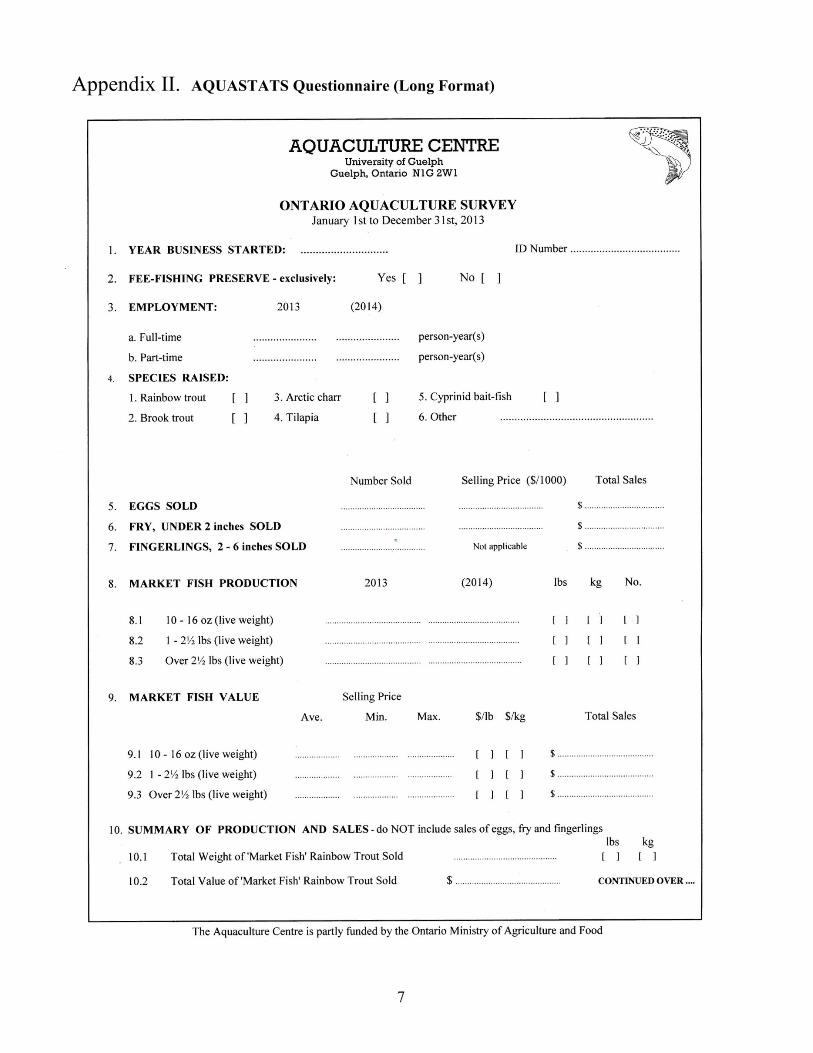
Appendix II. AQUASTATS Questionnaire (Long Format)
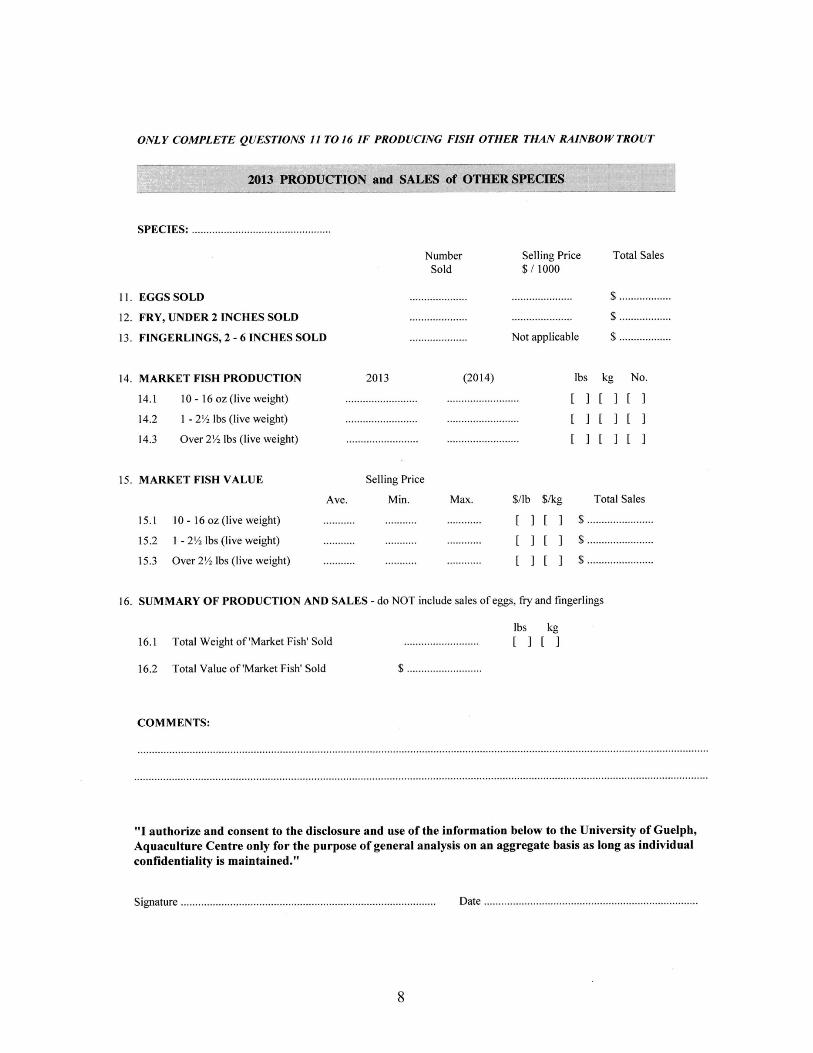
8
9
Appendix III. AQUASTATS Questionnaire (Short Format)
10
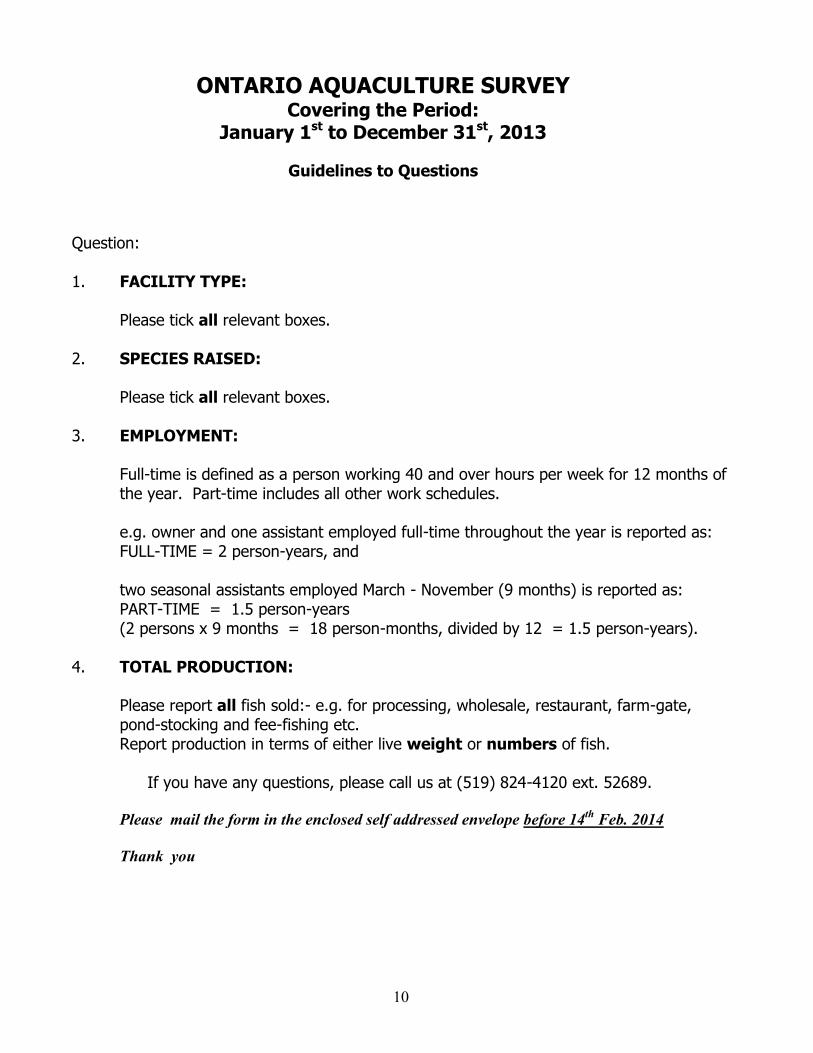
ONTARIO AQUACULTURE SURVEY Covering the Period: January 1st to December 31st, 2013
Guidelines to Questions
Question:
1. FACILITY TYPE:
Please tick all relevant boxes.
2. SPECIES RAISED: Please tick all relevant boxes.
3. EMPLOYMENT: Full-time is defined as a person working 40 and over hours per week for 12 months of the year. Part-time includes all other work schedules. e.g. owner and one assistant employed full-time throughout the year is reported as: FULL-TIME = 2 person-years, and two seasonal assistants employed March - November (9 months) is reported as: PART-TIME = 1.5 person-years (2 persons x 9 months = 18 person-months, divided by 12 = 1.5 person-years).
4. TOTAL PRODUCTION:
Please report all fish sold:- e.g. for processing, wholesale, restaurant, farm-gate, pond-stocking and fee-fishing etc. Report production in terms of either live weight or numbers of fish.
If you have any questions, please call us at (519) 824-4120 ext. 52689.
Please mail the form in the enclosed self addressed envelope before 14th
Feb. 2014
Thank you