Maiden Holdings, Ltd. Investor Presentation... · Maiden’s History 1 AmTrust’s majority...
22
Investor Presentation September 2015 Maiden Holdings, Ltd.
Transcript of Maiden Holdings, Ltd. Investor Presentation... · Maiden’s History 1 AmTrust’s majority...

Investor Presentation
September 2015
Maiden Holdings, Ltd.

Forward Looking Statements
This presentation contains “forward-looking statements” which are made pursuant to the safe harbor
provisions of the Private Securities Litigation Reform Act of 1995. The forward-looking statements are based
on current expectations and beliefs of Maiden Holdings, Ltd. (the “Company”) concerning future
developments and their potential effects on the Company. There can be no assurance that actual
developments will be those anticipated by the Company. Actual results may differ materially from those
projected as a result of significant risks and uncertainties, including non-receipt of expected payments,
changes in interest rates, effect of the performance of financial markets on investment income and fair values
of investments, developments of claims and the effect on loss reserves, decreases in existing and new client
projected premiums, accuracy in projecting loss reserves, the impact of competition and pricing
environments, changes in the demand for the Company’s products, the effect of general economic
conditions, adverse state and federal legislation, regulations and regulatory investigations into industry
practices, developments relating to existing agreements, heightened competition, changes in pricing
environments and changes in asset valuations. The Company undertakes no obligation to publicly update any
forward-looking statements, except as may be required by law. Additional information about these risks and
uncertainties, as well as others that many cause actual results to differ materially from those projected is
contained in Item 1A. Risk Factors in the Company’s Annual Report on Form 10-K for the year ended
December 31, 2014.
2

Maiden’s Value Proposition
• Significant line of business and geographical diversity across low volatility underwriting portfolio
− Not focused on the property catastrophe reinsurance market
• Long-term relationships with targeted regional and specialty P&C insurers - 32-year operating history
• Successful and stable multi-year strategic reinsurance relationship with AmTrust Financial Services, Inc. (“AmTrust”) since 2007
• Predictable and stable operating results
• Highly efficient and scalable operating platform
• Growing balance sheet scale and capital efficiency supported by the low-volatility model
• Conservative investment portfolio
• Strong commitment to rewarding shareholders through dividends
3
1
2
3
4
5
6
7
8
Maiden targets consistent underwriting profitability, above industry average growth and an operating ROAE of 15% or greater

RNR
VR
EIG
AWH
AXS
AGII
ACGL
PREENH
AHLXLMHLD
GLRE
50%
60%
70%
80%
90%
100%
110%
0 x5.0 x10.0 x15.0 x20.0 x25.0 x30.0 x35.0
5 Y
ear
Avera
ge C
om
bin
ed R
ati
o
Multiple of MHLD's Standard Deviation in Combined Ratio
5 Year Average Quarterly Combined Ratio and Standard Deviation in Combined Ratio
MHLD = x1.0 SD
Predictable and Stable Operating Performance
4Data Source: Quarterly Combined Ratio Data from SNL Financial – 2Q 2010 to 2Q 2015
Relatively stable and profitable combined ratio reflecting low volatility underwriting portfolio

Maiden’s History
1 AmTrust’s majority shareholders include holdings of Michael Karfunkel, Leah Karfunkel, George Karfunkel, and Barry Zyskind (“Founding Shareholders”).2 National General Holdings Corporation (“NGHC”), formerly known as American Capital Acquisition Corporation (“ACAC”), acquired GMAC Personal Lines Business in 2010. 3 As of most recent filings 4 Last twelve months as of June 30, 2015.
2007 2008 2009 2010 2011 2012 2013 2014 Q2 2015
Gross Premiums Written (“GPW”) $247 $727 $1,049 $1,298 $1,813 $2,001 $2,204 $2,507 $2,7334
Employees 5 129 139 204 213 214 185 194 206
Founding Shareholders¹ Ownership
18.6% 30.1% 30.1% 28.3% 28.3% 28.4% 28.4% 28.1% 20.3%3
5
2007 2008 2009 2010 2011 2012 2013
• AmTrust’s majority shareholders¹ formed Maiden
• Entered into 40% Quota Share with AmTrust
• Entered into 25% NGHC² Quota Share
• Acquired international insurance business (IIS) from Ally
• Sold property Excess & Surplus (“E&S”) lines business
• NGHC Quota Share discontinued
• Acquired a reinsurance platform with 25 years of operations, GMAC RE, with renewal rights, client relationships, and infrastructure
2014
• Redeemed 14% TRUPS January 15, 2014
• All-time record annual operating earnings in 2014
2015
(GPW in $ millions)
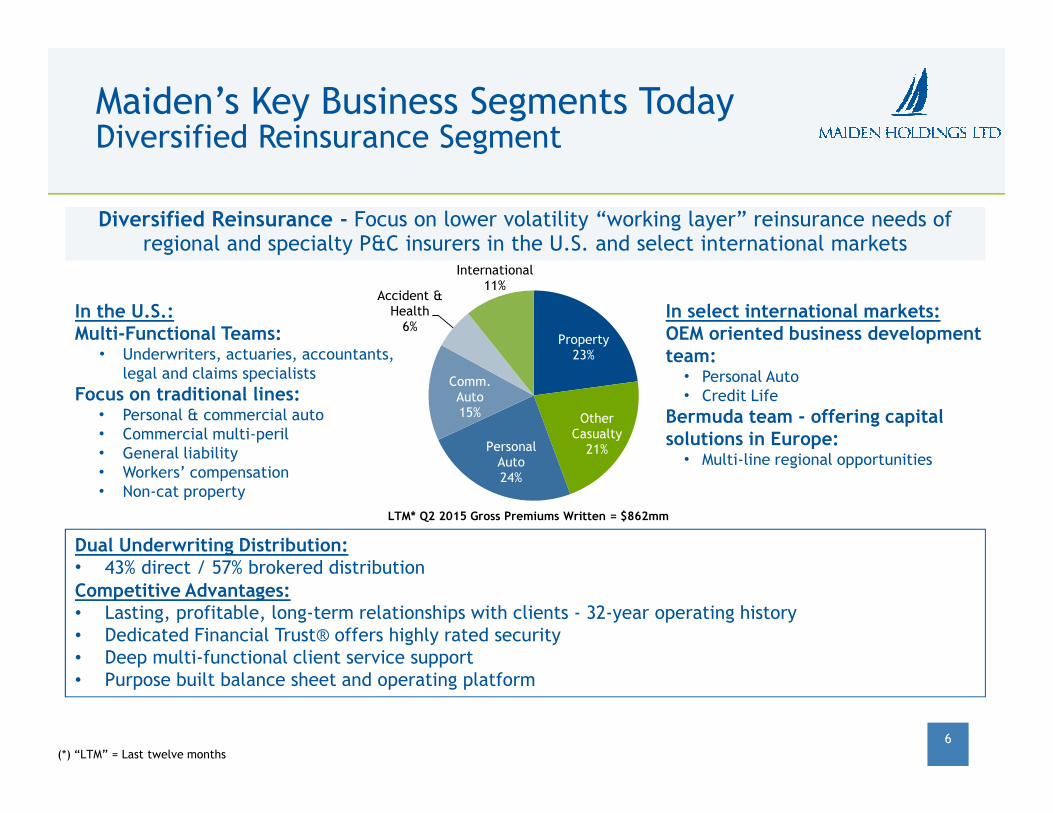
In the U.S.: Multi-Functional Teams:
• Underwriters, actuaries, accountants, legal and claims specialists
Focus on traditional lines:• Personal & commercial auto • Commercial multi-peril• General liability• Workers’ compensation• Non-cat property
In select international markets:OEM oriented business development team:
• Personal Auto• Credit Life
Bermuda team - offering capital solutions in Europe:
• Multi-line regional opportunities
LTM* Q2 2015 Gross Premiums Written = $862mm
Maiden’s Key Business Segments TodayDiversified Reinsurance Segment
6
Underwriting / Distribution
Dual Underwriting Distribution:• 43% direct / 57% brokered distributionCompetitive Advantages:• Lasting, profitable, long-term relationships with clients - 32-year operating history• Dedicated Financial Trust® offers highly rated security• Deep multi-functional client service support• Purpose built balance sheet and operating platform
Diversified Reinsurance - Focus on lower volatility “working layer” reinsurance needs of regional and specialty P&C insurers in the U.S. and select international markets
(*) “LTM” = Last twelve months
Property23%
Other Casualty
21%Personal Auto24%
Comm. Auto15%
Accident & Health
6%
International11%

Specialty Risk and Extended Warranty (U.S., Europe):• Consumer and commercial goods
warranty
• European Hospital liability
• Other
Small Commercial (U.S.):• Workers’ compensation
• Commercial package
• Commercial lines
Specialty Program:• Commercial package for
specialty risks / segments
Small Commercial
Business55%
Specialty Program
17%
Specialty Risk and Extended
Warranty28%
Underwriting:• Multi-year quota-share reinsurance relationship since 2007
— Master Agreement in place through 2016, with negotiated contract modifications and term extensions renewed twice previously
— Actively managed by Maiden to preserve targeted economics
• Strong controls and governance — Independent underwriting and reserving
— All related party transactions require independent Audit Committee approvals
AmTrust’s Strengths:• Significant driver of growth with profitable combined ratios
• AmTrust’s leading competitive position in specialty markets
• Highly efficient with strong technological core competency
Maiden’s Key Business Segments TodayAmTrust Quota Share Reinsurance Segment
7
AmTrust Quota Share - Providing strategically important capital support
to AmTrust since 2007
LTM* Q2 2015 Gross Premiums Written = $1,871mm
(*) “LTM” = Last twelve months

Balanced Portfolio of Low Volatility Underwriting Business
8
LTM Q2 2015 Gross Premiums Written• Majority of business made up of lower volatility proportional reinsurance
• Low-hazard, profitable workers’ compensation business
― 38% of LTM gross premiums written
― Focus on small premium, small-employer policies
― Significantly lower workers’ compensation loss ratio vs. industry mainly reflecting AmTrust’s specialization and leading position in low-hazard segment
Last Twelve Months Q2 2015 Gross Premiums Written = $2,733mm
1. Workers' compensation 38%
2. Commercial auto 12%
3. Personal auto 11%
4. Other liability 11%
5. Warranty 11%6. Fire, allied lines and inland marine 4%
7. European hospital liab. 4%
8. Commercial multi-peril 3%
9. Others 3%
10. Accident & health 2%
11. Homeowners' 1%
1
23
4
5
6
78
9
10 11

(50)%
(40)%
(30)%
(20)%
(10)%
0%
10%
20%
30%
40%
50%
60%
Q1
Q2
Q3
Q4
Q1
Q2
Q3
Q4
Q1
Q2
Q3
Q4
Q1
Q2
Q3
Q4
Q1
Q2
Q3
Q4
Q1
Q2
Q3
Q4
Q1 2
015
Q2 2
015
2009 2010 2011 2012 2013 2014
Maiden Has Predictable And Stable Operating Performance
9
Quarterly Combined Ratio Annualized Operating ROAE
Maiden Selected P&C (Re)Insurers¹ Maiden Q4 2012 Excluding Property E&S²
Maiden’s LTM Q2 2015 Operating ROAE: 13.1%
1Aspen, Arch, Axis, AWAC, Endurance, EverestRe, PartnerRe, RenRe, Validus, XL2Property E&S was sold to Brit in 2013.Source SNL Financial.
60%
80%
100%
120%
140%
160%
180%
Q1
Q2
Q3
Q4
Q1
Q2
Q3
Q4
Q1
Q2
Q3
Q4
Q1
Q2
Q3
Q4
Q1
Q2
Q3
Q4
Q1
Q2
Q3
Q4
Q1 2
015
Q2 2
015
2009 2010 2011 2012 2013 2014

Unique Operating Platform and Business Model Drive Highly Efficient Expense Relativities
101Aspen, Arch, Axis, AWAC, Endurance, EverestRe, PartnerRe, RenRe, Validus, XLSource: SNL and Company Financials
LTM Q2 2015 G&A Expense RatioMaiden: 2.7%Selected P&C (Re)Insurers1: 15.6%
$1,049
$1,298
$1,813 $2,001
$2,204 $2,507
$2,733
3.5% 3.5% 3.5%
2.9% 2.9% 2.8%2.7%
2009 2010 2011 2012 2013 2014 LTM Q2 2015
Gross Premiums Written ($mm) G&A Expense Ratio
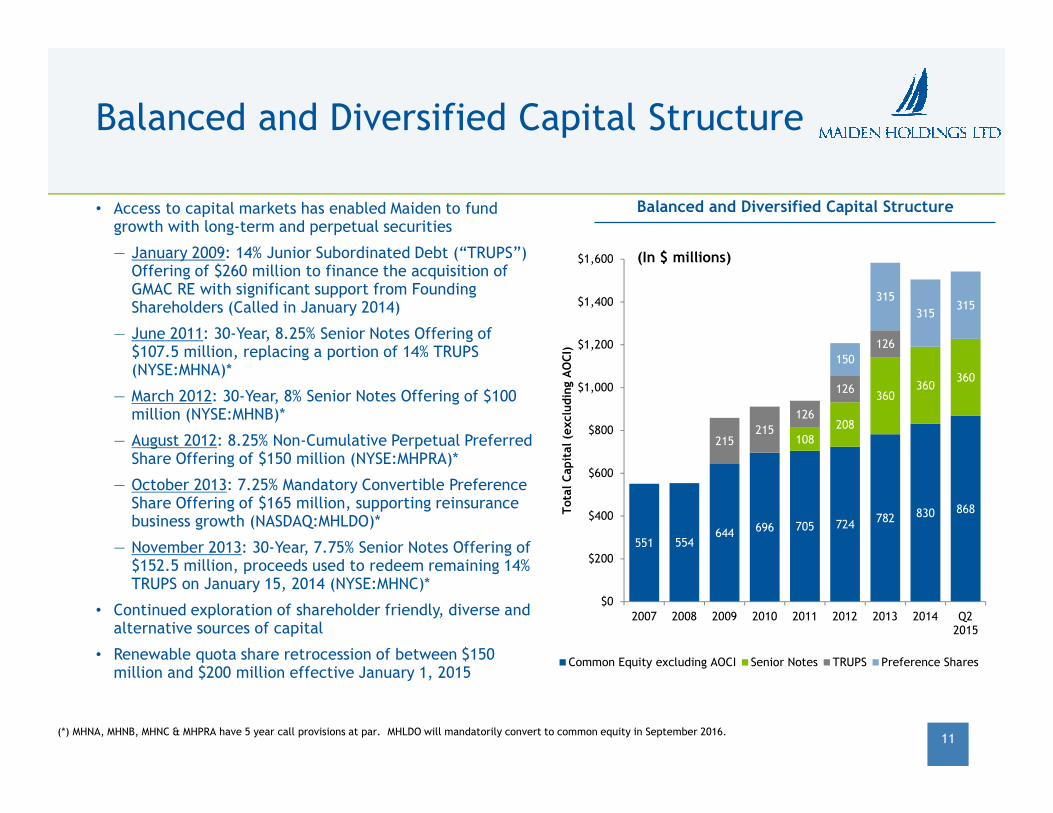
551 554644 696 705 724
782 830 868
108208
360360
360
215215
126
126
126
150
315
315315
$0
$200
$400
$600
$800
$1,000
$1,200
$1,400
$1,600
2007 2008 2009 2010 2011 2012 2013 2014 Q22015
Tota
l C
apit
al (e
xcl
udin
g A
OC
I)
Common Equity excluding AOCI Senior Notes TRUPS Preference Shares
Balanced and Diversified Capital Structure
11
• Access to capital markets has enabled Maiden to fund growth with long-term and perpetual securities
— January 2009: 14% Junior Subordinated Debt (“TRUPS”) Offering of $260 million to finance the acquisition of GMAC RE with significant support from Founding Shareholders (Called in January 2014)
— June 2011: 30-Year, 8.25% Senior Notes Offering of $107.5 million, replacing a portion of 14% TRUPS (NYSE:MHNA)*
— March 2012: 30-Year, 8% Senior Notes Offering of $100 million (NYSE:MHNB)*
— August 2012: 8.25% Non-Cumulative Perpetual Preferred Share Offering of $150 million (NYSE:MHPRA)*
— October 2013: 7.25% Mandatory Convertible Preference Share Offering of $165 million, supporting reinsurance business growth (NASDAQ:MHLDO)*
— November 2013: 30-Year, 7.75% Senior Notes Offering of $152.5 million, proceeds used to redeem remaining 14% TRUPS on January 15, 2014 (NYSE:MHNC)*
• Continued exploration of shareholder friendly, diverse and alternative sources of capital
• Renewable quota share retrocession of between $150 million and $200 million effective January 1, 2015
Balanced and Diversified Capital Structure
(In $ millions)
(*) MHNA, MHNB, MHNC & MHPRA have 5 year call provisions at par. MHLDO will mandatorily convert to common equity in September 2016.
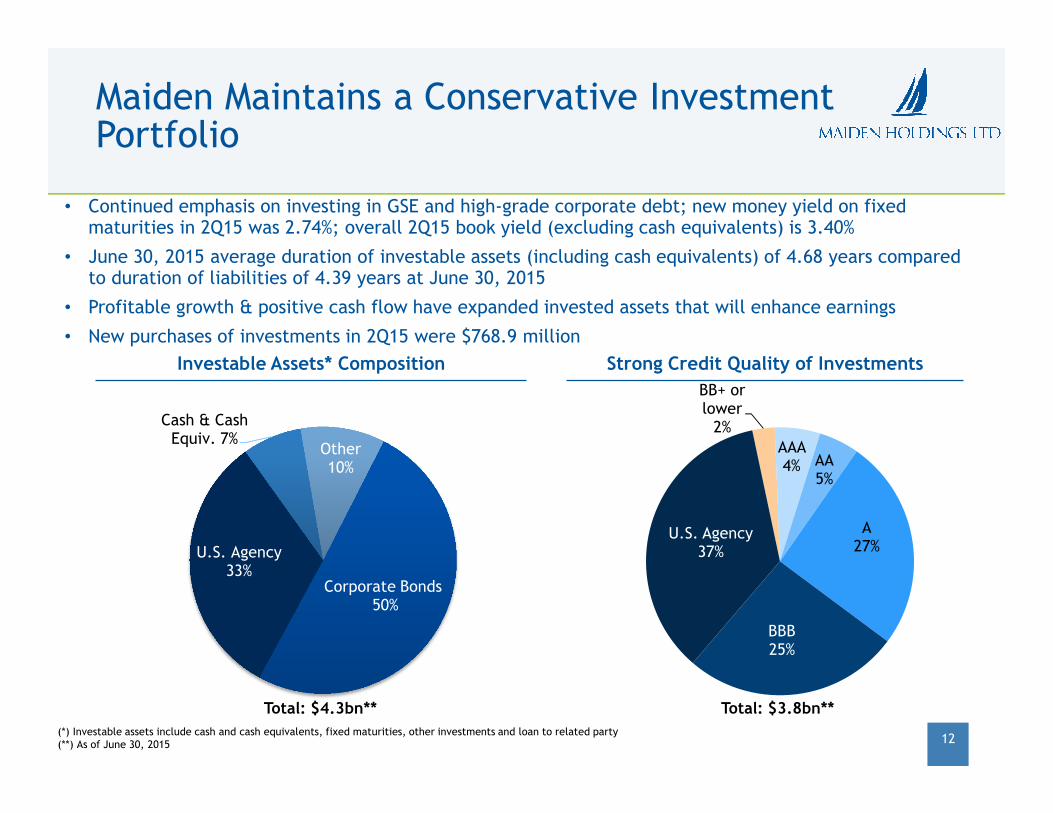
Corporate Bonds50%
U.S. Agency 33%
Cash & Cash Equiv. 7%
Other10%
BB+ or lower
2%AAA 4% AA
5%
A27%
BBB25%
U.S. Agency37%
Maiden Maintains a Conservative Investment Portfolio
Investable Assets* Composition
(*) Investable assets include cash and cash equivalents, fixed maturities, other investments and loan to related party (**) As of June 30, 2015
Total: $4.3bn**
Strong Credit Quality of Investments
Total: $3.8bn**
12
• Continued emphasis on investing in GSE and high-grade corporate debt; new money yield on fixed maturities in 2Q15 was 2.74%; overall 2Q15 book yield (excluding cash equivalents) is 3.40%
• June 30, 2015 average duration of investable assets (including cash equivalents) of 4.68 years compared to duration of liabilities of 4.39 years at June 30, 2015
• Profitable growth & positive cash flow have expanded invested assets that will enhance earnings
• New purchases of investments in 2Q15 were $768.9 million

Low-Volatility Business Model Supporting Asset and Investment Income Growth
Growing Net Investment Income ($mm) Expanding Investable Assets Base ($mm)
(*) Investable assets at December 31, 2013 include net proceeds of $147.4 million from November 2013 Senior Note offering. Maiden primarily utilized the proceeds of its Senior Notes offering in November 2013, as well as cash on hand, to redeem the $152.5 million face value TRUPs on January 15, 2014. 13
$ 62.9
$ 71.6 $ 74.9
$ 81.2
$ 91.4
$ 117.2
$ 124.7
2009 2010 2011 2012 2013 2014 LTM Q22015
$ 2,088 $ 2,234
$ 2,494
$ 3,003
$ 3,552
$ 4,030
$ 4,313
2009 2010 2011 2012 2013* 2014 Q2 2015

Investment Opportunity
14
� Differentiated P&C reinsurance business model with focus on low-volatility, predictable lines of business and strong long-lasting client relationships
� Demonstrated predictable, stable and highly efficient operating performance targeting ROAE of 15% or greater
� Shareholder-friendly capital management
� Strong commitment to rewarding shareholders through dividends
� Well-positioned for continued disciplined growth; significant opportunities to further enhance profitability

Maiden Holdings, Ltd.

Appendix
• Strategic Initiatives
• Targeted Operating Metrics
• Summary Balance Sheet
• Summary Income Statement
• Non-GAAP Financial Measures – Reconciliation
• Non-GAAP Financial Measures
16

Strategic Initiatives
Maiden IIS is continuing to develop OEM opportunities with additional expansion under development
• Several new auto accounts won in U.K., Germany, and Russia – U.K. and German opportunities include reinsurance
Maiden/Allianz payment protection insurance (PPI) joint venture partnership
• Strong European PPI pipeline identified
• Joint venture should be ready to accept business in early Q4 2015
Maiden capital solutions activity in Europe actively marketing and entertaining numerous prospect quoting opportunities
• Opportunities under development in multiple global markets including France, U.K., Nordic region, Gibraltar, and U.S.
• Currently actively marketing in the U.K., Spain, France, Italy, Gibraltar, Germany, Ireland and the U.S.
Maiden Re team in U.S. continues to identify opportunities to expand existing client relationships and customers
• Developing capital solutions model for U.S. similar to Maiden Bermuda approach in Europe
17
Appendix

Maiden Well Positioned to Achieve a 15% Operating ROAE
• Medium-term Operating ROAE > 15%
• Combined ratio < 96%
— G&A expense ratio < 4%
• NPW CAGR of 10%+
• Core regional insurer client retention rate of > 85%
• Modeled annual aggregate exposure to cat events < annual net income
Targeted Operating Metrics
15% operating ROAE attainable with improved underwriting results, growth in invested assets and current capital structure
18
Appendix

2009 2010 2011 2012 2013 2014 Q2 2015
($ in millions)
Investable Assets
Investments $ 1,667.2 $ 1,880.3 $ 2,022.9 $ 2,621.6 $ 3,167.2 $ 3,469.5 $ 3,836.2
Cash & Cash Equivalents 252.3 185.9 303.0 213.8 217.2 392.5 309.1
Loan to Related Party 168.0 168.0 168.0 168.0 168.0 168.0 168.0
Total Investable Assets 2,087.5 2,234.2 2,493.9 3,003.4 3,552.4 4,030.0 4,313.3
Net Reinsurance Receivable 211.3 226.3 423.4 522.6 560.1 513.0 600.2
Deferred Acquisition Costs 173.0 203.6 248.4 270.7 304.9 372.5 443.2
Other Assets 164.3 318.5 229.4 341.5 296.0 248.6 307.4
Total Assets $ 2,636.1 $ 2,982.6 $ 3,395.1 $ 4,138.2 $ 4,713.4 $ 5,164.1 $ 5,664.1
Loss and LAE Reserve $ 1,002.7 $ 1,226.8 $ 1,398.4 $ 1,740.3 $ 1,957.8 $ 2,271.3 $ 2,459.3
Unearned Premiums 583.5 657.6 832.0 936.5 1,034.8 1,207.7 1,483.9
Senior Notes - - 107.5 207.5 360.0 360.0 360.0
Trust Preferred Securities 215.1 215.2 126.3 126.3 126.4 - -
Other Liabilities 158.3 132.5 161.9 112.0 110.1 83.9 135.2
Total Liabilities 1,959.6 2,232.1 2,626.1 3,122.6 3,589.1 3,922.9 4,438.4
Equity 676.5 750.5 769.0 1,015.6 1,124.3 1,241.2 1,225.7
Total Liabilities & Equity $ 2,636.1 $ 2,982.6 $ 3,395.1 $ 4,138.2 $ 4,713.4 $ 5,164.1 $ 5,664.1
Book Value per Common Share $ 9.62 $ 10.40 $ 10.64 $ 11.96 $ 11.14 $ 12.69 $ 12.35
Growth in Total Investable Assets 13.8% 7.0% 11.6% 20.4% 18.3% 13.4% 7.0%
Ratio of Total Investabe Assets to Equity 308.6% 297.7% 324.3% 295.7% 316.0% 324.7% 351.9%
Summary Balance Sheet
19
Appendix

2009 2010 2011 2012 2013 2014 Q2 2015
($ in millions)
Gross Premiums Written $ 1,048.7 $ 1,298.1 $ 1,812.6 $ 2,001.0 $ 2,204.2 $ 2,507.4 $ 1,508.4
Net Premiums Written $ 1,030.4 $ 1,227.8 $ 1,723.5 $ 1,901.3 $ 2,096.3 $ 2,458.1 $ 1,426.6
Net Premiums Earned $ 919.9 $ 1,169.8 $ 1,552.4 $ 1,803.8 $ 2,000.9 $ 2,251.7 $ 1,186.7
Net Investment Income 62.9 71.6 74.9 81.2 91.4 117.2 63.4
Interest and Amortization Expenses 34.4 36.5 34.1 36.4 39.5 29.6 14.5
Net Income attributable to Maiden common shareholders $ 61.1 $ 69.9 $ 28.5 $ 46.5 $ 87.9 $ 77.1 $ 52.9
Operating Earnings * $ 66.2 $ 72.7 $ 69.6 $ 48.5 $ 87.5 $ 117.7 $ 55.0
Operating EPS * $ 0.95 $ 1.02 $ 0.96 $ 0.66 $ 1.18 $ 1.53 $ 0.71
Operating ROE ** 11.2% 10.2% 9.2% 5.9% 10.5% 13.6% 12.1%
Loss Ratio 66.2% 64.6% 66.6% 69.5% 67.0% 66.1% 66.3%
Expense Ratio 29.7% 32.3% 31.5% 30.0% 30.5% 31.9% 32.4%
Combined Ratio 95.9% 96.9% 98.1% 99.5% 97.5% 98.0% 98.7%
Summary Income Statement
• (*) 2011 Includes $9.5 million or 0.6% in loss ratio and combined ratio impact from U.S. thunderstorm and tornado activity in 2Q11. 2012 includes $31.1 million or 1.7% in loss ratio and combined ratio impact from Superstorm Sandy in 4Q12.
• (**) Q2 2015 Operating ROE is annualized.
• Please see the non-GAAP reconciliation table in the appendix of this presentation for additional important information.
20
Appendix

Non-GAAP Financial MeasuresReconciliation
Note: Please see the definition of non-GAAP financial measures on next page for additional important information.
Appendix
21
2009 2010 2011 2012 2013 2014 Q2 2015
($ in millions)
Net income $ 61.1 $ 69.9 $ 28.5 $ 50.2 $ 102.8 $ 101.5 $ 65.0
(Income) loss attributable to noncontrolling interest - - - (0.1) (0.1) $ (0.1) $ 0.1
Dividends on preference shares - - - (3.6) (14.8) $ (24.3) $ (12.2)
Add (subtract):
Net realized and unrealized (gains) losses on investment (0.3) (6.6) (0.5) (1.9) (3.6) (1.2) (1.1)
Net impairment losses recognized in earnings - - - - - 2.4 -
Foreign exchange and other (gains) losses (2.5) 0.6 (0.3) (1.6) (2.8) (4.2) (2.6)
Amortization of intangible assets 6.6 5.8 5.0 4.4 3.8 3.3 1.4
Divested excess and surplus business and NGHC run-off - - - - - 10.4 3.8
Junior subordinated debt repurchase expense - - 15.1 - - - -
Accelerated amortization of junior subordinated debt discount and issuance cost - - 20.3 - - 28.2 -
Interest expense incurred related to 2013 Senior Notes prior to actual
redemption of the junior subordinated debt- - - - 1.2 0.5 -
Non-recurring general and administrative expenses relating to
IIS Acquisition - 1.8 0.2 - - - -
Non-cash deferred tax expense 1.3 1.2 1.3 1.1 1.0 1.2 0.6
Operating earnings $ 66.2 $ 72.7 $ 69.6 $ 48.5 $ 87.5 $ 117.7 $ 55.0
Operating earnings per common share:
Basic operating earnings per share $ 0.95 $ 1.03 $ 0.97 $ 0.67 $ 1.21 $ 1.61 $ 0.75
Diluted operating eanings per share $ 0.95 $ 1.02 $ 0.96 $ 0.66 $ 1.18 $ 1.53 $ 0.71

Non-GAAP Financial Measures
• In presenting the Company’s results, management has included and discussed in this presentation certain non generally accepted accountingprinciples (“non-GAAP”) financial measures within the meaning of Regulation G as promulgated by the U.S. Securities and Exchange Commission.Management believes that these non-GAAP measures, which may be defined differently by other companies, better explain the company’sresults of operations in a manner that allows for a more complete understanding of the underlying trends in the Company’s business. However,these measures should not be viewed as a substitute for those determined in accordance with generally accepted accounting principles (“U.S.GAAP”).
• Operating Earnings and Operating Earnings per Common Share: In addition to presenting net income determined in accordance with U.S. GAAP,we believe that showing operating earnings enables investors, analysts, rating agencies and other users of our financial information to moreeasily analyze our results of operations in a manner similar to how management analyzes our underlying business performance. Operatingearnings should not be viewed as a substitute for U.S. GAAP net income. Operating earnings are an internal performance measure used in themanagement of our operations and represents operating results excluding, as applicable on a recurring basis, net realized and unrealized gainsor losses on investment, foreign exchange and other gains or losses, amortization of intangible assets and non-cash deferred tax expenses. Weexclude net realized and unrealized gains or losses on investment and foreign exchange and other gains or losses as we believe that both areheavily influenced in part by market opportunities and other factors. We do not believe amortization of intangible assets are representative ofour ongoing business. We believe all of these amounts are largely independent of our business and underwriting process and including themdistorts the analysis of trends in our operations. We also exclude certain non-recurring expenditures that are material to understanding ourresults of operations. As of the third quarter of 2014, we exclude impairment losses. Beginning in the second quarter of 2014, we exclude ourdivested E&S business as it has been in run-off for over one year following the sale to Brit effective May 1, 2013. Similarly, beginning in thefourth quarter of 2014, we exclude results from NGHC as this business segment has been in run-off for one year following the mutualcancellation on a run-off basis of our contract. Furthermore, in Q1 of 2014 and Q2 2011, we exclude the accelerated amortization of the JuniorSubordinated Debt discount and the write off of the associated issuance costs. In Q1 2014 and Q4 2013, we also exclude the interest expenseincurred on our 2013 Senior Notes prior to the redemption of the outstanding Junior Subordinated Debt given the one time nature of theadditional funding cost. For 2011 and 2010, we exclude transaction expenses related to the IIS Acquisition as these are non-recurring.
• Operating Return on Average Common Equity ("Operating ROACE"): Management uses operating return on average common shareholders' equityas a measure of profitability that focuses on the return to Maiden common shareholders. It is calculated using operating earnings available tocommon shareholders (as defined above) divided by average Maiden common shareholders' equity. Management has set as a target a long-termaverage of 15% Operating ROACE, which management believes provides an attractive return to shareholders for the risk assumed from ourbusiness. The repayment of the Junior Subordinated Debt in the first quarter of 2014 is a crucial step in advancing the Company closer to thatgoal.
• See the previous page of this presentation for a reconciliation of non-GAAP measures used in this presentation to their most directly comparableGAAP measures.
Appendix
22