Mahendra Negi Trend Micro · Mahendra Negi, CFO, Representative director February 4, 2003 1 Trend...
30
Mahendra Negi Mahendra Negi , , CFO, Representative director CFO, Representative director February 4, 2003 February 4, 2003 1 Trend Micro Trend Micro FY2002. 4Q / Annual Results FY2002. 4Q / Annual Results
Transcript of Mahendra Negi Trend Micro · Mahendra Negi, CFO, Representative director February 4, 2003 1 Trend...

Mahendra NegiMahendra Negi, ,
CFO, Representative directorCFO, Representative director
February 4, 2003February 4, 2003
1
Trend MicroTrend MicroFY2002. 4Q / Annual ResultsFY2002. 4Q / Annual Results

Certain statements that we make in this presentation are forward-looking statements.These forward-looking statements include statements regarding:
• The business potential of the Internet• Our ability to profitably develop and sell Internet-related products and services• Trends in our future operating results and other financial results• Our investments in Internet-related companies, and the success of those
investments
Many important factors could cause our actual results to differ materially from thoseexpressed in our forward-looking statements. These factors include:
• Customer acceptance of our new products and services• The impact of competing products and services• Difficulties in adapting our products and services to the Internet• Difficulties in addressing new virus and other computer security problems• The potential lack of attractive investment targets and difficulties in successfully
executing our investment strategy• Declining prices for our products and services
We assume no obligation to update any forward-looking statements.
For more details regarding risk factors relating to our future performance, please refer toour filings with the SEC.
2
Forward Looking Statements
3
Fiscal Year ended December 2002Fiscal Year ended December 2002FY2002 4Q Financial HighlightFY2002 4Q Financial Highlight

4
Three months ended Dec 31,
11,760
11,1226,6894,4333,942
63810,838
79610,0426,1253,9164,239
9%-20%11%9%
13%-7%
34% 39%
4Q2002 4Q2001 YoY growth
Net salesCost of salesGross profitOperating expensesOperating incomeOrdinary income
Ordinary income margin
(In accordance with Japanese GAAP)
(in million Yen)(unaudited)
Consolidated ResultsConsolidated Results
11,616 10,838 7%Net salesIf same currency exchange rate is applied.
Net Income 2,576 - -

(In accordance with Japanese GAAP)5
(unaudited)
910312
2,965
4,706
2,361 2,5472,233
4371,117
5,006
0
1,000
2,000
3,000
4,000
5,000
6,000
Japan US Europe Asia Pacific Others
4Q20014Q2002
(in million Yen)
+ 6%
- 5%+ 16%
+ 23%+ 40%
Growth by regionGrowth by region

(In accordance with Japanese GAAP)
If same currency exchange rate is applied.
6
(unaudited)
(in million Yen)
312910
2,5472,361
4,706
2,6782,257
5,006
1,115559
0
1,000
2,000
3,000
4,000
5,000
6,000
Japan US Europe Asia Pacific Others
4Q20014Q2002
+ 6%
- 4 %+ 5 %
+ 22%+ 79%
Growth by regionGrowth by region

JapanJapan43%43%
USUS22%22%
EuropeEurope24%24%
Asia Asia PacificPacific
8%8%
OthersOthers3%3%
JapanJapan43%43%
USUS19%19%
EuropeEurope25%25%
OthersOthers4%4%
4Q2001 4Q200210,838 million Yen 11,760 million Yen
(In accordance with Japanese GAAP)7
(unaudited)
Asia Asia PacificPacific
9%9%
% % share by regionshare by region
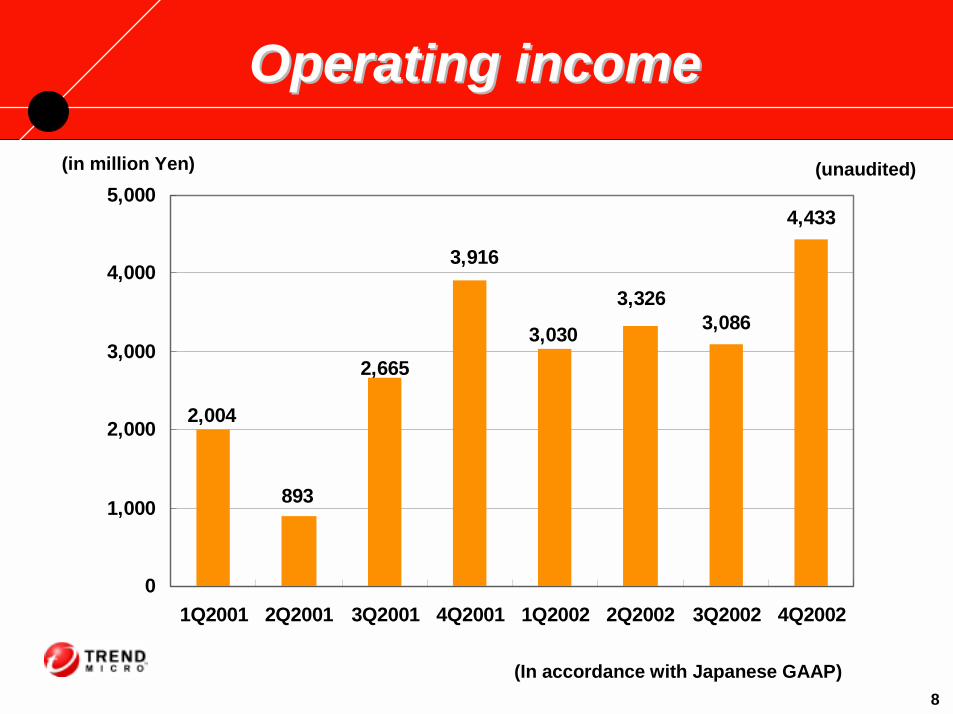
3,086
4,433
3,326
3,030
3,916
2,665
893
2,004
0
1,000
2,000
3,000
4,000
5,000
1Q2001 2Q2001 3Q2001 4Q2001 1Q2002 2Q2002 3Q2002 4Q2002
(in million Yen)
(In accordance with Japanese GAAP)8
(unaudited)
Operating incomeOperating income

Gross marginGross margin
(In accordance with Japanese GAAP)
95%95%94%94%93%
95%95%
94%90%
95%
100%
1Q2001 2Q2001 3Q2001 4Q2001 1Q2002 2Q2002 3Q2002 4Q2002
9
(unaudited)
38%29%31%31%30%
14%
35% 36%
10%
15%
20%
25%
30%
35%
40%
1Q2001 2Q2001 3Q2001 4Q2001 1Q2002 2Q2002 3Q2002 4Q2002
ProfitabilityProfitability
Operating profit marginOperating profit margin

(In accordance with Japanese GAAP)
0
2,000
4,000
6,000
8,000
10,000
12,000
14,000
4Q2001 4Q2002
Internet sever
LAN
PC(consumer)
PC(enterprize),others
4Q2001 4Q2002
38%
14%
25%
23%
39%
16%
21%
23%
100% 100%Total
(in million Yen)
10
(unaudited)
1,840
Sales by productSales by product
2,526
2,756
4,150
1,535
2,700
2,453
4,638

1,364 881
1,0181,070
1,7621,925
2,1261,983
836830
0
1,000
2,000
3,000
4,000
5,000
6,000
7,000
8,000
3Q2002 4Q2002
R&D
Marketing
Sales
Support
Others
(in million Yen)
(In accordance with Japanese GAAP)**Categorized in accordance with the accounting policy for internal reporting purpose
Operating expenses by department**
11
12%
30%
29%
16%
13%
Total
(unaudited)
4Q20023Q2002
12%
30%
25%
14%
19%
100%
SGA by DepartmentSGA by Department
100%

Sales, Marketing
Research, Development
Technical Support
Others
624
636
351
226
Dec - 20021,837
+ 42(+ 2%)
12
Sep - 20021,795
Sales, Marketing
Research, Development
Technical Support
Others
610
619
342
224
HeadcountHeadcount

(In accordance with Japanese GAAP)
Operating income
4,433 M
Interest income117M
Exchange gain Interest expense
Ordinary income
3,942 M
13
NonNon--operating itemsoperating items
Incomebefore taxes
3,937 M
Disposal of inventories and others
53M74M
4M
((unauditedunaudited))
550M
Loss on securities & capital fund
77M Disposal of fixed assets

14
15,672
12,99712,017
4,686
6,966 7,77910,259
11,222
0
2,500
5,000
7,500
10,000
12,500
15,000
17,500
20,000
Mar-'01 Jun-'01 Sep-'01 Dec-'01 Mar-'02 Jun-'02 Sep-'02 Dec-'02
(in million Yen)
(In accordance with Japanese GAAP)
(unaudited)
Deferred revenue analysisDeferred revenue analysis

15
Fiscal Year ended December 2002Fiscal Year ended December 2002FY2002 Annual Financial HighlightFY2002 Annual Financial Highlight

16
Fiscal year ended Dec 31,
42,979
40,62526,74913,87613,449
2,35331,3261,898
29,42719,946
9,4819,549
37%24%38%34%46%41%
31% 30%
FY2002 FY2001 YoY growth
Net salesCost of salesGross profitOperating expensesOperating incomeOrdinary income
Ordinary income margin
(In accordance with Japanese GAAP)
(in million Yen)(unaudited)
Consolidated ResultsConsolidated Results
42,035 31,326 34%Net salesIf same currency exchange rate is applied.
Net Income 7,892 2,421 226%

(in million Yen)
(In accordance with Japanese GAAP)17
Growth by regionGrowth by region
2,803970
9,215 9,80712,114
8,5776,860
1,401
4,208
18,346
0
5,000
10,000
15,000
20,000
Japan US Europe Asia Pacific Others
FY2001FY2002
(in million Yen) + 51%
+ 7%+ 43%
+ 50%
+ 44%
(unaudited)
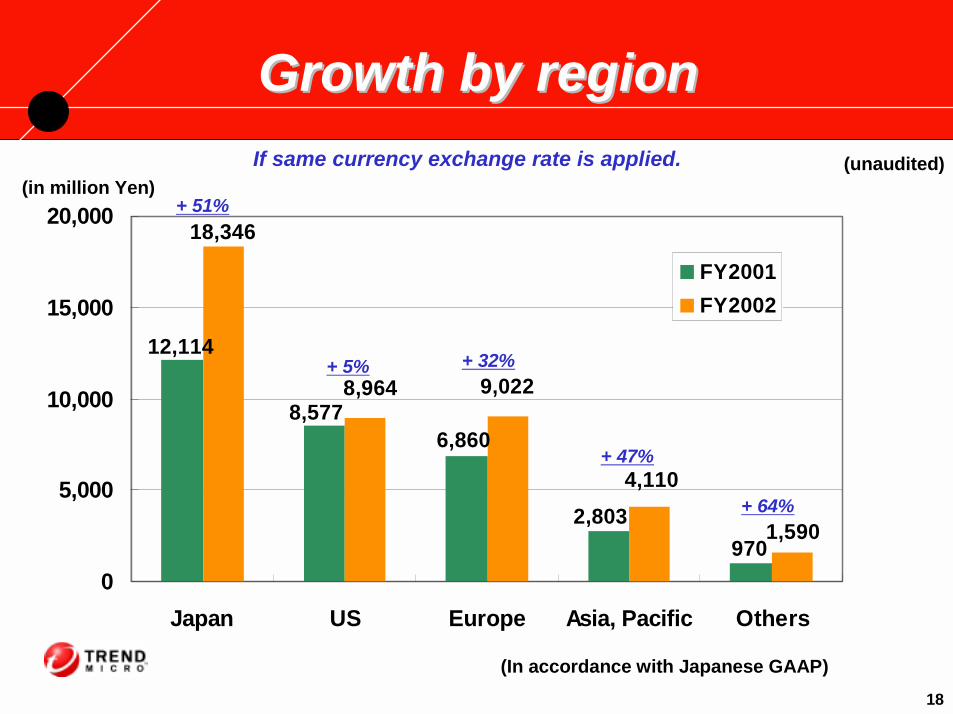
9702,803
12,114
8,5776,860
9,0228,964
1,590
4,110
18,346
0
5,000
10,000
15,000
20,000
Japan US Europe Asia, Pacific Others
FY2001FY2002
(in million Yen)
(In accordance with Japanese GAAP)
+ 51%
+ 5% + 32%
+ 47%
+ 64%
If same currency exchange rate is applied.
18
Growth by regionGrowth by region(unaudited)

4,716 4,344
2,459 3,855
6,2067,640
3,810
7,4052,755
3,505
0
5,000
10,000
15,000
20,000
25,000
30,000
FY2001 FY2002
R&D
Marketing
Sales
Support
Others
(in million Yen)
(In accordance with Japanese GAAP)
Operating expenses by department**
19
Operating expensesOperating expenses
**Categorized in accordance with the accounting policy for internal reporting purpose
13%
28%
29%
14%
16%
Total
FY2002FY2001
14%
19%
31%
12%
24%
100% 100%
(unaudited)

(In accordance with Japanese GAAP)
Operating income
13,876 M
Interest income
409 M
Others
Ordinary income
13,449 M
20
NonNon--operating itemsoperating items
550 M
Incomebefore taxes
13,431 M
Disposal of fixed assets
Exchange Gain48 M
122M
277 M
88M
64 MInterest expense
Disposal of inventories and others
Loss on repurchase of treasury bond
93M
Loss on securities & capital fund
(unaudited)

(In accordance with Japanese GAAP)21
Balance sheetBalance sheet
74,165
+ 6
+ 7,042
65,317
Dec-2002 Dec-2001
Total assets
Cash and bank deposit
Account receivable
(in million Yen)
+ 835Deferred tax assets (current)
YoY change
40,853
12,280
3,209
2,529- 1,379 Investment securities
47,895
12,287
4,044
1,150
+ 8,848
(unaudited)
(In accordance with Japanese GAAP)22
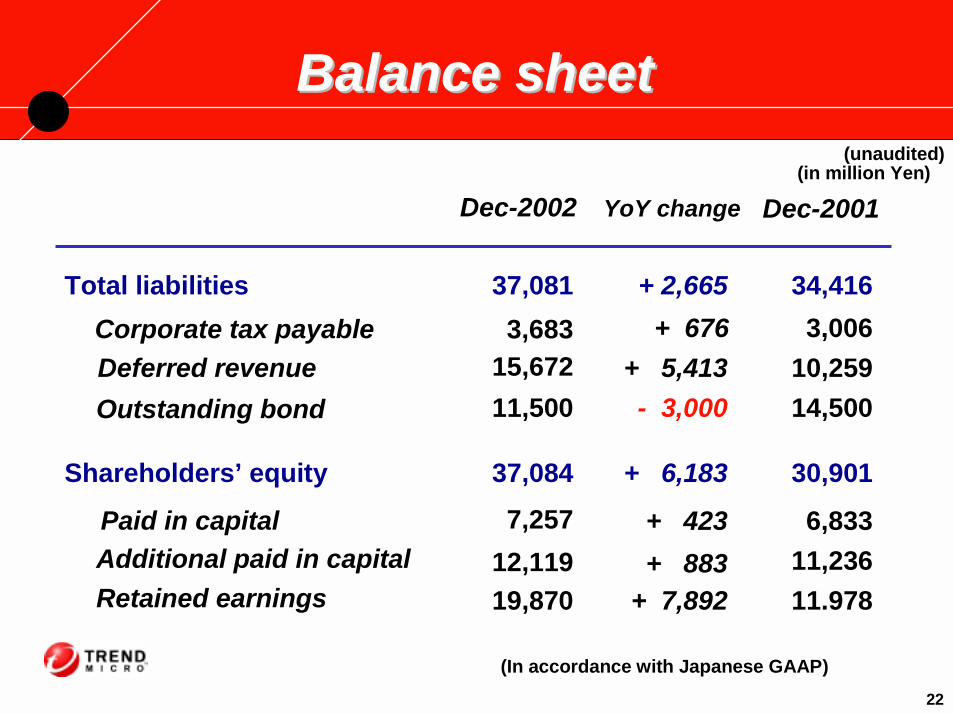
Balance sheetBalance sheet
37,081
+ 5,413+ 676
34,416
Dec-2002 Dec-2001
Total liabilities
Outstanding bondDeferred revenue
(in million Yen)
- 3,000
Corporate tax payable
+ 423Additional paid in capital + 883Retained earnings
YoY change
3,00610,25914,500
6,83311,23611.978+ 7,892
Paid in capital
3,68315,67211,500
7,25712,11919,870
+ 2,665
37,084 30,901Shareholders’ equity + 6,183
(unaudited)

(in million Yen)
(In accordance with Japanese GAAP)23
Deferred Revenue by regionDeferred Revenue by region
540 268
3,977
1,6852,678
5,085
6,897
939339
3,519
0
2,000
4,000
6,000
8,000
Japan US Europe Asia Pacific Others
Dec-2001Dec-2002
(in million Yen)
+ 36%
+ 48% + 109%
+ 74%
+ 26%
(unaudited)

(in million Yen)
(In accordance with Japanese GAAP)24
Deferred Revenue by regionDeferred Revenue by region
540 268
4,3645,085
2,6781,685
3,283
478988
6,897
0
2,000
4,000
6,000
8,000
Japan US Europe Asia Pacific Others
Dec-2001Dec-2002
(in million Yen)
+ 36%
+ 63%+ 95%
+ 83%
+ 78%
(unaudited)If same currency exchange rate is applied.
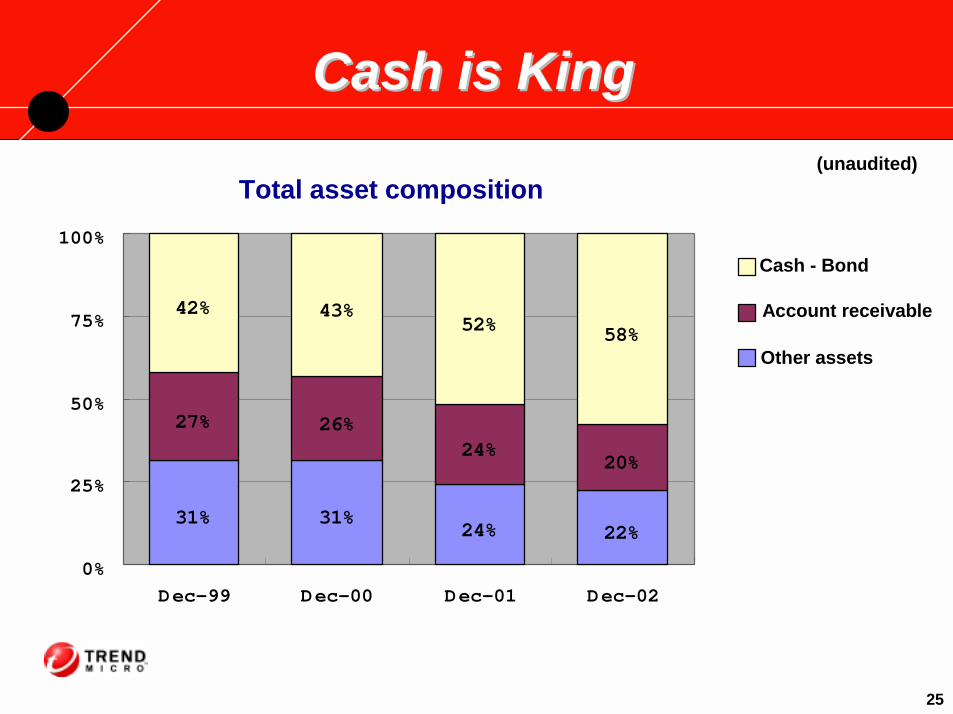
Cash is KingCash is King
31% 31%24% 22%
27% 26%24%
20%
42% 43%52% 58%
0%
25%
50%
75%
100%
Dec-99 Dec-00 Dec-01 Dec-02
Cash - Bond
Account receivable
Other assets
Total asset composition
25
(unaudited)

Impact of Option ExpenseImpact of Option Expense
Pro forma stock option expense under SFAS 148 , U.S. GAAP.
Pro forma Ordinary income 12,577 8,7276% decline
FY2002 FY2001
(in million Yen)
Pro forma Option expense 872 821
13,449 9,549Ordinary income
9% decline
(unaudited)
26
Japan GAAP

Internal TransactionInternal TransactionRoyalty
Business outsourcing (R&D and others)
Parent4,397
3,942
739
370
Japan
5,543
1,468
2,617
0
Japan
Subsidiaries
Parent: SalesSubsidiaries: Operating
Expense
Accounting Treatment
US
EuroAsia/
OceaniaOthers
Parent: Operating ExpenseSubsidiaries: Sales
( )-cost of sales
Accounting Treatment(5,279)
(2,481)
(0)
(1,398)
US
EuroAsia/
OceaniaOthers
(in million Yen)(unaudited)
27

Review for FY2002Review for FY2002
28
Japan - Strong growth of VB in 1H, slowing down in 2H. Building a new management team.
North America - Slow enterprise market.Rebuilding of channel, branding campaign, new Marketing team.
Europe - Strong growth continued, increasing investment and business in Scandinavia, Italy and Eastern Europe.
APAC - All round growth, China becomes cash flow positive in Q4.
LA - Increasing geographical coverage, some negative impact of currency.

29
• Estimated exchange rate 1USD = 118 yen1EUR = 128 yen
• Change the accounting standard to US GAAP•• Set 20 % of consolidated net income as a base Set 20 % of consolidated net income as a base
for the dividendsfor the dividends
Net Sales
Operating IncomeNet Income
11,000
3,1001,800
Jan, 2003 - Mar, 2003
Projection for 1QProjection for 1QFor 1Q
Expected YoY growth 13%
(in million Yen)

30
Thank you!Thank you!