MAHARASHTRA POLLUTION CONTROL BOARD Annual Report 2015 … · (April 2015) Shri Sitaram Kunte, IAS,...
147
MAHARASHTRA POLLUTION CONTROL BOARD Annual Report 2015-16
Transcript of MAHARASHTRA POLLUTION CONTROL BOARD Annual Report 2015 … · (April 2015) Shri Sitaram Kunte, IAS,...

MAHARASHTRA POLLUTION CONTROL
BOARD
Annual Report 2015-16

Foreword
The Maharashtra Pollution Control Board has truly acquired a significance
of its own in the national as well as in the global context. The Board will have to
play a far greater role in management in the Areas such as Water pollution control,
Air pollution control, Hazardous Waste management, Bio-Medical Waste
management, Municipal Solid Waste management etc. For effective implementation
of environmental legislations, the Board has taken various steps such as fast
clearance of the Consents/ Authorization, Joint Vigilance Sampling, Legal actions
under sec. 33A of Water Act and 31A of Air Act, Environment improvement
program at religious places, Conducting Mass Awareness programs on large scale,
increasing frequency of inspection of polluting sources, monitoring of coastal
pollution, strengthening of laboratories for analysis of samples, development of
Infrastructure and decentralization of powers at the level of subordinate offices,
maximum information dissemination through website etc.
With a view to have ready information on the activities of Maharashtra
Pollution Control Board, an attempt is made to present the relevant and latest
statistics about key indicators and parameters e.g. Industries covered under the
purview of the environmental legislations, Grant of Consent, Authorization issued
under Bio-Medical Waste (Mgmt. and Handling) Rules, 1998 & Municipal Solid
Waste (M & H) Rules, 2000, Legal Actions initiated against defaulters, Public
Complaints, Central Action Plan, Industrial pollution load, CETP Status,
Performance of Regional Offices, Central & Regional Laboratories, environmental
Water & Air quality, Organization, Staff Strength , Cess assessment and collection
etc.
Dr. P. Anbalagan Member Secretary
Maharashtra Pollution Control Board

INDEX
1. Introduction 1 - 2
2. Constitution of the Board 3 - 4
3. Meetings of the Board 5 - 8
4. Committees Constituted By the Board 9 - 10
5. Water & Air Quality Monitoring Network and Present Status of Environment
11 - 83
6. Regional Environmental Problems & Control Measures Taken in Respective Regions
84 - 90
7. Environmental Studies & Surveys 91 - 96
8. Environmental Training 97
9. Environmental Awareness & Public Participation 98 - 112
10. Implementation of Acts & Rules under Environment Protection Act, 1986
113
11. Prosecutions Launched & Conviction Secured 114 – 115
12. Finance and Accounts 116
13. Important matters dealt with by the Board 117 - 121
LIST OF ANNEXURES
Annexure 1A Organisational Structure
Annexure 1B Filed Office Chart
Annexure 2 Staff Strength of MPCB
Annexure 3 Details of Regional & Sub-Regional Offices with their juridisctions
Annexure 4 Regionwise Industry Statistics
Annexure 5 Details of Training Programs attended by MPCB officials
Annexure 6 Details of Financial Accounts & Balance Sheet FY 2015-16

1
1.0 INTRODUCTION
Maharashtra State is the first State in India to introduce environmental legislations. The
Maharashtra (Prevention of Water Pollution) Act was promulgated in 1969 & Maharashtra
State Board was established in 1970 under the provision of this Act. Subsequently, in 1974,
the Parliament passed Water (Prevention and Control of Pollution) Act 1974. This was
adopted by the State in 1981 and Maharashtra Pollution Control Board (MPCB) was
constituted under this new Act.
Considering the challenges, the Board has strengthened itself in various capacities by
developing infrastructure for laboratories and offices, following the practice of e-governance,
engaging services of Professionals, Environmental Scientists and Engineers for specific
projects and studies.
The Board has established twelve Regional Offices, forty two Sub-Regional offices and eight
laboratories across the State to safeguard natural environment and curb the pollution with
necessary control measures.
To know the pollution potential the Board regularly analyzes Water samples, Air samples
and Hazardous waste samples in the Central laboratory established at Navi Mumbai and
seven Regional Laboratories at Nagpur, Aurangabad, Pune, Nashik, Thane, Chiplun and
Chandrapur.
To assess ambient air quality, water quality the Board has already strengthened its
‘Monitoring’ network. All the related data is compiled and updated regularly on Board’s
website. The ‘Noise’ level monitored during festivals are regularly collected and updated on
the website for the information of the people at large. Under the National Ambient Noise
Monitoring Network Pro8gramme (NAMP) as per the proposed road map 5 continuous
monitoring stations have been installed at Mumbai / Navi Mumbai / Thane area in the State.
As a part of Common Environmental Infrastructure for Environment protection, Common
Effluent Treatment Plants (CETP) for treatment and disposal of industrial effluent, common
facilities for treatment and disposal of Hazardous Waste and common facilities for treatment
and disposal of Bio-Medical Waste have been established across the State.
To motivate the local bodies for treatment and disposal of Municipal Solid Waste, the Board
has undertaken demonstration projects at five places in the State.
Through Integrated Management Information System (IMIS) the Board is computerizing its
various process and operations to maintain transparency with its constituents and to

2
increase the overall efficiency. The system is mainly designed for Consent Management,
Waste Management, Cess Collection, Laboratory Management and Financial Management.
For tracking Hazardous waste, the board has also implemented a computer software
program.
For creating general awareness among the people on environmental issues, it is the
constant endeavor of the board to conduct various awareness programs throughout the
State involving Press, Media, NGOs, Artist and student. Efforts are also being made to
create awareness to celebrate almost all festivals in eco-friendly manners.

3
2.0 CONSTITUTION OF THE BOARD
The Maharashtra Pollution Control Board comprises of Chairman, Members from the
categories as shown below and a full time Member- Secretary, as chief executive officer as
per the Rules under Water (P.&C.P) Act, 1974 notified by the State Government in 1983.
The composition of the Board is as under:
1. Chairman: (Part time or full time)
2. Representatives of the State Govt. (not exceeding five)
3. Representatives of local bodies (not exceeding five)
4. Representatives of companies or corporations of the State Govt. (two)
5. Members representing interests of agriculture, fishery or industry or trade etc.
(not exceeding three)
6. Member Secretary (full time) Government of Maharashtra has the powers under section 4 of the Water (Prevention and
Control of Pollution) Act, 1974 to constitute State Pollution Control Board (MPCB). However,
members representing the local bodies (not exceeding five) and members representing
interests of agriculture, fishery, industry, trade or any other interest are not yet appointed as
per the composition given under the Act.
Constitution of M.P.C. Board during 2015-2016
Shri. Ajoy Mehta, IAS,
Principal Secretary, Environment Department,
Govt. of Maharashtra
Chairman (Additional Charge)
(April 2015)
Shri Sitaram Kunte, IAS,
Principal Secretary, Environment Department,
Government of Maharashtra
Chairman, (Additional Charge)
(from 20/4/2015 to 20/5/2015)
Mrs. Malini Shankar, IAS,
Additional Chief Secretary, Environment Dept.,
Government of Maharashtra,
Chairman, (Additional Charge)
(From 28/5/2015 to 2/5/2016)
Additional Chief Secretary
Public Health Dept.
Government of Maharashtra,
Mantralaya, Mumbai
Member
Principal Secretary-II
Urban Development Dept.,
Government of Maharashtra,
Mumbai
Member

4
Principal Secretary
Water Supply and Sanitation,
Government of Maharashtra,
Mantralaya, Mumbai
Member
Secretary
Home (Transport) Dept.,
Government of Maharashtra,
Mantralaya, Mumbai
Member
Chief Executive Officer
M.I.D.C., Mahakali Caves Road,
Andheri (E),Mumbai
Member
Member Secretary (Technical)
Maharashtra Jeevan Pradhikaran,
Express Towers, Nariman Point, Mumbai
Member
Dr. P. Anbalagan
Member Secretary,
M.P.C.B, Mumbai.
Member Secretary
(from 07/01/2015)

5
3.0 MEETINGS OF THE BOARD
During the year 2015-16, 165th Board meeting was held on 14th October 2015. Major
decisions taken by the Board during the year 2015-16 are as listed below:
Application from MIDC for grant of relaxations of Standards to LSI / MSI; industries
at Textile Park, Additional Industrial Area MIDC Nandgaon Peth, Dist. Amravati
Maharashtra Industrial Development Corporation (MIDC) has proposed a Common Effluent
Treatment Plant (CETP) of capacity 5 MLD at textile park additional Amravati industrial area,
MIDC Nandgaon Peth, Amravati for which the MPCB has granted Consent on 27/02/2015.
There was a request from MIDC to allow LSI and MSI to dispose their effluent in to CETP.
However as provided under Environment (Protection) Rules, 1986, it is the Boards that
prescribes standards as per local needs and conditions. According to revised guidelines for
CETPs published by MOEF&CC, large and medium scale industries other than those
belonging to 17 categories of heavily polluting industries may join CETP after primary
treatment or as considered necessary by the concerned SPCB for the purpose of hydraulic
load & techno-economic viability of the CETP.
CEO, MIDC expressed his views in respect of Textile Park Amravati and said that other
textile parks may also be considered for such types of CETPs. He was also of the opinion
that irrespective of discharge the primary treatment should be made compulsory for large
scale industries.
After due deliberations, the Board resolved that suitable limits to large and medium scale
industries be prescribed other than those belonging to the 17 categories of heavily polluting
industries at proposed Textile Park, Additional Amravati Industrial Area, MIDC Nandgaon
Peth, Dist. Amravati and recommend the same for concurrence of CPCB. The same
principal shall be used for all such textile CETPs.
Proposal for ground water Pollution assessment at Akolner, Dist. Ahmednagar in
compliance of Hon’ble NGT Judgment in (NGT Application NO. 42/2014-wz) dtd.
10th November, 2014
Member Secretary of the Board briefed about the incidence of ground water pollution at
Akolner, Dist. Ahmednagar. The item was placed before the Board for necessary guidance
and approval for expenditure to be incurred for assessment of ground water pollution. The
Board considered the proposal for remediation of contamination at Akolner.
The proposal to assess the ground water contamination and remediation of the

6
contamination at Akolner Village has been received from National Institute of Hydrology,
Roorkee, Uttarakhand with an expenditure of Rs. 48.0 Lakhs (excluding service tax). The
expenditure of the said proposal has to be borne by the M/s. IOCL & M/s. BPCL, Akolner
village, Tal Nagar, Dist. Ahmednagar as per the judgment dated 10th November, 2014
(Application No. 42/2014-WZ). In the meantime to ensure expeditious initiation of the study
by NIH-Roorkee, MPCB will release payment from Board's funds. Further, MPCB will write to
Dist. Collector, Ahmednagar to direct both the Industries to deposit the amount of Rs. 48.00
Lakh plus taxes towards the expenditure, to be incurred for study, to District Collector which
in turn can be reimbursed to MPCB.
Installation of CAAQMS in CEPI area of Navi Mumbai
Hon’ble National Green Tribunal (Western Zone) Pune directed MPCB to install the
Continuous Ambient Air Quality Monitoring Station (CAAQMS) in the CEPI area of Navi
Mumbai which will monitor all the parameters prescribed in the Ambient Air Quality
Standards 2009. To comply with the directions of Hon’ble NGT (National Green Tribunal), a
proposal was placed before the Board for capital expenditure of Rs. 1.5 Crs and quarterly
expenditure of Rs. 6 Lakhs (approx.) for operation and maintenance of this station.
The Board accorded its approval for the same and directed Board office to follow E-
tendering process for procurement. The Board authorized Chairmen/Member Secretary for
further action. The expenditure in this regard will be made from Cess Funds.
Setting up of wind augmentation and air purifying unit on air pollution control
system for traffic junction and congested road in Mumbai
To create favorable Micro Meteorology and to purify air which would reduce the air Pollutant
level at traffic junctions in Mumbai, an Air Purifying unit has been developed by NEERI along
with environmental experts. A proposal to install such devices at five traffic junctions in
Mumbai was received from NEERI. While going through the proposal the Additional Chief
Secretary, Home (Transport) pointed out that as there is no traffic junction proposed in the
Western side of the city, it is suggested to include one suitable junction from Western suburb
also. He also Stated that the Board should be proactive and prepare an action plan to
address air pollution. He was of the opinion of proactive action for monitoring through
agencies (such as WIAA). He suggested the Board to prepare action plan and budget for
the year 2016-2017 and place it before the Board.
Additional Chief Secretary (Environment) pointed out to submit the report on performance of
the Research Chair-professor.

7
Scheme of auto-renewal of Consents based on self-certification for Orange &
Green Category industries
With the increase in number of industries in the State and also the requirement of the
industries for amendment in products and expansion, the work load of Consent Management
has increased significantly. However the limited manpower for the grant of Consent leads
delays at various levels. Further the strategy for effective implementation of environmental
regulations includes enforcement and compliance aspects which are to be handled
simultaneously. Therefore the Board had introduced the concept of “Auto-Renewal of
Applications for Consent” without any substantial change in the earlier valid Consent to
Operate in order to expedite grant of Consent and reduce unnecessary burden of Consent
granting Authority in processing such applications for renewal of Consents. The Board
appreciated the work done in this regard and resolved to implement the scheme of Auto
Renewal of Consents based on self-certification for Orange and Green category of
industries.
Simplified Consent Application for Green Category Industry
The Board has implemented combined application form for Red/Orange/Green categories of
industries. However most of the information like hazardous waste, hazardous chemical, and
requirement of E.C. etc. are not related to Green category of industry. While processing the
application for Green category on the IMIS, it takes longer time as most of the non-relevant
information has “Green” category of industry. A draft simplified consent application form for
Green category of industry was placed before the Board for perusal & approval as a
Government of India initiative under ease of doing business.
After due deliberations, the Board approved the simplified Consent application from for
Green Category of industry, to be used for obtaining Consent to Establish /Operate/Renewal
subject to approval of GoM. As far as combined Consent under Water Act and Air Act and
HW Rules is concerned the Board directed the Board Office to submit necessary proposal to
Government of Maharashtra and its onward submission to MoEF&CC, Government of India.
Implementation of “Randomized Risk Based Inspection & Sampling” Module
The Board has taken review of earlier norms being followed for visit, inspection and
sampling. In order to bring more authenticity in reporting and sampling, a module has been
developed through IMIS application, generating the randomized list of industries for
inspection and sampling which appears in the Field Officer’s log-in-browsers. The Board
approved the ‘Randomized Risk Based Inspection & sampling’ IMIS module.

8
Amendment to the Enforcement Policy
Hon’ble National Green Tribunal, Western Zone Bench, Pune vide its judgment dated
16/05/2014 in the matter of M/s. Vinesh & M/s. Kalwal v/s State of Maharashtra & Ors.
Bearing Application NO. 30/2013 directed the MPCB to frame the Enforcement Policy to
integrate various aspects including inspection, monitoring, standards, compliances,
directions, remedial measures and filing of complaints before various Courts as per the
provisions of the Environment (Protection) Act, 1986 & other Environmental Laws, based on
culpability, environmental damages, severity of pollution, repeated violations etc.
Therefore, it is necessary to formulate an enforcement Policy duly integrated with various
aspects including inspection, monitoring standards, compliance of consent conditions &
various directions issued by the Board and remedial measures to be undertaken in case of
causing serious pollution, giving rise to serious complaints about environmental damages.
The policy frame work for initiating legal action has already been decided, wherein, the time
limit to adopt improvement measures duly supported by the bank guarantee for various
compliance have been spelt out.
Since enforcement mechanism is subject to improvement on the basis of execution of
enforcement policy, in due course of time, the Board will make necessary improvement on
the basis of its own experience, amendments in the various Environmental Laws and after
perusal of various order passed by the Hon’ble National Green Tribunal, High Court of
Judicatures and Hon’ble Supreme Court of India.
The Board has gone through the amendment in the draft Enforcement Policy and directed
the Board Office to place the same on the website of the Board for information of public at
large. The said policy should also be vetted through reputed institutions like NEERI, IIT,
Powai. The Board authorized Member Secretary of the Board to engage the services of
reputed institution in this regard.

9
4.0 COMMITTEES CONSTITUTED BY THE BOARD
With a view to have smooth functioning of the Board, as provided under section 9 of the
Water (Prevention and Control of Pollution) Act 1974 and section 11 of the Air (Prevention
and Control of Pollution Act 1981; the Board has constituted various committees for efficient
and effective implementation of the Acts and Rules. During the year 2015-16, the following
Committees were in existence.
4.1 Consent Appraisal Committee (CAC) During the reporting year, Consent Appraisal Committee is comprised of following members:
1. Chairman, MPC Board, Mumbai. Chairman
2. Secretary, Home (Transport) Dept., Mumbai Member
3. Technical Advisor, MIDC, Mumbai Member
4. Member Secretary, MPCB, Mumbai Member Secretary
5 Scientist & Head, NEERI, Mumbai Special Invitee
Terms of Reference
The CAC considers the applications for consents/ authorizations under Water (P &CP) Act,
1974, Air (P & CP) Act, 1981 and Hazardous Wastes (M & H) Rules, 1989 as under;
'RED' Category : Projects with capital investment above Rs.75Crores
'ORANGE' Category : Projects with capital investment above Rs.750Crores
'GREEN' Category : All Projects beyond Rs.2000Crores/ All Municipal
Corporations.
There were 16 Meetings of Consent Appraisal Committee held during the year 2015 -16
wherein 1217 CAC applications were discussed & granted 983 no. of cases.
4.2 Appellate Committee
The Water (Prevention & Control of Pollution) Cess Act 1977 was enacted by the Parliament
on December 7, 1977. The main object of the Act is to levy and collection of Cess on water
consumed by persons carrying on certain industries and by local authorities and to augment
the resources of Central Pollution Control Board and State Pollution Control Boards.
The Act provides for constitution of Appellate Authority comprising of Chairman (Chairman of
the Board) and two members to be nominated by the Chairman from amongst the Board
Members. The Appellate Authority is empowered to entertain appeal against the order of
assessment of order imposing penalty. The Appellants are required to prefer an appeal
within 30 days.

10
Accordingly, Appellate Authority has been reconstituted vide order No.E-319/2006 dated
8/12/2006 to hear an appeals. 59 Appeals were pending before the Appellate Authority since
1992. Out of 59 appeals, the Appellate Authority has disposed off 55 Appeals & remaining 4
appeals are pending for final hearing. During the year no fresh appeal has been filed. The
Appellate Committee constituted is comprised of following members:
1. Chairman Maharashtra Pollution Control Board Chairman
2. Chief Executive Officer Maharashtra Industrial Development Corporation, Andheri (E) Mumbai 400093
Member
3. Member-Secretary (Technical) Maharashtra Jeevan Pradhikaran, Nariman Point Mumbai 400021
Member
4.3 Consent Committee (CC) The Consent Committee comprises of following members;
1. Member Secretary, Maharashtra Pollution Control Board
Chairman
2. Water Pollution Abatement Engineer, Maharashtra Pollution Control Board
Member
3. Air Pollution Abatement Engineer, Maharashtra Pollution Control Board
Member
4. Assistant Secretary (Technical), Maharashtra Pollution Control Board
Member
5. Shri. R. G. Pethe, Retired WPAE Maharashtra Pollution Control Board
Member
Terms of Reference
The Consent Committee considers the applications for consent/ authorization under water (P
& CP) Act. 1974, Air (P & CP) Act, 1981 and Hazardous Wastes (M&H) Rules, 1989 as
under;
‘RED’ Category : Projects with capital investment above Rs.25Crores and up to Rs.75
Crores
‘ORANGE’ Category : Projects with capital investment above Rs.250Crores and upto
Rs.750Crores
‘Green’ Category : Projects with capital investment above Rs.1000Crores and upto
Rs.2000Crores
'Infrastructure Project’ : Project with capital investment above Rs.25Crores and upto
Rs.350Crores
There were 26 meetings of Consent Committee held during the year 2015-16 and total 1261
applications were discussed and 996 were disposed off. Now, consent committee is
following the same strategy used in Consent Appraisal Committee for achieving ZERO
pendency and compliance of consent condition.

11
5.0 WATER & AIR QUALITY MONITORING NETWORK AND PRESENT STATUS OF
ENVIRONMENT
After independence, there has been rapid urbanization leading to issues related to economic
growth and various environmental concerns associated with uncontrolled industrialization.
The Government of Maharashtra in exercise of the powers conferred under section 4 of the
Water Act, constituted the Board to resolve the environmental issues and implement the
environmental Rules & regulations within the State effectively.
According to the above notifications, during the year under report, the Board comprised of a
part-time Chairman; four officials representing the interest of the State Government; two
officials representing those companies and corporations owned and controlled by the State
Government. In addition, four members representing the interests of local bodies, and one
member to represent the interests of industries, trade, fisheries, etc., are to be nominated by
the State Government. Board's common goal is shaping better Maharashtra through sharing
of their expertise and views on various issues such as Environment, Awareness & Training
in the State. Board is controlled by full time Member Secretary to execute the decision taken
by the Board. The State Pollution Control Board and the State Environment Department
have been combining their efforts to maximize the protection of the environment and to
control pollution in all sectors. Although details of Board functions are laid down in the Acts,
priority areas are: advising the State Government on matters relating to pollution,
administering pollution control in the industrial sector and municipal bodies, monitoring of
ambient air and water quality in the State, taking necessary steps to improve air and water
quality and creating awareness about the ill-effects of pollution.
Maharashtra is a State in the western region of India and is India's second-most populous
State and third-largest State by area spread over 307,713 km2. It is one of the largest,
wealthiest & most developed States in India by all major economic indicators and also the
most industrialized State in India. The State has a long tradition of highly powerful planning
bodies at district and local levels. Local self-governance institutions in rural areas include
34 Zilla Parishads, 355 Taluka Panchayat Samitis and 27,993 Gram Panchayats. Urban
areas in the State are governed by 27 Municipal Corporations, 222 Municipal Councils,
four Nagar Panchayats and seven Cantonment Boards.
Being the biggest State and having various stipulated environmental norms with various
implementing authorities; it is very difficult to analyze the overall compliance of Maharashtra.
Looking at the vast spread in number of region and self-governance, collaborative data
collection, review of data, analysis and interpretation of whole State data in a single report is
12
necessary for the decision making authority. It is important and basic need to analyze
environmental data of entire State every year in order to understand the actual status of all
regions in terms of enforcement and compliance of various stipulated environmental norms
laid down.
MPCB being apex environmental regulatory agency; believes in its duty which is mandatory
as per chapter VI, Section 39 of Water (P&C), 1974 to submit this report every year. In lieu
of the same this report shall give insight about the Board’s functions and performance in the
fiscal year. Also this annual report will highlight its long-term goals of protecting the
environment and human health and action taken in accordance. This report will highlight
commitment and groundwork of the Board for a cleaner environment by working with
stakeholders and navigating them towards cleaner technology and better compliance using
many initiatives and rewarding schemes and engaging citizens through education and
awareness thus underlining the motto that environmental responsibility is everyone’s, not
just the Board’s or the Government.
MPCB has its Regional Offices located at 12 different places around the State as shown in
Figure 5.1. Details of organizational chart & staff strength of MPCB as well as information of
Regional & Sub-Regional offices is attached as Annexure 1A, 1B, 2 & 3 respectively. This
report has been compiled based on data received from each field office in terms of present
status of environmental aspects.
Figure 5.1 MPCB Field Offices
Brief information about each of this region is explained in Figure 5.2 in terms of its
geographical location, administrative working & jurisdictions and other important
environmental concerns.

13
Figure 5.2 Brief Information about each Region in the State
Raigad
Area- 7,512 sq. km
Population- 26 Lakhs
Regions-
RaigadI,Raigad II
and Mahad
Kalyan
Nagpur
Mumbai
Pune
Chandrapur
Aurangabad
Nashik Amravati
Thane
Navi
Mumbai
Raig
ad
Kolhapur Raigad
Area- 7152 sq. km
Population- 26 Lakhs
Sub regions- . Raigad I, Raigad II and Mahad
Panvel Municipal Corporation & 10 Municipal Councils
4 rivers Patalganga, Kundlika, Amba &Savitri
Aurangabad
Area- 25,687 sq. km
Population- 16 Lakhs
Sub regions- Aurangabad, Latur, Nanded and Parbhani
8 districts of Marathwada region
Major rivers are Godavari,Sukna, Manjra, Asna, Manar and Lendi, Dudhana, Bindusara
Pune
Area- 11,536.2 sq. km
Population- 62 Lakhs
Sub regions- Pune I,PuneII,Pimpri Chinchwad, Satara and Solapur
4 Municipal Corporation
Nagpur
Area- 3933.6 sq. km
Population- 25 Lakhs
Sub regions- Nagpur I, Nagpur II and Bhandara
Nagpur Nagpur and 22 municipal councils
Kolhapur
Area- 8,695.93 sq. km
Population- 27 Lakhs
Sub regions- Kolhapur, Ratnagiri, Sangli and Chiplun
2 Municipal corporations& 24 Municipal councils
Panchanga & Krishna are the prime rivers
Kalyan
Area- 287.2 sq. km
Population- 19 Lakhs
Sub regions- Kalyan I,II,III and Bhiwandi
1 Municipal Corporation & 2 Municipal Councils
One of the biggest MIDCs, i.e Kalyan Dombivali.
Navi Mumbai
Area- 344 sq. km
Population- 14 Lakhs
Sub regions- Navi Mumbai I,II and Taloja
a planned township of Mumbai off the west coast
Navi Mumbai Municipal CorporationUran Municipal Council
Mumbai
Area- 603.4 sq. km
Population- 12.4 Million
Sub regions- Mumbai I, Mumbai II, Mumbai III and IV
The capital city of Maharashtra
Divided into Mumbai city & Mumbai Suburban district.
Bounded by the Arabian Sea to the west.
Thane
Area- 147 sq. km
Population- 41 Lakhs
Sub regions- Thane I, Thane II, Tarapur I and Tarapur II
3 Municipal corporation & 3 municipal councils
Ecological sensitive areas of Dahanu Taluka and Chemical Zone Tarapur MIDC
Nashik
Area- 25871 sq. km
Population- 52 Lakhs
Sub regions- Nahsik ,Dhule, Jalgaon, Latur, Ahmednagar
5Municipal Corporations
India‟s second largest river Godavari rises near Nashik.
Chandrapur
Area- 10,690 sq. km
Population- 3.5 Lakhs
Sub regions- Nagpur I,NagpurII and Bhandara
Chandrapur Municipal CorporationLargest thermal power plant „Chandrapur Super Thermal Power
Amravati
Area- 15,187 sq. km
Population- 6.5 Lakhs
Regions- Amravati I, Amravati II and Akola
Amaravati Municipal Corporation
Situated at right bank of the river Krishna
Thane
Raig
ad
Kolhapur

14
Examples of rapidly depleting assets include depleted groundwater, collapsing fisheries,
CO2 accumulation in the atmosphere, and deforestation. It is a demand of time that we
understand our basic requirements, dependency on resources and sustainability on the life
support systems that would be the determinant of our very existence. This integrity takes us
to the concept of “Sustainable Development” This year, an attempt is made to evaluate the
entire State as a whole; based on few indicators that were quantified through standards
adopted from various literature surveys. However, taking the concept much further this
report also attempts to formulate a framework and micro-scale analysis of each region to
evaluate environment quality in terms of certain indicators again parameterized with the local
and regional standards available.
In order to assess the environment quality of each of these regions it is necessary to carry
out monitoring of each environmental sector. Environment Monitoring is a process to
measure pollutants available in Air, Water, Soil etc. and various steps taken to reduce
pollution after analysis of data received from monitoring. There are various monitoring
programs set by different authorities under which these monitoring processes have been
carried out. Details of these programs under which MPCB has carried out monitoring is
represented in further sections of the report along with its data analysis & further prediction
of environmental status for each region.
5.1. Monitoring Network & Region-wise Air Quality in Maharashtra Planning for prevention, control or abatement of pollution of streams, wells and air in the
State, to secure the execution of such plans and to classify the waters of the State; these are
some of the functions of the State Board as Air Pollution & Water Pollution has severe risk
for the human life as well all Animal & Plant life. It is necessary to observe the status of both
air & water quality under some specific and dedicated system and hence monitoring stations
have been set up for observation of pollution extent in river water, seawater and in ambient
air.
Ambient air quality monitoring network is designed to get spatial and temporal variation of
ambient air concentrations for a wide range of pollutants that are considered relevant for
evolving a strategic management plan. Monitoring locations are selected to represent
different land use categories like kerbside, residential, industrial, and commercial and so on,
to capture air quality levels under different activity profiles. To have a continuous vigilance of
air quality in different parts of the State, MPCB has installed various AAQMS (Ambient Air
Quality Monitoring Stations) in various regions. The following section provides an overview
of the status of AAQM (Ambient Air Quality Monitoring) in year 2015-16.

15
AAQMS are added periodically to expand the network of monitoring stations. However due
to operating challenges like maintenance issues, shortage of manpower and change in
location, some monitoring stations are closed temporarily and hence data may be
unavailable for a particular station for that period of time. In 2015-16 there were 71 active
AAQMS, 62 under NAMP (National Ambient Monitoring Program), 4 under SAMP (State
Ambient Monitoring Program) and 5 under CAAQMS (Continuous Ambient Air Quality
Monitoring). Parameters like SO2 (Sulphur dioxide), NO2 (Oxides of Nitrogen) and RSPM
(Respirable Suspended Particulate Matter) are monitored by AAQMS. Along with these
parameters CO (Carbon Monoxide), Ozone and Benzene are also monitored by CAAQMS
sites at Pune, Bandra and Solapur.
Given that Maharashtra has very prominent industrial zones and is one of the highly
populated States in the country, air quality monitoring becomes essential at these locations.
However, owing to the population growth and expansion of the cities the residential areas
have now grown so large that they are now located in very close vicinity of the industrial
belts. Some examples of the same are the residential areas in Navi Mumbai, Dombivali,
Ambernath, where the residential zones are very close to the industrial areas. Hence, in a
given region there is a mixture of various types of monitoring stations representing various
type of areas. MPCB-RO (Regional Office) wise tally of AAQMS operating in the year 2015-
16 is presented in Table 5.1.
Table 5.1 MPCB RO Wise Tally of Active CAAQMS (2015-16)
MPCB RO Commercial Industrial Residential Rural and
other areas Total
Amravati 1 2 2 1 6
Aurangabad 1 3 6 1 11
Chandrapur - 3 3 - 6
Kalyan 2 2 - 5 9
Kolhapur - 2 4 2 8
Mumbai - - 2 - 2
Nagpur - 1 2 1 4
Nashik - 2 5 - 7
Navi Mumbai - 3 2 1 6
Pune - 1 6 1 8
Raigad - - 1 - 1
Thane - 1 1 1 3
Grand Total 4 20 33 13 71
SO2 (Sulphur Dioxide), NOX (Nitrogen Oxides) and RSPM (Respirable Suspended
Particulate Matter) are regularly and consistently monitored across all the monitoring sites in
Maharashtra under NAMP, SAMP and also at the CAAQMS. SPM (Suspended Particulate
Matter) are bigger than coarse particles, they settle down fast and do not reach the
respiratory tract and therefore they have less adverse effect on health. As a result the
16
standard for SPM has not been set as per revised NAAQMS (2009). Although some
monitoring stations do record the concentrations of SPM, this has not been considered for
the statistical compilation.
MPCB published the data recorded by all the monitoring sites in Maharashtra on its website.
It also presents an interactive way to select the time series data for a particular monitoring
station. The data sets recorded at the monitoring station for year 2015-16 have been
compiled in this report. A pollutant wise overview for the air quality recorded at the areas
representing residential, industrial, commercial, rural & other areas and sensitive monitoring
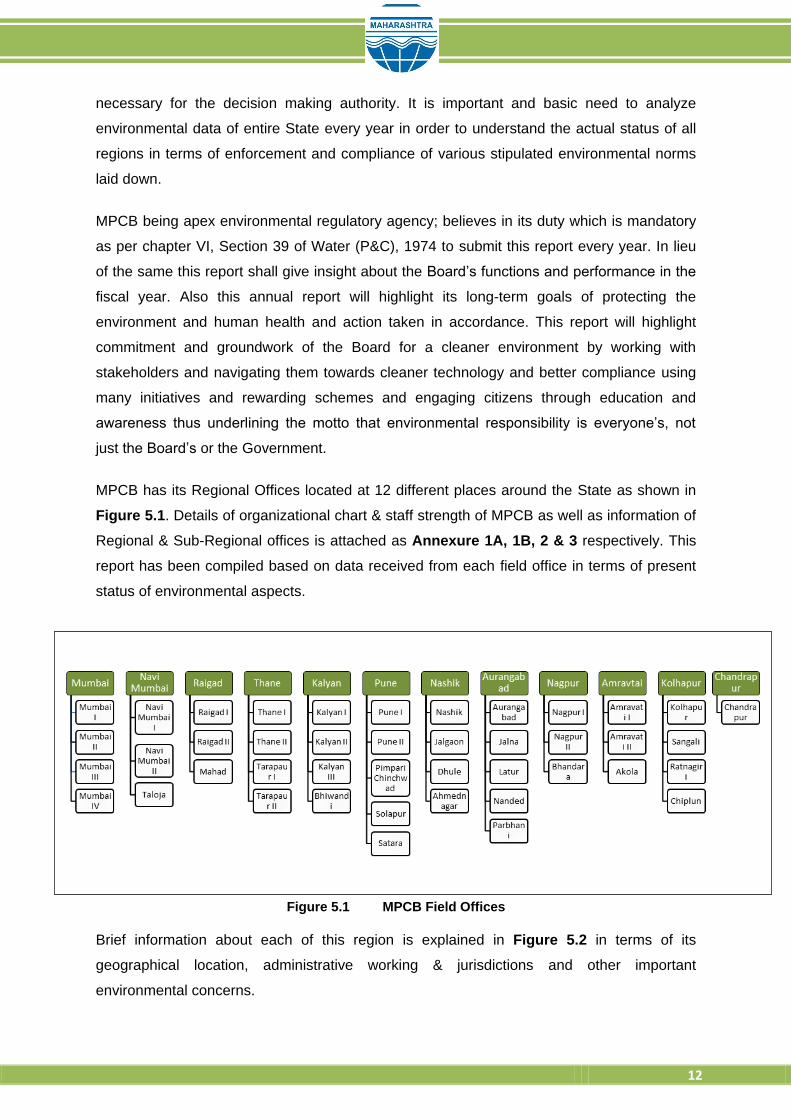
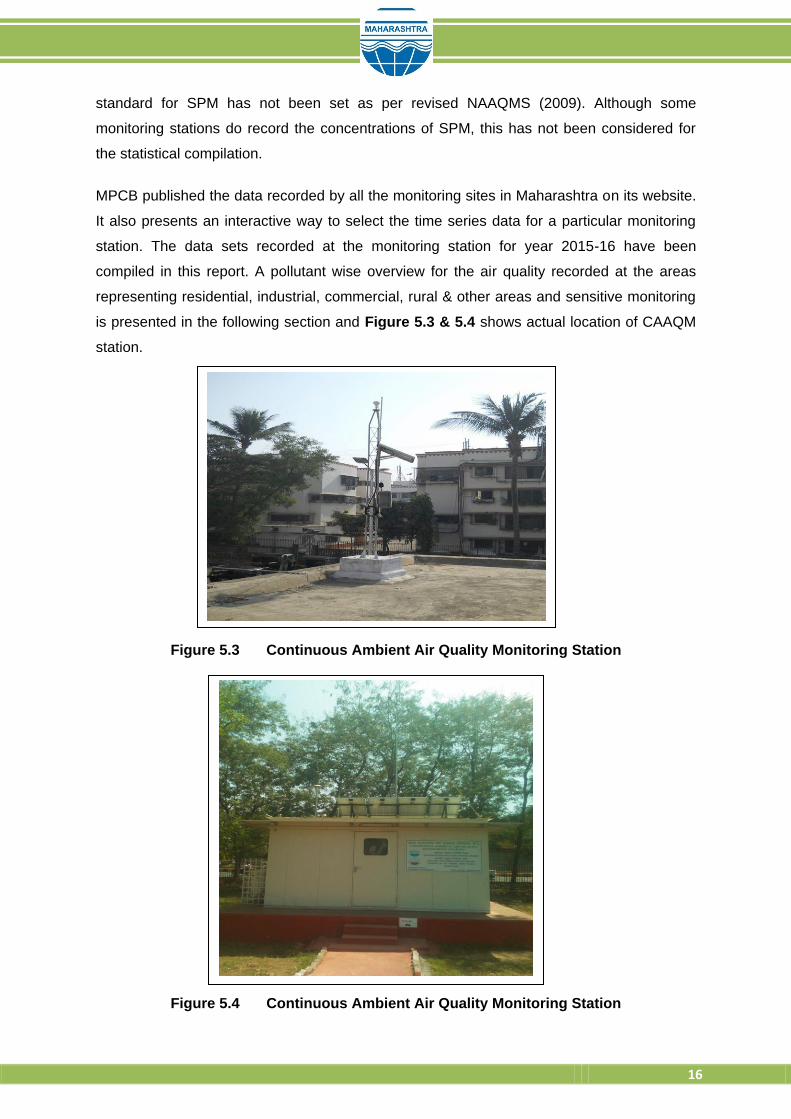
is presented in the following section and Figure 5.3 & 5.4 shows actual location of CAAQM
station.
Figure 5.3 Continuous Ambient Air Quality Monitoring Station
Figure 5.4 Continuous Ambient Air Quality Monitoring Station

17
5.1.1 Ambient Air Quality in Residential Locations of Various Cities In Maharashtra Air quality in the State is assessed through routine and specific monitoring. In order to
assess the Ambient Air Quality in respect of criteria pollutants as per National Ambient Air
Quality standards, the data is collected for year 2015-16. The data is analyzed for SO2, NOX
and Particulate Matter. The locations under different class area like industrial, residential and
commercial were monitored region-wise and the observations were made using NAAQM
standards as represented in following sections.
5.1.1.1 Mumbai Samples from 2 Ambient Air Monitoring Stations installed under Continuous Ambient Air
Quality Monitoring [CAAQM] were analyzed to assess the quality of ambient air at 2 different
locations including residential and commercial area. The annual average concentration for
the three parameters i.e. SO2, NOx & PM10 analyzed at these locations is represented in
Figure 5.5.
Figure 5.5 Annual Average Air Quality of Mumbai Region
From Figure 5.5 it is observed that annual average concentration of SO2 is within the
prescribed limit of NAAQM standards. However NOX & PM10 concentration of both the
locations viz. Bandra and Sion are not within the prescribed limits. Heavy traffic may be the
reason for higher NOX and PM10 concentration. Details of annual average statistical data
recorded throughout the year are represented in Table 5.2.

18
Table 5.2 Statistical results of Annual Average Air Quality in Mumbai Region
Parameters [µg/m3] Bandra Sion
SO2 18 14
NOX 49 81
PM10 93 143
From Table 5.2, it is found that minimum SO2 of 14µg/m3 was found at Sion, Mumbai
whereas maximum of 18µg/m3 was found at Bandra. Minimum NOX & PM10 of 49µg/m3 &
93µg/m3 respectively was found at Bandra whereas maximum NOX & PM10 respectively that
is 81µg/m3 & 143µg/m3 respectively was found at Sion, Mumbai.
5.1.1.2 Navi Mumbai There are 3 Ambient Air Monitoring Stations installed under Continuous Ambient Air Quality
Monitoring [CAAQM], 3 are installed under National Air Quality Monitoring Program [NAMP]
in this region. Samples were analyzed under CAAQMS 346 under NAMP to assess the
quality of ambient air at 6 different locations. The average annual concentrations of all the
parameters analyzed at all locations are represented in Figure 5.6.
Figure 5.6 Annual Average Air Quality of Navi Mumbai Region
From Figure 5.6 it is noticed that the average annual concentration of particulate matter is
exceeding the limits except at 1 location i.e. Airoli & SO2 concentration is well within the
prescribed standard at all locations whereas NOX is within the limits only at one location i.e
Airoli. Heavy traffic near sampling station might be the reason for higher concentration of

19
pollutants. A detail of annual average statistical data recorded throughout the year is
represented in Table 5.3.
Table 5.3 Statistical results of Annual Average Air Quality In Navi Mumbai Region
Parameters [µg/m3]
Rabale Nerul-DY
Patil Mahape, MPCB-Nirmal Bhavan
Airoli Khargar-
CIDCO Nodol Office
Taloja-MIDC
Building
SO2 21 17 20 26 17 21
NOX 48 41 43 39 41 47
PM10 131 136 85 36 116 148
From Table 5.3, it is observed that minimum SO2 of 17µg/m3 and minimum NOX of 39µg/m3
was found at Nerul-DY Patil and Khargar-CIDCO Nodol Office in Navi Mumbai region
whereas maximum SO2 concentration of 26µg/m3 was found at Airoli and that of NOX is
48µg/m3 was found at Rabale. The minimum PM10 concentration was found as 36µg/m3 at
Airoli and the maximum concentration of 148µg/m3 at Taloja - MIDC Building which might be
due to the roadside traffic near sampling station.
5.1.1.3 Raigad In this region ambient air quality is analyzed under National Air Quality Monitoring Program
[NAMP] and the sampling station is installed near Panvel water supply plant. The average
annual concentration of parameters observed throughout the year at this location is
presented in Table 5.4 & it is observed from the table that NOX and PM10 concentration is
exceeding the limit of 40 and 60ug/m3 respectively.
Table 5.4 Statistical results of Annual Average Air Quality in Raigad Region
Parameters [µg/m3] Panvel Water Supply Plant
SO2 18
NOX 43
PM10 137
5.1.1.4 Thane There are 3 Ambient Air Monitoring Stations installed under National Air Quality Monitoring
Program [NAMP] & ambient air quality is monitored at 3 different locations in Thane City.
The results of assessment are represented in Figure 5.7.
Co
ncen
tration
in µ
g/m
3

20
Figure 5.7 Annual Average Air Quality of Thane Region
Figure 5.7 represents that SO2 concentration at all locations is within the prescribed limits
whereas the NOX and PM10 concentration at all the locations viz. Kopri, Naupada and
Balkum/ Glaxo are above the standards of 40ug/m3 & 60ug/m3 respectively. The higher
concentrations of PM10 and NOX are due to the presence of large amount of industries in the
vicinity. A detail of annual average statistical data recorded at these stations is represented
in Table 5.5.
Table 5.5 Statistical results of Annual Average Air Quality in Thane Region
Parameters [µg/m3] Kopri Naupada Balkum/Glaxo
SO2 27 28 24
NOX 62 63 58
PM10 136 102 132
From Table 5.5, it is found that minimum SO2 & NOX that is 24µg/m3 & 58µg/m3 which was
found at Balkum/ Glaxo whereas maximum SO2 & NOX that is 28µg/m3 & 63µg/m3 found at
Naupada. Minimum PM10 of 102µg/m3 found at Naupada whereas maximum PM10 of
136µg/m3 found at Kopri.
5.1.1.5 Kalyan There are 4 Ambient Air Monitoring Stations installed under National Air Quality Monitoring
Program [NAMP], 1 is installed under State Air Quality Monitoring Program [SAMP] and 8
stations are installed under National Air Quality Monitoring Program [NAMP]. In this region
total sample analyzed were at 9 different locations & average annual concentration observed
is as represented in Figure 5.8.

21
Figure 5.8 Annual Average Air Quality of Kalyan Region
It is represented from the Figure 5.8 that only SO2 concentration is within the limit at all
locations whereas particulate matter and NOX is beyond the limit at all location. Heavy traffic
near sampling locations might be the reason for increased concentration of PM10 & NOx.
Details of average annual concentration of sampling are statistically represented in Table
5.6.
Table 5.6 Statistical results of Annual Average Air Quality in Kalyan Region
Parameters
[µg/m3]
Ambernath
Badlapur-
BIWA
I.G.M Hospit
al
Permatai hall
Dombivali
MIDC Dombiv
ali
MPCB Office
St. CHM Col
PowaiChowk
SO2 22 23 34 34 23 21 32 22 25
NOX 58 61 43 44 58 58 40 59 67
PM10 111 113 73 72 112 110 71 109 126
From Table 5.6 it is observed that, minimum 21µg/m3 of SO2 was found at MIDC Office
Dombivali in Kalyan region whereas maximum SO2 of 34µg/m3 was found at I.G.M Hospital
and Dombivali. Minimum NOX & PM10 that is 40µg/m3 & 71µg/m3 respectively was found at
MPCB RO Kalyan Office in Kalyan whereas maximum NOX & PM10 that is 67µg/m3 &
126µg/m3 respectively was found at Powai Chowk which might be because of heavy traffic
conditions near sampling location.
5.1.1.6 Pune
Pune City has always been appreciated as a “Pensioner's Paradise”. Its salubrious climate
and clean air leads to decrease in illness rate which is good but this rate is seemingly
deteriorating with time. Air pollution has reached to such an extent that, this metropolis is
choking on its own vehicular exhaust. Looking at the continuous increase in air pollution,

22
there are 3, 4 & 1 Ambient Air Quality Monitoring Stations installed under CAAQM, NAMP &
SAMP respectively. Samples have been analyzed to assess the air quality in entire region
for all the areas i.e. residential, commercial & industrial. The annual average concentration
of all parameters is represented in Figure 5.9.
Figure 5.9 Annual Average Air Quality of Pune Region
It is observed from Figure 5.9 that in this region annual average concentration of PM10 is
higher than the prescribed limit at all the locations & concentration of NOX is beyond the limit
at 6 locations viz. Bhosari, Pimpri - Chinchwad-BOB building, Saat Rasta-Chithale Clinic, Nal
Stop, Karve road-CAAQMS, Solapur and Swargate. Levels of SO2 are well within the limit at
every location. Details of annual average statistical data recorded at these sampling
locations are represented in Table 5.7.
Table 5.7 Statistical results of Annual Average Air Quality in Pune Region
Parameters [µg/m
3]
Bhosari
Nal Stop
Swargat,
Pune
Pimpri-Chinchwad-
BOB Building
Karve Road-
CAAQMS
WIT Camp
us
Saat Rasta-Chithale
Clinic
Solapur
SO2 31 21 21 27 25 13 13 13
NOX 50 64 66 52 57 35 37 49
PM10 97 88 138 101 106 76 78 100
From Table 5.7 it is found that, minimum SO2 of 13µg/m3 was found at WIT Campus, Saat
Rasta- Chithale Clinic and Solapur whereas maximum SO2 that is 31µg/m3 was found at
Bhosari in Pune. Minimum NOX of 35µg/m3 was found at WIT Campus in Pune whereas
maximum NOX of 66µg/m3 was found at Swargate having the biggest bus stand and depot in
Pune the drain of all the major bus services going in and out of Pune results in the increased
concentration. Minimum PM10 of 76µg/m3 was found at WIT Campus whereas maximum
PM10 that is 138µg/m3 was found at Swargate Pune.

23
5.1.1.7 Nashik There are 4 Ambient Air Monitoring Stations installed under NAMP & 3 stations are installed
under SAMP. Samples were analyzed in Nashik at 7 locations to understand the air quality
in this area. The results of the sampling are represented in Figure 5.10
Figure 5.10 Annual Average Air Quality of Nashik Region
It is observed from the above Figure 5.10 that concentration of SO2 is within the prescribed
limit whereas that of NOX is above the standards only at 1 location i.e. MIDC Jalgaon.
Presence of industries might be the reason for increased concentration in NOx. PM10 is
beyond the limit at all locations. Details of annual average statistical data are represented in
Table 5.8.
Table 5.8 Statistical results of Annual Average Air Quality in Nashik Region
Parameters [µg/m3]
Old B.J Market
Girna Water Tank
MIDC Jalgaon
RTO Colony
MIDC Satpur -
VIP
NMC Nashik
SRO Office Nashik
SO2 14 13 16 14 14 15 15
NOX 38 33 41 23 22 24 24
PM10 108 103 114 73 78 94 76
From Table 5.8 it is found that, minimum SO2 of 13µg/m3 was found at Girna Water Tank
Jalgaon in Nashik whereas maximum SO2 of 16µg/m3 was found at MIDC Jalgaon. Minimum
NOX of 22µg/m3 was found at MIDC Satpur –VIP in Nashik region whereas maximum NOX of
41µg/m3 was found at MIDC Jalgaon. Minimum PM10 of 73µg/m3 was found at RTO Colony
in Nashik whereas maximum PM10 of 114µg/m3 was found at MIDC Jalgaon at Nashik.

24
5.1.1.8 Aurangabad In the jurisdiction of Regional Office, MPCB, Aurangabad, major air polluting industries are
Steel Industries, Re-rolling mills, Stone Crushers, Thermal Power Plant, etc. The main
contributors of environmental pollution are the parameters like SPM/TPM, SO2 and NOX.
Most of the industries have provided air pollution control systems with adequate height of
chimney. The other sources of Air pollution are vehicular traffic, burning of agro waste pre
and post harvesting, burning of M.S.W. in open space, construction activities, etc. Looking at
the source and extent of pollution level, 6 Continuous Air Quality Monitoring Stations are
installed in Aurangabad, Nanded, Jalna & Latur under the State Air Quality Monitoring
Program [SAMP] & 4 Air Quality Monitoring Stations are installed under Monitoring of Indian
National Aquatic Resources System [MINARS]. The samples were taken at 10 locations
from industrial, commercial & residential areas & analyzed to assess the air quality in the
region. The results are represented in Figure 5.11.
A committee has been formed which constitutes the officials from IIT, NEERI and MPCB for
studying the pollution control facilities in steel industries of Jalna Area.
Figure 5.11 Annual Average Air Quality of Aurangabad Region
From Figure 5.11 it is represented that SO2 concentration in entire region is within the limit.
However PM10 is exceeding the limit at all locations in the region and NOX is exceeding only
at two locations i. e. SBES College and Industrial Area CIDCO. Details of annual average
statistical data are represented in Table 5.9.

25
Table 5.9 Statistical results of Annual Average Air Quality in Aurangabad Region
Parameters
[µg/m3]
SBES
College
Collector
Office ,Aurangabad
C.A.D.A Offic
e
Jalna- BachatBhava
n
Jalna- Krishna
dhan seeds
Ltd
MIDC Water Work
s- Latur
Shyam Nagar-
Keshewraj
Vidyalaya
GanjGolia-
Sidhheshwar Bank
Ganeshnagar
Mutha
Chowk
SO2 16 12 15 11 12 5 5 5 27 38
NOX 44 35 43 29 30 15 15 15 28 32
PM10 111 73 75 111 135 81 85 78 117 173
From the Table 5.9 it is found that, minimum SO2 of 5µg/m3 was found at MIDC Water
Works- Latur ,Shyam Nagar – Keshewraj Vidyalaya and Gunj Golai at Latur in Aurangabad
region whereas maximum SO2 that is 38µg/m3 was found at Mutha Chowk. The maximum
concentration of SO2 is due to the industries in vicinity. Minimum NOX that is 15µg/m3 was
found at MIDC Water Works- Latur, Keshavraj Vidyalaya, Latur and Ganj Golia-Sidhheshwar
Bank in Aurangabad whereas maximum NOX that is 44µg/m3 was found at SBES College.
Minimum PM10 of 73µg/m3 was found at Collector Office, Aurangabad in Aurangabad region
whereas maximum PM10 of 173µg/m3 was found at Mutha Chowk.
5.1.1.9 Nagpur
There are 4 Ambient Air Monitoring Stations installed under National Air Quality Monitoring
Program [NAMP] in this city. Samples were analyzed to assess the air quality of the region
at 4 locations. Result of the analyses is represented in Figure 5.12.
Figure 5.12 Annual Average Air Quality of Nagpur Region

26
It is depicted from Figure 5.12 that concentrations of gases are well within the limit in entire
region; however the concentration of particulate matter is within the prescribed limit at only
one location i.e. Civil lines Nagpur. It is observed that the particulate matter concentration is
exceeding at certain locations for few samples; making the average quality beyond the limits.
Details of annual average statistical data is represented in Table 5.10.
Table 5.10 Statistical results of Annual Average Air Quality in Nagpur Region
Parameters [µg/m3]
IOE North Ambazari road
MIDC Office, Hingna road
Govt. Polytechnic Col, Sadar
Civil lines Nagpur
SO2 10 10 10 9
NOX 31 32 33 21
PM10 101 110 91 54
From the Table 5.10 it is found that, minimum SO2, NOX & PM10 that is 9µg/m3, 21µg/m3 &
54µg/m3 respectively which was found at Civil lines Nagpur whereas maximum SO2,, that is
10µg/m3 , was found at IOE North Ambazari road, MIDC Office, Hingna road and Govt.
Polytechnic Col, Sadar. Maximum NOX that is 33µg/m3 which was found at Govt. Polytechnic
Col, Sadar & maximum PM10 of 110µg/m3 was found at MIDC Office, Hingna road.
5.1.1.10 Amravati In this region, total 6 ambient air quality monitoring stations have been installed under
National Air Quality Monitoring Program [NAMP].The samples were taken at 6 locations from
industrial, commercial & residential areas & analyzed to assess the air quality in the region.
The air quality analyses are represented in Figure 5.13.
Figure 5.13 Annual Average Air Quality of Amaravti Region

27
It is depicted from the Figure5.13 that concentrations of SO2 and NOX were within the
prescribed limit of NAAQM whereas that of PM10 was not within the prescribed limits. Heavy
traffic might be the reason for increased concentration in PM10. Details of annual average
statistical data are represented in Table 5.11.
Table 5.11 Statistical results of Annual Average Air Quality in Amravati Region
Parameters [µg/m3]
LRT Commerce
College
MIDC Water
Works -Akola
Akola-College of
Engg & Technology
Raj Kamal Chowk
Govt. College of
Eng.
God hadiwala Private Limited
SO2 6.9 7 6.75 7 8.09 8
NOX 7.41 7 12.08 12 9 9
PM10 115.08 115 105.5 106 128.08 139
From Table 5.11, minimum SO2 that is 6.75µg/m3 which was found at Akola College
whereas maximum SO2 of 8.09µg/m3 was found at Govt. College of Engineering. Minimum
NOX that is 7µg/m3 was found at MIDC Water Works -Akola whereas maximum NOX of
12.08µg/m3 was found at Akola-College of Engineering and Technology. Minimum PM10 that
is 105.5µg/m3 was found at Akola-College of Engineering and Technology whereas
maximum PM10 that is 139µg/m3 was found at Godhadiwala Private Limited.
5.1.1.11 Kolhapur In this region, samples were taken at 8 different locations from industrial, commercial &
residential areas & analyzed to assess the air quality in the region.
Figure 5.14 Annual Average Air Quality of Kolhapur Region
From Figure 5.14 it is predicted that concentration of SO2 is well within the limits at all the
locations but NOX is not within the standards prescribed standard except at 4 locations viz.

28
Chiplun-MIDC Chalkewadi, Chiplun- Water Treatment, Shivaji University campus and
Terrace of SRO-Sangli, Udyog Bhavan. PM10 concentrations are exceeding just beyond the
limit at all locations. Details of annual average statistical data are represented in Table 5.12.
Table 5.12 Statistical results of Annual Average Air Quality in Kolhapur Region
Parameters
[µg/m3]
Chiplun-MIDC
Chalkewadi
Chiplun-Water Treatm
ent
Shivaji Universit
y Campus
Ruikar
Trust
Mahadwar
Road
Terrace of SRO-
Sangli,Udyog Bhavan
Sangli-Miraj
Primary Municipal
School
Krishna
Valley school
SO2 11.5 11.5 13 25 21 10 11 11
NOX 11.5 11 23 52 40 38 44 37
PM10 170.5 173 63 120 106 82 77 92
From the Table 5.12, minimum SO2 of 10µg/m3 was found at Terrace of SRO-Sangli, Udyog
Bhavan in Kolhapur whereas maximum SO2 & NOX, that is 25µg/m3 & 52µg/m3 respectively,
was found at Ruikar Trust. The main reason of high concentration can be heavy traffic and
smaller roads resulting into congestion. Minimum NOX of 11µg/m3 was found at Chiplun-
Water Treatment in Kolhapur. Minimum PM10 of 63µg/m3 was found at Shivaji University
Campus in Kolhapur Region whereas maximum PM10 that is 173µg/m3 was found Chiplun-
Water Treatment due to heavy traffic coming from the main highway.
5.1.1.12 Chandrapur
The pilot project of ETS (Emission Trading Scheme) for industries is introduced in
Chandrapur Region in collaboration with CPCB, MPCB & J-Pal. At present 68 nos. of stacks
of 21 industries have been connected with ETS Server.
Area under this office is rich with major minerals like coal, dolomite, limestone etc. and thus
industries based on these minerals are established in this area and are coalmines, cement,
sponge iron, coal watery & Thermal power plant. These industries are mainly air polluting
industry and having sources from their process units. Apart from this there are other sources
of air pollution i.e. coal transportation, coal depots, domestic coal burning, vehicular
transportation etc. There are 3 Ambient Air Monitoring Stations installed under National Air
Quality Monitoring Program [NAMP] and another 3 are installed under State Air Quality
Monitoring Program [SAMP].The samples were taken at 6 locations from industrial,
commercial & residential areas & analyzed to assess the air quality in the region. The results
are represented in Figure 5.15.

29
.
Figure 5.15 Annual Average Air Quality of Chandrapur Region
From Figure 5.15, it is predicted that concentration of gases is within the prescribed limits,
however the concentration of PM10 is exceeding the limits at all the locations except 1 i.e.
Tadali- MIDC. Heavy traffic and presence of industries might be the reason for higher PM10
concentration. A detail of annual average statistical data is represented in Table 5.13.
Table 5.13 Statistical results Of Annual Average Air Quality In Chandrapur Region
Parameters [µg/m3]
Ghuggus Chandrapur-
MIDC Chandrapur-SRO MPCB
Tadali MIDC
Ballarshah Rajura
SO2 4 7 4 4 4 4
NOX 17 26 20 20 28 17
PM10 180 75 70 58 123 127
From Table 5.13, it is observed that minimum SO2 of 4µg/m3 was found at all the sampling
stations in Chandrapur region except at Chandrapur – MIDC whereas maximum SO2 that is
7µg/m3 was found at Chandrapur - MIDC. The major reasons behind such higher SO2
concentration are the mining Industries in MIDC area. Minimum NOX of 17µg/m3 was found
at Ghuggus and Rajura in Chandrapur region whereas maximum NOX of 28µg/m3 was found
at Ballarshah. Minimum PM10 of 58µg/m3 was found at Tadali MIDC in Chandrapur region
whereas maximum PM10 of 180µg/m3 was found at Ghuggus.
From above observations it is analyzed that at almost every region the quality of air is
exceeding the limits in terms of particulate matter while the gases’ concentration are within
the limit.

30
5.1.2 Conclusion All the AAQMS representing residential areas were well below the annual (50µg/m3) as well
as daily (80µg/m3) standards. All the 13 AAQMS representing rural and other areas in
Maharashtra recorded the annual SO2 well under the annual standards (50µg/m3).Air quality
in the commercial areas of Maharashtra is clean for SO2 pollution and all the AAQMS
recorded annual average well below the annual as well as daily standards.
The Industrial area of CIDCO in Aurangabad region recorded the highest annual NOX
concentration of 81µg/m3 which is twice the standard. The Amravati, Kolhapur, Chandrapur
were observed to be less polluted as compared to other region. The AAQMS at Sion,
Mumbai region recorded the highest annual NOX concentrations at 81µg/m3 which is more
than twice the standard value. The residential areas of Amravati, Aurangabad, Chandrapur,
Kolhapur were observed to be less polluted than other regions in terms of NOX pollution. All
AAQMS of Kalyan region recorded annual NOX in range of 43-67µg/m3 exceeding the
annual concentration of NOX. The rural regions of Amravati, Aurangabad and Nagpur were
observed to be less polluted in terms of NOX as compared to other regions.
All the AAQMS sites representing industrial areas violated the annual and daily standards
prescribed by CPCB (60µg/m3). The highest annual average concentration of RSPM is
recorded at Industrial Area CIDCO, Aurangabad. None of the industrial sites were observed
to meet the RSPM standard limits or meet the prescribed standards by CPCB. It could be
observed in Figure 5.12 that except for Civil Lines (54µg/m3), Nagpur; all the stations have
exceeded the annual average concentration for RSPM which is 60µg/m3. The highest
concentrations (180µg/m3) are recorded at Ghuggus, Chandrapur which are almost 3 times
the annual standard. The reason for the same could be due to the presence of the
industries. Almost all AAQMS, under rural and other areas exceeded the annual average
standard (60µg/m3), except for Airoli station from Navi Mumbai which has recorded the
lowest concentration of annual RSPM as 36µg/m3 lying within the limit set by CPCB
(60µg/m3). The AAQMS site at Raj Kamal Chowk, Amravati recorded the highest
concentration of RSPM which is almost double (135µg/m3) the standard followed by Powai
chowk, Kalyan (126µg/m3) and Ruikar trust, Kolhapur (120µg/m3).
5.1.3 Ambient Noise Quality at Various Locations In State Noise pollution is defined as unwanted sound, a potential hazard to health and
communication dumped into the environment with regard to the adverse effect it may have
on unwilling ears. Sound, which pleases the listeners, is music to the ears and that which
causes pain and annoyance is noise. It is caused mainly due to vehicles, industrial activities

31
and other human activities. Traffic jams, bad roads, festivals and other types of celebration
increases the ambient noise levels on that particular day. Noise pollution causes decrease in
the work efficiency of man, lack of concentration, fatigue, increased blood pressure &
temporary deafness which may finally lead to permanent deafness. Various Rules have
been put forth to control noise pollution such as Noise Pollution (Regulation and Control)
Rule 2000 under Environment Protection Act 1996, The Noise Pollution (Regulation and
Control) Rules, 2000 has been authorized in order to curb the growing menace of Noise
Pollution.
The unit of Noise measurement is decibel, one-tenth of a bell and denotes as dB, however
the monitoring unit is considered as dB(A) Leq. which denotes the time weighted average ‘A’
of the level of sound in decibels on scale A and it has been found related to human
hearing. Thus, in dB(A) Leq, denotes the frequency weighting in the measurement of noise
and corresponds to frequency response characteristics of the human ear. The unit of
frequency is hertz (Hz) and is defined as the number of compressions and rarefactions per
unit time (sec.). Human hearing is sensitive to frequencies in the range of about 20-20,000
Hz (the audio frequency range). Site of an area is selected such that it meets the land use
pattern as prescribed in the standard e.g. Industrial, Commercial, and Residential & Silence
Zone. According to the Noise standards of CPCB, the levels should be 65dB and 55dB in
commercial areas during the day and night time respectively, while in residential area it
should be 55dB and 45dB for the same as presented in Table 5.14.
Table 5.14 Noise Standards by CPCB
Area Code Category of Area / Zone Limits in dB(A) Leq*
Day time Night time
(A) Industrial area 75 70
(B) Commercial area 65 55
(C) Residential area 55 45
(D) Silence zone 50 40
Noise pollution is an objectionable parameter and thereby would involve individual
perception. Usually Noise regulations have been much in discussions in the recent past and
most of the areas across India, do not qualify under the Noise Standards though being
dependent upon individual perception; MPCB has been monitoring noise periodically & also
during the festivals expecting higher variations and impacts on the environment & people.
The monitoring is carried out in prescribed Day time (06:00 am to 10:00 pm) and Night time
(10:00 pm to 06:00 am).The exercise has to be carried out for 6 to 8 hrs. in the said time
frame of day & night. Region-wise details of noise pollution monitoring and analysis are
discussed in following sections.

32
5.1.3.1 Mumbai Total 40 observations were taken during this year out of which 20 were during the day time
and 20 during the night time. The Figure 5.16 summarizes the average day time and night
time noise levels at 10 locations of 2 days.
Figure 5.16 Summary of Noise Levels observed in Mumbai
On 1st day of monitoring highest noise level was observed at Shivaji Park, Dadar with 83.8
dB(A) and Charkop, Kandivali was found with high noise level on the second day of noise
monitoring
5.1.3.2 Thane Industries, vehicles, commercial places i.e. Markets, Cinema Halls, Bus Stand, Railway
Station, Festivals are the major sources of Noise Pollution in the city. Total 20 observations
were taken during this year out of which 10 were during the day time and 10 during the night
time. The Figure 5.17 summarizes the average day time and night time noise levels at 5
locations of 2 days.
From Figure 5.17, the highest noise level during day time on the first day was observed at
Tembi Naka with 75.2 dB(A) and Main road Gaodevi Mandir was found to have high noise
levels during night time with 72.6 dB(A) & on 2nd day highest noise level was found at
Gaodevi Mandir with 72.6 dB(A) during the day time & 60.9 dB(A) during the night time
respectively.

33
Figure 5.17 Summary of Noise levels observed in Thane
5.1.3.3 Kalyan Total 12 observations i.e. 6 during the day time and 6 during the night time were taken
during this year. Figure 5.18 summarizes the average day time and night time noise levels
at 3 locations of 2 days
Figure 5.18 Summary of Noise levels observed in Kalyan
Katemanivali was found to have the highest noise level during the 3 days monitoring of
Diwali festival. The highest noise level during day time was observed on the first day of
monitoring with 82.2 dB(A) and during night time with 77.5 dB(A) was observed on the
second day of noise monitoring.

34
5.1.3.4 Pune Total 20 observations i.e. 10 during the day time and 10 during the night time were taken
during this year. The Figure 5.19 summarizes the average day time and night time noise
levels at 5 locations of 2 days
From Figure 5.19, the highest noise level during day time both on first and second day of
monitoring was observed at Nucleus mall with 73.8 dB(A) and 67.3 dB(A) respectively. The
highest noise level during night time both on first and second day of monitoring was
observed at Nucleus mall with 54.1 dB(A) and 53.3 dB(A) respectively
Figure 5.19 Summary of Noise levels observed in Pune
5.1.3.5 Nashik Total 20 observations i.e. 10 during the day time and 10 during the night time were taken
during this year. The Figure 5.20 summarizes the average day time and night time noise
levels at 5 locations of 2 days
Figure 5.20 Summary of Noise levels observed in Nashik
In Nashik the highest noise level was observed on the first day during the noise monitoring
at CBS both during day time and night time with 81.9 dB(A) and 81.7 dB(A) respectively.

35
5.1.3.6 Aurangabad Total 12 observations i.e. 6 during the day time and 6 during the night time were taken
during this year. The Figure 5.21 summarizes the average day time and night time noise
levels at 3 locations of 2 days.
Figure 5.21 Summary of Noise levels observed in Aurangabad
Gulmandi was found to have the highest noise level both during day time and night time with
76.4 dB(A) and 65.5 dB(A) respectively which was observed on the first day of noise
monitoring.
5.1.3.7 Nagpur Total 20 observations i.e. 10 during the day time and 10 during the night time were taken
during this year. The Figure 5.22 summarizes the average day time and night time noise
levels at 5 locations of 2 days.
Figure 5.22 Summary of Noise levels observed in Nagpur

36
In Nagpur, out of 5 locations monitored in 3 days, Sadar was found to have the highest noise
level on the first day of monitoring both during day time and night time with 77 dB(A) and
82.6 dB(A) respectively.
5.1.3.8 Amravati Total 12 observations i.e. 6 during the day time and 6 during the night time were taken
during this year. The Figure 5.23 summarizes the average day time and night time noise
levels at 3 locations of 2 days.
Figure 5.23 Summary of Noise levels observed in Amaravati
The highest noise level both during day time and night time was observed on the first day of
noise monitoring at Rajkamal Chowk with 75.4 dB(A) and 60.8 dB(A) respectively.
5.1.3.9 Kolhapur Total 20 observations i.e. 10 during the day time and 10 during the night time were taken
during this year. The Figure 5.24 summarizes the average day time and night time noise
levels at 5 locations of 2 days.
The highest noise level during day time of 86.5 dB(A) was observed at Papachi Tikti and
during night time was observed at Bindu Chowk with 85.0 dB(A).

37
Figure 5.24 Summary of Noise levels observed in Kolhapur
5.1.3.10 Chandrapur Total 12 observations i.e. 6 during the day time and 6 during the night time were taken
during this year. The Figure 5.25 summarizes the average day time and night time noise
levels at 3 locations of 2 days.
Figure 5.25 Summary of Noise levels observed in Chandrapur
The highest noise level both during day time and night time was observed on the first day of
monitoring at Jatpura Gate with 85 dB(A) and at Warora Naka 77.9 dB(A) respectively.

38
5.1.4 Conclusion Noise pollution is not only causing environmental damage but it also has a negative impact
on human health as it can cause conditions such as aggression, hypertension, high stress
levels, hearing loss and sleep disturbances. The noise measured during the Maharashtra
Control Board noise monitoring project, the noise levels where exceeding the limits of
provided in Noise Pollution (R & C) Rules, 2000 amendment dated 21st April 2009. Road
vehicles including trucks, buses, tractors, SUVs and even motorcycles and most cars are
major reason for the increase in noise range. Noise pollution can take a severe toll on
human health in the long run. These effects will not become apparent immediately, but there
could be repercussions later on. The effects include deterioration of mental health, ability to
hear things clearly, dilation in the pupils of the eyes, improper working of the heart etc. The
government should make efforts to control noise pollution by replacing rickety buses with
comfortable coasters, planting trees all over the city, etc. The world without excessive noise
pollution coming from human sources would be a much quieter and much more beautiful
place to live in.
5.2 Water Quality in Maharashtra Water, an important factor essential for the health of human beings, if contaminated leads to
serious health problems. The major sources of water include oceans, lakes, rivers and
ground water. The most important rivers of Maharashtra State are Godavari, Krishna, Bhima
Tapi and Wardha-Wainganga River respectively. If pollutants are discharged directly or
indirectly to these water bodies without effective treatment or without removal of the harmful
compounds, it could create a serious threat to human health & environment.
Some of the basic causes of water pollution include pathogens, chemicals, elevated
temperature, discoloration, plant matter, manmade chemicals, detergents, food processing
waste, insecticides, herbicides, volatile organic compounds, chlorinated solvents, acid rain
drainage, fertilizers, heavy metal from motor vehicles, soil erosion and sedimentation in
water bodies etc. The idol immersion during Ganpati festival is also one of the sources of
river pollution.
5.2.1 Water Quality Monitoring Network in Maharashtra Located on the west coast of India, Maharashtra is the second State in India in terms of
population (11.24crores) and the third largest in terms of area (30.7Mha). The total
geographical area of the State is divided into 5 basins, namely Godavari, Tapi, Narmada,
Krishna and West flowing rivers of the Konkan region.

39
In Maharashtra, 55% of the dependable yield is received from four basins (Krishna,
Godavari, Tapi and Narmada) whereas remaining 45% of State's water resources are from
west flowing rivers. As per Ministry of Drinking Water and Sanitation, the State had 557
stationary drinking water quality testing laboratories as on January 31, 2014; about one-
fourth of the total such stationary testing laboratories available in the entire country.
In Maharashtra, water quality is monitored by various agencies namely Hydrology Project
(SW), Groundwater Surveys & Development Agency (GSDA), CPCB, Maharashtra Pollution
Control Board (MPCB), Central Water Commission (CWC), Central Ground Water Board
(CGWB) as per provisions made by Water Quality Assessment Authority constituted under
sub sections (1) and (3) of section 3 of the Environment (Protection) Act, 1986 (Act No.29 of
1986).
The water quality testing under the GEMS and MINARS program under NWMP in
Maharashtra is monitored by MPCB (State nodal agency). Monitoring is carried out at 250
station as presented in Table 5.15, (156 are on rivers, 34 on sea/creek, 10 on nallahs and
50 groundwater), the highest across all States. MPCB has infrastructure to monitor 44
parameters including field observations, general parameters, core parameters and trace
metals. The water samples are monitored with a monthly and six monthly frequencies for
surface and groundwater stations respectively.
Table 5.15 Basin And Water Body wise Tally of WQMS in Maharashtra
Water body Basin
Tapi Godavari Krishna West Flowing Rivers Grand Total
Rivers 20 48 53 35 156
Creek/Sea 0 0 0 34 34
Nalla 0 1 1 8 10
Bore well 1 8 10 5 24
Dug well 1 12 5 6 24
Hand pump 0 1 0 0 1
Tube well 1 0 0 0 1
Grand Total 23 70 69 88 250
The comprehensive data sets recorded by WQMS across the State were organized basin
wise for evaluation of both surface and groundwater quality. The water monitoring stations
were further arranged from upstream to downstream in order to study basin wise trend of
water quality. The classification of the various rivers, their basins and sub basins considered
in this report is presented in Table 5.16. The Water quality index is determined by
calculating the basic parameters like pH, BOD (mg/l), DO (mg/l to %) and FC (MPN/100ml).
The WQI has been calculated separately for surface water and groundwater water samples

40
using the formula provided by National Sanitation Foundation (NSF) and the relative weights
modified by CPCB. To present the data in a spatial format GIS (Geographical Information
System) maps were generated.
The following section presents the illustrations of the parameters pH, DO, BOD and FC
recorded across the 229 surface water quality monitoring stations of MPCB in a lucid format.
Further, basin wise water quality index is presented in this section for the basins of Krishna,
Godvari, Tapi and West flowing rivers.
The classification of the rivers considered under basins and sub basins in the report is given
in Table 5.16.
Table 5.16 Classifications of Rivers Considered Under Basins & Sub Basins
Basin Sub Basins Name of rivers No. of WQM
stations
Tapi
Tapi Upper Tapi, Purna, Pedhi 8
Tapi Middle Tapi, Girna, Rangavali, Amravati, Bori, Burai, Gomai, Hiwara, Kan, Mor, Panzara, Titur, Waghur, Waghur
15
Godavari 1
Godavari Upper Godavari, Chikhalinalla, Darna 23
Godavari Middle Godavari, Bindusara 11
Manjra Godavari, Manjra 2
Godavari 2
Wardha Wardha, Penganga 17
Weinganga Kolar, Kanhan, Wainganga 16
Pranhita and others
Wainganga 1
Krishna
Bhima Upper Bhima, Nira, Chandrabhaga, Mutha, Ghod, Indrayani, Pawana, Sina, Vel, Nalla, MulaMutha
43
Krishna Upper Krishna, Panchganga, Koyna, Urmodi, Venna
26
West Flowing
Kalu, Ulhas, Patalganga, Bhatsa, Vashishti, Mithi, Kundalika, Savitri, Amba, Kundalik, Muchkundi, Surya, Tansa, Vaitarna, Rabodinalla, ColourChemnalla, Sandoz nalla, BPT Navapur, Tarapur MIDC nalla, Pimpal-Panerinalla
54
Saline 34
Total 250
5.2.2 Water Quality Index A water quality index provides a single number (like a grade) that expresses overall water
quality of a certain water sample (location and time specific) for several water quality
parameters. The objective of developing an index is to simplify the complex water quality
parametric data into comprehensive information for easy understanding. A water index

41
based on important parameters provides a simple indicator of water quality and a general
idea on the possible problems with the water in the region.
In 1970, the National Sanitation Foundation, USA developed the Water Quality Index
(NSFWQI), a standardized method for comparing the water quality of various water bodies.
NSFWQI is one of the most respected and utilized water quality indexes in the United
States. Nine water quality parameters selected for calculating the index include Dissolved
Oxygen, Fecal Coliform, pH, Biochemical Oxygen Demand (BOD) (5-day), Temperature
change (from 1 mile upstream), Total phosphate, Nitrate, Turbidity & Total Solids.
5.2.2.1 WQI for surface water Given the parameters monitored in India under the NWMP and to maintain the uniformity
while comparing the WQI across the nation, the NSF WQI has been modified and relative
weights been assigned by CPCB. The modified weights as per CPCB are given in Table
5.17 and the equations used to determine the sub index values are given Table 5.18. Upon
determining the Water Quality Index, the water quality is described for easy understanding
and interpretation. The description used in the report for classifying and the describing the
water quality is presented in Table 5.19.
Table 5.17 Modified Weights for Computation of WQI Based on DO, FC, pH And
BOD
Parameters Original Weights from NSF
WQI Modified Weights by CPCB
Dissolved Oxygen (DO) 0.17 0.31
Fecal Coliform (FC) 0.15 0.28
pH 0.12 0.22
BOD 0.1 0.19
Total 0.54 1
Table 5.18 Sub Index Equation Used to Calculate NSF WQI for DO, FC, pH And BOD
Water Quality Parameters (units)
Range Applicable Equation
Dissolved Oxygen (DO)(% Saturation)
0-40 0.18 + 0.66 X % Saturation DO
40-100 (-13.55) + 1.17 X % Saturation DO
100-140 163.34 - 0.62 X % Saturation DO
Fecal Coliform (FC) (counts/100 ml)
1 - 103 97.2 - 26.6 X log FC
103 - 105 42.33 - 7.75 X log FC
>105 2
pH
02 - 05 16.1 + 7.35 X (pH)
05 - 7.3 (-142.67) + 33.5 X (pH)
7.3 - 10 316.96 - 29.85 X (pH)
10 – 12 96.17 - 8.0 X (pH)
<2, >12 0

42
BOD (mg/l)
0 – 10 96.67 - 7 X (BOD)
10 – 30 38.9 - 1.23 X (BOD
>30 2
Table 5.19 Water Quality Classification and Best Designated Use
WQI Value
Water Quality Class by
CPCB Class by
MPCB Remarks
Color code used in this
report
63 – 100 Good Excellent A A -I Non Polluted
50 – 63 Good water B Not Prescribed Non Polluted
38 - 50 Poor Water C A –II Polluted
38 & less Very Poor water D, E A – III, A- IV Heavily Polluted
5.2.2.2 WQI for Groundwater MPCB monitors ground water quality for parameters like pH, total hardness, Calcium,
Magnesium, Chloride, total dissolved solids, Fluoride, Manganese, Nitrate, Sulphates and so
on once in six months. Based on the stringency of the parameters and its relative importance
in the overall quality of water for drinking purposes each parameter has been assigned
specific weightage. The relative weights of the same have been determined and presented
in Table 5.20 for the parameters monitored and recorded by MPCB for the water samples
monitored in the year 2015-16.These weights indicate the relative harmfulness when present
in water. The maximum weight assigned is 5 and minimum is 1.
Table 5.20 Relative Weights of Each Parameter
Chemical Parameters
Indian Standards for Drinking Water Quality
22
Weight (Wi)
Acceptable Limit
Permissible Limits
Weight Relative Weight
Weight w/o Iron,
Manganese & Bicarbonate
Relative Weight w/o
Iron, Manganese & Bicarbonate
pH 6.5-8.5 No
relaxation 4 0.09756 4 0.13333
Total Hardness
300 600 2 0.04878 2 0.06667
Calcium 75 200 2 0.04878 2 0.06667
Magnesium 30 No
relaxation 2 0.04878 2 0.06667
Bicarbonate 244 732 3 0.07317 - -
Chloride 250 1000 3 0.07317 3 0.10000
Total Dissolved
Solids 500 2000 4 0.09756 4 0.13333
Fluoride 1 1.5 4 0.09756 4 0.13333
Manganese 0.1 0.3 4 0.09756 - -
Nitrate 45 No
relaxation 5 0.12195 5 0.16667

43
Sulphate 200 400 4 0.09756 4 0.13333
Total 41 1 30 1
5.2.3 Analysis of surface Water Quality with Statistical details Based on the absolute value of the index determined, water quality is classified as presented
below in Table 5.21.
Table 5.21 Groundwater Classification Based On the Water Quality Index
WQI Value Water Quality Color code used in this report
<50 Excellent
50-100 Good water
100-200 Poor Water
200-300 Very Poor water
>300 Water Unsuitable for drinking
Surface water is available in the form of rivers, lakes, ponds, canals and so on. However,
rivers are the most important source of surface water. The surface water resources potential
of India, is about 1869 Billion Cubic Meters (BCM). Due to various topographical constraints
and uneven distribution over space and time, only about 690 BCM of surface water and 431
BCM of ground water can be used. It has been estimated that due to increase in population
between 2001 and 2011 in India, the per capita availability of water resources has reduced
from 1,816 cubic meter to 1,544 cubic meter. The stress on water resources is increasing
rapidly due to the pressure from urbanization and industrialization. The pollution of water
resources caused by discharge of sewage and industrial effluents in water bodies further
deteriorate quality of water.
In order to have continuous vigilance check on water quality across the State, MPCB has
installed WQMS (Water Quality Monitoring Stations) across the State. The total WQMS for
year 2015-16 are represented in the Table 5.22 water quality is monitored per month across
all the stations. The spatial presence of the stations is presented basin wise in the respective
sections.
Table 5.22 Monitoring Stations List across Different Type of Water Bodies (MPCB)
Water Quality monitoring stations
Water Bodies 2015-16
Rivers 156
Sea and Creek 34
Nalla 10
Borewell 24
Dug well 24
Hand pump 1
Tube well 1
Total 250

44
5.2.3.1 Tapi Basin In Maharashtra, the Tapi Basin could be divided into two sub-basins Tapi Upper and Tapi
Middle. There are a total of 22 surface water monitoring stations (5 on upper and 17 on
middle) in Tapi basin in Maharashtra. Figure 5.26 shows the trends in WQI along the Tapi
Basin flowing through 6 districts from the year 2007 -2016.
Figure 5.26 Trend of Annual Average WQI Across Districts of Tapi Basin Note:
This graph considers the average WQI for all the monitoring stations in that particular district and hence may
include some bias. This graph is only for an overview and monitoring station wise data may be analyzed to pin
point the most affected and polluted patches in that district.
The Intra basin performance of Tapi Basin across six districts of the State is depicted in
Figure 5.26. It is observed that among six districts, namely Akola, Amravati, Dhule, Jalgaon,
Nandurbar and Nashik, the annual average WQI of Amravati and Akola were consistently in
Bad to Medium category (i.e. WQI in range of 38-63) from year 2007-08 till 2014-15. This

45
year in 2015–16 both the districts have registered improvement in the overall water quality.
Dhule, Jalgaon, Nandurbar and Nashik belong in the Medium to Good category (i.e. WQI in
range of 50-63). But a decrease could be recorded in all these 4 stations this year which
indicates deterioration in the water quality at these stations.
The Tapi basin has 8 WQMS in Tapi Upper and 15 WQMS in Tapi Middle. From Figure
5.26, it can be noted that more 50% of the observations in Tapi Middle were recorded to be
in the dry and no data category while only 20% of the observations in Tapi Upper were
recorded as Dry, Not collected and No Data categories. This could be attributed to lack of
rainfall this year which has led to the drying of rivers. The occurrence of “Medium to Good”
and “Bad” categories of WQI is more than double in the Tapi Upper compared to Tapi
Middle. This indicates that the water quality in Tapi Upper is better compared to Tapi Middle.
5.2.3.2 Godavari Basin 1 The Godavari basin passes through six States (third largest basin in India) and drains about
10% of the total geographical area of the country. Approximately 50 percent of the
catchment area comes under the State of Maharashtra. In Maharashtra, the Godavari Basin
could be divided into six sub-basins Godavari Upper, Godavari Middle, Manjra, Wardha,
Weinganga, Indravati and Pranhita. In this report for the ease of analysis the sub-basins
have been categorized into two, Godavari 1 Basin covering Upper, middle and Manjra sub-
basin and Godavari 2 basin covering Wardha, Weinganga, Indravati and Pranhita. In basin 1
there are a total of 34 surface water monitoring stations (21 on upper, 11 on middle and 2 on
Manjra). A list of the station and the codes has been provided below. In basin 2 there are a
total of 29 surface water monitoring stations (12 on Wardha, 16 on Weinganga and 1 on
Pranhita). Figure 5.27 shows the trends in WQI along the Godavari Basin 1 flowing through
4 districts from the year 2007 -2016.
Figure 5.27 Trend of Annual Average WQI across Districts of Godavari Basin (1 Of 2)

46
It is observed that the annual average WQI across major districts of Godavari basin (1 of 2)
namely - Beed, Jalna, Latur, Nanded, Nashik, Osmanabad and Parbhani are in Good to
excellent category (63-100) except for Aurangabad. The WQI of Aurangabad was found to
decrease this year from Good to Excellent to Good to Medium category (50-63). Irrespective
of the fact that majority of the indices for districts belong in the Good to Excellent category, a
slight decrease could be observed this year which indicates a slight deterioration in the water
quality.
5.2.3.3 Godavari Basin 2 Figure 5.28 shows the trends in WQI along the Godavari Basin 2 flowing through 7 districts
from the year 2007 -2016.
Figure 5.28 Trend of Annual Average WQI Across Districts of Godavari basin (2 of 2)
Among the seven districts namely Akola, Bandara, Buldhana, Chandrapur, Nagpur, Wardha
and Yavatmal, the annual average WQI of all the districts except Akola were Medium to
Good (50-63). But this year in 2015- 16, an improvement in the water quality at Akola has
been recorded as the WQI has improved from Very Bad to Bad category.
5.2.3.4 Krishna Basin The Krishna originates as the Upper Krishna basin in the Western Ghats of Maharashtra and
Karnataka, drains the Deccan Plateau, and discharges into the Bay of Bengal. The Krishna
basin spreads across the States of Maharashtra (69,425sq.km), Karnataka (113,271sq.km)
and Andhra Pradesh (76,252sq.km) covering total area of 2,58,948sq.km which is about 8%
of total geographical area of country. The principal tributaries joining Krishna are the
Ghataprabha, the Malaprabha, the Bhima, the Tungabhadra and the Musi. Figure 5.29

47
shows the trends in WQI along the Krishna Basin flowing through 6 districts from the year
2007 -2016.
It is observed that among the 5 districts- Kolhapur, Pune, Sangli, Satara and Solapur, the
annual average WQI of Sangli and Kolhapur were Good to Excellent category (63-100).
Satara and Solapur display an increasing trend in the WQI as Satara has improved from
‘Mediun to Good’ to Good to Excellent category and Solapur has shown an increasing trend
towards the Good to Excellent category. Since the last 2 years, the WQI of Pune has also
improved from “Bad” category to “Medium to Good” category. The new station added at
Ahmednagar has shown the WQI to be in the Bad category in 2015- 16.
Figure 5.29 Trend of Annual Average WQI across Districts Of Krishna Basin
5.2.3.5 West Flowing Rivers Maharashtra has many westwards flowing rivers originating from the Western Ghats like
Damanganga, Surya, Vaitarna, Ulhas, Savitri, Kundalika, Patalganga, Vashisti, Shastri, Karli,
Terekhol and so on. These are an important source of drinking water, agricultural
applications and industrial purposes and are known to contribute about 44.54% of the yield
at 75% dependability of Maharashtra. Rivers like Vaitarna, Patalganga, Ulhas, and Balganga
and so on with tributaries such as Tansa, Bhasta and Barvi are used as sources of drinking
water. While Rivers like Ulhas, Patalganga, Panvel, Bhogeshwari and Amba & few other
tributaries like Vashishthi and Kundalika lie very close to industrial areas and are thus prone
to water pollution due to release of industrial effluents.
Figure 5.30 shows the trends in WQI along the West flowing rivers through 4 districts from
the year 2007 -2016.

48
The results showed that among four districts, namely Thane, Mumbai, Raigad and Ratnagiri,
the annual average WQI of Mumbai were consistently in Bad to Medium category (38-63)
across all the years. This year in 2015-16 WQI has also shown a decline which indicates the
deteriorating water quality in Mumbai. Raigad, Ratnagiri and Thane were in Good to
Excellent (63-100) category. Thane and Ratnagiri have shown improvement in its category
this year compared to last year (2014-15). Even though the WQI for Raigad is in Good to
Excellent category, a decreasing trend could be observed over the years.
Figure 5.30 Trend of Annual Average WQI Across Districts Of West Flowing Basin
5.2.4 Analysis of Sea and Creek Water Quality with Statistical details Ranking seventh largest in the world in terms of coastline, India has 7,517km long coastline
out of which 5,423km belongs to peninsular India and remaining 2,094km to the Andaman,
Nicobar and Lakshadweep Islands. India has 43% sandy beaches; 11%, rocky coast
including cliffs; and 46%, mudflats or marshy coast. It is estimated that nearly 250 million
people live within area of 50km from the coastline of India. This coastline supports a huge
human population, which is dependent on the rich coastal and marine resources for
economic growth.
Rapid industrialization has taken place along the coastline of India. Among the coastlines,
industrial pollution is recorded high on coast of West Bengal, Tamil Nadu, Gujarat,
Maharashtra and Andhra Pradesh. It is estimated that about 8000 industries release 390
million tonnes of effluents annually into the Indian coastal waters either directly or indirectly.

49
Disposal of Municipal solid waste also acts as source of marine pollution. Municipal waste
consists of degradable and non- degradable waste which comprises of plastic, rubber, glass,
heavy metals and so on. The discarded plastic waste leads to entanglement, suffocation and
ingestion of aquatic life. Consumption of plastic by marine animals causes disruption of the
endocrine system and reduction in reproduction rate. Heavy metals such as mercury, lead,
nickel, arsenic, and cadmium, could also accumulate in the tissues of many species in a bio
accumulation process. Recreational activities like tourism and oil spills from shipping
industries also contribute to coastal pollution.
Being a coastal State, Maharashtra is bestowed with a coast line of about 720 kms. Thane,
Mumbai, Raigad, Ratnagiri and Sindhudurg districts are all located along the coastal front in
Maharashtra. These districts are blessed with beaches, mangroves, migratory birds, corals
and a lot of unique marine biodiversity. These areas are not only stress busters for general
public but also cater of tourism sector. These patches are also significant for various
livelihood opportunities since they support occupations like fishing and salt production in the
State.
Given the fact that water pollution on the coastal front shall directly impact the marine
ecosystem and also the humans, it is of significant importance to monitor sea water quality.
MPCB has 36 monitoring stations along the sensitive and pollution prone areas of coastline
of the State. Regular monitoring is conducted at these monitoring stations. Figure 5.31
shows the trends in WQI along the Sea and Creek from the year 2007 -2016
Figure 5.31 Trend of Annual Average WQI across Districts Of Coastal Basin

50
The water quality results from test conducted in the year 2015-16 showed that among the
four coastal districts, the sea/creek water quality at Thane, Raigad and Mumbai were in ‘Bad
to Medium’ category (38-63). A decreasing trend was also being observed in the water
quality at these 3 districts. Irrespective of the sudden decrease in the average water quality
of Ratnagiri district last year, this year the water quality was in the Good to Excellent
category (63-100).
The trend in average occurrence for WQI across the WQMS was noted and it is observed
that occurrence of Medium to good category has increased across the past 9 years. The Bad
to Very Bad category has also shown a decline over the years which indicate the improving
water quality. But the category of ‘Good to Excellent’ has shown decrease this year while a
growth in ‘Medium to Good’ and ‘Bad’ has increased
5.2.5 Analysis of Ground water quality Water located beneath the earth’s surface in soil pore spaces and aquifers formed due to
formation of cracks in the rocks is termed as Groundwater. It is recharged from rain and
surface water and at times the only source for water supply in regions. Groundwater
constitutes about two thirds of the freshwater resources of the world and accounts for nearly
80 per cent of the rural and 50 per cent of the urban water needs in India. Groundwater is
intensively drawn for agricultural, irrigation and industrial purposes. The accumulation and
inadequate disposal of waste generated by the industries ultimately leads to groundwater
pollution. MPCB has 50 ground water monitoring stations which monitor water quality twice a
year for parameters like pH, Nitrate, TDS, Hardness, Fluoride, microbial content, Sulphates
and so on.
The basins of Tapi, Godavari, West Flowing rivers and Coastal have recorded a decreasing
trend in their annual average Water Quality Index (WQI) while Krishna basin showed an
increasing trend for its WQI. Station No. 186 and 187 on Nag River (Nagpur region) had the
annual average WQI in Bad to Very Bad category throughout the year. This was highly
polluted compared all the other rivers in the basin, which is a serious cause of concern and
should immediately be investigated further for the cause of pollution.
Stations on nallahs at BPT Navpur, Sandoz and Rabodi from Thane region also recorded
the WQI in Bad to Very Bad category throughout the year. This indicated pollution mostly
due to the release of waste water from the industrial area of Thane. Considering the intra
basin scenario of Krishna basin, Bhima Upper sub basin was found to be more polluted than
Krishna Upper.

51
Out of 65 water monitoring stations of groundwater, Station no. 2819 dug well in Pune
recorded the water quality in Bad to Very Bad category throughout the year. Raigad region
recorded the water quality of ground water in excellent category. The levels of Total
Hardness, pH, Fluoride and Nitrate were recorded to be high in 2015-16.The Table 5.23
gives the WQI for Ground water in Kalyan, Navi Mumbai, Raigad, Thane, Amravati,
Aurangabad, Nashik, Chandrapur, Nagpur, Kolhapur and Pune respectively whereas Table
5.24 shows the legend.
Table 5.23 WQI for Ground Water in Various Regions
Table 5.24 Legend for WQI color variations
5.3 Industrial Pollution The Ministry of Environment, Forest and Climate Change (MoEF&CC) had brought out
notifications in 1989, with the purpose of prohibition/ restriction of operations of certain
industries to protect ecologically sensitive areas. The notification introduced the concept of
categorization of industries as "Red", "Orange" and "Green" with the purpose of facilitating
decisions related to location of these industries. Subsequently, the application of this
concept was extended in other parts of the country not only for the purpose of location of
industries, but also for the purpose of Consent management and formulation of norms
related to surveillance / inspection of industries. The process of categorization thus far was
primarily based on the size of the industries and consumption of resources. The pollution

52
due to discharge of emissions & effluents and its likely impact on health was not considered
as primary criteria.
Based on the series of brain storming sessions among CPCB, SPCBs and MoEF&CC, the
following criteria on "Range of Pollution Index" for the purpose of categorization of industrial
sectors is finalized.
Industrial Sectors having Pollution Index score of 60 and above - Red category
Industrial Sectors having Pollution Index score of 41 to 59 - Orange category
Industrial Sectors having Pollution Index score of 21 to 40 - Green category Maharashtra is one of the most highly industrialized States in India. With the rise in
industrial eStates in the State, areas like Mumbai, Thane, Navi-Mumbai, Kalyan, Nashik,
Pune & Pimpri-Chinchwad have a large number of pollution prone industries are facing
chronic industrial pollution. In order to maintain safe distance between industrial units and
river to avoid discharge of effluent in to water bodies, the State has its policy which also
States that no industry will be allowed to establish along a river bank. Industries are being
encouraged to recycle and reuse the waste.
Maharashtra Pollution Control Board (MPCB) has divided the State Maharashtra into 12
regions viz Mumbai, Navi Mumbai, Raigad, Thane, Kalyan, Pune, Nashik, Aurangabad,
Nagpur, Amravati, Kolhapur and Chandrapur. The total numbers of industries in
Maharashtra are 84,075. These industries are categorized as red, green and orange and
further in each it is again divided into small, large & medium based on its pollution index. The
total number of red industries in Maharashtra is 18,737 orange are 24,052, green are
41,286.The total number of large scale industries are 5913, medium scale 2,514 and small
scale 75,648. The flow chart of the categorization as well as size of industries within
Maharashtra is given in Table 5.25 and details of regional industry statistics is attached as
Annexure 4.
Table 5.25 Categorization of Industries in Maharashtra
Maharashtra - 84075(Total No. of Industries)
Large Medium Small
Red 3415 723 14599
Orange 2327 1305 20420
Green 171 486 40629
To monitor compliance of Consent conditions, performance of ETP, ECS and other
measures, the Board officials inspect the industries regularly. There are 713 industries
identified under “17 categories of highly polluting industries” of which 93 industries are
closed, 556 industries have complied with the pollution control norms and necessary action
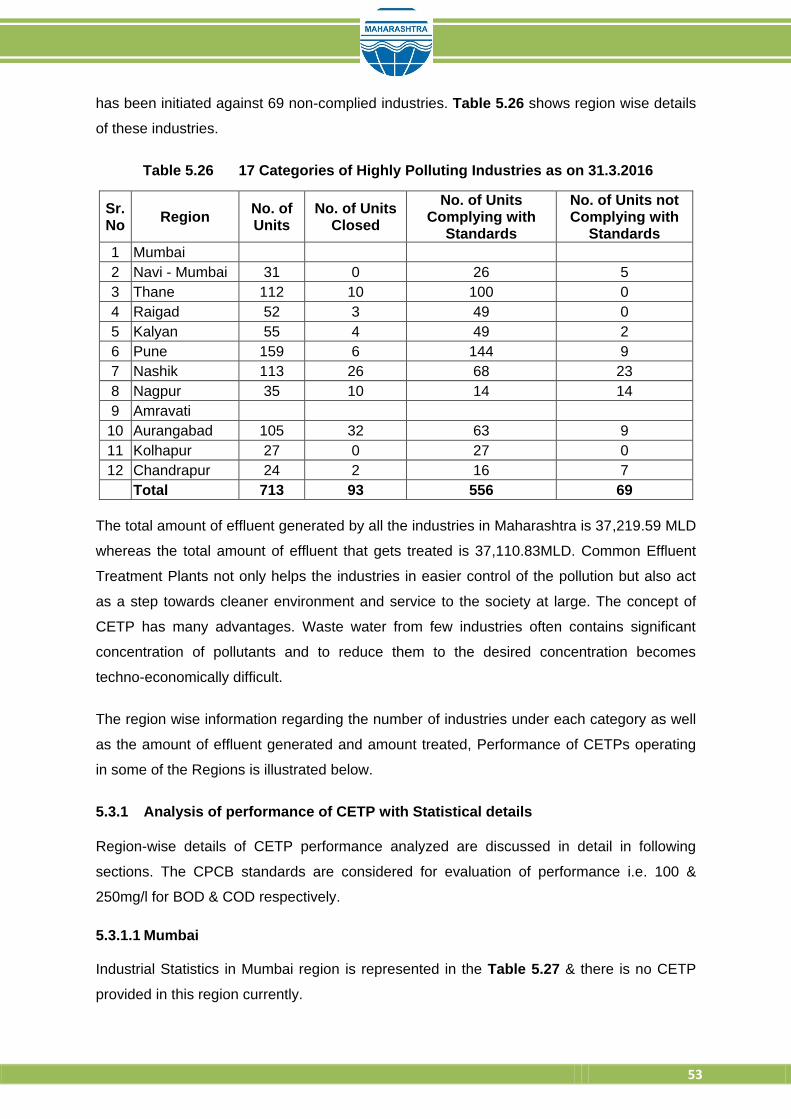
53
has been initiated against 69 non-complied industries. Table 5.26 shows region wise details
of these industries.
Table 5.26 17 Categories of Highly Polluting Industries as on 31.3.2016
The total amount of effluent generated by all the industries in Maharashtra is 37,219.59 MLD
whereas the total amount of effluent that gets treated is 37,110.83MLD. Common Effluent
Treatment Plants not only helps the industries in easier control of the pollution but also act
as a step towards cleaner environment and service to the society at large. The concept of
CETP has many advantages. Waste water from few industries often contains significant
concentration of pollutants and to reduce them to the desired concentration becomes
techno-economically difficult.
The region wise information regarding the number of industries under each category as well
as the amount of effluent generated and amount treated, Performance of CETPs operating
in some of the Regions is illustrated below.
5.3.1 Analysis of performance of CETP with Statistical details Region-wise details of CETP performance analyzed are discussed in detail in following
sections. The CPCB standards are considered for evaluation of performance i.e. 100 &
250mg/l for BOD & COD respectively.
5.3.1.1 Mumbai Industrial Statistics in Mumbai region is represented in the Table 5.27 & there is no CETP
provided in this region currently.
Sr. No
Region No. of Units
No. of Units Closed
No. of Units Complying with
Standards
No. of Units not Complying with
Standards
1 Mumbai
2 Navi - Mumbai 31 0 26 5
3 Thane 112 10 100 0
4 Raigad 52 3 49 0
5 Kalyan 55 4 49 2
6 Pune 159 6 144 9
7 Nashik 113 26 68 23
8 Nagpur 35 10 14 14
9 Amravati
10 Aurangabad 105 32 63 9
11 Kolhapur 27 0 27 0
12 Chandrapur 24 2 16 7
Total 713 93 556 69

54
Table 5.27 Categorization of Industries in Mumbai
Mumbai - 3957(Total No. of Industries)
Large Medium Small
Red 170 54 480
Orange 421 300 660
Green 0 27 1845
5.3.1.2 Navi Mumbai MIDC industrial eStates in Navi Mumbai are TTC and Taloja and few industries scattered in
Uran Taluka. Chemical, bulk drugs & intermediates, dye and dye intermediates,
pharmaceutical, pesticide, Food Industries, Petrochemical, engineering goods and textile
manufacturing industries, etc. are the types of industries present in these areas. 2 numbers
of CETPs are provided to treat the effluent generated from these industries and total amount
of effluent being treated is to the tune of 67.62 MLD. Industrial Statistics in Navi Mumbai
region is demonstrated in Table 5.28.
Table 5.28 Categorization of Industries in Navi Mumbai
Navi Mumbai – 4157 (Total No. of Industries)
Large Medium Small
Red 168 31 1809
Orange 134 178 952
Green 6 59 1540
The average annual statistical data analyzed to understand performance of CETP for
various parameters is represented in Table 5.29.
Table 5.29 Statistical Data Analysis for CETP Performance in Navi Mumbai Region
Parameters in mg/l
Inlet Outlet
BOD(Avg) COD(Avg) S.S(Avg) BOD(Avg) COD(Avg) S.S(Avg)
Taloja CETP Co Operative Society
1056 2637 483 278 686 131
Thane-Belapur Association
387 1037 176 70 230 33
It is clear from the Table 5.29 that Thane Belapur Association performed well, where more
than 82% reduction in B.O.D and 78% reduction in C.O.D. at the outlet were noticed. Also all
the parameters of treated water are within the discharge standard prescribed under EPA,
Schedule VI. Also it is observed that BOD & COD concentrations of treated water at Taloja
MIDC do not qualify the discharge standard 100 & 250mg/l.

55
5.3.1.3 Raigad Industrial Statistics in this region is demonstrated in Table 5.30. There are total 3 numbers of
CETPs provided in this region & total amount of effluent being treated in these CETPs is
32.5MLD.
Table 5.30 Categorization of Industries in Raigad
Raigad – 1447 (Total No. of Industries)
Large Medium Small
Red 148 31 383
Orange 86 31 324
Green 0 19 425
Annual average performance of these CETPs during the year is presented in Table 5.31.
Table 5.31 Statistical Data Analysis for CETP Performance in Raigad Region
Parameters in mg/l
Inlet Outlet
BOD(Avg) COD(Avg) S.S(Avg) BOD(Avg) COD(Avg) S.S(Avg)
PRIA CETP (I) Ltd
371 971 196 238 571 52
MMA-CETP Co Operative Society Ltd
339 1056 159 75 206 76
RIA CETP Co-op. Society Ltd.
912 2105 296 220 617 84
It is clear from the Table 5.31 above that MMA CETP performance is good, where more than
78% reduction in B.O.D and 80% reduction in C.O.D. at the outlet were noticed. Also all the
parameters of treated water are within the discharge standard prescribed under EPA,
Schedule VI.
5.3.1.4 Thane Mainly engineering, fabrication, plastic and various service industries like Hotels, Service
Stations, etc. are the types of industries present in this region. 1 CETP is provided to treat
the effluent generated from these industries and total amount of effluent being treated is
39.24MLD.
Most of the industries located in Corporation area have been shifted to nearby industrial
areas of MIDC. Industrial Statistics in Thane is demonstrated in Table 5.32.

56
Table 5.32 Categorization of Industries in Thane
Thane – 3186 (Total No. of Industries)
Large Medium Small
Red 190 33 950
Orange 251 24 451
Green 1 13 1273
The treatment capacity of CETP, Tarapur is exhausted due to excessive quantum of waste
water and pollution load. Now, it has been proposed to install additional CETP of 50 MLD as
expansion of existing CETP. Environment Department, Government of Maharashtra has
issued Environment Clearance for the proposed expansions vide letter dtd. 24/03/2015. The
work of additional CETP of 50 MLD is in progress and it will be made operational within
period of 18 months.
Table 5.33 Statistical Data Analysis for CETP Performance in Thane Region
Parameters in mg/l
Inlet Outlet
BOD(Avg) COD(Avg) S.S(Avg) BOD(Avg) COD(Avg) S.S(Avg)
Tarapur Environment Protection Society CETP
999 2813 479 266 802 150
Table 5.33 result shows 73% reduction in B.O.D. & 71% reduction in COD. However
concentration of BOD & COD parameter in treated water is not within the prescribed limit of
100 & 250mg/lit respectively.
5.3.1.5 Kalyan Industrial Statistics in Kalyan region are demonstrated in Table 5.34. 6 CETPs are provided
to treat the effluent generated from these industries and total amount of effluent being
treated is around 32.5MLD.
Table 5.34 Categorization of Industries in Kalyan
Kalyan – 4570 (Total No. of Industries)
Large Medium Small
Red 135 107 1769
Orange 79 57 929
Green 0 22 1472
The treated effluent is finally discharged into the Diva creek. The Addl. Ambernath CETP
was in operation since June-2012. The capacity of CETP in Addl. Ambernath MIDC is about
7.5 MLD. Performance of these CETPs during the year is presented in Table 5.35.

57
Table 5.35 Statistical Data Analysis for CETP Performance in Kalyan Region
Parameters in mg/l
Inlet Outlet
BOD(Avg) COD(Avg) S.S(Avg) BOD(Avg) COD(Avg) S.S(Avg)
ACMA - CETP-Co-operative Society Ltd
288 763 218 39 144 27
Chikhloli-Morivali Effluent Treatment
619 1701 252 44 150 27
Badlapur CETP Association
526 1394 222 92 251 80
Dombivli Better Environment System Association
685 1661 362 155 425 89
Dombivli CETP (Chemical) (Phase-II)
868 2226 300 262 737 150
Additional Ambernath CETP
1745 6406 179 380 949 138
As per Table 5.35, it is found that all CETPs except Dombivli Better Environment System
Association, Dombivli CETP (Chemical) (Phase-II) and Additional Ambernath CETP, the
BOD is within the prescribed limit of 100 & 250mg/lit respectively. The efficiency of BOD and
Cod removal is more than 80% in ACMA - CETP-Co-operative Society Ltd, Chikhloli-Morivali
Effluent Treatment and Badlapur CETP Association.
5.3.1.6 Pune This region mostly harbors multi facet forms of industries ranging from IT & Biotech parks to
complicated process & manufacturing industries. Total numbers of CETPs provided in this
region are 5 & total amount of effluent treated in these CETPs is 361.2 MLD. Industrial
Statistics in Pune region is demonstrated in Table 5.36.
Table 5.36 Categorization of Industries in Pune
Pune – 18598 (Total No. of Industries)
Large Medium Small
Red 1168 235 3558
Orange 1098 511 4587
Green 105 266 7070
CETPs performance at all these locations have been regularly monitored by comparing the
inlet and outlet parameters as presented in Table 5.37. As per the observation it is clear that

58
CETP located at Kurkumbh MIDC is performing very well with almost 96% efficiency
however the COD in not within the prescribed limit. The BOD and COD values of the rest i.e
Kurkumbh Environment Protection Co-opp. Society, Ranjangaon CETP, Hydro Air Tectonics
(PCD) and Greenfield CET Plant Pvt. Ltd are within the prescribed limits of 100mg/l and
250mg/l respectively.
Table 5.37 Statistical Data Analysis for CETP Performance in Pune Region
Parameters in mg/l
Inlet Outlet
BOD(Avg) COD(Avg) S.S(Avg) BOD(Avg) COD(Avg) S.S(Avg)
Kurkumbh Environment Protection Co-op Society
2225 6538 187 97 290 40
Ranjangaon CETP
210 638 274 60 183 68
Hydro Air Tectonics (PCD)
68 187 60 33 97 21
Greenfield CET Plant P. Ltd
164 491 109 46 130 28
5.3.1.7 Nashik
There are no CETP presently in this region however it is proposed CETP for MIDC
Ahmedabad & MIDC Satpur, Nashik. Industrial Statistics in Nashik region is demonstrated in
Table 5.38.
Table 5.38 Categorization of Industries in Nashik
Nashik – 11165 (Total No. of Industries)
Large Medium Small
Red 399 58 2036
Orange 109 55 2312
Green 44 35 6117
5.3.1.8 Aurangabad There is only 1 CETP provided of 10MLD capacity Viz. M/s. Waluj CETP Pvt. Ltd. located at
MIDC Area, Waluj. The said CETP is in operation. Earlier, CETP was receiving very less
effluent i.e. 1MLD from industries, however, due to continuous follow-up by the Board
Officers, now the CETP is receiving effluent to the tune of about 4.5MLD. M/s. Waluj CETP
Pvt. Ltd., Aurangabad has received Vasundhara Award during this year based on its
performance.
Industrial Statistics in Aurangabad region is presented in Table 5.39 and performance of
CETP is presented in Table 5.40.

59
Table 5.39 Categorization of Industries in Aurangabad
Pune – 8633 (Total No. of Industries)
Large Medium Small
Red 202 71 851
Orange 34 70 2004
Green 11 14 5376
Table 5.40 Statistical Data Analysis for CETP Performance in Aurangabad Region
Parameters in mg/l
Inlet Outlet
BOD(Avg) COD(Avg) S.S(Avg) BOD(Avg) COD(Avg) S.S(Avg)
SMS Waluj CETP Pvt Ltd
212 865 168 28 169 41
As per Table 5.40, it is observed that the CETP is performing at its maximum efficiency and
obtaining desired results as well. The efficiency of this CETP for removal is almost 87% for
BOD and 81% for COD.
5.3.1.9 Nagpur Industrial Statistics in Nagpur region is presented in Table 5.41. 1 CETP is provided in this
region to treat the effluent generated from industries & average annual performance of
CETP is presented in Table 5.42.
Table 5.41 Categorization of industries in Nagpur
Nagpur-5632 (Total No. of Industries)
Large Medium Small
Red 395 15 1253
Orange 62 21 2215
Green 3 3 1665
Table 5.42 Statistical Data Analysis for CETP Performance in Nagpur Region
Parameters in mg/l
Inlet Outlet
BOD(Avg) COD(Avg) S.S(Avg) BOD(Avg) COD(Avg) S.S(Avg)
Butibori CETP Pvt. Ltd.
264 742 142 33 99 51
It is observed from Table 5.42 that the CETP is performing at almost 87% efficiency and
achieving the desired disposal standard of 100mg/l and 250mg/l for BOD and COD
respectively.
5.3.1.10 Amravati Total amount of effluent generated in this region is 20.12MLD & there is no CETP provided
by the municipal corporation in this region. However, all the effluent generated from

60
industries is getting treated as industries have provided their own ETP units. Industrial
Statistics in Amravati region is demonstrated in Table 5.43.
Table 5.43 Categorization of Industries in Amaravati
Amravati – 6641 (Total No. of Industries)
Large Medium Small
Red 51 13 320
Orange 8 10 1920
Green 0 4 4315
5.3.1.11 Kolhapur In this region Sugar, Distillery, Agro base industry, Foundries & Engineering types of
industries are situated. MIDC Shiroli, MIDC Gokulshirgaon, Five Star MIDC Kagal-
Hatkanangale, MIDC Shinoli, MIDC Ajara and MIDC Gadhinglaj are the major industrial
areas and total amount of effluent generated is 232.49 MLD.
In the jurisdiction of Sub Region Kolhapur there are 4 Common Effluent Treatment Facility of
31.5MLD. The CETP in Miraj region is not in operation. The non-CETP individual industries
have also provided ETP and made arrangements for its disposal on their own land for
gardening/irrigation. Industries located at Gane Khadpoli & Kherdi are having Primary &
Secondary Treatment. Treated effluent is reused in the process & remaining is discharged
on land for gardening/ irrigation purpose. Industries situated at MIDC Lote are having
Primary & Secondary Treatment & some of them are having tertiary treatment. Also some
industries have achieved zero discharge. The treated effluent is disposed to CETP for
further treatment & disposal which is further disposed in to Karambavne Creek which is
notified by NIO.
Industrial Statistics in Kolhapur region is demonstrated in Table 5.44 and performance of
CETP is presented in Table 5.45.
Table 5.44 Categorization of Industries in Kolhapur
Kolhapur – 14836 (Total No. of Industries)
Large Medium Small
Red 240 75 1663
Orange 30 48 3656
Green 1 22 1901
Table 5.45 Statistical Data Analysis for CETP Performance in Kolhapur Region
Parameters in mg/l
Inlet Outlet
BOD(Avg) COD(Avg) S.S(Avg) BOD(Avg) COD(Avg) S.S(Avg)
L.K. Akiwate Ind. Co Op, EState Ltd
676 2060 191 73 201 45
Lote Parshuram
898 2939 208 151 397 117

61
Env. Co-op Societ
ITDCL (1 MLD)
407 1389 193 35 144 36
ITDCL (12 MLD)
545 1783 192 33 129 51
Kagal- C.E.T.P.
248 753 157 56 197 59
It is observed from the Table 5.45 all CETPS except Lote Parshuram, treated water quality
meets the desired discharge standards.
5.3.1.12 Chandrapur Total amount of effluent generated from industries in this region is 254.24MLD and there is
no CETP provided in this region. However industries are treating their effluent individually
within the premises thereby all the effluent generated is being treated. Many of the industries
are not located on the banks of the river except M/s. Bilt Graphic Paper Products Limited
that is located near Wardha River, Super Thermal Power Station which is located near Erai
River and WCL mines located near Wardha & Erai Rivers. Industrial Statistics in Chandrapur
region is demonstrated in Table 5.46.
Table 5.46 Categorization of Industries in Chandrapur
Chandrapur-1253 (Total No. of Industries)
Large Medium Small
Red 149 0 247
Orange 15 0 410
Green 0 2 430
5.4 Domestic Waste Water Treatment Sewage is water-carried waste, in either solution or suspension that is intended to flow away
from a community. Domestic wastewater contains both solid and dissolved pollutants
including fecal matter, paper, urine, sanitary items, food residues and a variety of other
contaminants. This wastewater may carry pathogenic organism that can transmit disease to
humans and other animals, contain organic matter that can cause odor and nuisance
problems of receiving water bodies and can lead to eco toxicity. Excessive deposition of
chemical nutrients in water bodies is called eutrophication. It is one of the numerous
problems created by sewage water pollution. Degradation of the quality of water, reduction in
the number of fish and increase in BOD, are the effects of eutrophication. The toxics
released into the rivers through sewage water are consumed by fishes and other organisms,
thus increasing the possibility of these toxics entering the food chain. Collecting and treating
wastewater has been even more beneficial to human health than the health service because

62
it will stop water-borne diseases such as cholera and typhoid. Proper collection and safe,
nuisance-free disposal of the liquid wastes of a community are legally recognized as a
necessity and it is important for a safe and clean environment.
Discharge of untreated sewage into the water bodies is single most important cause for
pollution of surface and ground water because there is a remarkable gap between
generation and treatment of domestic wastewater. Domestic sewage is responsible for about
80% of water pollution. Following are certain causes for improper handling of STP operation;
In STPs operation Sludge removal & its treatment is generally neglected
Irregular power supply and non-availability of alternate facility in most of the local
bodies
Fund shortage is an important factor in poor operation and maintenance of STPs
Deputation of unqualified or less qualified staff at site lead to poor operation of STPs
Maharashtra Pollution Control Board (MPCB) has divided the State of Maharashtra into 12
regions viz Mumbai, Navi Mumbai, Raigad, Thane, Kalyan, Pune, Nashik, Aurangabad,
Nagpur, Amravati, Kolhapur and Chandrapur. Details related to domestic waste water
treatment for each these regions is discussed in following section of the report.
5.4.1 Analysis of performance of STP with Statistical details Region wise details of STPs are presented in following section & STP performance is
analyzed based on MoEF&CC standards of 30mg/l & 30mg/l for Biological Oxygen Demand
& Suspended Solids respectively.
5.4.1.1 Mumbai Mumbai region has provided total 8 Nos. of STPs and total sewage getting treated in these
STP is 2118MLD. The annual average performance analysis of all STPs provided in Mumbai
region is represented in Table 5.47
Table 5.47 Average Annual Performances of STPs in Mumbai Region
Location & Parameters in mg/l
BOD (Avg.) COD(Avg.) O & G(Avg.) S. S. (Avg.)
Inlet Outlet Inlet Outlet Inlet Outlet Inlet Outlet
Worli STP 114 87 276 225 2 5 144 136
Colaba STP 42 59 182 161 1 5 46 38
Versova 52 36 122 76 BDL BDL 53 26
Bandra -- 35 -- 73 BDL BDL -- 24
MCGM's STP, Ghatkopar I -- 50 -- 115 -- BDL -- 45
MCGM's STP, Ghatkopar II -- 36 -- 83 -- BDL -- 30
Malad STP 88 73 184 132 4.9 2 120 75
Charkop STP 135 85 225 185 4 3 135 78

63
From Table 5.47 it is observed that all STPs are functioning at more than 50% efficiency.
However, it is observed that no STP is achieving BOD standards i.e. 30mg/l. It should be
noted that only Three STPs namely Versova, Bandra & Ghatkopar are achieving TSS
standards of 30mg/l. Other parameters i.e. COD & O&G are being achieved by all STPs.
5.4.1.2 Navi Mumbai This jurisdiction is having only one Municipal Corporation (Navi Mumbai Municipal
Corporation) and one Municipal council (Uran Municipal Council). Details of sewage
generation and its disposal of each local body is presented in following section;
a) Navi Mumbai Municipal Corporation
Navi Mumbai Municipal Corporation has provided 8 numbers of Sewage Treatment Plants
out of which total capacity of 443MLD is being operated by NMMC and remaining 1 STP of
30MLD is being operated by CIDCO. All STPs are constructed based on Cyclic Activated
Sludge process (C-Technology). STP of NMMC at Sector -2 Nerul consists of treatment in
Aerated Lagoons
b) Uran Municipal Council
No treatment facility is provided by the local body and thereby untreated sewage is being
discharged into creek through nallah. The proposal of underground drainage system & STP
is under consideration of Maharashtra Jeevan Pradhikaran.
Performance of all 8 STPs of Navi Mumbai Municipal Corporation is presented in Table 5.48.
Table 5.48 Average Annual Performance of STP of Navi Mumbai Municipal Corporation
Location & Parameters in mg/l
BOD (Avg.) COD(Avg.) O & G(Avg.) S. S. (Avg.)
Inlet Outlet Inlet Outlet Inlet Outlet Inlet Outlet
STP- Sector 12, CBD ….. 8 ….. 26 ….. BDL ….. 10
STP- Sector 50, Nerul ….. 14 ….. 42 ….. BDL ….. 11
STP- Sector 2, Nerul The effluent is diverted to STP at Sec-50, Nerul
STP- Sector 18, Vashi ….. 10 ….. 23 ….. 7.1 ….. 11
STP- Sec. 20 Sanpada ….. 19 ….. 38 ….. BDL ….. 11
STP KoperKhairane ….. 7 ….. 21 ….. BDL ….. 10
STP Airoli ….. 11 ….. 43 ….. BDL ….. 13
STP Ghansoli ….. 15 ….. 41 ….. BDL ….. 11
*Note: (…..)- sample was not collected; and same applies for all the tables
From above Table 5.48 it is observed that average concentration of all parameters is well
within the prescribed discharge standards laid down by MoEF&CC. O&G concentration in
treated water from all STPs is Below Detection Limit.

64
5.4.1.3 Thane There are total 6 Urban Local Bodies in the Jurisdiction of Thane Region, details of sewage
generation and its disposal of each local body is presented in following section;
a) Thane Municipal Corporation
Total 3 numbers of STPs are provided by Thane Municipal Corporation. TMC has proposed
to install 4 new STP’s with total capacity of 100.49MLD at Kharegaon (46.76MLD), Kolshet
(23.06MLD), Lodha (22.22MLD) and Vitava (8.45MLD).
b) Mira Bhayander Municipal Corporation
The Mira Bhayander Municipal Corporation has provided STP at 12 locations with total
capacity of 117MLD but at present only 5 number of STPs are in operations i.e. 13MLD STP
at Shanti Park,11MLD at Shanti Nagar, 17MLD at Kankia, 2MLD at Jessal Park, 1.5MLD at
Shrusti Complex. 48.5MLD of domestic Sewage is being discharged in the Creek without
any treatment.
Overall Sewage generation from all local bodies under the jurisdiction of Thane Municipal
Corporation is 548MLD [TMC - 350 + MBMC - 93 + VVCMC - 105] and out of which only
296.5MLDis being treated in 9 operational STPs having 296.5MLD capacity whereas
251.5MLD is being directly discharge in to the Creek without any treatment. Performance of
all STPs of Thane Municipal Corporation is presented in Table 5.49
Table 5.49 Average Annual Performance of STP of Thane Municipal Corporation
Location & Parameters in mg/l
BOD (Avg.) COD(Avg.) O & G(Avg.) S. S. (Avg.)
Inlet Outlet Inlet Outlet Inlet Outlet Inlet Outlet
Thane Municipal Corporation, ….. 13 ….. 37 ….. BDL ….. 20
STP at Shrushti Complex ….. 122 ….. 290 ….. 1 ….. 78
As per Table 5.49, it is observed that Thane Municipal Corporation is performing well &
achieving all desired treated water quality standards as per discharge standard. However
STP provided at Shrushti complex; BOD & SS concentration is found to be exceeded in
treated water quality and crossing the prescribed standard of 30mg/lit.
5.4.1.4 Kalyan Domestic sewage is generating by local body namely Kalyan-Dombivali Municipal
Corporation, Grampanchyat at & industries in this jurisdiction. Details of sewage generation
and its disposal of each Municipal Corporation and Council are given in following section;

65
a) Kalyan & Dombivali Municipal Corporation KDMC has provided 6 no. of Sewage Treatment Plants and construction of one STP is in
process. Capacity of existing STPs are 203MLD and located at different locations namely
40MLD at Barawe, 40MLD at Aadharwadi, 40MLD at Chinchpada, 40MLD at Barave, 2MLD
at Titwala (E), 1MLD at Titwala (W) &40MLD at Motagaon. KDMC has also installed 6 New
STPs.
b) Ulhasnagar Municipal Corporation The U.M.C. has provided STP of capacity 28MLD, but due to heavy flood condition in July
2005 the STP is hampered and since then it is not in operation. Due to non-compliances of
consent conditions, MPCB has issued Conditional Directions to UMC. There is existing STP
of capacity 28MLD and has proposed to install additional STP of additional 135MLD.
c) Ambernath Municipal Councils
AMC has provided STP of 28MLD and is in operation d) Bhiwandi Nizampur City Municipal Corporation
BNCMC has provided 2 STPs of total capacities 30MLD with individually capacity of 13MLD
& 17MLD. Recently BNCMC has undertaken construction of proposed additional STPs of
capacity 99MLD at 4 places in BNCMC area i.e. 29MLD at Idgah, 30MLD at Bakara Bazaar,
9MLD at Temghar and 31MLD at Stepping Garden.
e) Kalyan Municipal Corporation
Overall 311MLD of wastewater is being treated in 6 operational STPs having 311MLD
capacity. Performance of all STPs of Kalyan Municipal Corporation is presented in Table
5.50.
Table 5.50 Average Annual Performance of STP of Kalyan Municipal Corporation
Location & Parameters in mg/l
BOD (Avg.) COD(Avg.) O & G(Avg.) S. S. (Avg.)
Inlet Outlet Inlet Outlet Inlet Outlet Inlet Outlet
Adharwadi STP ….. 16 ….. 50 BDL BDL ….. 130
Barve STP 30 12 90 50 BDL BDL 30 13
Ulhasnagar Municipal Corp ….. 17 ….. 51 ….. BDL ….. 10
Ambernath Municipal Corp ….. 20 ….. 56 ….. BDL ….. 18
Badlapur Municipal Corp STP installed
Bhiwandi Nizampur City Municipal Corporation,
….. 98 ….. 284 ….. BDL ….. 343
It is observed from Table 5.35, that Barve STP is performing at almost 50% efficiency and
achieving the desired treated water quality standard. However, Adharwadi & Bhiwandi -

66
Nizampur STP is crossing the TSS limit i.e. 30mg/l. Bhiwandi STP is performing well but not
meeting the BOD standard of 30mg/l.
5.4.1.5 Pune
Sewage generation from all local areas-1,281.8MLD
Pune Municipal Corporation alone generates 744MLD sewage, out of which 567MLD
is treated at present with the help of 10 numbers of STP’s provided at different
locations
The Pimpri-Chinchwad Municipal Corporation (PCMC) has provided 13 STPs at
various locations
The treated and untreated wastewater is disposed off into the river
To improve the river water quality, local bodies from Pune region have been given directives
time to time to Pune Municipal Corporation and Pimpri Chinchwad Municipal Corporation for
treatment of total sewage generated. PMC proposes to install 9 no. of STPs of Capacities
364MLD & PCMC proposes to install 90MLD of capacity. Solapur Municipal Corporation is in
process of installation of 3 STPs of collective capacity of 102MLD. Performance status of all
STPs of Pune Region is presented in Table 5.51.
Table 5.51 Average Annual Performance of STP of Pune Regional Office
Location & Parameters in mg/l
BOD (Avg.)
COD (Avg.)
O & G (Avg.)
S. S. (Avg.)
Outlet Outlet Outlet Outlet
PMC STP at Bopodi 15 41 BDL 13
PMC STP at Tanajiwadi 13 37 BDL 12
PMC STP at New Naidu 11 32 BDL 7
PMC STP at old Naidu 21 56 0.1 17
PMC STP at Mundhwa 11 29 BDL 10
PMC STP at Bhiroba 17 47 BDL 22
PMC STP at Vittalwadi 13 35 BDL 12
PMC STP at Erandwana 12 34 BDL 9
PMC STP at Baner 13 35 BDL 9
PMC Kharadi STP 12 34 BDL 10
Aquatech Solution Pvt. Ltd. CSTP, MIDC Hinjewadi,
24 67 0 32
Kirkee Cantonment Board (8 MLD) 7 20 BDL 8
Kirkee Cantonment Board (1.2 MLD) 182 632 4.6 171
Lonawala Municipal Council, Lonavala 8 32 BDL 8
Shirur Municipal Council, Shirur 12 ….. ….. 6
Sangavigaon 50 ….. Nil 54
Kasarwadi Phase-I Not in Operation
Kasarwadi Phase-II 12 35 Nil 19.33

67
Kasarwadi Phase-III 15 42 Nil 16
Chinchwad Phase-I 11 30 Nil 20
Chinchwad Phase-II 14 35 Nil 21
Chikali Phase-I 19 53 Nil 26
Chikali Phase-II 9 30 Nil 19
Pimple Nilakh 15 44 Nil 33
Akurdi 13 34 Nil 16
Ravet 12 36 Nil 8
STP No.1(City Survey no.257/1) Mahabaleshwar,
16 …..
BDL 6
STP No.2- Survey No.626, Mahabaleshwar,
19 …..
BDL 8
STP No.1- Siddharthnagar, Panchgani, 11 ….. 1 51
STP No.2- at Shivajinagar, Panchgani, 9 ….. 1 19
Baradabari, Near Oxidation Pond, Karad 13 ….. BDL 9
Solapur Municipal Corporation, Solapur STP is not in operation
Pandharpur Municipal Council, Pandharpur 90 275 BDL 21
In this region, Municipal Corporations have provided many STPs to treat the generated
sewage. In comparison, it can be observed that all the STPs are performing well and
achieving desired treated water quality standards in terms of parameter concentration.
However 3 STPs are not giving the desired efficiency viz. Kirkee Cantonment Board,
Sangavi Gaon & Pandharpur Municipal Council, it is observed that BOD concentration is
slightly exceeding the prescribed limit of 30mg/lit. Also SS concentration in treated water is
exceeding the limit of 30mg/lit.
5.4.1.6 Nashik Nashik Municipal Corporation has provided 270.5MLD capacity of STP to treat the sewage
generation from the city & 142MLD STP is proposed. Annual average performance status of
STPs of Nashik region is presented in Table 5.52
Table 5.52 Average Annual Performance of STP of Nashik Regional Office
Name of the STP BOD (Avg.) COD (Avg.) S. S. (Avg.)
Inlet Outlet Inlet Outlet Inlet Outlet
Shirdi, Nagar Panchyat 110 5 200 36 78 10
It is observed from the Table 5.52 that provided STP is performing at almost 90-95%
efficiency and achieving the desired treated water quality standards.
5.4.1.7 Aurangabad The main source of domestic pollution is generation of sewage effluent from house hold
activities. In this region, there are 57 Local Bodies including Municipal Corporation, B and C
Class Municipal Councils and one Cantonment Board. The major local bodies are C class
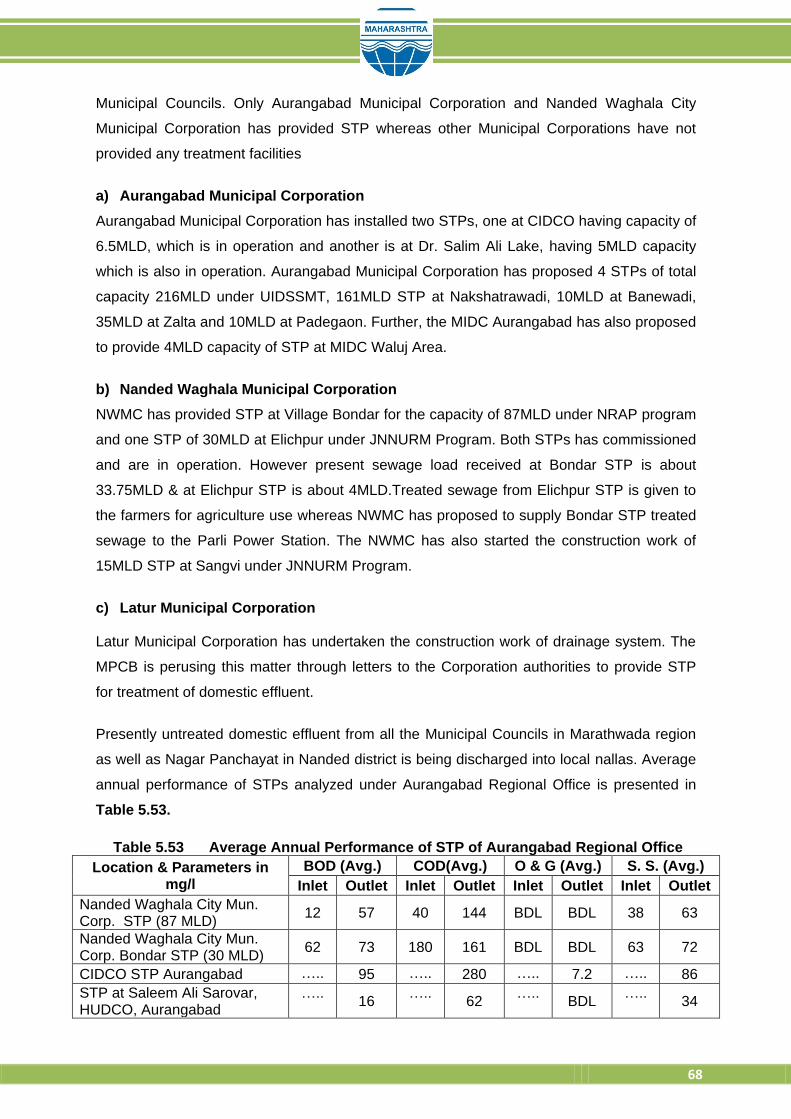
68
Municipal Councils. Only Aurangabad Municipal Corporation and Nanded Waghala City
Municipal Corporation has provided STP whereas other Municipal Corporations have not
provided any treatment facilities
a) Aurangabad Municipal Corporation
Aurangabad Municipal Corporation has installed two STPs, one at CIDCO having capacity of
6.5MLD, which is in operation and another is at Dr. Salim Ali Lake, having 5MLD capacity
which is also in operation. Aurangabad Municipal Corporation has proposed 4 STPs of total
capacity 216MLD under UIDSSMT, 161MLD STP at Nakshatrawadi, 10MLD at Banewadi,
35MLD at Zalta and 10MLD at Padegaon. Further, the MIDC Aurangabad has also proposed
to provide 4MLD capacity of STP at MIDC Waluj Area.
b) Nanded Waghala Municipal Corporation
NWMC has provided STP at Village Bondar for the capacity of 87MLD under NRAP program
and one STP of 30MLD at Elichpur under JNNURM Program. Both STPs has commissioned
and are in operation. However present sewage load received at Bondar STP is about
33.75MLD & at Elichpur STP is about 4MLD.Treated sewage from Elichpur STP is given to
the farmers for agriculture use whereas NWMC has proposed to supply Bondar STP treated
sewage to the Parli Power Station. The NWMC has also started the construction work of
15MLD STP at Sangvi under JNNURM Program.
c) Latur Municipal Corporation Latur Municipal Corporation has undertaken the construction work of drainage system. The
MPCB is perusing this matter through letters to the Corporation authorities to provide STP
for treatment of domestic effluent.
Presently untreated domestic effluent from all the Municipal Councils in Marathwada region
as well as Nagar Panchayat in Nanded district is being discharged into local nallas. Average
annual performance of STPs analyzed under Aurangabad Regional Office is presented in
Table 5.53.
Table 5.53 Average Annual Performance of STP of Aurangabad Regional Office
Location & Parameters in mg/l
BOD (Avg.) COD(Avg.) O & G (Avg.) S. S. (Avg.)
Inlet Outlet Inlet Outlet Inlet Outlet Inlet Outlet
Nanded Waghala City Mun. Corp. STP (87 MLD)
12 57 40 144 BDL BDL 38 63
Nanded Waghala City Mun. Corp. Bondar STP (30 MLD)
62 73 180 161 BDL BDL 63 72
CIDCO STP Aurangabad ….. 95 ….. 280 ….. 7.2 ….. 86
STP at Saleem Ali Sarovar, HUDCO, Aurangabad
….. 16
….. 62
….. BDL
….. 34

69
It is observed from Table 5.53 that the only STP provided at Saleem Ali Sarovar, HUDCO is
performing well and achieving the desired standards of treated water for all parameters
except TSS standard of 30mg/l while the other 3 STPs are meeting the standards of COD &
O&G but not achieving desired standard of BOD [30mg/l] and TSS [30mg/l].
5.4.1.8 Nagpur In Nagpur Region, there is one Municipal Corporation i.e. Nagpur Municipal Corporation
[NMC] and 22 numbers of Municipal Councils. Nagpur Municipal Corporation has provided 2
STP; both are located at Bhandewadi, 100MLD STP based on aerobic process and another
STP of 130MLD. In addition to these 4 numbers of sewage treatment plants of 5MLD
capacity are also proposed at different locations of which work of 2 sewage treatment plant
are in progress Average annual performance of STPs analyzed under Nagpur region is
presented in Table 5.54.
Table 5.54 Average Annual Performance of STP of Nagpur Region
Location & Parameters in mg/l
BOD (Avg.) COD(Avg.) O & G (Avg.) S. S. (Avg.)
Inlet Outlet Inlet Outlet Inlet Outlet Inlet Outlet
Bhandewadi STP, NMC Nagpur
78 21 80 65 6.7 1.8 95 15
It is depicted from Table 5.54 that STP provided in this region is performing at almost 90%
efficiency and concentration of BOD & SS in outlet is within the prescribed limit.
5.4.1.9 Kolhapur There are 2 Municipal Corporation namely Kolhapur Municipal Corporation and Sangli-Miraj-
Kupwad Municipal Corporation and 24 Municipal Council under Kolhapur region. Only 2
STPS have been provided in this region. Details of sewage generation and its disposal from
each municipal corporations and local bodies are presented in following section;
a) Kolhapur Municipal Corporation
There is 1 Municipal Corporation and 09 Municipal Councils in this region. Out of which
Kolhapur Municipal Corporation [KMC] & Ichalkaranji Municipal Council [IMC] is located on
the banks of Panchganga River. Total sewage of 55MLD is being treated in new 76MLD
STP and remaining sewage is directly mixed into the Panchganga River through various
Nallas. From IMC, total sewage generated is about 38MLD for which IMC has provided
20MLD STP but only 14MLD is being treated & remaining is discharged directly into
Panchganga River through various Odhas/Nallas.

70
b) Sangli-Miraj-Kupwad Municipal Corporation
There is one Municipal Corporation and 5 Municipal Councils in this region. The Corporation
has provided 10 numbers of oxidation ponds which are out of order presently. Corporation
has started work of 23.5MLD STP on this land based on SBR technology. Commissioning of
another 27MLD STP is in process which is based on Oxidation Pond located at Dhulgaon.
Other than above mentioned STPs, no sewage treatment plant is provided by other
Municipal Councils and generated sewage is directly being discharged in to the water
bodies. Average annual performance details of Sewage Treatment Plant of Kolhapur region
is presented in Table 5.55.
Table 5.55 Average Annual Performance of STP of Kolhapur Region
Location & Parameters in mg/l BOD (Avg.) COD (Avg.) O & G (Avg.) S. S. (Avg.)
Inlet Outlet Inlet Outlet Inlet Outlet Inlet Outlet
Kolhapur Municipal Corporation 46 28 94 81 BDL BDL 171 23
Ichalkaranji Municipal Council 95 28 232 78 BDL BDL 24 30
SMK Corporation Oxidation Pond At Bedag Road
Not in operation
SRO Ratnagiri There is no any STP provided by the Municipal Council
SRO Chiplun There is no STP provided by any Municipal Council/Nagar
Panchyat in the jurisdiction of this office
It is depicted that both the STPs are performing at almost 50-60% efficiency and achieving
the desired treated water quality standards for all the parameters. O&G concentration in
treated water is also observed to be Below Detection Limit [BDL] in all STPs.
5.4.1.10 Chandrapur At present, there is no STP provided by Chandrapur Municipal Corporation. However, 2
numbers of STP having capacity 45MLD & 25MLD under UIDSSMT scheme are in under
construction phase and shall be commissioned soon.
5.5 Solid Waste Management in Maharashtra Solid Waste is classified into four different types depending on their source. First category of
solid waste is Municipal Solid Waste (MSW). It consists of household waste, construction
and demolition debris (C&D), Sanitation residue, and waste from streets, generated mainly
from residential and commercial complexes. As per the MoEF&CC it includes commercial
and residential waste generated in municipal or notified areas in either solid or semi-solid
form excluding industrial hazardous wastes but including treated bio-medical wastes.
Second category of solid waste is Hazardous Solid Waste (HSW) which is also termed as
industrial waste. They may contain toxic substances, corrosive, highly inflammable, or react
when exposed to certain things such as gases. Third category of solid waste is biomedical

71
waste or hospital waste. It is usually infectious waste that may include waste like sharps,
soiled waste, disposables, anatomical waste, cultures, discarded medicines, chemical
wastes, etc., usually in the form of disposable syringes, swabs, bandages, body fluids,
human excreta, etc. These can be a serious threat to human health if not managed in a
scientific and discriminate manner. Fourth category of waste is electronic waste or e-
waste describes discarded electrical or electronic devices. Used electronics which are
destined for reuse, resale, salvage, recycling or disposal are also considered e-waste.
Following are major waste treatment and disposal methods for MSW
a) Thermal Treatment-Thermal waste treatment refers to the processes that use heat to
treat waste materials. Following are some of the most commonly used thermal waste
treatment techniques:
Incineration - This approach involves the combustion of waste material in the
presence of oxygen. The combustion process converts wastes into ash, flue, gas,
water vapor, and carbon dioxide.
Gasification and Pyrolysis are two similar methods, both of which decompose organic
waste materials by exposing waste to low amounts of oxygen and very high
temperature.
Open Burning is a legacy of thermal waste treatment that is environmentally harmful.
b) Dumps and Landfills
Sanitary landfills provide the most commonly used waste disposal solution.
Controlled dumps are more or less the same as sanitary landfills.
Bioreactor landfills are the result of recent technological research. These landfills use
superior microbiological processes to speed up waste decomposition.
c) Biological Waste Treatment
Composting is another most frequently used waste disposal or treatment method
which is the controlled aerobic decomposition of organic waste materials by the
action of small invertebrates and microorganisms.
Anaerobic Digestion also uses biological processes to decompose organic materials.
There are various processes used to treat BMW viz. Chemical processes, Thermal
processes, Mechanical processes, Irradiation processes and Biological processes etc.
Chemical processes use chemicals that act as disinfectants whereas thermal processes
utilize heat to disinfect. This includes autoclaving and microwaving. Mechanical processes
are used to change the physical form or characteristics of the waste either to facilitate waste
handling or to process the waste in conjunction with other treatment steps. The two primary
mechanical processes are shredding and compaction. In irradiation processes, wastes are

72
exposed to ultraviolet or ionizing radiation in an enclosed chamber. These systems require
post shredding to render the waste unrecognizable. Biological processes use biological
enzymes for treating medical waste.
The treatment technologies for HSW have been categorized as physical, chemical,
biological, thermal, or stabilization/fixation.
Physical treatment processes include gravity separation, phase change systems,
such as air and steam stripping of volatiles from liquid wastes, and various filtering
operations, including carbon adsorption.
Chemical treatment transforms waste into less hazardous substances using such
techniques as pH neutralization, oxidation or reduction, and precipitation. Biological
treatment uses microorganisms to degrade organic compounds in the waste stream.
Thermal destruction processes include incineration, which is increasingly becoming a
preferred option for the treatment of hazardous wastes and pyrolysis, which is the
chemical decomposition of waste, is brought about by heating the material in the
absence of oxygen.
The two methods for proper treatment of e-waste are recycling and refurbishing. For
recycling, there may be products that cannot be recycled completely. PVC layers, for
example, stay as such for ages and cannot be recycled. If electronics are refurbished, they
can be sold again at a lower price. Thus, both the society and environment will benefit.
Instead of simply dumping your old TV into the garbage bin, you might want to think about
calling the vendor and ask him where to present the item for refurbishing
Municipal Solid Waste generated in Maharashtra State is being treated in 56 Common
Facilities provided by either Corporation or Municipal Councils. 4 Common Hazardous
Waste Treatment Facilities are provided to treat the hazardous waste generated in State. 3
Common Waste Treatment Facilities are provided to treat the biomedical waste generated.
Details of waste generation, facilities & treatment provided are elaborated in following
section of the report.
5.5.1 Analysis of Waste Management with Statistical details The detailed report about the quantity of different categories of solid waste generated and
treated in all the regions of the Maharashtra is given below.
5.5.1.1 Mumbai
Quantity of Municipal Solid Waste generated – 8,600MT/Month

73
Quantity of Hazardous Solid Waste generated- 190MT/Month of which 180MT/Month
is treated
Biomedical Solid Waste generated -1,5947kg/D & all is getting treated in the facilities
provided
Almost 100% waste treatment is carried out for Municipal, Hazardous and Biomedical
Waste
5.5.1.2 Navi Mumbai
Quantity of Municipal Solid Waste generated-15,011MT/Month of which
15,005MT/Month is being treated
Quantity of Hazardous Solid Waste generated- is 5,813.64MT/Month of which
5,813.64MT/Month is being treated
Biomedical Solid Waste generated -1,239.38kg/D of which 1,239.38kg/D is getting
treated
The whole quantity of Municipal, Hazardous and Biomedical Solid Waste generated
is getting treated
5.5.1.3 Raigad
Quantity of Municipal Solid Waste generated - 375MT/Month of which 375MT/Month
is getting treated
Quantity of Hazardous Solid Waste generated- 2,217MT/Month of which
2,217MT/Month is treated
Biomedical Solid Waste generated -105kg/D of which 105kg/D is getting treated
100% waste treatment is carried out for Municipal, Hazardous and Biomedical Waste
5.5.1.4 Thane
Quantity of Municipal Solid Waste generated – 52,833.45MT/Month
Quantity of Hazardous Solid Waste generated- 1,003.59MT/Month of which
1,003.59MT/Month is getting treated
Biomedical Solid Waste generated -3,511.16kg/D of which 3,511.16kg/D is getting
treated
100% treatment carried out for Hazardous and Biomedical waste
5.5.1.5 Kalyan
Quantity of Municipal Solid Waste generated – 23,780MT/Month of which
10,800MT/Month is being treated

74
Quantity of Hazardous Solid Waste generated- 15,231.5MT/Month and15,231.5MT
MT/Month is getting treated
Biomedical Solid Waste generated -213.59kg/D of which 77.09kg/D is getting treated
Only 46% of Municipal Waste and 62.9% of Biomedical Waste is getting treated
5.5.1.6 Pune
Quantity of Municipal Solid Waste generated – 13,211MT/Month of which
13,211MT/Month is getting treated
Quantity of Hazardous Solid Waste generated- 350MT/Month of which 350MT/Month
is getting treated
Biomedical Solid Waste generated -1,450kg/D of which 1,450kg/D is getting treated
100% waste treatment is carried out for Municipal, Hazardous and Biomedical Waste
5.5.1.7 Nashik
Quantity of Municipal Solid Waste generated – 23,776.24MT/Month of which
18,722MT/Month is getting treated
Quantity of Hazardous Solid Waste generated- 672MT/Month of which 672MT/Month
is getting treated
Biomedical Solid Waste generated -3,253.3kg/D of which 2,656kg/D is getting treated
78.7% of municipal waste and 81.6% of biomedical waste generated is being treated.
5.5.1.8 Aurangabad
Quantity of Municipal Solid Waste generated – 39,740MT/Month of which
26,285MT/Month is getting treated
Quantity of Hazardous Solid Waste generated- 1,423.88MT/Month of which
1,423.88MT/Month is getting treated
Biomedical Solid Waste generated -6,786.04kg/D of which 6,786.04kg/D is getting
treated
66% of municipal waste, 100% of hazardous waste and biomedical waste is getting
treated
5.5.1.9 Nagpur
Quantity of Municipal Solid Waste generated – 31,485MT/Month of which
6,485MT/Month is getting treated

75
Quantity of Hazardous Solid Waste generated-2,861.655MT/Month of which
2,861.655MT/Month is getting treated
Biomedical Solid Waste generated -1,851.535kg/D of which 1,851.535kg/D is getting
treated
Only 20.1% of municipal waste, 100% of Hazardous waste and Biomedical waste is
getting treated
5.5.1.10 Amravati
Quantity of Municipal Solid Waste generated – 10,433.05MT/Month of which
8,878MT/Month is being treated
Quantity of Hazardous Solid Waste generated- 720.13MT/Month and 664.8
MT/Month is getting treated
Biomedical Solid Waste generated -2,679.9kg/D and all the waste is getting treated
85.1% of Municipal Waste and 92.22% of hazardous Waste is getting treated
whereas 100% treatment is provided for biomedical waste
5.5.1.11 Kolhapur
Quantity of Municipal Solid Waste generated – 16,388.5MT/Month of which
1,231MT/Month is getting treated
Quantity of Hazardous Solid Waste generated-1,737.503MT/Month of which
1,492.11MT/Month is getting treated
Biomedical Solid Waste generated 427.757kg/D of which 427.757kg/D is getting
treated
Only 7.5% of Municipal waste, 86% of Hazardous Waste and 100% of Biomedical
Waste is getting treated
5.5.1.12 Chandrapur
Quantity of Municipal Solid Waste generated - 9,306MT/Month of which
840MT/Month is getting treated
Quantity of Hazardous Solid Waste generated - 2,132.47MT/Month of which
2,132.47MT/Month is getting treated
Only 9% of Municipal Waste and 100% of Hazardous Waste is getting treated
5.5.2 Status of Common Hazardous Waste Treatment, Storage & Disposal Facility There are total 4 number of Common Hazardous Waste Treatment, Storage & Disposal
Facilities installed and operating successfully in the State of Maharashtra, 2 facilities namely

76
Mumbai Waste Management [MWM], Taloja, Trans Thane Waste Management Association
[TTCWMA], Mahape, are located under Navi Mumbai Region, 1 facility namely Maharashtra
Enviro Power Ltd [MEPL], Ranjangaon is located under Pune region & Vidharbha Enviro
Protection Ltd. [VEPL], Buttibori Industrial Area is located under Nagpur region. Presently
6128 industries are member of these 4 facilities and disposing their Hazardous Waste. HW
generation of the State is presented in Figure 5.32 & details of individual capacity of
CHWTSDF are presented in Table 5.56.
Figure 5.32 Region wise Hazardous Waste generation (SLF-Secured Landfill facility, RCL-
Recyclable, INC-Incinerable)
Table 5.56 Summary of Hazardous Waste Received at disposal sites in 2015-16
Sr. No. SITE DLF
(MT/M) LAT
(MT/M) INC
(MT/M) TOTAL (MT/M)
Total industries Joined 6,128Nos.
1 MWML - TALOJA 26,603.00 1,14,863.00 25,885.00 1,67,351.00
2 TTCWMA - MAHAPE 2,106.47 8,557.71 0 10,664.18
3 MEPL - RANJANGAON 42,496.97 25,825.99 28,357.19 96,680.15
4 VEPL - BUTIBORI 8,296.70 11,117.75 4,026.17 23,440.62
TOTAL 79,503.14 1,60,364.45 58,268.36 2,98,135.95
*LAT-Landfill along trading scheme There are 6,128 industries that generate Hazardous Waste. Various methods viz. DLF, LAT,
INC and onsite hydroclave are used for the treatment of this Hazardous Waste.79,503.14

77
MT/Month of HW is treated by DLF method, 1,60,364.45 MT/Month by LAT method and
58,268.36 MT/Month by INC method.
Table 5.57 represents about the number of units in each region that is given an authorization
to generate HSW.
Table 5.57 No. of units in each region that is given authorization to generate HSW
Authorizations – Region wise
Sr. No. Region Total No. of Units
1 Amravati 75
2 Aurangabad 340
3 Chandrapur 127
4 Kalyan 893
5 Kolhapur 362
6 Mumbai 396
7 Nagpur 355
8 Nashik 503
9 Navi Mumbai 710
10 Pune 1,222
11 Raigad 596
12 Thane 549
Total 6,128
5.5.3 Status of Common Bio-medical Waste Treatment, Storage & Disposal Facility Total Numbers of Health Care Facilities (HCFs) in the State is presented in Table 5.58 .
Total numbers of beds provided in the facilities are 2,75,845.
Table 5.58 Total Numbers of Health Care Facilities (HCFs) in the State
Sr. No.
HCF Category No. of HCFs require authorization under
BMW Rules
No. of HCFs does not require authorization
under BMW Rules
1 Bedded Hospitals 21,191 0
2 Non Bedded Hospitals 12,928 16,657
3 Others (Veterinary Hospitals, Research Organizations etc.
11,580 310
Total 126 no of HCFs have applied for Consents under Water & Air Acts Status of Consents
under Water Act & Air Acts, 49 have obtained Consent under Water & Air Acts, 64
applications are under consideration & 4 applications are rejected.
Further 15,559 Nos. of HCFs have applied for authorization, 13,815 No. of HCFs have
obtained authorization, 2,696 applications are under consideration & 1 application is
rejected.

78
Table 5.59 Details of On-Site treatment equipment’s installed by HCFs
Sr. No.
No. of HCFs
On site Deep Burial
On-site Incinerator
On-site Autoclave
On-site Microwave
On-site Shredder
Nos. Capa
city Nos.
Capac
ity Nos.
Capac
ity Nos.
Capac
ity Nos.
Capaci
ty
1 8,300 6,979 3,903 9 1,585 335 2,665 1 40 1,641 29,96
Total BMW Generated & Treated by HCFs (On site/captive facilities) is 20024 Kg/day. Total
Recyclable & Treated BMW Sold off by HCFs is 682 Kg/day and total Treated BMW
Disposed off by HCFs through a CBMWTSDF is 20050Kg/day. Further to the same No. of
On-site incinerator (s) in operation installed by HCFs with APCD is 9.
Details of Common Bio-medical Waste Treatment Facility (CBWTF):
a) Total No. of CBWTFs in operation : 37
b) Total No. of CBWTFs under consideration : 3
c) Total No. of incinerators installed by CBWTFs :
I) With APCD : 42
II) Without APCD : 0
Details of CBWTFs
a) Total BMW collected & treated by CBWTFs in kg/day : 47,247
b) Total recyclable BMW sold off by CBWTFs in kg/day : 7,752
Total BMW disposed off by CBWTFs in kg/day : 46,616
Action taken against HCFs / CBWTFs for violation of provisions:
a) No. of show cause notices issued to HCFs : 426
b) No. of show cause noticed issued to CBWTFs : 3
c) No. of HCFs closed during the year 2015 : 0
d) No. of CBWTFs closed during the year 2015 : 3
Details of Bio-medical Waste Management Scenario :
a) Total Biomedical Waste Generation in kg/day :
I. Incinerable : 46,593
II. Recyclable (after autoclaving followed by shredding : 17,041
III. Disposable in secured landfill /deep burial / sanitary landfill : 12,082
b) Total bio-medical waste collected in kg/day : 59,537
c) Total bio-medical waste Treated & Disposed in kg/day : 61,104

79
5.5.4 E-Waste Electronic waste or e-waste describes discarded electrical or electronic devices. Used
electronics which are destined for reuse, resale, salvage, recycling, or disposal are also
considered e-waste. Informal processing of e-waste in developing countries can lead to
adverse human health effects and environmental pollution. Electronic scrap components,
such as CPUs, contain potentially harmful components such as lead, cadmium, beryllium,
or brominated flame retardants. Recycling and disposal of e-waste may involve significant
risk to health of workers and communities in developed countries and great care must be
taken to avoid unsafe exposure in recycling operations and leaking of materials such as
heavy metals from landfills and incinerator ashes
Implementation of the E-waste (management and Handling) Rules, 2011
For effective implementation of the E-Waste (Management and Handling) Rules,
2011 a circular was issued on 20/07/2012 which is made available on MPCB
website.
Ministry of Environment, Forest and Climate Change, Government of India, has
notified new E-Waste (Management) Rules, 2016 on 23rd March, 2016; which will
come into force from the 1st day of October, 2016
A registration committee has been constituted for grant or renewal of registration
under the E-Waste (Management and Handling) Rules, 2011 for
Dismantling/Recycling of the E-waste using Environmentally Sound technology
During the Year 2016-17, the Boards has granted authorization and registration
under the E-waste (Management and Handling)Rules, 2011, to 13 E-waste
dismantlers and 2 E-waste Recyclers having Environmental sound Management of
E-Waste and granted authorization to 8 Collection Centers for E-Waste in
Maharashtra State
Details of authorization issued under the E-waste (M and H) Rules, 20111 to Dismantlers /
Recyclers/ Collection/ Producers is as shown in Table 5.60.
Table 5.60 Status of E-Waste Generation and Recycling in Maharashtra State
Sr. No.
Types of Authorization/ Registration Granted by Board
Authorization/ Registration Granted bynthe Board (Nos)
Capacity of E-waste generation/ collection/ Dismantling/ Recycling (MT/A)
1 E-Waste Producers-Manufacturer 27 Not Applicable
2 E-Waste Producers Importer 25 Not Applicable
Total 52 Not Applicable
E-Waste Collection/dismantling and recycling capacity/ Centers
3 E-Waste Collection Center’s 42 Not Applicable

80
4 E-Waste Dismantlers 27 32720
5 E-Waste Recyclers 05 15340
Total 74 48060
5.6 Performance of Board Laboratories Maharashtra Pollution Control Board has established / recognized a Central Laboratory and
7 Regional Laboratories at Pune, Nashik, Aurangabad, Nagpur, Chiplun, Thane and
Chandrapur, respectively under sub-section 2 of Section 17 of the Water (P&CP) Act, 1974
and the Air (P&CP) Act, 1981. These laboratories are well equipped and approved by
Ministry of Environment & Forest and Climate Change (MoEF&CC), Government of India
(GoI), Delhi under E(P) Act, 1986 and also ISO 9001:2008 and OHSAS 18001:2007
accredited.
MPCB laboratories functions as Board’s laboratories as defined under Water and Air Act;
and Environment (Protection) Act, 1986 and Rules made there under to analyze the samples
collected by field officers from respective region for analysis of Water, Air & Hazardous
waste, Municipal Solid Waste, Biomedical waste samples and submit the reports to
respective Sub Regional Office for further regulatory action. Regional Lab Chandrapur
analyzes only Air samples.
MPCB’ laboratories are well equipped with modern sophisticated instruments and equipment
like UV Spectrophotometer, Gas Chromatograph (GC), Mass Spectroscopy, Atomic
Absorption Spectrophotometer (AAS), Ion Chromatography (IC) Inductive Couple Plasma
(ICP), Adsorable Organic Halide Analyzers (AOx), CHNS Analyzers and others.
Water sample analysis includes physical, chemical, microbiological and toxicological
parameters. Air sample analysis includes ambient air quality parameter such as RSPM,
suspended Particulate Matter, Sulphur-di-Oxide, Oxides of Nitrogen, Acid Mist, Benzene,
Chlorine, Lead, Ammonia, VOC, etc. The Stack monitoring includes analysis of parameters,
such as Total Particulate Matter, Sulphur-Di-Oxide, Acid Mist, Chlorine, H2S, HCl, Ammonia
etc. Hazardous Waste samples are analyzed for metals, Hydrocarbons, etc. Bio-Medical
Waste samples are analyzed for spore test. Analysis Performance of Board Laboratories for
the year 2015-2016 is presented in Table 5.61 & represented graphically in Figure 5.33 to
5.35.
Table 5.61 Yearly performances of Board’s laboratories (April-2015 to March-2016)
Sr. No
Laboratory
Total No. of Samples Received
Total No. of Samples Analyzed
Total No. of Parameters Analyzed
Water Air H.W Water Air H.W Water Air H.W
1 CL, Navi Mumbai
10343 1425 280 10487 1430 242 121473 9898 1673

81
2 RL, Nagpur 2961 1411 28 3601 2095 28 45864 5517 357
3 RL, A'bad 2348 310 18 2348 310 18 27258 881 56
4 RL, Pune 6729 876 35 5698 908 23 65664 3964 91
5 RL, Nashik 3636 709 28 3602 1080 18 42351 4761 193
6 RL, Chiplun 4912 1046 87 4803 1151 91 57031 2804 905
7 RL, Thane 2218 1000 _ 2275 1019 _ 15857 2251 _
8 RL, Chandrapur _ 706 _ _ 706 _ _ 2072 _
TOTAL 33147 7483 476 32814 8699 420 375498 32148 3275
* CL - Central Laboratory, RL - Regional Laboratory
Figure 5.33 Total No. of Water Samples Received (2015-16)
Figure 5.34 Total No. of Air Samples Received (2015-16)
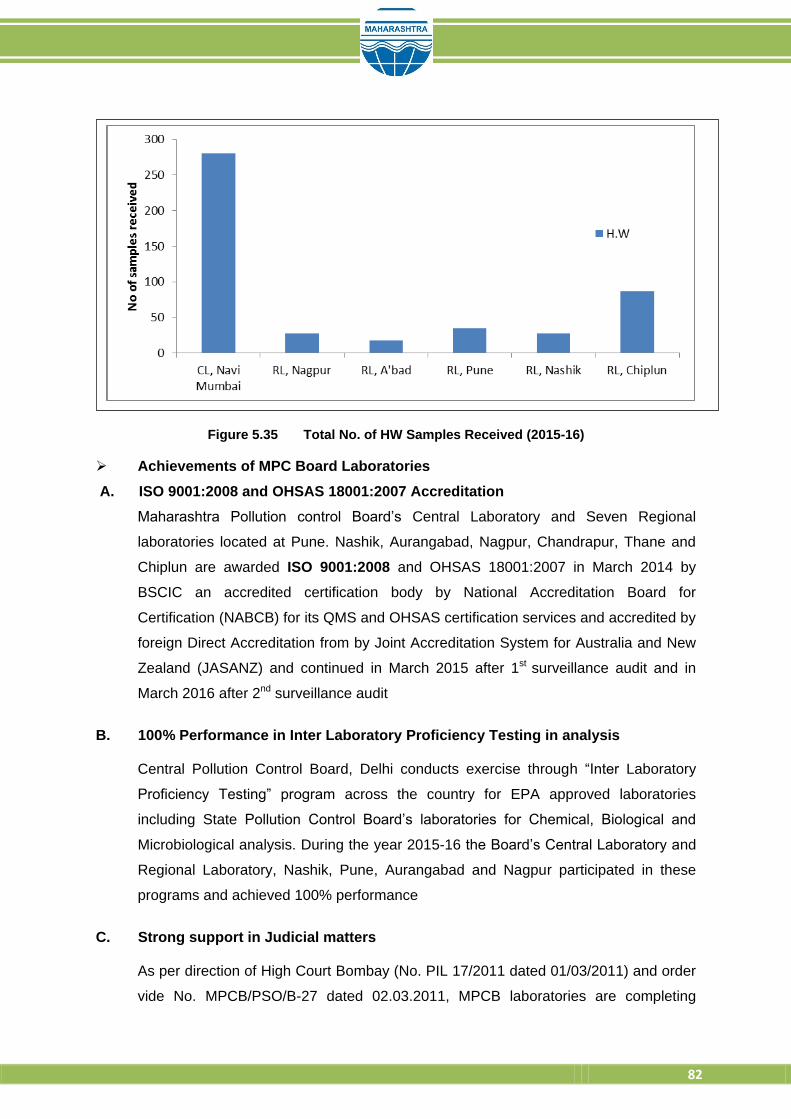
82
Figure 5.35 Total No. of HW Samples Received (2015-16)
Achievements of MPC Board Laboratories
A. ISO 9001:2008 and OHSAS 18001:2007 Accreditation
Maharashtra Pollution control Board’s Central Laboratory and Seven Regional
laboratories located at Pune. Nashik, Aurangabad, Nagpur, Chandrapur, Thane and
Chiplun are awarded ISO 9001:2008 and OHSAS 18001:2007 in March 2014 by
BSCIC an accredited certification body by National Accreditation Board for
Certification (NABCB) for its QMS and OHSAS certification services and accredited by
foreign Direct Accreditation from by Joint Accreditation System for Australia and New
Zealand (JASANZ) and continued in March 2015 after 1st surveillance audit and in
March 2016 after 2nd surveillance audit
B. 100% Performance in Inter Laboratory Proficiency Testing in analysis
Central Pollution Control Board, Delhi conducts exercise through “Inter Laboratory
Proficiency Testing” program across the country for EPA approved laboratories
including State Pollution Control Board’s laboratories for Chemical, Biological and
Microbiological analysis. During the year 2015-16 the Board’s Central Laboratory and
Regional Laboratory, Nashik, Pune, Aurangabad and Nagpur participated in these
programs and achieved 100% performance
C. Strong support in Judicial matters
As per direction of High Court Bombay (No. PIL 17/2011 dated 01/03/2011) and order
vide No. MPCB/PSO/B-27 dated 02.03.2011, MPCB laboratories are completing

83
weekly analysis of CETP Joint Vigilance Sample analysis across the State and
submitting analysis report well within time for hoisting the performance of CETPs on
MPCB web site
D. Time bound completion of analysis of samples collected under special projects
i. During Ganesh Festival MPCB laboratories analyze the samples
(pre and post immersion) collected from lakes, Rivers, Sea and Creeks
ii. Sinhastha Kumbhmela - Maharashtra Pollution Control Board carried out Water, Air
and Noise Monitoring and its Analysis during Sinhastha Kumbhmela 2015. Mass
awareness programme is being carried out during Kumbhmela period to keep the
Godavari River free from pollution & to keep clean environment at Nashik Region
E. Training to Scientific Staff
Maharashtra Pollution Control Board imparted “Internal Auditor” training as per
ISO9001: 2008 and OHSA 18001:2007 to Scientific Officers and Regional Officers of
the Board in the year 2016 and declared twenty three officers as qualified as ‘Internal
Auditor’ for MPCB Laboratories.

84
6.0 REGIONAL ENVIRONMENTAL PROBLEMS & CONTROL MEASURES TAKEN IN RESPECTIVE REGIONS
Major environmental problems across the State and control measures adopted for the same
are mentioned in this Chapter.
6.1 Chandrapur
Heavy transportation of coal, iron ore, cements etc. overloading of trucks, railway siding at
Ghuggus, Wani, Tadali, Majri area. Coal depot issues in Yavatmal & Chandrapur districts.
Board has issued guidelines for coal stack &railway siding. For implementation of said
guidelines Board has issued proposed direction & taken personal hearing of coal depot
located at Wani area.
Board has conducted meeting regarding review of CEPI under the Chairmanship of
Additional Chief Secretary of Environment at Collector Office, Chandrapur to reduce score of
CEPI and implementation action plan of CEPI.
6.2 Aurangabad
The trend of Air quality in this Region is quite changed in the parameter like SPM and RSPM
mostly due to construction activities and vehicular pollution throughout the year.
The air polluting industries in the Region have provided Cyclone type dust collectors, Bag
filters, Wet Scrubber, Fly ash arrester and ESP with adequate height of stack for control of
air emission and same are operated regularly. Recently a meeting was held on 18/02/2016
under the Chairmanship of the Hon’ble Environment Minister, Govt. of Maharashtra at
Mantralaya, Mumbai and as per the minutes of said meeting, 10 Nos. of steel industries in
Jalna district are directed to operate the existing air pollution control system efficiently, to
improve the O & M of Air Pollution Control System and to submit the Bank Guarantee of Rs.
5.0 Lacs (each) towards compliance of these directions.
Major industrial units have installed pollution reduction mechanism like R.O system, MEEP
system for reduction in quantity of effluent and the industries are also sending their treated
effluent to CETP for further treatment and disposal. Industries have also installed Air
Pollution Control System like ESP, Ventury Wet Scrubbers etc. for minimization of emissions
in the environment. Further industries have joined to CHWTSDF for safe disposal of
Hazardous Waste and provided separate storage facility within premises.
6.3 Kalyan
1. Only part of Kalyan & Dombivali city is covered by under-drainage system. Most of
sewage is flowing through open nalla & meeting to Ulhas creek

85
2. Smell nuisance is being caused by improper treatment of effluent in industrial area
The MIDC effluent carrying pipeline and chambers are broken and the overflowing
effluent in local nalla which is flowing through residential area due to which smell
nuisance compliant has been received
3. There is no treatment facility available and presently illegal dumping of MSW
carried out by Corporation & Local Grampanchyat on unauthorized areas &
industrial areas
4. There is no demarcation as industrial, residential & commercial zone
5. STP of Ulhasnagar Municipal Corporation is not continuously in operation & STP
of Ambernath Municipal Council is partially found in operation. This is leading to
Waldhuni river pollution
6. Diversion of Khemani nalla is felt necessary
7. ETPs are not provided for jean washing units operating in Ulhasnagar &
Ambernath area
8. Noise pollution is being caused by jean sewing machine in Ulhasnagar area
9. Illegal industrial units operating in Ulhasnagar residential area
10. There is no treatment facility available & presently illegal dumping of MSW carried
by Ulhasnagar Municipal Corporation, Ambernath Municipal Council on
unauthorized area. Badlapur Municipal Council dumping MSW unscientifically on
unauthorized site
11. The industries developed in this area are mostly Air Pollution prone Industries.
Almost all the industries in Wada, Shahapur & Murbad Tehsil has provided
necessary APC systems like swinging hood, duct line, air blower, cyclone followed
by Bag house or Wet type scrubber to control the air pollution. The chimney of
minimum height of 30 Mts. is provided to assure natural dispersion of pollutants at
specific height. Regional Office, Kalyan regularly carries out vigilance of the
industries to check compliance of consent conditions. Most of the industries are
operating their APC Systems. However, in some cases it is observed that though
the APC systems provided by the industries are adequate but there are problems
of operation & maintains of APC system or that they are not operating
continuously & efficiently
6.4 Bhiwandi
1. Insufficient collection, transportation and treatment and disposal facility for sewage
and solid waste within and outside the Corporation area causing environmental
problems within and outside the city area by way of open gutters, common nallas,
accumulation of waste water and other related issues

86
2. Unorganized establishment/ growth of power loom, in the area and establishment
of this in the residential area and no mechanism in place for abating noise
pollution
3. Unorganized growth of godowns and power looms and small scale industry in the
nearby villages which are mainly non polluting
4. Rapid increase in construction of godowns without any basic infrastructure,
thereby causing vehicular pollution and emission of road dust
5. Incidents of fire in the godown belt due to lack of proper attention towards safely
6. Vehicular pollution due to movement of heavy vehicles, lack of roads, bad
condition of road and lack of traffic sense among the vehicular transporters
7. Unscientific dumping of Municipal Solid Waste at Chavindra site
8. Disposal of untreated domestic effluent into Kamavari River
9. Illegal construction of godowns and storage of chemical at village, Dapoda, Purna,
Kasheli, Gundavali, Val, Kalher etc.
6.5 Kolhapur
The major source of Panchaganga river pollution is due to the discharge of untreated
sewage in Panchaganga River by local bodies located on the bank of river. The contribution
of effluent discharged in Panchaganga River is as below:
Kolhapur Municipal Corporation - 96 MLD
Ichalkaranji Municipal Council - 32 MLD
174 Villages - 23 MLD
Industrial - 4.5 MLD
1. About 20 MLD agriculture run off directly enters Panchaganga River
2. On the bank of Panchaganga River about 8 Sugar industries, 5 Distillery units
were located. All the sugar industries have provided Effluent Treatment Plant for
the effluent generated and the treated effluent is used for irrigation purpose. Most
of the times, these sugar industries have carried out excess crushing of sugar
cane and due to insufficient treatment facility the excess effluent discharge into
nearby nalla which further meets the River. Sometimes due to accidental
discharge there may be pollution problem & fish kill incidence
3. The major problem in the MIDC Shiroli & Gokul Shirgaon is disposal of Foundry
waste sand/ Slag and sewage treatment since MIDC has not provided Sewage
Treatment Facility and other required infrastructure. Regional Office, Kolhapur has
issued letter regarding the same to MIDC office, Kolhapur. The Foundry industries

87
has formed a cluster for recycling of burnt sand and the said project will be
implemented very soon & about 60 % waste sand will be recycled
4. The Municipal Solid Waste generated from the Kolhapur City area is not handled
or treated scientifically by the Corporation. There are frequent complaints about
the same. Necessary direction has been issued by the Board to the corporation
5. Due to the construction of about 8 K. T. Weir on River Panchaganga the natural
flow of the river water is not maintained which causes the further deterioration of
water quality
6. Along with above problems the MSW and Sewage treatment of local bodies is a
problematic issue and Regional Office, Kolhapur took necessary follow up for the
same during the year
Regional Office, Kolhapur has brought above points to the notice of concerned authorities by
the way of regular correspondence, analysis of water samples & asked to adopt
precautionary measures from time to time
6.6 Nashik
In this region, Air Pollution problems created due to stone crushers located in Vilholi Sarul
village area; the Board has issued directions U/s 31 A of Air Act and 33 A of Water Act.
Quantity of Water consumption of Nashik Municipal Corporation is 390.0 MLD & quantity of
generation of sewage is 280.0.MLD. Nashik Municipal Corporation is having STP of capacity
270.50 MLD & sewage is treated to the tune of 225.0 MLD. Nashik Municipal Corporation
has also proposed to provide STP of capacity 142 MLD.
The Board has directed to Nashik Municipal Corporation to avoid the untreated Sewage
discharging into river. Further the Board issued consent to Nashik Municipal Corporation
with condition to operate & maintain the STP’s to achieve BOD level 30 mg/l to 10 mg/L. The
Board monitored river water quality & STP regularly during the year.
6.7 Pune
Major reasons for River Water Pollution in the area;
1. Domestic Sewage Generation from human settlement
2. Lechate due to unscientific disposal of Municipal Solid waste
3. Run of rain water from agricultural fields
4. Uncontrolled Sand Dredging
5. Non availability of minimum flow in river
6. Increase in Water Hyacinth

88
7. Accumulation of silts due to obstructions in river
Major Issues of MSW
1. Municipal Solid Waste segregation is unscientific
2. Non Operational treatment facilities due to technical problems
3. Technology Failure facilities viz. waste to energy plant not operational due to
non-generation of required quality and required quantity of lean gas
4. Indigenous Proven technology is not available
5. Open dumping created Ground Water Pollution
6. Strong opposition by local population for not allocating a new site for MSW
disposal
Chandrabhaga river Pollution related issues
1. Floating Population of pilgrims creates pollution load on river Chandrabhaga
2. MSW treatment facility is unscientific
3. Environmental Management Plans not prepared and not yet implemented
4. Villages situated on the bank of river are discharging untreated sewage into
river Chandrabhaga
Major Issues related to Pollution Due to Old Distillery Units
1. Unscientific storage of spent wash by old distilleries already caused ground
water pollution
2. Reclamation /Bio-remediation is not possible
3. During rainy season seepages find its way into nearby water body/river
4. CREP guidelines to be adopted by distillery units in phase wise manner
5. Leachates due to unpredictable rain fall causing pollution
6.8 Thane
Implementation Of MSW Rule
1. Urbanization in recent decades has created problems of scientific disposal of
Municipal Solid Waste in Urban Local Bodies. Urban Local Bodies have not
made provision for source segregation, treatment and disposal of solid waste
thereby violating provisions of MSW Rules
2. Unscientific dumping of Municipal Solid Wastes in the area invites the
complaints of pollution and smell nuisance from local people
3. No physical source segregation of MSW which creates problem of smell
nuisance during transportation due to mixing of wet and dry waste
4. Dumping of MSW in CRZ prone area creates adverse effect on environment,
mangroves and nearby aquatic life

89
5. Need of awareness among public and urban local bodies regarding
implementation of the Rules are necessary
Treatment of Domestic Waste Water by ULB
1. It is a major thrust area which need to be attended by ULB so as to conserve
natural resource of water. There is need of reuse and recycle of treated waste
water considering its scarcity
2. The quantum of water consumption for Urban Local Bodies in jurisdiction of
Regional Office, Thane is @ 600 MLD and domestic waste water generation
is @ 500 MLD Presently, partly treated / untreated domestic waste water is
being discharged into nearby creeks which create adverse effect on nearby
environment & aquatic life
3. Urban Local Bodies have to be motivated by facilitating them with subsidies
for provision of STP and other environmental management infrastructure
Paneri Nalla pollution
Paneri Nalla is located near Palghar. On the bank of this paneri nalla there are three
private industrial eStates. The Industries located on the bank of Paneri Nalla as well
as Palghar Municipal Council are discharging their effluent into the nalla resulting
severe pollution complaints
MIDC Tarapur
1. Tarapur MIDC is largest chemical zone in Maharashtra. CPCB has declared
critically polluted area and cumulative CEPI index is 72.01 (Water CEPI : 56,
Air CEPI : 60.75 & Land CEPI : 51.25). The major contribution in the CEPI
was due to water pollution, air pollution use of carcinogenic chemicals, nearby
locality and allied aspects
2. Action plan has been prepared to reduce the CEPI index. The implementation
of Tarapur action Plan is under progress
3. Most of the industries have installed advance air pollution control measures
so as to limit process emissions. The industries will compelled to switch over
to clean fuel so as to limit TPM, SOx levels due to burning of fossil fuels. The
pipeline work of GAIL is under progress
4. CETP has proposed to carryout expansion of existing CETP by installing
additional capacity plant of 50 MLD which will reduce impact of water pollution
so as to minimize CEPI score
5. It is necessary to study feasibility for setting up sewage treatment plant (STP)
in Boisar area

90
6. MIDC have proposed to develop site for scientific treatment and disposal of
Municipal Solid Waste generated from industrial area and nearby villagers.
The development of treatment facility along with landfill site will improve CEPI
score in the said area
7. Present evaluation of CEPI score is not possible due to non-availability of
methodology and technology adopted by CPCB. Also, Board is not having
such type of technocrats to cope up with CEPI evaluation
Illegal Industries in Corporation area
1. The jurisdiction of this office consists of Municipal Corporation area of Thane,
Mira Bhayander& Vasai-Virar City which is densely populated area
2. Most of the industries are being operated with trade licenses under Shop &
Establishments issued by Corporations
3. These industries have not obtained consents from the Board and operating
without provision of adequate pollution control measures
4. There are frequent complaints of air / water pollution and nuisance thereof
from nearby residents
5. It is necessary to carryout extensive survey of the Corporation area
specifically Vasai-Virar city Municipal Corporation to identify such type of
illegal industrial establishments to curb pollution nuisance. It is proposed to
offload the work of survey to outside agency considering manpower crunch
with the office

91
7.0 ENVIRONMENTAL STUDIES & SURVEYS
7.1 Air quality assessment during Diwali 2015 at few regions of Maharashtra Historically, the origin of Diwali can be traced back to ancient India, when it was probably an
important harvest festival. However, there are various legends pointing to the origin of Diwali
or 'Deepawali.' Some believe it to be the celebration of the marriage of Lakshmi with Lord
Vishnu whereas; in Bengal the festival is dedicated to the worship of Mother Kali, the dark
goddess of strength. Lord Ganesha, the elephant-headed God, the symbol of
auspiciousness and wisdom, is also worshiped in most Hindu homes on this day. In Jainism,
Deepawali has an added significance to the great event of Lord Mahavira attaining the
eternal bliss of nirvana. Diwali also commemorates the return of Lord Rama along with Sita
and Lakshman from his fourteen yearlong exile and vanquishing the demon-king Ravana. In
joyous celebration of the return of their king, the people of Ayodhya, the Capital of Rama,
illuminated the kingdom with earthen diyas (oil lamps) and burst crackers. All the simple
rituals of Diwali have significance and a story to tell. The illumination of homes with lights
and the skies with firecrackers is an expression of obeisance to the heavens for the
attainment of health, wealth, knowledge, peace and prosperity. According to one belief, the
sound of fire-crackers is an indication of the joy of the people living on earth, making the
gods aware of their plentiful State.
In order to assess the ambient air quality during Diwali festival period, Maharashtra Pollution
Control Board (MPCB) has taken initiative to carry out Noise monitoring at Mumbai, Pune,
Solapur & Chandrapur city at few locations during on 9-10.11.2015 (Pre-diwali), 11.11.2015
(Lakshmi-Pujan), 12.11.2015 (Balipratipada) and 13.11.2015 (Bhaubeej). The main aim of
the project is to determine the trends and variations in air quality at various areas of the city
in different land uses and to create awareness about air pollution through availability of
scientific data. The results of monitoring carried out during this period are represented in
Figure 7.1.

92
Figure 7.1 Air quality assessed during Diwali 2015 in State. From Figure 7.1 SO2 concentration is higher in Mumbai in Pune region on all days while in
Solapur & Chandrapur region it is less almost half of the other regions. Overall concentration
of all samples was observed to be within the prescribed limits of NAAQM.
NOX concentration in Mumbai region is exceeding beyond the prescribed limits on all days.
While in other region it is observed well within the limits. Lowest concentration is found at
Chandrapur region.
PM10 & PM2.5 concentration is observed to be higher amongst all the regions though at all
the locations concentration is exceeding the prescribed limits of NAAQM.
5.2 Monitoring of Ambient Noise pollution During Ganesh Festival, 2015
Ganesh Festival is one of the main festivals in Maharashtra. Large numbers of people
participate in the immersion procession culminating the 10 days festival. Vocal music and
musical instruments during the festival often lead to high levels of noise. Since last few years
Maharashtra Pollution Control Board is monitoring ambient noise levels in Ganesh Festival
Period.
This report is based on the extensive noise monitoring study conducted by Maharashtra
Pollution Control Board at 132 locations all over Maharashtra covering 26 corporations for
the 5 days period during Ganesh Festival i.e. on 11th, 18th ,21st, 23rd & 21st September, 2015
for 24hrs on First day of monitoring and from 18.00 hrs. to 24.00 hrs continuously for 6
hours, in the remaining days, comprising residential, commercial and silence zones. The

93
details of number noise monitoring locations in different Municipal Corporation all over
Maharashtra as provided in Table 7.1.
Table 7.1 Noise Monitoring Locations of Maharashtra During Ganesh Festival
Sr. No. Municipal Corporation Number of Locations
1. Mumbai 25
2. Navi Mumbai 05
3. Thane 09
4. Pune 20
5. Nashik 05
6. Aurangabad 05
7. Nagpur 05
8. Kalyan 03
9. Amravati 03
10. Jalgaon 03
11. Kolhapur 03
12. Sangli 03
13. Mira – Bhyander 03
14. Vasai – Virar 03
15. Ulhas Nagar 03
16. Bhiwandi – Nizampur 03
17. Chandrapur 03
18. Nanded – Waghala 03
19. Ahmednagar 03
20. Dhule 03
21. Malegaon 03
22. Pimpiri – Chinchwad 03
23. Parbhani 03
24. Latur 03
25. Akola 03
26. Solapur 04
Hourly Noise Levels on 17th, 18th, 21st, 23rd and 27th September, 2015 during Ganesh
Festival at 132 different locations in Maharashtra. In the present study, hourly and day wise
Leq. has been calculated to compare the results obtained from various locations. Details of
obtained level w.r.t. each region is graphically represented in Figure 7.2.
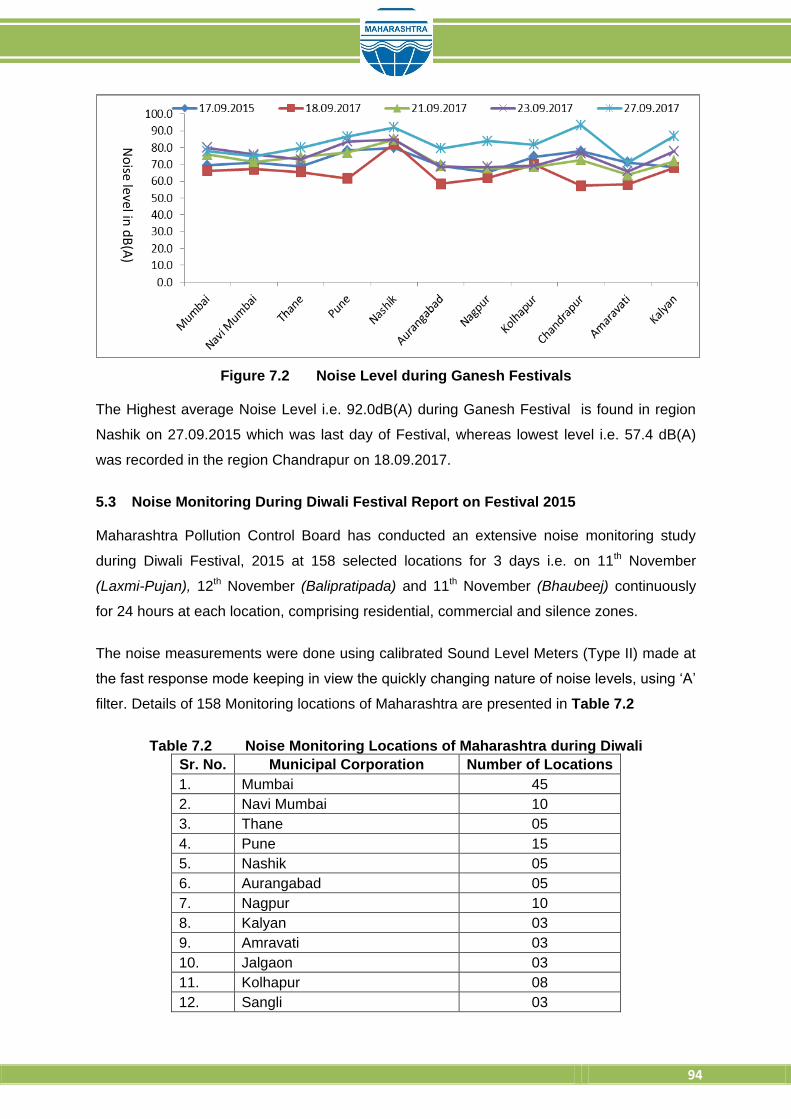
94
Figure 7.2 Noise Level during Ganesh Festivals The Highest average Noise Level i.e. 92.0dB(A) during Ganesh Festival is found in region
Nashik on 27.09.2015 which was last day of Festival, whereas lowest level i.e. 57.4 dB(A)
was recorded in the region Chandrapur on 18.09.2017.
5.3 Noise Monitoring During Diwali Festival Report on Festival 2015 Maharashtra Pollution Control Board has conducted an extensive noise monitoring study
during Diwali Festival, 2015 at 158 selected locations for 3 days i.e. on 11th November
(Laxmi-Pujan), 12th November (Balipratipada) and 11th November (Bhaubeej) continuously
for 24 hours at each location, comprising residential, commercial and silence zones.
The noise measurements were done using calibrated Sound Level Meters (Type II) made at
the fast response mode keeping in view the quickly changing nature of noise levels, using ‘A’
filter. Details of 158 Monitoring locations of Maharashtra are presented in Table 7.2
Table 7.2 Noise Monitoring Locations of Maharashtra during Diwali
Sr. No. Municipal Corporation Number of Locations
1. Mumbai 45
2. Navi Mumbai 10
3. Thane 05
4. Pune 15
5. Nashik 05
6. Aurangabad 05
7. Nagpur 10
8. Kalyan 03
9. Amravati 03
10. Jalgaon 03
11. Kolhapur 08
12. Sangli 03
No
ise level in d
B(A
)

95
13. Mira – Bhyander 03
14. Vasai – Virar 03
15. Ulhas Nagar 03
16. Bhiwandi – Nizampur 03
17. Chandrapur 03
18. Nanded – Waghala 03
19. Ahmednagar 03
20. Dhule 03
21. Malegaon 03
22. Pimpiri – Chinchwad 03
23. Parbhani 03
24. Latur 03
25. Akola 03
26. Solapur 04
TOTAL 158
Average Noise Level [Day Time] of all regions are presented in Table 7.3 and Graphical
presentation is given in Figure 7.3
Figure 7.3 Average Noise Level [Day Time] During Diwali Festival 2015 The highest average Noise level i.e. 87.8dB(A) during Day Time was recorded in the region
Navi Mumbai on 12.11.2015 and lowest average Noise Level i.e. 62.9 dB(A) was recorded in
the region Amravati on 13.11.2017.
Average Noise Level [Night Time] of all regions are presented in Figure 7.4
No
ise level in d
B(A
)

96
Figure 7.4 Average Noise Level [Night Time] During Diwali Festival 2015 The highest average Noise level i.e. 75dB(A) during Night Time was recorded in the region
Nashik on 11.11.2015 and lowest average Noise Level i.e. 52.2dB(A) was recorded in the
region Amravati on 12.11.2017.
5.4 Conclusion
The noise level in many regions was lesser this year as compared to last year and even the
noise of fire crackers was also very much limited. But still the noise level was beyond the
permissible limit or in other words it was more than what a human ear or an animal can
resist. Even in the night time after 10 PM also loud noise was created with bursting of
crackers which leave difficulties to babies, old people and even stray dogs and other
animals.
It cannot be ignored that the impact of noise is correlated with the distance. MPCB has
carried out noise level measurements in specified locations. The levels received may be
different from any other and people staying nearby any place where fire crackers are busted
may receive more decibel noise levels. Thereby this study can’t be concluded that noise
pollutions and its effects where really less. While each year goes, there is difference in the
levels of noise created and people have also taken precautions in making their festival eco-
friendly. More awareness and ill effects of the use of fire crackers should be made which
may ultimately lessen the levels of noise pollution with other pollutions.

97
8.0 ENVIRONMENTAL TRAINING
Training constitutes as an integral and continuous process for any learning and
development. Understanding advancements in technology and new provisions in the
environmental aspects, quality of the work, responsibilities in the respective field and overall
development in the field of environment and work all boils down to effective training
programs imparted on each accountable member of the Staff and Officers of the Board.
It is therefore one of the primary function of the Board to plan & organize these programs of
training of varied capacity in different aspects of prevention, abatement and control of
pollution. The Board deputes its Staff & Officers for training of different aspects for
knowledge in environment protection & pollution control, cleaner technologies, waste
minimization and amendments in respective Acts & Rules to adequately equip them to
perform their duties with highest efficiency.
During this year of consideration, the Board had deputed 109 officers to attend training in
technical, scientific and administrative courses organizing 23 training programs during the
year.
The various training courses/workshops/seminars/lectures attended by the Staff and the
Officers of the Board held during the year 2015-2016 are summarized in ANNEXURE 5.

98
9.0 ENVIRONMENTAL AWARENESS & PUBLIC PARTICIPATION
For sustainable development it is necessary to promote and create environmental
awareness among communities, businesses and governments. Therefor the Board
organizes various environmental awareness programs across the State of Maharashtra.
During the year following programs on environmental awareness were conducted by the
Board:
Month Subject Details
April 2015 World Earth Day, Public
awareness article published
by the newspapers : Times
of India and Maharashtra
Times
On April 22, on account of World Earth day,
special articles were published in the
newspapers of Maharashtra Times and Times
of India.
April 2015 On 22nd April 2015 World
Earth Day, Public
awareness articles were
published by the leading
newspapers : DNA,
Hindustan Times and Mid-
day
On April 22, after publishing a special edition
of World Earth Day, special correspondence
was published for DNA, Hindustan Times and
Mid-Day newspapers.
April 2015 On account of World Earth
Day 22nd April, 2015, Public
awareness articles were
published by the leading
newspapers : Dainik
Samana, Sakal and Divya
Marathi
On the occasion of World Earth Day, special
issues of Environmental Publications were
published in the leading newspapers.
April 2015 Financial Assistance for
Photothon 2015
Photothon 2015 is an innovative competition
for photographers, wherein 24 hours are
allotted to photograph any environmental
issue and five photographs of which are
presented by the participants. Best
Photograph, Best Small Photograph and Best
Photographer were the special awards
presented to the winners. The competition
was held in March 2015 at Mahim Nature
Garden in Mahim, at 12.00 noon.
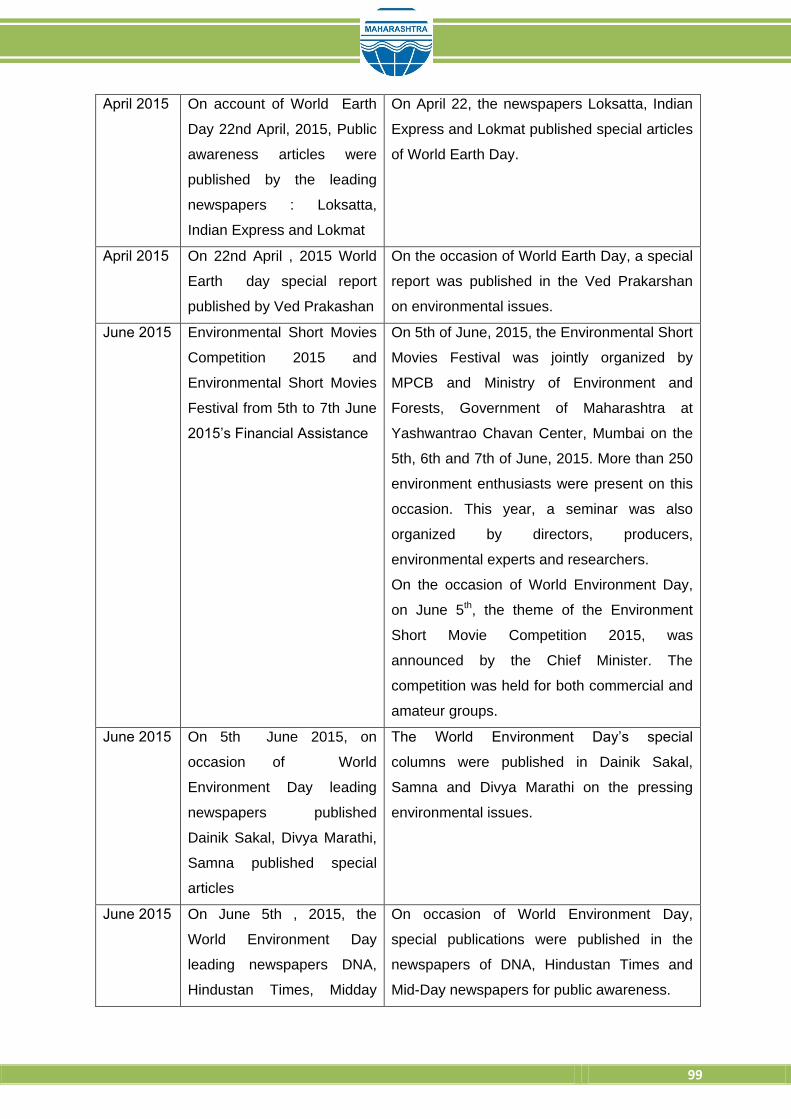
99
April 2015 On account of World Earth
Day 22nd April, 2015, Public
awareness articles were
published by the leading
newspapers : Loksatta,
Indian Express and Lokmat
On April 22, the newspapers Loksatta, Indian
Express and Lokmat published special articles
of World Earth Day.
April 2015 On 22nd April , 2015 World
Earth day special report
published by Ved Prakashan
On the occasion of World Earth Day, a special
report was published in the Ved Prakarshan
on environmental issues.
June 2015 Environmental Short Movies
Competition 2015 and
Environmental Short Movies
Festival from 5th to 7th June
2015’s Financial Assistance
On 5th of June, 2015, the Environmental Short
Movies Festival was jointly organized by
MPCB and Ministry of Environment and
Forests, Government of Maharashtra at
Yashwantrao Chavan Center, Mumbai on the
5th, 6th and 7th of June, 2015. More than 250
environment enthusiasts were present on this
occasion. This year, a seminar was also
organized by directors, producers,
environmental experts and researchers.
On the occasion of World Environment Day,
on June 5th, the theme of the Environment
Short Movie Competition 2015, was
announced by the Chief Minister. The
competition was held for both commercial and
amateur groups.
June 2015 On 5th June 2015, on
occasion of World
Environment Day leading
newspapers published
Dainik Sakal, Divya Marathi,
Samna published special
articles
The World Environment Day’s special
columns were published in Dainik Sakal,
Samna and Divya Marathi on the pressing
environmental issues.
June 2015 On June 5th , 2015, the
World Environment Day
leading newspapers DNA,
Hindustan Times, Midday
On occasion of World Environment Day,
special publications were published in the
newspapers of DNA, Hindustan Times and
Mid-Day newspapers for public awareness.

100
published public awareness
articles
June 2015 On June 5, 2015, the World
Environment Day, Loksatta,
Indian Express and Lokmat
newspapers published
special public awareness
articles
The editions of the Indian Express, Lokmat
and Loksatta on occasion of World
Environment Day published in the in which a
special one-pager for public awareness.
June 2015 Financial Assistance for
Bhamba Foundation by
Public awareness program
on 5th of June 2015, World
Environment Day
On 5th of June, 2015, on the occasion of
World Environment Day celebrations the We
Love India foundation organized
Environmental awareness program,
Environmental conveyances, Canvas
Paintings, Public awareness campaigns and
other activities at Bandra. In addition to the
participants of the program, celebrity movie
stars, sportspersons and Minister of State for
Environment graced the occasion.
June 2015 On 5th June 2015, World
Environment Day
Environment Club of India,
Pune’s Financial Donations
Financial assistance for environmental
awareness of World Environment Day was
granted by Environment Club of India, Pune.
Vasundhara Award distribution on the eve of World Environment Day 2015

101
World Environment Day Inauguration Programme (Participation of Hon’ble Shri. Ramdasji Kadam, Minister for Environment & Forest, GoM,
Hon’ble Shri. Pravin Pote – Patil, Minister for State Environment, GoM, Hon’ble Smt. Malini Shankar, principal Secretary, Environment Department, GoM,
Hon’ble Dr. P. Anbalagan, Member Secretary, MPCB in World Environment Day 2015 inauguration function held at Mumbai)
Short film award distribution by Hon’ble Shri. Ramdasji Kadam, Environment Minister, GoM on the eve of World Environment Day 2015 at Mumbai
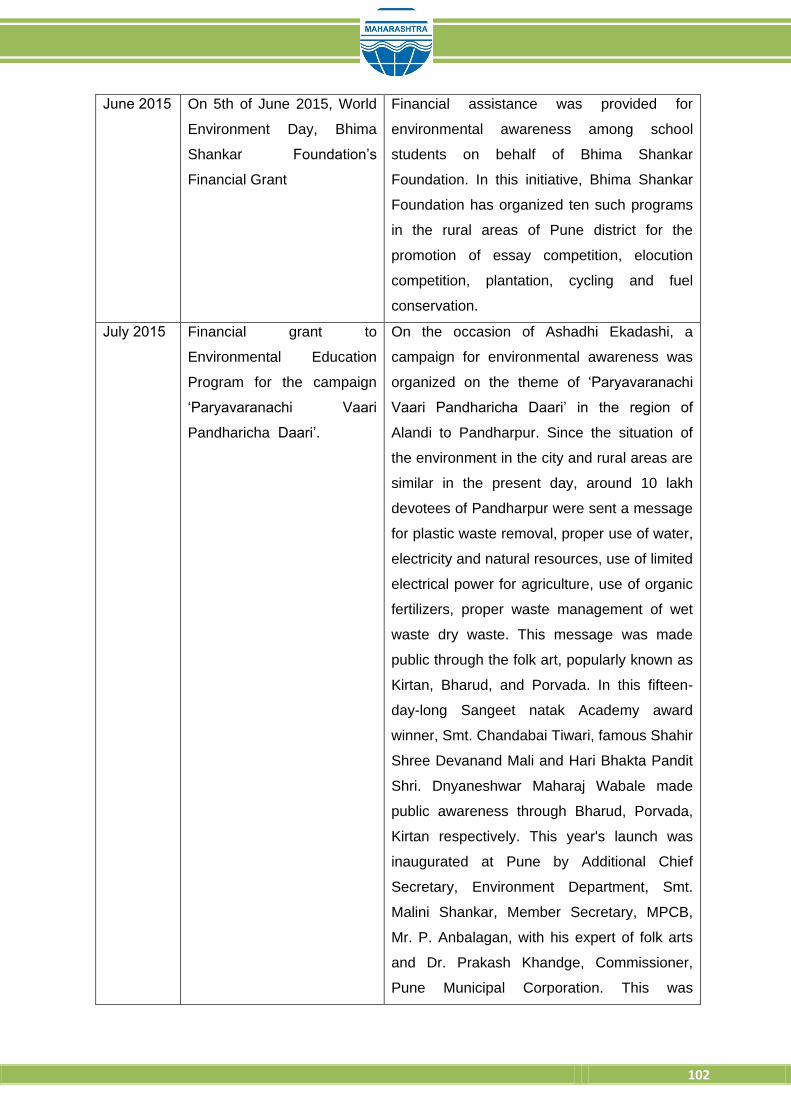
102
June 2015 On 5th of June 2015, World
Environment Day, Bhima
Shankar Foundation’s
Financial Grant
Financial assistance was provided for
environmental awareness among school
students on behalf of Bhima Shankar
Foundation. In this initiative, Bhima Shankar
Foundation has organized ten such programs
in the rural areas of Pune district for the
promotion of essay competition, elocution
competition, plantation, cycling and fuel
conservation.
July 2015 Financial grant to
Environmental Education
Program for the campaign
‘Paryavaranachi Vaari
Pandharicha Daari’.
On the occasion of Ashadhi Ekadashi, a
campaign for environmental awareness was
organized on the theme of ‘Paryavaranachi
Vaari Pandharicha Daari’ in the region of
Alandi to Pandharpur. Since the situation of
the environment in the city and rural areas are
similar in the present day, around 10 lakh
devotees of Pandharpur were sent a message
for plastic waste removal, proper use of water,
electricity and natural resources, use of limited
electrical power for agriculture, use of organic
fertilizers, proper waste management of wet
waste dry waste. This message was made
public through the folk art, popularly known as
Kirtan, Bharud, and Porvada. In this fifteen-
day-long Sangeet natak Academy award
winner, Smt. Chandabai Tiwari, famous Shahir
Shree Devanand Mali and Hari Bhakta Pandit
Shri. Dnyaneshwar Maharaj Wabale made
public awareness through Bharud, Porvada,
Kirtan respectively. This year's launch was
inaugurated at Pune by Additional Chief
Secretary, Environment Department, Smt.
Malini Shankar, Member Secretary, MPCB,
Mr. P. Anbalagan, with his expert of folk arts
and Dr. Prakash Khandge, Commissioner,
Pune Municipal Corporation. This was

103
organized on the eve of Ashadi Ekadashi
graced by the presence of Hon’ble Chief
Minister Devendra Fadnavis, Mrs. Amruta
Fadnavis, Guardian Minister of Solapur,
Mr.Vijay Deshmukh and other dignitaries.
Inauguaration of environmental awareness program based on theme “Paryavranchi
Vaari Pandharicha Daari”
A campaign for environmental awareness based on theme “Paryavranchi Vaari Pandharicha Daari”

104
June 2015 On 5th of June 2015
Financial Assistance for
Green Idea 2015 was
organized by Mumbai Tarun
Bharat and Samarth Bharat
Vyaspeeth
On the occasion of World Environment Day,
the event of 'Green Idea' was organized in
Thane with a joint venture of Mumbai Tarun
Bharat and Samarth Bharat Vyasapeeth,
Thane. Financial subsidy was provided by
MPCB for the event.
June 2015 On 5th of June, 2015 public
awareness articles were
published by the
newspapers Maharashtra
Times and Times of India
Public awareness messages were published
in all the editions of the Times of India and
Maharashtra Times on occasion of World
Environment Day.
August
2015
Financial Assistance for 92.7
BIG FM Big Green Ganesha
event
The 92.7 BIG FM and MPCB s organized Big
Green Ganesh in Mumbai city. In this initiative,
people were invited to organize the Big Green
Ganesha Van at various places in Mumbai
City and citizens were given an opportunity to
donate waste papers and newspapers for this
program. Ganesh idols were then made out of
this waste by 92.7 BIG FM radio channel. This
program was held in the Sahyadri State guest
house, in presence of Hon’ble Chief Minister
of Maharashtra, Shri. Devendra Fadnavis,
Minister of Environment, Shri Ramadasbhai
Kadam, Minister of State, Shri Pravin Potte
Patil, Additional Chief Secretary, Environment
Department, Mrs. Malini Shankar, Member
Secretary Dr. P. Anbalagan, 92.7 BIG FM
Director Mr.Tarun Katiyal wherein school
children were donated the waste newspapers
who made the eco-friendly Ganesh Murtis . At
the same time, exhibition of eco-friendly
Ganesh murti was also organized. A special
studio was set up in the city of Lalbagh in
Mumbai city for a total of 10 days in Ganesh
Festival. During this time, the Chief Minister,
the Minister of Environment, Minister of State
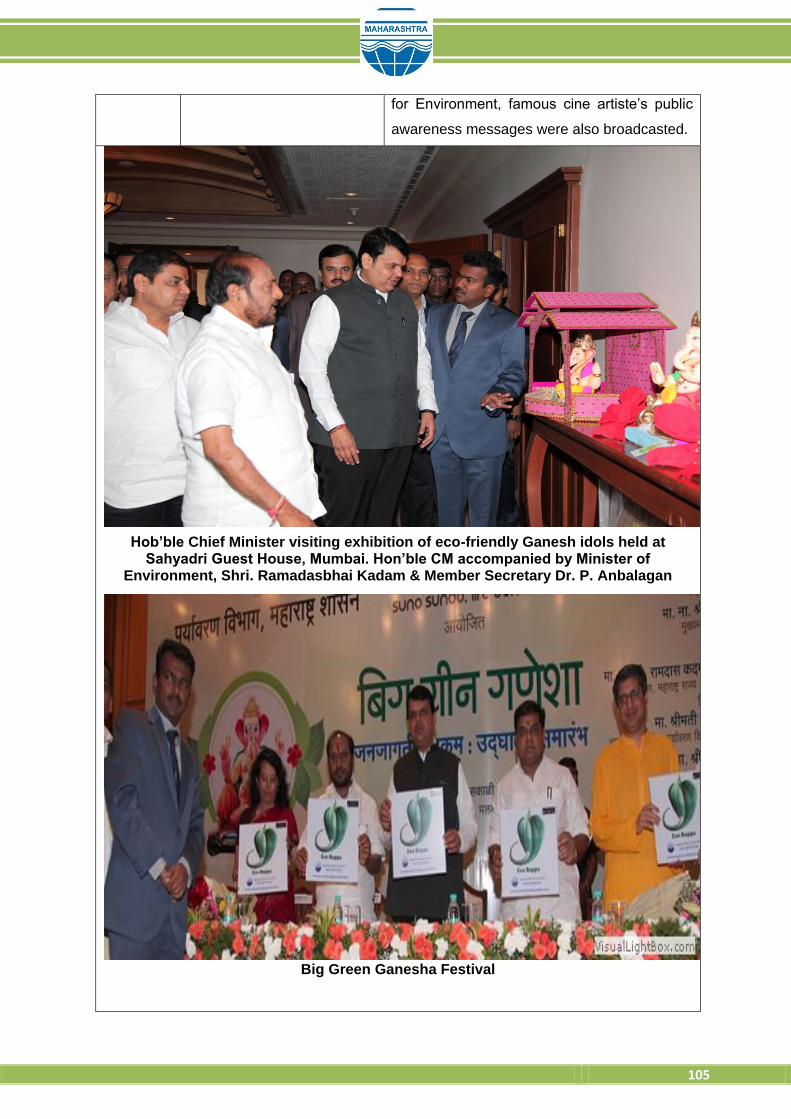
105
for Environment, famous cine artiste’s public
awareness messages were also broadcasted.
Hob’ble Chief Minister visiting exhibition of eco-friendly Ganesh idols held at Sahyadri Guest House, Mumbai. Hon’ble CM accompanied by Minister of
Environment, Shri. Ramadasbhai Kadam & Member Secretary Dr. P. Anbalagan
Big Green Ganesha Festival

106
August
2015
Eco-Friendly Ganeshotsav
Financial grants by ZEE 24-
TAAS
The State-level competition for domestic Eco-
Friendly Ganeshotsav Competition 2015 was
organized in association with MPCB and ZEE
24-TAAS. More than 700 participants
participated in this competition. The event was
presented in the presence of Hon’ble Minister
Shri Ramadasbhai Kadam, Additional Chief
Secretary of Environment, Mrs. Malini
Shankar, and Member Secretary of the Board
of Directors Mr. P. Anbalagan. The special
program for this project was broadcasted.
August
2015
Eco-Friendly Ganeshotsav
Financial grants by ABP-
MAZA
On behalf of MPCB and ABP MAZA News
channel, eco-friendly Ganeshotsav was
celebrated in the housing societies of the
major cities of the State, for which a special
campaign was organized. The special
broadcast was broadcasted in the news of this
channel on the occasion of Ganeshotsav
celebrated in the housing societies of Mumbai,
Pune, Nashik and Nagpur. At this time special
talk shows were organized for half an hour by
ABP MAZA channel. In addition to this,
Adinath Kothare, a popular Marathi filmmaker,
and Urmila Kanetkar, promoted this for
organizing eco-friendly Ganesh Utsav in the
entire State. The winners of the competition
were awarded certificates by MPCB and
Bappa’s Prasad at their homes. Both the
artists also visited the HQ of MPCB. The
special story was broadcasted on ABP MAZA
VAHINI.
August
2015
Financial grant for the Eco-
friendly domesti Ganesh
Festival 2015, organized by
Loksatta and MPCB
Eco-friendly domestic Ganeshotsav
decoration competition was organized jointly
by MPCB and Loksatta at six-divisional level
of Loksatta daily in Mumbai, Pune, Nashik,

107
Nagpur, Ahmednagar and Aurangabad. More
than 2000 participants participated in this
competition. In this competition, the prize
distribution ceremony was held in the
presence of the Minister of State of the
Environment, Additional Chief Secretary,
Environment Department, Mrs. Malini Shankar
& Member Secretary, Dr. P. Anbalagan. It was
published in the Loksatta newspaper.
August
2015
Eco Friendly Ganesh Utsav’s
Financial Grant by UFO
Digital Movies
Messages from the Marathi and Hindi film
industry artiste to celebrate Eco-friendly
Ganesh Festival were broadcasted for two
weeks in 205 digital cinemas in the entire
State.
August
2015
Financial Assistance for Eco
Friendly Ganeshotsav by
Lokmat-Marathi
A one page supplement was published by the
Lokmat Mumbai newspaper to celebrate Eco-
Friendly Ganesh Festival
August
2015
Eco Friendly Dahi Handi
2015
The Eco Friendly Dahihandi Festival 2015 was
organized in association with the IDEAL Book
Company and the MPCB. In this program,
awareness campaign was organized to
increase awareness about noise pollution in
association with famous Marathi film industry
artists wherein a rally was organized in an
open-deck BEST bus. On the day before Dahi
Handi, street artists also performed street
plays in Dadar and Lalbagh area, while on the
day of Dahi handi the rally was organized in
the presence of famous artists of Zee TV and
E-TV. The handi was broken near Chhabildas
High School in Dadar, in presence of famous
cine & TV artists and MPCB officials.
August
2015
Public Awareness for Eco-
Ganesha Program organized by
Dainik Sakal and MPCB
Dainik Sakal and MPCB collaborated to spread
awareness of celebrating eco-friendly Ganesh
festival by was publishing this message in the daily
edition of the Dainik Sakal.

108
Marathi film celebrities participated in Eco-Friendly Dahi Handi event held at Lalbaug, Mumbai during August 2015
Figure 6.13 Eco Friendly Dahi Handi Event
August
2015
Public Awareness for Eco-
Ganesha Program organized
by DNA and MPCB
DNA and MPCB has organized Eco- Ganesh
idol in the selected mall of Mumbai city based
on the auspicious tribute to celebrate the eco-
friendly Ganesh festival. In this initiative of the
DNA, the MPCB was involved as a co-

109
coordinator. Famous actors from Hindi film
industry were involved in this program. The
prize ceremony was held in the presence of
the Public Relations Officer
August
2015
Financial Assistance to
Times Green Ganesha as a
Public Awareness Program
Eco Green Ganesha was organized in
association with MPCB, Environment
Department, Maharashtra Government and
Times of India Group. Eco-friendly Ganesh
competition was organized for Sarvajanik
Ganeshotsav Mandal and Housing Societies
in Mumbai city. In this campaign, a public
awareness program was organized at various
malls, cinema theaters in Mumbai city for Eco-
friendly Ganesh idols, a Eco Ganesh idol
workshop was organized for schools students
and cleaning the Visarjan sites at Girgaum
Chowpatty, Juhu Beach and Versova beach,
during Ganesh Visarjan. This initiative was
inaugurated at Lala Lajpat Rai School in the
presence of popular actors. The film was
produced by a The Times of India for
spreading these messages which was
publicized for 15 consecutive days.
August
2015
Eco-Ganeshas awareness
campaign organized by
Dainik Samana and MPCB
In association with the Daily Samana, the eco-
friendly public Ganeshotsav competition was
organized at the centers of Mumbai, Pune and
Aurangabad. The event was presented in the
presence of Hon. Minister Shri Ramdasbhai
Kadam, Additional Chief Secretary of
Environment, Mrs. Malini Shankar and
Member Secretary of the Board of Directors
Mr. P. Anbalagan.
August
2015
Financial grant for displaying
awareness messages on
eco-friendly Ganesh Utsav
on Times OOH! BEST Bus
Public awareness message was displayed for
a period of 15 days on the bus stand of the
BEST bus stops in the city of Mumbai to
celebrate Ganesh Utsav. This message was

110
Stop Shelter published on the total of 70 bus stops.
October
2015
Governor’s Now Magazine’s
Public Awareness Message
Governor’s Now Magazine published a special
edition of the State government for completing
a year. Environment awareness messages
were published in the articles.
November
2015
Diwali UFO Digital Cinema
Public awareness message
UFO Digital Movies’ message with Marathi
and Hindi film industry artists to celebrate eco-
friendly Diwali were broadcasted for two
weeks in 205 digital cinemas in the State.
November
2015
Diwali Innovation Set
An innovative Diwali set was created to
celebrate the pollution-free Diwali on Diwali
Festival 2015. The Diwali set included Diwali
gift card, Four Pantya, Vati, Aromatic essence,
Rangoli of five colors, white rangoli, rangoli
mesh and Rangoli template papers, fragrant
soaps, small calendars. Similarly, a beautiful
box was prepared for the commodity and the
name of the Maharashtra Pollution Control
Board and public awareness messages were
inscribed. The Diwali sets were distributed
among all the ministers in the ministry, all
secretaries , CMO’s officials / employees,
officers / employees of the Environment
Department, the MPCB Headquarters in
Mumbai and Regional Offices of Thane,
Raigad, Navi Mumbai, Kalyan and centralized
laboratory ‘s officers/employees and also to
important government offices in Mumbai city.
The program was first of its kind by MPCB.
November
2015
Public awareness message
of Diwali on TV
Chief Minister, Minister of Environment,
Minister of State for Environment’s message
of "Celebrate pollution free Diwali" was
broadcasted in the channels: ZEE 24 TAAS,
ABP MAZA, IBN Lokmat, Star PRAVAH, Mi
Marathi, TV9 Maharashtra, Sam TV,

111
Jayamaharashtra, etc.
November
2015
Diwali FM Radio Public
awareness Message
The message of public awareness of the Chief
Minister, Minister of Environment, Minister of
Environment, environment minister,
"Celebrate pollution-free Diwali" was
broadcasted on FM radio channels.
November
2015
Diwali Bus Stop Nagpur The message of the Chief Minister, Minister of
Environment, Minister of Environment,
Minister of Environment, "Celebrate pollution-
free Diwali" was published for a period of 15
days at a 50 lit bus stops in Nagpur city.
November
2015
Diwali TIMES OOH! Bus
Stop Mumbai
Chief Minister, Minister of Environment,
Minister of State for Environment, Minister of
State for Information’s message of "Celebrate
pollution free Diwali", was published for a
period of 15 days at 70 lit and non-lit bus
stops in the city of Mumbai.
November
2015
Mumbai Doordarshan
Dipotsav
To celebrate pollution free Diwali, Sahyadri
channel of Mumbai Television had presented
a special program for five days in order to
preserve the richness of Diwali. In this
program, the message from Chief Minister,
Environment Minister, and Minister of State for
Environment for a pollution-free Diwali was
disseminated.
November
2015
Publishing Diwali Magazine
Issue 2016 for
Environmental Awareness
In the selected Diwali magazine issue, the
people of the State were spread messages of
celebrating eco-friendly Diwali
December
2015
Mi Kanjurkar Pratishthan-
Environmental Public
awareness program
A festival showing the identity of the culture of
Konkan was organized by Mi Kanjarkar
Pratishthan. The program was attended by
MPCB officials as an awareness program for
the environment and pollution in Konkan.
March
2016
Ecofolks Green Theater
Festival, Inter School
Theater Competition in
Green Theater Festival, an Inter-School
Drama Competition was organized jointly by
Ecofolks and MPCB. The competition was

112
Mumbai Pune, Aurangabad,
Kolhapur, Nagpur and
Nashik
organized in Mumbai, Pune, Nagpur,
Aurangabad, Kolhapur and Nashik. This
competition was held in two rounds, viz
.primary round and final round. The primary
round was held also in Latur, Nanded for the
Aurangabad division. More than 300 schools
took part in this competition.
March
2016
Public awareness message
on television shows for eco-
friendly Holi festival
For celebration of eco-friendly Holi festival
2016, the message by acclaimed artists' in
Marathi and Hindi films public in interest was
broadcasted over the leading television
channels of the State.
March
2016
To disseminate public
messages from FM channels
for Holi festival-2016
Public awareness songs were broadcasted in
the State for eco-friendly Holi celebrations in
2016 by leading FM radio channels of the
State.
March
2016
Eco--friendly Holi messages
on bus stop shelters in
Nagpur city
Public awareness messages were published
on 50 bus stations in Nagpur city to celebrate
eco-friendly Holi.
March
2016
Financial grant for Photothon
2016
Photothon 2016 is an innovative competition
for photographers, in which five photographs
are presented which are clicked in 24 hours
on any environmental issue. Best Photo, Best
Small Photo and Best Photographer were the
Special Awards for the winners. The
competition was held in March 2016 at Mahim
Nature Garden in Mahim, at 12.00 noon. The
prize distribution ceremony was held at the
main function of World Environment Day.
March
2016
Holi public awareness
messages on environment
by TIMES OOH! on BEST
bus stop shelters
Public awareness messages were published
on eco-friendly celebration of Holi on 70 Bus-
stops in Mumbai city.

113
10.0 IMPLEMENTATION OF ACTS & RULES UNDER ENVIRONMENT PROTECTION
ACT, 1986
Maharashtra Pollution Control Board (MPCB) is implementing various environmental
legislations in the Maharashtra, mainly including Water (Prevention and Control of Pollution)
Act, 1974, Air (Prevention and Control of Pollution) Act, 1981, Water (Prevention and Control
of Pollution), Cess Act, 1977 and some of the provisions under Environmental (Protection)
Act 1986. MPCB is functioning under the administrative control of Environment Department
Govt. of Maharashtra. List of various Acts & Rules implemented by MPCB is as follows:
1. Water (Prevention & Control of Pollution) Act, 1974
2. Air (Prevention & Control of Pollution) Act, 1981
3. Maharashtra Water (Prevention & Control of Pollution) Rules, 1983
4. Maharashtra Air (Prevention & Control of Pollution) Rules, 1983
5. Maharashtra Biodegradable & Non-biodegradable Waste (Control) Act, 2006 and
Maharashtra Plastic Carry Bags (Production & Usage) Rules, 2006
6. Environment (Protection) Act, 1986 and Rules & Amended Rules made thereunder,
which are as follows:
i) The Environment (Protection) Rules, 1986 and Environment (Protection)
Amendment Rules, 2016
ii) The Hazardous & Other Wastes (Management & Transboundary Movement)
Rules, 2016
iii) The Bio-Medical Waste (Management) Rules, 2016
iv) The Solid Waste (Management) Rules, 2016
v) The Construction & Demolition Waste (Management) Rules, 2016
vi) The Plastic Waste (Management) Rules, 2016
vii) The E-waste (Management) Rules, 2016
viii) The Manufacture, Storage and Import of Hazardous Chemicals Rules, 1989
ix) The Plastic Manufacture, Sale and Usage Rules, 1999
x) The Noise Pollution (Regulation & Control) Rules, 1999
xi) The Batteries (Management & Handling) Rules, 2001
xii) The Wetlands (Conservation & Management) Rules, 2010
xiii) Notifications:
a. Environment Impact Assessment Notification, 2006
b. Coastal Regulation Zone Notification, 2011

114
11.0 PROSECUTIONS LAUNCHED & CONVICTION SECURED
11.1. Status of Legal Enforcement Upto March, 2016
I) Status of cases filed before Trial Courts
A) Name of the Act No. of cases
filed No. of cases disposed off
No. of cases pending
1. Water (Prevention & Control of Pollution) Act, 1974
464 400 64
2. Air (Prevention & Control of Pollution) Act, 1981
149 149 NIL
3. Environment (Protection) Act, 1986 & Rules made thereunder
264 25 239
II) Status of Writ Petitions / PILs filed before Hon’ble High Court of Judicature at
Bombay Bench at Mumbai/Aurangabad/Nagpur
Sr. No.
No. of Writ Petitions/PILs filed
No. of Writ Petitions/PILs disposed off
No. of Writ Petitions pending
1 893 438 455
III) Status of cases before the Hon’ble Supreme Court of India
Sr. No.
No. of Special Leave Petitions filed
No. of Special Leave Petitions
disposed off
No. of Special Leave Petitions pending
1 69 38 31
IV) Status of Appeal/Application filed before the National Green Tribunal, New Delhi and Pune
Sr. No.
No. of Appeals / Applications filed
No. of Appeals / Applications disposed off
No. of Appeals / Applications pending
1 290 126 164
11.2. Maharashtra Right to Information Act, 2005
The said Act provide for setting out the practical regime of right to information for citizens to
secure access to information under the control of public Authorities, in order to promote
transparency and accountability in the working of every public authority, the constitution of a
Central Information Commission and State Information Commission and for matters
connected therewith or incidental thereto.

115
There were 32 applications pending from April, 2015 to March, 2016. The Board received 32
Applications under Section 6(1) of the Maharashtra Right to Information Act, 2005 during the
year. Out of these applications, 25 were disposed off and 7 applications were pending upto
March, 2016.
Being aggrieved by the order passed by the Public Information Officer, the One Appeal was
preferred by the Appellant under Section 19(1) of the Maharashtra Right to Information Act,
2005 before the Appellate Authority from April, 2015 to March, 2016. One Appeal was
disposed off and no Appeals were pending upto March, 2016.

116
12.0 FINANCE AND ACCOUNTS
Annual Accounts of Maharashtra Pollution Control Board for the Financial Year 2015-16 are
prepared as per section 40 of the Water (P&CP) Act, 1974 and as per the guidelines given in
the Water (P&CP) Rule 1983, in the form Receipt & Payments, Income & Expenditure and
Balance Sheet along with schedule of Fixed Assets.
The Comptroller & Auditor General of India (CAG) has allotted the statutory audit work of
Board to M/s. Om Prakash S. Chaplot & Co., Chartered Accountant. The final Audit of
Accounts was done by M/s. Om Prakash S. Chaplot & Co., Chartered Accountant for the
Financial Year 2015-16.
The Audited Final Accounts submitted to the Board for approval & adoption. After approval
of the Board same will be submitted to Environment Department, Govt. of Maharashtra and
Account General Maharashtra.
The gist of annual Receipts and Payment Accounts, Income & Expenditure Accounts and
Balance Sheet for the year 2015-16 is given in this chapter.
A) Total Income of Board for the year 2015-16 is Rs. 394.67Crores.
1. Consent Fees Rs. 262.02Crores
2. Analysis Charges Rs. 11.13Crores
3. Interest on Investment Rs. 90.07Crores
4. Reimbursement of Cess Rs. 19.90Crores
5. Other Income Rs. 11.55Crores
B) Total Expenditure of Board for the year 2015-16 is Rs. 76.87Crores.
1. Salary Expenditure Rs. 30.42Crores
2. Expenditure from Cess Rs. 3.38Crores
3. Expenses on Projects from Cess Fund Rs. 13.67Crores
4. Office Administration Expenditure Rs. 24.21Crores
5. Capital Expenditure Rs. 5.19Crores
C) Investment in Fixed Deposits as on 31.03.16 Rs. 1281.25 Crores. Details of accounts for the year 2015-16 are attached as Annexure 6.

117
13.0 IMPORTANT MATTERS DEALT WITH BY THE BOARD
I. The MoEF&CC had published the CEPI index in which it was mentioned that the
pollution level in Chandrapur city was on higher rank. Board has prepared
Chandrapur Action Plan to control air pollution in the Chandrapur district and it is
under implementation
II. The MoEF&CC had published the CEPI index in which it was mentioned that the
pollution level in Navi Mumbai, Dombivali and Kalyan city was on higher rank. Board
has prepared Chandrapur Action Plan to control air pollution in the Chandrapur
district and it is under implementation
III. The representative of NEERI and IIT Bombay has been appointed for preparation of
Wani Action Plan to reduce pollution level of Wani area. The joint survey was carried
out by the representative NEERI, IIT Bombay and MPCB officials for evaluation of
pollution potential and preparation of Wani Action Plan is under progress
IV. For the estimation of air pollutant, preparation of baseline air quality monitoring data
for preparation of action plan and ensure effective implementation of Air Acts,
increased monitoring of air samples
V. Coal washery industries have been directed for effective implementation of
guidelines so as to reduce water/air pollution
VI. Thermal Power plants, Sponge iron industries and steel industries have been
instructed to use washed coal with ash content lower than 34%, to adopt clean
technology and to comply the MoEF&CC Notification about the same
VII. Draft guidelines to avoid air pollution problems for traditional brick manufacturing
units prepared by this section. The guidelines are under process for approval and
publication from Environment Department
VIII. Draft guidelines for Railway siding to avoid air pollution problems prepared by this
section. The guidelines are under process for approval and publication from
Environment Department
IX. Online application & payment for Consent Certificates; Dedicated Web Portal
“ecMPCB” launched which facilitates Online acceptance of consent applications and
online processing including online payment gateway and delivery of consents
through a dedicated Web Portal
X. Consent licenses are issued and renewed for a minimum period of 5 years/ terms
XI. Randomized Risk Based Inspection for industries; Effective from Nov., 2015 all
inspection are as per Risk Based Randomized Method, which brings in total
transparency and eliminates discretion

118
XII. Become the 1st State to notify a comprehensive Enforcement policy for environmental
compliances
XIII. Policies for regulation of tyres for end of life cycle process (Tyre Pyrolysis), Ready
Mix Concrete Plants, Railway Sidings and Brick Kiln etc.
XIV. The Consents granted is increased from 12088 (2014-15) to 15084 (2015-16)
including 983 consents through Consent Committee and 919 through Consent
Appraisal Committee
XV. MPC Board has scored 92 out of 100 in implementation of DIPP's Ease of doing
business reforms and topped 1st amongst all the Departments in Maharashtra The
special efforts in implementation of reforms for Ease of Doing Business under Make
in Maharashtra programme is well appreciated by the Hon'ble Chief Minister of
Maharashtra and Minister for Industries, Govt. of Maharashtra by giving "Certificate
of Appreciation" to the Member Secretary, MPCB
XVI. Arranging technical discussions and seminars to create awareness among metal and
mining industries to adopt cleaner technologies
XVII. To avoid air pollution problems, the Board has informed to all thermal power plants to
use coal as fuel having ash contain less than 34% and implementation of MoEF&CC
Notification about the same
XVIII. To avoid air pollution problems, the Board has informed to all thermal power plants
for the implementation of MoEF&CC Notification dated 03.11.2009 & 25.01.2016 of
utilization of fly ash in the construction projects, in the brick manufacturing unit & in
cement industry
XIX. To lessen effect of temperature rise and adverse effect of PM2.5, the Board is
encouraging industries and various organizations for tree plantations, use of
renewable energy resources by giving rewards on 5th June every year
XX. The Board had initiated auto renewal of Consent for the plain renewal of Consent for
industries which will submit a self-certification of environmental regulations.
Presently, all consent applications for establish, first operate, expansion and plain
renewals are considered uniformly by the Board, through the delegation of powers
defined under consent management scheme. With the increased number of
industries and also, the requirements of industries for amendment for products and
expansion, the work load on MPCB for consent management has increased
significantly. This additional workload of consent management has decreased scope
of activities of the Board and the limited available manpower, thereby resulting in
delay in grant of consents at various levels. The regulations provide four months’
time to MPCB for consideration of consent application and it has been observed that
the time taken for Consent management is exceeding this time frame in many cases,

119
which may attract 'Deemed consent* provisions. Therefore, it is decided to accept
applications henceforth for Auto-Renewal of Consent to Operate of all the Red,
Orange & Green Category industries along with Self-Certification and Commitment
letter, and grant auto-renewal as per the delegation of power within stipulated time
period without any delay.
The key features of this scheme are as under:
a. This scheme will be applicable for all the industries under Red Orange & Green category
b. The auto renewal of consent will be applicable when there is no increase in overall
production capacity and also, in pollution load
c. This scheme is applicable, only in case if there is marginal increase (upto max 10%) in
the capital investment which is due to infrastructure development clean technology,
pollution control system and better production management, without increase in
production or pollution load, the industry shall submit corresponding fees for consent to
establish and also difference in consent to operate fees since the blocks year the capital
investment is made on pro-rata basis
d. In case, if there is increase in Capital investment by over 10% then the application for
grant of renewal of Consent under Auto-renewal Policy will not be considered. The
industry needs to apply in prescribed consent application form
e. In case, if the capital investment is decreased, then the application for grant of renewal
of Consent under Auto-renewal Policy will not be considered. The industry needs to
apply in prescribed consent application form
f. For the auto-renewal, industries under purview of CC/CAC shall submit format of self-
certification on compliances of earlier Consent conditions duly signed by person
authorized by Company's Board and shall submit the copy of the said Resolution along
with the prescribed fees at SRO/RO Offices
g. For the auto-renewal of industries other than CC/CAC purview, industry shall submit
format of self-certification on compliances of earlier Consent conditions duly signed by
the Board of Directors/ Partners/ Proprietor/ Unit Head of the industry along with the
prescribed fees at SRO/RO Offices and, also industry shall submit Commitment towards
compliance of the Consent conditions & the Environmental Laws in prescribed format
h. The auto renewal can be availed for the period of five Years for Red category of
industries and for a minimum period of Six Years & maximum period of five terms for
Orange & Green -3 Category of industries excluding Sugar industries as per Board's
Circular dtd. 03/12/2015 regarding grant of renewal of Consent to Operate subject to
payment of requisite fees
i. The industry shall submit it in prescribed format along with the prescribed fees either at
MPCB HQ or RO/SRO offices. In case, the application is submitted at RO/SRO offices,

120
RO/SRO shall ensure that the same shall be forwarded to HQ within 3 days along with
details of fees paid and DD details and DR details. The renewal will be reflected in
MPCB website within 7 days
XXI. It is observed that most of the information contained in the application form like
details of Hazardous Waste / Chemicals, Applicability of Environmental Clearance
etc. is not related to the Green Category of industry and it confuses small
entrepreneurs while filling application hence it has been decided to simplify consent
procedure for green category. The CAC in its meeting held on 24/06/2015 had
decided to introduce Simplified Consent application form for obtaining Consent for
'Green' category of industries with the approval of the Environment Dept. Also, Board
in its 165th meeting held on 14/10/2015 had approved Simplified Consent application
form for Green category of industry subject to approval of GoM. Environment
Department, GOM vide letter No. SEAC-2016/C.R.-11/TC-2 dtd. 11/02/2016 had
approved draft of Simplified Consent Application form for Green Category industry.
Hence, for the ease of doing business, it has been decided to adopt Simplified
Consent application form for Green Category industry and it is directed to accept
Simplified Consent application form for Green Category industry.
XXII. Central Pollution Control Board has issued modified directions dated 07/03/2016
regarding classification of industries into Red/Orange/Green/White depending on
pollution potential of industry in which IT/ITES Park is not included in any category.
But, Industry which have installed D.G Set of capacity greater than 5 MVA with
average running 12 Hrs/Day is categorized as ‘Red’ Category industry which have
installed D.G Set of capacity greater than 1 MVA and less that 5 MVA is categorized
as ‘Orange’ Category. Boards, categorization committee's decision dated 01.11.2015
to consider IT /ITES in Green category was reviewed in the Consent Appraisal
Committee's meeting held on 27.04.2016 & policy decision was taken to categorize
the IT & ITES industries /park depending on pollution potential based upon CPCB's
modified direction dated 07.03.2016 regarding classification of industries and it has
been classified as below by issuing circular dated 26.05.2016;
Green : up to 1000KVA
Orange : >1000KVA & < 5000KVA
Red : >5000KVA
XXIII. As per the Hon’ble National Green Tribunal’s order dated 15.10.2015,Board has
amended the consents of the coal based thermal power plants and coal mines by the
incorporation of the conditions for implementation of MOEF&CC Notification dated
02.01.2014 for use /supply of coal having ash contents less than 34%.

121
Board has amended the consents of the coal based thermal power plants and coal
mines by the incorporation of the conditions for implementation of MOEF&CC
Notification dated 03.11.2009 about utilization of the Fly ash for the construction
projects, cement industries and brick manufacturing units, etc.
XXIV. For the preparation of the action plan to reduce pollution levels in the Aurangabad,
Chandrapur and Kalyan area seminars were conducted with the stack holders.
To reduce depletion of ozone layer, Board organize “Ozone” day program to create
awareness along peoples to discontinue use of ozone depleting materials. Also,
acted towards making policy for restricting industrial use of Ozone depleting
substances

ANNEXURE

ANNEXURE 1A – ORGANISATIONAL STRUCTURE
ABBREVIATIONS:
APAE- Air Pollution Abatement Engineer,
WPAE - Water Pollution Abatement Engineer,
AST - Assistant Secretary (Technical),
RO (HQ) - Regional Officer (Head Quarter),
CAO - Chief Accounts Officer,
EIC - Environmental Information Center

ANNEXURE 1B – FIELD OFFICE CHART
ABBREVIATIONS: SRO: Sub Regional Officer RO: Regional Officer

ANNEXURE 2 - STAFF STRENGTH AS ON 31/03/2016
Sr.No. CADRE SANCTIONED FILLED IN VACANT
I A-TECHNICAL
1 Water Pollution Abatement Engineer
1 1 0
2 Air Pollution Abatement Engineer
1 1 0
3 Asst=Secretary (Technical) 1 1 0
4 Executive Engineer 1 1 0
5 Regional Officer 14 9 5
6 Sub-Regional Officer 53 38 15
7 Deputy Engineer 1 0 1
8 Field Officer 206 177 29
9 Statistical Officer 1 1 0
10 Statistical Assistant 1 1 0
11 Draughtsman 1 0 1
12 Field Inspector 42 12 30
13 Asst. Draughtsman 2 0 2
14 Tracer 6 2 4
15 Electrician 2 1 1
16 Instrument Fitter 1 1 0
TOTAL 334 246 88
Sr.No. CADRE SANCTIONED FILLED IN VACANT
II B-LEGAL
1 Senior Law Officer 2 0 2
2 Law Officer 2 1 1
3 Asst.Law Officer 3 2 1
4 Legal Assistant 4 2 2
TOTAL 11 5 6
Sr.No. CADRE SANCTIONED FILLED IN VACANT
III C-SCIENTIFIC
1 Princiipal Scientific Officer 1 1 0
2 Senior Scientific Officer 3 1 2
3 Scientific Officer 9 6 3
4 Junior Scientific Officer 26 23 3
5 Junior Scientific Asst. 40 32 8
6 Laboratory Asst. 7 6 1
TOTAL 86 69 17

Sr.No. CADRE SANCTIONED FILLED IN VACANT
IV D- Accounts & Administration
1 Chief Accounts Officer 1 1 0
2 Senior Administrative Officer 1 1 0
3 Material Officer 1 0 1
4 Private Secretary 2 1 1
5 Accounts Officer 2 1 1
6 Administrative Officer 1 0 1
7 Asst. Secretary 1 0 1
8 Asst. Accounts/Admin Officer 11 7 4
9 Head Accountant / O.S. 20 14 6
10 Senior Clerk 50 41 9
11 Junior Clerk 64 61 3
12 Senior Steno 5 5 0
13 Junior Steno 27 16 11
14 First Clerk 17 12 5
15 Daftari 14 6 8
16 Drivers 74 62 12
17 Roneo Operator 1 0 1
18 Naik 2 0 2
19 Chowkidar 20 13 7
20 Peons 88 55 33
21 Sweeper 3 3 0
TOTAL 405 299 106

ANNEXURE 3 - DETAILS OF REGIONAL & SUB-REGIONAL OFFICES WITH THEIR JURIDISCTIONS
Sr No
Regional Office Address Jurisdiction Phone Fax
1 Amravati
18/25, Aashirwad building, Daffrin Hospital Road, Shree Kurshn Peth, Amravati-444601
Amravati, Akola, Buldhana, Vashim and Yavatmal district.
0721-2563594, 0721-2563592
0721-2563597
Sub-Regional Offices
i S.R.O. Amravati I
18/25, Aashirwad building, Daffrin Hospital Road, Shree Kurshn Peth, Amravati-444601
Amravati district. 0721-2563593
0721-2563593
ii S.R.O. Amravati II
18/25, Aashirwad building, Daffrin Hospital Road, Shree Kurshn Peth, Amravati-444601
Vashim District. 0721-2563594
0721-2563592
iii S.R.O. Akola
Sub-Regional Office, Akola Opp. Vijay Smruti, Mahashabde Hospital, Birla Road, Ramdas Peth, Akola-444001.
Akola and Buldhana District.
0724-2442344
0724-2442344
2 Aurangabad
Paryavaran Bhavan, A - 4/1, MIDC Area , Chikalthana, Near Seth Nandlal Dhoot Hospital, Jalna Road , Aurangabad - 431 210
Aurangabad, Jalna, Parbhani, Hingoli, Nanded, Beed,Latur
0240 - 2473462
0240 - 2473461
Sub-Regional Offices
i S.R.O.Aurangabad I
Paryavaran Bhavan, A - 4/1 , MIDC Area , Chikalthana, Near Seth Nandlal Dhoot Hospital , Jalna Road , Aurangabad - 431 210
Aurangabad district.
0240 - 2473463
0240 - 2473462
ii S.R.O.Jalna
Sub-Regional Office, Jalna, plot no. p 3/1 and p 3/2, Jalna Aurangabad Road, Hotel Aadarsh place, MIDC Colony
Jalna and Beed. 02482 - 220120
02482 - 220120

iii S.R.O.Latur Dev Towers, Opposite Tahsil Office, Latur - 413512
Latur, Osmanabad district.
02382 - 252672
-
iv S.R.O.Nanded
Sub-Regional Office, Nanded H no. 1/1/353, Jelevar Complex, Paidewadi road, Nanded - 431602
Nanded distritct. 02462 - 242492
02462 - 242492
v S.R.O.Parbhani
Devkripa Building, Rangnath Maharaj Nagar, Nandkheda Road, Parbhani - 431401
Parbhani, Hingoli, distritct. Tal - Parli-Vaijyanath
02452 - 226687
-
3 Kalyan
Maharashtra Pollution Control Board, Sidhivinayak Sankul,3rd and 4th Floor, Station Road,KalyanD(West)
Kalyan, Bhiwandi, Ulhasnagar, Badlapur, Wada Murbad and Shahapur talukas of Thane District.
0251-2027343 0251-2310212
0251-2310192
Sub-Regional Offices
i S.R.O. Kalyan I
Maharashtra Pollution Control Board, Sidhivinayak Sankul, 3rd and 4th Floor, Station Road, Kalyan (West
Kalyan, Bhiwandi taluka .
0251 - 2310167
-
ii S.R.O. Kalyan II
Maharashtra Pollution Control Board, Sidhivinayak Sankul, 3rd and 4th Floor, Station Road, Kalyan (West)
Ulhasnagar , Badlapur 0251 -
2310167 -
taluka .
iii S.R.O. Kalyan III
Maharashtra Pollution Control Board, Sidhivinayak Sankul, 3rd and 4th Floor, Station Road, Kalyan (West)
Wada , Murbad, Shahapur Taluka
0251 - 2310167
-
iv S.R.O. Bhiwandi
Maharashtra Pollution Control Board, Sidhivinayak Sankul, 3rd and 4th Floor, Station Road, Kalyan (West)
Sarvali MIDC and Bhiwandi District
0251 - 2310167
-
4 Kolhapur
Maharashtra Pollution Control Board, Udyog Bhavan Building, Near Collectarate Office, Kolhapur - 416 002
Sangli, Kolhapur and Sindhudurga district.
0231-2652952 0231-2660448
0231-2660448

Sub-Regional Offices
i S.R.O. Kolhapur
Udyog Bhavan Building , Near Collectarate Office, Kolhapur district.
0231 -2652952
0231 - 2660448
Kolhapur-416 002
ii S.R.O. Sangli
300/2 , Udyog Bhavan , Near Government
Sangli district. 0233 - 2672032
0233- 2323732 Rest House , Vishrambaug
, Sangli - 416 416
iii S.R.O. Ratnagiri
Revenue Department Employees Co-Op Credit Society Ltd., Office Building, Collectors Office Compound, Zandgaon , Ratnagiri - 415 639
Sindhudurga district and
02352 - 220813
02352 - 220713
Rajapur, Lanja, Ratnagiri ,
Deorukh and Sangmeshwar
taluka
iv S.R.O. Chiplun
Parkar Complex, 1st floor, Behind Nagar Parishad Office, Chiplun Taluka. Chiplun Dist . Ratnagiri - 415 605
Chiplun, Guhagar, Khed,Dapoli and Mandangad taluka of Ratnagiri district
02355 -261570
02355-261570
5 Mumbai
Maharashtra Pollution Control Board, Raikar Chambers, "A" wing, 216, 2nd floor, Deonar Gaon Road, Near Jain Mandir, Govandi (E), Mumbai-400 088
Mumbai Municipal Corporation Area
25505928 25505926
Sub-Regional Offices
i S.R.O. Mumbai-I
201-202, Raikar Chambers, Govandi Station Road, near Jain Temple, Govandi, Mumbai 400 088.
Mumbai Island, Ward No. A.B.C D. FF(South) F(North) G(South) and G(North).
25505926 -
ii S.R.O. Mumbai-II
201-202, Raikar Chambers, Govandi Station Road, near Jain Temple, Govandi, Mumbai 400 088.
Part Of Mumbai Suburb, Ward No. M(East) M(West), H(East) H(West) and L.
25505926 -
iii S.R.O. Mumbai-III
201-202, Raikar Chambers, Govandi Station Road, near Jain Temple, Govandi, Mumbai 400 088.
Part Of Mumbai Suburb, Ward No. K(East) K(West), S, N, and (P (South).
25505926 -

iv S.R.O. Mumbai-IV
201-202, Raikar Chambers, Govandi Station Road, near Jain Temple, Govandi, Mumbai 400 088.
Suburb of Mumbai, Ward No. P(North), R(North), R(South) and T.
22640345 -
6 Nagpur
Udyog Bhavan , 5th floor , Near Sales Tax Office, Civil Line , Nagpur - 440 001
Nagpur, Wardha, Bhandara,Gondia, Chandrapur and Godchiroli district.
0712 - 2565308
0712 - 2560851
Sub-Regional Offices
i S.R.O. Nagpur I
Udyog Bhavan , 5th floor , Near Sales Tax Office, Civil Line , Nagpur - 440 001
Nagpur district. 0712-2560152
0712-2560139
ii S.R.O. Nagpur II
Udyog Bhavan , 5th floor , Near Sales Tax Office, Civil Line , Nagpur - 440 001
Wardha district , Hingana taluka, (excluding Nagpur Municipal Corporation area ) Umred, Bhivapur, Kuhi and Nagpur Gramin taluka of Nagpur district.
0712-2560152
-
iii S.R.O. Bhandara
Sub-Regional Office, Bhandara, Petkar Building, Sant Tukodji Ward, Bhandara-441 904
Bhandara and Gondia district.
07184-258913
07184-260629
7 Nashik
Udyog Bhavan, First Floor, Trimbak Road, Near ITI, Satpur, Nashik - 422007
Nashik , Ahmednagar, Jalgaon , Dhule, Nandurbar district.
0253 - 2365150
0253 - 2365150
Sub-Regional Offices
i S.R.O.Nashik Udyog Bhavan, First Floor, Trimbak Road, Near ITI, Satpur, Nashik - 422007
Nashik distrct. 0253 - 2365161
0253 - 2365161
ii S.R.O. Jalgaon
Late Shri Bhikamchand Jain Municipal Market Building , Hall No. A , 3rd floor, Jalgaon - 425 001
Jalgaon district. 0257 - 2221288
0257 - 2221288

iii S.R.O. Dhule
2nd Floor, Fulchand Plaza, B.C. College Road,Near S.S.V.P.S. Engineering College,Near vidya Nagari,Devpur, Dhule- 424 001
Dhule , Nandurbar district.
07184-260629
07184-260629
iv Ahmednagar
Bharat Timber, 1st floor, Tilak Road, Opposite Sanket Hotel , Ahmednagar , 414 001
Ahemdnagar district.
0241 - 2470852
0241 - 2353852
8 Navi Mumbai
Maharashtra Pollution Control Board, Raigad Bhavan, 7th floor, Sector - 11, C.B.D Belapur, Navi Mumbai
Part of Thane and Raigad district as mentioned against the Sub-Regional Offices.
022- 27572739
022- 27571586
Sub-Regional Offices
i S.R.O.Navi Mumbai-I
Raigad Bavan, 7th floor Sector - 11, C.B.D Belapur, Navi Mumbai
Mahape, Kopar-khairne, Sarvali, Ghansoli, Rabale, Airoli, Dighe
022-27572740
-
ii S.R.O. Navi Mumbai - II
Raigad Bavan, 7th floor Sector - 11, C.B.D Belapur, Navi Mumbai
Vashi, Ravane, Turbhe, Sanpada, Belapur
022 27572740
022 27571586
iii S.R.O. Taloja Raigad Bavan, 7th floor Sector - 11, C.B.D Belapur, Navi Mumbai
MIDC Taloja and Uran Taluka.
022 27572740
022 27571586
9 Pune
Jog Center, 3rd floor, Mumbai Pune Road, Wakdewadi, Pune - 411003.
Pune Satara and Solapur district.
020 - 25811627
020 -25811029
Sub-Regional Offices
i S.R.O.Pune-I
Jog Center, 3rd floor, Mumbai Pune Road, Wakdewadi, Pune - 411003.
Pune Corporation area ,Daund , Indapur , Baramati,Purandar , Bhor and Velhe taluka of Pune district.
020 - 25811694
-

ii S.R.O. Pune - II
Jog Center, 3rd floor, Mumbai Pune Road, Wakdewadi, Pune - 411003.
Haveli taluka : ( excluding Pimpri Chinchwad Corporation Area.) Khed , Mulshi, Ambegaon, Junnar, Maval and Shirur taluka of Pune district..
020 - 25816451
-
iii S.R.O.Pimpri-Chichwad
Jog Center, 3rd floor, Mumbai Pune Road, Wakdewadi, Pune - 411003.
Pimpri Chinchwad Municipal Corporation area including MIDC Pimpri , Bhosari and Akurdi.
020-25810222
-
iv S.R.O.Satara
Sub-Regional Office, Satara New Government Bhavan, 2nd Floor, Near S.T. Sand, Sadar Bazar, Satara - 415 001..
Satara district..
02162-233527/
02162-233527
237789
v S.R.O.Solapur
4/B, Bali Block, Civil Lines, Oppsite Government Milk Scheme, Saat Rasta, Solapur - 413003.
Solapur district.. 0217-2319850
217
10 Raigad
Maharashtra Pollution Control Board, Raigad Bhavan, 6th floor, Sector - 11, C.B.D Belapur, Navi Mumbai- 400 614
Part of Raigad district as mentioned against the Sub-Regional Offices under him.
022-27572620
022-27562132
Sub-Regional Offices
i S.R.O.Raigad-I
Maharashtra Pollution Control Board, Raigad Bhavan, 6th floor, Sector - 11, C.B.D Belapur, Navi Mumbai.
Khalapur taluka and Panvel taluka ( Except MIDC - Taloja).
022- 27572739
022- 27572620
ii S.R.O. Raigad II
Maharashtra Pollution Control Board, Raigad Bhavan, 6th floor, Sector - 11, C.B.D Belapur, Navi Mumbai.
Pen , Karjat, Sudhagad taluka.
022- 022- 27572739
-
iii S.R.O. Mahad Samaik Suvidha Kendra Building, MIDC - Mahad, District Raigad - 402 309
Mahad Mhasla, Mangaon, Shriwardhan and Poladpur taluka.
02145 - 232372
02145-232373
11 Thane Maharashtra Pollution Part of Thane 022-

Control Board, Plot No P-30, 5th floor Office Complex Building Mulund Checknaka, Thane - 400 604
district as mentioned against the Sub-Regional Offices.
022-25802272
25805398
Sub-Regional Offices
i SRO Thane I
Plot No. P-30, 5th floor, Office Complex Building Mulund Checknaka, Thane.
Thane Municipal Corporation Area.
022- 25829582
022 25805398
ii S.R.O.Thane II Plot No. P - 30, 5th floor, Office Complex Mulund Checknaka ,Thane.
Thane taluka excluding Thane Municipal Corporation Area Vasai taluka.
022- 25829582
022- 25805398
iii S.R.O.Tarapur MIDC Office Building, Boisar Station,Post Taps,Tarapur,Dist Thane.
Tarapur MIDC and related area.
02525 -273314
-
iii SRO Tarapur II MIDC Office Building Boisar Station, Post Taps, Tarapur , Dist Thane
Dahanu , Talasari , Mokhada,Javhar and Vikramgadh taluka and Palghar taluka (Except SRO-Tarapur- I jurisdiction).
02525 -261581
02525 - 273314
12 Chandrapur Mahaveer Tower, 2nd floor, Mul Road, Chandrapur, 442 401
Chandrapur, Yavatmal, Gadchiroli district.
07172-251965
07172-251965
Sub-Regional Offices
i S.R.O.Chandrapur-I
Mahaveer Tower, 2nd floor, Mul Road, Chandrapur, 442 401
Chandrapur, Yavatmal district.
07172-272410
07172-251965

ANNEXURE 4 – REGIONWISE INDUSTRY STATISTICS
Industry Statistical Report
RO Office Green Green
Total
Orange Orange Total
Red Red Total
Grand Total LSI MSI SSI LSI MSI SSI LSI MSI SSI
RO Amravati
4 4315 4319 8 10 1920 1938 51 13 320 384 6641
RO Aurangabad
11 14 5376 5401 34 70 2004 2108 202 71 851 1124 8633
RO Chandrapur
2 430 432 15
410 425 149
247 396 1253
RO Kalyan
22 1472 1494 79 57 929 1065 135 107 1769 2011 4570
RO Kolhapur 1 22 9101 9124 30 48 3656 3734 240 75 1663 1978 14836
RO Mumbai
27 1845 1872 421 300 660 1381 170 54 480 704 3957
RO Nagpur 3 3 1665 1671 62 21 2215 2298 395 15 1253 1663 5632
RO Nashik 44 35 6117 6196 109 55 2312 2476 399 58 2036 2493 11165
RO Navi Mumbai
6 59 1540 1605 134 178 952 1264 168 31 1089 1288 4157
RO Pune 105 266 7070 7441 1098 511 4587 6196 1168 235 3558 4961 18598
RO Raigad
19 425 444 86 31 324 441 148 31 383 562 1447
RO Thane 1 13 1273 1287 251 24 451 726 190 33 950 1173 3186
Grand Total 171 486 40629 41286 2327 1305 20420 24052 3415 723 14599 18737 84075

ANNEXURE 5 - DETAILS OF TRAINING PROGRAMS ATTENDED BY MPCB OFFICIALS DURING YEAR APR-2015- MAR-2016
Sr. no
Training Date Location Subject Name of Officers
1 23-24 April, 2015
Industrial Management Academy, New Delhi, at Hotel Ramada, Plaza Palm Grove, Juhu Beach, Mumbai.
"Right to Information Act 2005:Obligations & Strategies"
Utkarsh Shingare, FO, JD(WPC)
2 15-17 April, 2015
Navi Mumbai, As per NGT (WZ), Pune Bench, Order No. 157(THC)/2013
"Advances in Air Pollution Monitoring & Analysis"
28 Participants Mr. Kishor Gavankar, JSO Mr. Anil R Patil, JSA Mr. S. H. Nagare, JSO Mr. Sangam Taide, JSA Mrs. Madhura R. Pore JSA Mrs. Swapna Satam, JSA Mr. Devanand Jadhav, JSA Mr. Suresh V. Bhosale, SO Mrs. Sumitra S Mahajan, JSO Dr. Mahesh Rakh, JSO Mr. Dattatraya V. Nehe, JSO Mr. Ravindra P. Raut, JSA Mr. B. S. Gadhan, SO Mr. A.V. Mandavkar, JSO Mr. A. N. Sandansing, JSO Mr. S. A. Salunkhe, JSA Shri. D. R. Nanekar, JSA Mr. V. R. Thakur, SO Mr. S. R. Badgujar, JSO Mr. S. D. Mali, JSO Mr. S. K. Baviskar, JSO Mr. R. B. Sorte, SO Mr. G. S. Nagre, JSA Mrs. Anjana S. Sengupta, JSA Mr. Abhijit Wagh, JRF, Mr. S. A. Deshpande, JSA Mr. B. N. Sangle, JSO, Dr. Padmanabh Khadkikar, JSO
3 23-24 April, 2015
The Imperial, New Delhi, Indian Infrastructure, New Delhi.
"3rd Annual Conference on Sewage Treatment Plans"
Shri Shashikant Patil, FO, RO(HQ) & Shri Ketan Patil, FO, AS(T) Sec.
4 May-4 to 8 2015
Gowathi Assam C.S.E, Delhi
Waste Management Policies Issue Challenges an way forward
Kartik S Langote, F.O., J. D. (WPC) Sec.,S. L. Chavan, FO, AS(T), D. R. Bansod, FO AS(T)

5 05.08 May, 2015
Engineering Staff College, Hederabad.
"Continuing Professional Development Programme on "Laboratory Management System Awarness & Internal Auditing (As per ISO/IEC:17025:2005 & NABL Requirement)s
Mrs. Swa[ma Satam, JSA, C.Lab., Mrs. Meeta Deshmukh, JSA, R.Lab., Nashik, Mr. Ravindra Raut, JSA, R.Lab., Pune.
6 14 & 15 May, 2015
HICC, Hyderabad Conference on "Green Cementech-2015 Theme: Make India Cement Plants World Class in Green
Shri V.M. Motghare, JD(APC) Shri N.N. Gurave, I/c. R.O.(HQ) Dr. A.N. Harshwardhan, R.O. Chandrapur
7 27-29 August, 2015
YASHADA, Pune "Project Management for e-Governance"
Shri Dinesh Sonawane, Asst. System Officer, Ms. Ragini Butale, JSO, PSO Sec.
8 17-21 August, 2015
NEERI, Nagpur Characterization of Domestic Waste Water and Design, Operation & Maintenance of Treatment Plants with Particular reference to Natural Treatment Technology
Mrs. Hema Deshpane, SRO, Nagpur-I Shri Gajanan Khadkikar, FO, Nagpur-I Shri Gajanan Nagare, JSA, Regional Lab., Nagpur Shri Surendra Karankar, F.O. R.O. Chandrapur
9 07-09 October, 2015
NGRI, Hyderabad Monitoring Techniques of Organic Pollutants (PAH and VOC)
Pradeep Jagtap, F.O., SRO Mumbai-IV Shri S.K. Baviskar, JSO, C.Lab., N.M.
10 25-27 August, 2015
Centre for Development Advanced Computing, C-DAC, Pune
Decision support system from Air Quality Management
Shri V.M. Motghare, JD(APC) Shri P.M. Joshi, R.O. Chandrapur Shri S.L. Waghmare, SRO, Tarapur-I Shri M.R. Lad, SRO, Kalyan-I

11 04 December, 2015
Green Chemistry Foundation, Goregaon, Mumbai Hotel Countryyyard, Mumbai
Conference on "Green Chemistry"
Dr. A.N. Harshwardhan, R.O. Raigad Shri S.L. Waghmare, SRO, Tarapur-I Shri Nitin R. Shinde, SRO, Kalyan-II Shri T.g. Yadav, SRO Taloja
12 08-09 October, 2015
I.C.T., Matunga, Mumbai
"International Conference "SusChemE" on catalyzing research and technology innovation for sustainable future."
Shri J.B. Sangewar, R.O., Kalyan Dr. A.N. Harshwardhan, RO-Raigad T.G. Yadav, SRO, Taloja, S.R. Said, SRO-Mumbai-III V.N. Patil, SRO, Thane-I
13 09-11 November, 2015
EPTRI, Hyderabad "Clean Development Mechanicsm (CDM): CDM Project implementation for Industrial Sector, Wasteland Sector, Mining and Carbon Trading"
P.M. Joshi, R.O. Chandrapur. Devidas Koparkar, SRO, Pune-II, Kiran Hasabnis, SRO, Nagpur-II
14 30.10.2015 GAD, GoM, Dist. Training Institute, Mumbai & YASHADA, Pune, Assembly Hall, 6th Floor, Mantralaya, Mumbai
Implementation of "Maharashtra Lokseva Hakka Adhiniyam, 2015
N.N. Gurav, I/c. R.O.(HQ). R.B. Andhale, SRO, Mumbai-II Amar Durgule, SRO, Mumbai-I
15 31.10.2015 CIDCO Bhavan, Navi Mumbai, M.S. MCZMA, Mantralaya, Mumbai
Meeting/Workshop on CRZ Notification-2011.
Dr. Y.B. Sontakke, JD (WPC). Dr. A.N. Harshwardhan, RO-Raigad Dr. Prakash Mumndhe, SRO, Mumbai-IV
16 26-27th Nov., 2015
Aqua Foundatoin, India Habitant Centre, Lodhi Road, New Delhi.
"IX World Aqua Congress "Reviving Tradintinal Water & Environment Conservation Technique.
Dr. Y.B. Sontakke, JD (WPC) Sanjay Bhosale, SRO Nashik

17 10-11th Dec. 2015
SIES, Nerul, Navi Mumbai
"National Conference on Environment Monitoring Assessment and Pollution Contrl
S.C. Kollur, SO, JD(APC), Section. V.V. Killedar, F.O. RO-Raigad Smt. Madhurima Joshi, FO-RO-Navi Mumbai, Yogesh Patil, F.O. JD(APC)
18 20th November, 2015
Coastguard Region (West), Conference Room 3rd floor, at Head Quarters, Coast Guard, Mumbai
"The Initial Planning Conference for Conduct of the Sixth National Level Pollution Response Exercise"
D.K. Khedkar, RO-Mumbai N.S. Lohalkar, I/c. RO-Navi Mumbai Dr. A.N. Harshwardhan, RO-Raigad
19 5 to 7 January, 2016
central Laboratory,MPCB, Navi Mumbai
"ISO 9001 and OHSAS:18001 Internal auditor's training"
19 Participants Mr. S. C. Kollur, SO & I/C, C. Lab Ms. V. D. Pednekar, JSO Mrs. Swapna Satam JSA Shri. S. S. Doke, RO
Shri. Ravindra Raut, JSA
Shri A Kurale, JSA
Shri Sunil Salve JSA
Shri. Mita R. Deshmukh, JSA
Shri. Bipin Bhandare, JSO
Shri. Gajanan Nangare, JSA
Shri. V. V. Shinde, RO
Shri. Suresh Mali, JSO
Shri. A. F. Deshmane, I/c. RO
Shri. B. N Sangale, JSO, I/C, Lab
Shri. Saran Deshpande, JSA
Shri. Anil Sandansing, JSO
Shri. Dhananjay Nanekar, JSA
Shri Anil Patil, JSA
Shri. S. N. Nagare, JSO
20 18 to 22 January, 2016
Centre for Science and Environment, New Delhi
Water Quality Management
Shri G.D. Khadkikar, F.O., SRO Nagpur-I Mrs. S.S. Patil, F.O., R.O. Nashik
21 1 to 19 January, 2016
Centre for Science and Environment, New Delhi (2nd Week) At Ahmedabad (3rd Week)
"Two week Foundation Course and one week specialization course on compliance monitoring and enforcement
Shri Nitin Shinde, SRO, Kalyan-II Shri Manchak Jadhav, F.O., A.S.(T) Section Shri Abhijeet R. Kasbe, F.O., SRO, Chiplun
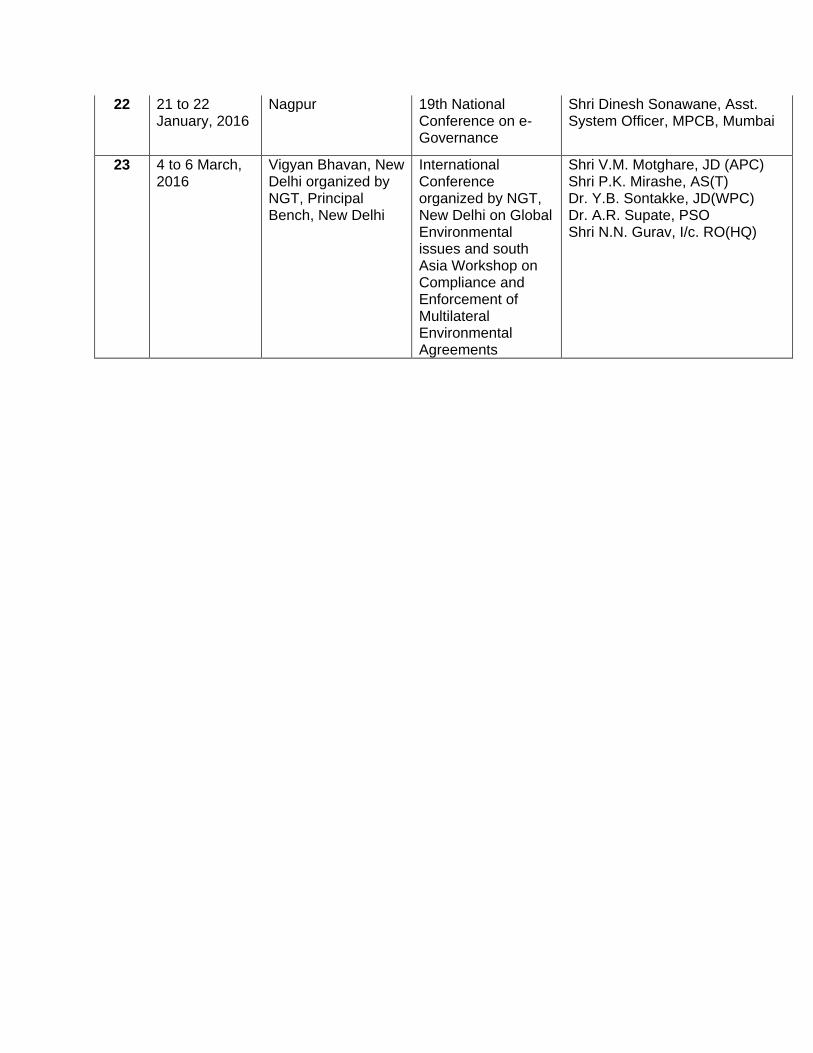
22 21 to 22 January, 2016
Nagpur 19th National Conference on e-Governance
Shri Dinesh Sonawane, Asst. System Officer, MPCB, Mumbai
23 4 to 6 March, 2016
Vigyan Bhavan, New Delhi organized by NGT, Principal Bench, New Delhi
International Conference organized by NGT, New Delhi on Global Environmental issues and south Asia Workshop on Compliance and Enforcement of Multilateral Environmental Agreements
Shri V.M. Motghare, JD (APC) Shri P.K. Mirashe, AS(T) Dr. Y.B. Sontakke, JD(WPC) Dr. A.R. Supate, PSO Shri N.N. Gurav, I/c. RO(HQ)


Maharashtra Pollution Control Board Kalpataru Point, Sion [E], Mumbai - 400022
Website: www.mpcb.gov.in
DESIGNED BY: