Magnetorheological Fluid Dampened Dowels for Rigid Pavement
90
Magnetorheological Fluid Dampened Dowels for Rigid Pavement Distress Mitigation A Major Qualifying Project submitted to the faculty of Worcester Polytechnic Institute in partial fulfillment of the requirements for the Degree of Bachelor of Science Submitted by: James Arsenault David Magnano Chris Surprenant Submitted to: Project Advisors: Professor Yeesock Kim Professor Tahar El-Korchi
Transcript of Magnetorheological Fluid Dampened Dowels for Rigid Pavement

Magnetorheological Fluid Dampened Dowels
for Rigid Pavement Distress Mitigation
A Major Qualifying Project submitted to the faculty of
Worcester Polytechnic Institute
in partial fulfillment of the requirements for the Degree of Bachelor of Science
Submitted by:
James Arsenault
David Magnano
Chris Surprenant
Submitted to:
Project Advisors:
Professor Yeesock Kim
Professor Tahar El-Korchi

Abstract:
Every year billions of tax payers’ dollars are spent in an attempt to repair and maintain the
crumbling four million miles of roads and highways that span the country. The US government adds
nearly 36,000 lane-miles of roadway per year and the amount of deterioration is growing faster than can
be repaired (ARTBA, 2013). New systems are being developed in an attempt to improve road conditions
and slow the degradation of the country’s roadways. This project proposes a new system, incorporating
smart materials, in an attempt to solve the issues caused by failing dowel-jointed rigid pavements. The
proposed dowel system, based on a magnetorheological (MR) fluid dampening system, would provide
the appropriate stiffness in the dowel in response to various dynamic loads due to vehicular traffic.

Acknowledgments:
Our team would like to thank our advisors, Professor Yeesock Kim and Professor Tahar El-Korchi
for all of their guidance and patience. We would also like to extend a special thanks to Russell Lang and
Donald Pellegrino for all of their help in the laboratory.

Authorship:
This project was developed and executed by the collaborative efforts of James Arsenault, David
Magnano, and Chris Surprenant, as well as the assistant of the WPI Civil Engineering Departments Lab
Supervisors: Russell Lang and Donald Pellegrino.
The planning phase of the project was subdivided into four main areas of focus each lead by a
member or multiple members of the project team. The areas of focus are as follows (Person(s) in charge
of each area are in parentheses)
1. Back Ground Information (Chris Surprenant)
2. Magnetorheological Fluid Properties Testing (David Magnano and Chris Surprenant)
3. Rigid Pavement- Joint Slab Testing (James Arsenault)
4. Magnetorheological Dampened-Dowel Design and Testing (David Magnano)
The execution phase of these areas was conducted by all teammates.
The paper was written by all teammates. Authors of each of the following chapters are as
follows
1. Chapter I- Literature Review (James Arsenault, David Magnano, Chris Surprenant)
2. Chapter II- Slab Testing (James Arsenault)
3. Chapter III- Magnetorheological Fluid Testing (David Magnano and Chris Surprenant)
4. Chapter IV- Final Design (David Magnano)
5. Chapter V- Cost Analysis (James Arsenault and David Magnano)
6. Chapter VI- Overall Conclusion (James Arsenault, David Magnano, Chris Surprenant)
7. Chapter VII- Appendices (James Arsenault, David Magnano, Chris Surprenant)
Table of Contents Abstract: ........................................................................................................................................................ 2
Authorship: ................................................................................................................................................... 4
List of Figures: ............................................................................................................................................... 8
List of Tables: .............................................................................................................................................. 12
Executive Summary: .................................................................................................................................... 13
Introduction: ............................................................................................................................................... 16
Chapter I: Literature Review ....................................................................................................................... 18
Pavement: ............................................................................................................................................... 18
Rigid Pavement: ...................................................................................................................................... 19
Rigid Pavement Failures: ......................................................................................................................... 20
Pumping: ............................................................................................................................................. 20
Cracking: .............................................................................................................................................. 20
Punch-out: ........................................................................................................................................... 20
Faulting: .............................................................................................................................................. 20
Dowels:.................................................................................................................................................... 21
Materials: ............................................................................................................................................ 22
Epoxy Coated Dowels:......................................................................................................................... 23
Plastic Coated Dowels: ........................................................................................................................ 23
Stainless Steel: .................................................................................................................................... 23
Causes of Dowel Failure in Rigid-Pavement Dowels: .............................................................................. 24
Corrosion: ............................................................................................................................................ 24
Misalignment: ..................................................................................................................................... 24
Shear Failure: ...................................................................................................................................... 25
Construction:........................................................................................................................................... 25
Smart Materials: ..................................................................................................................................... 28
Magnetorheological Fluids:................................................................................................................. 28
MR Fluid Properties: ........................................................................................................................... 29
Rheology: ............................................................................................................................................ 29
Magnetic Fields: .................................................................................................................................. 29
Chapter II: Slab Testing ............................................................................................................................... 31
Introduction: ........................................................................................................................................... 31

Methods: ................................................................................................................................................. 33
Results: .................................................................................................................................................... 38
Discussion: .............................................................................................................................................. 39
Chapter III: Magnetorheological Fluid Testing ............................................................................................ 40
Introduction: ........................................................................................................................................... 40
Methods: ................................................................................................................................................. 40
Static Testing: ...................................................................................................................................... 40
Impact Testing: .................................................................................................................................... 42
Results: .................................................................................................................................................... 44
Discussion: .............................................................................................................................................. 44
MR Fluid Properties- Manual Manipulation Testing: .............................................................................. 45
Results: .................................................................................................................................................... 45
Discussion: .............................................................................................................................................. 46
Syringe Testing: ....................................................................................................................................... 46
Results: .................................................................................................................................................... 47
Discussion: .............................................................................................................................................. 47
Prototype 2.0: ......................................................................................................................................... 47
Chapter IV: Final Design .............................................................................................................................. 49
Introduction: ........................................................................................................................................... 49
Methods: ................................................................................................................................................. 50
Results: .................................................................................................................................................... 51
Discussion: .............................................................................................................................................. 52
Chapter V: Cost Analysis ............................................................................................................................. 54
Introduction: ........................................................................................................................................... 54
Discussion: .............................................................................................................................................. 54
Chapter VI: Overall Conclusions .................................................................................................................. 55
Works Cited: ................................................................................................................................................ 56
Chapter VII: Appendices .............................................................................................................................. 58
Appendix A: Static Loading of Prototype 1.0 Series ................................................................................ 58
All Data: ............................................................................................................................................... 58
Appendix B: Impact Testing of Prototype 1.0 Series .............................................................................. 61
All Data: ............................................................................................................................................... 61

Impact Data: ........................................................................................................................................ 65
Appendix C: MR Fluid Sample Testing .................................................................................................... 68
Appendix D: Slab Testing ........................................................................................................................ 72
Appendix E: Prototype 2.0 ...................................................................................................................... 76
Appendix F: Prototype 3.0 ...................................................................................................................... 77
Appendix G: 3-D Printer .......................................................................................................................... 79
Appendix H: Prototype 3.0 Testing ......................................................................................................... 81

List of Figures:
Figure 1: Dowels supported by wire frame or basket prior to slab construction, note, dowels
are greased on one side to allow for dowel movement at the joint (El-Korchi & Mallick, 2013) 21
Figure 2: Jointed Plain Concrete Pavement (El-Korchi & Mallick, 2013) ............................................ 22
Figure 3: Schematic Showing Dowel Deformation Under Load at a rigid pavement joint (El-
Korchi & Mallick, 2013) ...................................................................................................................................... 22
Figure 4: Setting Dowels Prior to Pavement Construction Using a Paver (El-Korchi & Mallick,
2013) ........................................................................................................................................................................ 26
Figure 5: Pouring Concrete using a concrete paver to form the pavement (El-Korchi & Mallick,
2013) ........................................................................................................................................................................ 26
Figure 6: Finishing the pavement slab surface using a bullfloat (El-Korchi & Mallick, 2013) .... 26
Figure 7: Creating Grooves in the Pavement using a steel comb apparatus (El-Korchi & Mallick,
2013) ........................................................................................................................................................................ 27
Figure 8: Precut joint in concrete Slab with polymer filling (El-Korchi & Mallick, 2013) ............. 27
Figure 9: Slab After Curing with strain wires attached to the dowel protruding from the
concrete ................................................................................................................................................................... 32
Figure 10: Example of Sinusiodal Loading from 200 to 500 lbs. at 1 Hz (Graph generated by
wolframalpha.com) ............................................................................................................................................. 33
Figure 11: Slab in Process of Being Tested (Photo Taken by David Magnano) ................................ 33
Figure 12: Empty Slab Mold with Dowels place on chairs with strain gages attached (Photo
Taken by David Magnano) ................................................................................................................................. 31
Figure 13: Strain Gauge Reading at Failure ................................................................................................ 38
Figure 14: Deflection Results at Time of Failure ........................................................................................ 39
Figure 15: CPVC Flow Guard Gold Adhesive (Photo Taken by David Magnano) ............................... 40
Figure 16: Image of Static Loading on Prototype 1.0 Series (Photo Taken by David Magnano) 41
Figure 17: Results from Static Loading of Prototype 1 ............................................................................. 41
Figure 18: Testing Apparatus for Impact Loading (Photo Taken by David Magnano) .................. 43
Figure 19: Results from Impact Loading of Prototype 1 .......................................................................... 43
Figure 20: MR Fluid Soaked Sponge in Plastic Tube (Photo Taken by David Magnano) ............... 45

Figure 21: MR Fluid Sample in Connected Syringes (Photo Taken by David Magnano) ................ 46
Figure 22: Prototype 3.0 Concept Design (CAD Drawing by David Magnano) .................................. 49
Figure 23: Manufacturing of Prototype 3.0 (Photo Taken by David Magnano) ............................... 50
Figure 24: Deflection Results from 2.5" Drop Impact Test ...................................................................... 52
Figure 25: Prototype 3.0 at Failure (Photo Taken by David Magnano) .............................................. 53
Figure 26: Test 1, Empty CPVC Deflected to .5" ........................................................................................... 58
Figure 27: Test 2, Water Filled CPVC Deflected to .5” ................................................................................ 58
Figure 28: Test 3, MR Fluid Filled CPVC (no magnetic field) Deflected to .5” ..................................... 59
Figure 29: Test 4, MR Fluid Filled CPVC (magnetic field) Deflected to .4” .......................................... 59
Figure 30: Test5, MR Fluid Filled CPVC (no magnetic field) Deflected to.4” ...................................... 59
Figure 31: Test 6, MR Fluid Filled CPVC (magnetic field) Deflected to .4” .......................................... 60
Figure 32: Cumulative Data .............................................................................................................................. 60
Figure 33: Image of Static Loading Test Preformed on WPI’s Instron 5567A (Photo Taken by
David Magnano) ................................................................................................................................................... 60
Figure 34: No Magnets ........................................................................................................................................ 61
Figure 35: 8 Stacks of 5 Magnets On Center ................................................................................................. 61
Figure 36: No Magnets ........................................................................................................................................ 61
Figure 37: No Magnets ........................................................................................................................................ 61
Figure 38: 8 Stacks of 5 Magnets On Center ................................................................................................. 62
Figure 39: 4 Stacks of 10 Magnets On Center .............................................................................................. 62
Figure 40: 4 Stacks of 10 Magnets On Center .............................................................................................. 62
Figure 41: 4 Stacks of 10 Magnets On Center .............................................................................................. 62
Figure 42: 40 Magnets Stacked Horizontally (fell off during loading) ................................................ 63
Figure 43: 1 Stack of 40 Horizontal Magnets ............................................................................................... 63
Figure 44: 1 Stack of 40 Horizontal Magnets ............................................................................................... 63
Figure 45: 1 Stack of 40 Horizontal Magnets ............................................................................................... 63

Figure 46: Image of Testing Apparatus for Impact Loading (Photo Taken by David Magnano) 64
Figure 47: No Magnets ........................................................................................................................................ 65
Figure 48: 8 Stacks of 5 Magnets On Center ................................................................................................. 65
Figure 49: No Magnets ........................................................................................................................................ 65
Figure 50: No Magnets ........................................................................................................................................ 65
Figure 51: 8 Stacks of 5 Magnets On Center ................................................................................................. 66
Figure 52: 4 Stacks of 10 Magnets On Center .............................................................................................. 66
Figure 53: 4 Stacks of 10 Magnets On Center .............................................................................................. 66
Figure 54: 4 Stacks of 10 Magnets On Center .............................................................................................. 66
Figure 55: 40 Magnets Stacked Horizontally (fell off during loading) ................................................ 67
Figure 56: 40 Magnets Stacked Horizontally ............................................................................................... 67
Figure 57: Cumulative Data from Impact Tests .......................................................................................... 67
Figure 58: MR Fluid Soaked Sponge Contained in Plastic Tubing (Photo Taken by David
Magnano) ................................................................................................................................................................ 68
Figure 59: MR Fluid Sample in Connected Syringes (Photo Taken by David Magnano) ................ 68
Figure 60: Hand Bending Observations ........................................................................................................ 69
Figure 61: Syringe Test Observations ............................................................................................................ 70
Figure 62: Syringe Test Observations Cont. ................................................................................................. 71
Figure 63: Testing Conducted at 500lbs ........................................................................................................ 72
Figure 64: Testing Conducted at 1500lbs ..................................................................................................... 72
Figure 65: 3000lbs Initial Iteration ................................................................................................................ 72
Figure 66: Testing Conducted at 2000lbs ..................................................................................................... 72
Figure 67: Testing Conducted at 3000lbs ..................................................................................................... 73
Figure 68: Testing Conducted at 4000lbs ..................................................................................................... 73
Figure 69: Slab Calculations ............................................................................................................................. 74
Figure 70: Slab Calculations Continued ........................................................................................................ 75

Figure 71: Prototype 2.0 Concept Design (CAD Drawing by David Magnano) .................................. 76
Figure 72: Auto CAD Concept Drawing of Prototype 3.0 (CAD Drawing by David Magnano) ...... 77
Figure 73: Picture of Prototype 3.0 Core and Magnetic Coil (Photo Taken by David Magnano) . 77
Figure 74: Prototype 3.0 During Construction (Photo Taken by David Magnano) ......................... 78
Figure 75: 1.75" Impact Loading Height ....................................................................................................... 81
Figure 76: 2.5" Impact Loading Height ......................................................................................................... 81
Figure 77: 3.25" Impact Loading Height ....................................................................................................... 82
Figure 78: 4" Impact Loading Height ............................................................................................................. 82
Figure 79: 4.75" Impact Loading Height ....................................................................................................... 83
Figure 80: 5.5" Impact Loading Height ......................................................................................................... 83
Figure 81: 6" Impact Loading Height ............................................................................................................. 84
Figure 82: 6.75" Impact Loading Height ....................................................................................................... 84
Figure 83: 7.5" Impact Loading Height ......................................................................................................... 85
Figure 84: 8" Impact Loading Height ............................................................................................................. 85
Figure 85: 8.75" Impact Loading Height ....................................................................................................... 86
Figure 86: 9.5" Impact Loading Height ......................................................................................................... 86
Figure 87: 11.75" Impact Loading Height .................................................................................................... 87
Figure 88: 16.5" Impact Loading Height ....................................................................................................... 87
Figure 89: 23.25" Impact Loading Height .................................................................................................... 88
Figure 90: LVDT Attached to Prototype 3.0 During Testing (Photo Taken by David Magnano) . 88
Figure 91: Prototype 3.0 Secured in Instron 8250 (Photo Taken by David Magnano)................... 89
Figure 92: Prototype 3.0 During Testing (Photo Taken by David Magnano) .................................... 89
Figure 93: Prototype 3.0 at Failure (Photo Taken by David Magnano) .............................................. 90

List of Tables:
Table 1: Slab Testing, Cycles Run for Each Loading .................................................................................. 37
Table 2: Static Loading Test Iterations ......................................................................................................... 42
Table 3: Impact Load Test Iterations ............................................................................................................. 44
Table 4: Prototype Test Iterations .................................................................................................................. 51

Executive Summary:
As time and usage deteriorates the country’s infrastructure the government spends
increasing sums of tax payer’s money in an attempt to maintain and eventually improve
conditions. Roads in the USA recently received a rating of D by the American Society of Civil
Engineers (ASCE, 2013) with the government investing only 91 billion for repairs, compared to
the 170 billion dollars the Federal Highway Administration reports is needed to rectify the
situation (ASCE, 2013). The current condition of American roadways costs citizen’s time, money,
and in some cases lives. More cost effective, longer lasting solutions are needed if the country
is to gain any grounds towards refurbishing the crumbling infrastructure.
Rigid pavements consist of road surfaces constructed of concrete as compared to
asphalt. The ability of rigid pavements to be more durable with less maintenance while
supporting heavy traffic loading renders this a desirable pavement design. In general rigid
pavements are composed of concrete slabs residing on foundational sub-layers. The sub-layers
are designed to be more flexible than the concrete, relieving some of the loads as well as
providing drainage assistance. After pavements have been laid they will go through years of
weathering, heavy loads, and other naturally occurring conditions causing them to deteriorate.
These deteriorations can lead to multiple problems in the rigid pavement including, but not
limited to, punchouts, faulting, cracking, and pumping.
The role of dowels in rigid pavement design is to transfer shear loads across joints in the
concrete. Current dowels are solid steel bars that are set in the concrete at the joints. Traffic
loading over time will induce stresses in both the dowels and the concrete surrounding the
dowels. Fatigue cracking in the concrete will propagate over time. This cracking, coupled with
environmental effects at the joint from rain, salt and freezing and thawing will cause failure at
the joints. This failure can be due to one or a combination of effects due to steel dowel
corrosion and concrete deterioration. As the effectiveness of the doweled joint decreases
overtime, more failure of the rest of the slab is also eminent due to excessive deflection of the
slab joint. More crack propagation, increasing in severity and extent, from the joint to the
center of the slab will then require substantial and costly repairs. The design of a smart dowel

capable of more efficiently transferring the shear load would allow the dowel to last longer,
increasing the longevity of the pavement joint and protecting the rest of the slab from
progressive failure.
The objective of this project includes determining if magnetorheological fluid (MR fluid)
dampened dowels will enhance and increase the load transfer efficiency of jointed-doweled
concrete pavements. A secondary objective was to evaluate the cost effectiveness of
implementing the team’s final design for MR fluid dampened dowel system. Our design
efficiency took priority over economic feasibility as the team’s main goal was to prove that the
design was effective in the given application. The cost of MR fluid involved have decreased
significantly over the past several years and if the trend continues implementing the final
design will become more viable in the near future.
The group has designed and tested several prototypes to determine the conditions
under which the MR fluid would be the most effective in preventing failure in the rigid
pavement joint. The original prototype series, of which there were four iterations, focused on
the MR fluid’s properties, using a CPVC pipe to simulate a smart MR fluid filled dowel system to
easily detect the increased stiffness of the MR fluid under a magnetic field. These dowel
prototypes were then tested for mechanical properties through three point bending and impact
testing. The prototypes with MR Fluid were tested with and without a magnetic field applied to
them. The results of these tests would indicate whether or not an increase in stiffness could be
measured. The second prototype was designed but never tested due to the difficulty of
manufacturing some of the parts given the limited capability of the WPI machining facilities.
This design incorporated several compartments containing MR fluid surrounding a magnetic
coil in the center 1’ span of a 2’ dowel. These compartments were joined by small openings
through which the MR fluid could flow when pressure was applied to the uppermost
compartment.
In an attempt to simplify the second prototype the third and final design, prototype 3.0,
was designed. This design allowed for the MR fluid to be contained within one compartment
separated by the core of the dowel, around which the magnetic coil would be wrapped. The MR

fluid would flow around the coil, and through two small openings at either end of the coil, when
pressure was applied to the top of the dowel. For ease of manufacturing and testing, a square
steel pipe was used in place of the round pipe featured in the design.
The results of the initial tests indicated no change in stiffness of the dowels. All of the
dowels in the first series showed similar results in deflection verses load regardless of the
presence of a magnetic field. This data indicated that the first design would not be capable of
meeting the required results. By passing the MR fluid through an enclosed system with a
decrease in the cross-sectional area under the influence of a magnetic field, we determined
that in order to optimize the MR fluid’s capacity to resist shear, the sample would need to be
forced to change cross-sectional area during loading which led to the second and third
prototype designs.
While the results from testing the third design were not enough to fully prove the
concept, there was evidence to support the hypothesis that a magnetorheological dampened
dowel would increase rigid pavement joint effectiveness. Future testing will need to be
conducted in order to ensure that the initial positive results will be consistent under different
rigid pavement joint conditions and loading. Should the design prove to be effective in bearing
the shear loads during future testing, the prototype will need to be tested in a jointed rigid
pavement slab to compare against the load bearing capacity of commonly used dowels.

Introduction:
This document contains our final report that summarizes our proposed idea to
incorporate magnetorheological fluid dampened dowels in rigid pavement design to aid in
mitigating local induced stress at the dowel-concrete interface. This report documents the
research, design, and testing conducted to create a feasible design in order to extend the life of
doweled rigid pavement joints. The following chapters are included in this report:
1. Chapter 1: Background Information on Road Conditions, Rigid Pavements,
Transverse Joints, and Magnetorheological Fluid
2. Chapter 2: Slab testing conducted to provide base information for comparison
against proposed design
3. Chapter 3: Magnetorheological fluid testing conducted to determine fluid properties
under various conditions of current, impact load or strain
4. Chapter 4: Final Design and Testing of the Dowel Prototype
5. Chapter 5: Basic Cost Analysis of the Designed Dowels Fabrication
6. Chapter 6: Discussion and Conclusions
The goals of this project were to design and evaluate a smart dowel system that could
complement or replace current rigid pavement dowels, to enhance and improve joint load
transfer efficiency while decreasing the frequency of failure. Specifically the group proposed to
produce an MR fluid dampened dowel for rigid pavement distress mitigation. While economic
feasibility is a concern, the group chose to neglect expenses for this phase of the project, as the
initial objective was focus on functionality of the prototype. However, future iterations of this
project may develop a more affordable alternative based on the results of our testing. The main
objectives of this project are:
1. Design an effective replacement for road joint dowels using a MR fluid dampening
system
2. Determine the properties of road dowels and their structural effectiveness given the
demands of their application.

3. Determine the properties of Magnetorheological Fluids under the stresses and
applications needed to provide structural support as the core of a pavement dowel.
4. Determine the cost effectiveness of implementing Magnetorheological Fluid filled
dowels in
The project team accomplished these goals and objectives by undergoing several weeks
of background research, as well as lab experimentation. All work was done on the
Worcester Polytechnic Institute (WPI) campus. The team worked closely with our
advisors, Yeesock Kim and Tahar El-Korchi as well as the WPI Civil Engineering
Department Lab Supervisors: Donald Pellegrino and Russell Lang.

Chapter I: Literature Review
Pavement:
As the American transportation infrastructure grows with each year, maintenance
needs, and the associated costs with road maintenance, also rise. With the government adding
approximately 36,000 lane-miles of roadway per year, to the already existing 4 million miles,
maintenance needs are increasing faster than the government can handle. As the percent of
roadways in poor conditions increases, commuters start to suffer more and more of the
consequences resulting from the country’s decaying infrastructure. (ASCE, 2013)
Motorists waste over 100 billion dollars every year, averaging over $300 per motorist
vehicle, due to the poor road conditions. These costs accumulate due to additional
maintenance and vehicle repairs, loss of time, and wasted fuel, due to congestion caused by
failing infrastructures. The American Society of Civil Engineers (ASCE, 2013) recently rated roads
and related transportation infrastructure with a D in their 2013 report card, due to failures such
as pumping and fractures, which is addressed in further reading. On a yearly basis an average of
91 billion dollars is being spent on roadway and infrastructure repairs, while the Federal
Highway Administration reports that 170 billion dollars is needed annually. Due to the current
lack of funding and additional roadways being constructed, transportation infrastructure is
deteriorating faster than can be repaired. (ASCE, 2013)
Currently about 32% of America’s 4 million miles of roads are in poor to mediocre
condition. There have been some recent improvements; however, the majority of these are not
long term, but rather quick fixes to solve the immediate short term issues. Repercussions
caused by the lack of quality roads are estimated to have cost commuters approximately 1.9
billion gallons of gas per year, totaling roughly 6.2 billion dollars at current gas prices. Aside
from this an average of 34 hours of wasted time per motorist per year due to congestion is
incurred. This trend is only becoming worse over the years as the gap between money required
and money being spent is continuing to widen. (ASCE, 2013)

Rigid Pavement:
Rigid pavement refers to any road surfaces made of concrete as compared to asphalt.
The advantage to using rigid pavement is its long life span with less maintenance, the ability to
handle heavy traffic loads, however, it’s more costly initially as compared to flexible
pavements. Rigid pavement will tend to remain fixed in place when stresses are applied and
cracks will form if these stresses exceed the tolerances of the concrete. The basic design of rigid
pavements is composed of slabs of concrete residing on sub-layers of gravel and soils. The sub-
layers are designed to be more flexible than the concrete to allow for some give, as well as
assisting in drainage underneath the slabs.
There are three main types of rigid pavements, jointed plain concrete pavements (JPCP),
jointed reinforced concrete pavements (JRCP), and continuously reinforced concrete
pavements (CRCP). JCPC is the most common rigid pavement due to its simplistic construction
and relatively low costs. Dowels are the only form of slab reinforcement at transverse joints in
order to transfer load. When dowels are not used aggregate shear interlocking can assist in the
transfer of loads over joints assuming the opening remains narrow. JRCP is similar to the
aforementioned option however the slabs are generally longer and contain additional
reinforcement. Reinforcement in these slabs is not intended to carry loads between joints but
instead designed to control cracking into tight groups and preserve shear load transfer across
the cracks. CRCP are heavily reinforced concrete slabs containing no contraction joints. Like
JRCP, it utilizes the reinforcement to maintain cracking to a characteristic pattern encouraging
aggregate interlocking and shear transfers. CRCP, although initially more costly compared to
the other options due to heavy steel reinforcement, is likely more cost effective in the long
term of heavily traveled areas because of its increased durability (Mallick & El-Korchi, 2013).
The pavement’s configuration is best exemplified by the depth of the slab being
used. The number of equivalent single axel loads a rigid pavement can carry over its lifetime is
dependent on slab depth. In general, after approximately 8 inches the load carrying capacity of
a rigid pavement doubles for each additional 1 inch of thickness (AASHTO Rigid Pavement
Structural Design, 2008).
Rigid Pavement Failures:
Pumping:
Pumping can be defined as the movement of material from underneath the concrete
slab. This is often caused when heavier weighted vehicles travel over the joint between slabs.
Each side will deform slightly and has the potential to pull up sub-grade or soil when returning
to its original position creating a pocket underneath the concrete. Repetition of this
phenomenon can eventually lead to a large enough lack of sub-grade that the concrete will
cave in at the weakened area, creating a pothole. (Mallick & El-Korchi, 2013)
Cracking:
In concrete slabs cracks tend to form when tensile stresses within the concrete
overcome its bearing capacity. This can happen for a variety of reasons including temperature,
usage, and variants in moisture content. Cracks can also form in the concrete due to drying
shrinkage, which can occur during the initial pouring. In most cases, cracks originate roughly
every 30-150 feet apart and will gradually begin to form closer to one another, roughly every
15-20 feet. Weather plays a big role in this process, due to changes in temperature, humidity,
and hydration causing shrinkage and expansion. These sudden changes result in uncontrolled
cracking (American Concrete Pavement Association, 2013).
Punch-out:
Punch-out occurs when a concrete slab in CRCP becomes broken into several pieces in a
small area of the slab. The issue being that the porosity of the pavement allows for moisture to
penetrate the slab and erode away the sub-grade. After this process has begun heavy truck
loading will induce stresses in the pavement resulting in cracks and disintegration. Some
possible causes could be excessively wide cracks, defects during the pouring of the concrete,
steel corrosion in joints, or closely concentrated cracking in the slabs (Pavement Management:
Punchout, 2012).
Faulting:
Faulting can be defined as differences in elevation across joints or cracks in slabs. As the
slabs are contacted by loads one will become lower than the other due to the effects of
pumping. Faulting becomes noticeable at approximately one tenth of an inch and should be

considered for maintenance upon reaching a deformation of .15 inches. Aside from pumping,
faulting can be caused by slab settlement, curling, and warping of the concrete (Pavement
Management: Faulting, 2012).
Dowels:
The typical length of a dowel is 18-24 inches. The diameter will vary based on expected
load requirements but will generally be in the 1.125-2 inch range. Spacing is typically every 12-
24 inches. Design parameters can vary based on expectations, design restraints, budget and
other altering factors. Rigid pavement dowels must have a relatively low coefficient of friction,
and are often greased before construction, so the bars can slide in between the concrete as the
concrete expands and contracts. (John B. Kornick, 1968)
Dowels in rigid pavement construction play a crucial role in the transferring of loads
between concrete slabs joints. Joints in concrete slabs are designed to absorb the effects of the
expansion and contraction caused by variation in temperature. The dowels allow the slabs to
work together to carry the wheel loads across the joint which is more effective than allowing
only one slab to carry more of the shear force across the joint.
Figure 1: Dowels supported by wire frame or basket prior to slab construction, note, dowels are greased on one side to allow for dowel movement at the joint (El-Korchi & Mallick, 2013)

Figure 2: Jointed Plain Concrete Pavement (El-Korchi & Mallick, 2013)
The dowel works by transferring shear stresses caused by traffic loads from one slab to
another. When a load is applied to the slab, the near side will deflect downwards. This vertical
force is transferred into the dowel. As the load travels along the joint, this force also travels
along the dowel to the other slab. As the load moves away from the joint the dowel and the
concrete return to their original rest state.
Figure 3: Schematic Showing Dowel Deformation Under Load at a rigid pavement joint (El-Korchi & Mallick, 2013)
Materials:
Dowels are typically made out of A36 structural steel. One of the problems with steel as
a construction material is that over time the steel interacts with water, oxygen, and chlorides

which cause a corrosive effect that will eventually compromise the integrity of the dowel. This
can eventually lead to failures in the road design, potentially causing accidents and costing
commuters and governmental agencies time, money, and in some cases lives. In order to
combat the interaction between steel and these corrosive elements engineers have utilized
several different coating materials that don’t corrode. (Corrosion Resistance, Jolivet, 2007)
Epoxy Coated Dowels:
Epoxy coated bars are any type of dowel that uses a form of epoxy to coat the steel. This
coating provides protection from the corrosive effects of oxygen and water on the steel bar by
not allowing them to reach the bar. The epoxy is applied to the bars by melting the chemicals at
high temperatures exceeding 2200®C. This process only takes a few seconds, leaving the steel
unaffected by the temperature. This process allows the epoxy to bond with the steel, creating
an impervious barrier around the dowel. (David Jolivet, 2007)
Plastic Coated Dowels:
One of the alternate materials for highway dowel bars is a plastic coated steel bar. The
steel portion of this bar is the same length and diameter of a typical highway dowel (18 in
x1.125 in). This bar is then coated in 1 to 8 mm of an adhesive that is suitable to bond plastic to
steel. This adhesive must be soft enough to be elastic and rubbery at room temperature, but
not free flowing. The plastic bonded to the steel bar is a polyolefin polymer, such as
polyethylene, a plastic with chemical resistant properties. The adhesive and plastic then act
together to protect the bar from corrosion by preventing the steel bar from being exposed to
the concrete during load transference (Plastic Coated Dowel, Kornick, 1967)
Stainless Steel:
Stainless steel bars are another alternative material to regular steel bars. Stainless steel
does not react to chlorides and other corrosive elements and corrodes at a very slow pace.
Stainless steel is a lot more expensive than regular steel making it an economically inefficient
alternative.

Causes of Dowel Failure in Rigid-Pavement Dowels:
Corrosion:
Corrosion is a serious concern in the design of rigid pavements utilizing steel dowels.
Corrosion occurs overtime as the steel interacts with oxygen and water. However, oxygen and
water will only corrode the surface of the steel bar; the bar will then develop a layer of rust
which will protect the rest of the bar from corrosions. When chlorides found in the concrete or
in other materials such as road salt, interact with the steel the protective layer of rust breaks
down, allowing for more rust to form. Overtime this constant process of rust forming and being
broken down will eventually reduce the overall strength of the bar. This reduction of strength is
one of many factors that can contribute to a failure in the road joint (David Jolivet, 2007).
Coating dowels with epoxy is the most common method used in an attempt to combat
corrosion, but will only prevent it for so long. The epoxy on the dowel will slowly absorb water,
which then leaks onto the steel. This leaking will eventually cause the epoxy to disband from
the dowel. Once the epoxy is removed, the steel will begin the aforementioned process of
rusting. Other methods, that are more effective than epoxy coated steel bars, prove to cost
more initially, with varying results over the life of the dowel (David Jolivet, 2007).
Misalignment:
Misalignment referrers to the movement of dowels in concrete joints, so that it is not in
its intended orientation. The cause of this could be because of incorrect installation or
displacement during construction. There are four major types of misalignment: vertical tilting,
horizontal tilting, vertical translations, and longitudinal translations. The first two misalignment
types deal with the dowel being rotated on the horizontal and vertical axis, so that the dowel is
no longer parallel to the direction of vehicle motion or perpendicular to the joint, respectively.
The later types of misalignments are when the dowel is not located mid-depth in the concrete
or has not been equally spaced form the adjacent dowel. The Federal Highway Administration
(FHWA) recommends that misalignment be no greater than 2% of the length of a dowel, so a 12
inch dowel can only be misaligned in any give direction by ¼ inch. Misalignments greater than
2% can severely decrease the strength of the joint in that location and accelerate the
deterioration of that section of the slab (Priya Saxena, 2012).
Shear Failure:
Shear failure occurs when the dowel becomes too weakened to support the weight of
the traffic loads. Shear failure can result from several sources, including factors such as
corrosion and misalignment. However, failure can result from the slow deformation of the
dowel. As the dowel ages and is repeatedly compressed then decompressed by dynamic loads,
the dowel becomes unable to recover from these forces and begins to lose its shape. As this
deformation occurs, the dowel also loses its strength. Eventually, it will no longer be able to
hold the loads and a sudden failure, either by elongation of the bar or by complete rupture.
Since this malfunction occurs many years into the joints lifespan, a failure like this is difficult to
prevent or predict and has severe potential for damage and harm when it occurs (Belletti B,
2012).
Construction:
Concrete joints can be built using several different methods. The first method is by
laying the dowels into position using wire frames. The bars are placed at the mid height of the
concrete, e.g. if the concrete will be 12 inches thick, the bar will be set at 6 inches above the
subgrade. After the dowels are set, concrete in then poured over the bars and allowed to
harden. During the hardening process water is spread along the surfaces to midigate the drying
shrinkage and cracking that can occur under non-ideal conditions . A metal comb apparatus
then cuts grooves into the pavement to aid in water removal and road traction. Construction
laborers then saw a 2 inch cut into the concrete perpendicular to the dowel bars. Over time a
crack forms from this cut in the concrete, leaving the slabs on each site connected only by the
dowel bars (John B. Kornick, 1968).
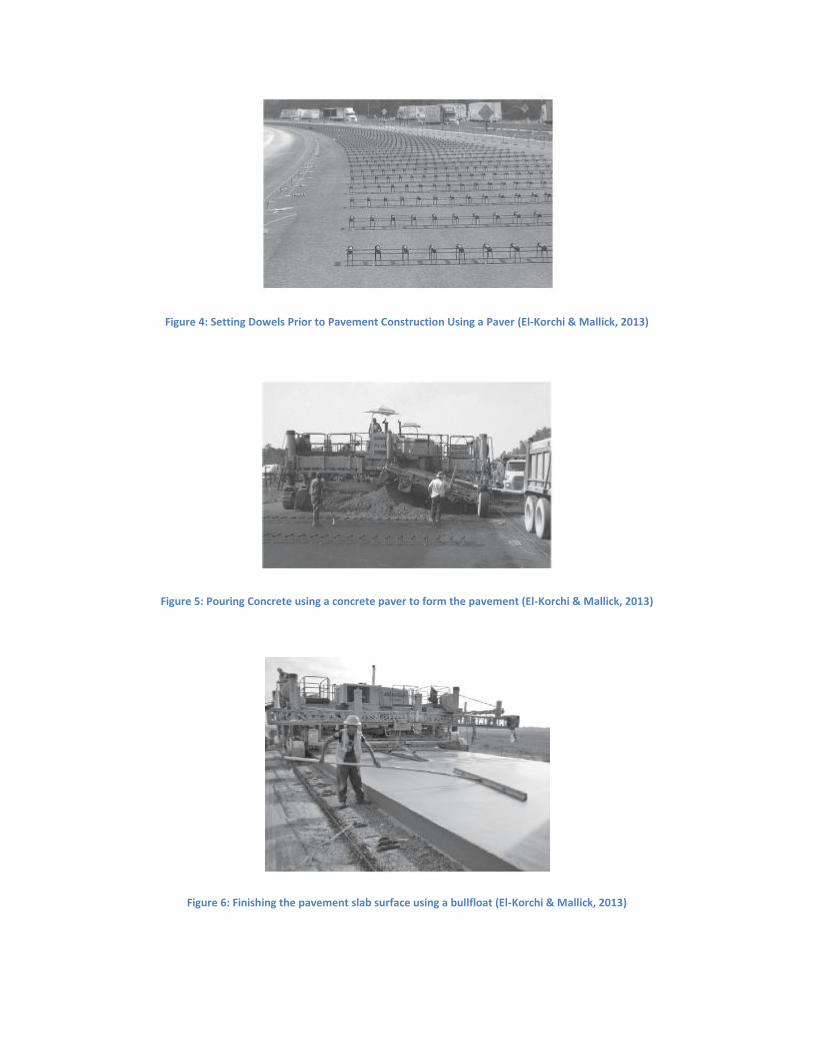
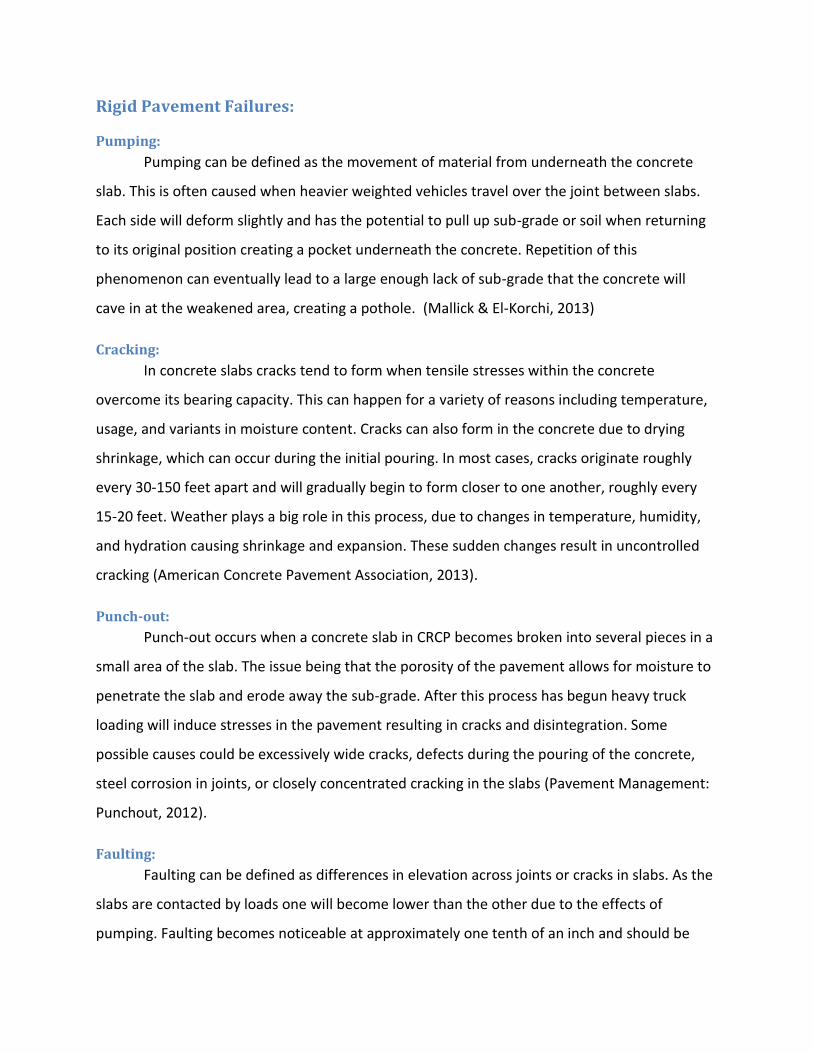
Figure 4: Setting Dowels Prior to Pavement Construction Using a Paver (El-Korchi & Mallick, 2013)
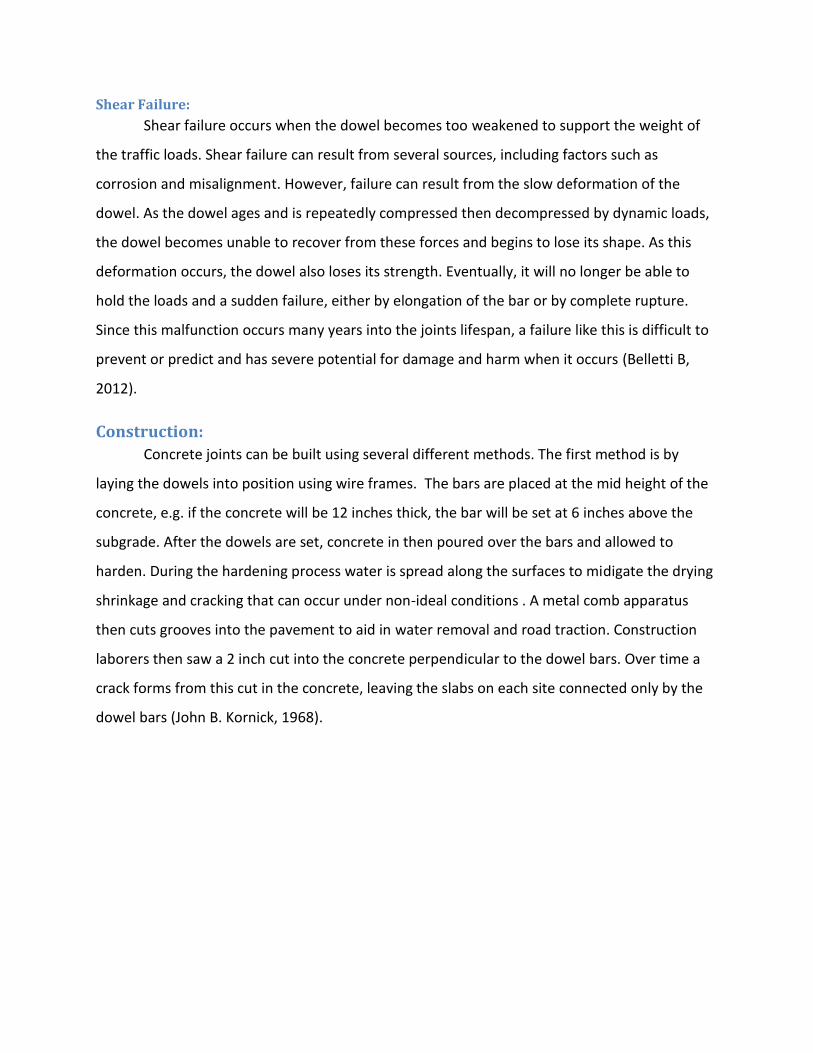
Figure 5: Pouring Concrete using a concrete paver to form the pavement (El-Korchi & Mallick, 2013)
Figure 6: Finishing the pavement slab surface using a bullfloat (El-Korchi & Mallick, 2013)

Figure 7: Creating Grooves in the Pavement using a steel comb apparatus (El-Korchi & Mallick, 2013)
Figure 8: Precut joint in concrete Slab with polymer filling (El-Korchi & Mallick, 2013)
A more automated way of construction is the use of a dowel laying machine. The
machine operates by moving along the path of the road, behind the concrete pouring machine.
The machine, at regular intervals places the dowel bars into the concrete. The concrete is then
vibrated, causing the dowel bars to sink into the concrete. This process has several
disadvantages to the aforementioned method. The first disadvantage is that it is impossible to
tell if the bars have reached the required depth and proper alignment in the concrete. The
second disadvantage is that since the machine must disturb already finished concrete to place
the dowels, a second finishing is required after the machine passes. The third disadvantage is

that most machines are manually loaded with dowels, which increases the time required to
fabricate each joint. Manual loading also poses an increased risk to laborers because it means
they must operate in close confines of moving machinery. These disadvantages are being
addressed with the more recent invention of a machine that drives instead of vibrates the bar
into position, allowing for more accurate insertions, as well as having automatically reloading
dowels, thus cutting down the amount of times that laborers have to reload the machine
(McConville, 1989).
Smart Materials:
Smart materials are part of a rapidly growing industry, as new ways to control the
properties of materials are being developed. Smart materials properties can be rapidly and
drastically altered when exposed to a certain external stimulus. Smart materials are capable of
rapid property changes when exposed to certain external stimuli such as:
Heating resulting in a return to original shape (Thermoresponsive materials)
Mechanical pressure resulting in electric charge (Piezoelectric materials)
Electric field resulting in change in viscosity (Electrorheological fluids)
Magnetic field resulting in change in viscosity (Magnetorheological fluids)
Smart materials are used in a variety of applications from the mending or replacement
of bones (Shape Memory Alloys) to mechanical dampeners in automobile suspension
(Magnetorheological fluids). The ‘smartness’ of the material is determined by several factors,
including the amount of energy needed to change the properties, the extent to which the
materials properties are altered, and the speed at which the properties are altered. The less
energy required, and the faster and greater the change in the properties, the ‘smarter’ the
material is considered to be (Rivera) (Bhattacharyya, 2001).
Magnetorheological Fluids:
Magnetorheological fluids, or MR fluids, are one of many smart materials that have
become a more common in industrial applications. MR fluids are smart materials in which the
viscosity is the controlled property. The viscosity of an MR fluid can be altered in milliseconds

when exposed to a magnetic field. MR fluids are becoming more prevalent in applications such
as dampeners and shock absorbers as the cost of producing MR fluid has been decreasing due
to an increase in production rates (G Bossisa, 2002).
MR Fluid Properties:
MR fluids are composed of magnetizable micro-particles, such as iron, suspended in a
carrier fluid, such as natural or synthetic oil. When in the presence of a magnetic field the iron
particles realign solidifying the fluid, allowing it to withstand significantly greater impact forces.
The strength of the fluid is dependent on the strength of the magnetic field, the rate of loading,
and the composition of the fluid. The strength of the magnetic field determines the fluids ability
to resist shear forces. However the fluids ability to resist shear forces is also dependent on the
rate of loading, with MR fluids capable of resisting greater loads under dynamic testing than
under static loading (LORD, 2008).
Rheology:
Rheology is derived from the Greek words rheo, meaning flow, and logos, meaning
science and is the study of a materials viscosity, or ability to flow. Rheology is usually used to
describe fluids, though it can also be used for soft solids and semisolids. The viscosity of a
material is determined by the fluids ability to resist fluid flow due to an internal friction. A
highly viscous material is a material in which the particles have a high level of attraction,
causing a high level of internal friction and a greater resistance to flow. (Vader & Wyss)
Magnetic Fields:
Magnetic fields are the mathematical description of the magnetic influence emanating
from electric currents and magnetic materials. Every magnetic field can be specified with a
direction and magnitude at any time. The Lorentz force exerted on the electric charges
generally defines these fields. The Lorentz force is when a particle moving in a magnetic field
experiences a sideways force relative to the strength of the magnetic field with velocity
perpendicular to it. Lorentz force is defined by the equation
where:
F= force
v= velocity
q= the electric charge of the particle
B= the magnetic field (tesla)
Moving electric charges, and the magnetic moment associated with their spin, is the
force that creates the magnetic fields. Moving electrons produce fields that depend on charge,
velocity, and particle acceleration. Magnetic field lines form in concentric circles around
conductors, such as wire. The further from the wire the weaker the magnetic field becomes
where strength decreases inversely proportional to the distance from the wire (Nave).
When a wire is bent to form a loop or coil the strength of the magnetic field inside the
loop increases while weakening the field outside of it. Multiple loops, forming a coil, amplify
this effect in the direction based on the ‘right hand rule’. A coil formed around a metal core
such as a steel rod can act as an electromagnet forming a strong, controlled magnetic field.
The number of loops in the coil does in fact create a stronger magnetic field and is
therefore important to note. Diameter of the coil is not relevant to the strength of the magnetic
field produced, only the number of coils and how closely they are wound together. This would
imply the only advantage to using a smaller diameter wire would be to make more coils closely
bound. However using a thicker wire allows the ability to send a stronger current through the
coil. Finite lengths of coils produce a uniform field with strength and polarity based on the
current flowing through said coil.

Chapter II: Slab Testing
Introduction:
In order to understand how rigid pavements worked a series of dynamic tests were
conducted on a dowel-jointed system. The dowel-jointed system consisted of a 48”x24”x7”
concrete slab. There were two dowels, 1 inch in diameter and 12 inches in length, laid in the
concrete on center, 12 inches apart from one another shown below in Figure 9.
Figure 9: Empty Slab Mold with Dowels place on chairs with strain gages attached (Photo Taken by David Magnano)
A plastic divider was placed horizontally in the center of the concrete slab approximately
1 inch into the slab. The concrete was allowed to cure for a day and then the divider was
removed, leaving a groove running horizontally across the slab; this would act as the joint. The
concrete was then allowed to cure to its 28-day strength of approximately 4000 psi. A picture of
the jointed slab after 1 day of curing is shown below in Figure 10.

Figure 10: Slab After Curing with strain wires attached to the dowel protruding from the concrete
(Photo Taken by David Magnano)
Testing for the slab was conducted using a three-point bend test. This was done by
placing the slab on supports in WPI’s Instron 8803. The sample was preloaded with a load of
200 lbs., which would prevent the slab from slipping without compromising the integrity of the
concrete. Once the slab was in place, it was then loaded with a sinusoidal load at 1 cycle per
second.

Figure 11: Example of Sinusiodal Loading from 200 to 500 lbs. at 1 Hz (Graph generated by wolframalpha.com)
Figure 12: Slab in Process of Being Tested (Photo Taken by David Magnano)
Methods:
Before the test could begin, theoretical calculations were performed to determine the
maximum force that could be applied. The first step of finding the maximum theoretical load

that could be applied to the slab was to find the radius of relative thickness. The equation for
the radius of relative thickness is:
where:
= radius of relative stiffness (in.; mm)
E = modulus of elasticity of the pavement (psi; MPa)
h = thickness of the pavement (in.; mm)
μ = Poisson’s ratio of the PCC (in./in.; mm/mm)
k = modulus of subgrade reaction (pound per cubic inch, pci or MN/m3)
In order for this equation to work, an assumption had to be made for the modulus of
subgrade reaction. Since, the slab was to be treated as a simply supported beam there would
be no subgrade for the testing, so a highly conservative value of 50 was used. When a value of
50 was applied for k in the equation, a value of 36.4 inches was determined for (El-Korchi &
Mallick, 2013).
The purpose of was to determine the load that would be applied to one dowel. In a
normal slab design, the slab is typically 12 feet or wider with dowels placed every foot. With a
system this wide the stress from a point load would be distributed across the entire length of
1.8 , in this case 65.5 inches. This would mean the load felt on the dowel directly below the
load would only be approximately 25 percent of the actual point load. For the dynamic testing,
the slab would only have a width of 24 inches, which is less than the 1.8 of 65.5 inches. This,
along with the fact that we would only be using two dowels instead of the required number of
7 dowels, would mean that each dowel would take a much higher percent of the applied load,
in this case, approximately 80 percent. Once the load capacity for each dowel was determined,
=Eh 3
12 1- m2( )k4

it was then possible to calculate the theoretical maximum load the slab could handle before
breaking.
The next step of the calculations was to determine the deformation at the face of the
joint. This was donen by using the equation:
t0 3
d d
P (2 z)y
4 E I
where:
y0 = the deformation of the dowel at the face of the joint
Pt = the load on one dowel
z = the joint width
Ed = Young’s modulus of the dowel
Id = the moment of inertia of the dowel
4
d
1I d
64
β = the relative stiffness of a dowel embedded in concrete
4
d d
KD
4E I
K = the modulus of the dowel support, which ranges from 300,000 to 1,600,000 pci
d = the diameter of the dowel
(El-Korchi & Mallick, 2013)
Several assumption where made in order to determine the deformation at the joint.
First, a load of 9,000lbs was chosen to be starting point for the calculations. The reason this
loading was chosen is that the point load of an 18-wheel truck is 9000lbs at each tire. Since,

each dowel in our slab would receive 80 percent of the test load a Pt of 7,200lbs. was used. The
next assumption was for the modulus of the dowel support K. A K-value of 1,600,000 pci was
used. With these assumptions, a deformation of value of .005 inches was determined.
The third step was to then determine the bearing stress in the concrete. The bearing
stress is proportional to the deformation and is calculated using the equation:
tb 0 3
d d
KP (2 z)Ky
4 E I
Using a K of 1,600,000 pci, the σb was determined to be 3,750 psi.
The final step of the calculations was to compare the actual bearing stress to the
allowable bearing stress. This was done by using the equation:
b c
(4 d)f f
3
where:
Fb= the allowable bearing stress
d= the diameter of the dowel
fc’= the ultimate compressive strength of the concrete
(El-Korchi & Mallick, 2013)
The dowels used in the testing were 1 inch in diameter and the strength of the concrete
was approximately 4,000 psi. Applying these parameters to the equation resulted in an
allowable bearing stress of 4,000 psi.
When the actual bearing stress was compared to the allowable shear stress, it was
determined to be too high, and a load smaller than 9,000 lbs. would have to be used for testing.
The test load was determined by using the equations for the actual bearing stress and the
deformation at the face of the joint as well as the parameter σb≤fb to solve for the Pt . The final

Pt was then multiplied by 5/4 for a load of 4,500lbs. A safety factor of 2 was used with the load
of 4,500lbs. to give a final theoretical test load of 2,250lbs.
The slab test was conducted by incrementally increasing the load on the slab. The test
iterations can be seen below in Table 1. The load was applied by a circular metal disc with a
diameter of 8 inches. The Instron 8803 began testing by starting at a constant applied load of
200lbs. to prevent any slippage between the supports and the slab during testing. The tester
then began applying a sinusoidal load with a frequency of 1 cycle per second, starting at 200lbs.
and the increasing up to 500lbs. This was repeated for 1 hour for a total of 3600 cycles.
Table 1: Slab Testing, Cycles Run for Each Loading
Loads and Duration of Each Iteration of Slab Testing
Load (lbs.)* Duration (hrs.) Cycles
500 1 3,600
1500 1 3,600
3000 1 3,600
2000 16 57,600
3000 1 3,600
4000** 2 7,200 *Every iteration started with a constant 200lbs.
**Load in which failure occurred
This process was repeated with loads of 1500lbs and 3000lbs. In order to see the effects
of repeated loads over an extended period of time a load of 2,000 lbs. was applied using the
same 1 cycle per second sinusoidal cycling for a 16 hour time period for a total of 57,600 cycles.
Upon completion of the 16 hour iteration, testing occurred periods using 3,000lbs for 4 hours
and 4,000lbs for 2 hours. It was during the 4,000lbs iteration that the slab failed, shown below
in Figure 13. Data for the test cycles can be found in Appendix D.
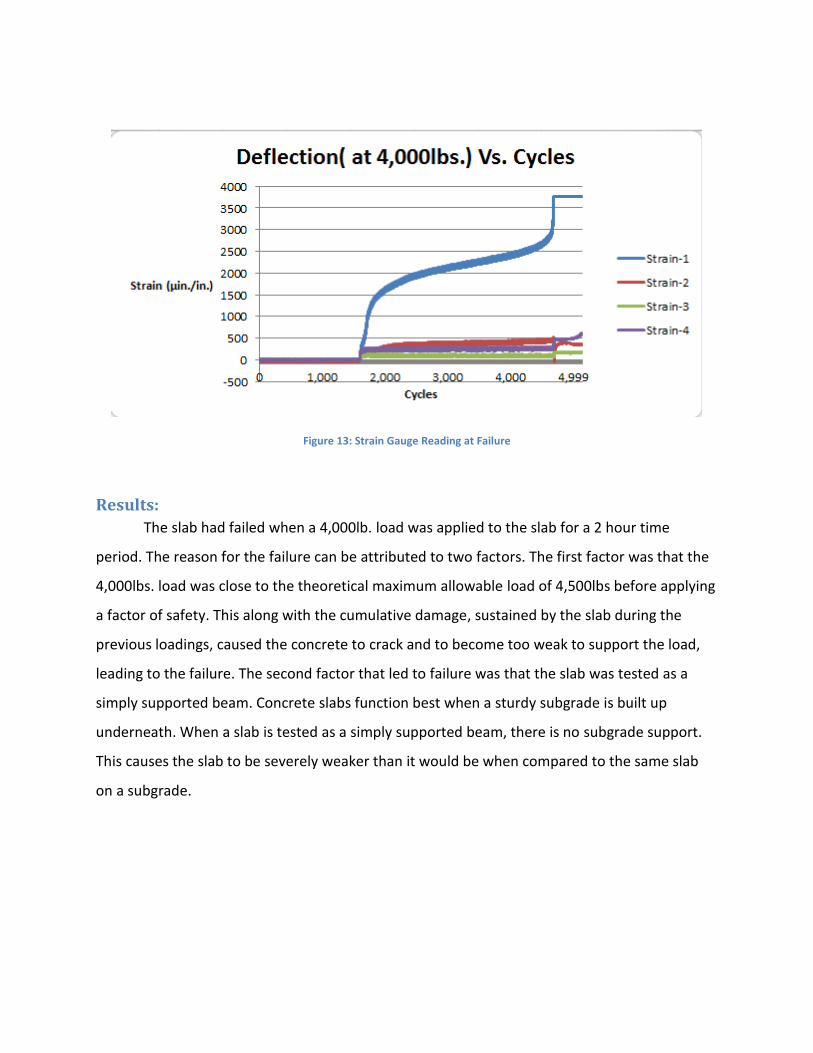
Figure 13: Strain Gauge Reading at Failure
Results:
The slab had failed when a 4,000lb. load was applied to the slab for a 2 hour time
period. The reason for the failure can be attributed to two factors. The first factor was that the
4,000lbs. load was close to the theoretical maximum allowable load of 4,500lbs before applying
a factor of safety. This along with the cumulative damage, sustained by the slab during the
previous loadings, caused the concrete to crack and to become too weak to support the load,
leading to the failure. The second factor that led to failure was that the slab was tested as a
simply supported beam. Concrete slabs function best when a sturdy subgrade is built up
underneath. When a slab is tested as a simply supported beam, there is no subgrade support.
This causes the slab to be severely weaker than it would be when compared to the same slab
on a subgrade.

Figure 14: Deflection Results at Time of Failure
Discussion:
The results of the slab testing made three things clear for any future testing. The two
limiting parameters of the testing were: the amount of time allowed for testing, and the
subgrade used for testing. In order to get a good representation of the stresses that are applied
to highway slabs, testing must be done to simulate the loading of several years of damage. This
is impossible to accomplish over the course of several days, therefore, future testing should be
done with a larger available test window. Future testing should also utilize a subgrade to more
realistically represent field conditions. Lacking a subgrade greatly reduced the slab’s ability to
absorb the test loads, leading to it to fail after only a few days of testing. The final conclusion
was that the placement of the strain gauges did not allow for any quantifiable observations to
be made. This is because the gauges were placed at the edge of the dowels instead of the
center. Future testing should look at the changes of strain in the middle of the dowels where
strain will be greatest.

Chapter III: Magnetorheological Fluid Testing
Introduction:
In order to determine if the Magnetorheological fluid fits the requirements for the
desired application the group ran several preliminary tests using CPVC (chlorinated polyvinyl
chloride) pipes in place of steel for the road dowels. The pipes all had the same dimensions with
an inner diameter of .5 inches, wall thickness of .1 inches, and a length of 12 inches. All
prototypes were capped with standard CPVC caps with Flow Guard Gold adhesive, shown
below in Figure 15. All of the prototypes had a variation of a magnetic coil or had rare earth
magnets placed along the dowel in order to test the material under the influence of a magnetic
field. The samples were then filled with the same MR fluid used in all of the group’s tests for
this experiment, LORD CG140.
Figure 15: CPVC Flow Guard Gold Adhesive (Photo Taken by David Magnano)
Methods:
Static Testing:
In the first round of testing the group compared the original prototype design, a CPVC
pipe with a single pass of 24 gauge copper wire, to an empty CPVC pipe and a CPVC pipe filled
with water (Samples 1.2, 1.0 and 1.1 respectively) all under static loading. The samples were
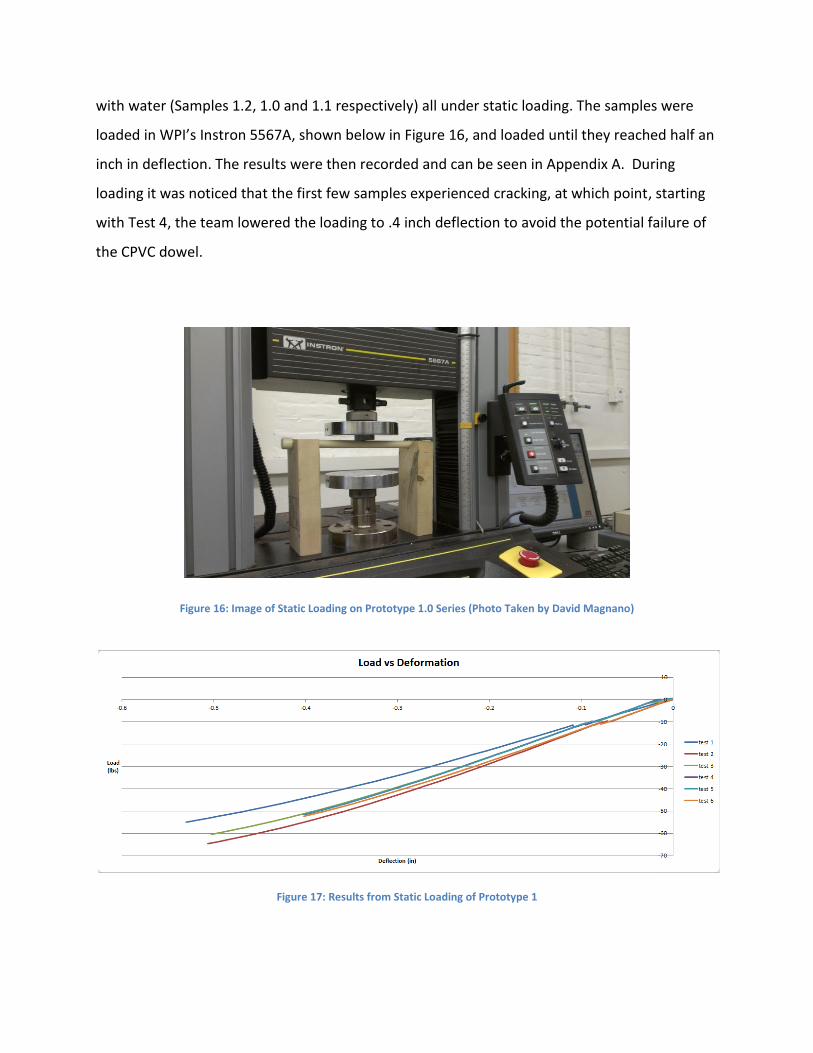
loaded in WPI’s Instron 5567A, shown below in Figure 16, and loaded until they reached half an
inch in deflection. The results were then recorded and can be seen in Appendix A. During
loading it was noticed that the first few samples experienced cracking, at which point, starting
with Test 4, the team lowered the loading to .4 inch deflection to avoid the potential failure of
the CPVC dowel.
Figure 16: Image of Static Loading on Prototype 1.0 Series (Photo Taken by David Magnano)
Figure 17: Results from Static Loading of Prototype 1

Table 2: Static Loading Test Iterations
Test Number Dowel tested
1 Empty CPVC Pipe
2 Water Filled CPVC Pipe
3 MR Fluid Filled CPVC Pipe
(no magnetic field)
4 MR Fluid Filled CPVC Pipe (magnetic field applied)*
5 MR Fluid Filled CPVC Pipe
(no magnetic field)*
6 MR Fluid Filled CPVC Pipe (magnetic field applied)*
*Testing with sample only loaded to .4” of deflection. Full results can be found in Appendix A.
Impact Testing:
The sample containing MR fluid with no magnetic coil, Sample 1.3, was then placed in
WPI’s Instron 8250 and tested under impact loading, held in the apparatus shown below in
Figure 18. The Instron 8250 was loaded with no added weights; however the total weight of the
steel impactor and necessary attachments was 12.47lbs the impactor was dropped from a
height of 1 inch in a total of 12 tests. As there was no magnetic coil in this model the magnetic
field was created by different arrangement of 40 neodymium magnets. The differing
arrangements were used in an attempt to determine if the location or orientation of the
magnetic field had an effect on the MR fluid’s shear resistance. Data was recorded by WPI’s
LVDT.

Figure 18: Testing Apparatus for Impact Loading (Photo Taken by David Magnano)
Figure 19: Results from Impact Loading of Prototype 1

Table 3: Impact Load Test Iterations
Test Number Magnet Configuration
0 none
1 8 centered magnet stacks of 5
2 none
3 none
4 8 centered stacks of 5
5 4 centered stacks of 10
6 4 centered stacks of 10
7 4 centered stacks of 10
8 40 horizontal centered (fell off)
9 1 centered stack of 40*
10 1 centered stack of 40
11 1 centered stack of 40* *Omitted due to recording error. Full results can be found in Appendix B.
Results:
The prototype 1.0 series contributed no noteworthy additional support to the CPVC
containers during testing, both static and impact. While this was to be expected with the static
loading, as MR fluid resists shear forces when under rapid dynamic loading, this was
unexpected during the impact loading.
Discussion:
As shown by the results from the static and impact testing preformed on the prototype
1.0 series, a simple enclosed container of MR fluid, under the presence of a magnetic field,
provides no noticeable resistance to static bending or impact forces. While bending forces
result in a small amount of experienced internal shear, as the molecules experience
compressive forces above opposed to tensile forces below, the shear forces are only internal on
a molecular level. MR fluid is highly resistant to shear forces between particles, as the
magnetized particles are realigned in a specific orientation based on the direction of the
magnetic field. It is the bond between the particles, not the particles themselves, that is
resistant to shear forces. This observation eventually led to the manual manipulation and
syringe testing performed by the group
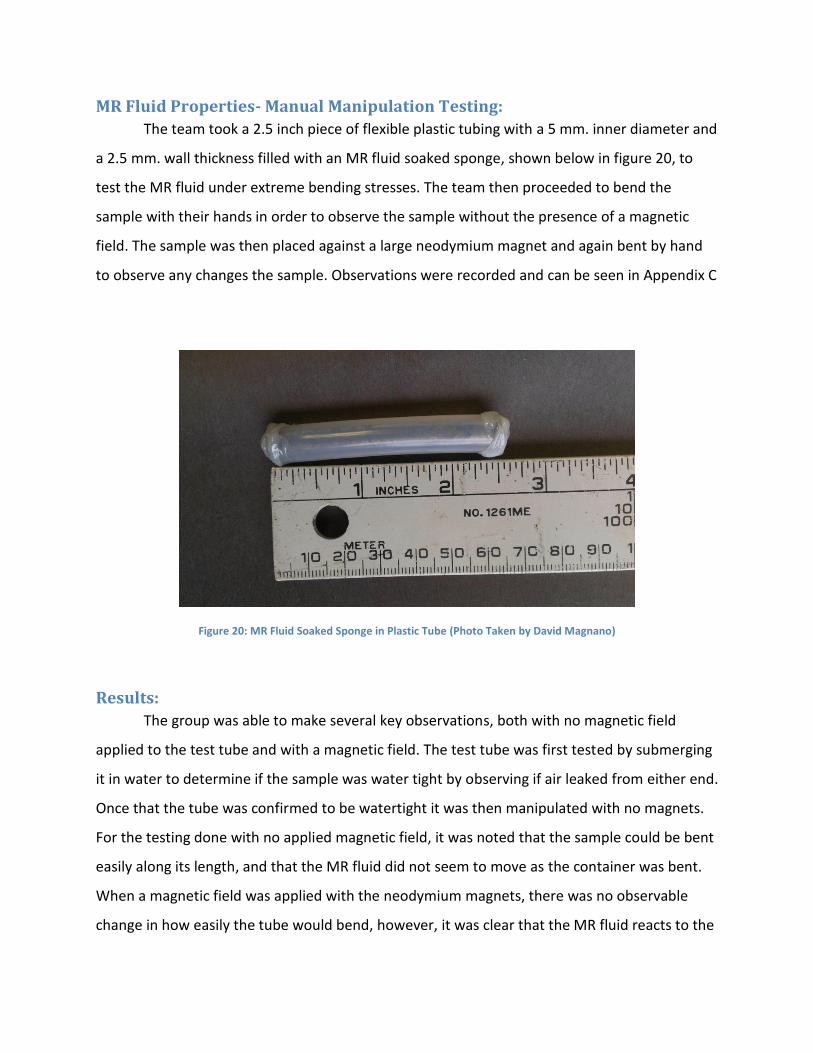
MR Fluid Properties- Manual Manipulation Testing:
The team took a 2.5 inch piece of flexible plastic tubing with a 5 mm. inner diameter and
a 2.5 mm. wall thickness filled with an MR fluid soaked sponge, shown below in figure 20, to
test the MR fluid under extreme bending stresses. The team then proceeded to bend the
sample with their hands in order to observe the sample without the presence of a magnetic
field. The sample was then placed against a large neodymium magnet and again bent by hand
to observe any changes the sample. Observations were recorded and can be seen in Appendix C
Figure 20: MR Fluid Soaked Sponge in Plastic Tube (Photo Taken by David Magnano)
Results:
The group was able to make several key observations, both with no magnetic field
applied to the test tube and with a magnetic field. The test tube was first tested by submerging
it in water to determine if the sample was water tight by observing if air leaked from either end.
Once that the tube was confirmed to be watertight it was then manipulated with no magnets.
For the testing done with no applied magnetic field, it was noted that the sample could be bent
easily along its length, and that the MR fluid did not seem to move as the container was bent.
When a magnetic field was applied with the neodymium magnets, there was no observable
change in how easily the tube would bend, however, it was clear that the MR fluid reacts to the

magnetic field and was being pulled towards to the magnet. These observations allowed us to
make conclusions on the nature of MR fluid.
Discussion:
The observations from the manual manipulation testing confirmed that the original
prototype design would not be effective as an MR fluid dampener for rigid pavement distress
mitigation. As the sample was contained within an extremely flexible casing, any rigidity
observed would have been due to the MR fluid. The team observed no noteworthy differences
between bending the sample with or without the presence of a magnetic field, regardless of the
rate of bending. The cumulative observations confirmed the group’s hypothesis that MR fluid
was not resistant to the internal shear forces resulting from bending stresses.
MR Fluid Properties- Syringe Testing:
Using two syringes, connected by various means, the team attempted to create an
environment which forced MR fluid to pass through an opening that decreased in cross-
sectional area, as shown below in Figure 21.
Figure 21: MR Fluid Sample in Connected Syringes (Photo Taken by David Magnano)
Of the several attempts only three samples lasted long enough to be tested; one with no
change in cross-sectional area, one with approximately 50 percent decrease in cross-sectional

area at the joint, and one with approximately 75 percent decrease in cross-sectional area at the
joint. The several other samples manufactured did not last long enough to be tested as the oils
in the MR fluid caused the multiple adhesives used to fail to bond to the plastic of the syringes.
The three samples were tested by hand under the following conditions: No magnet, Magnet
placed on center (on the joint), Magnet placed on end. The observations were recorded and
can be found in Appendix C
Results: It was noted in all of the samples that, when no magnetic field was present, it was simple to
push the MR fluid from one syringe to another. When the magnetic field was present at joint between
the syringes it was not possible to force the MR fluid through a decrease in cross-section area by hand.
However, in the sample with no change in cross-sectional area, it was still possible to move the MR fluid
from one syringe to another, regardless of the presence of a magnetic field. It was also noted that, when
the magnetic field was located at the end of the syringe, the MR fluid could pass through the decrease in
cross-sectional area, dragging the magnet along the surface of the syringe, until the magnet reached the
joint in the syringes.
Discussion:
The observations from the syringe testing further confirmed the group’s hypothesis that
the MR fluid must experience shear forces between the molecules, not within the molecules,
for there to be any noticeable resistance. The team observed that the MR fluid displayed the
greatest resistance when passing through a connection with a decrease in cross-sectional area.
This observation led to the design of Prototype 2.0, and later (in an attempt to simplify the
second design) Prototype 3.0. Both designs attempted to convert the bending forces from
loading directly to shear forces.
Prototype 2.0:
The Prototype 2.0 design consisted of six compartments, all containing MR fluid,
surrounding a magnetic coil located in the center 1 foot span of a 2 foot dowel. These
compartments were joined by small openings through which the MR fluid could flow when
pressure was applied to the uppermost compartment. The upper compartment was capable of
compressing under load while the remaining five compartments were capable of expanding to

compensate for the movement of MR fluid. Once the load was no longer being applied all
compartments would reset to their original positions as the springs contained in each
compartment forced the caps back into position.
As prototype 2.0 was too complex to manufacture, given the limited capacity of the WPI
machine laboratories, no testing was ever performed on the design. The third and final design
was made in an attempt to simplify this design, which is included in the report in Appendix E.

Chapter IV: Final Design
Introduction:
Prototype 3.0, shown in Figure 22, was the final design, created in an attempt to
simplify the 2nd prototype design. This design allowed for the MR fluid to be contained within
one compartment separated by the core of the dowel, around which the magnetic coil would
be wrapped.
Figure 22: Prototype 3.0 Concept Design (CAD Drawing by David Magnano)
Openings at either end of the core, as well as space between the magnetic coil and the outer
wall, allow the MR fluid to flow from one end of the compartment to another when pressure
was applied to the top of the dowel. For ease of manufacturing and testing, a square steel pipe
was used in place of the round pipe featured in the design. The shell, manufactured from a

square steel pipe with a width of 2 inches and wall thickness of .2 inches, can be seen below in
Figure 23.
Figure 23: Manufacturing of Prototype 3.0 (Photo Taken by David Magnano)
Methods:
Prototype 3.0 was tested in WPI’s Instron 8250 under Impact loading. The team loaded
the dowel with 18lbs dropped from increasing heights, until the sealant used to contain the MR
fluid failed. In all 31 tests were performed, two from each height, alternating between magnetic
field applied, and no magnetic field applied. The following tests were performed; data was
recorded by WPI’s LVDT:
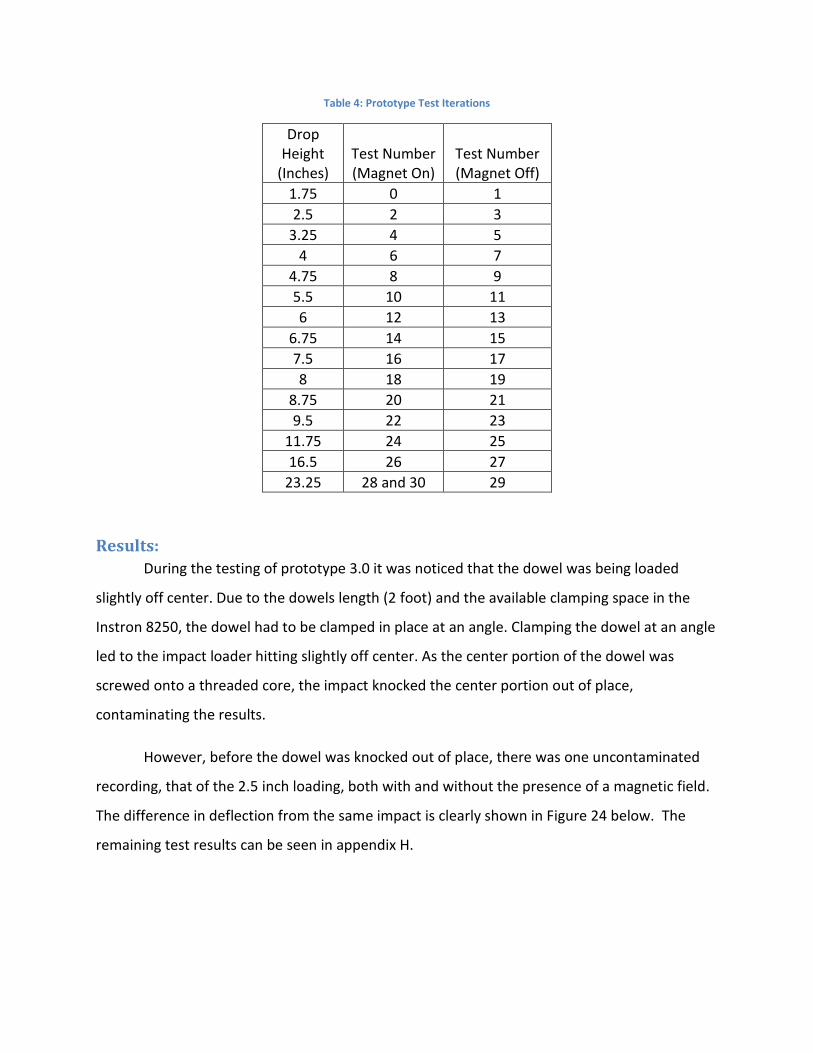
Table 4: Prototype Test Iterations
Drop Height
(Inches) Test Number (Magnet On)
Test Number (Magnet Off)
1.75 0 1
2.5 2 3
3.25 4 5
4 6 7
4.75 8 9
5.5 10 11
6 12 13
6.75 14 15
7.5 16 17
8 18 19
8.75 20 21
9.5 22 23
11.75 24 25
16.5 26 27
23.25 28 and 30 29
Results:
During the testing of prototype 3.0 it was noticed that the dowel was being loaded
slightly off center. Due to the dowels length (2 foot) and the available clamping space in the
Instron 8250, the dowel had to be clamped in place at an angle. Clamping the dowel at an angle
led to the impact loader hitting slightly off center. As the center portion of the dowel was
screwed onto a threaded core, the impact knocked the center portion out of place,
contaminating the results.
However, before the dowel was knocked out of place, there was one uncontaminated
recording, that of the 2.5 inch loading, both with and without the presence of a magnetic field.
The difference in deflection from the same impact is clearly shown in Figure 24 below. The
remaining test results can be seen in appendix H.

Figure 24: Deflection Results from 2.5" Drop Impact Test
Discussion:
While this data is not enough for the group to declare the prototype a success, it is
enough to warrant further testing of the concept and design. However, the increase in
deflection may have been the result of several factors, all of which must be examined during
future iterations of this testing. While the change in deflection may have been caused by a
change in the MR fluid, it may also have been the initial point of failure for the adhesive (H2
Hold Epoxy) containing the MR fluid. As seen in Figure 25 below, the failure occurred at the
location of the adhesive bonding to one end of the steel shell, allowing the MR fluid to leak
through the gap between the shell and cap.
-0.25
-0.245
-0.24
-0.235
-0.23
-0.225
0 0.05 0.1 0.15 0.2
Deflection (in.)
Time (Seconds)
2.5"
Magnet On
Magnet Off

Figure 25: Prototype 3.0 at Failure (Photo Taken by David Magnano)

Chapter V: Cost Analysis
Introduction:
To determine the cost effectiveness of implementing MR fluid filled dowels in rigid
pavement the team needed to first calculate the cost of manufacturing the final design. Once
calculated the cost would be compared to the cost of an average steel dowel. However, while
this gives a basic comparison between the two, the true cost of the dowels, both the standard
dowels and the team’s design, far exceed the basic cost of manufacturing. While the team will
determine the difference between the two dowels, calculating the total life-cycle cost of the
design is beyond the scope of this project.
Discussion:
As MR fluid is currently priced at $750.00 per liter, and the current design uses 200mL of
MR fluid, the cost of the MR fluid dampened dowel starts at $150.00. This is not including the
price of steel and manufacturing costs as the majority of the steel was taken from the Kaven
lab’s existing stock, and the manufacturing was done by the team. Further cost analyses were
deemed unnecessary, as the $150.00 per dowel base price made the dowel economically
inefficient. However, as the price of MR fluid drops, the dampened dowel design may become
more economically feasible.
Chapter VI: Overall Conclusions While the results from testing the third prototype were not enough to prove the team’s
hypothesis, they were enough to elicit future testing of the design. However, the group was
able to prove the initial hypothesis, resulting from the failure of the prototype 1.0 series, that
MR fluid must be forced undergo a change in cross-sectional area so that the bond between the
suspended iron particles, under the influence of a magnetic field, can bear the resultant shear
stresses. The group was also able to document the effects of loading on a dowel jointed rigid
slab for comparison against future testing with MR fluid dampened dowels in rigid pavement.
More testing is required to determine if the concept will function under field conditions and if
the design, compared to the expected life-cycle of the dowel, could be economically viable in
the future.

Works Cited: Building Code Requirements for Structural Concrete (ACI 318-08) and Commentary. (2008).
Farmington Hills, MI: American Concrete Institute.
Pavement Management: Faulting. (2012). Retrieved April 20, 2013, from Pavement Interactive:
http://www.pavementinteractive.org/article/faulting/
Pavement Management: Punchout. (2012). Retrieved April 20, 2013, from Pavement
Interactive: http://www.pavementinteractive.org/article/punchout/
American Concrete Pavement Association. (2013). Retrieved April 20, 2013, from
http://www.pavement.com/Concrete_Pavement/Technical/FATQ/Construction/Crackin
g.asp
ARTBA. (2013). Building a Better America Through Transportation Construction. Retrieved
January 26, 2013, from ARTBA American Road and Transportation Builders Association:
http://www.artba.org/about/faqs-transportation-general-public/faqs/#10
ASCE. (n.d.). 2009 Report Card for America's Infrastructure. Retrieved December 27, 2012, from
ASCE American Society of Civil Engineers: http://www.asce.org/Infrastructure/Report-
Card/2009-Report-Card-for-America-s-Infrastructure/
Belletti B, C. R. (2012). Design Aspects on Steel Fiber-Reinforced Concrete Pavements. Journal
of Materials in Civil Engineering , 599-607.
Bhattacharyya, D. A. (2001, August 17). Smart Materials. Retrieved November 20, 2012, from
Smart Materials:
http://webdocs.cs.ualberta.ca/~database/MEMS/sma_mems/smrt.html
David Jolivet, D. M. (2007, July). The corrosion resistance of coated steel dowels determined by
impedance spectroscopy. Cement and Concrete Research, pp. 1134-1143.
El-Korchi, T., & Mallick, R. B. (2013). Pavement Engineering Principles and Practice. Boca Raton:
CRC Press.
G Bossisa, S. L. (2002, November). Magnetorheological fluids. Retrieved November 20, 2013,
from SciVerse: http://www.sciencedirect.com/science/article/pii/S0304885302006807
John B. Kornick, e. a. (1968). Patent No. 3397626. United States of America.
LORD. (2008). MRF-140CG Magneto-Rheological Fluid. Retrieved November 20, 2012, from
LORD ask how: http://www.lord.com/products-and-solutions/magneto-rheological-
(mr)/product.xml/1646

McConville, D. J. (1989, August 10). LexisNexis Academinc. Retrieved October 17, 2012, from
LexisNexis Academinc:
http://au4sb9ax7m.search.serialssolutions.com/?ctx_ver=Z39.88-
2004&ctx_enc=info%3Aofi%2Fenc%3AUTF-
8&rfr_id=info:sid/summon.serialssolutions.com&rft_val_fmt=info:ofi/fmt:kev:mtx:journ
al&rft.genre=article&rft.atitle=Highways%3A+Machine+Places+Dowels+Evenly&
Nave, R. (n.d.). Magentic Fields. Retrieved April 20, 2013, from Hyper Physics:
http://hyperphysics.phy-astr.gsu.edu/hbase/magnetic/magfie.html
Priya Saxena, K. H. (2012). Laboratory and analytical modelling of misaligned dowel.
International Journal of Pavement Engineering , 209-215.
Rheology Basics. (n.d.). Retrieved March 20, 2013, from Rheology:
http://www.me.umn.edu/~kstelson/research_sbp/sbp/rheology.html
Rivera, A. C. (n.d.). Types of Smart Materials. Retrieved November 20, 2012, from Smart
Materials: http://academic.uprm.edu/pcaceres/Undergrad/Smart-Alessandra/id18.htm
Vader, D., & Wyss, H. (n.d.). Introduction. Retrieved March 20, 2013, from Weitzlab:
http://weitzlab.seas.harvard.edu/links/tutorials/introductiontorheology2.pdf
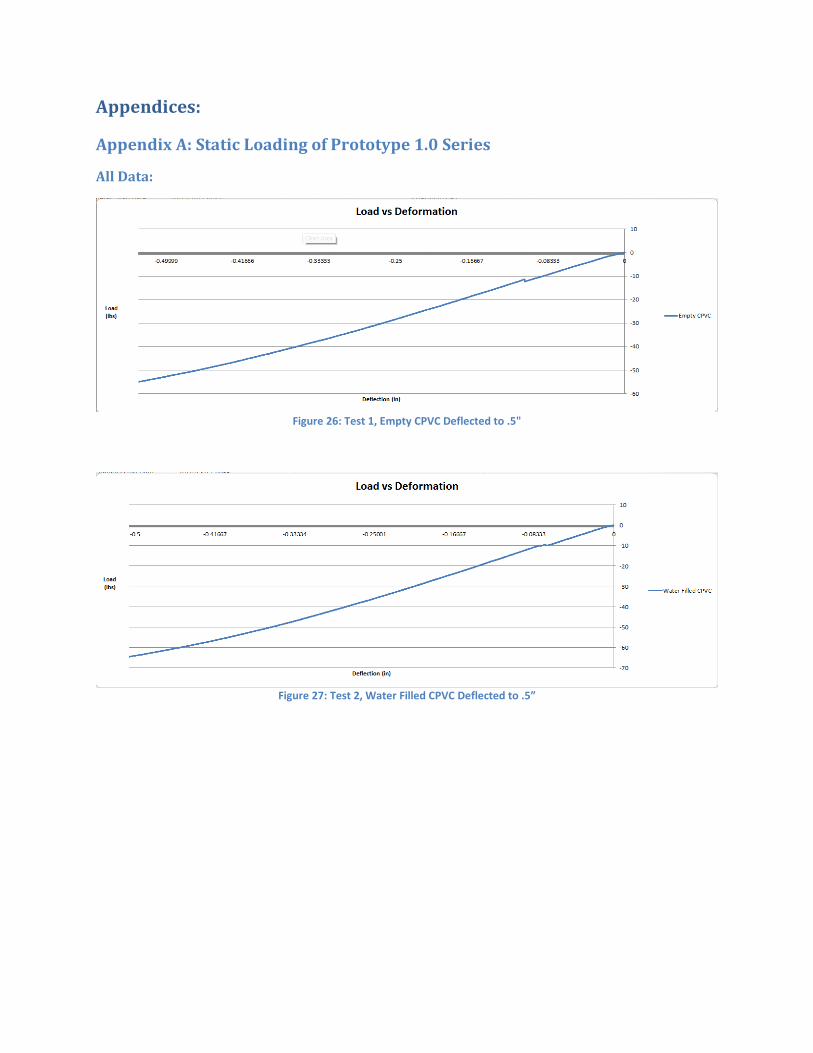
Appendices:
Appendix A: Static Loading of Prototype 1.0 Series
All Data:
Figure 26: Test 1, Empty CPVC Deflected to .5"
Figure 27: Test 2, Water Filled CPVC Deflected to .5”

Figure 28: Test 3, MR Fluid Filled CPVC (no magnetic field) Deflected to .5”
Figure 29: Test 4, MR Fluid Filled CPVC (magnetic field) Deflected to .4”
Figure 30: Test5, MR Fluid Filled CPVC (no magnetic field) Deflected to.4”

Figure 31: Test 6, MR Fluid Filled CPVC (magnetic field) Deflected to .4”
Figure 32: Cumulative Data
Figure 33: Image of Static Loading Test Preformed on WPI’s Instron 5567A (Photo Taken by David Magnano)

Appendix B: Impact Testing of Prototype 1.0 Series
All Data:
Figure 34: No Magnets
Figure 35: 8 Stacks of 5 Magnets On Center
Figure 36: No Magnets
Figure 37: No Magnets

Figure 38: 8 Stacks of 5 Magnets On Center
Figure 39: 4 Stacks of 10 Magnets On Center
Figure 40: 4 Stacks of 10 Magnets On Center
Figure 41: 4 Stacks of 10 Magnets On Center
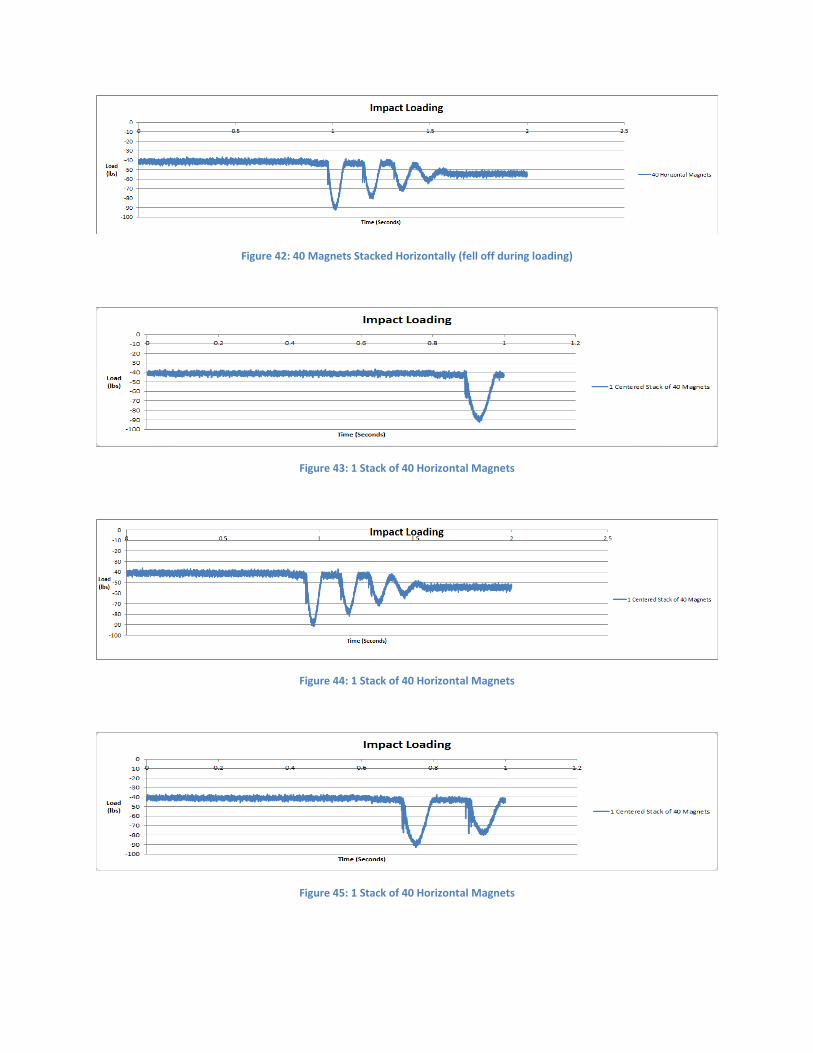
Figure 42: 40 Magnets Stacked Horizontally (fell off during loading)
Figure 43: 1 Stack of 40 Horizontal Magnets
Figure 44: 1 Stack of 40 Horizontal Magnets
Figure 45: 1 Stack of 40 Horizontal Magnets

Figure 46: Image of Testing Apparatus for Impact Loading (Photo Taken by David Magnano)

Impact Data:
Figure 47: No Magnets
Figure 48: 8 Stacks of 5 Magnets On Center
Figure 49: No Magnets
Figure 50: No Magnets

Figure 51: 8 Stacks of 5 Magnets On Center
Figure 52: 4 Stacks of 10 Magnets On Center
Figure 53: 4 Stacks of 10 Magnets On Center
Figure 54: 4 Stacks of 10 Magnets On Center
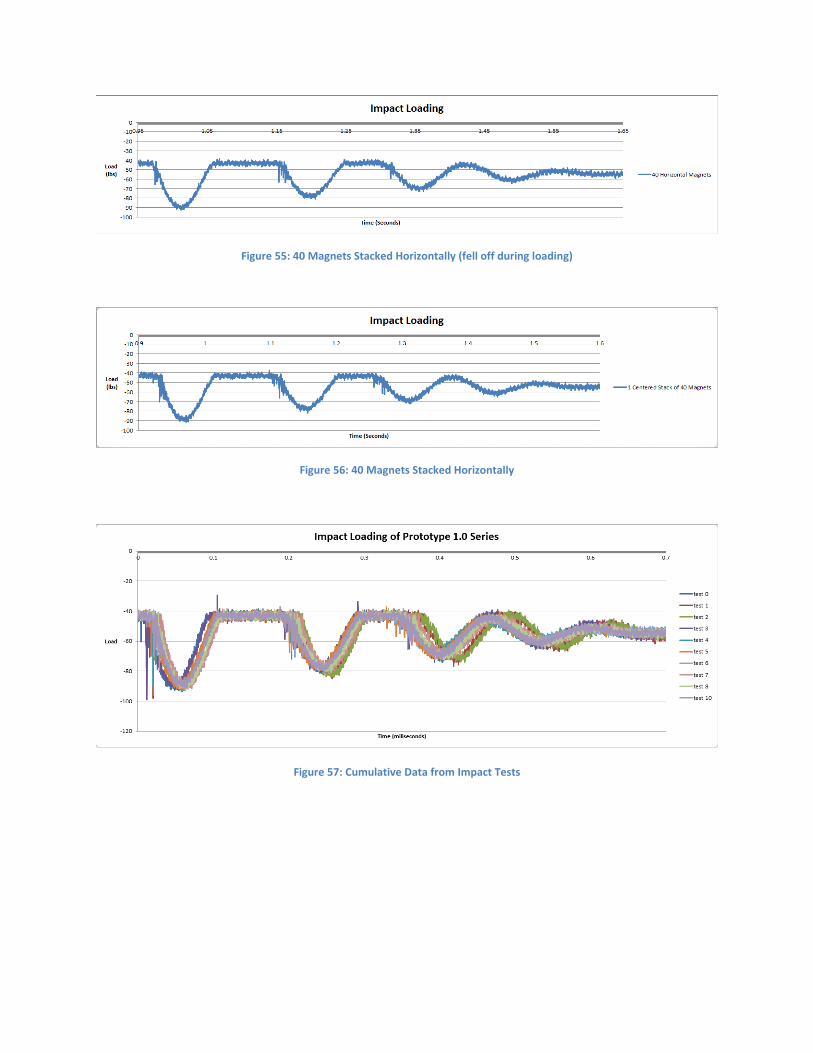
Figure 55: 40 Magnets Stacked Horizontally (fell off during loading)
Figure 56: 40 Magnets Stacked Horizontally
Figure 57: Cumulative Data from Impact Tests

Appendix C: MR Fluid Sample Testing
Figure 58: MR Fluid Soaked Sponge Contained in Plastic Tubing (Photo Taken by David Magnano)
Figure 59: MR Fluid Sample in Connected Syringes (Photo Taken by David Magnano)

Figure 60: Hand Bending Observations
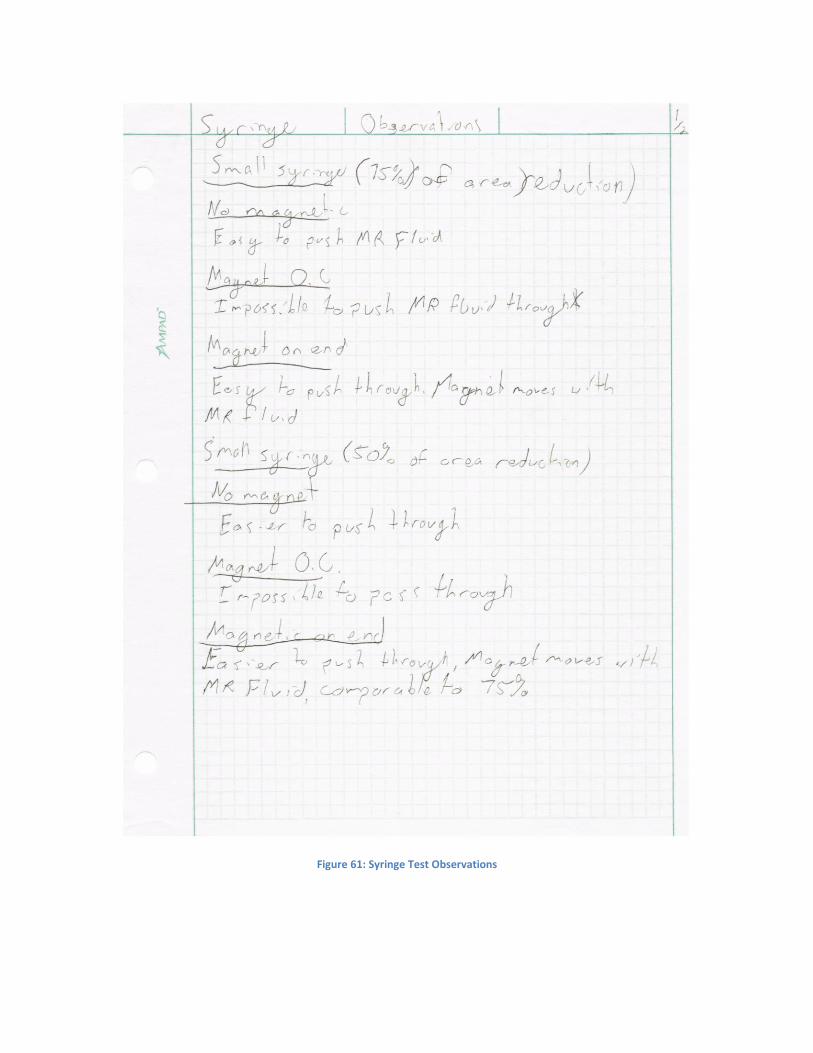
Figure 61: Syringe Test Observations

Figure 62: Syringe Test Observations Cont.

Appendix D: Slab Testing
Figure 63: Testing Conducted at 500lbs
Figure 64: Testing Conducted at 1500lbs
Figure 65: 3000lbs Initial Iteration
Figure 66: Testing Conducted at 2000lbs

Figure 67: Testing Conducted at 3000lbs
Figure 68: Testing Conducted at 4000lbs

Figure 69: Slab Calculations

Figure 70: Slab Calculations Continued

Appendix E: Prototype 2.0
Figure 71: Prototype 2.0 Concept Design (CAD Drawing by David Magnano)

Appendix F: Prototype 3.0
Figure 72: Auto CAD Concept Drawing of Prototype 3.0 (CAD Drawing by David Magnano)
Figure 73: Picture of Prototype 3.0 Core and Magnetic Coil (Photo Taken by David Magnano)

Figure 74: Prototype 3.0 During Construction (Photo Taken by David Magnano)
Appendix G: 3-D Printer
The 3-D plastic printer was originally intended to be used to test the second prototype.
However the 3-D printer was unavailable at the time of the second design, and the team waited
to print the third prototype. 3-D printing provided a cheap and fast alternative to building a full
size, steel version of the prototype. This model would have been tested using the same
equipment used to test the CPVC prototypes from the first design. In order to test the feasibility
of the concept theoretical calculations of the design were done to prove that the design could
handle enough of a load to be used for testing.
The 3-D printing was done on the Dimension SST 1200ES Rapid Prototype Machine. This
machine operates by layering plastic to construct the object. This process allows for rapid,
cheap construction, but the final product is porous and not fully watertight. The plastic used in
the printing is P430 ABSplus, which has a modulus of elasticity of 320,000psi and a specific
gravity of 1.04.
The plastic design of the prototype was analyzed using basic stress and strain equations
to look at the design’s ability to with stand the bending forces placed on the cap if it was tested
using a standard three point test. The calculations looked at: the theoretical maximum flexural
strength of the dowel, the total deflection of the dowel on center under a given load, and the
total strain put on the dowel due to flexural stress. Although, the caps were irregularly shaped,
the moment of inertia was still easily calculable by splitting the cap into 2 rectangles and a
semi-circle, and summing the respective shapes, giving a final moment of inertia of .0224 in4.
Theoretical analysis of the 3-D printer prototype determined that the dimensions of the
dowel would not be able to handle a load large enough to be tested dynamically or statically.
The overall bending strength of the cap was 45 pounds (for a deflection of .2 inches). Trying a
higher load than this could cause the cap to rupture after the deflection exceeded .2 inches.
The inability to test can be linked to two main causes, both stemming from the type of
material used in the 3-D printer. The first reason being the maximum load of the beam was too
small to be read by the testing machines 10,000lbs load cell, making it impossible to collect any
data accurately. The second reason was that the water tightness of the final product would not

allow for use with MR fluid. The 3-D printer works by layering melted plastic to build up the
final design. This causes the final product to be very porous and prone to leaks. Any leaks in the
prototype would negate the effects of the MR fluid and make any data collected invalid. A more
durable plastic could have been used to fabricate the design, but would have been 8 times
more expensive than the ABS plastic, making it outside of this project’s budget.
The 3-D printer model was determined too weak of a design to be used effectively for
testing. However, the prototype did serve as an opportunity to provide a visual demonstration
of how the proposed design would work conceptually. Several dimensions on the final printed
product were scaled up in order to accentuate certain aspects of the design as well as to ensure
that the design was within the tolerances of the 3-D printer.

Appendix H: Prototype 3.0 Testing
Figure 75: 1.75" Impact Loading Height
Figure 76: 2.5" Impact Loading Height

Figure 77: 3.25" Impact Loading Height
Figure 78: 4" Impact Loading Height

Figure 79: 4.75" Impact Loading Height
Figure 80: 5.5" Impact Loading Height

Figure 81: 6" Impact Loading Height
Figure 82: 6.75" Impact Loading Height
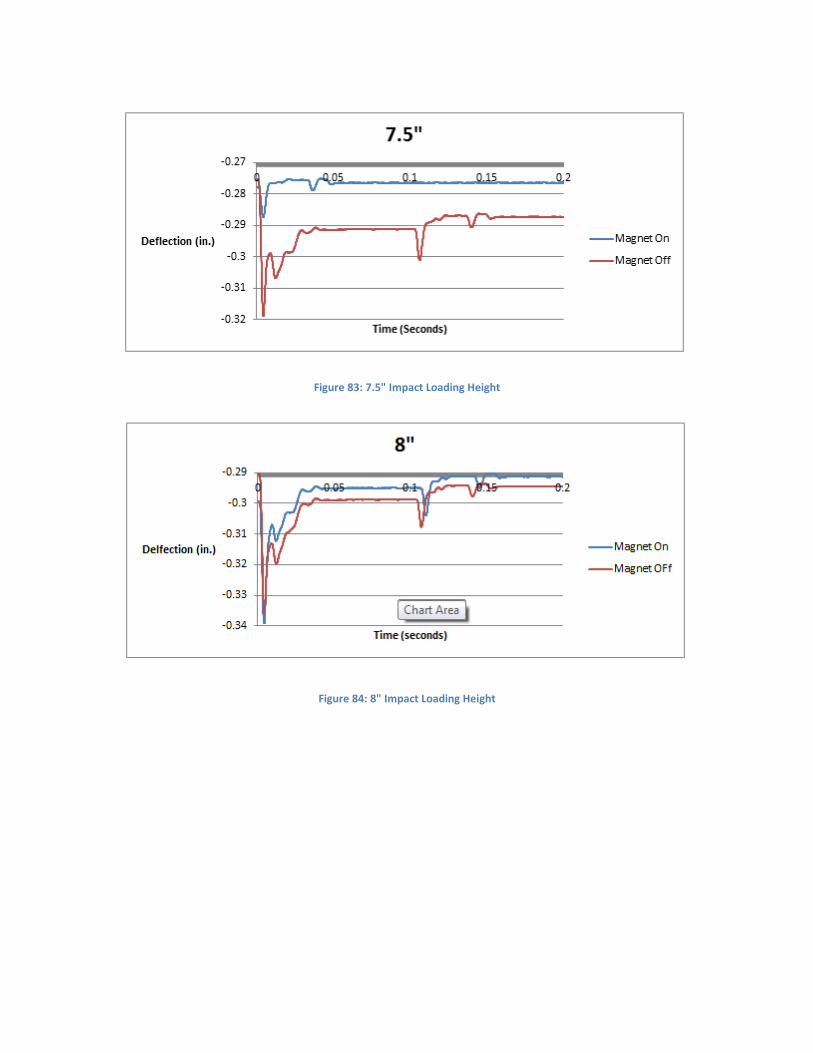
Figure 83: 7.5" Impact Loading Height
Figure 84: 8" Impact Loading Height

Figure 85: 8.75" Impact Loading Height
Figure 86: 9.5" Impact Loading Height

Figure 87: 11.75" Impact Loading Height
Figure 88: 16.5" Impact Loading Height

Figure 89: 23.25" Impact Loading Height
Figure 90: LVDT Attached to Prototype 3.0 During Testing (Photo Taken by David Magnano)

Figure 91: Prototype 3.0 Secured in Instron 8250 (Photo Taken by David Magnano)
Figure 92: Prototype 3.0 During Testing (Photo Taken by David Magnano)

Figure 93: Prototype 3.0 at Failure (Photo Taken by David Magnano)