
Magnetic Resonance Imaging Outcomes From a Comprehensive Magnetic Resonance Study of
19
Magnetic Resonance Imaging Outcomes From a Comprehensive Magnetic Resonance Study of Children With Fetal Alcohol Spectrum Disorders Susan J. Astley, Elizabeth H. Aylward, Heather Carmichael Olson, Kimberly Kerns, Allison Brooks, Truman E. Coggins, Julian Davies, Susan Dorn, Beth Gendler, Tracy Jirikowic, Paul Kraegel, Kenneth Maravilla, and Todd Richards Background: Magnetic resonance (MR) technology offers noninvasive methods for in vivo assessment of neuroabnormalities. Methods: A comprehensive neuropsychological ⁄ psychiatric battery, coupled with MR imaging, (MRI), MR spectroscopy (MRS), and functional MRI (fMRI) assessments, were administered to children with fetal alcohol spectrum disorders (FASD) to determine if global and ⁄ or focal abnor- malities could be identified, and distinguish diagnostic subclassifications across the spectrum. The 4 study groups included: (i) fetal alcohol syndrome (FAS) ⁄ partial FAS (PFAS); (ii) static encephalopathy ⁄ alcohol exposed (SE ⁄ AE); (iii) neurobehavioral disorder ⁄ alcohol exposed (ND ⁄ AE) as diagnosed with the FASD 4-Digit Code; and (iv) healthy peers with no prenatal alcohol exposure. Presented here are the MRI assessments that were used to compare the sizes of brain regions between the 4 groups. The neuropsychological ⁄ behavioral, MRS, and fMRI outcomes are reported separately. Results: Progressing across the 4 study groups from Controls to ND ⁄ AE to SE ⁄ AE to FAS ⁄ PFAS, the mean absolute size of the total brain, frontal lobe, caudate, putamen, hippocam- pus, cerebellar vermis, and corpus callosum length decreased incrementally and significantly. The FAS ⁄ PFAS group (the only group with the 4-Digit FAS facial phenotype) had disproportionately smaller frontal lobes relative to all other groups. The FAS ⁄ PFAS and SE ⁄ AE groups [the 2 groups with the most severe central nervous system (CNS) dysfunction] had disproportionately smaller caudate regions relative to the ND ⁄ AE and Control groups. The prevalence of subjects in the FAS ⁄ PFAS, SE ⁄ AE, and ND ⁄ AE groups that had 1 or more brain regions, 2 or more SDs below the mean size observed in the Control group was 78, 58, and 43%, respectively. Significant correlations were observed between size of brain regions and level of prenatal alcohol exposure, magnitude of FAS facial phenotype, and level of CNS dysfunction. Conclusions: Magnetic resonance imaging provided further validation that ND ⁄ AE, SE ⁄ AE, and FAS ⁄ PFAS as defined by the FASD 4-Digit Code are 3 clinically distinct and increasingly more affected diagnostic subclassifications under the umbrella of FASD. Neurostructural abnor- malities are present across the spectrum. MRI could importantly augment diagnosis of conditions under the umbrella of FASD, once population-based norms for structural development of the human brain are established. Key Words: Fetal Alcohol Spectrum Disorder, Magnetic Resonance Imaging, FASD 4-Digit Diagnostic Code. F ETAL ALCOHOL SYNDROME (FAS) is a perma- nent birth defect syndrome caused by maternal alcohol consumption during pregnancy. FAS is defined by growth deficiency, a unique cluster of minor facial anomalies, and central nervous system (CNS) dysfunction and ⁄ or structural brain abnormalities (Smith, 1979). The cognitive ⁄ behavioral problems in this condition stem from prenatal brain damage. Not all individuals with prenatal alcohol exposure present with measurable CNS dysfunction or structural brain abnor- malities, and not all who present with measurable CNS dysfunction or structural brain abnormalities have FAS. Recently, the term fetal alcohol spectrum disorders (FASD) was coined to depict the spectrum of outcomes observed From the Department of Epidemiology (SJA, AB, SD, BG, PK), Pediatrics (SJA, JD), Radiology (EHA, KM, TR), Psychiatry and Behavioral Sciences (HCO), Speech and Hearing Sciences (TEC), and Rehabilitation Medicine (TJ), University of Washington, Seattle, Washington; and Department of Psychology, University of Victoria (KK), Victoria, Canada. Received for publication August 18, 2008; accepted April 25, 2009. Reprint requests: Susan Astley, PhD, Center on Human Develop- ment and Disability, P.O. Box 357920, University of Washington, Seattle, WA 98195-7920; Fax: 206-598-7815; E-mail: astley@u. washington.edu Copyright Ó 2009 by the Research Society on Alcoholism. DOI: 10.1111/j.1530-0277.2009.01004.x Alcoholism: Clinical and Experimental Research Vol. 33, No. 10 October 2009 Alcohol Clin Exp Res, Vol 33, No 10, 2009: pp 1–19 1
Transcript of Magnetic Resonance Imaging Outcomes From a Comprehensive Magnetic Resonance Study of
Magnetic Resonance Imaging Outcomes From a
Comprehensive Magnetic Resonance Study of Children
With Fetal Alcohol Spectrum Disorders
Susan J. Astley, Elizabeth H. Aylward, Heather Carmichael Olson, Kimberly Kerns, AllisonBrooks, Truman E. Coggins, Julian Davies, Susan Dorn, Beth Gendler, Tracy Jirikowic,
Paul Kraegel, Kenneth Maravilla, and Todd Richards
Background: Magnetic resonance (MR) technology offers noninvasive methods for in vivoassessment of neuroabnormalities.
Methods: A comprehensive neuropsychological ⁄ psychiatric battery, coupled with MR imaging,(MRI), MR spectroscopy (MRS), and functional MRI (fMRI) assessments, were administered tochildren with fetal alcohol spectrum disorders (FASD) to determine if global and ⁄ or focal abnor-malities could be identified, and distinguish diagnostic subclassifications across the spectrum.The 4 study groups included: (i) fetal alcohol syndrome (FAS) ⁄ partial FAS (PFAS); (ii) staticencephalopathy ⁄ alcohol exposed (SE ⁄AE); (iii) neurobehavioral disorder ⁄ alcohol exposed(ND ⁄AE) as diagnosed with the FASD 4-Digit Code; and (iv) healthy peers with no prenatalalcohol exposure. Presented here are the MRI assessments that were used to compare the sizes ofbrain regions between the 4 groups. The neuropsychological ⁄ behavioral, MRS, and fMRIoutcomes are reported separately.
Results: Progressing across the 4 study groups from Controls to ND ⁄AE to SE ⁄AE toFAS ⁄PFAS, the mean absolute size of the total brain, frontal lobe, caudate, putamen, hippocam-pus, cerebellar vermis, and corpus callosum length decreased incrementally and significantly. TheFAS ⁄PFAS group (the only group with the 4-Digit FAS facial phenotype) had disproportionatelysmaller frontal lobes relative to all other groups. The FAS ⁄PFAS and SE ⁄AE groups [the 2groups with the most severe central nervous system (CNS) dysfunction] had disproportionatelysmaller caudate regions relative to the ND ⁄AE and Control groups. The prevalence of subjects inthe FAS ⁄PFAS, SE ⁄AE, and ND ⁄AE groups that had 1 or more brain regions, 2 or more SDsbelow the mean size observed in the Control group was 78, 58, and 43%, respectively. Significantcorrelations were observed between size of brain regions and level of prenatal alcohol exposure,magnitude of FAS facial phenotype, and level of CNS dysfunction.
Conclusions: Magnetic resonance imaging provided further validation that ND ⁄AE, SE ⁄AE,and FAS ⁄PFAS as defined by the FASD 4-Digit Code are 3 clinically distinct and increasinglymore affected diagnostic subclassifications under the umbrella of FASD. Neurostructural abnor-malities are present across the spectrum. MRI could importantly augment diagnosis of conditionsunder the umbrella of FASD, once population-based norms for structural development of thehuman brain are established.
Key Words: Fetal Alcohol Spectrum Disorder, Magnetic Resonance Imaging, FASD 4-DigitDiagnostic Code.
F ETAL ALCOHOL SYNDROME (FAS) is a perma-nent birth defect syndrome caused by maternal alcohol
consumption during pregnancy. FAS is defined by growthdeficiency, a unique cluster of minor facial anomalies, andcentral nervous system (CNS) dysfunction and ⁄or structuralbrain abnormalities (Smith, 1979). The cognitive ⁄behavioralproblems in this condition stem from prenatal brain damage.Not all individuals with prenatal alcohol exposure presentwith measurable CNS dysfunction or structural brain abnor-malities, and not all who present with measurable CNSdysfunction or structural brain abnormalities have FAS.Recently, the term fetal alcohol spectrum disorders (FASD)was coined to depict the spectrum of outcomes observed
From the Department of Epidemiology (SJA, AB, SD, BG, PK),Pediatrics (SJA, JD), Radiology (EHA, KM, TR), Psychiatry andBehavioral Sciences (HCO), Speech and Hearing Sciences (TEC),and Rehabilitation Medicine (TJ), University of Washington, Seattle,Washington; and Department of Psychology, University of Victoria(KK), Victoria, Canada.
Received for publication August 18, 2008; accepted April 25, 2009.Reprint requests: Susan Astley, PhD, Center on Human Develop-
ment and Disability, P.O. Box 357920, University of Washington,Seattle, WA 98195-7920; Fax: 206-598-7815; E-mail: [email protected]
Copyright � 2009 by the Research Society on Alcoholism.
DOI: 10.1111/j.1530-0277.2009.01004.x
Alcoholism: Clinical and Experimental Research Vol. 33, No. 10October 2009
Alcohol Clin Exp Res, Vol 33, No 10, 2009: pp 1–19 1
among individuals with prenatal alcohol exposure. The degreeof brain damage among individuals with prenatal alcoholexposure may vary from microcellular and neurochemicalaberrations to gross structural anomalies. Similarly, cogni-tive ⁄behavioral dysfunction varies along the full continuumfrom mild developmental delay or learning disabilities toglobal developmental disability (Astley et al., 2009b). Thespecificity of the FAS facial phenotype to prenatal alcoholexposure lends credence to the clinical judgment that the cog-nitive and behavioral dysfunction observed in individuals withFAS is due, at least in part, to brain damage caused by ateratogen (Aase et al., 1995; Astley and Clarren, 2001; Astleyet al., 2002). Unfortunately, without the unique facial pheno-type of FAS or at least a severe or clinically obvious expres-sion of brain damage, the neurodevelopmental disabilities ofan individual affected by prenatal alcohol exposure often gounrecognized and inappropriately served (Streissguth et al.,1993).Many individuals with prenatal alcohol exposure exhibit
cognitive difficulties and significant maladaptation thatprevent them from leading productive, independent lives(Stratton et al., 1996; Streissguth et al., 2004). Across the pop-ulation, the profile of cognitive dysfunction among individu-als with prenatal alcohol exposure is highly variable, althoughthere are some commonalities in functional compromiseamong subgroups, and conceptual models of overarching def-icits have been proposed (Kodituwakku, 2007). However, nosingle behavioral phenotype specific to alcohol teratogenicityhas been described. Without a behavioral phenotype specificto the teratogen alcohol, attributing an alcohol-exposedchild’s dysfunction to brain damage is often questionable at aclinical level (Aase et al., 1995). If indisputable evidence ofbrain damage (e.g., alterations in neurostructure, neuro-metabolites, and ⁄or neuroactivation) could be found in theseindividuals, and linked to behavioral deficit, diagnostic effortscould be improved. The ‘‘disability’’ of these alcohol-exposedchildren would be clearly established, and help facilitate eligi-bility for needed services. Further, if specific alterations inneurostructure, neurometabolites, and ⁄or neuroactivationcould be linked to clinically meaningful, discrete neuropsy-chological deficits, development of appropriate interventionprograms could be accelerated.The overall goal of this research study was to determine if
magnetic resonance (MR) imaging (MRI), MR spectroscopy(MRS), and ⁄or functional MRI (fMRI) could serve as non-invasive methods for definitively identifying global and ⁄orfocal brain abnormality across the full continuum of FASD,and distinguish diagnostic subclassifications within the spec-trum. The results of this comprehensive study are presentedin 4 separate reports: MRI (presented here) and theneuropsychological ⁄behavioral (Astley et al., 2009b), MRS(Astley et al., 2009c), and fMRI (Astley et al., 2009a) outcomesreported separately. The focus on FASD diagnostic methodo-logy in this report directly responds to the following ResearchRecommendations for Diagnostic Criteria published in theInstitute of Medicine report on FASD (Stratton et al., 1996)
research: (i) to evaluate the utility, reliability, and validity ofschemes for classification and diagnosis, (ii) to identify poten-tial structural or functional brain abnormalities and otherneurobiological indices that may be associated with or distin-guish FAS, alcohol-related neurodevelopmental disorder(ARND), or alcohol-related birth defect, and to relate theseabnormalities and indices to cognitive and behavioralcorrelates.Magnetic resonance imaging allows for very sensitive
assessment of size, shape, spatial orientation, and even tissuecomposition of selected brain regions. Numerous FASDMRI studies have been conducted to date (Archibald et al.,2001; Bookstein et al., 2002b; Mattson et al., 2001; Milleret al., 1999; Riley et al., 1995; Sowell et al., 2001b, 2002a,b).Documented abnormalities include reduction in overall brainsize, reduction in absolute size of selected brain regions (basalganglia, caudate, cerebellum, and anterior ⁄posterior regionsof the corpus callosum), disproportionate reduction of thecaudate, alterations in shape and spatial orientation of thecorpus callosum, and white matter hypoplasia in the parietaland temporal lobes.The majority of FASDMRI studies published to date have
enrolled study groups diagnosed or classified as FAS, fetalalcohol effects (FAE), ARND, or prenatal exposure toalcohol (PEA) prior to the establishment of comprehensive,case-defined FASD diagnostic guidelines that are quicklybecoming best practice (Astley, 2004; Bertrand et al., 2004;Chudley et al., 2005). The specific diagnostic criteria used toestablish the FASD study groups (e.g., level of growth defi-ciency; type, number and severity of facial anomalies; breadthand magnitude of neuropsychological impairment; type ofneurostructural anomaly present), providing confirmation thatFASD diagnostic subgroups are clinically and statistically dis-tinct from each other, are typically not reported. Absence ofrigorous diagnostic methods can lead to diagnostic misclassifi-cation. Astley and Clarren (2000) and Hoyme and colleagues(2005) have both demonstrated that individuals diagnosedwith FAS by a gestalt approach often lose that diagnostic clas-sification when more rigorous diagnostic guidelines areapplied. Misclassification impacts study validity and reducesthe power of a study to detect clinically meaningful differencesbetween FASD subgroups. If specific diagnostic features thatdefine the FASD study groups are not clearly reported, thislimits the ability to compare outcomes across studies.In general, most FASDMRI studies have found significant
differences between FAS and control groups, regardless ofdiagnostic system used; but have not always found differencesbetween clinical subgroups on the fetal alcohol spectrum. Inthe current study, the sizes of brain regions were comparedbetween 3 FASD diagnostic subgroups and a healthy controlgroup with no prenatal alcohol exposure. An important goalof this MRI study was to determine if meaningful neurostruc-tural differences do exist between FASD subgroups when thesubgroups, including FAS, are rigorously case-defined(Astley, 2004) and confirmed to be clinically and statisticallydistinct from one another (Astley et al., 2009b).
2 ASTLEY ET AL.
MATERIALS AND METHODS
Subjects and Study Groups
The protocol was approved by the University of WashingtonHuman Subjects Review Board. The goal of the study was to create3 clinically distinct and increasingly less affected FASD study groupsand 1 healthy unexposed control group that fell along the followingordinal scale: (i) significant brain damage ⁄dysfunction with the FASfacial phenotype; (ii) significant brain damage ⁄dysfunction withoutthe FAS facial phenotype; (iii) mild to moderate brain dysfunctionwithout the FAS facial phenotype, and (iv) healthy with no prenatalalcohol exposure. The 3 FASD groups were selected from among1,200 patients previously diagnosed by an interdisciplinary team inthe WA State FAS Diagnostic & Prevention Network (FAS DPN)of clinics using a practical, comprehensive diagnostic system calledthe FASD 4-Digit Code (Astley, 2004; Astley and Clarren, 2000).Briefly, the 4 digits of the FASD 4-Digit Code reflect the magnitude
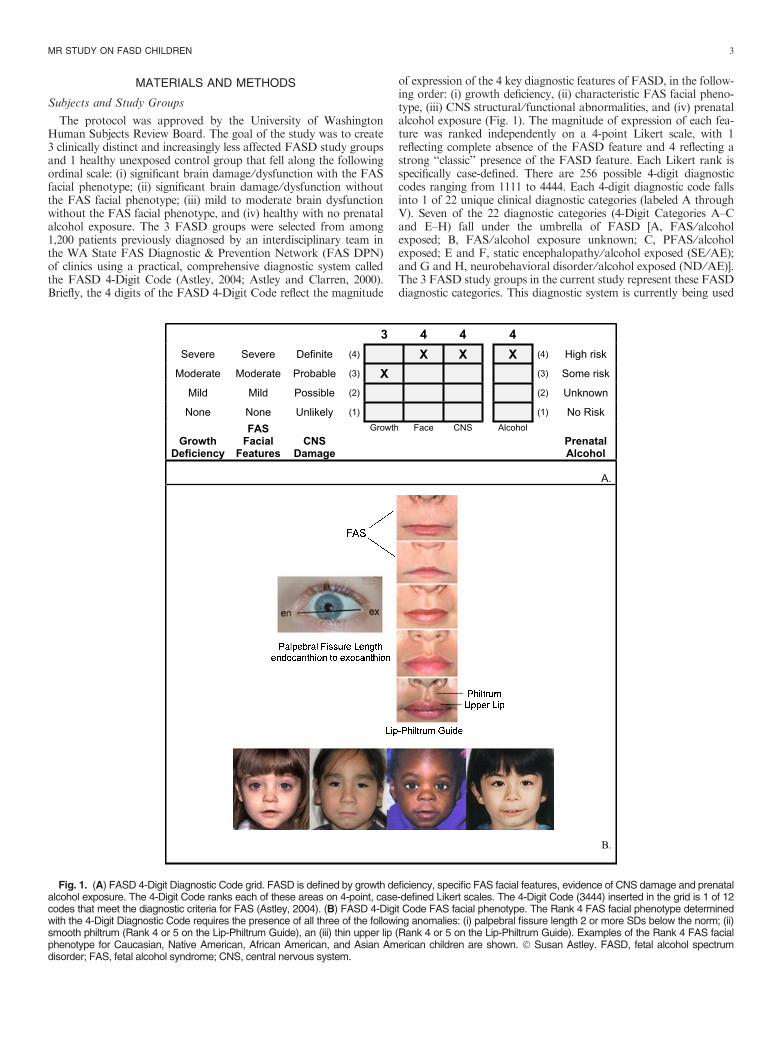
of expression of the 4 key diagnostic features of FASD, in the follow-ing order: (i) growth deficiency, (ii) characteristic FAS facial pheno-type, (iii) CNS structural ⁄ functional abnormalities, and (iv) prenatalalcohol exposure (Fig. 1). The magnitude of expression of each fea-ture was ranked independently on a 4-point Likert scale, with 1reflecting complete absence of the FASD feature and 4 reflecting astrong ‘‘classic’’ presence of the FASD feature. Each Likert rank isspecifically case-defined. There are 256 possible 4-digit diagnosticcodes ranging from 1111 to 4444. Each 4-digit diagnostic code fallsinto 1 of 22 unique clinical diagnostic categories (labeled A throughV). Seven of the 22 diagnostic categories (4-Digit Categories A–Cand E–H) fall under the umbrella of FASD [A, FAS ⁄alcoholexposed; B, FAS ⁄alcohol exposure unknown; C, PFAS ⁄alcoholexposed; E and F, static encephalopathy ⁄alcohol exposed (SE ⁄AE);and G and H, neurobehavioral disorder ⁄alcohol exposed (ND ⁄AE)].The 3 FASD study groups in the current study represent these FASDdiagnostic categories. This diagnostic system is currently being used
Fig. 1. (A) FASD 4-Digit Diagnostic Code grid. FASD is defined by growth deficiency, specific FAS facial features, evidence of CNS damage and prenatalalcohol exposure. The 4-Digit Code ranks each of these areas on 4-point, case-defined Likert scales. The 4-Digit Code (3444) inserted in the grid is 1 of 12codes that meet the diagnostic criteria for FAS (Astley, 2004). (B) FASD 4-Digit Code FAS facial phenotype. The Rank 4 FAS facial phenotype determinedwith the 4-Digit Diagnostic Code requires the presence of all three of the following anomalies: (i) palpebral fissure length 2 or more SDs below the norm; (ii)smooth philtrum (Rank 4 or 5 on the Lip-Philtrum Guide), an (iii) thin upper lip (Rank 4 or 5 on the Lip-Philtrum Guide). Examples of the Rank 4 FAS facialphenotype for Caucasian, Native American, African American, and Asian American children are shown. � Susan Astley. FASD, fetal alcohol spectrumdisorder; FAS, fetal alcohol syndrome; CNS, central nervous system.
MR STUDY ON FASD CHILDREN 3
by a wide variety of diagnostic teams in United States and othercountries. The control population for this study was selected primar-ily from a large cohort of children enrolled at birth in a University ofWashington study of typical development conducted through theDepartment of Speech and Hearing Sciences. With the enrollment ofeach child in the FAS ⁄partial FAS (PFAS) group, a child matchedon age (within 6 months), gender, and race was randomly identifiedand invited to enroll from the eligible SE ⁄AE, ND ⁄AE, and Controlpopulations. The enrollment goal was 80 subjects (20 per group).The study enrollment procedure produced a sample of 81 children
of diverse ethnicity. The age range (8 to 15.9 years) included thebroadest age range of children that could be administered a compara-ble psychometric assessment battery and be reasonably capable ofparticipating in the MR scanning. Each of the 4 study groups had 16to 24 subjects successfully balanced on age, gender, and race. The 61children with FASD were highly representative of the entire clinicsample of 1,200 from which they were drawn. The clinic populationof 1,200 was 43% female, 51% Caucasian, with 40% between 8 and15.9 years of age. The 4-Digit Codes of all 81 children were presentedin the neuropsychological ⁄behavioral report for this study (Astleyet al., 2009b). The diagnostic features specific to each group are asfollows:
1. Children in Group 1 had a 4-Digit diagnosis of FAS ⁄PFAS (e.g.,4-Digit Diagnostic Categories A, B, C: with Growth Ranks 1–4,Face Ranks 3–4, CNS Ranks 3 and ⁄or 4, and Alcohol Ranks 2–4) (Fig. 1). Alcohol Rank 2 (unknown exposure) could only bepresent if the child had a diagnosis of full FAS because the Rank4 FAS facial features are so specific to prenatal alcohol exposure(Astley and Clarren, 1996; Astley et al., 2002). As the only clinicaldifference between FAS and PFAS in this study was the presenceof growth deficiency in the former, FAS and PFAS werecombined. In summary, children in Group 1 had severe cogni-tive ⁄behavioral dysfunction and the FAS facial phenotype.
2. Children in Group 2 had a 4-Digit diagnosis of SE ⁄AE (e.g., 4-Digit Diagnostic Categories E and F: with Growth Ranks 1–4,Face Ranks 1–2, CNS Ranks 3 and ⁄or 4, and Alcohol Ranks3–4). In summary, children in Group 2 had severe cogni-tive ⁄behavioral dysfunction, comparable with Group 1, but didnot have the FAS facial phenotype.
3. Children in Group 3 had a 4-Digit diagnosis of ND ⁄AE (e.g., 4-Digit Diagnostic Categories G and H: with Growth Ranks 1–4,Face Ranks 1–2, CNS Rank 2, and Alcohol Ranks 3–4). In sum-mary, children in Group 3 had prenatal alcohol exposure likeGroups 1 and 2, but had only mild to moderate cognitive ⁄behavioral dysfunction, and did not have the FAS facialphenotype.
4. Children in Group 4 (Healthy Controls ⁄No Alcohol Exposure)were selected based on parental report that the child was healthy,had no academic concerns, and no prenatal alcohol exposure(e.g., 4-Digit Diagnostic Category V: with Growth Ranks 1–2,FAS Face Ranks [no restrictions], CNS Rank 1, Alcohol Rank1). In summary, these were nonexposed, healthy, average to high-functioning controls.
Using the FASD terminology introduced by Stratton andcolleagues (1996), the SE ⁄AE and ND ⁄AE groups most closelyreflected the severe and mild expressions of ARND, respectively. Acomprehensive analysis of the between-group differences of thesediagnostic features is presented in the neuropsychological ⁄psychiatricreport for this study (Astley et al., 2009b).Within our FASD participants, 1 subject with PFAS had agene-
sis of the corpus callosum (ACC) and 1 subject with FAS hadhypogenesis of the corpus callosum (HCC). That these subjectshad callosal abnormalities was known prior to study enrollment.Indeed these 2 subjects with ACC ⁄HCC were the only docu-mented cases of ACC ⁄HCC in the 2,040 patients with prenatalalcohol exposure diagnosed to date at the WA State FAS DPN
clinics. MRIs were typically only available when clinically indi-cated (e.g., evidence of neurological abnormalities). As such, only204 (10%) of the 2,040 patients evaluated at the FAS DPN had aprevious MRI evaluation summarized in their medical record and76% of the 204 MRI evaluations were interpreted as normal bythe patient’s neuroradiologist. Although ACC ⁄HCC has beenobserved in individuals with FASD (Riley et al., 1995), ACC ⁄HCC is not specific to prenatal alcohol exposure. The prevalenceof ACC among developmentally disabled populations is estimatedto be 2 to 3 per 100 (Jeret et al., 1986). Thus, a causal linkbetween ACC ⁄HCC and prenatal alcohol exposure in these 2 indi-viduals should not be assumed nor can it be ruled out. As all cur-rent FASD diagnostic guidelines (Astley, 2004; Bertrand et al.,2004; Chudley et al., 2005; Hoyme et al., 2005) list ACC ⁄HCC asone of the many types of structural abnormalities that meet theCNS criteria for a FAS ⁄PFAS diagnosis, it would be clinicallyinvalid to exclude ACC ⁄HCC from the FAS ⁄PFAS study group.While they might represent a very small fraction of all alcohol-exposed patients evaluated in the FAS DPN clinic, they represent2 of all 41 patients with FAS ⁄PFAS from the FAS DPN clinicwho met the 8- to 15-year-old eligibility criteria for enrollmentinto this study.
Study Participation
Participation in the study involved 5 visits over a 4- to 6-weekstudy period. The psychological and sociodemographic data werecollected during visits 1 and 2. The MR data were collected duringvisits 3 and 4. Outcomes of the psychological assessments wereshared with the caregivers on visit 5, and submitted to the child’smedical record with caregiver consent.
Sociodemographic and Clinical Assessments
A comprehensive sociodemographic and health ⁄medication his-tory of each child was obtained by parent interview and recordreview. Information included birth data, growth, and all prenataland lifetime exposures and adverse events. For subjects with FASD,most information was obtained at the time of their FASD diagnosticevaluation. All controls had a reported absence of prenatal alcoholexposure. All children had a standardized digital facial photographtaken at the time of enrollment. The facial photographs wereanalyzed using the FAS Facial Analysis Software (Astley, 2003) todocument the magnitude of expression of the FAS facial phenotype(Astley and Clarren, 1996). A more detailed methodology and analy-sis of the sociodemographic and FASD diagnostic outcomes, includ-ing prenatal alcohol exposure histories, were presented in theneuropsychological ⁄behavioral report from this study (Astley et al.,2009b).
Neuropsychological and Psychiatric Assessments
A detailed description of the assessment battery and a comprehen-sive analysis of the between-group differences in neuropsychologicaloutcome were presented in the neuropsychological ⁄behavioral reportfor this study (Astley et al., 2009b). Briefly, a comprehensive, stan-dardized assessment battery was administered to each child and theirprimary caregiver by a psychologist masked to group assignment.The assessment battery was designed to capture the domains ofpotential neuropsychological impairment seen as the result of thetypically diffuse brain damage arising from alcohol teratogenesis(Bertrand et al., 2004; Chudley et al., 2005; Kodituwakku, 2007;Mattson and Riley, 1998; Olson et al., 1998; Roebuck et al., 1999).The neuropsychological ⁄behavioral outcomes served to profile thestudy groups and confirm the groups were clinically and statisticallydistinct from one another; fundamental to the interpretation of theMR outcomes. The neuropsychological data will also be used to
4 ASTLEY ET AL.
assess correlations between brain structure and function. These corre-lations will be reported separately.It is important to note that the mean full scale IQ of the healthy
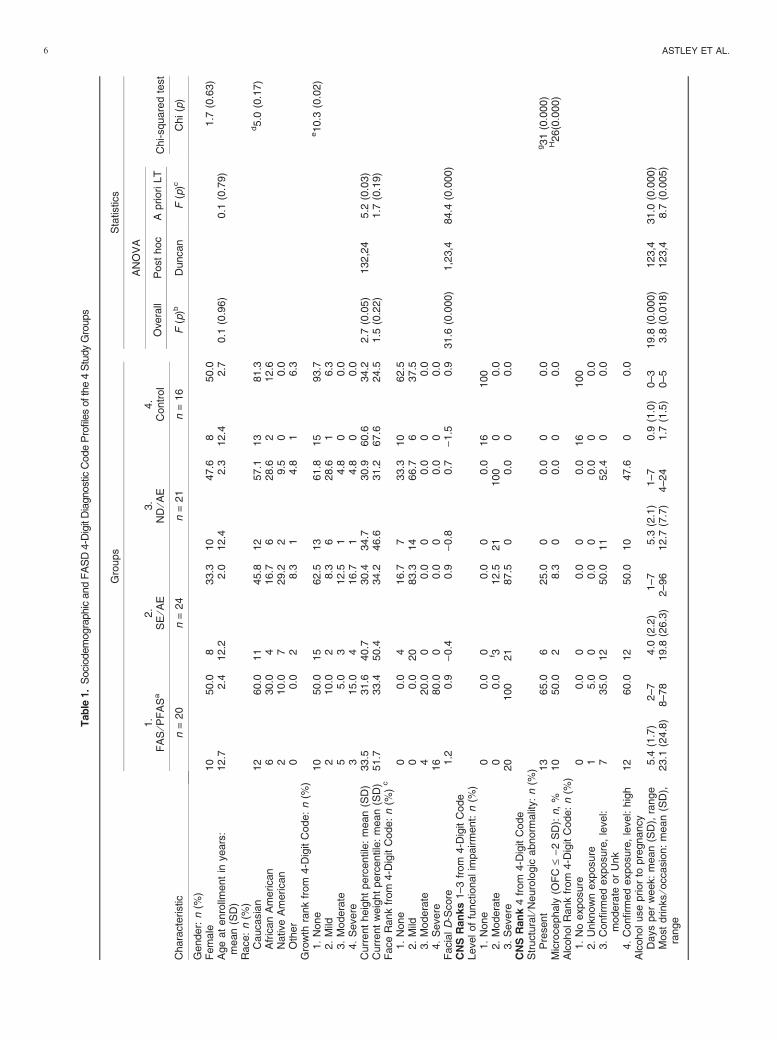
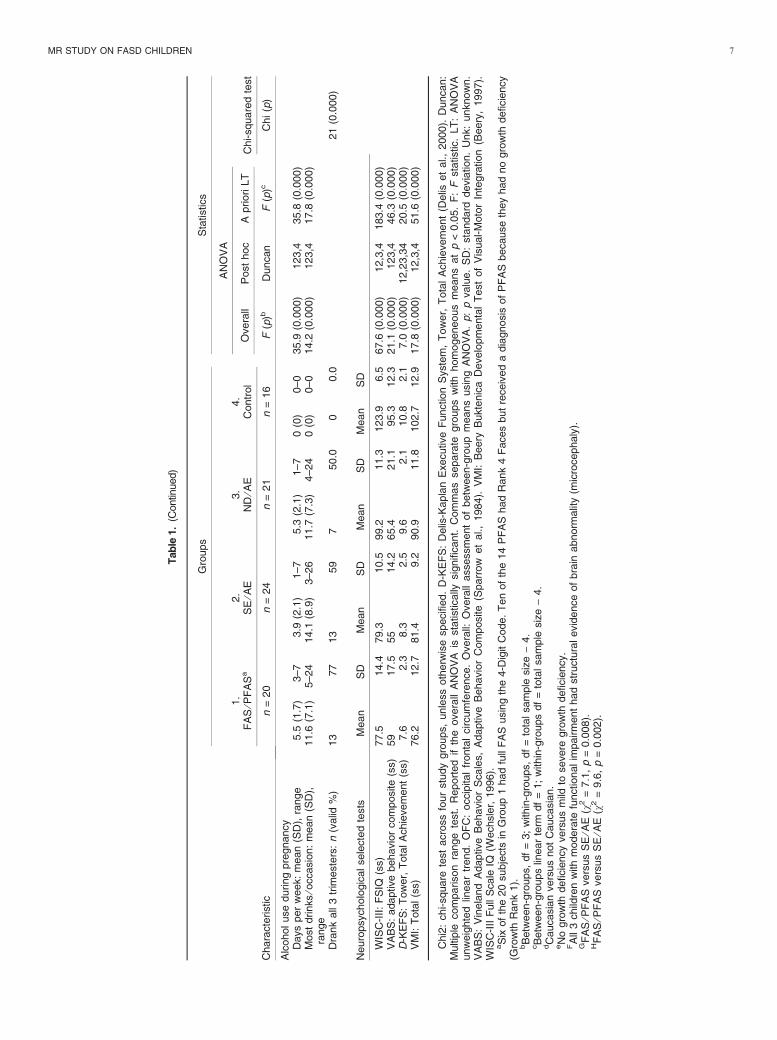
Control group (123 ± 7 SD) was higher than the population-basedmean of 100 ± 15 SD. This was anticipated as children with poten-tial threats to brain development were screened out and recruitmentwas through a University community. Other population-based MRIand FASD-MRI studies enrolling healthy controls have reportedmean FSIQs ranging from 110 to 127 (Bookstein et al., 2002b; Haieret al., 2004; Sowell et al., 2008; Waber et al., 2007). Most FASD-MRI studies do not report the IQ or neuropsychological profile oftheir healthy control population. In spite of the Control group’s rela-tively high IQ, however, many of the memory, executive function,language, and adaptive behavior scores assessed for this Controlgroup were, on average, solidly within normal limits compared withage peers (Table 1) (Astley et al., 2009b). The ND ⁄AE group had amean FSIQ (99.2 ± 11.3 SD) equivalent to the population-basedmean, despite their multiple prenatal ⁄postnatal risk factors and sig-nificant adaptive ⁄behavioral deficits.
MR Scanner
All scans (MRI, MRS, and fMRI) were acquired using a GeneralElectric 1.5 Tesla scanner in the Diagnostic Imaging Sciences Centerat the University of Washington.
MRS and fMRI
The MRS (Astley et al., 2009c) and fMRI (Astley et al., 2009a)components of this study were reported separately. Briefly, MRS wasused to measure the concentrations of neurometabolites, including:(i) choline, a marker of cell membrane stability and myelination,(ii) N-acetyl aspartate, a neuronal or axonal marker, and (iii) crea-tine, a marker of metabolic activity, in selected brain regions. fMRIwas used to assess neuroactivation in selected brain regions duringperformance of N-back working memory tasks.
Structural MRI Acquisition
An initial sagittal series was obtained first for orientation ofsubsequent series (Echo Time (TE) = 8, Time to Repetition(TR) = 400, flip angle = 25�, Field of View (FOV) = 24 · 24,matrix = 256 · 160, thickness = 4.0 mm, gap =1.0 mm]. A highresolution 3-D T1-weighted fast gradient echo image of the wholebrain was then performed in the axial plane [TE = 3, TR = 18,FOV = 24 · 18, matrix = 256 · 256, number of excitations(NEX) = 2, thickness = 1.5 mm, no gap]. This acquisition allowedimages to be reformatted into any plane, which, in turn, allowedmeasurement of each structure in the plane that was optimal for itsvisualization. This also allowed brain scans to be realigned to ensurethat all scans were measured in a standardized format. An exact mid-sagittal slice was reconstructed, allowing for area measures of corpuscallosum and cerebellar vermis. Total scanning time for the structuralseries was approximately 15 minutes. Each scan was clinicallyreviewed by the neuroradiologist (masked to group assignment) todetermine if there were any gross structural abnormalities.
Structural MRI Image Processing
Magnetic resonance imaging measures were performed on a PCworkstation using the measure program (The Johns Hopkins Univer-sity, Baltimore, MD) (Barta et al., 1997). Each scan was rotated in3-D space so that the axial images were parallel to the line connectingthe anterior and posterior commissures and perpendicular to theinterhemispheric fissure (ac–pc plane). Coronal slices were recon-structed with a thickness of 0.9375 mm and positioned perpendicularto the ac–pc plane. Based on prior FASD MRI literature (Archibald
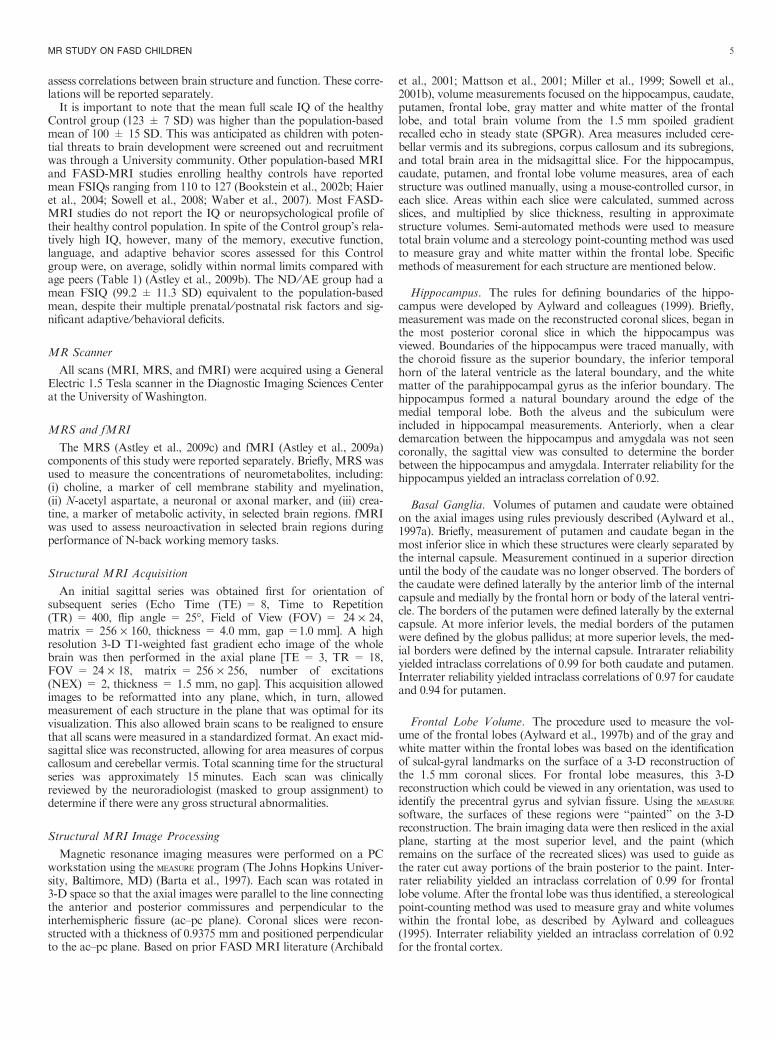
et al., 2001; Mattson et al., 2001; Miller et al., 1999; Sowell et al.,2001b), volume measurements focused on the hippocampus, caudate,putamen, frontal lobe, gray matter and white matter of the frontallobe, and total brain volume from the 1.5 mm spoiled gradientrecalled echo in steady state (SPGR). Area measures included cere-bellar vermis and its subregions, corpus callosum and its subregions,and total brain area in the midsagittal slice. For the hippocampus,caudate, putamen, and frontal lobe volume measures, area of eachstructure was outlined manually, using a mouse-controlled cursor, ineach slice. Areas within each slice were calculated, summed acrossslices, and multiplied by slice thickness, resulting in approximatestructure volumes. Semi-automated methods were used to measuretotal brain volume and a stereology point-counting method was usedto measure gray and white matter within the frontal lobe. Specificmethods of measurement for each structure are mentioned below.
Hippocampus. The rules for defining boundaries of the hippo-campus were developed by Aylward and colleagues (1999). Briefly,measurement was made on the reconstructed coronal slices, began inthe most posterior coronal slice in which the hippocampus wasviewed. Boundaries of the hippocampus were traced manually, withthe choroid fissure as the superior boundary, the inferior temporalhorn of the lateral ventricle as the lateral boundary, and the whitematter of the parahippocampal gyrus as the inferior boundary. Thehippocampus formed a natural boundary around the edge of themedial temporal lobe. Both the alveus and the subiculum wereincluded in hippocampal measurements. Anteriorly, when a cleardemarcation between the hippocampus and amygdala was not seencoronally, the sagittal view was consulted to determine the borderbetween the hippocampus and amygdala. Interrater reliability for thehippocampus yielded an intraclass correlation of 0.92.
Basal Ganglia. Volumes of putamen and caudate were obtainedon the axial images using rules previously described (Aylward et al.,1997a). Briefly, measurement of putamen and caudate began in themost inferior slice in which these structures were clearly separated bythe internal capsule. Measurement continued in a superior directionuntil the body of the caudate was no longer observed. The borders ofthe caudate were defined laterally by the anterior limb of the internalcapsule and medially by the frontal horn or body of the lateral ventri-cle. The borders of the putamen were defined laterally by the externalcapsule. At more inferior levels, the medial borders of the putamenwere defined by the globus pallidus; at more superior levels, the med-ial borders were defined by the internal capsule. Intrarater reliabilityyielded intraclass correlations of 0.99 for both caudate and putamen.Interrater reliability yielded intraclass correlations of 0.97 for caudateand 0.94 for putamen.
Frontal Lobe Volume. The procedure used to measure the vol-ume of the frontal lobes (Aylward et al., 1997b) and of the gray andwhite matter within the frontal lobes was based on the identificationof sulcal-gyral landmarks on the surface of a 3-D reconstruction ofthe 1.5 mm coronal slices. For frontal lobe measures, this 3-Dreconstruction which could be viewed in any orientation, was used toidentify the precentral gyrus and sylvian fissure. Using the measure
software, the surfaces of these regions were ‘‘painted’’ on the 3-Dreconstruction. The brain imaging data were then resliced in the axialplane, starting at the most superior level, and the paint (whichremains on the surface of the recreated slices) was used to guide asthe rater cut away portions of the brain posterior to the paint. Inter-rater reliability yielded an intraclass correlation of 0.99 for frontallobe volume. After the frontal lobe was thus identified, a stereologicalpoint-counting method was used to measure gray and white volumeswithin the frontal lobe, as described by Aylward and colleagues(1995). Interrater reliability yielded an intraclass correlation of 0.92for the frontal cortex.
MR STUDY ON FASD CHILDREN 5
Tab
le1.
Soci
odem
ogra
phic
and
FA
SD
4-D
igit
Dia
gnost
icC
ode
Pro
files
ofth
e4
Stu
dy
Gro
ups
Chara
cte
ristic
Gro
ups
Sta
tistics
1.
FA
S⁄P
FA
Sa
2.
SE
⁄AE
3.
ND
⁄AE
4.
Contr
ol
AN
OV
A
Chi-square
dte
st
Ove
rall
Post
hoc
Apriori
LT
n=
20
n=
24
n=
21
n=
16
F(p
)bD
uncan
F(p
)cC
hi(p
)
Gender:
n(%
)F
em
ale
10
50.0
833.3
10
47.6
850.0
1.7
(0.6
3)
Age
at
enro
llment
inyears
:m
ean
(SD
)12.7
2.4
12.2
2.0
12.4
2.3
12.4
2.7
0.1
(0.9
6)
0.1
(0.7
9)
Race:
n(%
)C
aucasia
n12
60.0
11
45.8
12
57.1
13
81.3
d5.0
(0.1
7)
Afr
ican
Am
erican
630.0
416.7
628.6
212.6
Native
Am
erican
210.0
729.2
29.5
00.0
Oth
er
00.0
28.3
14.8
16.3
Gro
wth
rank
from
4-D
igit
Code:
n(%
)1.
None
10
50.0
15
62.5
13
61.8
15
93.7
e10.3
(0.0
2)
2.
Mild
210.0
28.3
628.6
16.3
3.
Modera
te5
5.0
312.5
14.8
00.0
4.
Severe
315.0
416.7
14.8
00.0
Curr
ent
heig
ht
perc
entile
:m
ean
(SD
)33.5
31.6
40.7
30.4
34.7
30.9
60.6
34.2
2.7
(0.0
5)
132,2
45.2
(0.0
3)
Curr
ent
weig
ht
perc
entil
e:
mean
(SD
)51.7
33.4
50.4
34.2
46.6
31.2
67.6
24.5
1.5
(0.2
2)
1.7
(0.1
9)
Face
Rank
from
4-D
igit
Code:
n(%
)c
1.
None
00.0
416.7
733.3
10
62.5
2.
Mild
00.0
20
83.3
14
66.7
637.5
3.
Modera
te4
20.0
00.0
00.0
00.0
4.
Severe
16
80.0
00.0
00.0
00.0
Facia
lD
-Score
1.2
0.9
)0.4
0.9
)0.8
0.7
)1.5
0.9
31.6
(0.0
00)
1,2
3,4
84.4
(0.0
00)
CN
SR
an
ks
1–3
from
4-D
igit
Code
Levelof
functionalim
pairm
ent:
n(%
)1.
None
00.0
00.0
00.0
16
100
2.
Modera
te0
0.0
f 312.5
21
100
00.0
3.
Severe
20
100
21
87.5
00.0
00.0
CN
SR
an
k4
from
4-D
igit
Code
Str
uctu
ral⁄
Neuro
logic
abnorm
alit
y:
n(%
)P
resent
13
65.0
625.0
00.0
00.0
g31
(0.0
00)
Mic
rocephaly
(OF
C£
)2
SD
):n,
%10
50.0
28.3
00.0
00.0
H26(0
.000)
Alc
oholR
ank
from
4-D
igit
Code:
n(%
)1.
No
exposure
00.0
00.0
00.0
16
100
2.
Unknow
nexposure
15.0
00.0
00.0
00.0
3.
Confirm
ed
exposure
,le
vel:
modera
teor
Unk
735.0
12
50.0
11
52.4
00.0
4.
Confirm
ed
exposure
,le
vel:
hig
h12
60.0
12
50.0
10
47.6
00.0
Alc
oholuse
prior
topre
gnancy
Days
per
week:
mean
(SD
),ra
nge
5.4
(1.7
)2–7
4.0
(2.2
)1–7
5.3
(2.1
)1–7
0.9
(1.0
)0–3
19.8
(0.0
00)
123,4
31.0
(0.0
00)
Most
drinks
⁄occasi
on:
mean
(SD
),ra
nge
23.1
(24.8
)8–78
19.8
(26.3
)2–96
12.7
(7.7
)4–24
1.7
(1.5
)0–5
3.8
(0.0
18)
123,4
8.7
(0.0
05)
6 ASTLEY ET AL.
Tab
le1.
(Contin
ued)
Chara
cterist
ic
Gro
ups
Sta
tistics
1.
FA
S⁄P
FA
Sa
2.
SE
⁄AE
3.
ND
⁄AE
4.
Contr
ol
AN
OV
A
Chi-square
dte
st
Overa
llP
ost
hoc
Apriori
LT
n=
20
n=
24
n=
21
n=
16
F(p
)bD
uncan
F(p
)cC
hi(p
)
Alc
oholuse
during
pre
gnancy
Days
per
week:
mean
(SD
),ra
nge
5.5
(1.7
)3–7
3.9
(2.1
)1–7
5.3
(2.1
)1–7
0(0
)0–0
35.9
(0.0
00)
123,4
35.8
(0.0
00)
Most
drinks
⁄occa
sio
n:
mean
(SD
),ra
nge
11.6
(7.1
)5–24
14.1
(8.9
)3–26
11.7
(7.3
)4–24
0(0
)0–0
14.2
(0.0
00)
123,4
17.8
(0.0
00)
Dra
nk
all
3tr
imeste
rs:
n(v
alid
%)
13
77
13
59
750.0
00.0
21
(0.0
00)
Neuro
psycholo
gic
alsele
cte
dte
sts
Mean
SD
Mean
SD
Mean
SD
Mean
SD
WIS
C-I
II:
FS
IQ(s
s)
77.5
14.4
79.3
10.5
99.2
11.3
123.9
6.5
67.6
(0.0
00)
12,3
,4183.4
(0.0
00)
VA
BS
:adaptive
behavio
rcom
posite
(ss)
59
17.5
55
14.2
65.4
21.1
95.3
12.3
21.1
(0.0
00)
123,4
46.3
(0.0
00)
D-K
EF
S:
Tow
er,
Tota
lA
chie
vem
ent
(ss)
7.6
2.3
8.3
2.5
9.6
2.1
10.8
2.1
7.0
(0.0
00)
12,2
3,3
420.5
(0.0
00)
VM
I:T
ota
l(s
s)
76.2
12.7
81.4
9.2
90.9
11.8
102.7
12.9
17.8
(0.0
00)
12,3
,451.6
(0.0
00)
Chi2
:chi-square
test
acro
ss
four
stu
dy
gro
ups,
unle
ss
oth
erw
ise
specifi
ed.
D-K
EF
S:
Delis
-Kapla
nE
xecutiv
eF
unctio
nS
yste
m,
Tow
er,
Tota
lA
chie
vem
ent
(Delis
et
al.,
2000).
Duncan:
Multip
lecom
parison
range
test.
Report
ed
ifth
eovera
llA
NO
VA
issta
tist
ically
sig
nifi
cant.
Com
mas
separa
tegro
ups
with
hom
ogeneous
means
at
p<
0.0
5.
F:
Fsta
tist
ic.
LT
:A
NO
VA
unw
eig
hte
dlin
ear
trend.
OF
C:
occip
ital
fronta
lcircum
fere
nce.
Overa
ll:O
vera
llasse
ssm
ent
of
betw
een-g
roup
means
usin
gA
NO
VA
.p:
pvalu
e.
SD
:sta
ndard
devia
tion.
Unk:
unknow
n.
VA
BS
:V
inela
nd
Adaptiv
eB
ehavio
rS
cale
s,
Adaptive
Behavio
rC
om
posite
(Sparr
ow
et
al.,
1984).
VM
I:B
eery
Bukte
nic
aD
evelo
pm
enta
lT
est
of
Vis
ual-M
oto
rIn
tegra
tion
(Beery
,1997).
WIS
C-I
IIF
ull
Sca
leIQ
(Wech
sle
r,1996).
aS
ixof
the
20
subje
cts
inG
roup
1had
full
FA
Susin
gth
e4-D
igit
Code.
Ten
of
the
14
PF
AS
had
Rank
4F
aces
but
receiv
ed
adia
gnosi
sof
PF
AS
because
they
had
no
gro
wth
deficie
ncy
(Gro
wth
Rank
1).
bB
etw
een-g
roups,
df
=3;
within
-gro
ups,
df
=to
talsam
ple
siz
e)
4.
cB
etw
een-g
roups
linear
term
df
=1;
within
-gro
ups
df
=to
talsam
ple
siz
e)
4.
dC
aucasia
nvers
us
not
Caucasia
n.
eN
ogro
wth
deficie
ncy
vers
us
mild
toseve
regro
wth
deficie
ncy.
FA
ll3
child
ren
with
modera
tefu
nctionalim
pairm
ent
had
str
uctu
ralevid
ence
of
bra
inabnorm
alit
y(m
icro
cephaly
).G
FA
S⁄P
FA
Svers
us
SE
⁄AE
(v2
=7.1
,p
=0.0
08).
HF
AS
⁄PF
AS
vers
us
SE
⁄AE
(v2
=9.6
,p
=0.0
02).
MR STUDY ON FASD CHILDREN 7
Total Brain Volumes. Regional volumes were divided by totalbrain volume to allow correction for overall brain size. Total brainvolume was measured using semi-automated thresholding proceduresfor segmenting brain tissue from cerebral spinal fluid (CSF) on the1.5 mm axial images. Briefly, this procedure allowed the user to setthe contrast such that all pixels above a certain value were high-lighted, thus eliminating CSF (which in these images was black). Amask of this region was saved, and a command of ‘‘erode’’ was exe-cuted that ‘‘shrunk’’ the highlighted areas by a specified number ofpixels. This performed automatic cutting of ‘‘bridges’’ between high-lighted brain and nonbrain (e.g., dura and muscle) tissue regions.The cursor was then placed inside the brain region, and an ‘‘isolateblob’’ command then identified only those pixels that were connected(in any plane) with the pixel at the cursor location. This allowed thebrain to be isolated from nonbrain tissue. Finally, a ‘‘dilate’’ com-mand was executed, which restored pixels that were eroded previ-ously, but no further than the original mask. Raters modified theprocedure to ensure that only nonbrain tissue was removed. Intrar-ater reliability for obtaining brain volumes with this procedureyielded an intraclass correlation of 0.99. At each step, modificationswere made manually to ensure inclusion of all brain tissue and exclu-sion of nonbrain regions.
Midsagittal Area Measures. The 3-D brain was rotated so thatthe interhemispheric fissure was perfectly positioned in the verticalplane. As described above, the slices were reformatted from the1.5 mm axial series, yielding sagittal slices that were 0.9375 mmthick. The sagittal slice yielding the clearest visualization of the cere-bral aqueduct was selected for the midsagittal measures. Midsagittalarea measures were performed for cerebellar vermis and its 3 sub-sections (Lobules I–V, Lobules VI–VII, and Lobules VIII–X), cor-pus callosum and 5 subregions, and total brain (Aylward and Reiss,1991; Aylward et al., 1994; Reiss et al., 1991). Interrater reliabilityfor obtaining midsagittal areas yielded intraclass correlations rang-ing from 0.87 to 0.94. Midsagittal area of the total brain was alsomeasured to allow correction of the corpus callosum and cerebellarvermis measures for overall brain size. The corpus callosum (CC)length (cm) was the distance from the most anterior and posteriorborders of the CC that intersected with a line perpendicular to theac–pc plane. The CC was transected into 5 equiangular regions: (i)genu, (ii) anterior body, (iii) posterior body, (iv) isthmus, and (v)splenium, using the mammillary body as a reference point (Rileyet al., 1995).
MRI Hypotheses
In this report the analyses focus on the MRI comparisons betweenthe 4 study groups. The following primary hypotheses were derivedfrom the current MRI FASD literature (Archibald et al., 2001;Astley and Clarren, 2001; Bookstein et al., 2002b; Mattson et al.,2001; Miller et al., 1999; Sowell et al., 2001b). Note again that theneuropsychological ⁄psychiatric report for this study (Astley et al.,2009b) confirmed that the 4 study groups were clinically distinct andincreasingly more affected progressing across the 4 groups from theControls to the FAS ⁄PFAS.1. The mean absolute and ⁄or relative size of the brain as a whole
and its regions would become increasingly smaller progressingacross the 4 study groups from Controls to ND ⁄AE to SE ⁄AE toFAS ⁄PFAS.
2. The mean absolute and ⁄or relative size of the brain as a wholeand its regions would be significantly smaller in the FAS ⁄PFASgroup (with the FAS facial phenotype) compared with the SE ⁄AEgroup (without the FAS facial phenotype). This hypothesis specif-ically addressed a common clinical question: did individuals withFASD and the FAS facial phenotype have more severe brainabnormality than individuals with FASD and no FAS facialphenotype?
3. The prevalence of subjects with 1 or more brain regions 2 or moreSDs below the mean size of the Control group would increase sig-nificantly progressing from the ND ⁄AE group to the SE ⁄AEgroup and to the FAS ⁄PFAS group.
Statistical Analysis
The statistical analyses used to confirm the 4 study groups,effectively balanced on age, gender, and race, were described andpresented in the neuropsychological ⁄psychiatric report (Astley et al.,2009b).
Primary Analyses. ANOVA was used to determine if differencesin mean size of brain regions existed among the 4 study groups. Ifsignificant differences existed, the Duncan post hoc range test wasused to identify which group mean differed. The Duncan testmakes pairwise comparisons using a stepwise procedure. Mean wasordered from highest to lowest, and extreme differences were testedfirst. The Duncan test sets a protection level for the error rate forthe collection of tests and identifies homogeneous subsets of meanthat are not different from one another at the p = 0.05 level. Tospecifically test primary hypothesis 1, an a priori test for lineartrend was included in the ANOVA to determine if the mean size ofselected brain regions became increasingly smaller progressingacross the 4 study groups from Control to ND ⁄AE to SE ⁄AE toFAS ⁄PFAS. To test primary hypothesis 2, an a priori contrast (t-test) between the FAS ⁄PFAS and SE ⁄AE groups was specified inthe ANOVA. To test primary hypothesis 3, a chi-squared test fortrend was used to compare the prevalence of structural anomaliesacross the 3 FASD groups relative to the Control group. Two-tailed p values of 0.05 were used throughout the analyses.
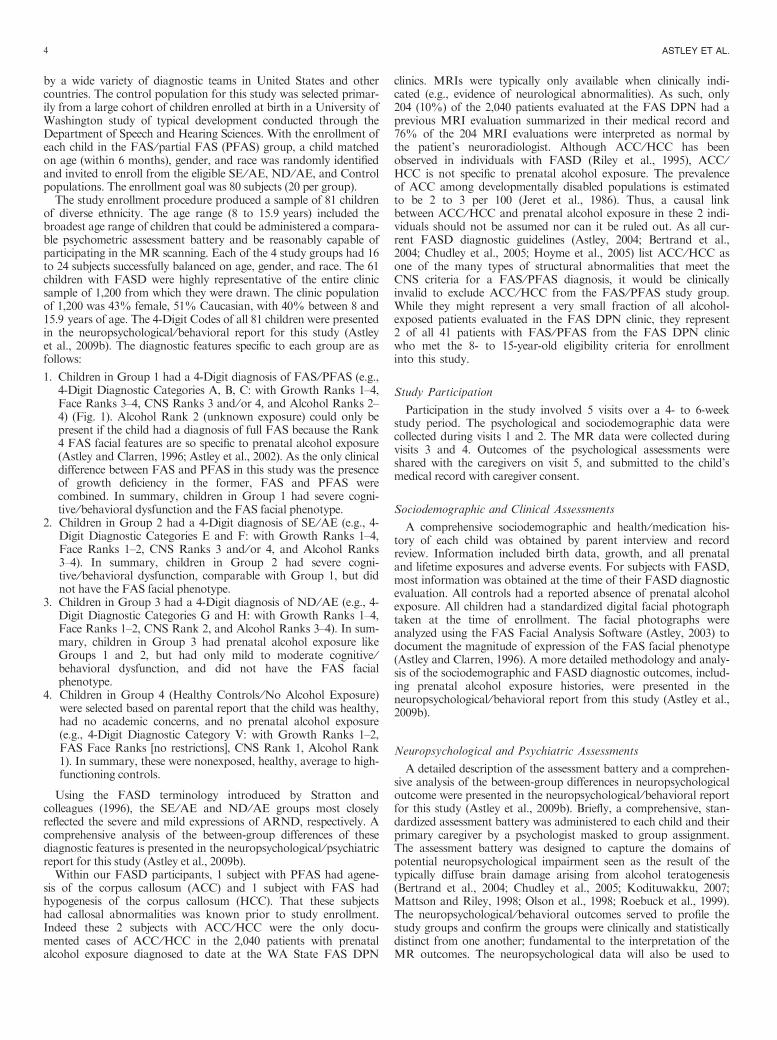
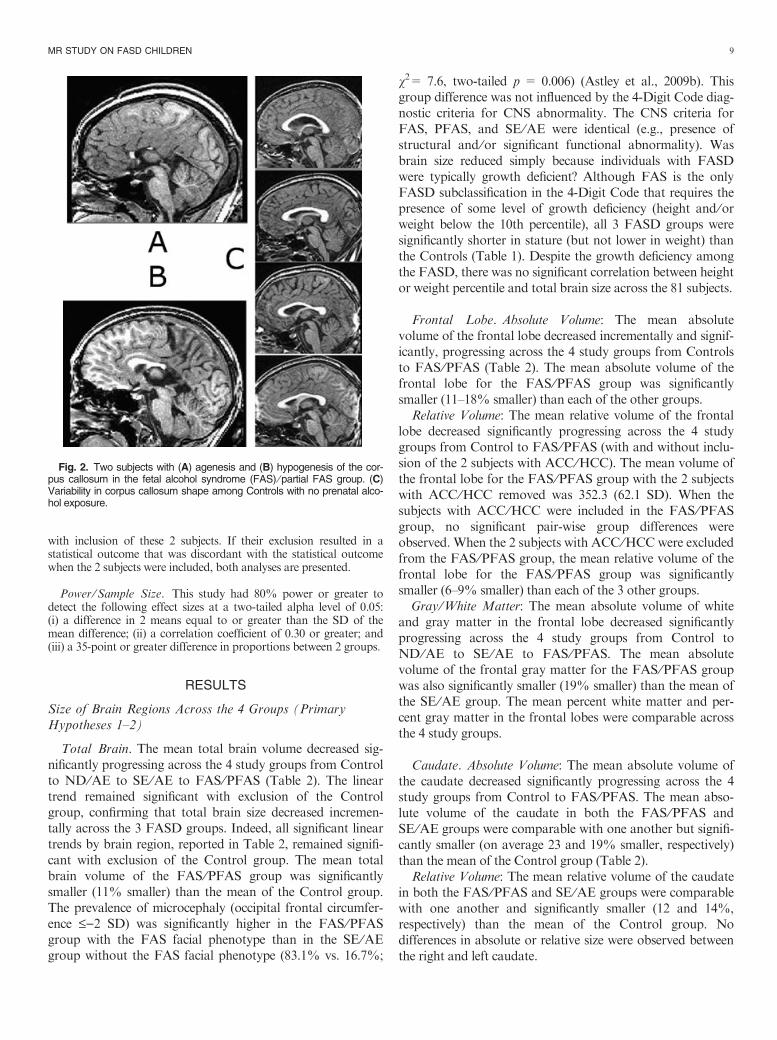
Secondary Analyses. Secondary analyses using Pearson Correla-tions coefficients and ANOVA tests for linear trends were conductedto determine if the size of brain regions decreased with increasingquantity, frequency, and ⁄or duration of reported prenatal alcoholexposure between the 3 FASD groups. Two adjustments were usedthroughout the analysis of the MRI data: (1) adjustment for totalbrain volume (or midsagittal area) and (2) inclusion or exclusion ofthe 2 subjects in the FAS ⁄PFAS group with ACC ⁄HCC (Fig. 2Aand 2B). Adjustment 1: to determine if some brain regions were dis-proportionately reduced in size. Given that overall brain size wasoften reduced among individuals with prenatal alcohol exposure, rel-ative measures of brain regions were computed by dividing the vol-ume of the region by total brain volume, or the midsagittal area ofthe brain region by the midsagittal area of the total brain. The terms‘‘relative’’ and ‘‘absolute’’ were used to distinguish the 2 types ofmeasures. Adjustment 2: the 2 subjects with ACC ⁄HCC in FAS ⁄PFAS group had CCs that were substantially smaller than the CCsof the other members of that group. The midsagittal area of the CCwas 0.3 cm2 in the subject with agenesis and 1.95 cm2 in the subjectwith hypogenesis (Figs. 2A and 2B). These are 6 and 42%, respec-tively, of the mean midsagittal area of the CC (4.64 cm2) for theremaining 18 members of the FAS ⁄PFAS group. Inclusion of these 2subjects in the FAS ⁄PFAS group could influence some between-group differences (particularly differences in the mean midsagittalarea of the CC). As such, it was important to confirm statistically sig-nificant group differences were not driven primarily by these 2 lowestmeasures (which represent outliers in the FASD sample). Althoughthe size of the CC for the subject with ACC was a statistical outlier(more than 2 SDs below the mean of the FAS ⁄PFAS group), itwould not be clinically valid to exclude this case from the study. Allcurrent published FASD diagnostic guidelines (Astley, 2004;Bertrand et al., 2004; Chudley et al., 2005; Hoyme et al., 2005) listACC as an example of a CNS structural abnormality that meets theCNS diagnostic criteria for FASD. Thus, all analyses were conducted
8 ASTLEY ET AL.
with inclusion of these 2 subjects. If their exclusion resulted in astatistical outcome that was discordant with the statistical outcomewhen the 2 subjects were included, both analyses are presented.
Power ⁄Sample Size. This study had 80% power or greater todetect the following effect sizes at a two-tailed alpha level of 0.05:(i) a difference in 2 means equal to or greater than the SD of themean difference; (ii) a correlation coefficient of 0.30 or greater; and(iii) a 35-point or greater difference in proportions between 2 groups.
RESULTS
Size of Brain Regions Across the 4 Groups (PrimaryHypotheses 1–2)
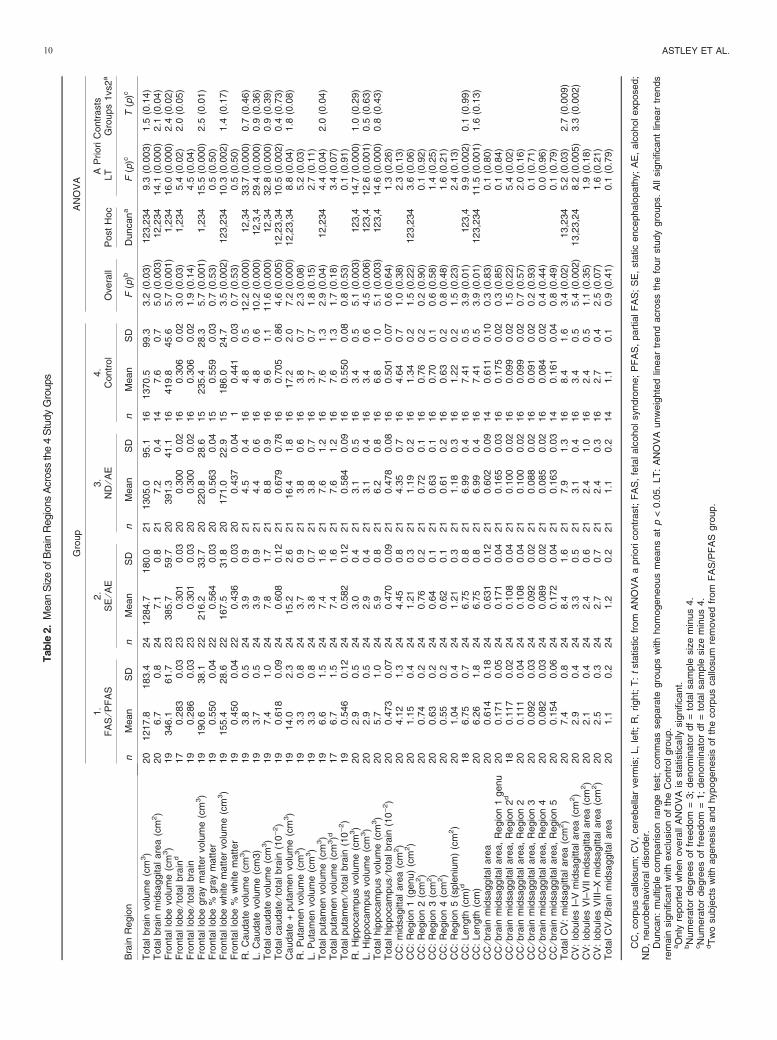
Total Brain. The mean total brain volume decreased sig-nificantly progressing across the 4 study groups from Controlto ND ⁄AE to SE ⁄AE to FAS ⁄PFAS (Table 2). The lineartrend remained significant with exclusion of the Controlgroup, confirming that total brain size decreased incremen-tally across the 3 FASD groups. Indeed, all significant lineartrends by brain region, reported in Table 2, remained signifi-cant with exclusion of the Control group. The mean totalbrain volume of the FAS ⁄PFAS group was significantlysmaller (11% smaller) than the mean of the Control group.The prevalence of microcephaly (occipital frontal circumfer-ence £)2 SD) was significantly higher in the FAS ⁄PFASgroup with the FAS facial phenotype than in the SE ⁄AEgroup without the FAS facial phenotype (83.1% vs. 16.7%;
v2= 7.6, two-tailed p = 0.006) (Astley et al., 2009b). Thisgroup difference was not influenced by the 4-Digit Code diag-nostic criteria for CNS abnormality. The CNS criteria forFAS, PFAS, and SE ⁄AE were identical (e.g., presence ofstructural and ⁄or significant functional abnormality). Wasbrain size reduced simply because individuals with FASDwere typically growth deficient? Although FAS is the onlyFASD subclassification in the 4-Digit Code that requires thepresence of some level of growth deficiency (height and ⁄orweight below the 10th percentile), all 3 FASD groups weresignificantly shorter in stature (but not lower in weight) thanthe Controls (Table 1). Despite the growth deficiency amongthe FASD, there was no significant correlation between heightor weight percentile and total brain size across the 81 subjects.
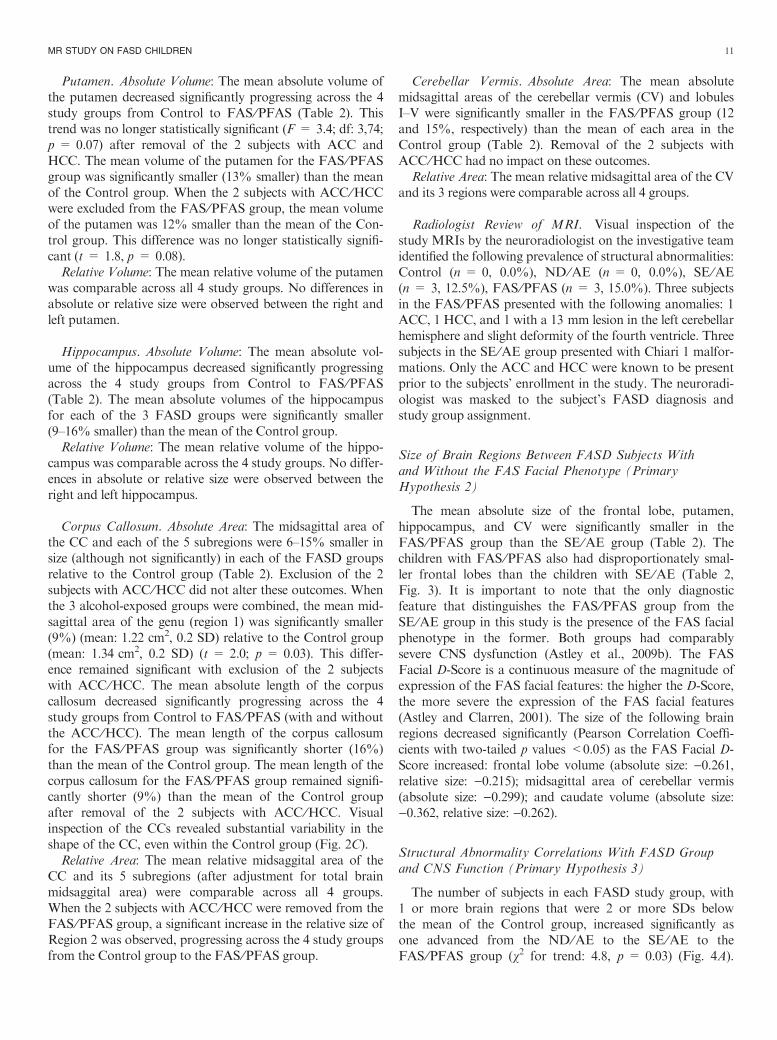
Frontal Lobe. Absolute Volume: The mean absolutevolume of the frontal lobe decreased incrementally and signif-icantly, progressing across the 4 study groups from Controlsto FAS ⁄PFAS (Table 2). The mean absolute volume of thefrontal lobe for the FAS ⁄PFAS group was significantlysmaller (11–18% smaller) than each of the other groups.Relative Volume: The mean relative volume of the frontal
lobe decreased significantly progressing across the 4 studygroups from Control to FAS ⁄PFAS (with and without inclu-sion of the 2 subjects with ACC ⁄HCC). The mean volume ofthe frontal lobe for the FAS ⁄PFAS group with the 2 subjectswith ACC ⁄HCC removed was 352.3 (62.1 SD). When thesubjects with ACC ⁄HCC were included in the FAS ⁄PFASgroup, no significant pair-wise group differences wereobserved. When the 2 subjects with ACC ⁄HCC were excludedfrom the FAS ⁄PFAS group, the mean relative volume of thefrontal lobe for the FAS ⁄PFAS group was significantlysmaller (6–9% smaller) than each of the 3 other groups.Gray ⁄White Matter: The mean absolute volume of white
and gray matter in the frontal lobe decreased significantlyprogressing across the 4 study groups from Control toND ⁄AE to SE ⁄AE to FAS ⁄PFAS. The mean absolutevolume of the frontal gray matter for the FAS ⁄PFAS groupwas also significantly smaller (19% smaller) than the mean ofthe SE ⁄AE group. The mean percent white matter and per-cent gray matter in the frontal lobes were comparable acrossthe 4 study groups.
Caudate. Absolute Volume: The mean absolute volume ofthe caudate decreased significantly progressing across the 4study groups from Control to FAS ⁄PFAS. The mean abso-lute volume of the caudate in both the FAS ⁄PFAS andSE ⁄AE groups were comparable with one another but signifi-cantly smaller (on average 23 and 19% smaller, respectively)than the mean of the Control group (Table 2).Relative Volume: The mean relative volume of the caudate
in both the FAS ⁄PFAS and SE ⁄AE groups were comparablewith one another and significantly smaller (12 and 14%,respectively) than the mean of the Control group. Nodifferences in absolute or relative size were observed betweenthe right and left caudate.
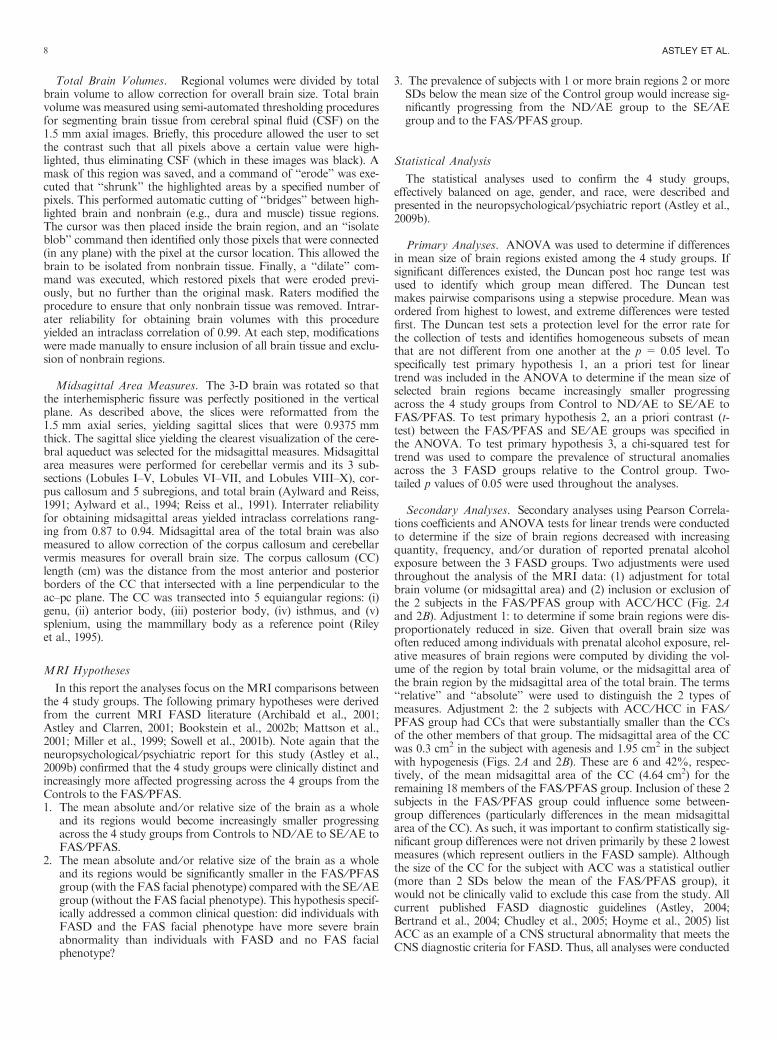
Fig. 2. Two subjects with (A) agenesis and (B) hypogenesis of the cor-pus callosum in the fetal alcohol syndrome (FAS) ⁄ partial FAS group. (C)Variability in corpus callosum shape among Controls with no prenatal alco-hol exposure.
MR STUDY ON FASD CHILDREN 9
Tab
le2.
Mean
Siz
eofB
rain
Regio
ns
Acr
oss
the
4S
tudy
Gro
ups
Bra
inR
egio
n
Gro
up
AN
OV
A
1.
FA
S⁄P
FA
S2.
SE
⁄AE
3.
ND
⁄AE
4.
Contr
ol
Overa
llP
ost
Hoc
AP
riori
Contr
asts
LT
Gro
ups
1vs2
a
nM
ean
SD
nM
ean
SD
nM
ean
SD
nM
ean
SD
F(p
)bD
uncan
aF
(p)c
T(p
)c
Tota
lbra
involu
me
(cm
3)
20
1217.8
183.4
24
1284.7
180.0
21
1305.0
95.1
16
1370.5
99.3
3.2
(0.0
3)
123,2
34
9.3
(0.0
03)
1.5
(0.1
4)
Tota
lbra
inm
idsaggital
are
a(c
m2)
20
6.7
0.8
24
7.1
0.8
21
7.2
0.4
14
7.6
0.7
5.0
(0.0
03)
12,2
34
14.1
(0.0
00)
2.1
(0.0
4)
Fro
nta
llo
be
volu
me
(cm
3)
19
346.1
61.7
23
385.7
59.7
20
391.3
41.1
16
419.8
45.6
5.7
(0.0
01)
1,2
34
16.0
(0.0
00)
2.4
(0.0
2)
Fro
nta
llo
be
⁄tota
lbra
ind
17
0.2
83
0.0
323
0.3
01
0.0
320
0.3
00
0.0
216
0.3
06
0.0
23.0
(0.0
3)
1,2
34
5.4
(0.0
2)
2.0
(0.0
5)
Fro
nta
llo
be
⁄tota
lbra
in19
0.2
86
0.0
323
0.3
01
0.0
320
0.3
00
0.0
216
0.3
06
0.0
21.9
(0.1
4)
4.5
(0.0
4)
Fro
nta
llo
be
gra
ym
att
er
volu
me
(cm
3)
19
190.6
38.1
22
216.2
33.7
20
220.8
28.6
15
235.4
28.3
5.7
(0.0
01)
1,2
34
15.5
(0.0
00)
2.5
(0.0
1)
Fro
nta
llo
be
%gra
ym
att
er
19
0.5
50
0.0
422
0.5
64
0.0
320
0.5
63
0.0
415
0.5
59
0.0
30.7
(0.5
3)
0.5
(0.5
0)
Fro
nta
llo
be
white
matt
er
volu
me
(cm
3)
19
155.4
28.6
22
167.5
31.8
20
171.0
22.9
15
186.0
24.7
3.5
(0.0
02)
123,2
34
10.3
(0.0
02)
1.4
(0.1
7)
Fro
nta
llo
be
%w
hite
matt
er
19
0.4
50
0.0
422
0.4
36
0.0
320
0.4
37
0.0
41
0.4
41
0.0
30.7
(0.5
3)
0.5
(0.5
0)
R.
Caudate
volu
me
(cm
3)
19
3.8
0.5
24
3.9
0.9
21
4.5
0.4
16
4.8
0.5
12.2
(0.0
00)
12,3
433.7
(0.0
00)
0.7
(0.4
6)
L.
Caudate
volu
me
(cm
3)
19
3.7
0.5
24
3.9
0.9
21
4.4
0.6
16
4.8
0.6
10.2
(0.0
00)
12,3
,429.4
(0.0
00)
0.9
(0.3
6)
Tota
lcaudate
volu
me
(cm
3)
19
7.4
1.0
24
7.8
1.7
21
8.8
0.9
16
9.6
1.1
11.6
(0.0
00)
12,3
432.8
(0.0
00)
0.9
(0.3
9)
Tota
lcaudate
⁄tota
lbra
in(1
0)
2)
19
0.6
18
0.0
924
0.6
08
0.1
221
0.6
79
0.7
816
0.7
05
0.8
64.6
(0.0
05)
12,2
3,3
410.5
(0.0
02)
0.4
(0.7
3)
Caudate
+puta
men
volu
me
(cm
3)
19
14.0
2.3
24
15.2
2.6
21
16.4
1.8
16
17.2
2.0
7.2
(0.0
00)
12,2
3,3
48.8
(0.0
4)
1.8
(0.0
8)
R.
Puta
men
volu
me
(cm
3)
19
3.3
0.8
24
3.7
0.9
21
3.8
0.6
16
3.8
0.7
2.3
(0.0
8)
5.2
(0.0
3)
L.
Puta
men
volu
me
(cm
3)
19
3.3
0.8
24
3.8
0.7
21
3.8
0.7
16
3.7
0.7
1.8
(0.1
5)
2.7
(0.1
1)
Tota
lputa
men
volu
me
(cm
3)
19
6.6
1.5
24
7.4
1.6
21
7.6
1.2
16
7.6
1.3
2.9
(0.0
4)
12,2
34
4.4
(0.0
4)
2.0
(0.0
4)
Tota
lputa
men
volu
me
(cm
3)d
17
6.7
1.5
24
7.4
1.6
21
7.6
1.2
16
7.6
1.3
1.7
(0.1
8)
3.4
(0.0
7)
Tota
lputa
men
⁄tota
lbra
in(1
0)
2)
19
0.5
46
0.1
224
0.5
82
0.1
221
0.5
84
0.0
916
0.5
50
0.0
80.8
(0.5
3)
0.1
(0.9
1)
R.
Hip
pocam
pus
volu
me
(cm
3)
20
2.9
0.5
24
3.0
0.4
21
3.1
0.5
16
3.4
0.5
5.1
(0.0
03)
123,4
14.7
(0.0
00)
1.0
(0.2
9)
L.
Hip
pocam
pus
volu
me
(cm
3)
20
2.9
0.5
24
2.9
0.4
21
3.1
0.4
16
3.4
0.6
4.5
(0.0
06)
123,4
12.6
(0.0
01)
0.5
(0.6
3)
Tota
lhip
pocam
pus
volu
me
(cm
3)
20
5.7
1.0
24
5.9
0.8
21
6.2
0.8
16
6.8
1.0
5.1
(0.0
03)
123,4
14.6
(0.0
00)
0.8
(0.4
3)
Tota
lhip
pocam
pus
⁄tota
lbra
in(1
0)
2)
20
0.4
73
0.0
724
0.4
70
0.0
921
0.4
78
0.0
816
0.5
01
0.0
70.6
(0.6
4)
1.3
(0.2
6)
CC
:m
idsagitta
lare
a(c
m2)
20
4.1
21.3
24
4.4
50.8
21
4.3
50.7
16
4.6
40.7
1.0
(0.3
8)
2.3
(0.1
3)
CC
:R
egio
n1
(genu)
(cm
2)
20
1.1
50.4
24
1.2
10.3
21
1.1
90.2
16
1.3
40.2
1.5
(0.2
2)
123,2
34
3.6
(0.0
6)
CC
:R
egio
n2
(cm
2)
20
0.7
40.2
24
0.7
60.2
21
0.7
20.1
16
0.7
60.2
0.2
(0.9
0)
0.1
(0.9
2)
CC
:R
egio
n3
(cm
2)
20
0.6
30.2
24
0.6
40.1
21
0.6
30.1
16
0.7
00.1
0.6
(0.5
8)
1.4
(0.2
5)
CC
:R
egio
n4
(cm
2)
20
0.5
50.2
24
0.6
20.1
21
0.6
10.2
16
0.6
30.2
0.8
(0.4
8)
1.6
(0.2
1)
CC
:R
egio
n5
(sple
niu
m)
(cm
2)
20
1.0
40.4
24
1.2
10.3
21
1.1
80.3
16
1.2
20.2
1.5
(0.2
3)
2.4
(0.1
3)
CC
:Length
(cm
)d18
6.7
50.7
24
6.7
50.8
21
6.9
90.4
16
7.4
10.5
3.9
(0.0
1)
123,4
9.9
(0.0
02)
0.1
(0.9
9)
CC
:Length
(cm
)20
6.2
61.8
24
6.7
50.8
21
6.9
90.4
16
7.4
10.5
3.9
(0.0
1)
123,2
34
11.5
(0.0
01)
1.6
(0.1
3)
CC
⁄bra
inm
idsaggital
are
a20
0.6
14
0.1
824
0.6
31
0.1
221
0.6
02
0.0
914
0.6
11
0.1
00.3
(0.8
3)
0.1
(0.8
0)
CC
⁄bra
inm
idsaggital
are
a,
Regio
n1
genu
20
0.1
71
0.0
524
0.1
71
0.0
421
0.1
65
0.0
316
0.1
75
0.0
20.3
(0.8
5)
0.1
(0.8
4)
CC
⁄bra
inm
idsaggital
are
a,
Regio
n2
d18
0.1
17
0.0
224
0.1
08
0.0
421
0.1
00
0.0
216
0.0
99
0.0
21.5
(0.2
2)
5.4
(0.0
2)
CC
⁄bra
inm
idsaggital
are
a,
Regio
n2
20
0.1
11
0.0
424
0.1
08
0.0
421
0.1
00
0.0
216
0.0
99
0.0
20.7
(0.5
7)
2.0
(0.1
6)
CC
⁄bra
inm
idsaggital
are
a,
Regio
n3
20
0.0
92
0.0
324
0.0
92
0.0
221
0.0
88
0.0
216
0.0
91
0.0
20.2
(0.9
3)
0.1
(0.7
1)
CC
⁄bra
inm
idsaggital
are
a,
Regio
n4
20
0.0
82
0.0
324
0.0
89
0.0
221
0.0
85
0.0
216
0.0
84
0.0
20.4
(0.4
4)
0.0
(0.9
6)
CC
⁄bra
inm
idsaggital
are
a,
Regio
n5
20
0.1
54
0.0
624
0.1
72
0.0
421
0.1
63
0.0
314
0.1
61
0.0
40.8
(0.4
9)
0.1
(0.7
9)
Tota
lC
V:
mid
sagitta
lare
a(c
m2)
20
7.4
0.8
24
8.4
1.6
21
7.9
1.3
16
8.4
1.6
3.4
(0.0
2)
13,2
34
5.2
(0.0
3)
2.7
(0.0
09)
CV
:lo
bule
sI–
Vm
idsagitta
lare
a(c
m2)
20
2.9
0.4
24
3.3
0.5
21
3.1
0.4
16
3.4
0.5
5.4
(0.0
02)
13,2
3,2
48.2
(0.0
05)
3.3
(0.0
02)
CV
:lo
bule
sV
I–V
IIm
idsagitta
lare
a(c
m2)
20
2.1
0.4
24
2.4
0.6
21
2.4
1.0
16
2.4
0.5
1.1
(0.3
5)
1.9
(0.1
8)
CV
:lo
bule
sV
III–
Xm
idsagitta
lare
a(c
m2)
20
2.5
0.3
24
2.7
0.7
21
2.4
0.3
16
2.7
0.4
2.5
(0.0
7)
1.6
(0.2
1)
Tota
lC
V⁄B
rain
mid
saggital
are
a20
1.1
0.2
24
1.2
0.2
21
1.1
0.2
14
1.1
0.1
0.9
(0.4
1)
0.1
(0.7
9)
CC
,corp
us
callo
sum
;C
V,
cere
bella
rverm
is;
L,
left
;R
,right;
T:
tsta
tistic
from
AN
OV
Aa
priori
contr
ast;
FA
S,
feta
lalc
oholsyndro
me;
PF
AS
,part
ialF
AS
;S
E,
sta
tic
encephalo
path
y;
AE
,alc
oholexposed;
ND
,neuro
behavio
raldis
ord
er.
Duncan:
multip
lecom
parison
range
test;
com
mas
separa
tegro
ups
with
hom
ogeneous
means
at
p<
0.0
5.
LT
:A
NO
VA
unw
eig
hte
dlin
ear
trend
acro
ss
the
four
stu
dy
gro
ups.
All
sig
nifi
cant
linear
trends
rem
ain
sig
nifi
cant
with
exclu
sio
nof
the
Contr
olgro
up.
aO
nly
report
ed
when
overa
llA
NO
VA
issta
tistically
sig
nifi
cant.
bN
um
era
tor
degre
es
of
freedom
=3;
denom
inato
rdf
=to
talsam
ple
siz
em
inus
4.
cN
um
era
tor
degre
es
of
freedom
=1;
denom
inato
rdf
=to
talsam
ple
siz
em
inus
4.
dT
wo
subje
cts
with
agenesis
and
hypogenesis
of
the
corp
us
callo
sum
rem
oved
from
FA
S/P
FA
Sgro
up.
10 ASTLEY ET AL.
Putamen. Absolute Volume: The mean absolute volume ofthe putamen decreased significantly progressing across the 4study groups from Control to FAS ⁄PFAS (Table 2). Thistrend was no longer statistically significant (F = 3.4; df: 3,74;p = 0.07) after removal of the 2 subjects with ACC andHCC. The mean volume of the putamen for the FAS ⁄PFASgroup was significantly smaller (13% smaller) than the meanof the Control group. When the 2 subjects with ACC ⁄HCCwere excluded from the FAS ⁄PFAS group, the mean volumeof the putamen was 12% smaller than the mean of the Con-trol group. This difference was no longer statistically signifi-cant (t = 1.8, p = 0.08).Relative Volume: The mean relative volume of the putamen
was comparable across all 4 study groups. No differences inabsolute or relative size were observed between the right andleft putamen.
Hippocampus. Absolute Volume: The mean absolute vol-ume of the hippocampus decreased significantly progressingacross the 4 study groups from Control to FAS ⁄PFAS(Table 2). The mean absolute volumes of the hippocampusfor each of the 3 FASD groups were significantly smaller(9–16% smaller) than the mean of the Control group.Relative Volume: The mean relative volume of the hippo-
campus was comparable across the 4 study groups. No differ-ences in absolute or relative size were observed between theright and left hippocampus.
Corpus Callosum. Absolute Area: The midsagittal area ofthe CC and each of the 5 subregions were 6–15% smaller insize (although not significantly) in each of the FASD groupsrelative to the Control group (Table 2). Exclusion of the 2subjects with ACC ⁄HCC did not alter these outcomes. Whenthe 3 alcohol-exposed groups were combined, the mean mid-sagittal area of the genu (region 1) was significantly smaller(9%) (mean: 1.22 cm2, 0.2 SD) relative to the Control group(mean: 1.34 cm2, 0.2 SD) (t = 2.0; p = 0.03). This differ-ence remained significant with exclusion of the 2 subjectswith ACC ⁄HCC. The mean absolute length of the corpuscallosum decreased significantly progressing across the 4study groups from Control to FAS ⁄PFAS (with and withoutthe ACC ⁄HCC). The mean length of the corpus callosumfor the FAS ⁄PFAS group was significantly shorter (16%)than the mean of the Control group. The mean length of thecorpus callosum for the FAS ⁄PFAS group remained signifi-cantly shorter (9%) than the mean of the Control groupafter removal of the 2 subjects with ACC ⁄HCC. Visualinspection of the CCs revealed substantial variability in theshape of the CC, even within the Control group (Fig. 2C).Relative Area: The mean relative midsaggital area of the
CC and its 5 subregions (after adjustment for total brainmidsaggital area) were comparable across all 4 groups.When the 2 subjects with ACC ⁄HCC were removed from theFAS ⁄PFAS group, a significant increase in the relative size ofRegion 2 was observed, progressing across the 4 study groupsfrom the Control group to the FAS ⁄PFAS group.
Cerebellar Vermis. Absolute Area: The mean absolutemidsagittal areas of the cerebellar vermis (CV) and lobulesI–V were significantly smaller in the FAS ⁄PFAS group (12and 15%, respectively) than the mean of each area in theControl group (Table 2). Removal of the 2 subjects withACC ⁄HCC had no impact on these outcomes.Relative Area: The mean relative midsagittal area of the CV
and its 3 regions were comparable across all 4 groups.
Radiologist Review of MRI. Visual inspection of thestudy MRIs by the neuroradiologist on the investigative teamidentified the following prevalence of structural abnormalities:Control (n = 0, 0.0%), ND ⁄AE (n = 0, 0.0%), SE ⁄AE(n = 3, 12.5%), FAS ⁄PFAS (n = 3, 15.0%). Three subjectsin the FAS ⁄PFAS presented with the following anomalies: 1ACC, 1 HCC, and 1 with a 13 mm lesion in the left cerebellarhemisphere and slight deformity of the fourth ventricle. Threesubjects in the SE ⁄AE group presented with Chiari 1 malfor-mations. Only the ACC and HCC were known to be presentprior to the subjects’ enrollment in the study. The neuroradi-ologist was masked to the subject’s FASD diagnosis andstudy group assignment.
Size of Brain Regions Between FASD Subjects Withand Without the FAS Facial Phenotype (PrimaryHypothesis 2)
The mean absolute size of the frontal lobe, putamen,hippocampus, and CV were significantly smaller in theFAS ⁄PFAS group than the SE ⁄AE group (Table 2). Thechildren with FAS ⁄PFAS also had disproportionately smal-ler frontal lobes than the children with SE ⁄AE (Table 2,Fig. 3). It is important to note that the only diagnosticfeature that distinguishes the FAS ⁄PFAS group from theSE ⁄AE group in this study is the presence of the FAS facialphenotype in the former. Both groups had comparablysevere CNS dysfunction (Astley et al., 2009b). The FASFacial D-Score is a continuous measure of the magnitude ofexpression of the FAS facial features: the higher the D-Score,the more severe the expression of the FAS facial features(Astley and Clarren, 2001). The size of the following brainregions decreased significantly (Pearson Correlation Coeffi-cients with two-tailed p values <0.05) as the FAS Facial D-Score increased: frontal lobe volume (absolute size: )0.261,relative size: )0.215); midsagittal area of cerebellar vermis(absolute size: )0.299); and caudate volume (absolute size:)0.362, relative size: )0.262).
Structural Abnormality Correlations With FASD Groupand CNS Function (Primary Hypothesis 3)
The number of subjects in each FASD study group, with1 or more brain regions that were 2 or more SDs belowthe mean of the Control group, increased significantly asone advanced from the ND ⁄AE to the SE ⁄AE to theFAS ⁄PFAS group (v2 for trend: 4.8, p = 0.03) (Fig. 4A).
MR STUDY ON FASD CHILDREN 11
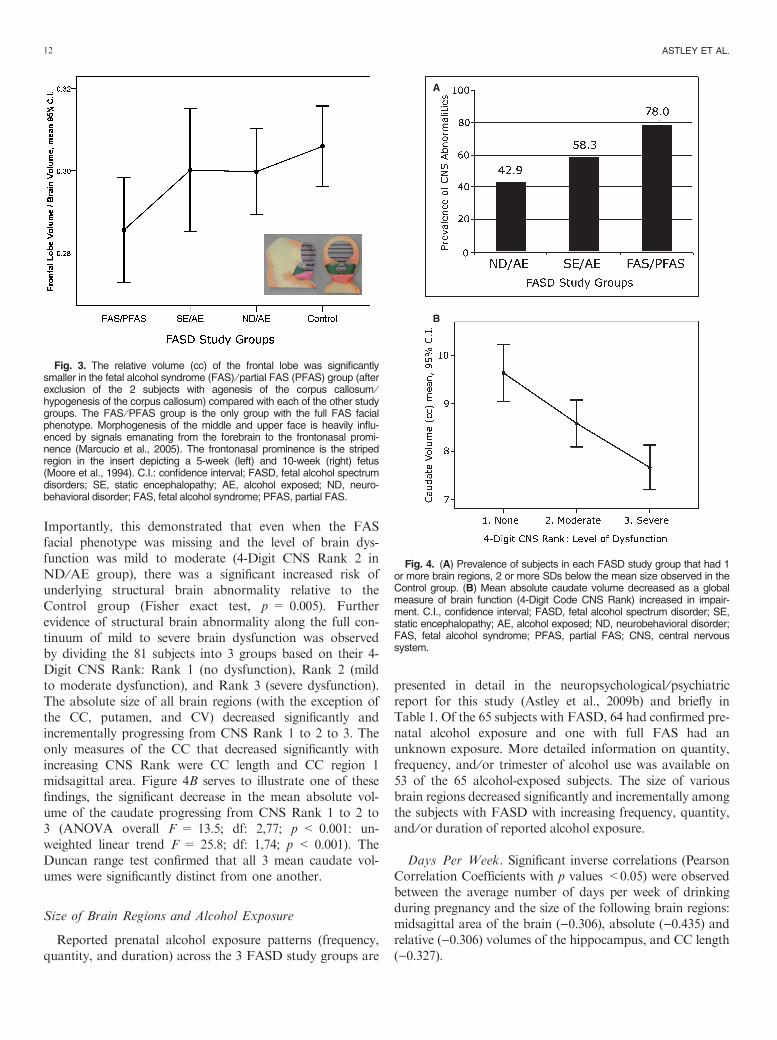
Importantly, this demonstrated that even when the FASfacial phenotype was missing and the level of brain dys-function was mild to moderate (4-Digit CNS Rank 2 inND ⁄AE group), there was a significant increased risk ofunderlying structural brain abnormality relative to theControl group (Fisher exact test, p = 0.005). Furtherevidence of structural brain abnormality along the full con-tinuum of mild to severe brain dysfunction was observedby dividing the 81 subjects into 3 groups based on their 4-Digit CNS Rank: Rank 1 (no dysfunction), Rank 2 (mildto moderate dysfunction), and Rank 3 (severe dysfunction).The absolute size of all brain regions (with the exception ofthe CC, putamen, and CV) decreased significantly andincrementally progressing from CNS Rank 1 to 2 to 3. Theonly measures of the CC that decreased significantly withincreasing CNS Rank were CC length and CC region 1midsagittal area. Figure 4B serves to illustrate one of thesefindings, the significant decrease in the mean absolute vol-ume of the caudate progressing from CNS Rank 1 to 2 to3 (ANOVA overall F = 13.5; df: 2,77; p < 0.001: un-weighted linear trend F = 25.8; df: 1,74; p < 0.001). TheDuncan range test confirmed that all 3 mean caudate vol-umes were significantly distinct from one another.
Size of Brain Regions and Alcohol Exposure
Reported prenatal alcohol exposure patterns (frequency,quantity, and duration) across the 3 FASD study groups are
presented in detail in the neuropsychological ⁄psychiatricreport for this study (Astley et al., 2009b) and briefly inTable 1. Of the 65 subjects with FASD, 64 had confirmed pre-natal alcohol exposure and one with full FAS had anunknown exposure. More detailed information on quantity,frequency, and ⁄or trimester of alcohol use was available on53 of the 65 alcohol-exposed subjects. The size of variousbrain regions decreased significantly and incrementally amongthe subjects with FASD with increasing frequency, quantity,and ⁄or duration of reported alcohol exposure.
Days Per Week. Significant inverse correlations (PearsonCorrelation Coefficients with p values <0.05) were observedbetween the average number of days per week of drinkingduring pregnancy and the size of the following brain regions:midsagittal area of the brain ()0.306), absolute ()0.435) andrelative ()0.306) volumes of the hippocampus, and CC length()0.327).
Fig. 3. The relative volume (cc) of the frontal lobe was significantlysmaller in the fetal alcohol syndrome (FAS) ⁄ partial FAS (PFAS) group (afterexclusion of the 2 subjects with agenesis of the corpus callosum ⁄hypogenesis of the corpus callosum) compared with each of the other studygroups. The FAS ⁄ PFAS group is the only group with the full FAS facialphenotype. Morphogenesis of the middle and upper face is heavily influ-enced by signals emanating from the forebrain to the frontonasal promi-nence (Marcucio et al., 2005). The frontonasal prominence is the stripedregion in the insert depicting a 5-week (left) and 10-week (right) fetus(Moore et al., 1994). C.I.: confidence interval; FASD, fetal alcohol spectrumdisorders; SE, static encephalopathy; AE, alcohol exposed; ND, neuro-behavioral disorder; FAS, fetal alcohol syndrome; PFAS, partial FAS.
A
B
Fig. 4. (A) Prevalence of subjects in each FASD study group that had 1or more brain regions, 2 or more SDs below the mean size observed in theControl group. (B) Mean absolute caudate volume decreased as a globalmeasure of brain function (4-Digit Code CNS Rank) increased in impair-ment. C.I., confidence interval; FASD, fetal alcohol spectrum disorder; SE,static encephalopathy; AE, alcohol exposed; ND, neurobehavioral disorder;FAS, fetal alcohol syndrome; PFAS, partial FAS; CNS, central nervoussystem.
12 ASTLEY ET AL.
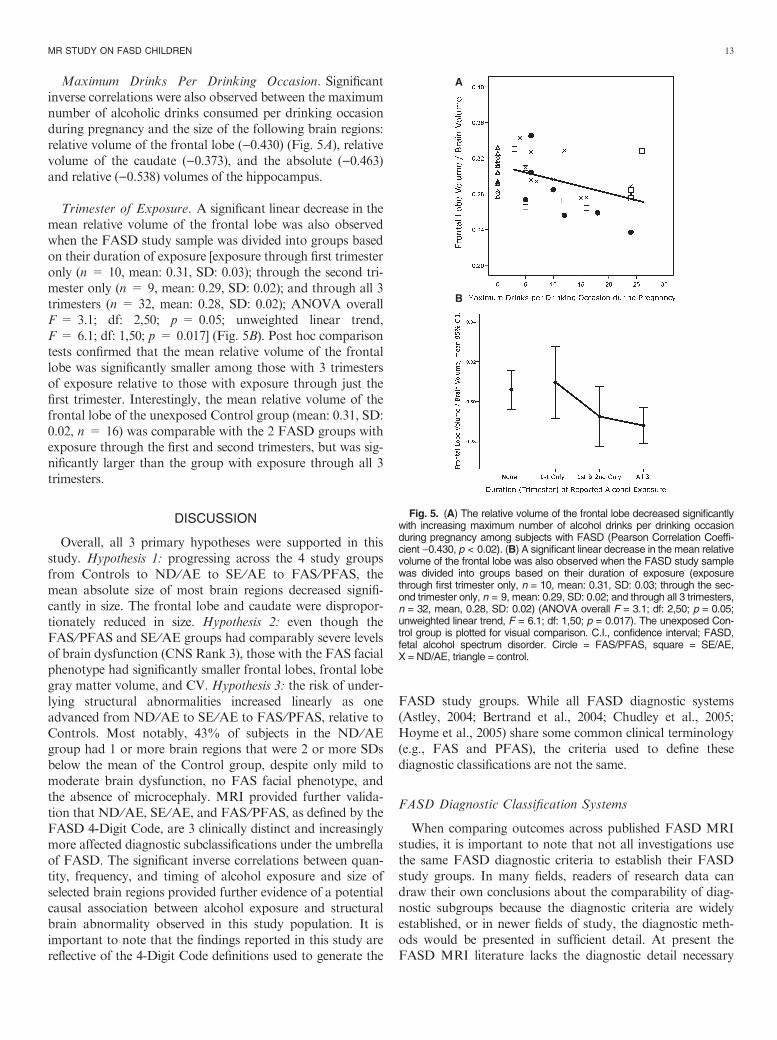
Maximum Drinks Per Drinking Occasion. Significantinverse correlations were also observed between the maximumnumber of alcoholic drinks consumed per drinking occasionduring pregnancy and the size of the following brain regions:relative volume of the frontal lobe ()0.430) (Fig. 5A), relativevolume of the caudate ()0.373), and the absolute ()0.463)and relative ()0.538) volumes of the hippocampus.
Trimester of Exposure. A significant linear decrease in themean relative volume of the frontal lobe was also observedwhen the FASD study sample was divided into groups basedon their duration of exposure [exposure through first trimesteronly (n = 10, mean: 0.31, SD: 0.03); through the second tri-mester only (n = 9, mean: 0.29, SD: 0.02); and through all 3trimesters (n = 32, mean: 0.28, SD: 0.02); ANOVA overallF = 3.1; df: 2,50; p = 0.05; unweighted linear trend,F = 6.1; df: 1,50; p = 0.017] (Fig. 5B). Post hoc comparisontests confirmed that the mean relative volume of the frontallobe was significantly smaller among those with 3 trimestersof exposure relative to those with exposure through just thefirst trimester. Interestingly, the mean relative volume of thefrontal lobe of the unexposed Control group (mean: 0.31, SD:0.02, n = 16) was comparable with the 2 FASD groups withexposure through the first and second trimesters, but was sig-nificantly larger than the group with exposure through all 3trimesters.
DISCUSSION
Overall, all 3 primary hypotheses were supported in thisstudy. Hypothesis 1: progressing across the 4 study groupsfrom Controls to ND ⁄AE to SE ⁄AE to FAS ⁄PFAS, themean absolute size of most brain regions decreased signifi-cantly in size. The frontal lobe and caudate were dispropor-tionately reduced in size. Hypothesis 2: even though theFAS ⁄PFAS and SE ⁄AE groups had comparably severe levelsof brain dysfunction (CNS Rank 3), those with the FAS facialphenotype had significantly smaller frontal lobes, frontal lobegray matter volume, and CV. Hypothesis 3: the risk of under-lying structural abnormalities increased linearly as oneadvanced from ND ⁄AE to SE ⁄AE to FAS ⁄PFAS, relative toControls. Most notably, 43% of subjects in the ND ⁄AEgroup had 1 or more brain regions that were 2 or more SDsbelow the mean of the Control group, despite only mild tomoderate brain dysfunction, no FAS facial phenotype, andthe absence of microcephaly. MRI provided further valida-tion that ND ⁄AE, SE ⁄AE, and FAS ⁄PFAS, as defined by theFASD 4-Digit Code, are 3 clinically distinct and increasinglymore affected diagnostic subclassifications under the umbrellaof FASD. The significant inverse correlations between quan-tity, frequency, and timing of alcohol exposure and size ofselected brain regions provided further evidence of a potentialcausal association between alcohol exposure and structuralbrain abnormality observed in this study population. It isimportant to note that the findings reported in this study arereflective of the 4-Digit Code definitions used to generate the
FASD study groups. While all FASD diagnostic systems(Astley, 2004; Bertrand et al., 2004; Chudley et al., 2005;Hoyme et al., 2005) share some common clinical terminology(e.g., FAS and PFAS), the criteria used to define thesediagnostic classifications are not the same.
FASD Diagnostic Classification Systems
When comparing outcomes across published FASD MRIstudies, it is important to note that not all investigations usethe same FASD diagnostic criteria to establish their FASDstudy groups. In many fields, readers of research data candraw their own conclusions about the comparability of diag-nostic subgroups because the diagnostic criteria are widelyestablished, or in newer fields of study, the diagnostic meth-ods would be presented in sufficient detail. At present theFASD MRI literature lacks the diagnostic detail necessary
A
B
Fig. 5. (A) The relative volume of the frontal lobe decreased significantlywith increasing maximum number of alcohol drinks per drinking occasionduring pregnancy among subjects with FASD (Pearson Correlation Coeffi-cient )0.430, p < 0.02). (B) A significant linear decrease in the mean relativevolume of the frontal lobe was also observed when the FASD study samplewas divided into groups based on their duration of exposure (exposurethrough first trimester only, n = 10, mean: 0.31, SD: 0.03; through the sec-ond trimester only, n = 9, mean: 0.29, SD: 0.02; and through all 3 trimesters,n = 32, mean, 0.28, SD: 0.02) (ANOVA overall F = 3.1; df: 2,50; p = 0.05;unweighted linear trend, F = 6.1; df: 1,50; p = 0.017). The unexposed Con-trol group is plotted for visual comparison. C.I., confidence interval; FASD,fetal alcohol spectrum disorder. Circle = FAS/PFAS, square = SE/AE,X = ND/AE, triangle = control.
MR STUDY ON FASD CHILDREN 13
when a field has not yet settled on common diagnostic stan-dards. Most FASD MRI studies to date have classified theirsubjects into 1 or more of the following groups: (i) analcohol-exposed group with FAS facial features (FAS), (ii)an alcohol-exposed group without FAS facial features (e.g.,ARND or FAE); or (iii) a group in which all FASD sub-groups are combined into 1 group with PEA. Criteria usedto define FAS groups are typically described qualitatively(e.g., known prenatal alcohol exposure, craniofacial anoma-lies consistent with FAS, prenatal or postnatal growth defi-ciency or both, and CNS dysfunction). Criteria used todefine ARND groups are also described qualitatively (e.g.,exposed to high levels of alcohol but display few or none ofthe facial features characteristic of FAS, and do not showgrowth retardation). But these qualitative descriptions donot adequately convey what goes into the classifications ofFAS, ARND, or FAE. Missing are parameters such as whatlevel of growth deficiency must be present, what level ofCNS dysfunction must be present, which FAS facial featuresmust be evident, and how severe the facial anomalies had tobe. Without this information, it is not clear if clinically dis-tinct study groups have been established or how they areclinically distinct. Nor can it be determined if the FAS ⁄FASD group in 1 study is comparable with the FAS ⁄FASDgroup in another study. As the field has matured, there isnow clear consensus that more rigorous diagnostic methodsshould be used and several more rigorous methods havebeen published (Astley, 2004; Bertrand et al., 2004; Chudleyet al., 2005). Two groups of investigators (Astley andClarren, 2000; Hoyme et al., 2005) have demonstrated in 2large clinical populations that the majority (50–87%) ofFAS diagnoses rendered using gestalt diagnostic methodsdid not meet FAS criteria when more rigorous diagnosticcriteria were applied.To help bridge the gap between the different diagnostic
terms used in the FASD literature, our ND ⁄AE and SE ⁄AEgroups would be most comparable with mild and severeARND, respectively. Our FAS ⁄PFAS group will differ fromother groups labeled FAS or PFAS if the diagnostic criteriaused to establish the groups differ. Our FAS ⁄PFAS, SE ⁄AE,and NE ⁄AE groups span the entire continuum of FASD. Theeffort here is to describe groups across the full fetal alcoholspectrum and to retain sufficient statistical power to detectclinically meaningful differences between diagnostic sub-groups. Combining possible subtypes into 1 larger alcohol-exposed group may obscure actual differences between thesesubtypes. In the current study, most neuroimaging differenceswould not have been revealed if the 3 FASD study groupshad been combined in any way and compared with the Con-trols. We suggest the following questions as standards forreview and interpretation of current and future literature onneuroimaging and behavioral outcomes in FASD: (i) Whatdiagnostic criteria are used to establish the study groups? (ii)Has the magnitude of growth deficiency, FAS facial features,CNS structural ⁄ functional abnormality, and alcohol exposurebeen reported to confirm that study groups are clinically
distinct? (iii) When significant differences between groups arenot observed, does the study have clinically distinct groupsand sufficient sample size ⁄power to support null findings? and(iv) When outcomes between FAS groups differ betweenstudies, is this because outcomes differ or the definition ofFAS differs?
MRI FASD Literature
In general, the FASDMRI literature documents significantreductions in the size of many but not all brain regions stud-ied, when comparing full FAS to a healthy control group.The current study supports and extends these findings. TheFASD MRI literature also documents marginal effects inPEA, FAE, or ARND groups relative to FAS or healthy con-trols, but these differences are rarely statistically significant.The current study provides definitive evidence that when thesenondysmorphic FASD clinical subgroups are more rigorouslydefined and subdivided (e.g., SE ⁄AE and ND ⁄AE) (Astley,2004), significant differences are observed not only when eachof these FASD groups is compared with a healthy controlgroup, but also when each is compared with the other. Thesefindings provide compelling evidence that clinically meaning-ful and distinct subgroups do exist under the umbrella ofFASD, and at least 2 distinct subgroups exist under the broadclassification ARND (e.g., SE ⁄AE and ND ⁄AE). Key out-comes in the current study are discussed below and comparedwith the FASD MRI literature, with emphasis on findingsspecific to FASD clinical subgroups and how subgroups areclinically defined.
Total Brain. In the current study, total brain size becameincrementally smaller progressing across the 4 study groupsfrom Control to FAS ⁄PFAS. This was influenced, in part,by the criteria used to construct the 4 groups. Microcephalyis a sufficient but not necessary CNS criterion for diagnosisof FAS, PFAS, and static encephalopathy ⁄alcohol-exposedsubjects. Of note, however, is the finding that the prevalenceof microcephaly was fourfold greater in the FAS ⁄PFASgroup relative to the SE ⁄AE group. Both groups wererequired to meet the same criteria for CNS damage ⁄dysfunc-tion (CNS Rank 3 and ⁄or 4). The only difference betweenthe criteria for the 2 groups was that the FAS ⁄PFAS grouphad to have FAS facial features (Face Ranks 3 or 4) andSE ⁄AE group had to have normal facial features (FaceRanks 1 and 2). Thus, the fact that microcephaly was farmore prevalent in the group with the FAS facial features is afurther evidence that 4-Digit Code definition of the FAS faceis a marker for underlying structural abnormality. Theimpact of alcohol on reduction of overall brain size is welldocumented in the animal and human FASD literature(Archibald et al., 2001; Hoyme et al., 2005; Mattson andRiley, 1995; Sowell et al., 2001b; Stratton et al., 1996). Thecurrent study provided definitive evidence of the continuumof effects across the full spectrum, not just among those withFAS.
14 ASTLEY ET AL.
Frontal Lobe. The most notable and novel finding in thecurrent study was a significant reduction in absolute and rela-tive volume of the frontal lobe in the FAS ⁄PFAS relative toall other groups including the SE ⁄AE group. The significantdifference observed between FAS ⁄PFAS and SE ⁄AE indi-cates individuals with FASD and the FAS facial features havesmaller frontal lobes than those with FASD, but no facial fea-tures, despite the fact that both groups had comparably severecognitive ⁄behavioral impairment (4-Digit CNS Rank 3: 3 ormore domains of function, 2 or more SDs below the mean)(Astley et al., 2009b). Archibald and colleagues (2001) usinga study sample of 14 FAS and 12 PEA by gestalt diagnosisand 41 controls and Sowell and colleagues (2001b) using asubset of the Archibald study sample, 14 FAS and 7 PEAby gestalt diagnosis and 21 controls, were unable to detectsignificant differences in absolute or relative measures offrontal lobe volumes between FAS, PEA, and controls. Fur-ther analysis of the Sowell and colleagues (2001b) study pop-ulation (Sowell et al., 2002a) using surface-based imageanalysis revealed a significant reduction in the absolute vol-ume and a significant increase in the relative volume of thefrontal lobe, when the 14 FAS and 7 PEA were combinedand compared with 21 controls. Wass and colleagues (2001)reported significant reductions in the absolute size of thefrontal cortex associated with prenatal alcohol exposure inan ultrasonographic study of 167 pregnant women. The per-cent of fetuses with a frontal cortex below the 10th percentileincreased from 4% for nonexposed fetuses to 23% for heav-ily exposed fetuses.
Frontal Lobe Gray–White Matter. Although we observedsignificantly smaller absolute volumes of white matter andgray matter in the frontal lobes among subjects with FAS ⁄PFAS relative to Controls, the proportion of the frontal lobethat contained white matter did not vary significantly acrossthe 4 study groups. These findings are consistent with the lit-erature. Archibald and colleagues (2001) identified a signifi-cant proportional reduction of white matter across the entirecerebrum among subjects with a gestalt diagnosis of FAS rel-ative to Controls. When their analysis was repeated for eachlobe (frontal, parietal, temporal, and occipital), a significantproportional reduction of white matter was only observed inthe parietal lobe. When subsets of these children were furtherassessed by Sowell and colleagues (2001b, 2002a) propor-tional reductions in white matter were observed in the lefthemisphere perisylvian cortices of the temporal and parietallobes (not in the frontal lobes) among alcohol-exposed sub-jects relative to Controls.
Caudate. The caudate, lenticular nuclei, some subthalamicnuclei, and the substantia nigra are subcortical gray matterstructures that form the basal ganglia (Cote and Crutcher,1990). The caudate nucleus has extensive neural connectionsto the frontal lobes and is thought to mediate higher cogni-tive and executive function. Like the frontal lobe, the abso-lute and relative volume of the caudate was significantly
reduced in the current study but unlike the frontal lobe thisreduction in size was observed in both the FAS ⁄PFAS andSE ⁄AE groups relative to the Control group. Archibald andcolleagues (2001) reported that the absolute and relative sizeof the caudate was significantly reduced in 14 children with agestalt diagnosis of FAS relative to 41 controls. But no sig-nificant caudate reductions were observed among their groupof 12 children with PEA. Cortese and colleagues (2006)assessed caudate size in an fMRI study with a very smallsample of children (7 with FAS and 4 with FAE by gestaltdiagnosis, and 4 controls). They reported significantly smal-ler absolute, but not relative, caudate volumes in the FASgroup relative to controls, but the unconventional use ofone-tailed p values increased the probability of achieving sta-tistical significance. No caudate differences were detectedbetween their FAE and control groups. It is noteworthy thatno significant differences in intracranial volume weredetected between their FAS, FAE, and control groups.
Putamen. The putamen (part of the lenticular nuclei)together with the caudate form the striatum. The putamen isinnervated by neurons from the primary motor, premotor,supplementary motor, and somotosensory cortices, whereasthe caudate receives input from frontal eye fields and associa-tion areas of the frontal and parietal lobes (Cote andCrutcher, 1990; Giedd et al., 1994). In the present study, theabsolute but not relative volume of the putamen was signifi-cantly smaller in the FAS ⁄PFAS group relative to the SE ⁄AE,ND ⁄AE, and Control groups. Mattson and colleagues (1996)in a study of 6 children with FAS (by gestalt diagnosis)reported that the absolute but not relative volume of thelenticular nuclei was significantly smaller relative to 7 con-trols. Archibald and colleagues (2001) reported no significantabsolute or relative reduction in the size of the lenticularnucleus among 14 FAS or 12 PEA (by gestalt diagnosis) whencompared with 41 controls.
Hippocampus. The hippocampus is a structure of the lim-bic system involved in learning, memory storage, and retrieval(Eichenbaum et al., 1992). In the present study, the meanabsolute volume of the hippocampus decreased significantly,progressing across the 4 study groups from Control to FAS ⁄PFAS. In contrast, Archibald and colleagues (2001) reporteda disproportionate sparing of the hippocampus in an other-wise hypoplastic brain among 14 FAS participants (by gestaltdiagnosis) relative to 41 controls.
Corpus callosum. The CC is a large bundle of nerve fibersconnecting the 2 hemispheres of the brain. CC deficits havebeen linked to deficits including intellectual functioning,learning, memory, executive function, and attention. In thisstudy, the absolute midsagittal area of the genu (Region 1)and the length of the CC were comparably small across theFASD groups and significantly smaller relative to the Con-trol group. No significant differences were observed afteradjustment for midsagittal brain area. Riley and colleagues
MR STUDY ON FASD CHILDREN 15
(1995) reported significant decreases in the absolute midsagit-tal area of the CC and regions 1, 3, 4, and 5 among 11 alco-hol-exposed subjects (9 with FAS by gestalt diagnosis)relative to 12 controls. After adjustment for midsaggitalbrain area, regions 1 (genu), 4, and 5 (splenium) remainedsignificantly smaller but overall midsagittal area did not. Themore severe outcomes reported by Riley and his colleagueswere not due to differences in diagnostic methodology, asour outcomes reflected our entire alcohol-exposed group. Itdoes appear the alcohol-exposed group in the study by Rileyand colleagues was more severely impaired than our alcohol-exposed group. They had a substantially lower FSIQ andwere drawn from a sample with a higher estimated preva-lence of ACC (3 ⁄44 or 6.8%). In a more recent study, Sowelland colleagues (2001a) observed the size, shape, and locationof the CC among 20 alcohol-exposed subjects (13 with FASby gestalt diagnosis) and 21 controls. Again, in contrast toour findings, they reported significant reductions in the abso-lute midsagittal area of the CC and all 5 subregions in theiralcohol-exposed group relative to their control group. Theirmore severe findings could be explained by the much higherprevalence of microcephaly in their alcohol-exposed popula-tion (they report ‘‘most’’ were microcephalic). Only 18% ofour alcohol-exposed group was microcephalic. Afteradjustment for brain volume, only the splenium in theiralcohol-exposed group remained significantly smaller. Theirkey finding was a significant anterior-inferior displacementof the splenium in the alcohol-exposed relative to controls.Based on their published Figs. 2 and 3 illustrating this effect,this finding would appear to be commensurate to our findingof a shorter CC. Autti-Ramo (2000) reported that CC wassignificantly shorter (7.4%), the midsagittal area significantlysmaller (13.8%), and the width of the splenium significantlysmaller (12%) among 17 alcohol-exposed subjects (5 withFAS by gestalt diagnosis) relative to 17 controls. Thesedifferences were no longer significant after adjustment formidsagittal area of the brain. Forty-one percent of theiralcohol-exposed population was microcephalic. Booksteinand colleagues (2002a,b) reported a variety of shape but notsize differences in the CC of subjects with gestalt diagnosesof FASD versus controls. It is important to remember thatbrain regions are inherently highly variable in shape and size,even in typically developing individuals (Steen et al., 2007).This is clearly evident in our Control population. They pres-ent with extraordinary variability in CC shape (Fig. 2C)despite their high level of cognitive function and absence ofalcohol exposure. One final comparison with the literature iswarranted. Miller and colleagues (1999) reported that theabsolute size of the CC was significantly larger in ethanol-exposed nonhuman primates relative to unexposed controls.The number of axons (not the axon size or myelin thickness)was significantly greater, especially in the rostral half of theCC (anterior to where the fornix joins the CC). It is impor-tant to note that total brain volume was comparable betweenthe exposed and unexposed groups, no animal had micro-cephaly, and the alcohol-exposed animals had mild to
moderate cognitive dysfunction with possibly only 1 animalhaving full FAS. Several human studies, including ours, havereported sparing of some anterior callosal regions in theiralcohol-exposed group. We observed a significant relativesparing of CC Region 2. Riley and colleagues (1995)observed significant absolute and relative sparing of CCRegion 2 and Sowell and colleagues (2001a) reported relativebut not absolute sparing of anterior callosal regions.What appears to be 1 recurring theme across several FASD
studies is that the CC is reduced in length and the regionsmost impacted are the genu and splenium. These findings areconsistent with the developmental spectrum of ACC. CCabnormalities are present in a multitude of syndromes anddisease entities (Paul et al., 2007). ACC is not specific to pre-natal alcohol exposure. ACC is present in 2 to 3 per 100 indi-viduals with general developmental disability (Jeret et al.,1986). The CC is the major commissure forming a junctionbetween the cerebral hemispheres. The formation of the CCstarts with the development of the genu in week 11; the body,isthmus and splenium develop at a later stage through week20 of gestation (Paul et al., 2007). If the normal developmen-tal process is disturbed, the CC may be absent completely orpartially (‘‘hypogenetic’’). As the developmental process startsfrom the anterior part and progresses from front to rear,when the CC is hypogenetic, it is usually the posterior portionthat is affected the most (the posterior body and the splenium)(Fig. 2B).
Cerebellar vermis. The cerebellum is located at the base ofthe brain and is involved in motor, cognitive, and affectivefunctions (Vidal et al., 2006). The absolute but not the relativemidsagittal area of the CV and lobules I–V were significantlysmaller in the FAS ⁄PFAS group relative to the Controls andSE ⁄AE in the current study. Sowell and colleagues (1996)reported a significant reduction in the absolute midsagittalarea of lobules I–V in a group of alcohol-exposed subjects (6FAS and 3 PEA by gestalt diagnosis) relative to 24 controls.They did not report if these findings remained significantwhen adjusted for overall brain size. More recently, O’Hareand colleagues (2005) reported significant reductions in themidsagittal area of lobules I–V and the VIII–X in a group ofalcohol-exposed subjects (14 FAS and 7 PEA by gestalt diag-nosis) relative to 21 controls. After correction for brain size,lobule I–V remained significantly reduced in size. Goodlettand colleagues (1990), using an animal model, demonstratedthat the number of Purkinje cells was significantly reduced inearlier maturing regions of the CV (lobules I–V and VIII–X)after a single critical day of neonatal alcohol exposure. Nota-bly, the Purkinje cells in the later maturing neocerebellar ver-mis (lobules VI and VII) were apparently spared.
Prevalence of CNS Structural Abnormalities Among FASDClinical Subgroups
From a FASD diagnostic perspective, it is interesting tonote how many subjects within all 3 FASD clinical subgroups
16 ASTLEY ET AL.
had 1 or more brain regions, 2 or more SDs below the meanof the Control group. Although we reported the prevalence ofanomalies in our FASD study groups using our research con-trol group as the reference, this would not be an appropriatepractice in a clinical setting. Norms for the size of brainregions adjusted for gender and age must be established usinglarge, representative, population-based samples, rather thansmall, convenient research control samples. The NationalInstitutes of Health (NIH) MRI Study of Normal BrainDevelopment (Waber et al., 2007) is a landmark study that isdocumenting structural brain development and behavior lon-gitudinally from birth to young adulthood in a large popula-tion-based sample of healthy children targeted to the UnitedStates 2000 census distribution.
Validation of the FASD 4-Digit Diagnostic Code
This study further validated (Astley and Clarren, 1996,2000, 2001; Astley et al., 2002) the measurement scales andprocedures for diagnostic classification used in the FASD 4-Digit Diagnostic Code. Statistically significant differences inneuropsychological outcomes (Astley et al., 2009b) and mea-sures of brain structure were observed between the FAS ⁄PFAS, SE ⁄AE, and ND ⁄AE groups, confirming that thesegroups reflect 3 clinically distinct and increasingly moreaffected diagnostic subclassifications under the umbrella ofFASD. The prevalence ⁄ severity of structural brain abnor-mality increased significantly as dysfunction increased fromCNS Rank 1 (no dysfunction) to Rank 2 (mild to moderatedysfunction) to Rank 3 (severe dysfunction). Indeed, whenthese CNS Ranks were first defined 10 years ago (Astley andClarren, 2000), the underlying principle was that as the mag-nitude and breadth of functional impairment increased, theprobability of underlying structural abnormality wouldincrease. It is for this reason that the 4-Digit CNS Ranks 1,2, and 3 were labeled ‘‘unlikely,’’ ‘‘possible,’’ and ‘‘probable’’underlying CNS abnormality, respectively (Fig. 1). The find-ing that the subjects in the FAS ⁄PFAS group with the 4-Digit FAS facial phenotype had significantly smaller frontallobes than the SE ⁄AE group with no FAS facial phenotypeprovides the most compelling data yet that this facial pheno-type truly is a marker for underlying brain abnormality(Fig. 3). Several animal and clinical studies have documentedcorrelations between midline facial anomalies and underlyingbrain abnormality caused by prenatal alcohol exposure(Astley and Clarren, 1996, 2001; Johnston, 1975; Sulik, 2005;Sulik and Johnston, 1982; Sulik et al., 1981, 1984). Morpho-genesis of the middle and upper face is heavily influenced bysignals emanating from the forebrain. Marcucio and collea-gues (2005) report that a role of Sonic hedgehog (Shh) in theforebrain is to regulate Shh expression in the face, and thattogether, these Shh domains mediate patterning within thefrontonasal prominence (Fig. 3) and proximodistal out-growth of the middle and upper face.The primary limitation of this study is the presence of
other prenatal and ⁄or postnatal risk factors, in addition to
alcohol, that are capable of adversely impacting braindevelopment. Clinical records for this FASD study sampledocumented that up to 83% of the mothers reportedlysmoked during pregnancy, up to 67% reportedly used illicitdrugs during pregnancy, and over 75% of the childrenwere in foster ⁄adoptive care (Astley et al., 2009b). Whilethe significant dose–response associations observed betweenalcohol exposure and neurostructural alterations in thisstudy provided compelling evidence of alcohol’s potentialcausal role, one cannot rule out the impact of the otherrisk factors.In conclusion, the results of this study confirm that signifi-
cant differences in the sizes of many brain regions existbetween children with FASD and their healthy peers. Moreimportantly, when the FASD 4-Digit Code is used to createclinically distinct diagnostic subgroups under the umbrella ofFASD (FAS ⁄PFAS, SE ⁄AE, and ND ⁄AE), statistically sig-nificant differences in neurostructure are identified betweenthe FASD diagnostic subgroups. Structural abnormalitieswere prevalent across the full spectrum of FASD. MRI couldimportantly augment the diagnosis of FASD, once popula-tion-based norms for structural development of the humanbrain are established.
ACKNOWLEDGMENTS
This research was supported by NIAAA Grant R01-AA12915-01A1 to SJA. Support was also received from theCenter on Human Development and Disability, University ofWashington (National Institute of Child Health and HumanDevelopment Grant: P30 HD02274). We would like toacknowledge Katherine Field, Olivia Liang, WinslowJohnson, and Katherine Keller for their assistance in themeasurement of MRI scans. Special thanks are extended tothe children and their families who so kindly contributed timeand effort to this study.
REFERENCES
Aase JM, Jones KL, Clarren SK (1995) Do we need the term ‘‘FAE’’? Pediat-
rics 95:428–430.
Archibald SL, Fennema-Notestine C, Ganst A, Riley EP, Mattson SN, Jerni-
gan TL (2001) Brain dysmorphology in individuals with severe prenatal
alcohol exposure. Dev Med Child Neurol 43:148–154.
Astley SJ (ed) (2003) Fetal Alcohol Syndrome Facial Photograph Analysis
Software. 1.0 ed. University of Washington, Seattle, WA.
Astley SJ (2004) Diagnostic Guide for Fetal Alcohol Spectrum Disorders: The
4-Digit Diagnostic Code. 3rd ed. University of Washington Publication Ser-
vices, Seattle, WA.
Astley SJ, Aylward EH, Olson HC, Kerns K, Brooks A, Coggins TE, Davies
J, Dorn S, Gendler B, Jirikowic T, Kraegel P, Maravilla K, Richards T
(2009a) Functional magnetic resonance imaging outcomes from a compre-
hensive magnetic resonance study of children with fetal alcohol spectrum
disorders. J Neurodev Disord 1:61–80.
Astley SJ, Clarren SK (1996) A case definition and photographic screening
tool for the facial phenotype of fetal alcohol syndrome. J Pediatr 129:33–41.
Astley SJ, Clarren SK (2000) Diagnosing the full spectrum of fetal alcohol
exposed individuals: Introducing the 4-Digit Diagnostic Code. Alcohol
Alcohol 35:400–410.
MR STUDY ON FASD CHILDREN 17
Astley SJ, Clarren SK (2001) Measuring the facial phenotype of individuals
with prenatal alcohol exposure: correlations with brain dysfunction. Alcohol
Alcohol 36:147–159.
Astley SJ, Olson HC, Kerns K, Brooks A, Aylward EH, Coggins TE, Davies
J, Dorn S, Gendler B, Jirikowic T, Kraegel P, Maravilla K, Richards T
(2009b) Neuropsychological and behavioral outcomes from a comprehen-
sive magnetic resonance study of children with fetal alcohol spectrum disor-
ders. Can J Pharmacol 16:e178–e201.
Astley SJ, Richards T, Aylward EH, Olson HC, Kerns K, Brooks A, Coggins
TE, Davies J, Dorn S, Gendler B, Jirikowic T, Kraegel P, Maravilla K
(2009c) Magnetic resonance spectroscopy outcomes from a comprehensive
magnetic resonance study of children with fetal alcohol spectrum disorders.
Magn Reson Imaging DOI: 10.1016/j.mri.2009.01.003.
Astley S, Stachowiak J, Clarren S, Clausen C (2002) Application of the fetal
alcohol syndrome facial photographic screening tool in a foster care popula-
tion. J Pediatr 141:712–717.
Autti-Ramo I (2000) Twelve-year follow-up of children exposed to alcohol in
utero. Dev Med Child Neurol 42:406–411.
Aylward EH, Augustine A, Li Q, Barta PE, Pearlson GD (1997b) Measure-
ment of frontal lobe volume on magnetic resonance imaging scans. Psychia-
try Res 75:23–30.
Aylward E, Brettschneider PD, McArthur JC, Harris GJ, Schlaepfer TE,
Henderer JD, Barta PE, Tien AY, Pearlson GD (1995) Magnetic resonance
imaging measurement of gray matter volume reductions in HIV-1 dementia.
Am J Psychiatry 152:987–994.
Aylward E, Li Q, Habbak R, Warren A, Pulsifer M, Barta P, Jerram M,
Pearlson G (1997a) Basal ganglia volume in adults with Down syndrome.
Psychiatry Res 74:73–82.
Aylward EH, Li Q, Honeycutt NA, Warren AC, Pulsifer MB, Barta PE,
Chang MD, Smith PD, Jerram M, Pearlson GD (1999) MRI volumes of
hippocampus and amygdala in adults with Down’s syndrome with and
without dementia. Am J Psychiatry 156:564–568.
Aylward E, Reiss A (1991) Area and volume measurement of posterior fossa
structures in MRI. J Psychiatr Res 25:159–168.
Aylward E, Reiss A, Barta P, Tien A, Han W, Lee J, Pearlson G (1994) Mag-
netic resonance imaging measurement of posterior fossa structures in schizo-
phrenia. Am J Psychiatry 151:1448–1452.
Barta PE, Powers RE, Aylward EH, Chase GA, Harris GJ, Rabins PV, Tune
LE, Pearlson GD (1997) Quantitative MRI volume changes in late onset
schizophrenia and Alzheimer’s disease compared to normal controls.
Psychiatry Res 68:65–75.
Beery KE (1997) The Beery-Buktenica Developmental Test of Visual-Motor
Integration. 4th ed. Modern Curriculum Press, Parsippany, NJ.
Bertrand J, Floyd RL, Weber MK, O’Connor M, Riley EP, Johnson KA,
Cohen DE, National Task Force on FAS ⁄FAE (2004) Fetal Alcohol
Syndrome: Guidelines for Referral and Diagnosis. Centers for Disease Con-
trol and Prevention, Atlanta, GA.
Bookstein FL, Sampson PD, Connor PD, Streissguth AP (2002a) Midline cor-
pus callosum is a neuroanatomical focus of fetal alcohol damage. Anat Rec
269:162–174.
Bookstein FL, Streissguth AP, Sampson PD, Connor PD, Barr HM (2002b)
Corpus callosum shape and neuropsychological deficits in adult males with
heavy fetal alcohol exposure. Neuroimage 15:233–251.
Chudley AE, Conroy J, Cook JL, Loock C, Rosales T, LeBlanc N (2005) Pub-
lic Health Agency of Canada’s National Advisory Committee on Fetal
Alcohol Spectrum Disorder: Canadian guidelines for diagnosis. Can Med
Assoc J 172:S1–S21.
Cortese BM, Moore GJ, Bailey BA, Jacobson SW, Delaney-Black V,
Hannigan JH (2006) Magnetic resonance and spectroscopic imaging in
prenatal alcohol-exposed children: Preliminary findings in the caudate
nucleus. Neurotoxicol Teratol 28:597–606.
Cote L, Crutcher MD (1990) The basal ganaglia, in Subcortical Dementia
(Kandel ER, Schwartz JH, Jessell M eds), pp 647–659. Oxford University
Press, New York.
Delis DC, Kaplan E, Kramer JH, Ober BA (2000) Delis-Kaplan
Executive Function Scale. The Psychological Corporation, San Antonio
TX.
Eichenbaum H, Otto T, Cohen NJ (1992) The hippocampus—what does it
do? Behav Neural Biol 57:2–36.
Giedd JN, Castellanos FX, Casey BJ, Kozuch P, King AC, Hamburger SD,
Rapoport JL (1994) Quantitative morphology of the corpus callosum in
attention deficit hyperactivity disorder. Am J Psychiatry 151:665–669.
Goodlett CR, Marcussen BL, West JR (1990) A single day of alcohol
exposure during the brain growth spurt induces brain weight restriction and
cerebellar Purkinje cell loss. Alcohol Clin Exp Res 7:107–114.
Haier R, Jung R, Yeo R, Head K, Alkire M (2004) Structural brain variation
and general intelligence. Neuroimage 23:425–433.
Hoyme HE, May PA, Kalberg WO, Kodituwakku P, Gossage JP, Trujillo
PM, Buckley DG, Miller JH, Aragon AS, Khaole N, Viljoen DL, Jones
KL, Robinson LK (2005) A practical clinical approach to diagnosis of fetal
alcohol spectrum disorders: clarification of the 1996 Institute of Medicine
criteria. Pediatrics 115:39–47.
Jeret JS, Serur D, Wisniewski K, Fisch C (1986) Frequency of agenesis of the
corpus callosum in the developmentally disabled population as determined
by computerized tomography. Pediatr Neurosci 12:101–103.
Johnston MC (1975) The neural crest in abnormalities of the face and brain.
Birth Defects Original Article Series 11(7):1–18.
Kodituwakku PW (2007) Defining the behavioral phenotype in children with
fetal alcohol spectrum disorders: a review. Neurosci Biobehav Rev 31:192–
201.
Marcucio RS, Cordero DR, Hu D, Helms JA (2005) Molecular interactions
coordinating the development of the forebrain and face. Develop Bio
284:48–61.
Mattson SN, Riley EP (1995) Prenatal exposure to alcohol. What images
reveal. Alcohol Health Res World 19:273–278.
Mattson SN, Riley EP (1998) A review of neurobehavioral deficits in children
with FAS or prenatal exposure to alcohol. Alcohol Clin Exp Res 22:279–
294.
Mattson SN, Riley EP, Sowell ER, Jernigan TL, Sobel DF, Jones KL (1996)
A decrease in the size of the basal ganglia in children with FAS. Alcohol
Clin Exp Res 20:1088–1093.
Mattson SN, Schoenfeld AM, Riley EP (2001) Teratogenic effects of alcohol
on brain and behavior. Alcohol Research & Health 25:185–191.
Miller MW, Astley SJ, Clarren SK (1999) Number of axons in the corpus
callosum of the mature Macaca nemestrina: Increases caused by prenatal
exposure to ethanol. J Comp Neurol 412:123–131.
Moore KL, Persaud TVN, Shiota K (1994) Color Atlas of Clinical Embryol-
ogy. W B Saunders Co, Philidelphia PA.
O’Hare ED, Kan E, Yoshii J, Mattson SN, Riley EP, Thompson PM,
Toga AW, Sowell ER (2005) Mapping cerebellar vermal morphology
and cognitive correlates in prenatal alcohol exposure. Neuroreport
16:1285–1290.
Olson HC, Feldman J, Streissguth AP, Sampson PD, Bookstein FL (1998)
Neuropsychological deficits among adolescents with fetal alcohol syndrome:
Clinical findings. Alcohol Clin Exp Res 22:1998–2012.
Paul LK, Brown WS, Adolphs R, Tyszka JM, Richards LJ, Mukherjee P,
Sherr EH (2007) Agenesis of the corpus callosum: genetic developmental
and functional aspects of connectivity. Nat Rev Neurosci 8:287–299.
Reiss A, Aylward E, Freund L, Bryan PJN (1991) Neuroanatomy of Fragile
X syndrome I: The posterior fossa. Ann Neurol 29:26–32.
Riley EP, Mattson SN, Sowell ER, Jernigan TL, Sobel DF, Jones KL (1995)
Abnormalities of the corpus callosum in children prenatally exposed to
alcohol. Alcohol Clin Exp Res 19:1198–1202.
Roebuck TM, Mattson SN, Riley EP (1999) Behavioral and psychosocial
profiles of alcohol-exposed children. Alcohol Clin Exp Res 23:1070–1076.
Smith DW (1979) The fetal alcohol syndrome. Hosp Pract 14:121–128.
Sowell ER, Jernigan TL, Mattson SN, Riley EP, Sobel DF, Jones KL (1996)
Abnormal development of the cerebellar vermis in children prenatally
exposed to alcohol: size reduction in lobules I through V. Alcohol Clin Exp
Res 20:31–34.
Sowell E, Johnson A, Kan E, Lu L, Horn JV, Toga A, O’Connor M,
Bookheimer S (2008) Mapping white matter integrity and neurobehavioral
correlates in children with fetal alcohol spectrum disorders. J Neurosci
28:1313–1319.
18 ASTLEY ET AL.
Sowell ER, Mattson SN, Thompson PM, Jernigan TL, Riley EP, Toga AW
(2001a) Mapping callosal morphology and cognitive correlates: Effects of
heavy prenatal alcohol exposure. Neurology 57:235–244.
Sowell ER, Thompson PM,Mattson SN, Tessner KD, Jernigan TL, Riley EP,
Toga AW (2001b) Voxel-based morphometric analyses of the brain in chil-
dren and adolescents prenatally exposed to alcohol.Neuroreport 12:515–523.
Sowell ER, Thompson PM, Mattson SN, Tessner KD, Jernigan TL, Riley
EP, Toga AW (2002a) Regional brain shape abnormalities persist into ado-
lescence after heavy prenatal alcohol exposure. Cereb Cortex 12:856–865.
Sowell ER, Thompson PM, Peterson BS, Mattson SN, Welcome SE,
Henkenius AL, Riley EP, Jernigan TL, Toga AW (2002b) Mapping cortical
gray matter asymmetry patterns in adolescents with heavy prenatal alcohol
exposure. Neuroimage 17:1807–1903.
Sparrow SS, Balla DA, Cicchetti DV (1984) Vineland Adaptive Behavior
Scales: Interview Edition Survey Form Manual. American Guidance
Service, Circle Pines, MN.
Steen RG, Hamer RM, Lieberman JA (2007) Measuring Brain Volume by
MR Imaging: Impact of Measurement Precision and Natural Variation on
Sample Size Requirements. Am J Neuroradiol 28:1119–1125.
Stratton K, Howe C, Battaglia F (1996) Fetal Alcohol Syndrome: Diagnosis
Epidemiology Prevention and Treatment. Institute of Medicine, National
Academy Press, Washington DC.
Streissguth AP, Bookstein FL, Barr HM, Sampson PD, O’Malley K, Young
JK (2004) Risk factors for adverse life outcomes in fetal alcohol syndrome
and fetal alcohol effects. J Dev Behav Pediatr 25:228–238.
Streissguth AP, Bookstein FL, Sampson PC, Barr HM (1993) The Enduring
Effects of Prenatal Alcohol Exposure on Child Development: Birth
Through Seven Years: A Partial Least Squares Solution. University of
Michigan Press, Ann Arbor, MI.
Sulik KK (2005) Genesis of alcohol-induced craniofacial dysmorphism. Exp
Biol Med 230:366–375.
Sulik KK, JohnstonMC (1982) Embryonic origin of holoprosencephaly: inter-
relationship of the developing brain and face. Scan Electron Microsc 1:309–
322.
Sulik KK, Johnston MC, Webb MA (1981) Fetal alcohol syndrome: embryo-
genesis in a mouse model. Science 214:936–938.
Sulik KK, Lauder JM, Dehart DB (1984) Brain malformations in prenatal
mice following acute maternal ethanol administration. Int J Dev Neurosci
2:203–214.
Vidal CN, Nicolson R, DeVito TJ, Hayashi KM, Geaga JA, Drost DJ,
Williamson PC, Rajakumar N, Sui Y, Dutton RA, Toga AW, Thompson
PM (2006) Mapping corpus callosum deficits in autism: an index of aberrant
cortical connectivity. Biol Psychiatry 60:218–225.
Waber DP, Moor CD, Forbes PW, Almli CR, Botteron KN, Leonard G,
Milovan D, Puas T, Rumsey J, Group TBDC (2007) The NIH MRI study
of normal brain development: performance of a population based sample of
healthy children aged 6 to 18 years on a neuropsychological battery. J Int
Neuropsychol Soc 13:1–18.
Wass TS, Persutte WH, Hobbins JC (2001) The impact of prenatal alcohol
exposure on frontal cortex development in utero. Am J Obstet Gynecol
185:737–742.
Wechsler D (1996) WISC-III Manual. Psychological Corporation, San
Antonio, TX.
MR STUDY ON FASD CHILDREN 19