Magnetic Hysteresis Models for Modelica · 2012-07-23 · Magnetic Hysteresis Models for Modelica...
8
Magnetic Hysteresis Models for Modelica Johannes Ziske, Thomas Bödrich Technische Universität Dresden, Institute of Electromechanical and Electronic Design 01062 Dresden, Germany [email protected] [email protected] Abstract Modelica models for transient simulation of magnet- ic hysteresis are currently being developed at Tech- nische Universität Dresden. This paper gives an overview about the present state of the work. Two hysteresis models have been implemented so far in Modelica and are currently optimised and tested: the rather simple but efficient Tellinen model and the more complex and accurate Preisach model. Utilisa- tion of the Tellinen model together with components of the Modelica.Magnetic.FluxTubes library is ex- emplarily shown with transient simulation of a three- phase autotransformer. Additionally, an efficient im- plementation of the Preisach model is described and a first comparison between the Tellinen and the clas- sical Preisach hystesis model is presented. It is planned to include the developed hysteresis models into the above-mentioned FluxTubes library after their further optimisation and validation with own measurements. These models will especially allow for the estimation of iron losses and for accurate computation of saturation behaviour during Modeli- ca-based design of electromagnetic components and systems. This becomes increasingly important with the growing requirements regarding energy efficien- cy and mass power densities of such systems. Keywords: magnetic hysteresis, lumped magnetic network; hysteresis model; Tellinen; Preisach; iron losses; Modelica.Magnetic.FluxTubes library 1 Introduction The Modelica.Magnetic.FluxTubes library included in the Modelica Standard Library [1] is intended for rough design and system simulation of magnetic components and devices, e.g. actuators, motors, transformers or holding magnets [2, 3]. This library is based on the well-established concept of magnetic flux tubes, which enables modelling of magnetic fields with lumped networks [4]. At present, ferromagnetic hysteresis is not consid- ered in the above-mentioned library. However, the prediction of losses due to static (ferromagnetic) and dynamic (eddy current) hysteresis becomes more and more important during the design of electromagnetic components. This is due to the increasing demands on energy efficiency of electromagnetic systems and due to increasing power densities of those systems. Prominent examples for this engineering trend are electromobility and more electric aircraft, where the necessity of high mass power densities and loss power minimisation are obvious. In general, the reliable prediction of hysteresis- related losses with lumped magnetic network models is difficult and demanding and has been a topic of research for a long time. Simplified empirical equa- tions for loss calculation, e.g. the well-known Steinmetz formula [5] are based on time-harmonic flux densities of known magnitude and frequency [6]. The delayed penetration of magnetic fields into bulk and laminated ferromagnetic materials can be approximated in lumped magnetic networks with Cauer circuits [7]. Transient simulation of magnetic hysteresis in lumped magnetic network models is possible with dedicated hysteresis models. Well-known such mod- els are for example the phenomenological one pub- lished by Preisach in 1935 [8], the physical model developed by Jiles and Atherton [9] or the compara- tively simple model developed by Tellinen [10]. Those models are currently analysed at Technische Universität Dresden, and selected hysteresis models are implemented in Modelica for inclusion into the Modelica.Magnetic.FluxTubes library. The Tellinen hysteresis model and the Preisach mod- el have been implemented and are currently tested and optimised. Theory and Modelica implementation of these two models and their utilisation in compo- nents of the Modelica.Magnetic.FluxTubes library will be presented in the following sections. It must be noted that this is a report about work in progress rather than a final presentation of the projected Mod- elica.Magnetic.FluxTubes library extension. Both DOI Proceedings of the 9 th International Modelica Conference 151 10.3384/ecp12076151 September 3-5, 2012, Munich, Germany
Transcript of Magnetic Hysteresis Models for Modelica · 2012-07-23 · Magnetic Hysteresis Models for Modelica...
Magnetic Hysteresis Models for Modelica
Johannes Ziske, Thomas Bödrich
Technische Universität Dresden, Institute of Electromechanical and Electronic Design
01062 Dresden, Germany
[email protected] [email protected]
Abstract
Modelica models for transient simulation of magnet-
ic hysteresis are currently being developed at Tech-
nische Universität Dresden. This paper gives an
overview about the present state of the work. Two
hysteresis models have been implemented so far in
Modelica and are currently optimised and tested: the
rather simple but efficient Tellinen model and the
more complex and accurate Preisach model. Utilisa-
tion of the Tellinen model together with components
of the Modelica.Magnetic.FluxTubes library is ex-
emplarily shown with transient simulation of a three-
phase autotransformer. Additionally, an efficient im-
plementation of the Preisach model is described and
a first comparison between the Tellinen and the clas-
sical Preisach hystesis model is presented. It is
planned to include the developed hysteresis models
into the above-mentioned FluxTubes library after
their further optimisation and validation with own
measurements. These models will especially allow
for the estimation of iron losses and for accurate
computation of saturation behaviour during Modeli-
ca-based design of electromagnetic components and
systems. This becomes increasingly important with
the growing requirements regarding energy efficien-
cy and mass power densities of such systems.
Keywords: magnetic hysteresis, lumped magnetic
network; hysteresis model; Tellinen; Preisach; iron
losses; Modelica.Magnetic.FluxTubes library
1 Introduction
The Modelica.Magnetic.FluxTubes library included
in the Modelica Standard Library [1] is intended for
rough design and system simulation of magnetic
components and devices, e.g. actuators, motors,
transformers or holding magnets [2, 3]. This library
is based on the well-established concept of magnetic
flux tubes, which enables modelling of magnetic
fields with lumped networks [4].
At present, ferromagnetic hysteresis is not consid-
ered in the above-mentioned library. However, the
prediction of losses due to static (ferromagnetic) and
dynamic (eddy current) hysteresis becomes more and
more important during the design of electromagnetic
components. This is due to the increasing demands
on energy efficiency of electromagnetic systems and
due to increasing power densities of those systems.
Prominent examples for this engineering trend are
electromobility and more electric aircraft, where the
necessity of high mass power densities and loss
power minimisation are obvious.
In general, the reliable prediction of hysteresis-
related losses with lumped magnetic network models
is difficult and demanding and has been a topic of
research for a long time. Simplified empirical equa-
tions for loss calculation, e.g. the well-known
Steinmetz formula [5] are based on time-harmonic
flux densities of known magnitude and frequency
[6]. The delayed penetration of magnetic fields into
bulk and laminated ferromagnetic materials can be
approximated in lumped magnetic networks with
Cauer circuits [7].
Transient simulation of magnetic hysteresis in
lumped magnetic network models is possible with
dedicated hysteresis models. Well-known such mod-
els are for example the phenomenological one pub-
lished by Preisach in 1935 [8], the physical model
developed by Jiles and Atherton [9] or the compara-
tively simple model developed by Tellinen [10].
Those models are currently analysed at Technische
Universität Dresden, and selected hysteresis models
are implemented in Modelica for inclusion into the
Modelica.Magnetic.FluxTubes library.
The Tellinen hysteresis model and the Preisach mod-
el have been implemented and are currently tested
and optimised. Theory and Modelica implementation
of these two models and their utilisation in compo-
nents of the Modelica.Magnetic.FluxTubes library
will be presented in the following sections. It must
be noted that this is a report about work in progress
rather than a final presentation of the projected Mod-
elica.Magnetic.FluxTubes library extension. Both
DOI Proceedings of the 9th International Modelica Conference 151 10.3384/ecp12076151 September 3-5, 2012, Munich, Germany
implemented hysteresis models are still subject to
optimisation and validation, e.g. with measurements.
2 The Tellinen Hysteresis Model
2.1 Theory
The hysteresis model developed by Tellinen is thor-
oughly described in [10]. The big advantage of this
model is its simplicity. Thus, it is well suited for fast
simulations when used in lumped magnetic network
models. It works without information about the his-
tory of the magnetic field strength H in ferromagnet-
ic components and can completely be configured
with the limiting increasing and decreasing branches
λi(H) and λd(H), respectively, of the limiting hystere-
sis loop of a ferromagnetic material (Figure 1).
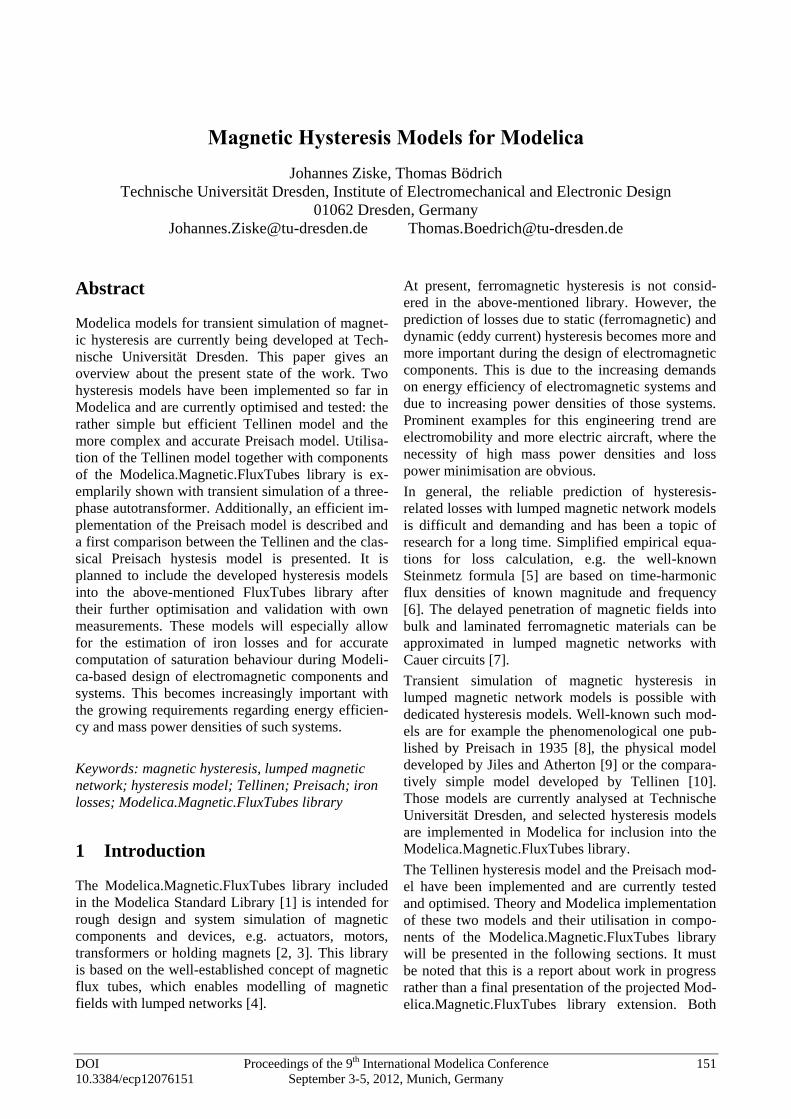
Figure 1: Limiting increasing and decreasing branch
λi(H) and λd(H), respectively, of a hysteresis loop
with magnetic polarization J and magnetic field
strength H (a) and corresponding slope functions
ρλi(H) and ρλd(H) (b).
Together with the corresponding slope functions
ρλi(H) and ρλd(H) the actual slope ρj at the operating
point O(h, j) can be determined as
{
( )
( ) ( ) ( )
( )
( ) ( ) ( )
(1)
Thus, the time–based slope of j can be easily com-
puted at every integration step to
(2)
Hence the slope of the magnetic flux density db/dt of
( )
(3)
µ0 is the slope db/dh of the limiting hysteresis loops
within the saturation region.
2.2 Implementation in Modelica
The Tellinen model described above was integrated
into a reluctance element of the Modelica.Mag-
netic.FluxTubes library, and can thus similarly
be used in electromagnetic network models (in [2]
the magnetic library is explained in detail). The re-
luctance model can be configured with the cross sec-
tion and the length of a ferromagnetic core and the
limiting hysteresis loop of the core material. On the
one hand hysteresis loops can be defined by the hy-
perbolic tangent function and definition of the three
parameters JS (saturation polarization), JR (rema-
nence) and HC (coercivity) (see Figure 1a). On the
other hand table data can be used to define the in-
creasing and decreasing hysteresis branches. Thus,
almost arbitrary hysteresis loops can easily be im-
plemented and also easily be derived from measure-
ments. In addition a small experimental library was
built using exemplary table data of some common
ferromagnetic materials (Figure 2).
Figure 2: Exemplarily simulated limiting hysteresis
loops: curve 1 described by a hyperbolic tangent
function and curves 2 to 4 described by tabular B(H)
data extracted from [11].
Magnetic Hysteresis Models for Modelica
152 Proceedings of the 9th International Modelica Conference DOI September 3-5, 2012, Munich Germany 10.3384/ecp12076151

2.3 Autotransformer as an Example
The implemented Tellinen hysteresis models were
tested with a simple electromagnetic network model
of a three-phase autotransformer. A sketch of the EI-
shaped ferromagnetic core of the transformer with
indicated corresponding network elements is shown
in Figure 3a and the complete electromagnetic net-
work model in Figure 3b.
Figure 3: Sketch of a three-phase autotransformer
with an EI-shaped ferromagnetic core (a) and corre-
sponding simple electromagnetic network model
with hysteresis elements representing the transformer
core (b).
Figure 4: Simulated magnetic flux densities B vs.
magnetic field strength H of the three hysteresis
elements Rmag1 (blue), Rmag2 (red) and Rmag3
(green) representing the three transformer legs.
Transient oscillations of the magnetic flux densities
in the three transformer legs after power-on are ex-
emplarily shown in Figure 4. Selected corresponding
voltages and currents are depicted in Figure 5.
Figure 5: Results of the autotransformer simulation:
source voltage V1.v and voltage drop RL1.v of load
resistance (a), magnetic flux densities of the three
hysteresis elements Rmag1.b to Rmag3.b (b) and
source currents V1.i to V3.i.
3 The Preisach Hysteresis Model
3.1 Overview on the Classical Preisach Model
In this section a very short overview on the classical
Preisach model is given. More detailed information
on this model can be found e.g. in [12]. The Preisach
model describes the behaviour of an output signal j(t)
in dependence on an input signal h(t) and on its his-
tory. Here, j(t) and h(t) are the magnetic polarisation
of a ferromagnetic material and the magnetic field
strength, respectively. The model assumes an infinite
set of elementary hysteresis operators γαβ. The opera-
tors’ output ( ) can only hold the polarisation
values of -1 or +1 dependent on the upper and lower
switching limits α and β, on the input signal h(t) and
on its history. The behaviour of γαβh(t) is shown in
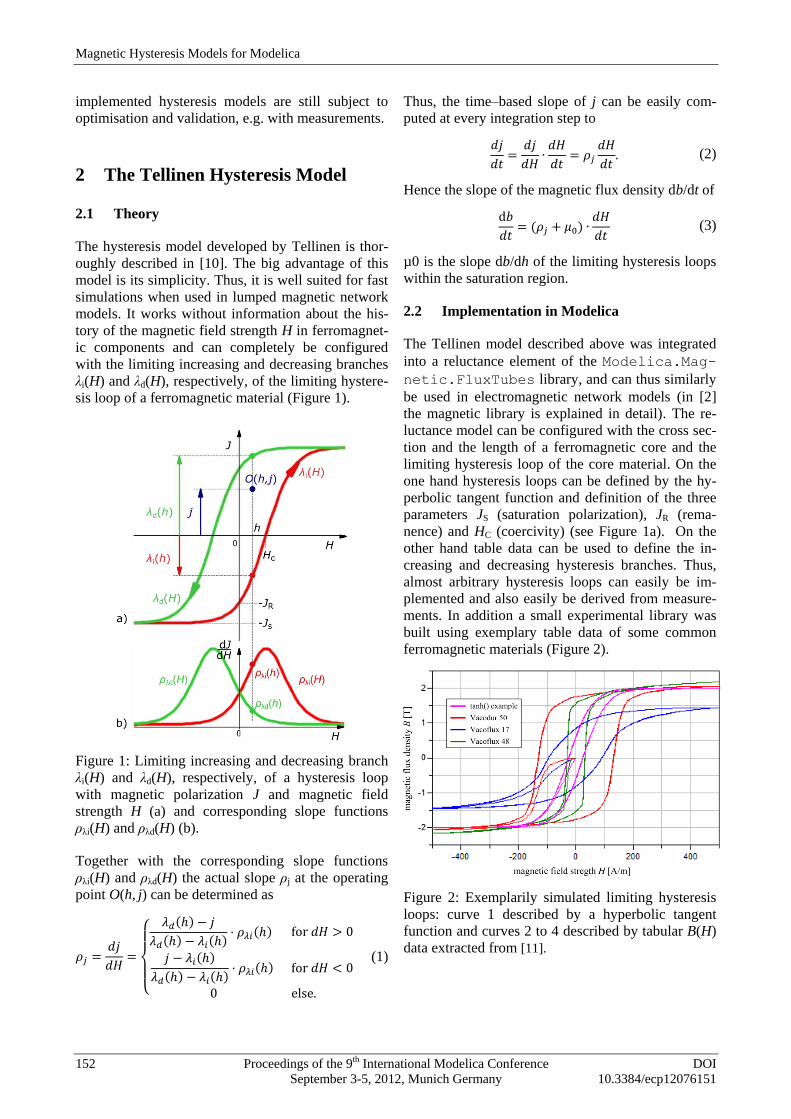
Figure 6. It is defined as
Session 1D: Electromagnetic Systems I
DOI Proceedings of the 9th International Modelica Conference 153 10.3384/ecp12076151 September 3-5, 2012, Munich, Germany
( ) {
( ) ( )
(4)
Figure 6: Elementary Preisach operator γαβ (hyster-
on).
The upper switching limit of each operator is always
greater than or equal to the lower limit (α ≥ β). Thus,
the switching limits α and β span a right triangular
region, often referred to as Preisach plane (Figure 7).
Figure 7: Preisach plane.
For each point (α, β) on this plane exactly one ele-
mentary hysteresis operator γαβ exists with upper and
lower switching limits α and β, respectively. The
Preisach distribution function P(α, β) gives a weight
to all operators in the region α ≥ β and is 0 out of that
region. Thus, the output polarisation j(t) of the sys-
tem results in
( ) ∬ ( ) ( )
(5)
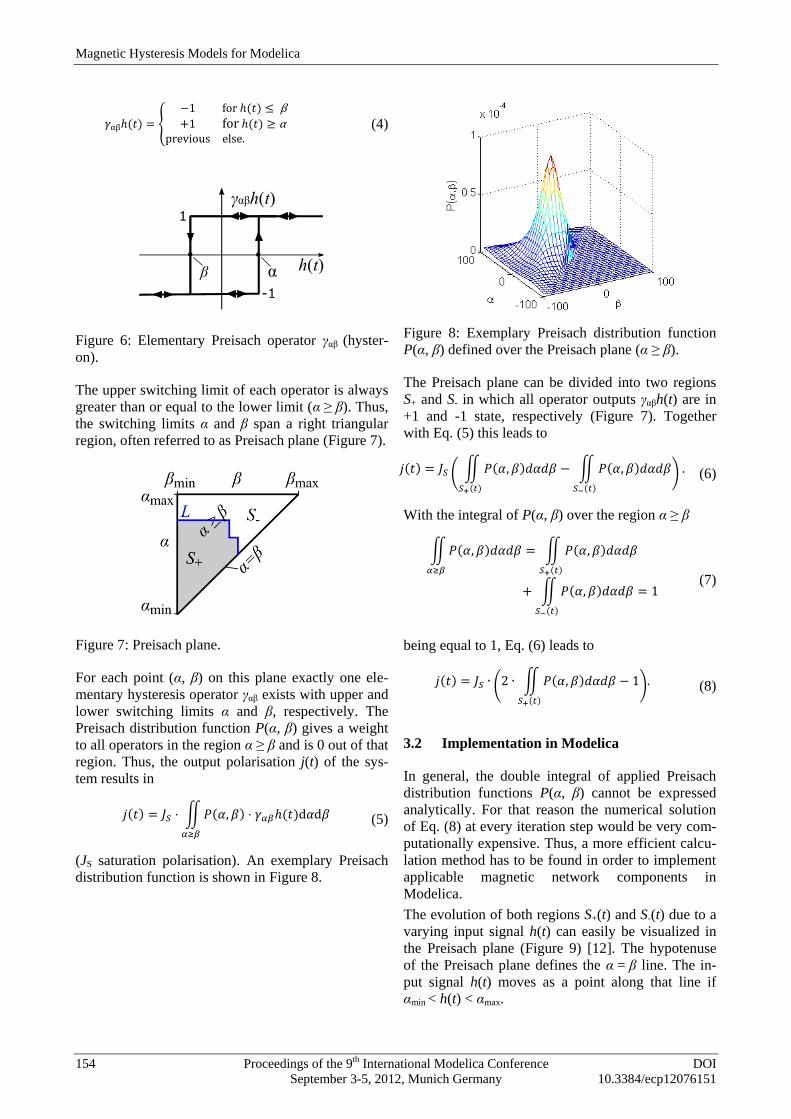
(JS saturation polarisation). An exemplary Preisach
distribution function is shown in Figure 8.
Figure 8: Exemplary Preisach distribution function
P(α, β) defined over the Preisach plane (α ≥ β).
The Preisach plane can be divided into two regions
S+ and S- in which all operator outputs γαβh(t) are in
+1 and -1 state, respectively (Figure 7). Together
with Eq. (5) this leads to
( ) ( ∬ ( )
( )
∬ ( )
( )
) (6)
With the integral of P(α, β) over the region α ≥ β
∬ ( )
∬ ( )
( )
∬ ( )
( )
(7)
being equal to 1, Eq. (6) leads to
( ) ( ∬ ( )
( )
) (8)
3.2 Implementation in Modelica
In general, the double integral of applied Preisach
distribution functions P(α, β) cannot be expressed
analytically. For that reason the numerical solution
of Eq. (8) at every iteration step would be very com-
putationally expensive. Thus, a more efficient calcu-
lation method has to be found in order to implement
applicable magnetic network components in
Modelica.
The evolution of both regions S+(t) and S-(t) due to a
varying input signal h(t) can easily be visualized in
the Preisach plane (Figure 9) [12]. The hypotenuse
of the Preisach plane defines the α = β line. The in-
put signal h(t) moves as a point along that line if
αmin < h(t) < αmax.
Magnetic Hysteresis Models for Modelica
154 Proceedings of the 9th International Modelica Conference DOI September 3-5, 2012, Munich Germany 10.3384/ecp12076151
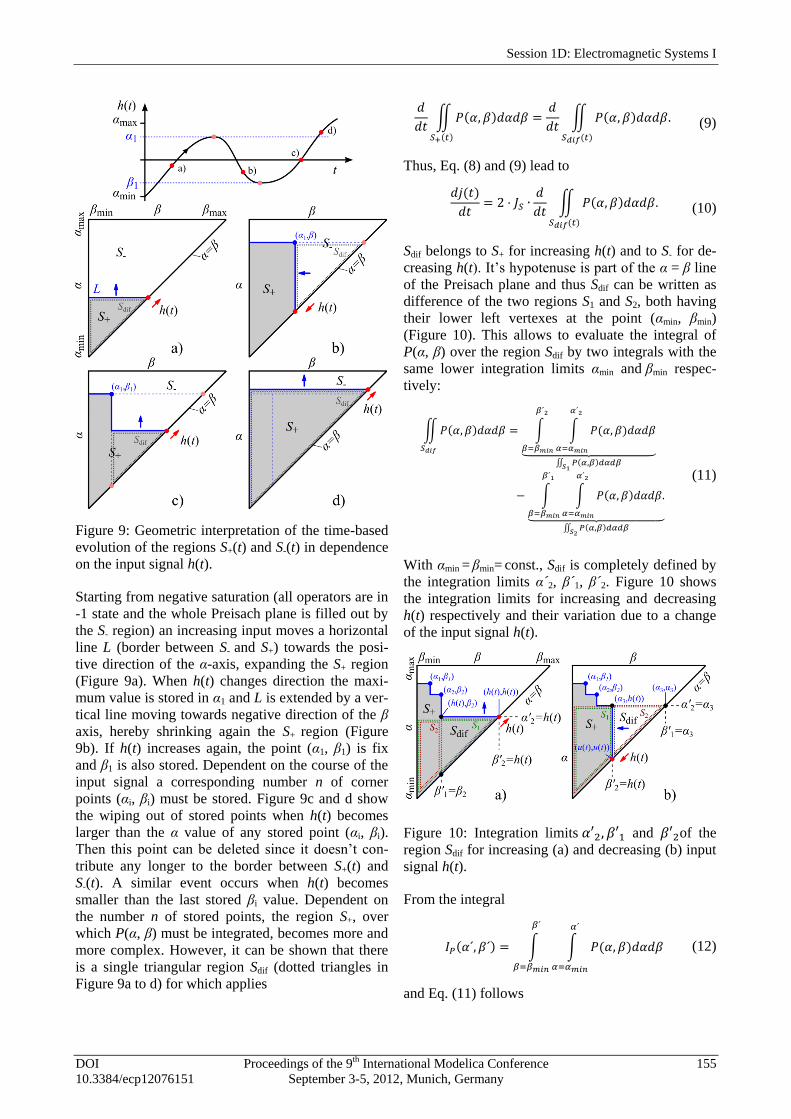
Figure 9: Geometric interpretation of the time-based
evolution of the regions S+(t) and S-(t) in dependence
on the input signal h(t).
Starting from negative saturation (all operators are in
-1 state and the whole Preisach plane is filled out by
the S- region) an increasing input moves a horizontal
line L (border between S- and S+) towards the posi-
tive direction of the α-axis, expanding the S+ region
(Figure 9a). When h(t) changes direction the maxi-
mum value is stored in α1 and L is extended by a ver-
tical line moving towards negative direction of the β
axis, hereby shrinking again the S+ region (Figure
9b). If h(t) increases again, the point (α1, β1) is fix
and β1 is also stored. Dependent on the course of the
input signal a corresponding number n of corner
points (αi, βi) must be stored. Figure 9c and d show
the wiping out of stored points when h(t) becomes
larger than the α value of any stored point (αi, βi).
Then this point can be deleted since it doesn’t con-
tribute any longer to the border between S+(t) and
S-(t). A similar event occurs when h(t) becomes
smaller than the last stored βi value. Dependent on
the number n of stored points, the region S+, over
which P(α, β) must be integrated, becomes more and
more complex. However, it can be shown that there
is a single triangular region Sdif (dotted triangles in
Figure 9a to d) for which applies
∬ ( )
( )
∬ ( )
( )
(9)
Thus, Eq. (8) and (9) lead to
( )
∬ ( )
( )
(10)
Sdif belongs to S+ for increasing h(t) and to S- for de-
creasing h(t). It’s hypotenuse is part of the α = β line
of the Preisach plane and thus Sdif can be written as
difference of the two regions S1 and S2, both having
their lower left vertexes at the point (αmin, βmin)
(Figure 10). This allows to evaluate the integral of
P(α, β) over the region Sdif by two integrals with the
same lower integration limits αmin and βmin respec-
tively:
∬ ( )
∫ ∫ ( )
⏟ ∬ ( )
∫ ∫ ( )
⏟ ∬ ( )
(11)
With αmin = βmin= const., Sdif is completely defined by
the integration limits α´2, β´1, β´2. Figure 10 shows
the integration limits for increasing and decreasing
h(t) respectively and their variation due to a change
of the input signal h(t).
Figure 10: Integration limits and of the
region Sdif for increasing (a) and decreasing (b) input
signal h(t).
From the integral
( ) ∫ ∫ ( )
(12)
and Eq. (11) follows
Session 1D: Electromagnetic Systems I
DOI Proceedings of the 9th International Modelica Conference 155 10.3384/ecp12076151 September 3-5, 2012, Munich, Germany

∬ ( )
( ) ( ) (13)
With Eq. (10) and (13) one obtains
( )
( ( ) ( )) (14)
In the Preisach hysteresis model implemented in
Modelica, the integral IP of the Preisach distribution
function P(α,β) is numerically computed only once
at the start of a simulation run for discrete grid points
and stored in a two-dimensional array AIP. All values
of IP between the grid points of AIP can then be ob-
tained by bilinear interpolation of adjacent AIP val-
ues. This is an enormous reduction of the computa-
tional effort, namely from the numerical solution of
the double integral of P(α, β) to two table look-ups
and bilinear interpolations of IP values in the array
AIP (see Eq. (14)). Figure 11 shows the values of AIP
for the exemplary Preisach distribution function de-
picted in Figure 8.
Figure 11: Array data AIP of the integral of the
Preisach distribution function P(α, β) shown in Fig-
ure 8.
3.3 First Simulation Results
A simple network model of an inductor with a closed
ferromagnetic core was used for first tests of the im-
plemented Preisach hysteresis model (Figure 12).
Figure 12: Simple electromagnetic model of an in-
ductor with closed ferromagnetic core for testing of
the Preisach hysteresis model.
Simulation results, especially the simulated B(H)
hysteresis of the iron core, are shown in Figure 13.
The increasing exponential sine voltage causes grow-
ing hysteresis loops. The resulting B(H) loops are not
centered around the origin, because the flux density
B of this simulation starts for H = 0 A/m at negative
remanence.
Figure 13: Simulation results of the inductor model:
source voltage expSine.v and flux density ironCore.b
in the core (a) and B(H) plot of the growing hystere-
sis loops in the iron core (b).
4 Model Comparison
To show the different behaviour between the classi-
cal Preisach and the Tellinen hysteresis model two
simulations were carried out. An identical magnetic
field strength H(t) was applied to the input of both
hysteresis elements, which were configured to have
equal limiting hysteresis loops. The models output
characteristics B(H) were then plotted together in
one diagram. In the first simulation a decreasing ex-
ponential sine wave was used as input signal. The
corresponding simulation results are shown in Figure
14. Only small differences in the models output are
obvious. The different behaviour can be seen more
clearly in the results of the second simulation, in
which a slightly more complex input signal of two
superposed sine waves of different amplitude and
frequency (Figure 15a) was applied. The B(H) char-
acteristics in Figure 15b show the deviation between
both models, especially in the region of the minor
Magnetic Hysteresis Models for Modelica
156 Proceedings of the 9th International Modelica Conference DOI September 3-5, 2012, Munich Germany 10.3384/ecp12076151
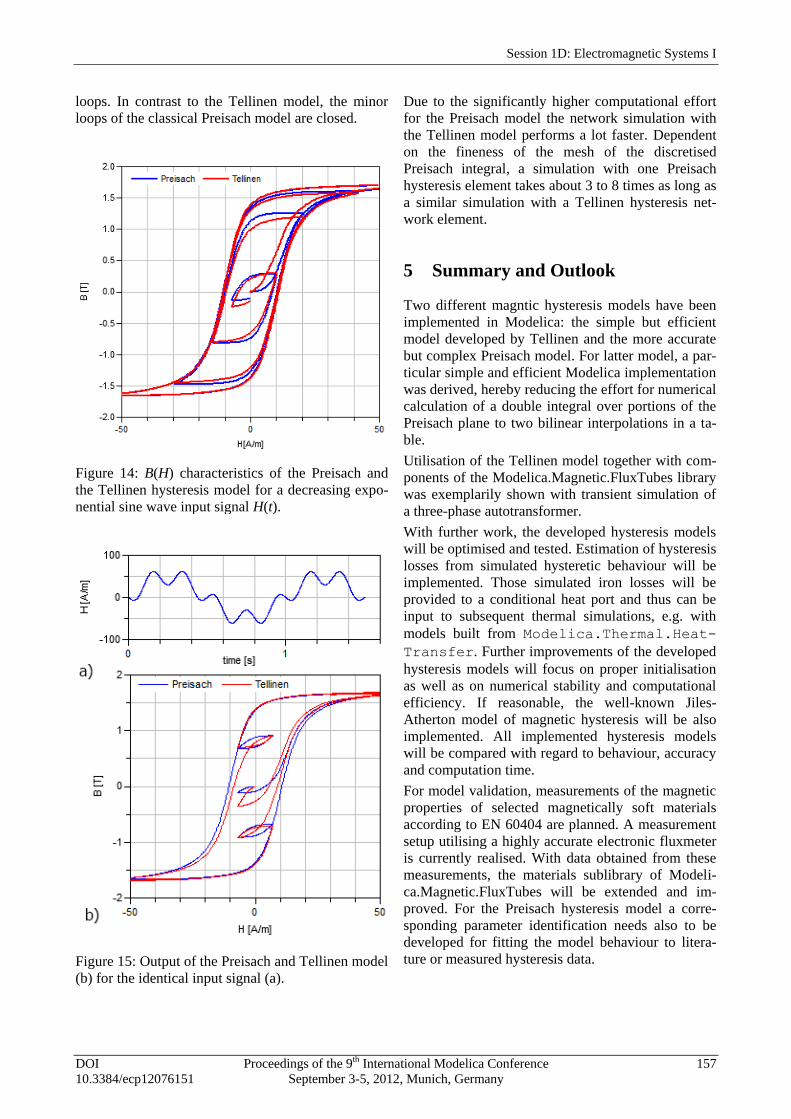
loops. In contrast to the Tellinen model, the minor
loops of the classical Preisach model are closed.
Figure 14: B(H) characteristics of the Preisach and
the Tellinen hysteresis model for a decreasing expo-
nential sine wave input signal H(t).
Figure 15: Output of the Preisach and Tellinen model
(b) for the identical input signal (a).
Due to the significantly higher computational effort
for the Preisach model the network simulation with
the Tellinen model performs a lot faster. Dependent
on the fineness of the mesh of the discretised
Preisach integral, a simulation with one Preisach
hysteresis element takes about 3 to 8 times as long as
a similar simulation with a Tellinen hysteresis net-
work element.
5 Summary and Outlook
Two different magntic hysteresis models have been
implemented in Modelica: the simple but efficient
model developed by Tellinen and the more accurate
but complex Preisach model. For latter model, a par-
ticular simple and efficient Modelica implementation
was derived, hereby reducing the effort for numerical
calculation of a double integral over portions of the
Preisach plane to two bilinear interpolations in a ta-
ble.
Utilisation of the Tellinen model together with com-
ponents of the Modelica.Magnetic.FluxTubes library
was exemplarily shown with transient simulation of
a three-phase autotransformer.
With further work, the developed hysteresis models
will be optimised and tested. Estimation of hysteresis
losses from simulated hysteretic behaviour will be
implemented. Those simulated iron losses will be
provided to a conditional heat port and thus can be
input to subsequent thermal simulations, e.g. with
models built from Modelica.Thermal.Heat-
Transfer. Further improvements of the developed
hysteresis models will focus on proper initialisation
as well as on numerical stability and computational
efficiency. If reasonable, the well-known Jiles-
Atherton model of magnetic hysteresis will be also
implemented. All implemented hysteresis models
will be compared with regard to behaviour, accuracy
and computation time.
For model validation, measurements of the magnetic
properties of selected magnetically soft materials
according to EN 60404 are planned. A measurement
setup utilising a highly accurate electronic fluxmeter
is currently realised. With data obtained from these
measurements, the materials sublibrary of Modeli-
ca.Magnetic.FluxTubes will be extended and im-
proved. For the Preisach hysteresis model a corre-
sponding parameter identification needs also to be
developed for fitting the model behaviour to litera-
ture or measured hysteresis data.
Session 1D: Electromagnetic Systems I
DOI Proceedings of the 9th International Modelica Conference 157 10.3384/ecp12076151 September 3-5, 2012, Munich, Germany
6 Acknowledgement
The authors would like to thank the Clean Sky Joint
Technology Initiative for funding of the presented
work within Project No. 296369 MoMoLib “Modeli-
ca Model Library Development for Media, Magnetic
Systems and Wavelets”.
References
[1] Modelica Association, Modelica Standard Li-
brary, https://www.modelica.org/libraries/-
Modelica (May 11, 2012).
[2] T. Bödrich and T. Roschke, A Magnetic Li-
brary for Modelica, in Proc. of the 4th Interna-
tional Modelica Conference, 2005, pp. 559–
565.
[3] T. Bödrich, Electromagnetic Actuator Model-
ling with the Extended Modelica Magnetic Li-
brary, Proc. of 6th Int. Modelica Conf., Biele-
feld, Germany, March 3-4, pp. 221–227, 2008.
[4] H. Roters, Electromagnetic Devices. New York:
John Wiley & Sons, 1941.
[5] C. Steinmetz, Hysteresis loss, Electrician 26, p.
261 ff., 1891.
[6] T. Roschke, Entwurf geregelter elektromagneti-
scher Antriebe für Luftschütze, ser. Fortschritt-
Berichte VDI. VDI Verl., 2000.
[7] D. Ribbenfjärd, Electromagnetic Modelling
Including the Electromagnetic Core, Ph.D. dis-
sertation, KTH Royal Institute of Technology,
Stockholm, 2010.
[8] F. Preisach, Über die magnetische Nachwir-
kung, Zeitschrift für Physik A Hadrons and Nu-
clei, vol. 94, pp. 277–302, 1935.
[9] D. Jiles and D. Atherton, Theory of Ferromag-
netic Hysteresis, Journal of Magnetism and
Magnetic Materials, vol. 61, no. 1–2, pp. 48 –
60, 1986.
[10] J. Tellinen, A Simple Scalar Model for Magnet-
ic Hysteresis, IEEE Transactions on Magnetics,
vol. 24, no. 4, pp. 2200 – 2206, July 1998.
[11] Soft Magnetic Cobalt-Iron-Alloys, Vacuum-
schmelze GmbH, 2001, http://www.vacuum-
schmelze.com/fileadmin/docroot/medialib/-
documents/broschue-ren/htbrosch/Pht-
004_e.pdf (05.21.2012).
[12] I. Mayergoyz, Mathematical Models of Hyste-
resis and their Application. Elsevier, 2003.
Magnetic Hysteresis Models for Modelica
158 Proceedings of the 9th International Modelica Conference DOI September 3-5, 2012, Munich Germany 10.3384/ecp12076151