
Magalie Delmas, Olivier Cerdan, Jean-Marie Mouchel ... · Sediment exports from French rivers...
30
Sediment exports from French rivers Magalie Delmas, Olivier Cerdan, Jean-Marie Mouchel*, Frédérique Eyrolles, Bruno Cheviron Université Pierre et Marie Curie, Paris BRGM, Orléans ISRN, Cadarache
-
Upload
phungthien -
Category
Documents
-
view
221 -
download
0
Transcript of Magalie Delmas, Olivier Cerdan, Jean-Marie Mouchel ... · Sediment exports from French rivers...

Sediment exports from French rivers
Magalie Delmas, Olivier Cerdan, Jean-Marie Mouchel*, Frédérique Eyrolles, Bruno Cheviron
Université Pierre et Marie Curie, ParisBRGM, Orléans
ISRN, Cadarache

Study framework● Asses Sediment Delivery Ratio for French basins at
various scales
● Map erosion sources that reach the catchment outlets.
● Tackle issues such as phosphorus inputs to rivers– Agricultural phosphorus is becoming the limiting factor for
algal growth
– Fallout derived contaminants such as PAH or metals
– Pesticide runoff potential, although mostly dissolved
● Sediment Delivery Ratio (SDR) based on– SSY : Specific Sediment Yield (tons/km2/y)
– ER : Erosion rates at field scale
Part of PhD work by Magalie Delmas, defended on May 18th

Data sources for sediment fluxes ?
● Most papers who need sediment flux estimates refer to few compilations (global scale)– Milliman et al. (1995), LOICZ-IGBP, Meybeck and Ragu
(1995), UNEP/GEMS/GLORI, FAO database
● A huge but non homogeneous work– Various data sources, estimation methods...
– Present versus past (before damming) fluxes
– Highly variables sampling periods and durations
● Sometimes local studies

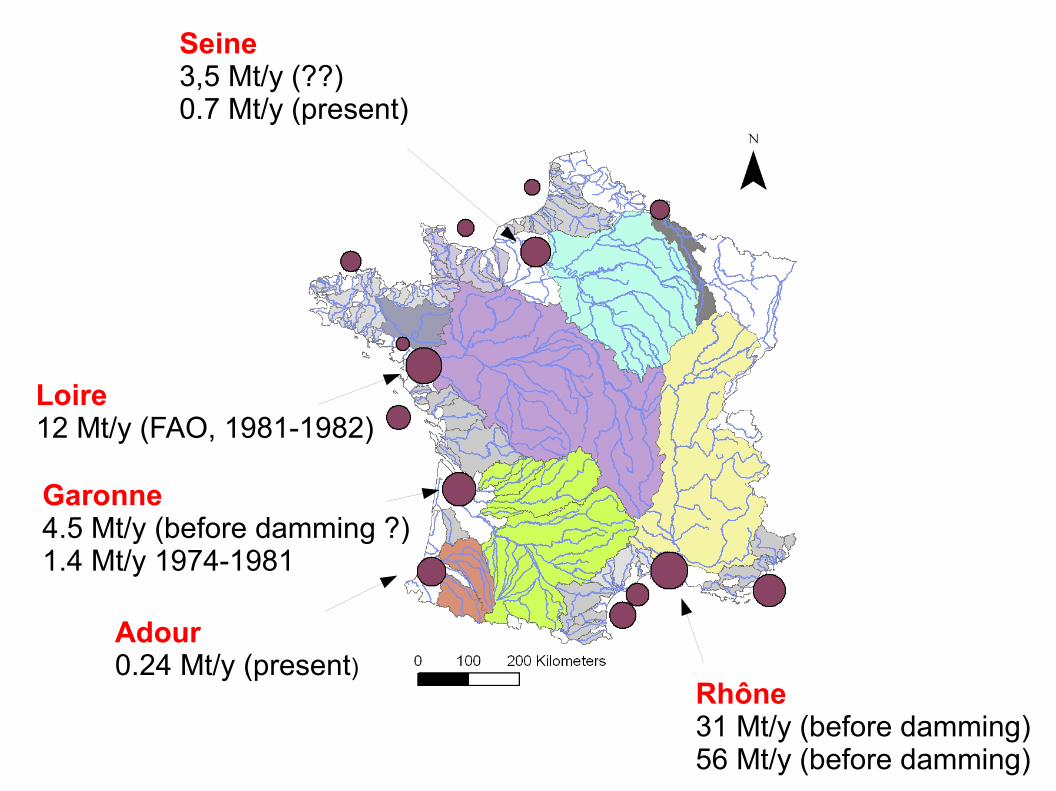
Examples (for France)Seine3,5 Mt/y (??)0.7 Mt/y (present)
Rhône31 Mt/y (before damming)56 Mt/y (before damming)
Loire12 Mt/y (FAO, 1981-1982)
Garonne4.5 Mt/y (before damming ?)1.4 Mt/y 1974-1981
Adour0.24 Mt/y (present)

Get our own sediment fluxes
● Mean fluxes for 10 year periods (or more)– Yearly fluctuations up to a factor of 10 for “gentle” river Seine
– Erosion rates also highly variable at the yearly scale
● Almost no high frequency monitoring data– Some monitoring at water intakes (legal)
– Recent programs for the main French rivers (Rhône, Garonne system, Loire, Seine on-going)
● Not yet available, except for Rhone● National water quality survey
– “once a month”

65579 stations with SS datalooks great !

73500 stations withdaily flow data

8
Accepted configuration
Non accepted configuration
SS dataRiver discharge data
260 stations finally accepted,with more than 10 years SS datawith well estimated catchments
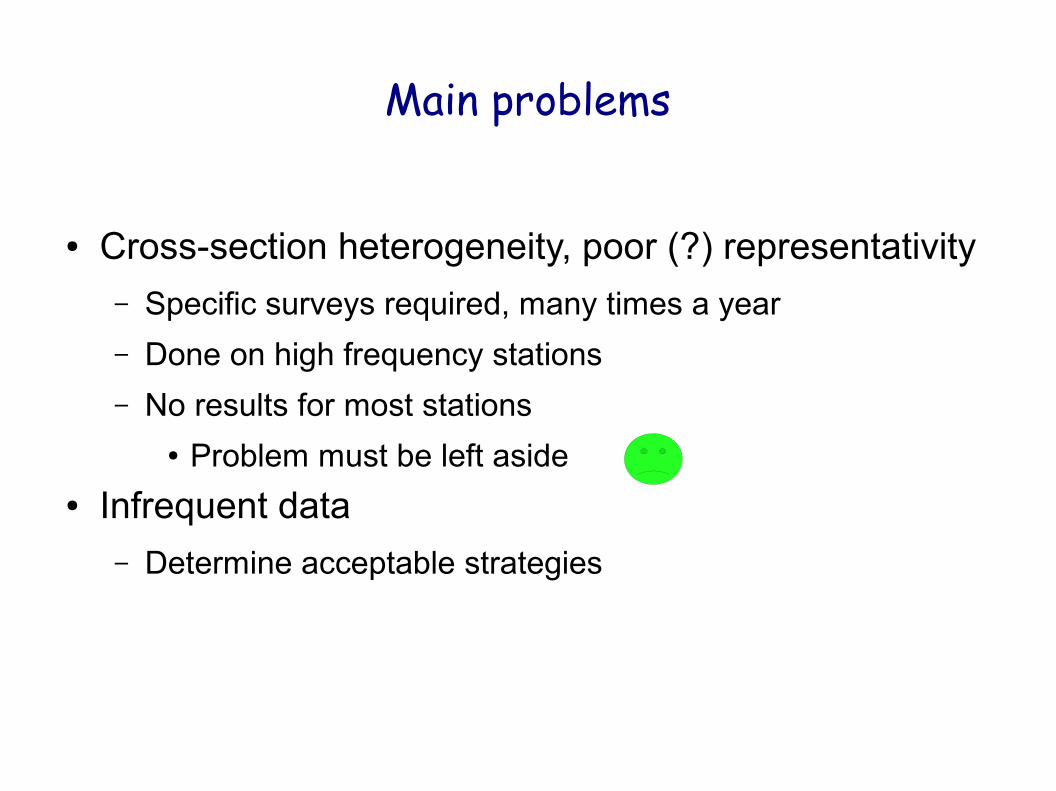
Main problems
● Cross-section heterogeneity, poor (?) representativity– Specific surveys required, many times a year
– Done on high frequency stations
– No results for most stations● Problem must be left aside
● Infrequent data– Determine acceptable strategies

Main methods to cope with missing data
● A risky one :– Use sediment fluxes when SS data, and average
● information on river flow is lost● A better one :
– Re- construct missing SS data and use all Q (river discharge) data
● “flow weighted average” SS● reconstruct from rating curve : SS = f(Q,...) +
● Evaluate methods by sub-sampling data sets– Using additional catchments (USGS !)

Several recent studies by French groups
● Coynel et al. 2004 (STOTEN)– Error on fluxes estimates, frequency, catchment size
● Moatar et al. 2006 (STOTEN)– Error on fluxes estimates, frequency, catchment size
● Sebastien Raymond PhD, 2011– Many methods tested on SS, major ions, nutrients. On-going
publication

Fraction of yearly sediment flux occurring during 2% of time (1 week)A
vera
ge
bia
is
Flow weighted average SS
Moatar et al., 2006

30 d
ays
15
da
ys
7 d
ays
4 d
ays
1 day
Ga
ron
ne :
53
000
km2
Niv
elle
: 1
65
km2
Coynel et al., 2004
Based on the « risky » method

“Improved” rating curve method (IRCA)● Usual rating curve SS = a.Qb + ● IRCA : SS = a.Qb + c.S +
– Average value for low flow
● S is a stock index– Should be high (~1) when much erodible sediment is
present
– Should be low (~0) when no erodible sediment is present
● S as a function of Q– Different for rising flow or declining flow
● Tested on USGS database– 5% decrease of RMSE

S(t) = exp(-Qf . F / Q
0)
Different for rising and decreasing flow

IRCA method on USGS dataset
Median value + 10% and 90% quantiles
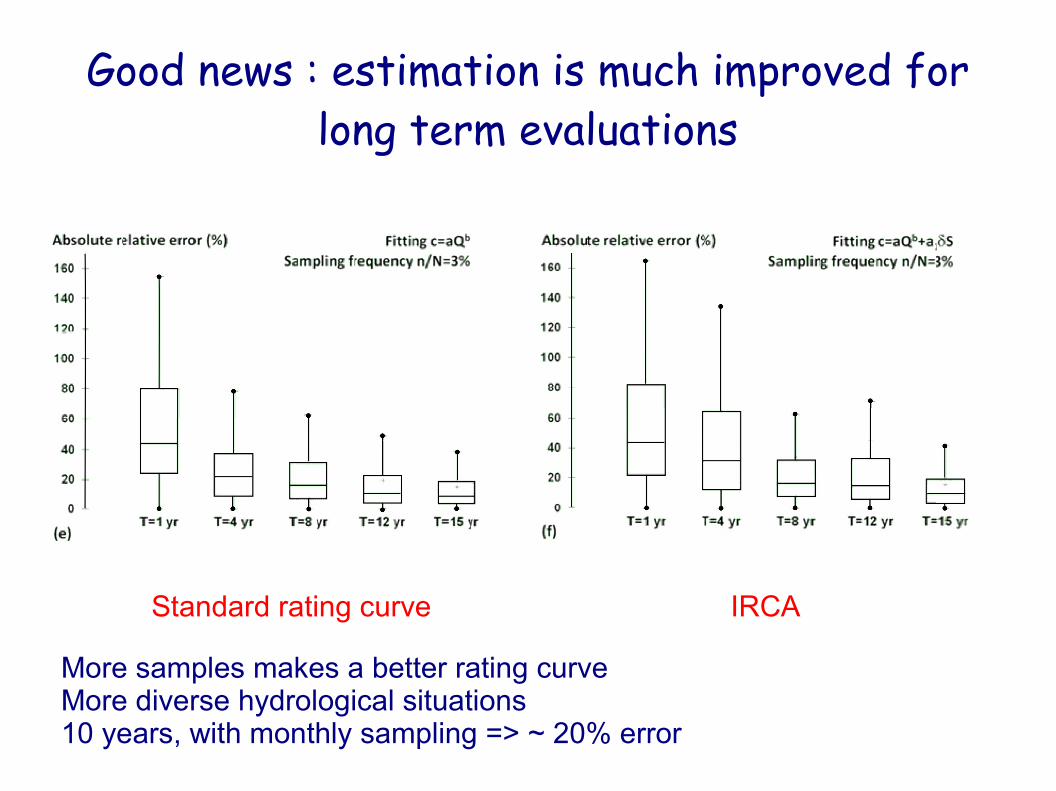
Good news : estimation is much improved for long term evaluations
Standard rating curve IRCA
More samples makes a better rating curveMore diverse hydrological situations10 years, with monthly sampling => ~ 20% error
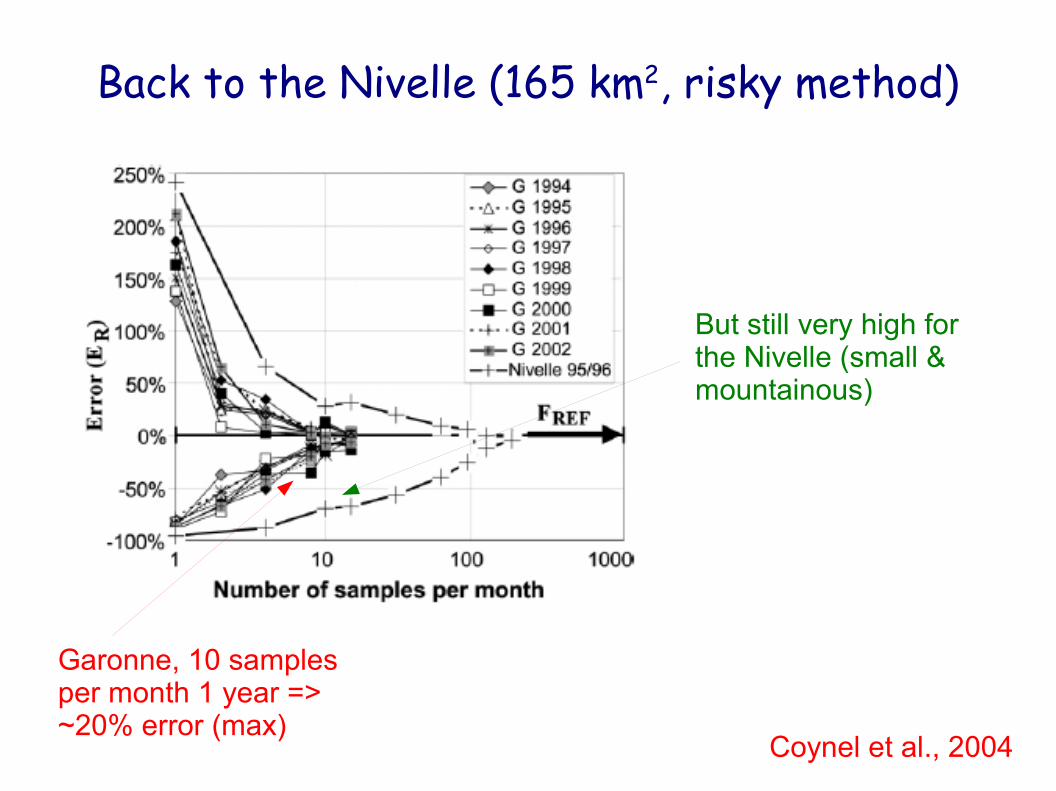
Back to the Nivelle (165 km2, risky method)
Garonne, 10 samples per month 1 year => ~20% error (max)
Coynel et al., 2004
But still very high for the Nivelle (small & mountainous)

Computation of sediment fluxes
● IRCA method for major rivers :– Seine, Vilaine, Loire, Garonne(+), Adour(+)
● 10 years of data for the Rhone river– Hopefully, highly problematic catchment
● Analogous catchments for small coastal streams– Brittany, Normandy, Northern region, Aquitaine, Cevennes,
Pyrenneans, South-East
– Same region, similar size
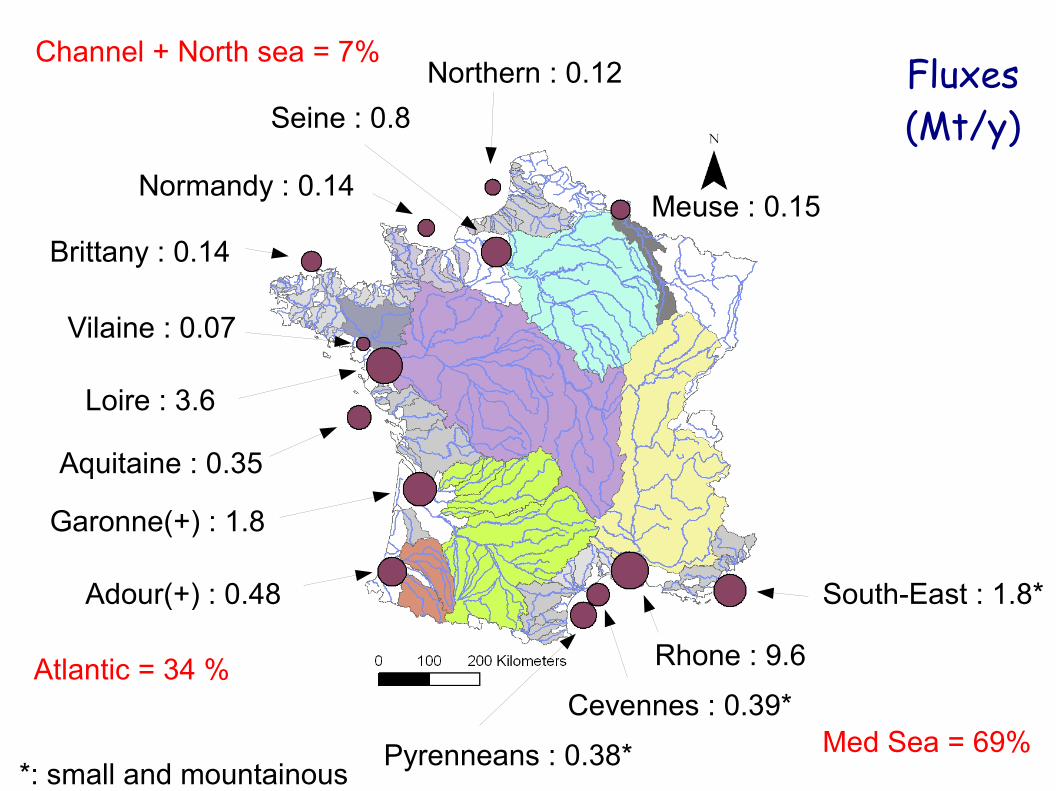
Seine : 0.8
Meuse : 0.15
Northern : 0.12
Normandy : 0.14
Brittany : 0.14
Vilaine : 0.07
Loire : 3.6
Aquitaine : 0.35
Garonne(+) : 1.8
Rhone : 9.6
Pyrenneans : 0.38*
Cevennes : 0.39*
South-East : 1.8*Adour(+) : 0.48
Med Sea = 69%
Atlantic = 34 %
Channel + North sea = 7% Fluxes(Mt/y)
*: small and mountainous
Examples (for France)Seine3,5 Mt/y (??)0.7 Mt/y (present)
Rhône31 Mt/y (before damming)56 Mt/y (before damming)
Loire12 Mt/y (FAO, 1981-1982)
Garonne4.5 Mt/y (before damming ?)1.4 Mt/y 1974-1981
Adour0.24 Mt/y (present)
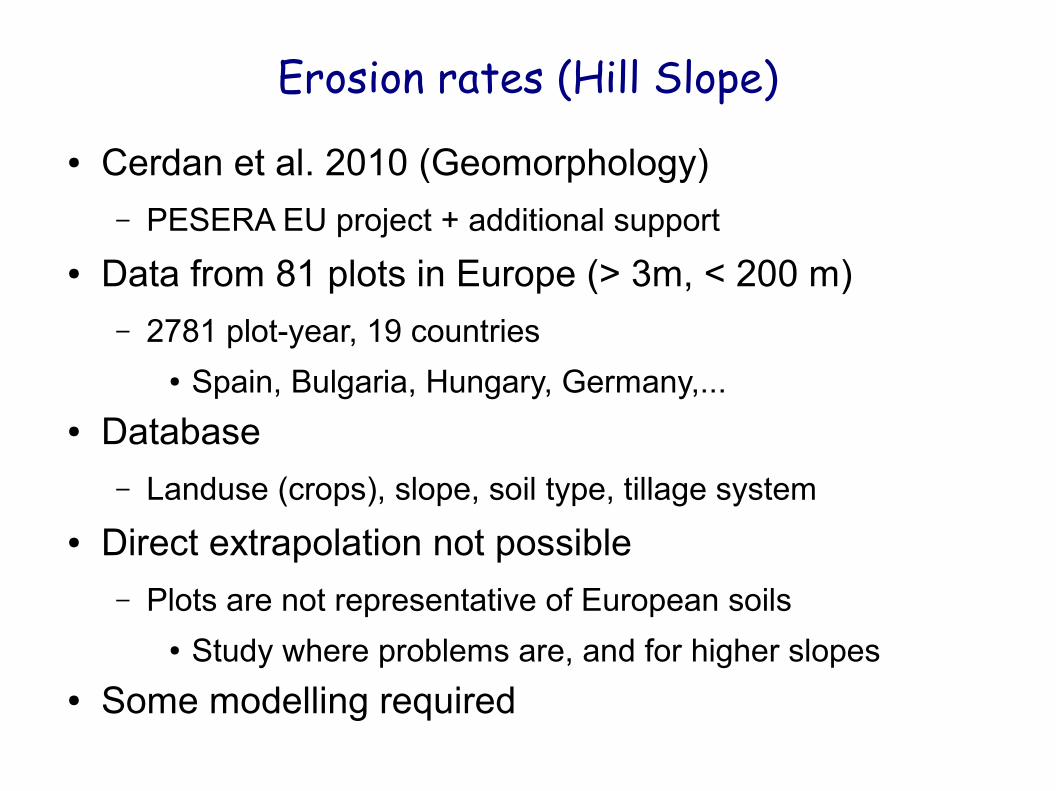
Erosion rates (Hill Slope)● Cerdan et al. 2010 (Geomorphology)
– PESERA EU project + additional support
● Data from 81 plots in Europe (> 3m, < 200 m)– 2781 plot-year, 19 countries
● Spain, Bulgaria, Hungary, Germany,...● Database
– Landuse (crops), slope, soil type, tillage system
● Direct extrapolation not possible– Plots are not representative of European soils
● Study where problems are, and for higher slopes● Some modelling required
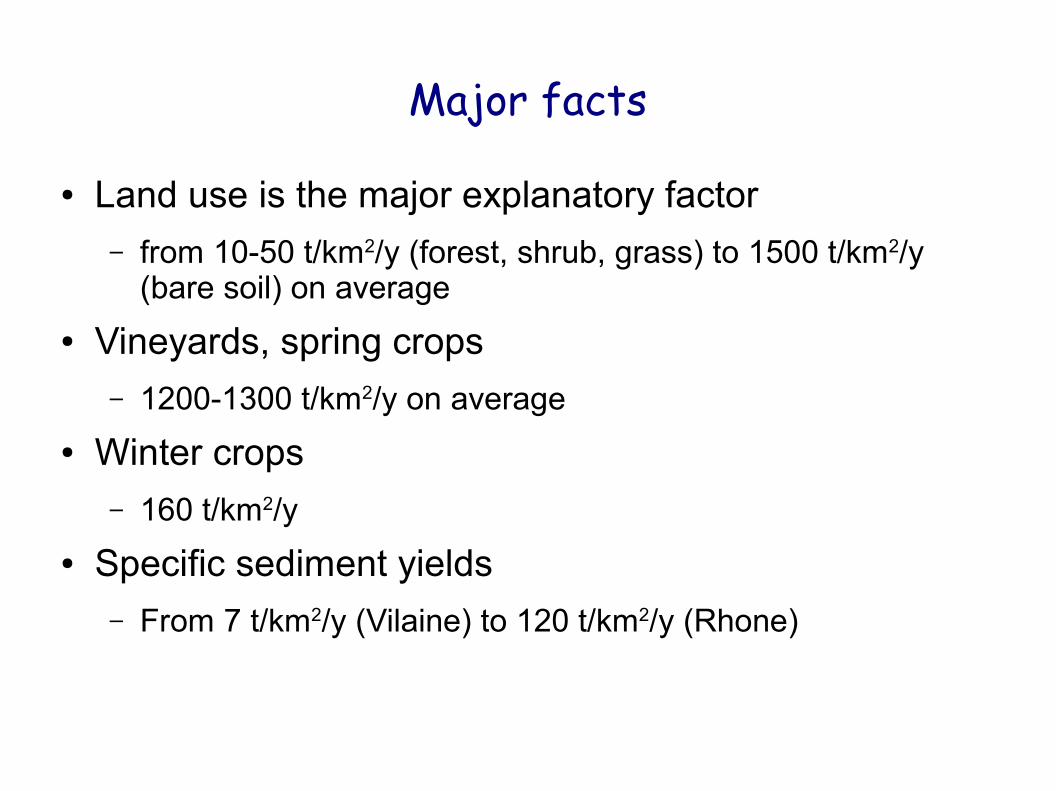
Major facts
● Land use is the major explanatory factor– from 10-50 t/km2/y (forest, shrub, grass) to 1500 t/km2/y
(bare soil) on average
● Vineyards, spring crops– 1200-1300 t/km2/y on average
● Winter crops– 160 t/km2/y
● Specific sediment yields– From 7 t/km2/y (Vilaine) to 120 t/km2/y (Rhone)

Additional factors
● Erodibility and crusting– From soil geographical database in Europe
– Estimated correction factors (Le Bissonnais et al., 2005)● 0.1 – 5 range (mainly 0.3 - 2)
● Topography correction– Slope factor (Nearing, 1997)
● 0.1 – 2 for 1% - 10% slope gradients– Brought to 100 m scale (0.5 power law)
● Correction for stony soils– -30% (e.g. Mediterranean areas)
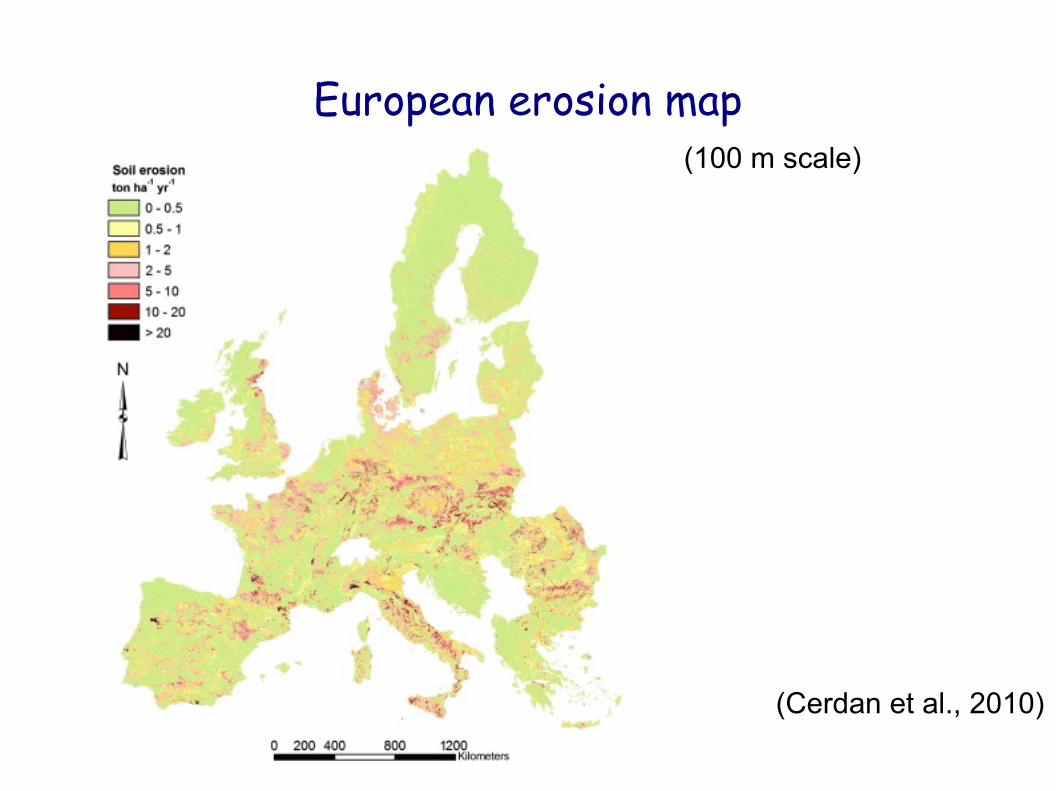
European erosion map
(Cerdan et al., 2010)
(100 m scale)

Seine : 12.3SDR : 0.07ER : 180
Meuse : 20.8SDR : 0.26ER : 80Vilaine : 7.3
SDR : 0.04ER : 177
Loire : 31SDR : 0.27ER : 116
Garonne(+) : 26.2SDR : 0.17ER : 154
Rhone : 115SDR : 1.01ER : 114
Adour(+) : 36.9SDR : 0.17ER : 212
SSY : t/km2/yER : t/km2/y

27
Mass movementHillslope erosion
Slope deposits
TransportDrainage density
Ignored processes
A set of indicatorsMM : percentage of basin area with potential mass movement
from slope and geologySD : percentage of basin area with slope < 2%DD : river length to river basin area
High DD means small distance from plot to river, low infiltration and potential bank erosionDams not included in the analysis
In-streamprocesses

28
Example at European scale
Ln(SSY) = 0.061 DD – 0.045 D + 0.034 HE + 0.047 MM – 0.8648
Everything important, but correlated (!)MM not important everywhere (!)

29
Further work● Construct a cell based model to derive cell contribution
to sediment fluxes– Stage 1 : model the ER fraction reaching the stream starting
from one cell.... on-going
– Stage 2 : model cell to cell transport
● ... where Mass Movement can be ignored (?)
● 260 catchments available for France– Could certainly be expanded across Europe
Additional questions
● Is the ~20% for gentle rivers acceptable ?– Error estimate on flux should be improved
● Add smaller scale catchments ?– Higher frequency needed there, data rarely shared
● How to work with basins with significant mass movement ?
● Dare work with in-stream processes ?
![baudrant magalie p04 2.ppt [Mode de compatibilité]](https://static.fdocuments.net/doc/165x107/6202ade13e4a5871f141dbe9/baudrant-magalie-p04-2ppt-mode-de-compatibilit.jpg)


