Made in America, Again Behind the American Export Surge · 2019-08-30 · Behind the American...
18
Behind the American Export Surge The U.S. as One of the Developed World’s Lowest-Cost Manufacturers Made in America, Again
Transcript of Made in America, Again Behind the American Export Surge · 2019-08-30 · Behind the American...

Behind the American Export SurgeThe U.S. as One of the Developed World’s Lowest-Cost Manufacturers
Made in America, Again

The Boston Consulting Group (BCG) is a global management consulting firm and the world’s leading advisor on business strategy. We partner with clients from the private, public, and not-for-profit sectors in all regions to identify their highest-value opportunities, address their most critical challenges, and transform their enterprises. Our customized approach combines deep in sight into the dynamics of companies and markets with close collaboration at all levels of the client organization. This ensures that our clients achieve sustainable compet itive advantage, build more capable organizations, and secure lasting results. Founded in 1963, BCG is a private company with 78 offices in 43 countries. For more information, please visit bcg.com.

Behind the American Export SurgeThe U.S. as One of the Developed World’s Lowest-Cost Manufacturers
Harold L. Sirkin, Michael Zinser, and Justin Rose
Made in America, Again
August 2013

Behind the American Export Surge2
The U.S. manufacturing sector could capture $70 billion to $115 billion in annual exports from other nations by the end of the decade as a result of significant cost advantages over Western Europe and Japan. Combined with production “reshored” from China, these higher exports could create up to 5 million new American jobs.
Consider Total CostsAmong the biggest drivers of the growing U.S. competitive advantage are labor and energy costs. Adjusted for productivity, U.S. labor costs are projected to be 15 to 35 percent lower than those of Western Europe and Japan by 2015 for many products. Prices for natural gas are projected to be 60 to 70 percent lower, and electricity is projected to be 40 to 70 percent cheaper in the U.S.
Rethink Your Global FootprintCompanies should maintain a diversified global manufacturing footprint to have the flexibility to respond to the needs of specific markets. But because of shifting cost structures, they should consider using the U.S. as a manufacturing base to supply not just the U.S. but also developed markets such as Europe and Japan.
AT A GLANCE

The Boston Consulting Group 3
Export manufacturing has recently become the unsung hero of the U.S. economy. Despite all the public focus on the U.S. trade deficit, little attention
has been paid to the fact that the country’s exports have been growing more than seven times faster than GDP since 2005. As a share of the U.S. economy, in fact, exports are at their highest point in 50 years.
But this is likely to be just the beginning. We project that the U.S., as a result of its increasing competitiveness in manufacturing, will capture $70 billion to $115 billion in annual exports from other nations by the end of the decade. About two-thirds of these export gains could come from production shifts to the U.S. from leading European nations and Japan. By 2020, higher U.S. exports, combined with produc-tion work that will likely be “reshored” from China, could create 2.5 million to 5 million American factory and service jobs associated with increased manufacturing.
Our perspective is based on shifts in cost structures that increasingly favor U.S. manufacturing. In the first two reports in our Made in America, Again series, we explained how China’s once overwhelming production-cost advantage over the U.S. is rapidly eroding because of higher wages and other factors—and how these trends are likely to boost U.S. manufacturing in specific industries.1 Below, we focus on America’s increasing cost-competitiveness in manufacturing compared with leading advanced economies that are major exporters.
Our analysis suggests that the U.S. is steadily becoming one of the lowest-cost countries for manufacturing in the developed world. We estimate that by 2015, average manufacturing costs in the five major advanced export economies that we studied—Germany, Japan, France, Italy, and the U.K.—will be 8 to 18 percent higher than in the U.S. Among the biggest drivers of this advantage will be the costs of labor (adjusted for productivity), natural gas, and electricity. As a result, we estimate that the U.S. could capture up to 5 percent of total exports from these developed countries by the end of the decade. The shift will be supported by a significant U.S. advantage in shipping costs in important trade routes compared with other major manufacturing economies.
These shifting cost dynamics are likely to have a significant impact on world trade. China and the major developed economies account for around 75 percent of global exports. And the U.S. export surge will be felt across a wide range of U.S. industries.
The most profound impact will likely be on industrial groups that account for the bulk of global trade, such as transportation equipment, chemicals, machinery, and
As a result of its increasing competi-tiveness in manufac-turing, the U.S. could capture $70 billion to $115 billion in annual exports from other nations by the end of the decade.
Behind the American Export Surge4
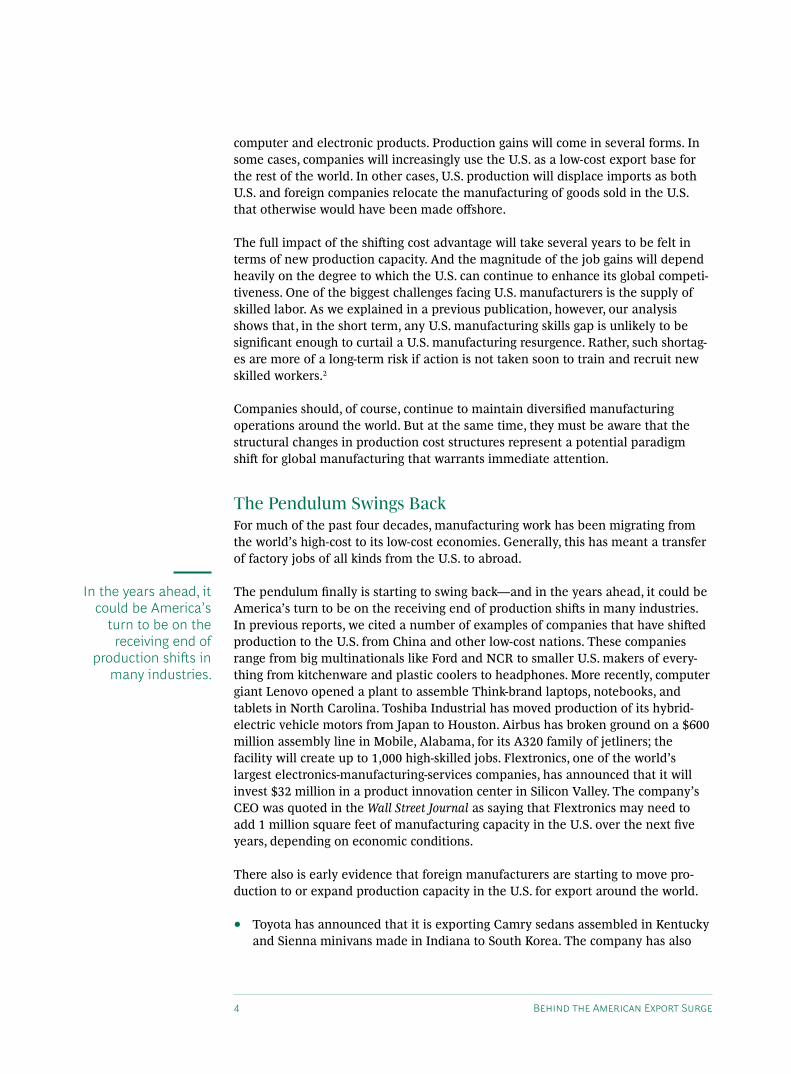
computer and electronic products. Production gains will come in several forms. In some cases, companies will increasingly use the U.S. as a low-cost export base for the rest of the world. In other cases, U.S. production will displace imports as both U.S. and foreign companies relocate the manufacturing of goods sold in the U.S. that otherwise would have been made offshore.
The full impact of the shifting cost advantage will take several years to be felt in terms of new production capacity. And the magnitude of the job gains will depend heavily on the degree to which the U.S. can continue to enhance its global competi-tiveness. One of the biggest challenges facing U.S. manufacturers is the supply of skilled labor. As we explained in a previous publication, however, our analysis shows that, in the short term, any U.S. manufacturing skills gap is unlikely to be significant enough to curtail a U.S. manufacturing resurgence. Rather, such shortag-es are more of a long-term risk if action is not taken soon to train and recruit new skilled workers.2
Companies should, of course, continue to maintain diversified manufacturing operations around the world. But at the same time, they must be aware that the structural changes in production cost structures represent a potential paradigm shift for global manufacturing that warrants immediate attention.
The Pendulum Swings BackFor much of the past four decades, manufacturing work has been migrating from the world’s high-cost to its low-cost economies. Generally, this has meant a transfer of factory jobs of all kinds from the U.S. to abroad.
The pendulum finally is starting to swing back—and in the years ahead, it could be America’s turn to be on the receiving end of production shifts in many industries. In previous reports, we cited a number of examples of companies that have shifted production to the U.S. from China and other low-cost nations. These companies range from big multinationals like Ford and NCR to smaller U.S. makers of every-thing from kitchenware and plastic coolers to headphones. More recently, computer giant Lenovo opened a plant to assemble Think-brand laptops, notebooks, and tablets in North Carolina. Toshiba Industrial has moved production of its hybrid-electric vehicle motors from Japan to Houston. Airbus has broken ground on a $600 million assembly line in Mobile, Alabama, for its A320 family of jetliners; the facility will create up to 1,000 high-skilled jobs. Flextronics, one of the world’s largest electronics-manufacturing-services companies, has announced that it will invest $32 million in a product innovation center in Silicon Valley. The company’s CEO was quoted in the Wall Street Journal as saying that Flextronics may need to add 1 million square feet of manufacturing capacity in the U.S. over the next five years, depending on economic conditions.
There also is early evidence that foreign manufacturers are starting to move pro-duction to or expand production capacity in the U.S. for export around the world.
Toyota has announced that it is exporting Camry sedans assembled in Kentucky •and Sienna minivans made in Indiana to South Korea. The company has also
In the years ahead, it could be America’s
turn to be on the receiving end of
production shifts in many industries.

The Boston Consulting Group 5
suggested that it may ship U.S.-made cars to China and Russia. In press reports, the president of Toyota Motor North America was quoted as saying, “This is just the beginning of a new era of North America being a source of supply to many other parts of the world.”
Honda is adding shifts at its plants in Indiana and Ohio to increase exports. The •company has said it expects to double its exports of U.S.-made vehicles in the next few years.
Siemens announced it will build gas turbines in North Carolina that will be used •to construct a large power plant in Saudi Arabia.
Yamaha has transferred production of all-terrain vehicles from overseas facilities •to Newman, Georgia, where it directly employs 1,250 factory workers. Yamaha has also opened a second assembly plant in Newman to produce future Side-by-Side products, including a three-person vehicle called the Viking, for worldwide distribution. Yamaha says it could add another 300 jobs in Georgia over the next three to five years.
In 2011, Rolls-Royce began making engine discs for aircraft at Crosspointe, a •world-class manufacturing facility in Prince George County, Virginia. The company said that some parts made in Virginia would be shipped to Europe and Asia to be assembled in jet engine factories. In coming years, Rolls-Royce plans to invest over $500 million in Crosspointe, generating more than 600 jobs, to serve the global economy.
Michelin of France announced that it will invest $750 million to build a new •factory and expand another one in South Carolina to make large tires for earth movers used in the mining and construction industries. The Financial Times reported that at least 80 percent of the additional output will be exported.
While the impact of this trend on U.S. jobs is currently modest, we expect a signifi-cant increase in such announcements starting around 2015, as the economic case for reshoring to the U.S. grows stronger—and as companies adjust their global manufacturing footprints accordingly.
The U.S. as a Low-Cost CountryThe U.S. now has a distinct production-cost advantage compared with other developed economies that are leading manufacturers. We estimate that due to three factors alone—labor, natural gas, and electricity—average manufacturing costs in the U.K. will be 8 percent higher than in the U.S. by 2015. Costs will be 10 percent higher in Japan, 16 percent higher in Germany and in France, and 18 percent higher in Italy. (See Exhibit 1.) There are three key drivers of this cost advantage.
Labor. The U.S. labor market is currently more attractive than that of all other major manufacturers among the developed economies. This is especially true when
By 2015, average manufacturing costs will be 8 percent higher in the U.K., 10 percent higher in Japan, and 18 percent higher in Italy than in the U.S.

Behind the American Export Surge6
factory wages are adjusted for output per worker, which is considerably higher in the U.S. than in Europe and Japan. Only a decade ago, average productivity-adjust-ed factory labor costs were around 17 percent lower in the U.S. than in Europe, and only 3 percent lower in the U.S. than in Japan. The productivity gap between these nations and the U.S. has widened considerably over the past ten years. We project that by 2015, average labor costs will be around 16 percent lower in the U.S. than in the U.K., 18 percent lower than in Japan, 34 percent lower than in Germany, and 35 percent lower than in France and Italy. (See Exhibit 2.)
An added advantage of the U.S. labor market is its relative flexibility. The Fraser Institute ranks the U.S. as the world’s third-most-favorable economy in terms of labor market regulation. In contrast, Japan and the U.K. rank 14 and 15, Italy ranks 72, France ranks 94, and Germany ranks 112.
A major reason for this high ranking is that it is far easier and less costly in the U.S. than in most other advanced economies to adjust the size of the workforce in response to business conditions. In Germany, for example, we estimate government-mandated costs of approximately $8 million to shutter an average, 200-worker plant and more than $40 million to close a 1,000-worker plant. These costs are associated
Average projected manufacturing cost structures of the majorexporting nations relative to the U.S., 2015
7 85
66
18
29 27 3019 25
15
4
5
120
80
140
100
0
U.S. = 100
Manufacturing cost index (U.S. = 100)
China2
95
74
2
Japan
110
77
3
U.K.
108
81
2
Italy
118
78
France
116
79
2
Germany
116
78
2
U.S.1
100
79
2
OtherNatural gasElectricityLabor (productivity adjusted)
1
Sources: U.S. Economic Census; U.S. Bureau of Labor Statistics; U.S. Bureau of Economic Analysis; International Labour Organization.Note: Cost structures were calculated as a weighted average across all industries. No difference was assumed in “other” costs (e.g., raw materials inputs and machine and tool depreciation). Differences in values are a function of the industry mix of each exporting country.1U.S. figures represent costs in a set of select lower-cost states specified in previous publications.2Chinese figures represent the Yangtze River Delta region.
Exhibit 1 | Labor and Energy Cost Advantages Will Make the U.S. One of the Developed World’s Lowest-Cost Countries

The Boston Consulting Group 7
with the need to comply with rules governing severance pay and the advance notice that must be given to long-term employees. However, the actual cost of shutting a German factory can be significantly higher. German law mandates that workers may remain on the job, at full pay, for anywhere from a few months to more than a year, depending on how long they have been employed by the company, while layoff terms are being negotiated and after notification of a layoff has been re-ceived. Specific union contracts, asset write-downs, requirements to retrain workers, and other factors can also add to exit costs. These are major considerations when European companies decide where to make new long-term investments in manu-facturing capacity.
Energy. Rapid technological progress in hydraulic fracturing is making it more economically feasible to unlock vast U.S. natural gas and oil deposits from shale. Since 2003, U.S. production of shale gas increased more than tenfold. This has helped push down the U.S. wholesale price of natural gas by 51 percent since 2005. By 2020, recovery costs from shale are expected to be half what they were in 2005—giving the U.S. a much larger supply of inexpensive natural gas. By 2035, U.S. shale-gas production is projected to double again, to 12 trillion cubic feet.
152 155 154
119 122
0
50
100
150
200
2015 productivity-adjusted wages (indexed, U.S. = 100)1
U.S. = 100
JapanU.K.ItalyFranceGermany
Labor costs in other major manufacturingeconomies are 1.2 to 1.6 times higher....
...and the U.S. benefits from a comparativelyflexible labor market
8.38.2
6.5
5.85.4
0
2
4
6
8
10
Germany
Overall labor-market-regulation rating (max = 10)
U.S. = 9.1 (ranked 3)
JapanU.K.ItalyFranceWorld
ranking 157294112 14
Sources: International Labour Organization; Economist Intelligence Unit; Fraser Institute economic freedom ratings, 2012; BCG analysis.Note: Fully loaded wages from the Economist Intelligence Unit. U.S. wages are the average for lower-cost states.1Projections for 2013 to 2015.
Exhibit 2 | The U.S. Labor Market Is the Most Attractive of All Major Developed-World Manufacturers

Behind the American Export Surge8
Most public attention to this development has focused on the implications for U.S. energy security. Less appreciated is the fact that cheap domestic sources of natural gas translate into a significant competitive advantage for a number of U.S.-based industries. Natural gas costs anywhere from 2.6 to 3.8 times higher in Europe and Japan than in the U.S. (See Exhibit 3.) The American advantage will likely grow further in the future: the most recent estimates suggest that the U.S. has more than 350 trillion cubic feet of proven shale-gas reserves, plus another 1,600 trillion cubic feet of potential shale-gas resources. That is more than four times the reserves of Western Europe. Japan’s reserves of both shale and conven-tional gas are negligible.
There are two important implications for industry. First, natural gas is a key feed-stock for chemicals and plastics and is a significant cost in the manufacture of primary metals, paper, synthetic textiles, and nonmetallic mineral products. Second, gas-fired power plants are an important source of electricity in the U.S. So cheap natural gas will contribute to keeping power costs lower for U.S.-based industry. Industrial electricity prices are currently 61 percent higher in France, 92 percent higher in the U.K., 107 percent higher in Germany, 135 percent higher in Japan, and 287 percent higher in Italy. Lower electricity rates add a further cost advantage of several percentage points to energy-intensive U.S.-based industries such as metals and paper.
Shipping Rates. Our calculations of manufacturing costs in the U.S. and other developed economies did not factor in a projection for shipping expenses. On
375
263
299
350358
0
100
200
300
400
Natural gas prices (indexed, U.S. = 100)
U.S. = 100
JapanU.K.ItalyFranceGermany
Natural gas prices in other major manufacturing economiesare around 2.6 to 3.8 times higher than in the U.S....
...and industrial electricity prices are around 1.6 to 3.9 times higher
235
192
387
161
207
0
100
200
300
400
Industrial electricity prices, 2012 (indexed, U.S. = 100)
U.S. = 100
JapanU.K.ItalyFranceGermany
Sources: International Energy Agency quarterly energy price and tax statistics; BCG analysis.Note: Energy prices based on 2012 averages.
Exhibit 3 | Abundant Natural Gas Has Led to a Large Energy-Cost Advantage for Domestic Manufacturers in the U.S.

The Boston Consulting Group 9
several important international trade routes, however, transportation costs give U.S.-based manufacturers another significant advantage. The large trade deficits that the U.S. has run up in the past decade have had a perverse impact on the shipping industry. Containers have been arriving in U.S. ports filled with imported products—and sometimes departing empty. The ports of Los Angeles, Long Beach, New York, Seattle, and Tacoma all process more than twice as many U.S. imports as exports. Meanwhile, capacity at U.S. ports nearly doubled between 2000 and 2008. As a result, the capacity utilization rate at U.S. ports was only around 54 percent as of 2010—one of the lowest rates in the world. In Europe, ports in 2010 were operat-ing at 59 percent of capacity. Utilization rates were at 69 percent in Northeast Asia and 76 percent in Southeast Asia.
The imbalanced trade flow has translated into low outbound-freight costs on a number of important trade routes. In late 2011 and early 2012, it cost an average of $3,900 per 40-foot equivalent unit (FEU), or around 72 cubic meters of container space, to ship goods from Yokohama to Rotterdam. The comparable shipping rate from New York City was $1,400. Although freight costs from the west coast of the U.S. to Japan are only slightly lower than those from Europe to Japan, U.S. exporters have an advantage because the shipping distance is shorter, meaning they can more quickly get their goods to Japanese buyers. Because so many shipping containers from the U.S. to China are returning empty, freight costs from the U.S. to China are particularly cheap—just $850 per FEU. That compares with $700 per FEU from neighboring Japan. As a result, Japan’s proximity to China will not necessarily be enough to offset the U.S. advantage in lower overall production costs for many products that are not time sensitive.
One event that could significantly change the cost balance, of course, is a sharp depreciation of the euro against the U.S. dollar. The dollar did indeed increase in value from around $1.60 per euro in early 2008 to around $1.20 per euro in mid-2012 as a result of the global financial crisis. But the dollar would have to appreci-ate even more dramatically—to below $1 per euro—for Germany, France, and Italy to approach cost parity with the U.S. by 2015. We will continue to monitor this and other cost factors as we continue our research on the competitiveness of the major manufacturing economies.
Many may assume that most of the production displaced from these developed economies will shift to China rather than to the U.S. But for reasons we explained in an earlier report in this series (Made in America, Again: Why Manufacturing Will Return to the U.S., BCG Focus, August 2011), wages have been rising so rapidly in China that its cost advantage over the U.S. by 2015 is projected to be only around 5 percent for many goods exported to North America. When logistics, shipping costs, and the many risks of operating extended global supply chains are factored in, it will be more economical to make many goods now imported from China in the U.S. if they are consumed in the U.S.
The Impact on U.S. ExportsThe U.S. export sector is already a little-noticed bright spot in the U.S. economy. Since 2005, export growth has averaged nearly 8 percent per year—despite the
Wages have been rising so rapidly in China that its cost advantage over the U.S. by 2015 is projected to be only around 5 percent for many goods exported to North America.

Behind the American Export Surge10
global recession of 2008 to 2009. Exports of U.S. goods, excluding food and beverag-es, now account for around 10 percent of U.S. GDP, the largest share in five decades. In the 1960s, when the U.S. was the world’s dominant manufacturer, exports accounted for only around 4 percent of GDP. What’s more, while the share of global exports by Western Europe and Japan declined between 2005 and 2010, U.S. exports have held steady at around 11 percent.
This momentum is likely to accelerate. Because of lower costs, we project that by the end of the decade, the U.S. could capture $20 billion to $55 billion in annual exports from the four Western European nations we studied, which would repre-sent 2 to 5 percent of those nations’ total exports. In addition, we estimate that the U.S. could capture $5 billion to $12 billion in Japanese exports by that time, or 1 to 2 percent of Japan’s total current exports.
The Impact on U.S. JobsWe estimate that the increase in U.S. exports and in the domestic production of goods that otherwise would have been imported will create between 600,000 and 1.2 million direct factory jobs. Another 1.9 million to 3.5 million jobs could be created indirectly in related services such as retail, transportation, and logistics. (See Exhibit 4.) We base these estimates on average output per worker and the multiplier effect in each industry category. In the transportation equipment sector, for example, every $140,000 in additional output on average creates one new job. A boost in U.S. production of $3 billion to $9 billion, therefore, would create 20,000 to 65,000 factory jobs. Each transportation-equipment production job, in turn, creates 3.6 jobs indirectly in other areas of the economy. That translates into an overall job
Millions of jobs
Total
2.6 to 4.7
Indirect
1.9 to 3.5
Direct
0.6 to 1.2
Theunemploymentrate could fallby two to three
percentagepoints by the end
of the decade
Projection revised upward from our earlier estimate of2 to 3 million jobs from both reshoring and exports
Sources: U.S. Bureau of Labor Statistics; U.S. Bureau of Economic Analysis; U.S. Central Intelligence Agency, The World Factbook, 2013; BCG analysis.
Exhibit 4 | The U.S. Export Surge Could Create 2.5 Million to 5 Million New Jobs
The Boston Consulting Group 11
increase of 110,000 to 290,000 in the U.S. transportation-equipment industry as a result of increased exports and reshored production.
If our projection of 2.5 to 5 million new U.S. jobs is accurate, the U.S. unemploy-ment rate could drop by 2 to 3 percentage points. That would push the U.S. rate toward the “frictional” level, meaning the unemployment that normally occurs in an economy as workers change jobs.
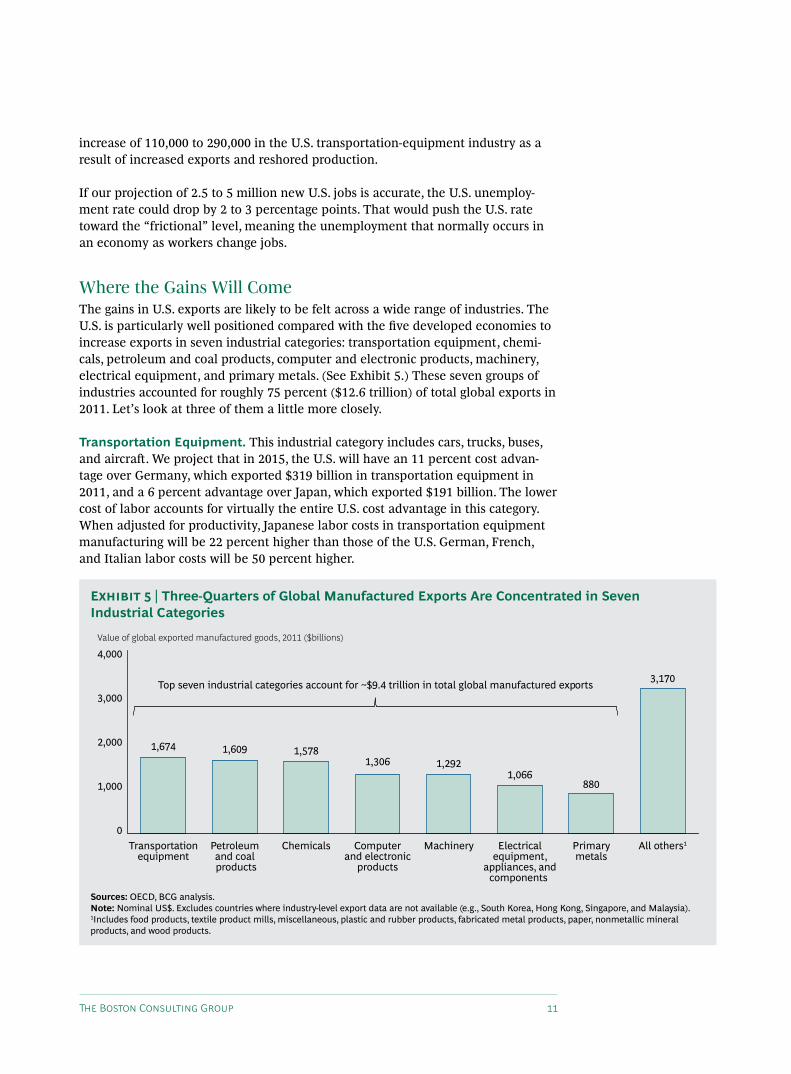
Where the Gains Will ComeThe gains in U.S. exports are likely to be felt across a wide range of industries. The U.S. is particularly well positioned compared with the five developed economies to increase exports in seven industrial categories: transportation equipment, chemi-cals, petroleum and coal products, computer and electronic products, machinery, electrical equipment, and primary metals. (See Exhibit 5.) These seven groups of industries accounted for roughly 75 percent ($12.6 trillion) of total global exports in 2011. Let’s look at three of them a little more closely.
Transportation Equipment. This industrial category includes cars, trucks, buses, and aircraft. We project that in 2015, the U.S. will have an 11 percent cost advan-tage over Germany, which exported $319 billion in transportation equipment in 2011, and a 6 percent advantage over Japan, which exported $191 billion. The lower cost of labor accounts for virtually the entire U.S. cost advantage in this category. When adjusted for productivity, Japanese labor costs in transportation equipment manufacturing will be 22 percent higher than those of the U.S. German, French, and Italian labor costs will be 50 percent higher.
Value of global exported manufactured goods, 2011 ($billions)
3,170
2,000
1,000
0All others1Primary
metals
880
Electricalequipment,
appliances, andcomponents
1,066
Machinery
1,292
Computerand electronic
products
1,306
Chemicals
1,578
Petroleumand coal products
1,609
Transportationequipment
1,674
3,000
4,000
Top seven industrial categories account for ~$9.4 trillion in total global manufactured exports
Sources: OECD, BCG analysis.Note: Nominal US$. Excludes countries where industry-level export data are not available (e.g., South Korea, Hong Kong, Singapore, and Malaysia).1Includes food products, textile product mills, miscellaneous, plastic and rubber products, fabricated metal products, paper, nonmetallic mineral products, and wood products.
Exhibit 5 | Three-Quarters of Global Manufactured Exports Are Concentrated in Seven Industrial Categories

Behind the American Export Surge12
China will still have an average production-cost advantage of around 6 percent in 2015 for transportation equipment. When shipping and other costs are accounted for, however, it will make more economic sense for such products to be made in the U.S. if they are consumed in the U.S.
We project that by 2015, the U.S. will gain $3 billion to $9 billion in exports of transportation equipment from Western Europe and Japan.
Chemicals. The low cost of natural gas in the U.S. will become a particularly significant factor in the production of chemicals, where natural gas is often an important feedstock. Production costs in Germany, a leading chemical exporter, are projected to be 29 percent higher than in the U.S. in 2015. Chemical production costs are projected to be 17 percent higher in the U.K., 27 percent higher in Italy and Japan, and 28 percent higher in France.
A breakdown of the cost structures in each country shows why. Although the cost of German labor will be more than 50 percent higher, for example, the biggest impact will be from differences in natural gas prices, which will be more than three and a half times higher in Germany than in the U.S. Put another way, while natural gas will account for 8 percent of the total production cost of U.S.-made chemicals, it will account for 29 percent of costs in Germany. In the case of Japan, natural gas costs in chemical manufacturing will be nearly four times higher than in the U.S. in 2015. A further consideration is electricity rates, since chemical production is power inten-sive. We estimate that lower electricity rates will give the U.S. an additional cost advantage, ranging from 1 percentage point over the U.K., France, and Germany to 4 percentage points over Italy.
The U.S. will have a significant cost advantage over China in chemical production in 2015 as well. We project that costs in China’s Yangtze River Delta region will be 16 percent higher, with natural gas prices more than offsetting any advantage that China will have in labor costs.
We project that by 2015, the U.S. will gain $7 billion to $12 billion in chemical exports from Western Europe and Japan.
Machinery. This broad category includes everything from construction and indus-trial machinery to engines and air conditioners. The U.S. will have a manufacturing cost advantage in machinery of around 7 percent over Japan, where machinery is a $143 billion export industry. Machinery production costs will be around 14 percent higher in Germany, which exported $216 billion in machinery in 2011, 14 percent higher in France, and 15 percent higher in Italy. Labor, a major cost in machinery manufacturing, is the big differentiator.
Projected total costs for machinery production will be around 8 percent lower in China in 2015. But when other costs are considered, it will likely be more cost- effective to produce much of the machinery that is sold in the U.S. in the U.S.
We project that by 2015, the U.S. will gain $3 billion to $12 billion in machinery exports from Western Europe and Japan.
We project that by 2015, the U.S.
will gain $7 billion to $12 billion in
chemical exports and $3 billion to
$12 billion in machinery exports
from Western Europe and Japan.

The Boston Consulting Group 13
The Key Messages for ManufacturersSuch core U.S. cost advantages as cheap energy and labor adjusted for productivity are likely to persist for at least the next five to ten years. As a result, the steady emergence of the U.S. as one of the lowest-cost countries of the developed world is a trend that is likely to have major implications for manufacturers around the world in a wide range of product categories across a wide range of industries. In the near term, the new math of manufacturing requires that many companies reassess their global production strategy.
We have long advised companies to maintain a diversified global manufacturing footprint in order to have the flexibility to respond to unanticipated changes and to expand or reduce production quickly in response to the competitive needs of specific markets. This advice continues to hold true. We also advise companies to carefully consider the total cost of ownership over the lifetime of the investment when deciding where to build new production capacity.
The shifting cost dynamics, however, suggest that more companies should consider the U.S. as a manufacturing option for global markets. A number of leading manu-facturers based in Europe and Asia have already begun to use the U.S. as a major export platform or have announced plans to do so. Others are relocating offshore production to the U.S. of goods to be consumed in North America. We believe that these companies are the early movers in what is likely to become a more wide-spread trend by 2020.
Companies that fail to take into account these cost shifts when making long-term investments could find themselves at a competitive disadvantage. Improving U.S. cost-competitiveness compared with developed economies, combined with rising costs in such offshore-manufacturing havens as China, represent what we believe is a paradigm shift that could usher in an American manufacturing renaissance.
Notes1. Made in America, Again: Why Manufacturing Will Return to the U.S., BCG Focus, August 2011, and U.S. Manufacturing Nears the Tipping Point: Which Industries, Why, and How Much? BCG Focus, March 2012.2. “Why a Skills Gap Is Unlikely to Constrain a U.S. Manufacturing Resurgence,” BCG article, November 2012.

Behind the American Export Surge14
About the AuthorsHarold L. Sirkin is a senior partner and managing director in the Chicago office of The Boston Consulting Group and the author of GLOBALITY: Competing with Everyone from Everywhere for Everything. You may contact him by e-mail at [email protected].
Michael Zinser is a partner and managing director in the firm’s Chicago office and the leader of BCG’s manufacturing practice in the Americas. You may contact him by e-mail at [email protected].
Justin Rose is a partner and managing director in the firm’s Chicago office. You may contact him at [email protected].
AcknowledgmentsThis report would not have been possible without the efforts of Justin Baier, Brianne Blakey, Collin Galster, Matt Gamber, Louis Hobson, Frank Roberts, Daniel Spindelndreier, and Steven Won of The Boston Consulting Group project team. The authors also would like to thank Alexandra Corriveau, Madeleine Desmond, David Fondiller, Beth Gillett, and Mike Petkewich for their guidance and interaction with the media, Pete Engardio for writing assistance, and Katherine Andrews, Angela DiBattista, Gina Goldstein, and Sara Strassenreiter for editing, design, and production.
For Further ContactIf you would like to discuss this report, please contact one of the authors. For a compilation of previous BCG research in the Made in America, Again series, see the e-book, The U.S. Manufacturing Renaissance: How Shifting Global Economics Are Creating an American Comeback, published by Knowledge@Wharton.

To find the latest BCG content and register to receive e-alerts on this topic or others, please visit bcgperspectives.com.
Follow bcg.perspectives on Facebook and Twitter.
© The Boston Consulting Group, Inc. 2013. All rights reserved.8/13

Abu DhabiAmsterdamAthensAtlantaAucklandBangkokBarcelonaBeijingBerlinBogotáBostonBrusselsBudapestBuenos AiresCanberraCasablanca
ChennaiChicagoCologneCopenhagenDallasDetroitDubaiDüsseldorfFrankfurtGenevaHamburgHelsinkiHong KongHoustonIstanbulJakarta
JohannesburgKievKuala LumpurLisbonLondonLos AngelesMadridMelbourneMexico CityMiamiMilanMinneapolisMonterreyMontréalMoscowMumbai
MunichNagoyaNew DelhiNew JerseyNew YorkOsloParisPerthPhiladelphiaPragueRio de JaneiroRomeSan FranciscoSantiagoSão PauloSeattle
SeoulShanghaiSingaporeStockholmStuttgartSydneyTaipeiTel AvivTokyoTorontoViennaWarsawWashingtonZurich
bcg.com