'Made available under NASA sponsorsiFp V7.3 1 … · "'Made available under NASA sponsorsiFp in the...
29
"'Made available under NASA sponsorsiFp in the interest of early and wide dis- semination of Earth Resou:ces Survey Program inform;nation and without liability for any use made thereof." V7.3 1 0.0. 5.5. C) 7-/3/C /3 33'S t, T, 5 f//C Ado S-0 THE USE OF ERTS IMAGERY IN RESERVOIR MANAGEMENT AND OPERATION Saul Cooper Department of the Army New England Division, Corps of Engineers 424 Trapelo Road Waltham, Massachusetts 02154 January 1973 Type II Interim Report for Period June - December 1972 E-73 :05U ) .. THE USE OF ERT:S IMI..AGERYIN iRESERVOIR MANAGEMENT AND OPERATION N73-162 jInte.rim Report, Jun. - Dec. 1972 (Corps of Engineers, Waltham, Mass.)., 29 p HC Unclas CSCL 08H G3/13 00055 Prepared for GODDARD SPACE FLIGHT CENTER Greenbelt, Maryland 20771 https://ntrs.nasa.gov/search.jsp?R=19730007590 2018-10-13T16:10:35+00:00Z
Transcript of 'Made available under NASA sponsorsiFp V7.3 1 … · "'Made available under NASA sponsorsiFp in the...
"'Made available under NASA sponsorsiFpin the interest of early and wide dis-semination of Earth Resou:ces SurveyProgram inform;nation and without liabilityfor any use made thereof."
V7.3 1 0.0. 5.5.
C) 7-/3/C /3 33'S
t, T, 5 f//C Ado S-0
THE USE OF ERTS IMAGERY IN RESERVOIR MANAGEMENT AND OPERATION
Saul CooperDepartment of the ArmyNew England Division, Corps of Engineers424 Trapelo RoadWaltham, Massachusetts 02154
January 1973Type II Interim Report for Period June - December 1972
E-73 :05U ) .. THE USE OF ERT:S IMI..AGERYINiRESERVOIR MANAGEMENT AND OPERATION N73-162jInte.rim Report, Jun. - Dec. 1972 (Corpsof Engineers, Waltham, Mass.)., 29 p HC Unclas
CSCL 08H G3/13 00055
Prepared forGODDARD SPACE FLIGHT CENTERGreenbelt, Maryland 20771
https://ntrs.nasa.gov/search.jsp?R=19730007590 2018-10-13T16:10:35+00:00Z
TECHNICAL iEFORT STANDARD TITLE PAGE
1. Report No. 2 . Governnent Accession No. 3. R.cipient's Cotclo; No.
4.i-Tec o-n- inI 'ktport Dote
The Use of ERTS Imagery in Reservoir Management January 1973and Operation P6-Pforming Organization Code
7. Author(s) 1.Performing Organization Report No.Saul Cooper
9. Performing Organization Nomne and Address 1o0. rk Unit No.Department of the Army 'New England Division, Corps of Engineers '. I.ntroct or Gront No.424 Trapelo Road S-70256-AGWaltham, Massachusetts 02154 11 Tpe of Report and Period Covered12. Sponsoring Agency Noae ond Address Type II Icterim ReportMr. E. Szajna June-December 1972ERTS Technical OfficerCode 430, GSFC . 14-.onsoring Agency CodeGr~ppnhplt, Maryland 2077115. Supplementary Notes
. v _ - A, , , , , _~~~~~~~C
16. Abstract Studies at NED, Corps of Engineers, are focused onevaluating the possible usefulness of ERTS DCS and imagery'to its watershed management functions. The first six months of ERTS-1 have beendevoted primarily to installing and debugging equipment and generalfamiliarization with ERTS data products, both DCS and imagery. To date17 of a planned 27 data collection platforms have been installed andare reporting to NED variops hydrometeorological parameters on a nearreal-time basis via a direct teletype link with GSFC. Only a very pre-liminary study of the data has been made so far. Statistical testswill be applied as soon as the data bank is of sufficient proportion.This should be within a few months as installation of the remainingDCP's is expected to be accomplished by early spring. Our imagerystudies are centering on both photo-interpretation and computer-orientecanalyses for depictions of useful' hydrologic features. Preliminarywork has suggested that configuration and areal coveragetof surfacewaters, as well as other hydrologically related terrain features, maybe obtained from ERTS imagery to an extent that would be useful to NED.Computer-oriented pattern recognition techniques are being developed tohelp automate the identification and analysis of hydrologic features inthe imagery. Emphasis is made upon the need for close man-machineinteraction while training the computer'for these tasks.
17. Key Wor', (' lected by Aurhor(s)) - 18. Distribution Stotatre -.
reservoir regulation, watershedmanagement, hydrometeorologi.caldata collection
19. Security Clcsif. (of this report) 0. Security Clossif. (of this poge) 21. . of Pages 22. Price-
-27 - S
precedn pae blanpvcfiPa-_ ii
I

PREFACE
The New England Division, Corps of Engineers, is participating inthe ERTS-1 experiment to assess the possible usefulness of satel-lites such as ERTS in the fulfillment of its watershed managementfunctions. We are studying both DCS and imagery in this regard.Our DCS studies encompass two separate goals: one -- to determinethe viability of satellites for the relay of real-time hydrometeor-ological data for watershed management purposes, and the other --to aid in the selection of the most economically feasible andtechnically useful layout of data collection points to provide allthe necessary information for the optimal regulation of a riverbasin. Our imagery studies are focused on the evaluation of theability of ERTS imagery to provide useful and timely supplementaryhydrologic information. Our work has been centered on both photo-interpretation and computer-oriented analyses of the imagery.
To date, only very preliminary analyses have been made of the ERTSdata-products, both DCS and imagery. During the first six months
_of_our participation in ERTS we have been mainly concerned withinstalling and debugging equipment and familiarizing ourselves withthe data-products.
D
As of 31 December, 17 of a planned 27 DCP's had been installed andwere reporting to NED various hydrometeorological parameters on anear real-time basis via a direct teletype link with Goddard SpaceFlight Center. Statistical tests will be applied as soon as thedata bank is of sufficient proportion. This should be within afew months as installation of remaining DCP's is expected to beaccomplished by early spring.
Preliminary analysis of ERTS imagery suggests that the configurationand areal coverage of surface waters, as well as other hydrologicallyrelated terrain features, may be obtained from ERTS imagery to anextent that would be useful to NED. Computer-oriented pattern rec-ognition techniques are being developed to help automate the iden-tification and analysis of hydrologic features. Considerable man-machine interaction is required while training the computer forthese tasks.
lll
TABLE OF CONTENTS
PagE
1.0 INTRODUCTION 1
2.0 DCS STUDIES 2
2.1 BACKGROUND 2
2.2 SUMMARY OF PROGRESS 2
2.2.1 Introduction 22.2.2 DCP Installation, Maintenance and
Performance 22.2.3 DCS Data Acquisition and Storage 42.2.4 DCS Studies, Program for Next Reporting
Interval and Conclusions 4
3.0 IMAGERY AND IMAGERY/DCS INTERACTION STUDIES 4
3.1 BACKGROUND 4
3.2 IMAGERY-PHOTO INTERPRETATION 6
3.2.1 Summary of Progress 63.2.1.1 ERTS Photo Products 63.2.1.2 Imagery Study 63.2.1.3 Equipment 83.2.1.4 Auxiliary Information Including DCS 83.2.2 Program for Next Reporting Interval 93.2.3 Conclusions 10
3.3 IMAGERY COMPUTER-ORIENTED ANALYSIS 10
3.3.1 Introduction 103.3.2 Summary of Progress 113.3.2.1 Initial Stages 113.3.2.2 Preliminary Analysis 113.3.2.3 Location of Image Features within
the Computer System 12
iv
TABLE OF CONTENTS (continued)
Page
3.3.3 Programs for the Next Reporting Inverval 123.3.3.1 Further Analysis 123.3.3.2 Long-Range Goals 123.3.4 Conclusions 13
4.0 CONTACTS WITH OTHER INVESTIGATORS, ORGANIZATIONSAND THE GENERAL PUBLIC 14
ERTS-1 DCP INFORMATION SHEET 15
APPENDIX A - UCONN ERTS PHOTO-LIBRARY
APPENDIX B - RBV PRINT PROGRAM
REFERENCES
V
1.0 INTRODUCTION
The purpose of this report is to summarize the first sixmonths of our participation in the ERTS-1 program and to report indetail the progress of our study since our last report, dated26 October 1972.
The imagery analysis and imagery/DCS interaction portions of our?investigation are subcontracted to the University of Connecticut(UCONN) at Storrs, under the direction of Dr. Paul Bock. This con-tract extends from 1 July 1972 through 3 September 1973. In certainaspects of the DCS segment of our studies we are also cooperatingwith Dr. Duwayne Anderson, Dr. Harlan McKim and Ray Tuinstra ofthe U.S. Army Cold Regions Research and Engineering Laboratory(CRREL), Hanover, New Hampshire. During the first six months ofERTS-1, personnel from these organizations attended several workinggroup meetings and one major meeting on 3 October 1972 at theUniversity of Connecticut.
The period since the launch of ERTS-1 has been devoted to over-coming problems associated with late delivery of equipment andsupplies, installing equipment, obtaining timely data products,debugging the system and establishing DCS data and imagery filingand retrieval systems rather than performing extensive research.To date, 17 data collection platforms have been installed and arereporting various hydrometeorological parameters on a near real-time basis to NED, Corps of Engineers in Waltham, Massachusetts.Only very preliminary analyses have been made upon these data.ERTS imagery has been used primarily as a training tool in'orderto become familiar with the characteristics of the imagery productswith a goal toward delineating the specific plan of data analysis(see updated Data Analysis Plan dated 8 November 1972).
The body of this report will be divided between our DCS studiesand those involving ERTS imagery and imagery/DCS interactions.
2.0 DCS STUDIES
2.1 BACKGROUND
As described in detail in our updated data analysis plan,the DCS studies involve two separate goals. The one -- to determinethe viability of satellites such as ERTS for the relay of real-timehydrometeorological data for watershed management purposes, and theother -- to aid in the selection of the most economically feasibleand technically useful layout of data collection points to provideall the necessary information for the optimal regulation of a riverbasin.
2.2 SUMMARY OF PROGRESS
2.2.1 Introduction
Location of operating DCP's and proposed sites for futureinstallation are included in the table on paqe 15. The two DCP'soperated by CRREL will test various soil temperature, soil moistureand other environmental sensors. The platform at the University ofConnecticut is a spare and will be used intermittently to testinterfacing techniques.
We are receiving DCS data via a real-time teletype link with GoddardSpace Flight Center (GSFC) which was installed on 16 November 1972.This data is being acquired as a printout and also on punched tapefor transferral to computer files. We are continuing to receivepunchcards and printouts by mail from GSFC for purposes of link errorevaluation.
2.2.2 DCP Installation, Maintenance and Performance
The following paragraphs describe in detail the progressand problems involved in setting up our ERTS DCP system. We hadhoped to have a system of 27 DCP's installed within six monthsafter the launch of ERTS-1. Instead we have only the 17 already men-tioned, due primarily to the many unforeseen problems in obtainingDCP's, interfaces and peripheral equipment.
By the end of September 1972, only 12 DCP's had been shipped toNED and, of these, 8 were installed and properly operating, one wasbeing tested and 3 were inoperable. At our test site in Waltham,two of these latter DCP's were damaged due to a lack of propergrounding. The third DCP (#6220) failed at a river gaging station
2

after 2 months of operation. A few days after this failure, GeneralElectric (GE) advised us that a unipoint ground should be installedbetween the batteries of the DCP and the sensor. This is now partof our installation procedure. It is not known whether the failureto platform #6220 was due to the lack of a unipoint ground.
By the end of December 1972, all 30 DCP's were delivered to NED,and a total of 17 were installed and properly operating. All theperipheral equipment, except a rain gage interface on order fromthe U.S. Geological Survey (USGS), had been received. Between 1 Octoberand 31 December, two DCP's were removed from the field for repairs.DCP #6246, removed from a river gaging station, had a damaged pro-grammer board, digital board and blown fuse. This DCP operated for,3 months and had damage similar to DCP #6220. The other DCP checkedout on the field test set but never transmitted a strong signal.The trouble was found to be a bad integrated circuit identified asU22 in Fig. 6-3, page 6-47/48 of the depot manual. All DCP's arenow tested for 24 hours in Waltham before field deployment. A simpleinexpensive field strength meter acquired from General Electric hasproved to be invaluable in testing and trouble shooting. The fieldstrength meter is used both at the Waltham test site and at fieldinstallations. By this method we have readily found several antennacables with weak connections that came apart during field installation.DCP maintenance, in general, is a continuing problem, but the situa-tion is improving as we become more familiar with the equipment.Personnel from CRREL are handling most of the trouble shooting andrepair work and have reached a level of expertise where contact withG.E. is rare.
With the installation of the system more than half complete, weare now devoting more time to analyzing the overall operation.Several platforms have been in operation for more than three months.Of particular interest to us are useful battery life, environmentaleffects and sensor performance. The "Gel-Cell" batteries are stillperforming satisfactorily. We are now in the winter season andsevere weather conditions have had no adverse effect on the systemup to this date. The reliability of many new sensors and interfaceshas not been satisfactory. At 3 of the river-gaging stations, datareceived has not been valid. In all these cases, the sensor isthe new Leupold & Stevens digital recording unit with a telemetryharness (so-called encoding module). We suspect the trouble to bein the encoding module. All of the water quality stations areinstalled but the data received has been erratic.- We suspect theproblem to be within the new Bristol "Datamaster" which stores theseynsor information.
3

DCS Data Acquisition and Storage
Transfer of data from NASA to NED has improved markedlysince our last report. Punchcards and printouts are received withina week after the acquisition of the data at GSFC. The near real-time teletype link with NASA has been functioning well, with abouta 45 minute interval between ERTS-1 passover and data reception at NED.
All DCS data via paper tape from the real-time link and the punch-cards received by mail from NASA is being stored in our computer.Ground truth is also being entered by punchcards. We are still inthe process of assessing the feasibility and costs for setting upa computer data link between the NED and the University of Connecticut.
2.2.4 DCS Studies,Program for Next Reporting Interval and Conclusions
Only very preliminary study has been made of the data sofar, due to the problems of equipment acquisition and installationwhich have delayed the establishment of a DCS network sizeable enoughfor analysis. Statistical tests that have been studied and selected,and computer programs written for data analysis will be applied assoon as the data bank is of sufficient proportion. This should bewithin a few months, as installation of the remaining DCP's is antic-ipated by early spring.
3.0 IMAGERY AND IMAGERY/DCS INTERACTION STUDIES
3.1 BACKGROUND
Work is underway to evaluate the application of ERTS imageryto provide useful and timely hydrologic information for NED ReservoirControl Center (RCC) management purposes. The overall plan of studyis described in a Service Contract between NED and the University ofConnecticut for NASA-ERTS Imagery Study, dated 30 June 1972.
The initial six months can be characterized as a "start-up" phaseleading into preliminary analyses of ERTS imagery. The main effortsfocused on adequate staffing (including assignment of graduatestudents); general identification and scoping of tasks (includingbackground review); organizing an efficient system for filing theERTS imagery; solving "housekeeping" problems such as setting uplaboratory space and equipment, obtaining reports, maps (particularlyimportant for the New England area) and other information; visiting
4
2.2.3
selected watersheds; liaison with NED RCC personnel to become famil-iar with operational missions and problems; becoming acquanited withthe NED METS and DCP data collection systems; and meeting with otherFederal agencies (USGS, NOAA, etc.). Imagery receipt from NASA hasbeen attended by considerable time delays, frequently as much as aone-month lag from date of the image itself. These delays continueas of this report.
The analysis of the ERTS imagery is directed toward development ofoperational benefits derived from improved NED operations ratherthan to "research" objectives per se. The thrust of the study isto integrate interpretations of the imagery analysis, the DCS in-formation, the METS data and other conventional sources of infor-mation -- all to provide an improved information base for the timely-reservoir management decisions of the NED RCC.
During this initial six-month period we have literally only "scratchedthe surface" of potential imagery applications to the complex oper-ations of NED RCC. What is reported here is only the first samplingof the ERTS imagery.
As far as we know this effort represents the first attempt at theoperational (or near operational) use of real' ERTS imagery forpurposes of managing a vast and complicated multistructure,'multi-purpose reservoir control system ($300 million system of 35 reser-voirs, 34 local protection projects, 4 hurricane barriers locatedin five major basins in New England). Further analyses using moreERTS data are expected to give significant results because: ourexperience base is growing in ERTS/NED operational problems; ofavailability of four seasons' data (including a complete networkof DCP's) and the greater chance of occurrence of significant hydro-logic events such as floods; of better interpretation techniques(imagery and computer-oriented).
Work is proceeding generally along two lines: (a) evaluation ofMSS frames (and RBV frames when available) in all bands (and incolor when available) and (b) use and development of computer-oriented pattern recognition techniques to assist the interpreta-tion and use of the imagery.
For reporting purposes, Imagery and Imagery/DCS Interaction Studiesare divided into two main sections: Imagery-Photo Interpretationand Imagery-Computer-oriented Analyses.
5
IMAGERY-PHOTO INTERPRETATION
3.2.1 Summary of Progress
3.2.1.1 ERTS Photo Products
To date, multiple photo-products of 69 separate imagesof at least one of every image frame covering all or part of NewEngland have been received at the University of Connecticut. Oneframe of image sets has been received for as many as five differentdates since the launching. New England and its coastal waters arecovered in 31 frames taken on five orbital passes corresponding to5 successive days, the sequence repeating itself every eighteendays. The first series of orbital passes were made during the period26 July through 30 July 1972 and have been repeated nine times todate. Thus if conditions were perfect New England would presentlyappear in 9 x 31 = 279 ERTS image frames. Thus the 69 images receivedso far, minus 4 of coverage completely outside the New England area,indicate that we have received, to date, 23 percent of the possibleimage sets covering all or part of New England. The balance presum-ably have not been received because of a backlog in ordering, poorimage quality, excessive cloud cover, or other difficulties. Ofthe images so far received, approximately 35 percent have minimalor no cloud cover and are of high quality, 45 percent have partialcloud cover but are useful and of generally good quality, and theremaining 20 percent have extensive cloud cover and are of limitedusefulness. An image library has been established with a filingand catalogue system described in Appendix I. The system is basedon orbital coverage with images catalogued by means of a scheduleof completed and anticipated ERTS coverage of New England from dateof launch through June 1973.
3.2.1.2 Imagery Study
USGS 1/250,000 quadrangle maps covering New England havebeen ordered and received and are being studied to locate Andidentify terrain and hydrological features. The present area ofconcentration is the Merrimack River basin located in northeasternMassachusetts and southern and central New Hampshire.
Considerable "general reconnaissance" of the ERTS imagery are maderoutinely. In particular we look for relative changes in hydro-logic features, including areas of large and small lakes (as indi-cations of volumes of surface storage). The following discussionprovides examples of hydrologic change detection.
6
3.2
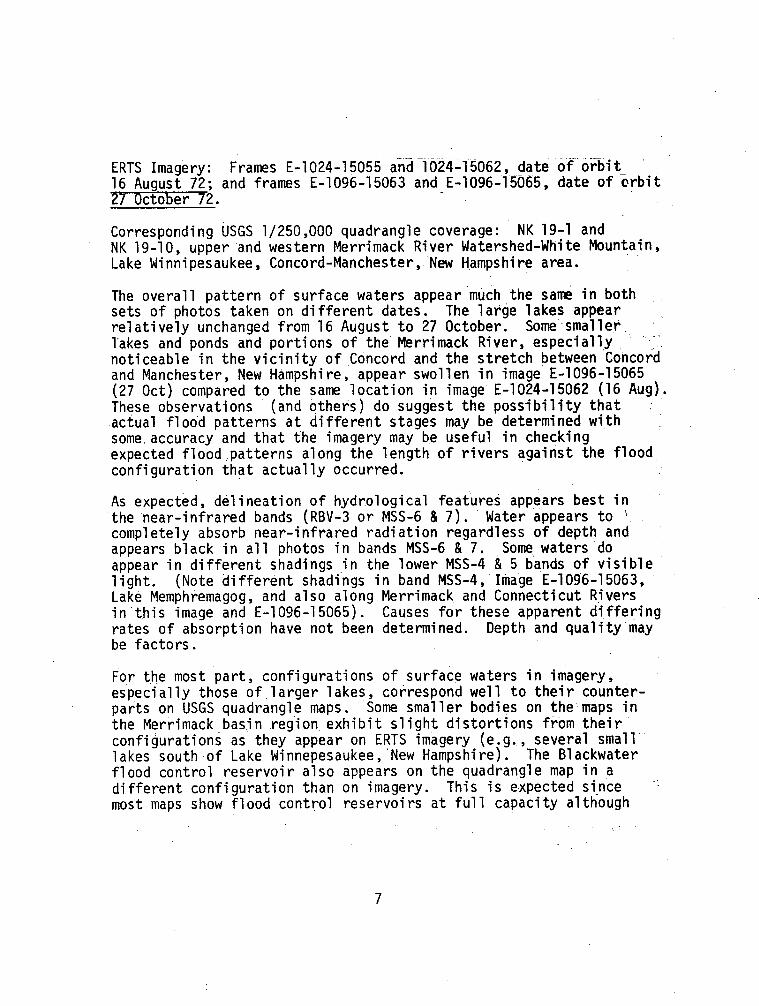
ERTS Imagery: Frames E-1024-15055 and 1024-15062, date of orbit16 August 72; and frames E-1096-15063 and E-1096-15065, date of orbit27 October 72.
Corresponding USGS 1/250,000 quadrangle coverage: NK 19-1 andNK 19-10, upper and western Merrimack River Watershed-White Mountain,Lake Winnipesaukee, Concord-Manchester,'New Hampshire area.
The overall pattern of surface waters appear much the same in bothsets of photos taken on different dates. The large lakes appearrelatively unchanged from 16 August to 27 October. Some smallerlakes and ponds and portions of the Merrimack River, especially 'noticeable in the vicinity of Concord and the stretch between Concordand Manchester, New Hampshire, appear swollen in image E-1096-15065(27 Oct) compared to the same location in image E-1024-15062 (16 Aug).These observations (and others) do suggest the possibility thatactual flood patterns at different stages may be determined withsome accuracy and that the imagery may be useful in checkingexpected flood patterns along the length of rivers against the floodconfiguration that actually occurred.
As expected, delineation of hydrological features appears best inthe near-infrared bands (RBV-3 or MSS-6 & 7). Water appears to 'completely absorb near-infrared radiation regardless of depth andappears black in all photos in bands MSS-6 & 7. Some waters doappear in different shadings in the lower MSS-4 & 5 bands of visiblelight. (Note different shadings in band MSS-4,'Image E-1096-15063,Lake Memphremagog, and also along Merrimack and Connecticut Riversin'this image and E-1096-15065). Causes for these apparent differingrates of absorption have not been determined. Depth and quality'maybe factors.
For the most part, configurations of surface waters in imagery,especially those of larger lakes, correspond well to their counter-parts on USGS quadrangle maps. Some smaller bodies on the maps inthe Merrimack basin region exhibit slight distortions from theirconfigurations as they appear on ERTS imagery (e.g., several smalllakes south of Lake Winnepesaukee,'New Hampshire). The Blackwaterflood control reservoir also appears on the quadrangle map in adifferent configuration than on imagery. This is expected sincemost maps show flood control reservoirs at full capacity although
7
these are rarely in this condition. The images may well be ofvalue in showing actual reservoir surface configurations at variousknown stages.
Terrain features show up much better in the red-infrared bands oflater images, dated 27 October, when most of the green vegetationhas disappeared. Green vegetation, prevalent in the 16 Augustimages, seems to exhibit a high reflectance and diffusion of infra-red, thus obscuring terrain features in these earlier images.Metropolitan areas with little vegetative cover seem to absorbred-infrared and thus show up very distinctly as dark areas in theMSS-6 & 7 bands of various images (e.g., Concord and Manchester,New Hampshire and Worcester, Massachusetts in aforementioned images).The correlation between different levels of absorption and varioussurface water runoff characteristics will be investigated. Anattempt is also being made to delineate actual watershed boundariesusing visible terrain features in the imagery such as iddgelines,hill and mountain tops, saddle points and valleys. Location ofdrainage divides is an important preliminary step in watershed analysis.
3.2.1.3 Equipment
To date, we have acquired several pieces of lightingequipment for viewing transparencies and we are presently constructingsmaller, portable light tables.
One of the purposes of the early studies has been to determine whatadditional equipment will be needed for more detailed study in thecourse of investigation. Brochures and pamphlets from several man-ufacturers of photogrammetric and photo-interpretation equipment,useful for ERTS imagery investigation, have been reviewed. Require-ments so far seem to dictate the necessity for magnification,measuring and drafting equipment for use in conjunction with selectedERTS imagery products. Some types of add-color devices using variouscolor filters of the type advertised in the several technical brochuresfor forming color and false color images have been investigated. Noconclusions regarding equipment have been reached. If color imagesare required, they will be ordered from NASA, or arrangements willbe made for darkroom reproduction from transparencies on' hand.
3.2.1.4 Auxiliary Information Including DCS
Arrangements are being made for NED to transfer to UCONNon a regular basis the DCS and METS data to be used in conjunctionwith the study of ERTS imagery. The USGS offices in both Hartford
8
and Boston have been contacted for receipt of available watershedsurveys, reports and other information. Arrangements are also beingmade with the River Forecast Center office in Hartford and localweather station at Storrs for receipt of weather, precipitationand snow accumulation charts and data.
DCP's provide point information of precipitation, river stage (canbe converted to discharge), water quality parameters, and'tidesand winds. These DCP data together with METS data of river stageand precipitation form the major source of time-dependent groundtruth information for interpretation of the ERTS imagery.
Snow information is obtained from snow survey-networks operatedby NED, Massachusetts Water Resources Commission, USGS and otheragencies. "Snow Bulletins" issued by NED during the winter and -spring provide graphs and maps of water equivalent of snow ininches for the various basins in New England.
3.2.2 Program for Next Reporting Interval
a. Build up imagery library to include suitable scenesfor all four seasons.
b. Build up local information sources to include: weeklyclimatological data and daily weather maps corresponding to periodand location of imagery, ERTS DCS and METS data corresponding toimagery, flood maps, snow charts and results of fieldwork associatedwith interpretation of ERTS imagery.
c. Imaqery-Photo Interpretation
(1) Quantitative measurement of hydrologic changesto include plotting and planimetering of surface waters as wellas changes in image intensity in conjunction with computer maps.
(2) Attempts to correlate imagery features andshadings with terrain type and characteristics leading to possibleusefulness in establishing area and'extent of terrain with varioushydrologic properties such as runoff and drainage characteristics,soil moisture retention, etc.
(3) Attempts to determine some of the in-watercharacteristics which, to date, have shown up as different shadingsin some waters in imagery in the lower visible bands (MSS-4 & 5):.
9
(4) Determination of extent, area and configurationof snow coverage as well as investigation of possible changes insnow conditions corresponding to different radiation absorptionlevel s.
(5) Updating of important map information notingespecially changes in reservoir extent, area and configurationwith changes in stage.
3.2.3 Conclusions
Imagery Observations:
a. IR bands (RBV3 and MSS-7) show best the delineationof surface water boundaries. These bands are satisfactory bythemselves for plotting and measuring surface areas, extent, andconfigurations of surface waters. As expected, near-IR does not,however, appear to indicate other characteristics such as depth,temperature or water quality.
b. Changes in extent and surface areas of water bodiesare observable between the times at which images of a given loca-tion have been taken. Precise measurements will be made in thenext phase.
c. No conclusions have been made about the observabilityof soil moisture as related to NED purposes.
d. Hydrologic features appear in considerable detailand provide an excellent check to update USGS quadrangle maps.This is important in hydrologic investigation.
e. Urban centers are well-defined especially in bandMSS-7. This may be useful in determining updated estimates ofextent of high flood-damage areas.
3.3 IMAGERY COMPUTER-ORIENTED ANALYSIS
3.3.1 Introduction
During the first stages of the ERTS-1 imagery study, andwhile we were waiting for data to arrive, most work was directedtowards background research. Literature (see references 1-12) inthe field of remote sensing, including the ERTS material in par-ticular and its relationships to missions of the NED RCC, has beenobtained and studied. We took particular interest in the fieldof computer analysis of imagery.
10

Various computer-oriented image-processing techniques are now beingapplied to.the.ERTS magnetic tapes. In order to use these techniquesoperationally, ground truth information'about the hydrologic events(i.e., snow conditions, flooding, rain data, etc.) must be establishedin relation to the imagery obtained. This kind of information isneeded to "train" the computer in recognizing and analyzing thehydrologic events'in the ERTS imagery. We are beginning to organizethis ground truth information as we continue to develop our tech-niques for computer analysis. A summary of-the digital image-processing activities in remote sensing for earth resources maybe found in a report by Nagy (12).
3.3.2 Summary of Progress
3.3.2.1 Initial Stages ... . .. .
Contacts were made with groups of ERTS investigators whohave been developing programs to perform automatic classificationon land uses and agricultural crops, and others who have:been doingwork in flood analysis and control (1, 3', 7). Some of these researchershave replied, and the information they sent is. being analyzed forpossible applications.
Progress has been delayed somewhat' due to a NASA backlog in ordersof computer data. With the assistance of NASA-Goddard, severalproblems concerning format and content-specification for the com-puter compatible-tapes have been solved, and.work has begun on ,the actual processing of these tapes. This is describe-d in thefollowing sections.
3.3.2.2 ' Preliminary Analysis
The first computer program, currently being developed,prints sections of an ERTS image at-a particular band us-ing .apseudo gray scale of blank to full icharacters.. . These sectionsare also printed in a numerative scale., so outlines-and boundaries,may be ascertained accurately. The user is able to select anyportions of the image for printout so as to assist his. interpreta-tion studies. A description: of the print program is given in:Appendix II. It is hoped that this;work will also give thoseinvolved in the same type of interpretation studies a better.feelfor the data. An interaction of human photo interpretation andcomputer data handling will be used at this point to print out in
11

detail "closeups" of particular hydrologic features, such as lakesand rivers. Using these techniques, the drainage basins of theMerrimack River and the Connecticut River will be studied.
3.3.2.3 Location of Image Features within the Computer System
Work is underway to develop a data handling packagewhich performs an image feature search. Within the image, it isoften desirable to have the computer identify, store and laterretrieve such hydrologic features as snow cover, bodies of water,clouds, etc. This will require application of numerical patternrecognition schemes. These schemes in general deal with the problemof programming a computer (or any other device) to automaticallyclassify data points into one of several known categories. Eachof these categories could be one of the hydrologic events withinan ERTS image.
3.3.3 Programs for the Next Reporting Interval
3.3.3.1 Further Analysis
The specific objective will be to develop computer-basedprocedures that will be capable of identifying and analyzing thevarious hydrologic events that are considered relevant to NED floodcontrol and prediction operations. Emphasis will be placed onexperimental use of computerized pattern-recognition techniquesin NED Reservoir Control Center operating procedures and as inputsto mathematical models of the Merrimack River and other hydrologicphenomena. Since a large amount of imagery data is involved, itwill be necessary to extract certain "features" present (alongthe same lines, only in greater detail, as the features mentionedin the previous section). Once a reduced feature subset of theimagery data has been identified it will be stored and processedwith a more efficient data handling scheme. This process offeature identification may be properly called data reduction. Thesestudies will have to be correlated with those at NED RCC. ERTS-relayed and other ground truth data will have to be collected to"train" the computer in automatic identification and analysis ofthe desired features. We plan a systematic interaction to determinehow the results of computer analysis at UCONN can be used to refineor improve the predictive models used at NED.
3.3.3.2 Long-Range Goals
Further analysis will be planned to investigate new meansfor the automatic interpretation of ERTS imagery that are relevantto NED missions. Possible topics for investigation include:
12

a. Dynamic analysis of ERTS imagery, to determine changesin hydrologic condition with respect to time and space to aid inlong-range flood control and NED predictive missions. This is anoverriding feature in the day to day operations of NED RCC whererapidly changing hydrologic conditions must be monitored, inter-preted and reservoir management operations quickly put into effect.
b. Refinement of evaluation of flood damages and identi-fication of flooded areas in post-flood analysis is an area of highconcern to NED. In particular, methods for damage estimation fromminor floods seem inadequate, although the Cumulative damages wouldappear to warrant rapid updated flood survey data.
c. Updating and refinement of mapping flood plain areason a regional basis. The Corps of Engineers is responsible forpreparing flood plain information studies.
d. Mathematical simulation of imagery-derived data forassessing combined effects of storms and NED operating rules onreservoirs and riverflows. Such use of ERTS data would assist NEDin-house studies for reservoir regulation manuals.
e. The means for optimally combining information extractedfrom separate RBV and MSS bands.
f. The determination of the effects of the imagery over-lap on the ability of machine analysis of the ERTS imagery.
3.3.4 Conclusions
At this time, several tentative conclusions may be drawnas a result of the first stages of the ERTS Imagery Computer-oriented Analysis Study. They are as follows:
a. There is clearly a need to apply computer-orientedpattern recognition techniques to perform detailed analysis ofthe ERTS imagery. Of particular importance are those techniquesthat will allow us to detect shade boundaries and recognize geo-metrical features relevant to the hydrological events in the imagery.Special care must be exercised in applying these techniques so thatonly minimum human assistance is needed after the initial trainingperiod.
13
b. The initial cost of computer processing the imageryis rather high (about $9/quarter frame/spectral band). This isdue to the fact that large amounts of data are involved in eachframe and considerable experimentation with the data is necessaryto refine the analysis schemes. To reduce the cost, more efficientmethods of data handling are being developed.
c. It is essential to have close man-machine interactionat various stages of the analysis study. This kind of interactionis necessary, not only for computer-assisted photo interpretation,but particularly important if interpretation results are to beuseful to the missions of NED.
4.0 CONTACTS WITH OTHER INVESTIGATORS, ORGANIZATIONS AND THEGENERAL PUBLIC
We are keeping in contact with other ERTS-1 investigatorsas well as with non-participating individuals, agencies and otherswho have shown interest in our progress. We are also keeping inclose contact with Corps of Engineers Headquarters in Washingtonand other Corps offices around the country.
Utilizing imagery products received at NED, CRREL evaluated thepotential use of ERTS-1 imagery in the recently initiated nation-wide dam inventory and submitted a report directly to the Corps'Washington headquarters.
We have evaluated the possibility of co-hosting a proposed meetingof selected DCS users at Wallops Island, Virginia, and concludedthat, due to lack of time and personnel, we cannot undertake sucha responsibility at this time.
In November, our DCS activities were filmed for inclusion in NASA'sERTS-1 official film. In the past six months, we have receivedconsiderable publicity from the local press, radio and television.
14
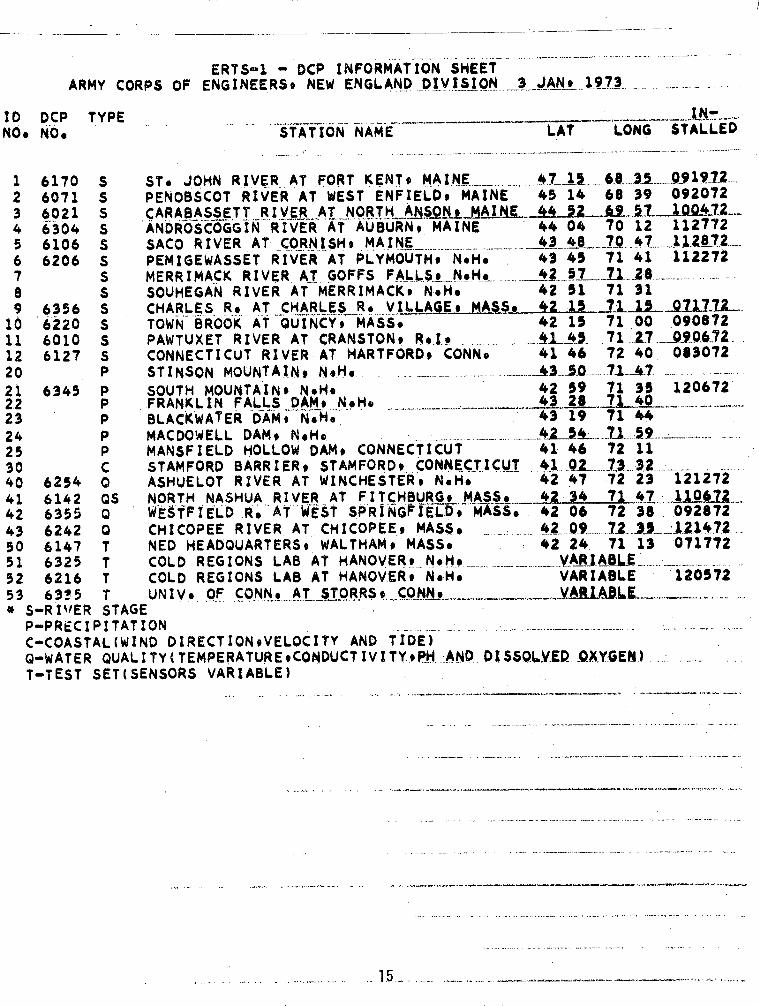
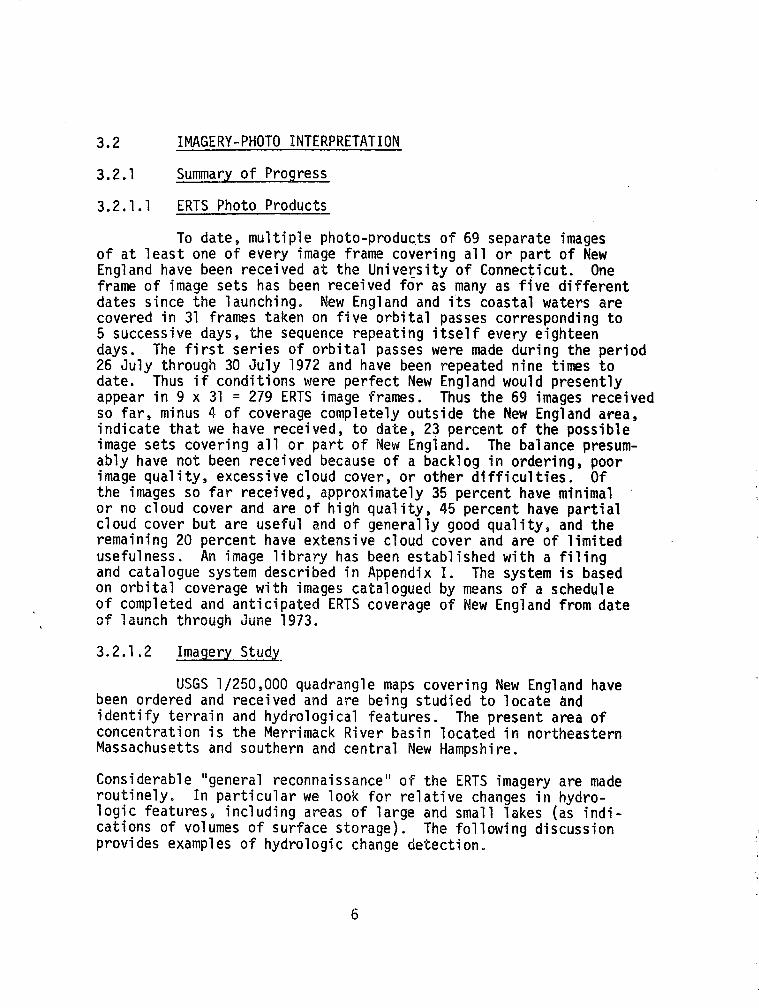
ERTS-1 - DCP INFORMATION SHEETARMY CORPS OF ENGINEERS. NEW ENGLAND DIVISION 3 JANe. 1.9.73
ID DCP TYPENO NO, StATION NAME LONG STALLED
1 6170 S ST. JOHN RIVER AT FORT KENt9. MAI.NE .... ..15 6..3..__91972.2 6071 S PENOBSCOT RIVER AT WEST ENFIELD, MAINE 45 14 68 39 0920723 6021 5S CARABASSETT RIVER AT, NORTA SL_4 O AN .i4..t_4 6304 S ANDROSCOGGIN RIVER AT AUBURN, MAINE 44 04 70 12 1127725 6106 S SACO RIVER AT CORNISH. MAINE __ 43 4_8_ 704.. ._28...6 6206 S PEMIGEWASSET RIVER AT PLYMOUTH, N.H, 43 45 71 41 1122727 S MERRIMACK RIVER AT GOFFS FALLS9,_N.H.,. . ._42 57 ... 8 .......................1 8 S SOUHEGAN RIVER AT MERRIMACK. N-.H. 42 51 71 319 6356 S CHARLES Re AT CHARLES R., VILLAGE,_AASSQ 42 15Q10 6220 S TOWN BROOK At QUINCYt MASS. 42 15 71,00 09087211 6010 S PAWTUXET RIVER AT CRANSTON, RSele ... ............ 71._27_._09.6.72712 6127 S CONNECTICUT RIVER AT HARTFORD, CONN* 41 46 72 40 08307220 P STINSON MOUNTAIN, N.H. . 4. 1 4721 6345 P SOUTH MOUNTAINt N.Ho 42 59 71 35 12067222 P FRANKLIN FALLS DAM, N.H 43 2 .. 7L4O 23 P BLACKWATER DAM. N.H 43 19 71 4424 P MACDOWELL DAM, NsHe ...:.....-...4..1.. .... __.._7... ............... 225 P MANSFIELD HOLLOW DAM, CONNECTICUT 41 46 72 1130 C STAMFORD BARRIER, STAMFORDt CONNECTICUT 41.0 .... .. 332.....,. 2. .40 6254 0 ASHUELOT RIVER AT WINCHESTER, N.H. 42 47 72 23 12127241 6142 QS NORTH NASHUA RIVER AT FITCHBURG, MAS5t 4 4 1 _7. _42 6355 Q WESTFIELD R 'AT 'WET 'SPRiNGIELDC M-ASS, 42 06 72 38 09287243 6242 Q CHICOPEE RIVER AT CHICOPEE, MASS, .. .. 2 ...7 3_1472. 50 6147 T NED HEADQUARTERS, WALTHAM, MASS, 42 24 71 13 07177251 6325 T COLD REGIONS LAB AT HANOVER,_NH .. _ __ Ne.......... ..... 52 6216 T COLD REGIONS LAB AT HANOVER, MN.H, VARIABLE 12057253 63?5 T UNIVo OF CONN AT STORRSCONN AT kjR ....j.. ..4. * S-RI.ER STAGE
P-PRECIPITATIONC-COASTAL(WIND DIRECTIONsVELOCITY AND TIDE)O-WATER QUALITY(TEMPERATURECONDUCTIVITYtPH. AND. DIXSSQLYED .XYGEN) -:T-TEST SET(SENSORS VARIABLE)
- ... ..... ..... ,, 15. - .. -...
LAT
Appendix A
UCONN ERTS Photo-Library
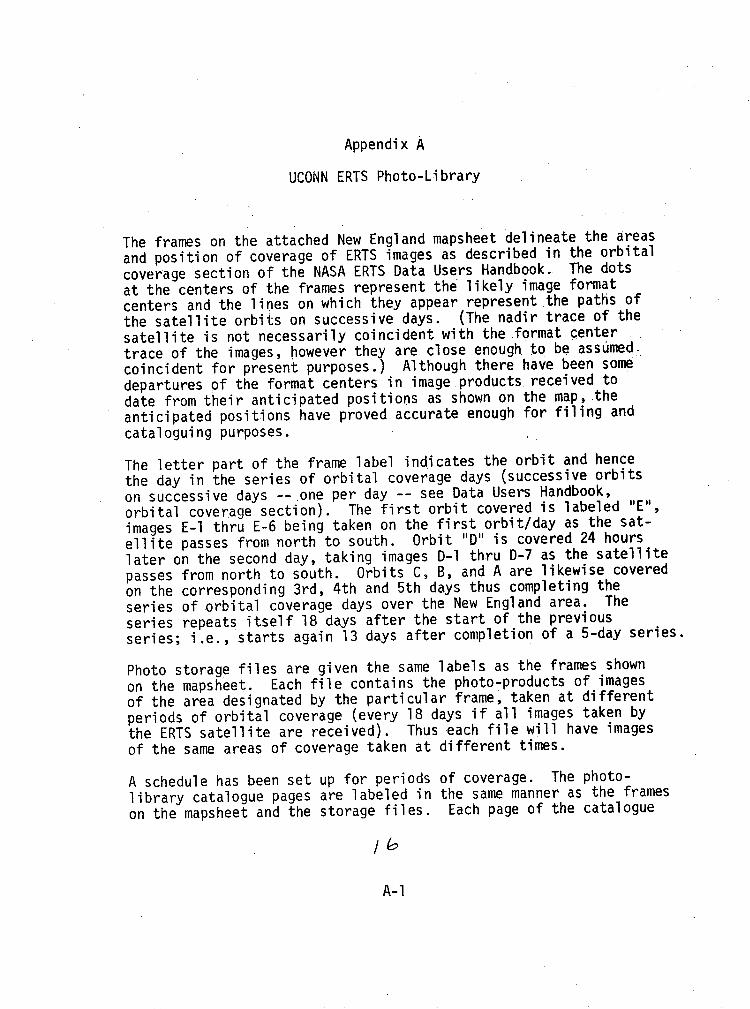
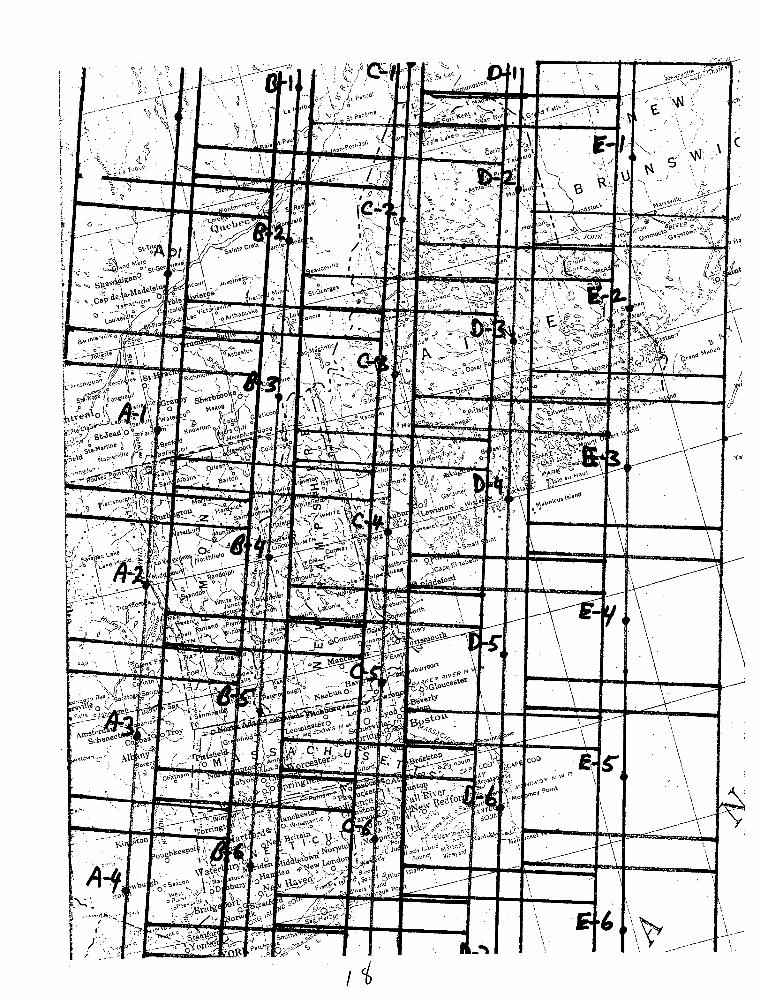
The frames on the attached New England mapsheet delineate the areasand position of coverage of ERTS images as described in the orbitalcoverage section of the NASA ERTS Data Users Handbook. The dotsat the centers of the frames represent the likely image formatcenters and the lines on which they appear represent the paths ofthe satellite orbits on successive days. (The nadir trace of thesatellite is not necessarily coincident with the format centertrace of the images, however they are close enough to be assumed-coincident for present purposes.) Although there have been somedepartures of the format centers in image products received todate from their anticipated positions as shown on the map, theanticipated positions have proved accurate enough for filing andcataloguing purposes.
The letter part of the frame label indicates the orbit and hencethe day in the series of orbital coverage days (successive orbitson successive days -- one per day -- see Data Users Handbook,orbital coverage section). The first orbit covered is labeled "E",images E-1 thru E-6 being taken on the first orbit/day as the sat-ellite passes from north to south. Orbit "D" is covered 24 hourslater on the second day, taking images D-1 thru D-7 as the satellitepasses from north to south. Orbits C, B, and A are likewise coveredon the corresponding 3rd, 4th and 5th days thus completing theseries of orbital coverage days over the New England area. Theseries repeats itself 18 days after the start of the previousseries; i.e., starts again 13 days after completion of a 5-day series.
Photo storage files are given the same labels as the frames shownon the mapsheet. Each file contains the photo-products of imagesof the area designated by the particular frame, taken at differentperiods of orbital coverage (every 18 days if all images taken bythe ERTS satellite are received). Thus each file will have imagesof the same areas of coverage taken at different times.
A schedule has been set up for periods of coverage. The photo-library catalogue pages are labeled in the same manner as the frameson the mapsheet and the storage files. Each page of the catalogue
A-1
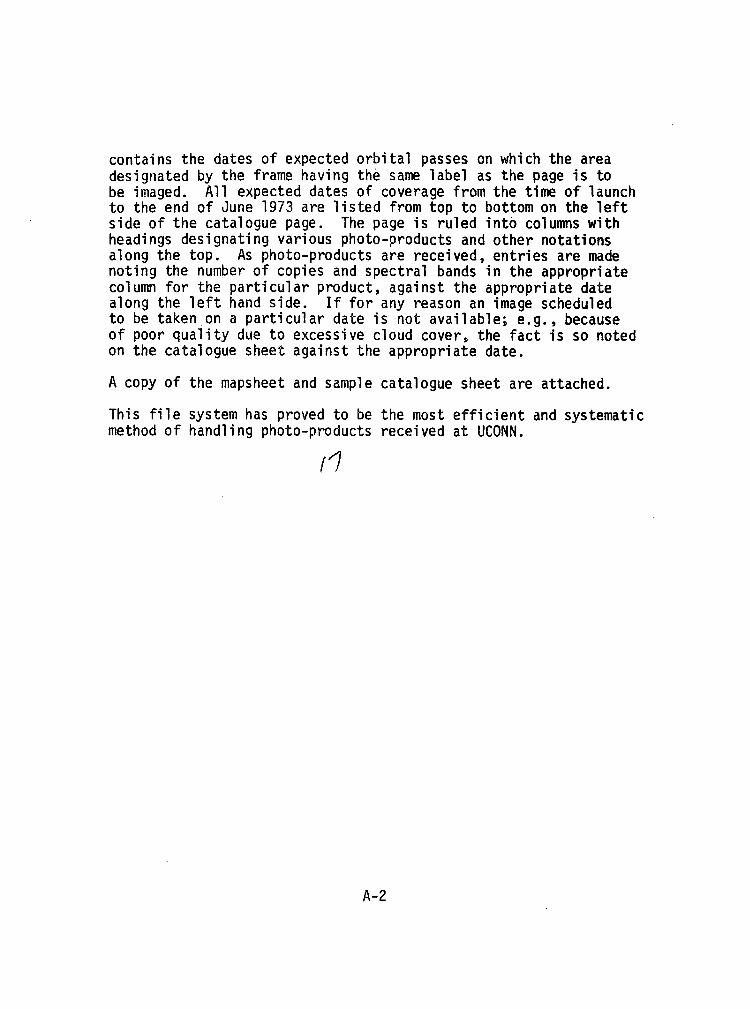
contains the dates of expected orbital passes on which the areadesignated by the frame having the same label as the page is tobe imaged. All expected dates of coverage from the time of launchto the end of June 1973 are listed from top to bottom on the leftside of the catalogue page. The page is ruled into columns withheadings designating various photo-products and other notationsalong the top. As photo-products are received, entries are madenoting the number of copies and spectral bands in the appropriatecolumn for the particular product, against the appropriate datealong the left hand side. If for any reason an image scheduledto be taken on a particular date is not available; e.g., becauseof poor quality due to excessive cloud cover, the fact is so notedon the catalogue sheet against the appropriate date.
A copy of the mapsheet and sample catalogue sheet are attached.
This file system has proved to be the most efficient and systematicmethod of handling photo-products received at UCONN.
(
A-2
I t L\ ilii /
..·
.- ~ 5,,,~. '*.~; - "' -
i7 "ui ? ii~- -Xc o\ b ;
I\ , e - 'N
:~%~ fi~~~~~~~~~~3' -".,
·:·- 1 ; ' %c,
rA,~~~~~O
I -e ,d '8 ' ''
...... ,g °IeP%
I,'~~~~~~~~~~~~~~~~~~~~~~ L-.. i-·- ;~ '8 ",, "
-a SIP :, ,~~~~,a~~L~~i; 'lei o ~, , -
i r
onguj" o ~e;b~)~nee i~~ ~~~ Otf~; cad 'jn C0 c,~
C M -
bV~~~r- .HU

-00)30S.-S.-om(AI-.lE I-0L)w
,.- IS.I-
I
X
m.
C
co
S.- I
Ln
>
8)L
v,
..
(1) cn
V
I I
I
V)
C,) c
Vc) /)
c
v-s r-
to
V)
tn
V)
X: m
M
PC)
v-
N-
E
I
ro s
N-
t
N-
I I
V)
C)
C)
C,)
GI
V)
M: m
M
kD
(.D0
D
t.0o
0 0
0UL
LO
LU) L
CO OC
C)
C0
.N
- r--
P-
I- {
CM
C
M
CNJ O
u- c'i
CO
G)
n C
L
4 >
u
u C
=
CD
a)
u o
a)
t
Qcncnoo3
N
N
I q
ILLIC
,
w:-4*--J
'.0
E
o0
.,-
-o00C:
CM
0,cn
Appendix B
RBV Print Program
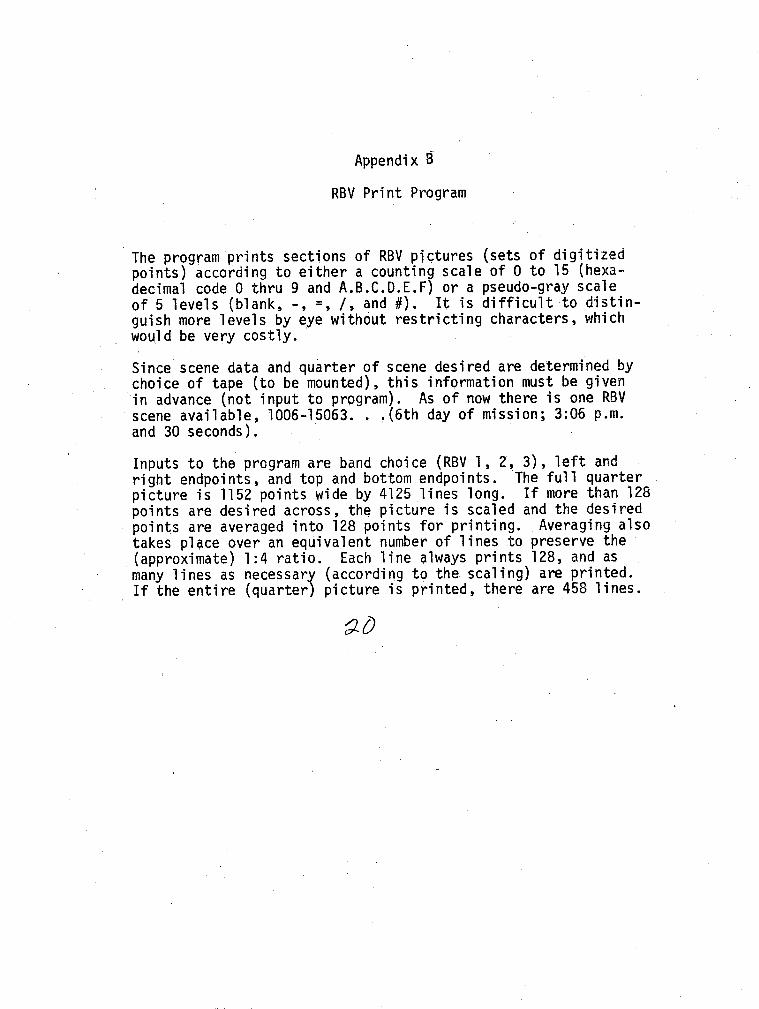
The program prints sections of RBV pictures (sets of digitizedpoints) according to either a counting scale of 0 to 15 (hexa-decimal code 0 thru 9 and A.B.C.D.E.F) or a pseudo-gray scaleof 5 levels (blank, -, =, /, and #). It is difficult to distin-guish more levels by eye without restricting characters, whichwould be very costly.
Since scene data and quarter of scene desired are determined bychoice of tape (to be mounted), this information must be givenin advance (not input to program). As of now there is one RBVscene available, 1006-15063. ..(6th day of mission; 3:06 p.m.and 30 seconds).
Inputs to the program are band choice (RBV 1, 2, 3), left andright endpoints, and top and bottom endpoints. The full quarterpicture is 1152 points wide by 4125 lines long. If more than 128points are desired across, the picture is scaled and the desiredpoints are averaged into 128 points for printing. Averaging alsotakes place over an equivalent number of lines to preserve the(approximate) 1:4 ratio. Each line always prints 128, and asmany lines as necessary (according to the scaling) are printed.If the entire (quarter) picture is printed, there are 458 lines.
REFERENCES
1. D. F. McGinnis, Detecting Melting Snow and Ice by Visible andNear-Infrared Measurements from Satellites, InternationalSymposia on the Role of Snow and Ice in Hydrology, August 1972.
2. Earth Resources Technology Satellite, NASA Data ProcessingFacility, Format and Content Specification for Computer Com-patible Tapes, Goddard Space Flight Center, May 1, 1972.
3. R. M. Hoffer and L. A. Bartolucci, Remote Sensing Techniquesfor Measurement of Water Temperatures, Information Note 111671,LARS, Purdue University.
4. R. Bernstein and H. Silverman, Digital Techniques for EarthResource Image Data Processing, American Institute of Aeronauticsand Astronautics, 8th Annual Meeting and Technical Display,September 1971.
5. James C. Barnes and Clinton J. Bowley, Operational Guide forMapping Snow Cover from Satellite Photography, Allied ResearchAssociates, Inc., Concord, Mass., May 1968.
6. James C. Barnes and Clinton J. Bowley, Snow Studies Using ThermalInfrared Measurements from Earth Satellites, Dept. of CommerceNational Oceanic and Atmospheric Administration, National Environ-ment Satellite Service, July 1972.
7. Victor I. Meyers, Fred A. Waltz and Jack R. Smith, Remote Sensingfor Evaluating Flood Damage Conditions, Remote Sensing Institute,South Dakota State University, June 1972.
8. Proceedings 8th International Symposium on Remote Sensing ofEnvironment, October 2-6, 1972, Ann Arbor, Michigan.
9. T. J. Harley, Jr., L. N. Kanal and N. C. Randall, System Con-siderations for Automatic Imagery Screening, Pictorial PatternRecognition, Ed. by G. C. Cheng, R. S. Ledley, D. K. Pollackand A. Rosenfield, Thompson Book Co., Washington, D.C. 1968,pp 15-32.
10. A. Habibi, Two-Dimensional Bayesian Estimate of Images, Proc.of IEEE, July, 1972, pp 878-883.

11. A. Rosenfield, Picture Processing by Computer, Computing Surveys,Vol. 1, No. 3, September 1969.
12. G. Nagy, Digital Image-Processing Activities in Remote Sensingfor Earth Resources, Proc. IEEE, Vol. 60, No. 10, October 1972.
e2_

January 1973
SUMMARY OF INVESTIGATION #MMC 89:-THE USE OF ERTS IMAGERY IN RESERVOIR
MANAGEMENT AND OPERATION
CO-PRINCIPAL INVESTIGATORS:MR. SAUL COOPERDR. PAUL BOCK
FOR DISCIPLINE 4: WATER RESOURCES
Studies at the New England Division, Corps of Enqineers, arefocused on evaluating the possible usefulness of ERTS DCS andimagery to its watershed management functions. The first sixmonths of ERTS-1 have been devoted primarily to installing anddebugging equipment and general familiarization with ERTS dataproducts, both DCS and'imagery. To date, 17 of a planned 27 datacollection platforms have been installed and are reporting to NEDvarious hydrometeorological parameters on a near real-time basisvia a direct teletype link with Goddard Space Flight Center. Onlya very preliminary study of the data has been made so far. Sta-tistical tests will be applied as soon as the data bank is of suf-ficient proportion. This should be within a few months as instal-lation of the remaining DCP's is expected to be accomplished byearly spring. Our imagery studies are centering on both photo-interpretation and computer-oriented analyses fordepictions ofuseful hydrologic features. Preliminary work has suggested thatconfiguration and areal coverage of surface waters, as well asother hydrologically related terrain features, may be-obtainedfrom ERTS imagery to an extent that would be useful to NED. Computer-oriented pattern recognition techniques are being developed to helpautomate the identification and analysis of hydrologic features inthe imagery. Emphasis is made upon the need for close man-machineinteraction while training the computer for these tasks.
January 1973
SUMMARY OF INVESTIGATION #MMC 89:THE USE OF ERTS IMAGERY IN RESERVOIR
MANAGEMENT AND OPERATION
CO-PRINCIPAL INVESTIGATORS:MR. SAUL COOPERDR. PAUL BOCK
FOR SUBDISCIPLINE 9B: SENSORTECHNOLOGY-DATA COLLECTION PLATFORMS
The Data Collection System operated by the New England Division,Corps of Engineers, Waltham, Massachusetts, is relaying hydro-meteorological information (primarily river stage, precipitationand water quality parameters) on a near real-time basis to NEDwith the aid of a direct teletype link with Goddard Space FlightCenter. We are evaluating the viability of DCS for relay of datafor watershed management purposes and also using it to aid ourdetermination of an optimal layout of data collection points forthe regulation of a typical river basin. To date, 17 of a planned27 DCP's have been installed. Only very preliminary analysis ofthe data has been made so far, pending establishment of a more com-plete network of DCP's (we expect to have all 27 in place by earlyspring).
We have found it expedient to install each DCP at NED and obtain satel-lite data before field deployment. In addition, a simple inex-pensive field strength meter, obtained from G.E., has proved invaluablein field testing the equipment. The "Gel-Cell" batteries and theDCP's are still operating satisfactorily despite severe winterweather conditions. We have had considerably more difficulty withdefective sensors and with the interfacing of sensors to DCP's.
Transfer of data from NASA to NED has been good. Punchcards andprintouts are received from NASA within a week after the acquisitionof the data at GSFC. The near real-time teletype link with NASA hasbeen functioning well, with about a 45-minute interval between ERTS-lpassover and data reception at NED.
6�2�