Composite Behavior of Simulated Madden-Julian Oscillation ...
Upload
xantha-watsonCategory
view
38download
0description
Madden-Julian Oscillation: Recent Evolution, Current
Status and Predictions
Update prepared byClimate Prediction Center / NCEP
September 17, 2012
Outline
• Overview
• Recent Evolution and Current Conditions
• MJO Index Information
• MJO Index Forecasts
• MJO Composites
Overview
Additional potential impacts across the global tropics are available at: http://www.cpc.ncep.noaa.gov/products/precip/CWlink/ghazards/index.php
• The MJO remained active during the past week as the enhanced phase propagated eastward across the Maritime Continent.
• Dynamical model MJO index forecasts generally indicate a weak eastward propagating signal
during the upcoming two week period, but model spread and uncertainty remains high.
• Based on the latest observations and most model forecasts, the MJO is forecast to remain active with the enhanced convective phase located across the western Pacific during the period.
• The MJO is expected to contribute to enhanced convection across the western Pacific and perhaps the eastern pacific and Central America by the end of Week-2. Suppressed convection is favored for parts of the Indian Ocean and Maritime continent throughout the period. Also, the chances for tropical cyclogenesis remain elevated across the western Pacific.
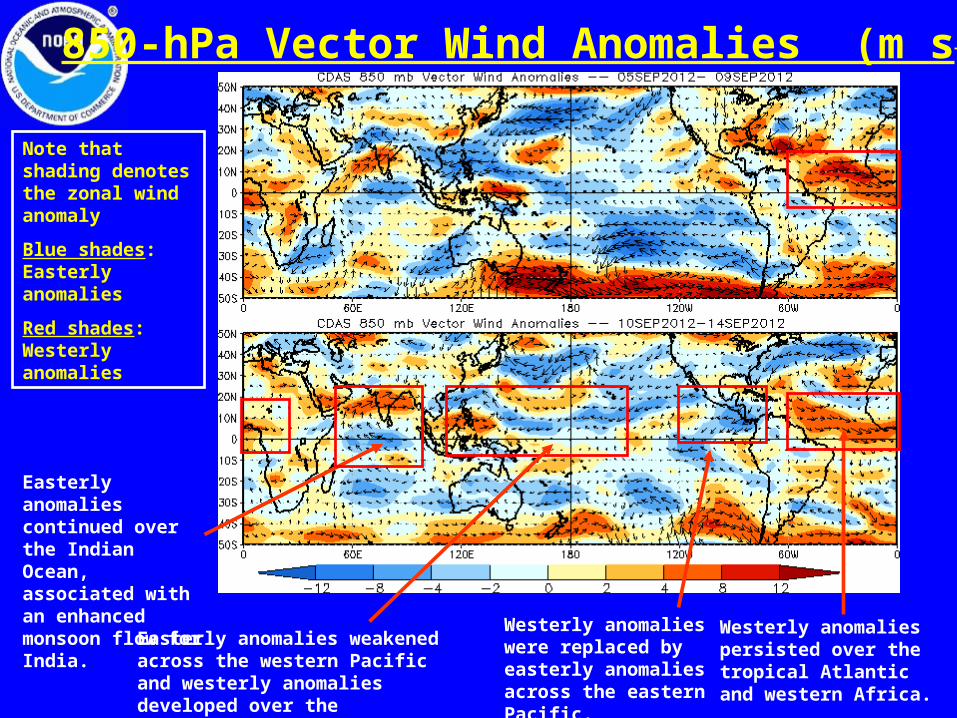
850-hPa Vector Wind Anomalies (m s-1)
Note that shading denotes the zonal wind anomaly
Blue shades: Easterly anomalies
Red shades: Westerly anomalies
Easterly anomalies continued over the Indian Ocean, associated with an enhanced monsoon flow for India.
Westerly anomalies persisted over the tropical Atlantic and western Africa.
Easterly anomalies weakened across the western Pacific and westerly anomalies developed over the Philippines.
Westerly anomalies were replaced by easterly anomalies across the eastern Pacific.
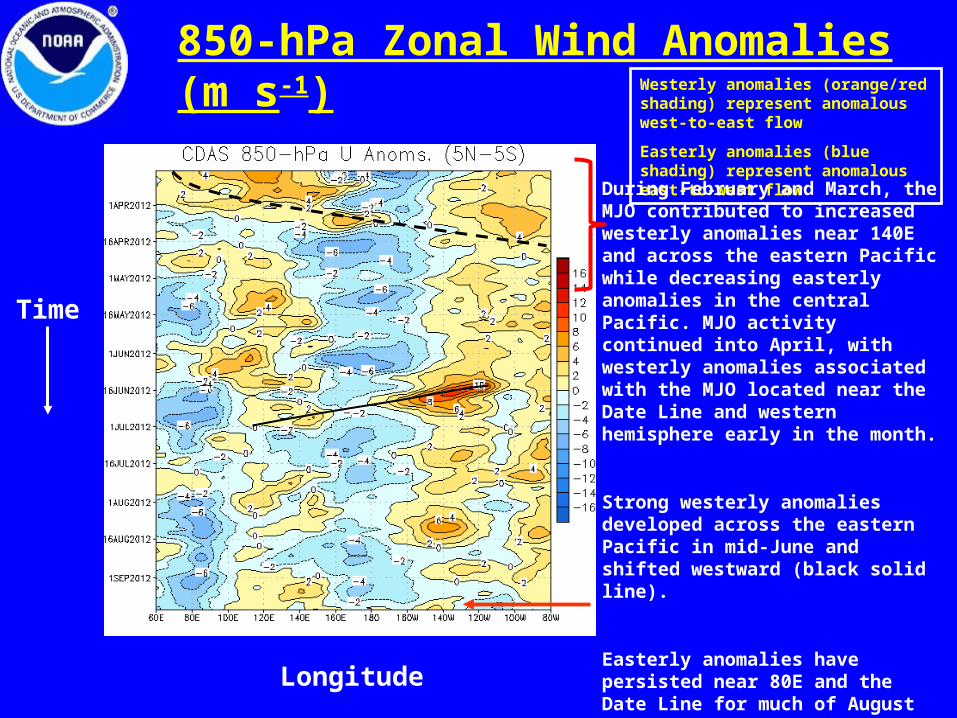
850-hPa Zonal Wind Anomalies (m s-1)Westerly anomalies (orange/red shading) represent anomalous west-to-east flow
Easterly anomalies (blue shading) represent anomalous east-to-west flow
During February and March, the MJO contributed to increased westerly anomalies near 140E and across the eastern Pacific while decreasing easterly anomalies in the central Pacific. MJO activity continued into April, with westerly anomalies associated with the MJO located near the Date Line and western hemisphere early in the month.
Strong westerly anomalies developed across the eastern Pacific in mid-June and shifted westward (black solid line).
Easterly anomalies have persisted near 80E and the Date Line for much of August and September. Most recently, weak westerly anomalies developed in the western and central Pacific.
Time
Longitude
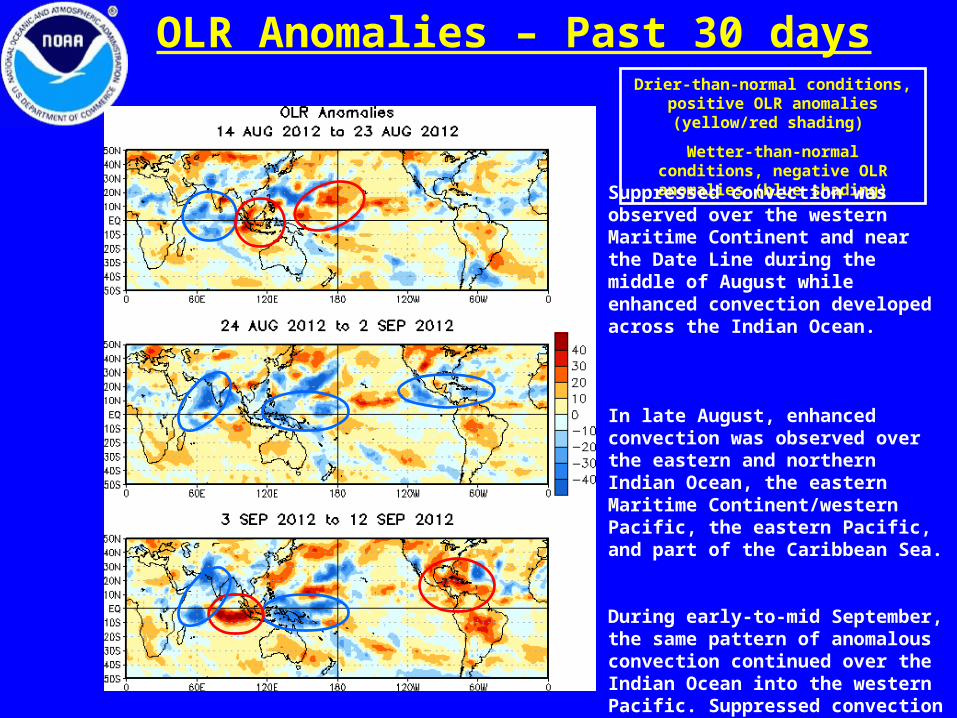
OLR Anomalies – Past 30 daysDrier-than-normal conditions, positive OLR anomalies (yellow/red shading)
Wetter-than-normal conditions, negative OLR anomalies (blue shading)
Suppressed convection was observed over the western Maritime Continent and near the Date Line during the middle of August while enhanced convection developed across the Indian Ocean.
In late August, enhanced convection was observed over the eastern and northern Indian Ocean, the eastern Maritime Continent/western Pacific, the eastern Pacific, and part of the Caribbean Sea.
During early-to-mid September, the same pattern of anomalous convection continued over the Indian Ocean into the western Pacific. Suppressed convection was observed over Central America and the Caribbean.
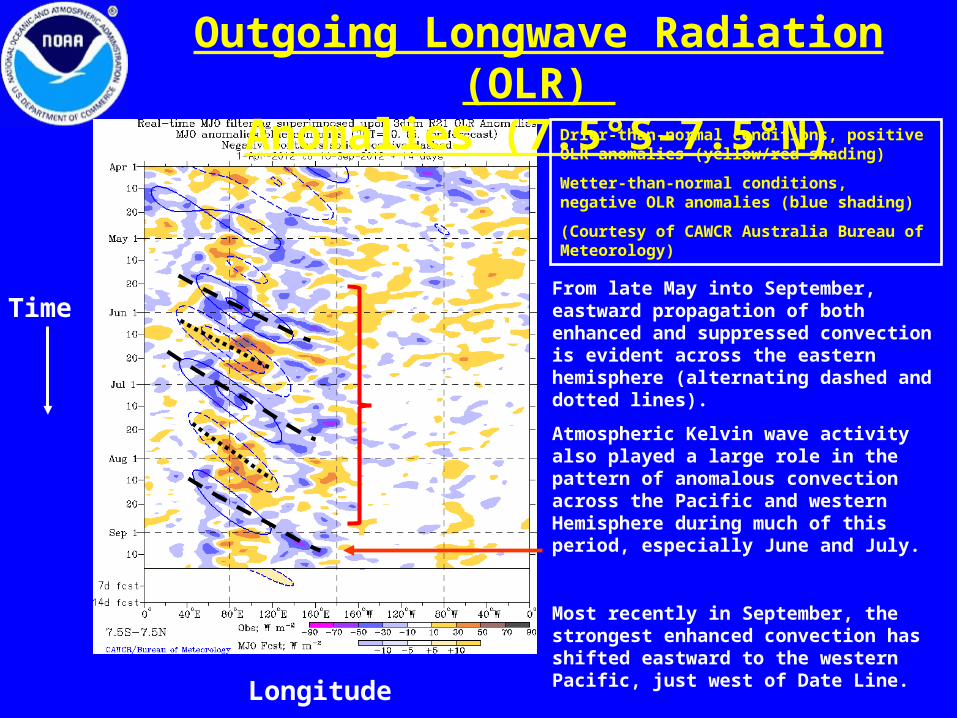
Outgoing Longwave Radiation (OLR) Anomalies (7.5°S-7.5°N)
Drier-than-normal conditions, positive OLR anomalies (yellow/red shading)
Wetter-than-normal conditions, negative OLR anomalies (blue shading)
(Courtesy of CAWCR Australia Bureau of Meteorology)
Time
Longitude
From late May into September, eastward propagation of both enhanced and suppressed convection is evident across the eastern hemisphere (alternating dashed and dotted lines).
Atmospheric Kelvin wave activity also played a large role in the pattern of anomalous convection across the Pacific and western Hemisphere during much of this period, especially June and July.
Most recently in September, the strongest enhanced convection has shifted eastward to the western Pacific, just west of Date Line.
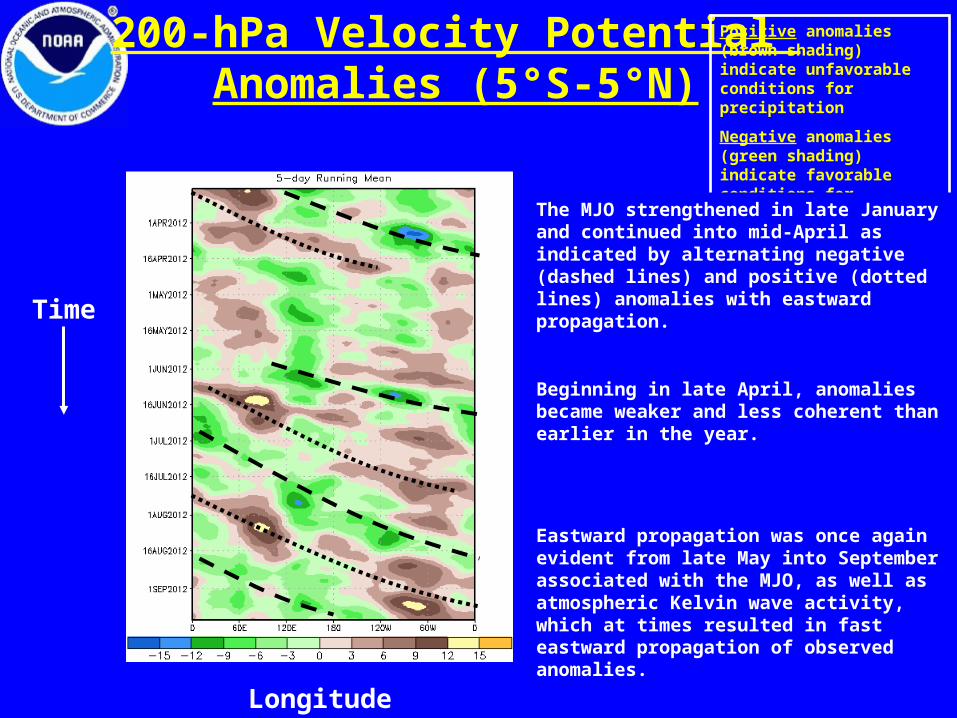
200-hPa Velocity Potential Anomalies (5°S-5°N)
Positive anomalies (brown shading) indicate unfavorable conditions for precipitation
Negative anomalies (green shading) indicate favorable conditions for precipitation
The MJO strengthened in late January and continued into mid-April as indicated by alternating negative (dashed lines) and positive (dotted lines) anomalies with eastward propagation.
Beginning in late April, anomalies became weaker and less coherent than earlier in the year.
Eastward propagation was once again evident from late May into September associated with the MJO, as well as atmospheric Kelvin wave activity, which at times resulted in fast eastward propagation of observed anomalies.
Time
Longitude
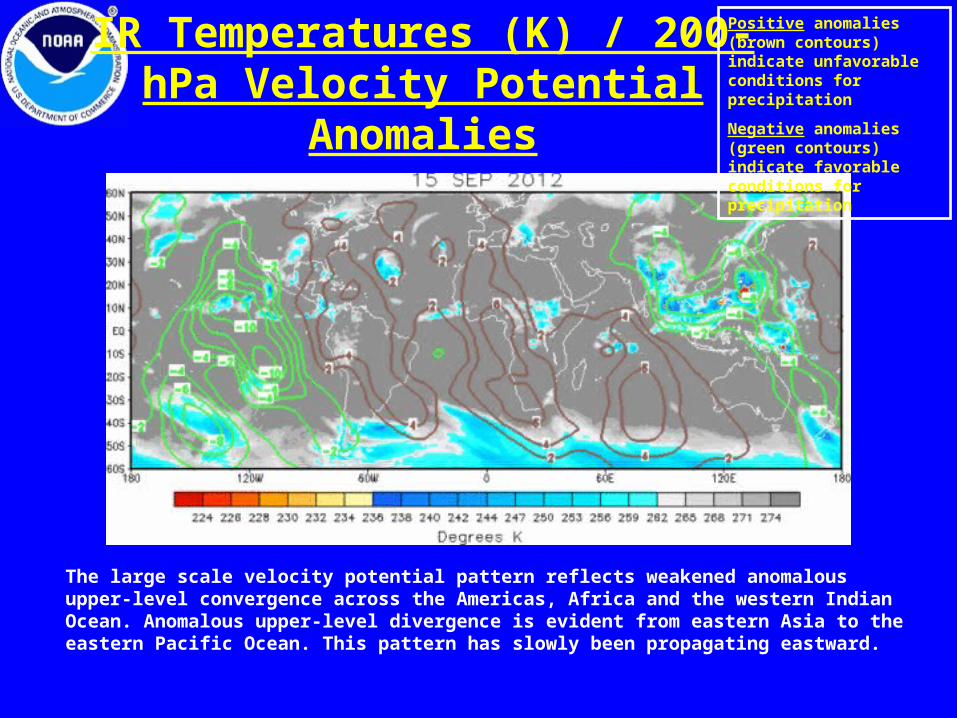
IR Temperatures (K) / 200-hPa Velocity Potential Anomalies
Positive anomalies (brown contours) indicate unfavorable conditions for precipitation
Negative anomalies (green contours) indicate favorable conditions for precipitation
The large scale velocity potential pattern reflects weakened anomalous upper-level convergence across the Americas, Africa and the western Indian Ocean. Anomalous upper-level divergence is evident from eastern Asia to the eastern Pacific Ocean. This pattern has slowly been propagating eastward.

200-hPa Vector Wind Anomalies (m s-1)Note that shading denotes the zonal wind anomaly
Blue shades: Easterly anomalies
Red shades: Westerly anomalies
The core of the westerly anomalies (blue box) shifted eastward across the eastern Pacific and into equatorial South America.
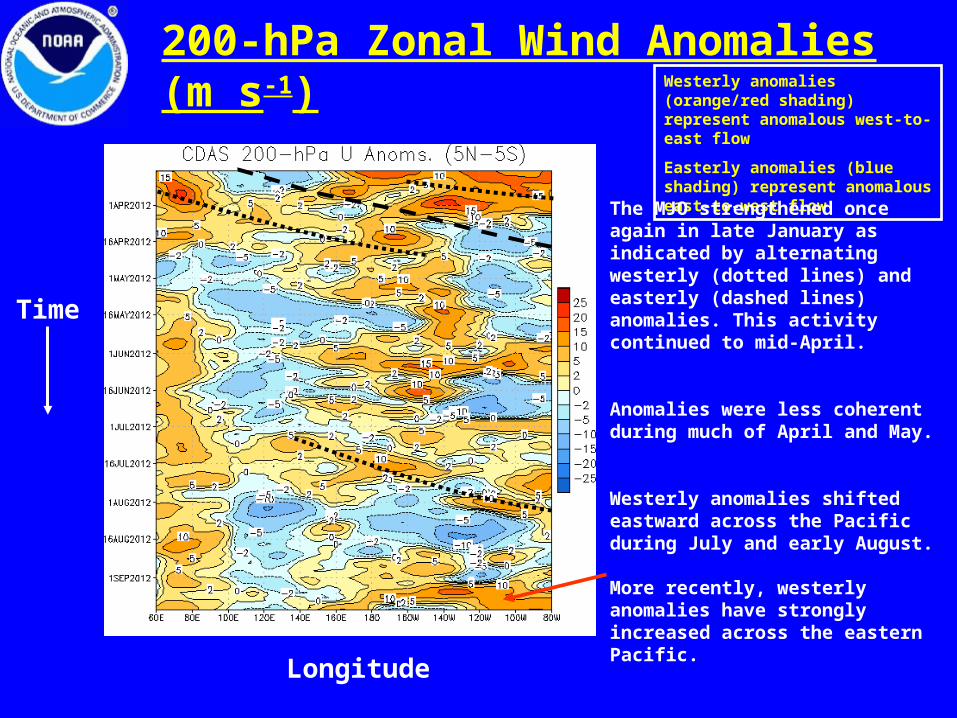
200-hPa Zonal Wind Anomalies (m s-1)Westerly anomalies (orange/red shading) represent anomalous west-to-east flow
Easterly anomalies (blue shading) represent anomalous east-to-west flow
The MJO strengthened once again in late January as indicated by alternating westerly (dotted lines) and easterly (dashed lines) anomalies. This activity continued to mid-April.
Anomalies were less coherent during much of April and May.
Westerly anomalies shifted eastward across the Pacific during July and early August.
More recently, westerly anomalies have strongly increased across the eastern Pacific.
Time
Longitude
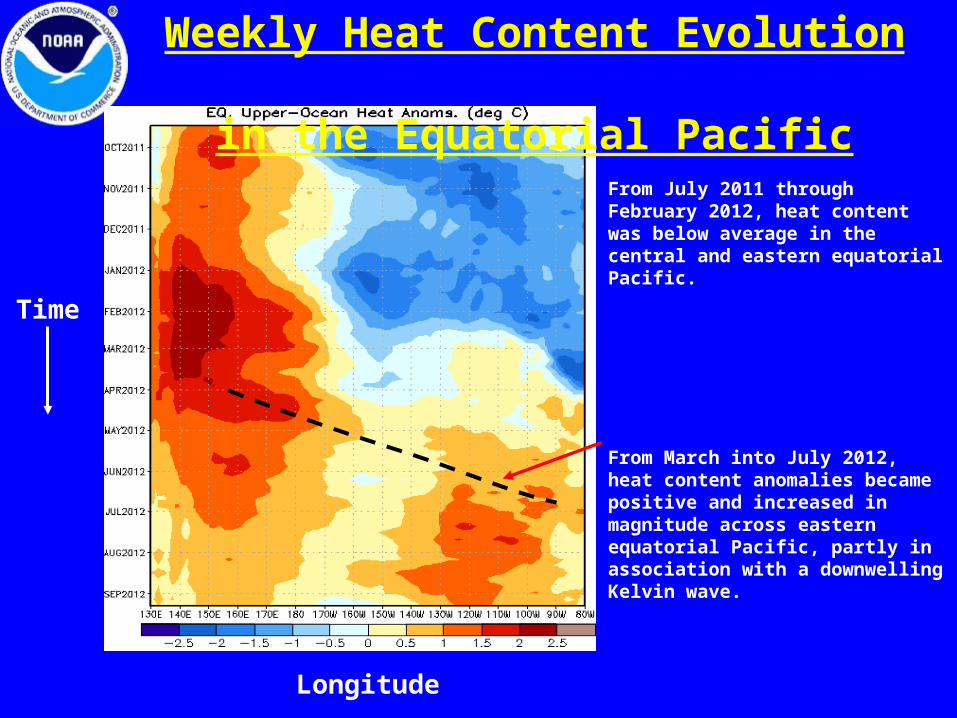
Weekly Heat Content Evolution in the Equatorial Pacific
Time
Longitude
From July 2011 through February 2012, heat content was below average in the central and eastern equatorial Pacific.
From March into July 2012, heat content anomalies became positive and increased in magnitude across eastern equatorial Pacific, partly in association with a downwelling Kelvin wave.
MJO Index -- Information
• The MJO index illustrated on the next several slides is the CPC version of the Wheeler and Hendon index (2004, hereafter WH2004).
Wheeler M. and H. Hendon, 2004: An All-Season Real-Time Multivariate MJO Index: Development of an Index for Monitoring and Prediction, Monthly Weather Review, 132, 1917-1932.
• The methodology is very similar to that described in WH2004 but does not include the linear removal of ENSO variability associated with a sea surface temperature index. The methodology is consistent with that outlined by the U.S. CLIVAR MJO Working Group.
Gottschalck et al. 2010: A Framework for Assessing Operational Madden-Julian Oscillation Forecasts: A CLIVAR MJO Working Group Project, Bull. Amer. Met. Soc., 91, 1247-1258.
• The index is based on a combined Empirical Orthogonal Function (EOF) analysis using fields of near-equatorially-averaged 850-hPa and 200-hPa zonal wind and outgoing longwave radiation (OLR).
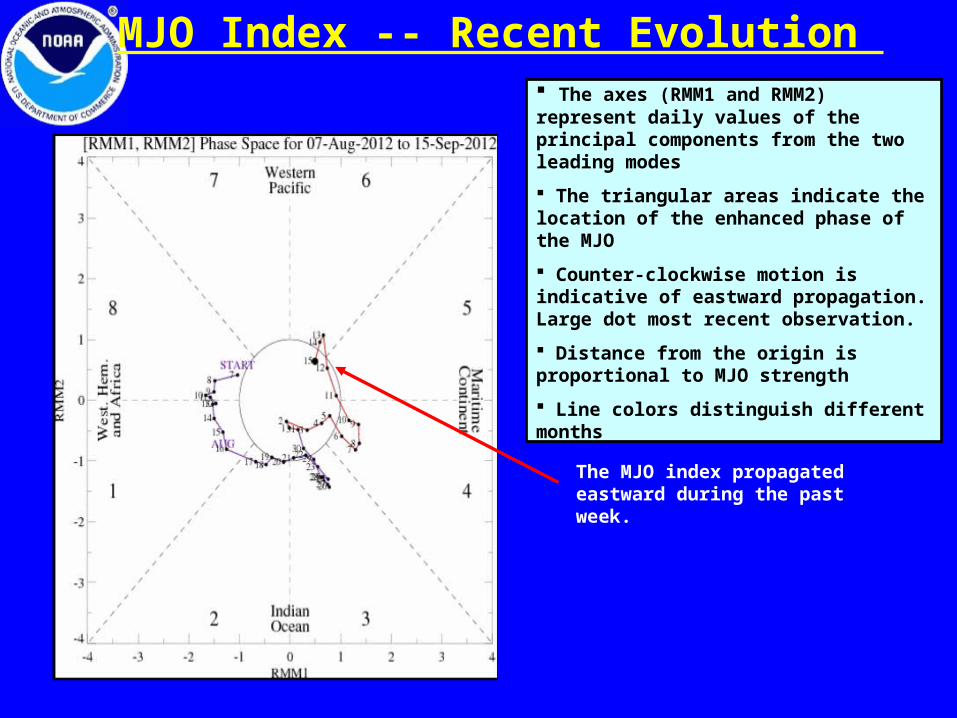
MJO Index -- Recent Evolution
The MJO index propagated eastward during the past week.
The axes (RMM1 and RMM2) represent daily values of the principal components from the two leading modes
The triangular areas indicate the location of the enhanced phase of the MJO
Counter-clockwise motion is indicative of eastward propagation. Large dot most recent observation.
Distance from the origin is proportional to MJO strength
Line colors distinguish different months
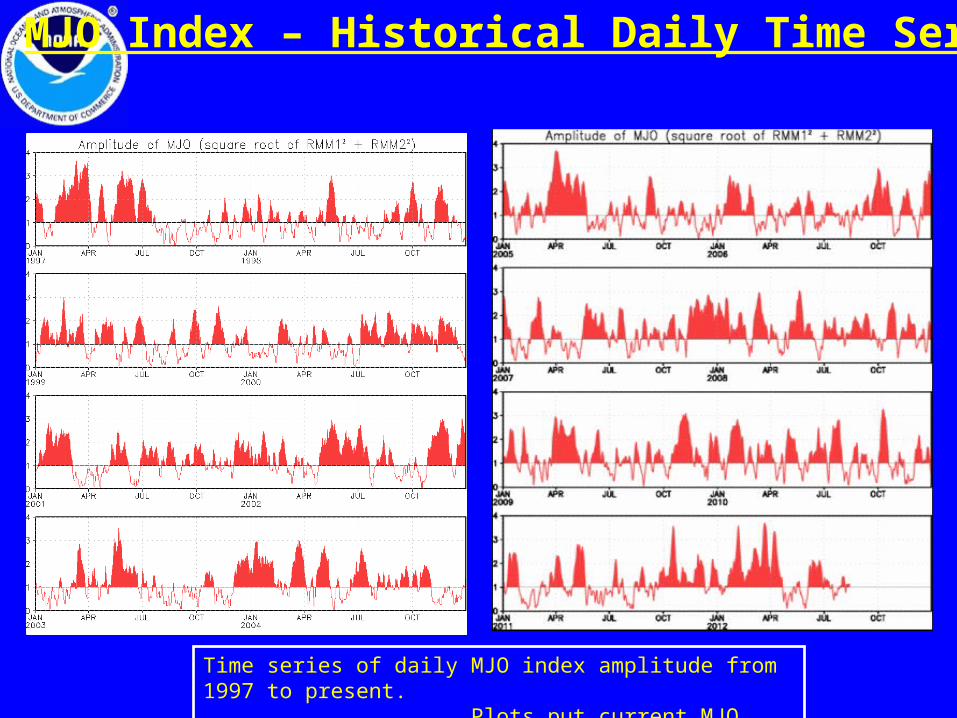
MJO Index – Historical Daily Time Series
Time series of daily MJO index amplitude from 1997 to present. Plots put current MJO activity in historical context.

Ensemble GFS (GEFS) MJO Forecast
RMM1 and RMM2 values for the most recent 40 days and forecasts from the ensemble Global Forecast System (GEFS) for the next 15 days
light gray shading: 90% of forecasts dark gray shading: 50% of forecasts
Yellow Lines – 20 Individual Members Green Line – Ensemble Mean
The ensemble GFS forecasts the MJO signal to remain generally weak with only minor eastward propagation during the next two weeks.
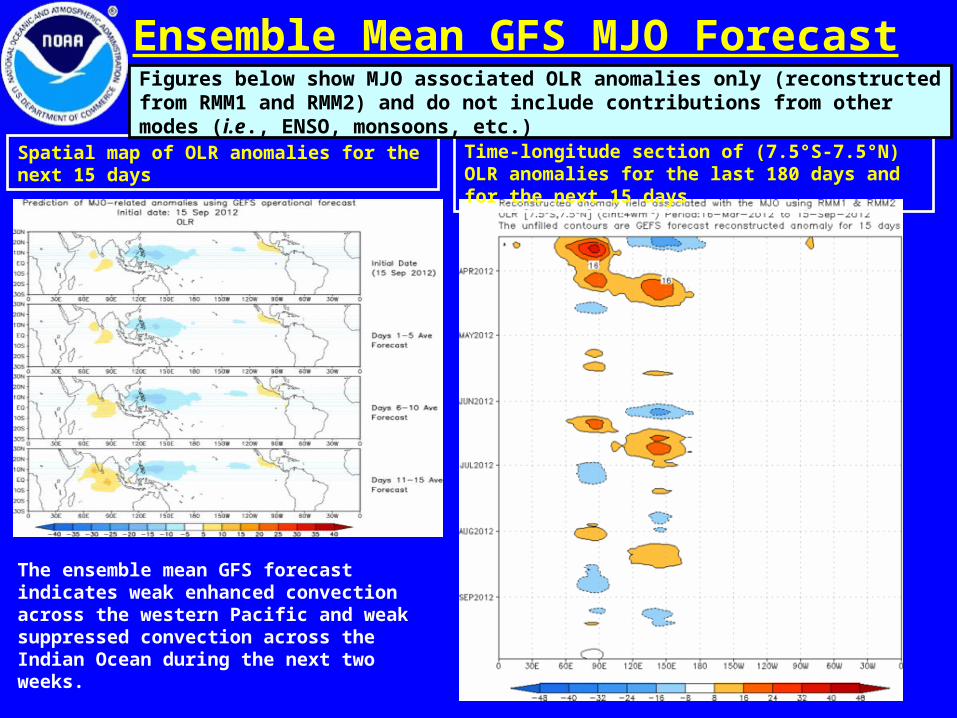
The ensemble mean GFS forecast indicates weak enhanced convection across the western Pacific and weak suppressed convection across the Indian Ocean during the next two weeks.
Ensemble Mean GFS MJO Forecast
Spatial map of OLR anomalies for the next 15 days Time-longitude section of (7.5°S-7.5°N) OLR anomalies for the last 180 days and for the next 15 days
Figures below show MJO associated OLR anomalies only (reconstructed from RMM1 and RMM2) and do not include contributions from other modes (i.e., ENSO, monsoons, etc.)
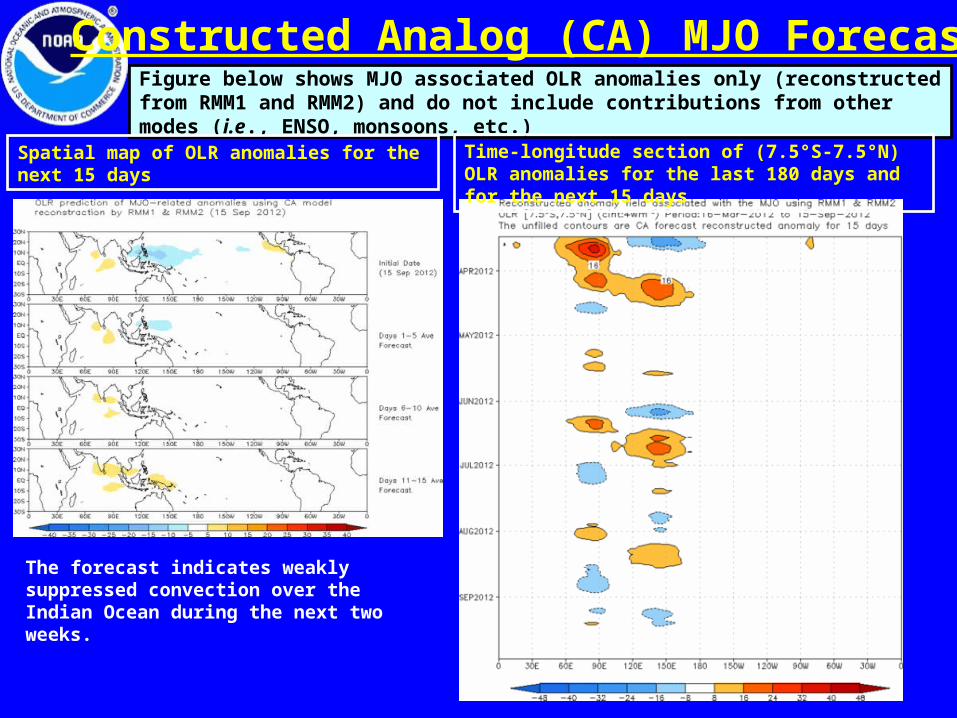
Constructed Analog (CA) MJO ForecastFigure below shows MJO associated OLR anomalies only (reconstructed from RMM1 and RMM2) and do not include contributions from other modes (i.e., ENSO, monsoons, etc.)
Spatial map of OLR anomalies for the next 15 days Time-longitude section of (7.5°S-7.5°N) OLR anomalies for the last 180 days and for the next 15 days
The forecast indicates weakly suppressed convection over the Indian Ocean during the next two weeks.
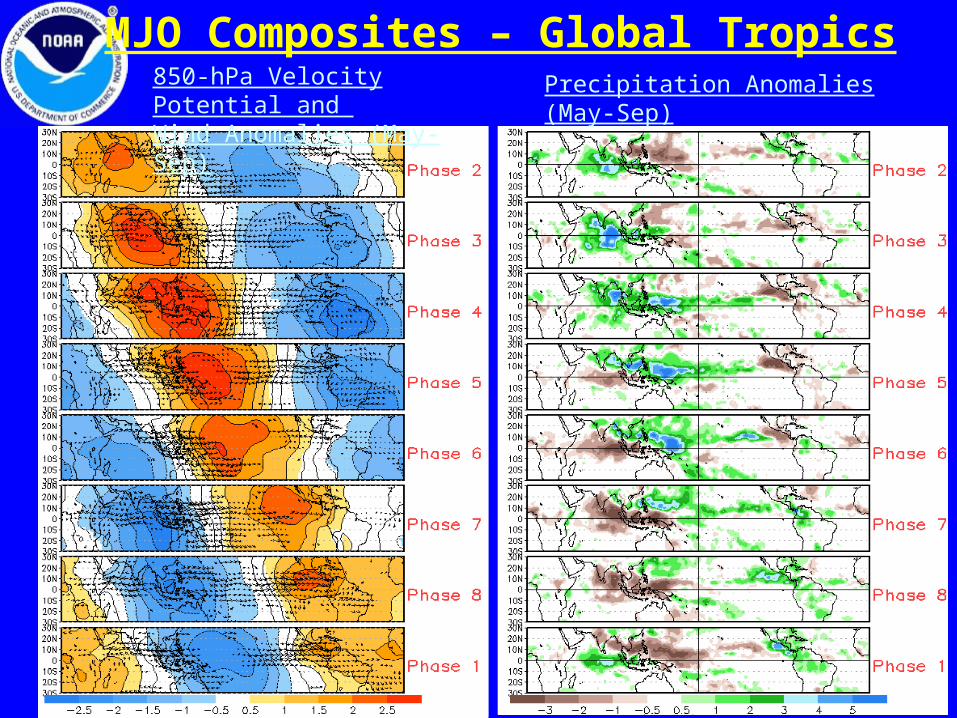
MJO Composites – Global TropicsPrecipitation Anomalies (May-Sep)850-hPa Velocity Potential and
Wind Anomalies (May-Sep)
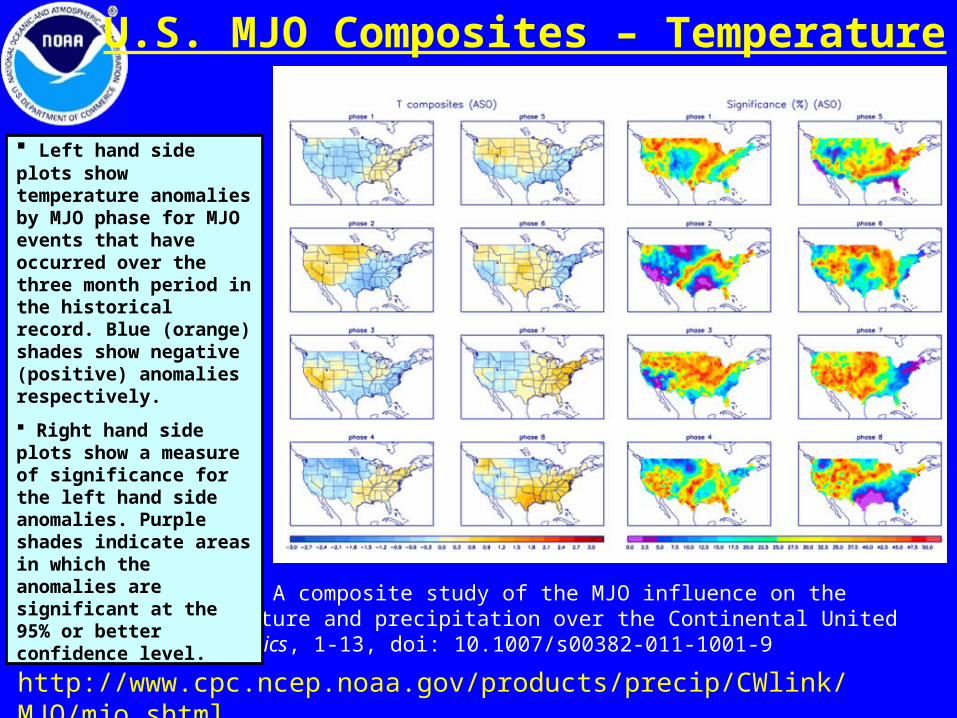
U.S. MJO Composites – Temperature
Zhou et al. (2011): A composite study of the MJO influence on the surface air temperature and precipitation over the Continental United States, Climate Dynamics, 1-13, doi: 10.1007/s00382-011-1001-9
http://www.cpc.ncep.noaa.gov/products/precip/CWlink/MJO/mjo.shtml
Left hand side plots show temperature anomalies by MJO phase for MJO events that have occurred over the three month period in the historical record. Blue (orange) shades show negative (positive) anomalies respectively.
Right hand side plots show a measure of significance for the left hand side anomalies. Purple shades indicate areas in which the anomalies are significant at the 95% or better confidence level.
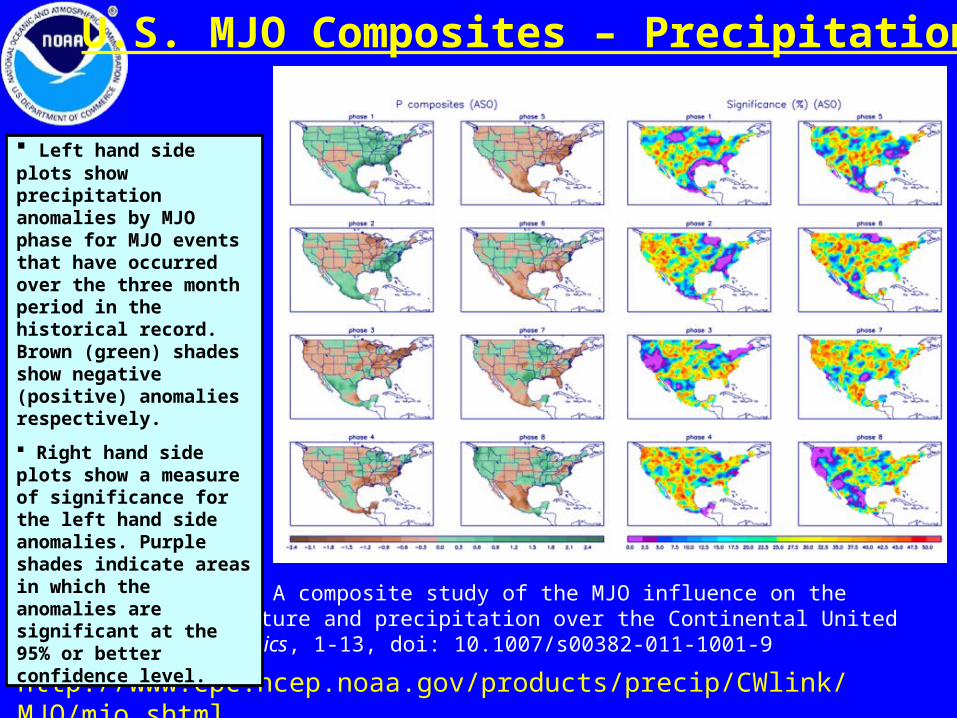
U.S. MJO Composites – Precipitation
Zhou et al. (2011): A composite study of the MJO influence on the surface air temperature and precipitation over the Continental United States, Climate Dynamics, 1-13, doi: 10.1007/s00382-011-1001-9
http://www.cpc.ncep.noaa.gov/products/precip/CWlink/MJO/mjo.shtml
Left hand side plots show precipitation anomalies by MJO phase for MJO events that have occurred over the three month period in the historical record. Brown (green) shades show negative (positive) anomalies respectively.
Right hand side plots show a measure of significance for the left hand side anomalies. Purple shades indicate areas in which the anomalies are significant at the 95% or better confidence level.