Macrodebris and microplastics from beaches in Slovenia - VLIZ · Macrodebris and microplastics from...
11
Macrodebris and microplastics from beaches in Slovenia Betty J.L. Laglbauer a,⇑ , Rita Melo Franco-Santos a,b , Miguel Andreu-Cazenave a,c , Lisa Brunelli a , Maria Papadatou a , Andreja Palatinus d , Mateja Grego e , Tim Deprez a a Ghent University, Marine Biology Research Group, Krijgslaan 281/S8, B-9000 Ghent, Belgium b Center for Marine Studies, Universidade Federal do Paraná (UFPR), Av. Beira Mar, Caixa Postal 61, Pontal do Paraná, PR 83.255-976, Brazil c Centro de Conservación Marina, Estación Costera de Investigaciones Marinas, Departamento de Ecología, Facultad de Ciencias Biológicas, Pontificia Universidad Católica de Chile, Av. Libertador Bernardo O’Higgins 340, C.P 6513667, Chile d Institute for Water of the Republic of Slovenia, Hajdrihova 28 c, SI-1000 Ljubljana, Slovenia e National Institute of Biology – Marine Biology Station of Piran, Fornace 41, 6330 Piran, Slovenia article info Article history: Available online 22 October 2014 Keywords: Marine debris Plastic Pollution Tourism Human-impact Adriatic abstract The amount of marine debris in the environment is increasing worldwide, which results in an array of negative effects to biota. This study provides the first account of macrodebris on the beach and microplas- tics in the sediment (shoreline and infralittoral) in relation to tourism activities in Slovenia. The study assessed the quality and quantity of macrodebris and the quality, size and quantity of microplastics at six beaches, contrasting those under the influences of tourism and those that were not. Beach cleanliness was estimated using the Clean Coast Index. Tourism did not seem to have an effect on macrodebris or microplastic quantity at beaches. Over 64% of macrodebris was plastic, and microplastics were ubiqui- tous, which calls for classification of plastics as hazardous materials. Standard measures for marine debris assessment are needed, especially in the form of an all-encompassing debris index. Recommendations for future assessments are provided for the Adriatic region. Ó 2014 Elsevier Ltd. All rights reserved. 1. Introduction Global population is expected to reach 9.5 billion people by 2050, with the highest growth registered in developing nations (UN/DESA, 2014). It is likely that there will also be an increase in the demand for disposable consumables – the annual plastic pro- duction in 2011, for example, was 280 million tons, more than 186 times the amount produced in the 1950s (Depledge et al., 2013). An estimated ten percent of this accumulates as persistent plastic debris in the ocean (Barnes, 2002; Derraik, 2002; Thompson et al., 2009b), converging to mid-ocean sub-tropical gyres (Kaiser, 2010; Kershaw et al., 2011). In 2010, the North Paci- fic gyre contained more than double the amount of marine debris (750.000 pieces km 2 ) detected nine years earlier (330.000 pieces km 2 )(Moore et al., 2001; Boerger et al., 2010). Microplastic (plastic particles < 5 mm) convergence zones have also been observed in the South Pacific and in the North Atlantic (Law et al., 2010; Eriksen et al., 2013). In the North Pacific and in the South Atlantic, larger plastic debris accumulate to form giant ‘gar- bage patches’ (Pichel et al., 2007; Ryan, 2013), reinforcing the idea that marine debris is a global issue that needs to be addressed urgently (Barnes et al., 2009; Kershaw et al., 2011; Depledge et al., 2013). Ocean currents spread large amounts of debris from industrial- ized and densely populated areas to even the most remote and unpopulated coastal regions (McDermid and McMullen, 2004; Barnes et al., 2009; Santos et al., 2009; Hirai et al., 2011). Yet, only a few of the main sources and sinks of marine debris have been identified worldwide (Ryan et al., 2009; Browne et al., 2011). In an effort to counter this issue, current studies aim to assess the glo- bal (coastal and offshore) distribution of the two main categories: macrodebris (size > 5 cm) and microplastics (Thompson et al., 2004; UNEP, 2005; Claessens et al., 2011; Collignon et al., 2012; Van Cauwenberghe et al., 2013). In Europe, this knowledge will help countries to conform to the Marine Strategy Framework Directive and achieve ‘good environmental status’ by 2020 (Galgani et al., 2010). Marine debris is defined as any persistent, man-made solid waste discarded into the marine environment (Galgani et al., 2010; CBD, 2012). Most of it is made of plastic (Barnes et al., 2009) that originates from both land- and ocean-based sources, and which interacts with at least 663 species worldwide (CBD, 2012). Plastics foster a myriad of negative effects on marine organ- isms, such as entanglement, intestinal blockage, suffocating, http://dx.doi.org/10.1016/j.marpolbul.2014.09.036 0025-326X/Ó 2014 Elsevier Ltd. All rights reserved. ⇑ Corresponding author. Tel.: +351 91 23 44 175. E-mail address: [email protected] (B.J.L. Laglbauer). Marine Pollution Bulletin 89 (2014) 356–366 Contents lists available at ScienceDirect Marine Pollution Bulletin journal homepage: www.elsevier.com/locate/marpolbul
Transcript of Macrodebris and microplastics from beaches in Slovenia - VLIZ · Macrodebris and microplastics from...

Marine Pollution Bulletin 89 (2014) 356–366
Contents lists available at ScienceDirect
Marine Pollution Bulletin
journal homepage: www.elsevier .com/locate /marpolbul
Macrodebris and microplastics from beaches in Slovenia
http://dx.doi.org/10.1016/j.marpolbul.2014.09.0360025-326X/� 2014 Elsevier Ltd. All rights reserved.
⇑ Corresponding author. Tel.: +351 91 23 44 175.E-mail address: [email protected] (B.J.L. Laglbauer).
Betty J.L. Laglbauer a,⇑, Rita Melo Franco-Santos a,b, Miguel Andreu-Cazenave a,c, Lisa Brunelli a,Maria Papadatou a, Andreja Palatinus d, Mateja Grego e, Tim Deprez a
a Ghent University, Marine Biology Research Group, Krijgslaan 281/S8, B-9000 Ghent, Belgiumb Center for Marine Studies, Universidade Federal do Paraná (UFPR), Av. Beira Mar, Caixa Postal 61, Pontal do Paraná, PR 83.255-976, Brazilc Centro de Conservación Marina, Estación Costera de Investigaciones Marinas, Departamento de Ecología, Facultad de Ciencias Biológicas, Pontificia Universidad Católica de Chile,Av. Libertador Bernardo O’Higgins 340, C.P 6513667, Chiled Institute for Water of the Republic of Slovenia, Hajdrihova 28 c, SI-1000 Ljubljana, Sloveniae National Institute of Biology – Marine Biology Station of Piran, Fornace 41, 6330 Piran, Slovenia
a r t i c l e i n f o
Article history:Available online 22 October 2014
Keywords:Marine debrisPlasticPollutionTourismHuman-impactAdriatic
a b s t r a c t
The amount of marine debris in the environment is increasing worldwide, which results in an array ofnegative effects to biota. This study provides the first account of macrodebris on the beach and microplas-tics in the sediment (shoreline and infralittoral) in relation to tourism activities in Slovenia. The studyassessed the quality and quantity of macrodebris and the quality, size and quantity of microplastics atsix beaches, contrasting those under the influences of tourism and those that were not. Beach cleanlinesswas estimated using the Clean Coast Index. Tourism did not seem to have an effect on macrodebris ormicroplastic quantity at beaches. Over 64% of macrodebris was plastic, and microplastics were ubiqui-tous, which calls for classification of plastics as hazardous materials. Standard measures for marine debrisassessment are needed, especially in the form of an all-encompassing debris index. Recommendations forfuture assessments are provided for the Adriatic region.
� 2014 Elsevier Ltd. All rights reserved.
1. Introduction
Global population is expected to reach 9.5 billion people by2050, with the highest growth registered in developing nations(UN/DESA, 2014). It is likely that there will also be an increase inthe demand for disposable consumables – the annual plastic pro-duction in 2011, for example, was 280 million tons, more than186 times the amount produced in the 1950s (Depledge et al.,2013). An estimated ten percent of this accumulates as persistentplastic debris in the ocean (Barnes, 2002; Derraik, 2002;Thompson et al., 2009b), converging to mid-ocean sub-tropicalgyres (Kaiser, 2010; Kershaw et al., 2011). In 2010, the North Paci-fic gyre contained more than double the amount of marine debris(750.000 pieces km�2) detected nine years earlier (330.000pieces km�2) (Moore et al., 2001; Boerger et al., 2010). Microplastic(plastic particles < 5 mm) convergence zones have also beenobserved in the South Pacific and in the North Atlantic (Lawet al., 2010; Eriksen et al., 2013). In the North Pacific and in theSouth Atlantic, larger plastic debris accumulate to form giant ‘gar-bage patches’ (Pichel et al., 2007; Ryan, 2013), reinforcing the idea
that marine debris is a global issue that needs to be addressedurgently (Barnes et al., 2009; Kershaw et al., 2011; Depledgeet al., 2013).
Ocean currents spread large amounts of debris from industrial-ized and densely populated areas to even the most remote andunpopulated coastal regions (McDermid and McMullen, 2004;Barnes et al., 2009; Santos et al., 2009; Hirai et al., 2011). Yet, onlya few of the main sources and sinks of marine debris have beenidentified worldwide (Ryan et al., 2009; Browne et al., 2011). Inan effort to counter this issue, current studies aim to assess the glo-bal (coastal and offshore) distribution of the two main categories:macrodebris (size > 5 cm) and microplastics (Thompson et al.,2004; UNEP, 2005; Claessens et al., 2011; Collignon et al., 2012;Van Cauwenberghe et al., 2013). In Europe, this knowledge willhelp countries to conform to the Marine Strategy FrameworkDirective and achieve ‘good environmental status’ by 2020(Galgani et al., 2010).
Marine debris is defined as any persistent, man-made solidwaste discarded into the marine environment (Galgani et al.,2010; CBD, 2012). Most of it is made of plastic (Barnes et al.,2009) that originates from both land- and ocean-based sources,and which interacts with at least 663 species worldwide (CBD,2012). Plastics foster a myriad of negative effects on marine organ-isms, such as entanglement, intestinal blockage, suffocating,

B.J.L. Laglbauer et al. / Marine Pollution Bulletin 89 (2014) 356–366 357
smothering, and ghost fishing (Gregory, 2009). These further causenegative physiological effects, lower fitness, reproductive failure,changes in community structure, and death (Spear et al., 1995;Barnes, 2002; Derraik, 2002). Approximately 370 species have beenfound entangled in or having ingested marine debris worldwide(CBD, 2012; Galgani et al., 2013). For example, all seven speciesof marine turtles, at least 14 cetacean species, 20 pinniped species,and 56 marine or coastal bird species have been found entangled inplastics worldwide (Katsanevakis, 2008). Additionally, marinebirds are known to ingest considerable amounts of plastic andaccumulate plastic-derived chemicals in their tissues (Tanakaet al., 2013; Acampora et al., 2014).
Microplastics were first detected in the North Atlantic four dec-ades ago (Carpenter and Smith, 1972). They are minute fragmentsof plastic debris, which are divided into small (<1 mm in diameter)and large (1–5 mm in diameter) particles (Gregory and Andrady,2003; Betts, 2008; Moore, 2008; Fendall and Sewell, 2009; Imhofet al., 2012). Microplastics consist of nylon, polyester, acrylic, poly-propylene, polyethylene, poly(ethylene–propylene), polyvinylchloride, polyvinyl alcohol, polystyrene, polyester, polyurethane,polyacrylonitrile, alkyd, alkyd resin, and polyamide fibers, thoughtheir main component is usually synthetic polymer(s) (Barneset al., 2009; Leslie et al., 2011; Vianello et al., 2013). Degradationprocesses of plastics are extremely slow, such that particles persistfor very long periods of time in the marine environment (Hidalgo-Ruz et al., 2012) and become readily available to biota. Microplasticingestion has been observed in a wide range of marine taxa, includ-ing crustaceans, molluscs, fish, birds, and mammals (Thompsonet al., 2009a; Fossi et al., 2012; Lusher et al., 2013; Wright et al.,2013; Watts et al., 2014), and can result in a wide range of negativeeffects, such as blockage of the intestinal tract and abrasion insmall organisms (similarly to the effects of macroplastics in largebiota) (Wright et al., 2013). Microplastic ingestion could also dis-rupt the endocrine and reproductive systems, diminish energyrates, and increase toxic load in smaller organisms (Galgani et al.,2010). Moreover, these particles are incorporated into marine foodwebs (Farrell and Nelson, 2013; Setälä et al., 2014) and provide asubstrate for leached contaminants, which could also bioaccumu-late (Teuten et al., 2009).
Tangible damages to humans caused by marine debris are diffi-cult to estimate. The tourism industry, for example, faces monetaryloss due to both a decrease in activity on polluted beaches and thecosts of beach cleaning (Sheavly and Register, 2007; Jang et al.,2014). Beachgoer safety issues arise from broken glass, medicalwaste, fishing lines, discarded syringes, and possibly from bacterialcontamination of discarded hygiene waste (Sheavly and Register,2007). On the other hand, fishermen face propeller entanglement,damage to fishing gear, and time losses due to gear cleaning as aresult of macroplastic pollution (Nash, 1992; van Franeker et al.,2005). It is still uncertain, though, whether marine debris canreduce fish quality through debris ingestion or tainting (vanFraneker et al., 2005). Moreover, indirect economic impacts resultfrom the degradation of the marine environment. An increase intourism may enhance debris accumulation in the Adriatic Sea,which already faces a dense concentration of debris in the seafloor(Galgani et al., 2000). In the case of Slovenia, the amounts andtypes of debris found along the 46.7 km appear to be different (Pal-atinus, pers. comm.), suggesting that human populations may havedistinct impacts in each beach location.
The present study assessed (1) the quality and quantity of mac-rodebris, and (2) the quality, size and quantity of microplastics onbeaches in Slovenia, contrasting those which were under the influ-ences of tourism (touristic, T) and those that were not (non-touris-tic, NT). Finally, it assessed the cleanliness of Slovenian beachesusing the Clean Coast Index (Alkalay et al., 2007). The results pro-vide the first assessment of macrodebris at the beach and micro-
plastics in the sediment in relation to tourism activities along thecoast of Slovenia.
2. Methods
2.1. Study area
Slovenian tourism has increased by 160% in the last fifteenyears, and the country welcomed approximately three milliontourists in 2011 (Maja Pak, Director of Slovenian Tourist Board,pers. comm.). The present study took place during the peak ofthe tourist season, in July 2012. Point samples were collected atsix beaches along the Slovenian coast (Fig. 1A), Debeli Rtic (T1),Jadranska (NT1), Simonov Zaliv (T2⁄), Bele Skale (NT2), Portoroz(T3⁄), and Seca (NT3). Sampling sites were chosen based on thelevel of urbanisation and human presence, such that areas of highurbanisation and flux were considered as touristic (T1, T2⁄, andT3⁄) and those with limited (or absence of) urbanisation and visitas non-touristic (NT1, NT2, and NT3).
The Slovenian coast is part of the Gulf of Trieste, which is a shal-low (20 m depth), semi-enclosed basin with horizontal bathymetryon its southern part (Malacic et al., 2012). Four rivers contribute tofresh water input to the Gulf, two in Italy (Isonzo and Timavo), onein the proximity of Koper (Rizana), and the other further south, inSeca (Dragonja), shown in Fig. 1B.
2.2. Macrodebris
2.2.1. SamplingBeaches are cleaned on a monthly basis in Slovenia, though two
of the three touristic ones, Portoroz (T2⁄) and Simonov Zaliv (T3⁄),were cleaned daily (represented by the symbol ‘‘⁄’’) throughout thesummer at 6 a.m. In order to account for this and to estimate themacroplastics accumulated in the last 24 h, sampling was per-formed before the beach cleanup (5 a.m.). One 50-m transect wasplaced randomly along the beach, parallel to the shoreline. All deb-ris P2 cm was collected in the area ranging from the shoreline tothe upper beach limit (determined by the presence of vegetation,dunes, or rocks) within the 50-m transect, as shown in Fig. 2. Sam-pling was performed according to the operational guidelines forrapid beach debris assessment described by Cheshire et al. (2009).
2.2.2. AnalysisParticles were classified in relation to 59 categories and 8 major
groups (according to a combination of the approaches used byCheshire et al., 2009 and Palatinus, pers. comm.), counted, andweighed (only major groups). Cigarette filters were analysed sepa-rately from other plastic items due to the high relevance of this cat-egory to infer the land-based origin of the debris (Oigman-Pszczoland Creed, 2007). Macrodebris quantity (count and weight) wasextrapolated for six of the debris categories (Table 1) for the twobeaches with daily cleaning (Portoroz – T2⁄ and Simonov Zaliv –T3⁄), in order to compare with that of beaches cleaned monthly.The extrapolation was possible because the date of last monthlycleaning event of all beaches was known (June 26th, 2012) andbecause the Slovenian local authorities recorded the quality andestimated quantity (count and weight) of macrodebris collecteddaily at Portoroz (T2⁄) and Simonov Zaliv (T3⁄) during weekdaysand weekends in July 2012. Extrapolation values were obtainedwith the equation:
Extrapolated macrodebris quantity
¼ sampled quantityþ ðestimated quantity per weekday � TwÞþ ðestimated quantity per weekend day � Tw-eÞ

Fig. 1. (A) Location of sampling sites with indication of the major cities (Koper, Izola and Portoroz) and rivers (Rizana and Dragonja) along the Slovenian coast. Black andwhite dots represent touristic and non-touristic beaches, respectively. T1: Debeli Rtic; NT1: Jadranska; T2⁄: Simonov Zaliv; NT2: Bele Skale; T3⁄: Portoroz; NT3: Seca. B: Mainfreshwater input (rivers Isonzo, Timavo, Rizana and Dragonja) in the Gulf of Trieste is represented in blue. Adapted from Turk et al. (2010).
Fig. 2. Macrodebris sampling scheme, which comprised the area between theshoreline and upper beach limit along the 50-m transect.
358 B.J.L. Laglbauer et al. / Marine Pollution Bulletin 89 (2014) 356–366
where the sampled quantity is the macrodebris count recorded inthe present study; estimated quantity per week and weekend dayis that recorded by Slovenian authorities; Tw is the number ofweekdays from the last cleaning event (26th June) to the day beforesampling (12th July 2012, for Portoroz – T2⁄ and Simonov Zaliv –T3⁄); and Tw-e is the number of weekend days in that period.
Beach cleanliness was assessed with the Clean Coast Index (CCI)(Alkalay et al., 2007). The CCI was obtained by applying theequation.
CCI ¼ ðTotal plastic parts on transect=Total area of transectÞ � k
where the CCI is the number of plastic items m�2, the total area oftransect is the product of the transect length and width, and k (con-stant) = 20. Beaches were classified from clean to extremely dirtyaccording to the scale provided for the number of plastic particleson the coast (Table 2).
2.3. Microplastics
2.3.1. SamplingSediment samples were obtained from the centre of the 50-m
transect line used for macroplastic sampling (i.e., � at the 25-mmark) by randomly placing three 25-cm2 quadrats within (each)the shoreline (SHORE – between the high and low tide marks)and infralittoral (INFRA – a 10 m distance perpendicular to theshoreline) zones (Fig. 3). SHORE samples were extracted from thefirst 5 cm of sediment below each quadrat using a metal spatula(Thompson et al., 2004); while INFRA samples were extracted usinga 500 mL corer used in a horizontal, circular motion, in order to pre-vent re-suspension of particles. All samples were placed in plasticbags and stored at ambient temperature for further analysis.
2.3.2. AnalysisThe protocol for microplastic extraction from sediments pro-
vided by Thompson et al. (2004) was adapted in order to accountfor varying types of sediments at the sampling locations, and com-bined decantation (in a 1.2 kg L�1 NaCl solution) and inverse filtra-tion (through a 250-lm sieve to separate particles by density andby size). Samples were pooled (3 per each beach for SHORE andINFRA) onto aluminium foil and dried for 24 h at 60�, after which150 g were placed in a 500 mL high saline concentration solution(360 g NaCl L�1) before undergoing a two-step decantation. Thesolution was manually shaken twice for two minutes before leav-ing it to rest for 30 min. The two subsequent supernatants werepoured into a glass beaker and washed through a 250-lm sieve.Particles were recovered on a glass Petri dish using a 100 mL washbottle. In order to isolate microplastics, six subsamples of 2.5 mLeach were examined under a light microscope. The microplasticparticles were isolated on another Petri dish and further examinedunder an Olympus SZX16 imaging microscope (DP-Soft software).Pictures of the particles were taken for further measurement usingImageJ software (ver. 2.0.0), and classified into four types(Claessens et al. 2011), according to their shape (fibres, granules,plastic films, plastic fragments).
2.4. Statistical analyses
Statistical analyses of macrodebris and microplastics data wereperformed using multidimensional scaling (MDS) in Primer v6(Clarke and Gorley, 2006). Data were log-transformed (logX + 1)before a Bray–Curtis similarity matrix was computed. Macrodebrisquality and quantity (by count and by weight) was comparedbetween beaches (T, NT) within 59 categories across eight majorgroups. Microplastic quantity was also compared between beaches(T, NT) and littoral zones (SHORE, INFRA) across four categories.
3. Results
3.1. Macroplastics
3.1.1. QualityA total of 5870 macrodebris items were classified into 59 cate-
gories and eight major groups (Table 2). The majority (64%) was

Table 1Macrodebris classification system for Slovenia. Amount of macrodebris per each of the 59 categories and eight major groups on a 50 m-transect at six beaches. Empty spacesrepresent zero items.
Debeli Rtic (T1) Simonov Zaliv (T2⁄) Portoroz (T3⁄) Jadran-ska (NT1) Bele Skale (NT2) Seca (NT3)
PlasticsCaps and lids 12 63a (13b) 68a (18b) 2 14 4Lolly sticks, cutlery, cups 12 323a (23b) 329a (29b) 2 16 1Drink bottles < 1 l 1 50a (0b) 14a (4b)Drink bottles > 1 l 2 50a (0b) 94a (4b) 1Straws 1 8 2 5Packaging for food 21 27 21 6 34 10Bags 26 2 1 3 6 2Toys & party poppers 3 15 5Cigarette lighter 3Cigarette filter 162 1012 347 144 8 15Syringes 1Mussel bags + pieces 1 2 8 2 1Monofilament line 2 6 2Cotton bud sticks 27 15 2 13Shipping lines 15Fishing ropes, string, cord 3 5 2 5 14 1Cosmetics packaging 1 1Fishing net floats 1Foam (pieces) 3 13 1 6 19 3Styrofoam pieces 19 6 10 118 6Plastic pieces (unrecognizable) 28 94 64 13 69 25Jerry cans 67Masking tape 2 2 2Condoms + packaging 1Packaging for tissues 1Tampons + applicators 1Panty liners + packaging 1 1 1 4 2Construction waste 2Cigarette box 7 21 10 10 11Buckets, flower pots 5Pens 1 1Biomass holder 1 1Other 1 24 2 3 3 2
Total 336 1724 973 226 433 72
RubberBalloons, balls, toys 2 15 1 2 1Shoes 1 3Gummies 1 16 3 2 1Other pieces 5 5 1 1 2 1
Total 9 36 2 6 5 5
ClothClothing, shoes, hats, towels 3 4 2Ropes 2 1 1 5 1Other 3 6 6 11
Total 8 7 7 20 3
Glass/ceramicsPieces 264 19 25 87 23 47Bottles, glasses 20a (0b) 52a (2b)Plates, pots (cups) 50 1 1 1Construction material 8 3 59
Total 322 39 80 88 24 107
Paper/cardboardCardboard (pieces, boxes) 1 2 1Paper (incl. magazines) 1Other (pieces) 7 526a (26b) 591a(91b) 7 2 2
Total 7 528 593 8 2 2
MetalCaps, can lids 1 26 7 6 1Drink cans 2 11a (1b) 13a (3a) 2 1Aluminium wrapping 3 20 3 7 2 1Pieces 4 3 1 3 1Wire, barbed wire 6Construction 9 2 5Other 2 1
(continued on next page)
B.J.L. Laglbauer et al. / Marine Pollution Bulletin 89 (2014) 356–366 359

Table 1 (continued)
Debeli Rtic (T1) Simonov Zaliv (T2⁄) Portoroz (T3⁄) Jadran-ska (NT1) Bele Skale (NT2) Seca (NT3)
Total 19 60 24 18 6 16
Wood (machined)Cork 2 1 1Ice lolly sticks 1 10 2 1Matches, fireworks 1Other 1 1
Total 3 11 4 2 1
OtherMedical waste (container) 16 9 8 1
Total 0 16 9 8 1 0
a Extrapolated data.b Count.
Table 2Clean Coast Index. Values, grades and visual assessment of the Clean Coast Index(Alkalay et al., 2007).
Value Grade Visual assessment
0–2 Very clean No debris is seen2–5 Clean No debris is seen over a large area5–10 Moderate A few pieces of debris can be detected10–20 Dirty A lot of debris on the shore20+ Extremely dirty Most of the beach is covered with plastic
Fig. 3. Microplastics sampling scheme. Shoreline (SHORE) samples were collectedbetween the high and low tide marks, at the centre of the 50-m transect line usedfor macroplastic sampling. Infralittoral (INFRA) samples were collected at a 10 mdistance perpendicular to the shoreline.
360 B.J.L. Laglbauer et al. / Marine Pollution Bulletin 89 (2014) 356–366
made of plastic, a category generally dominant within beaches(Fig. 4). Paper was the second most abundant group at beaches(19%), followed by glass and ceramics (11%), metal (2%), and rubber(1%) (Fig. 4). Seca (NT3) and Debeli Rtic (T1) were dominated byglass and ceramics, which accounted for 52.2% and 45.7% of mac-rodebris, respectively (Fig. 4). Cigarette filters accounted for a med-ian of 41.9% of the plastics at beaches. They dominated the plasticgroup in Jadranska (NT1) and Simonov Zaliv (T2⁄), representing63.7% and 58.7% of total plastic items, respectively (Table 2). Thelargest number of cigarette filters, 1012 in one 50 m-transect,was recovered from Simonov Zaliv (T2⁄). Fishing gear density(mussel bags/pieces, monofilament line, shipping line, fishingrope/string, fishing net floats) was higher in Bele Skale (NT2-0.096 items m�2) and Jadranska (NT1-0.069 items m�2), whileother beaches had much lower densities (<0.02 items m�2).
3.1.2. QuantityIn Slovenia, median macrodebris count density was
1.25 items m�2, ranging from 0.81 items m�2 in Seca (NT3) to3.45 items m�2 in Simonov Zaliv (T2⁄). Macrodebris density by
weight was 4.45 g m�2, ranging from 2.84 g m�2 in Bele Skale(NT2) to 19.12 g m�2 in Seca (NT3). The high macrodebris densityby weight in Seca (NT3) was due to the high proportion of glassand ceramics in this location (Figs. 4 and 5). The MDS revealed thatmacrodebris quantity (Fig. 5A) and weight (Fig. 5B) did not varydepending on the level of human use of beaches when consideringthe 59 categories across the eight major groups. Debeli Rtic (T1)and Jadranska (NT1) were more similar to each other than to otherbeaches in terms of macrodebris quantity and weight, as wereSimonov Zaliv (T2⁄) and Portoroz (T3⁄) (Fig. 5).
3.1.3. IndexBeaches in close proximity had similar CCI classification. Simo-
nov Zaliv (T2⁄) was the most polluted beach with a CCI grade of49.29, followed by Bele Skale (NT2) with a CCI of 21.92. Both bea-ches ranked as ‘extremely dirty’ (Fig. 6). Three beaches ranked as‘dirty’: Jadranska (NT1), Debeli Rtic (T1), and Portoroz (T3⁄), witha CCI of 15.61, 13.58, and 10.28 respectively (Fig. 6). Seca (NT3),with a CCI grade of 5.67, was the less polluted beach, and rankedas ‘moderate’.
3.2. Microplastics
3.2.1. QualityAll samples but one (Seca-NT3, INFRA) contained microplastic
fibres, which accounted for 96% of the total microplastic concentra-tion in INFRA samples, and 75% in SHORE samples. Fragments werethe second most dominant group (21%) in the shoreline, thoughnone were found in the infralittoral (Fig. 7). INFRA and SHORE sam-ples contained equal proportions of plastic films (4% each) andnone contained granules (Fig. 7). Debeli Rtic (T1-SHORE) had thehighest microplastic diversity and was the only beach that con-tained fibres, films and fragments (Fig. 8).
3.2.2. SizeThe majority of microplastics (74%) was larger than 1 mm
(Fig. 9). If observed on a distribution curve for all size fractions,however, microplastic size was skewed towards the left, with anon-negligible quantity being smaller than 1 mm (Fig. 9). Thesize-fractions with the highest frequency were 0.25–1.0 mm and2.0–3.0 mm (Fig. 9). Median size varied among samples, from0.8 mm in Simonov Zaliv (T2⁄, INFRA) to 3.3 mm in Portoroz (T3⁄,SHORE).
3.2.3. QuantityMedian microplastic density was higher in the infralittoral
(155.6 particles kg�1) than in the shoreline (133.3 particles kg�1)(Table 3). Microplastic concentration was not different between

Fig. 4. Proportion (in% of number of items per m2) of macrodebris of each of eight major groups at each beach.
Fig. 5. (A) Multidimensional scaling (MDS) plot of Bray–Curtis similarities of macrodebris quantity (or units) (log-transformed, items per m�2) within 59 categories acrosseight major groups, at six beaches. (B) MDS plot of Bray–Curtis similarities of macrodebris weight (log-transformed, grams m�2) within eight major groups at six beaches. Redsquares represent touristic beaches, and blue triangles represent non-touristic ones. 2-Dimensional stress is equal to 0. (For interpretation of the references to colour in thisfigure legend, the reader is referred to the web version of this article.)
Fig. 6. Pollution status of six Slovenian beaches according to the Clean Coast Index. T1: Debeli Rtic; NT1: Jadranska; T2⁄: Simonov Zaliv; NT2: Bele Skale; T3⁄: Portoroz; andNT3: Seca.
B.J.L. Laglbauer et al. / Marine Pollution Bulletin 89 (2014) 356–366 361
beaches of distinct level of human use (touristic, non-touristic) orbetween littoral zones (infralittoral, shoreline) when consideringthe three particle types found (Fig. 10A). Samples that only con-tained fibers were clustered together (Fig. 10B). The infralittoral
of Seca (NT3) was very dissimilar to other samples because nofibers were found in this location, only plastic films (Fig. 10A).The shoreline of Debeli Rtic (T1) had the highest particle diversityand the highest quantity of microplastics (444.4 part kg�1), and the

Fig. 7. Percentage distribution (%) of each microplastic type in infralittoral andshoreline sediment samples of Slovenian beaches.
Fig. 8. Images obtained under a microscope of the three types of microplasticsencountered along the coast of Slovenia, fibre (A–C), fragment (D), and film (E andF). (A) Red fibre from Jadranska (NT1) SHORE. (B) Blue fibre from Bele Skale (NT2)INFRA. (C) Blue fibre from Portoroz (T3⁄) SHORE. D: Green plastic fragment fromDebeli Rtic (T1) SHORE. E and F: Plastic film from Debeli Rtic (T1) INFRA. Scalebars = 0.2 mm (A, C–F) and 1 mm (B). (For interpretation of the references to colourin this figure legend, the reader is referred to the web version of this article.)
Fig. 9. Percentage distribution (%) of microplastics by size for all samples from bothinfralittoral and shoreline sediments in Slovenia.
362 B.J.L. Laglbauer et al. / Marine Pollution Bulletin 89 (2014) 356–366
shoreline of Jadranska (NT1) contained both fibers and plastic frag-ments, which makes them different to other samples (Fig. 10A).
4. Discussion
This is the first study to present an assessment of microplasticpollution in beaches along the Slovenian coast and to assess mac-rodebris in relation to tourism in the region. Marine macrodebrisand microplastic are ubiquitous on beaches in Slovenia. Althoughstudies rarely focus on both types of debris, biological processesultimately link these size classes. Oxygen availability at beachesfacilitates gradual photo-degradation of large plastic pieces tomicroplastics (Andrady, 2011), which could accumulate locally indownwind or sheltered sites (Costa et al., 2011), especially in thepresence of high human pressure from tourism activities.
4.1. Macrodebris
Over 88% of the Slovenian coast was urbanised within fifteenyears (Turk, 1999). The present study took advantage of the exis-tence of both urbanized and (few) still non-urbanised beaches tocarry out a comparative assessment of the marine debris presentalong the coast of Slovenia. The choice of eight major groups andfurther division into 59 debris categories is in accordance withthe recommended by Galgani et al. (2010) of one to six debrisgroups to yield a low error rate and more consistency in data anal-ysis. The inclusion of a higher resolution system of more than 20categories allows for identification of changes in debris composi-tion, source, and usage of items (Galgani et al., 2010).
The number and weight of macrodebris did not vary in relationto the level of human use at beaches (Fig. 5). The number of mac-rodebris on Slovenian beaches was higher than on beaches in Riode Janeiro, Russia, South Korea, Northern Taiwan, and the SouthChina Sea, although it was lower than on beaches in Chile, Japanand Santa Catarina (Table 3). This type of pollution is of high con-cern to the tourism sector, which operates within a relatively smallportion of coastline in Slovenia, and competes with foreign beachesthat are in close proximity. Beachgoers, especially foreign tourists,consider beach cleanliness first when choosing a recreational des-tination (Balance et al., 2000). Yet, they directly dispose of debris atthe beach they visit, as indicated by the high percentage of ciga-rette filters within the plastics group (up to 63.7% in Jadranska-NT1). Though beach cleaning practices have been put in place inSlovenia and occur monthly and, in some cases, daily, inadequatedisposal practices prevail.
Visual descriptions of beach cleanliness provided by Alkalayet al. (2007) were usually consistent with the index valuesobtained (Table 1). However, because the CCI only considers plasticparticles, beach cleanliness was likely underestimated in Seca(NT3) and Debeli Rtic (T1), where glass/ceramics and metalaccount for a large proportion of the debris. Moreover, the CCI indi-cates that geographical distribution of beaches in Slovenia seemsto be correlated with plastic abundance, in spite of touristaffluence.
Macrodebris count revealed that beaches in the vicinity of Kop-er harbour and Rizana river contain more plastic debris than bea-ches further South. The activities that are likely to affect marinewater quality in the region of Koper include: waste water release,industry, pollution from the port of Koper, tourism, sea traffic, andagriculture (Peterlin et al., 2005). However, the main pollutionpathways in the region identified by a long-term study were out-flow of wastewater from Koper treatment plant and untreatedwastewater, which flows into the sea through the river (Peterlinet al., 2005). Macrodebris could originate from these pathwayselsewhere and result in similar forms of beach pollution.

Table 3Macrodebris densities on the beach (items m�2) found in Slovenia (present studydata) and other regions of the world.
Region Mean density(items m�2)
Author
Slovenia 1.51 (1.25a) Present studyRio de Janeiro, Brasil 0.13 Oigman-Pszczol and Creed (2007)Santa Catarina, Brasil 4.98 Widmer and Hennemann (2010)Japan 3.41 Kusui and Noda (2003)Russia 0.207 Kusui and Noda (2003)Tasmania 0.28 Slavin et al. (2012)Chile 1.8 Bravo et al. (2009)South China Sea 0.0032 Zhou et al. (2011)South Korea 1.0 Lee et al. (2013)Northern Taiwan 0.149 Kuo and Huang (2014)
a Median density (items m�2).
B.J.L. Laglbauer et al. / Marine Pollution Bulletin 89 (2014) 356–366 363
Land-based was an important source of macrodebris in thisstudy, as could be expected from sampling during the peak touristseason in Slovenia. This is even clearer when looking at the highproportions (unit count) of cigarette filters (41.9% of total plastic),which are good indicators of land-based debris due to their rapiddisintegration at sea. Jadranska (NT1) and Simonov Zaliv (T2⁄) con-tained especially high proportions of cigarette filters within theplastic group, which indicates that these items were discardedlocally at these sites.
Though beaches are cleaned monthly in Slovenia, only particleslarger than �5 cm are removed (Palatinus, pers. comm.). Thus,smaller pieces such as cigarette filters are found in extremely highnumbers. For example, 1012 filters were collected in Simonov Zaliv(T2⁄) on one 50-meter transect (Table 2). Additionally, alcoholicbeverage bottles were found on the beaches of Jadranska (NT1),Simonov Zaliv (T2⁄) and Bele Skale (NT2), as a result of direct dis-posal by people drinking on the beach. This behaviour was wit-nessed in Simonov Zaliv during the 5 am debris sampling for thepresent study.
Ocean-based debris can include, for example, abandoned, lost orintentionally discarded fishing gear. These are an important sourceof marine pollution that is pervasive to sensitive habitats, marineorganisms, and fisheries (from the loss of commercially valuablespecies) (Guillory, 1993; Matsuoka et al., 2005; UNEP, 2005;Bilkovic et al., 2012). Median fishing gear density was higher inBele Skale (NT2-0.096 items m�2) and Jadranska (NT1-0.069
Fig. 10. (A) Multidimensional scaling (MDS) plot of Bray–Curtis similarities of microplazones (infralittoral and shoreline), at six beaches. (B) MDS subset of Bray–Curtis similartouristic beaches, empty red squares represent shoreline samples of touristic beaches, fublue triangles represent shoreline samples of non-touristic beaches.2-Dimensional stressreader is referred to the web version of this article.)
items m�2), although derelict fishing gear fell a few meters outsideof the transect in Seca (NT3). Moreover, macrodebris are concen-trated on the high tide mark in Bele Skale (NT2), which indicatesthat they originate from the ocean at this location (OSPAR, 2009).
Debeli Rtic (T1), Simonov Zaliv (T2⁄), Portoroz (T3⁄), and Seca(NT3) beaches were sheltered either by built structures (e.g. pon-toon) or by their configuration, which usually imply weaker cur-rents. Reduced movement of water masses could limit theoutward transport of locally disposed debris, causing them to accu-mulate on the beach and on the intertidal area (Galgani et al.,2010).
4.2. Microplastics
The approach used to isolate microplastics was successful inrecovering particles from a wide range of sediment types. The com-bination of decantation with inverse filtration is hence recom-mended for microplastic extraction, in particular from finesediment (i.e. silt, clay), which contains low-density particles thatmake density separation difficult (Vianello et al., 2013).
Small microplastics (0.25–1 mm) accounted for 26% of particles,while 74% were larger microplastics. Small size is a key factor indetermining the bioavailability of microplastics to lower trophicorganisms (Wright et al., 2013), which feed less selectively thanlarger biota (Moore, 2008). This mechanism enhances trophic accu-mulation of microplastics, as observed by Farrell and Nelson (2013)in the prey Mytilus edulis and its predator Carcinus maenas. Further-more, it also raises health concerns for humans (Thompson et al.,2009b), given that microplastics can be lodged in the hemolymphand tissues of the crab (Farrell and Nelson, 2013) and, possibly, inother species, such as the fin whale (Fossi et al., 2012).
The present study shows that it is unlikely that pollution bymicroplastics is directly related to tourism activities in Slovenia,given that their concentration did not vary between touristic andnon-touristic beaches or between infralittoral and shoreline sam-ples. Debeli Rtic (T1) was different from other beaches in that itwas the only one where records showed three types of microplas-tics: fibers, fragments, and films. Jadranska (NT1) contained twotypes of microplastic (fibers and fragments), while there were onlyplastic films in the infralittoral of Seca (NT3). All samples exceptthis one contained fibers, which accounted for 96% of microplasticsin the infralittoral, and for 75% of microplastics in the shoreline.
stic quantity (log-transformed, particles per kg) within three categories across twoities representing circled cluster. Full red squares represent infralittoral samples ofll blue triangles represent infralittoral samples of non-touristic beaches, and emptyis equal to 0. (For interpretation of the references to colour in this figure legend, the
364 B.J.L. Laglbauer et al. / Marine Pollution Bulletin 89 (2014) 356–366
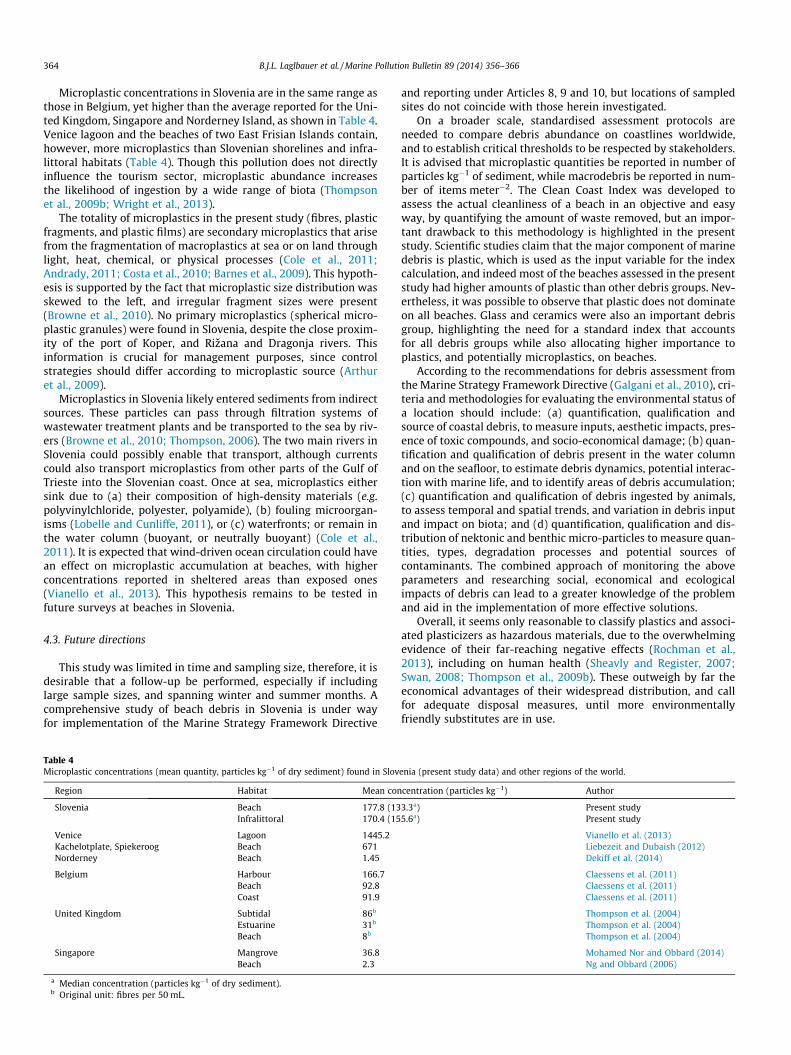
Microplastic concentrations in Slovenia are in the same range asthose in Belgium, yet higher than the average reported for the Uni-ted Kingdom, Singapore and Norderney Island, as shown in Table 4.Venice lagoon and the beaches of two East Frisian Islands contain,however, more microplastics than Slovenian shorelines and infra-littoral habitats (Table 4). Though this pollution does not directlyinfluence the tourism sector, microplastic abundance increasesthe likelihood of ingestion by a wide range of biota (Thompsonet al., 2009b; Wright et al., 2013).
The totality of microplastics in the present study (fibres, plasticfragments, and plastic films) are secondary microplastics that arisefrom the fragmentation of macroplastics at sea or on land throughlight, heat, chemical, or physical processes (Cole et al., 2011;Andrady, 2011; Costa et al., 2010; Barnes et al., 2009). This hypoth-esis is supported by the fact that microplastic size distribution wasskewed to the left, and irregular fragment sizes were present(Browne et al., 2010). No primary microplastics (spherical micro-plastic granules) were found in Slovenia, despite the close proxim-ity of the port of Koper, and Rizana and Dragonja rivers. Thisinformation is crucial for management purposes, since controlstrategies should differ according to microplastic source (Arthuret al., 2009).
Microplastics in Slovenia likely entered sediments from indirectsources. These particles can pass through filtration systems ofwastewater treatment plants and be transported to the sea by riv-ers (Browne et al., 2010; Thompson, 2006). The two main rivers inSlovenia could possibly enable that transport, although currentscould also transport microplastics from other parts of the Gulf ofTrieste into the Slovenian coast. Once at sea, microplastics eithersink due to (a) their composition of high-density materials (e.g.polyvinylchloride, polyester, polyamide), (b) fouling microorgan-isms (Lobelle and Cunliffe, 2011), or (c) waterfronts; or remain inthe water column (buoyant, or neutrally buoyant) (Cole et al.,2011). It is expected that wind-driven ocean circulation could havean effect on microplastic accumulation at beaches, with higherconcentrations reported in sheltered areas than exposed ones(Vianello et al., 2013). This hypothesis remains to be tested infuture surveys at beaches in Slovenia.
4.3. Future directions
This study was limited in time and sampling size, therefore, it isdesirable that a follow-up be performed, especially if includinglarge sample sizes, and spanning winter and summer months. Acomprehensive study of beach debris in Slovenia is under wayfor implementation of the Marine Strategy Framework Directive
Table 4Microplastic concentrations (mean quantity, particles kg�1 of dry sediment) found in Slov
Region Habitat Mean con
Slovenia Beach 177.8 (13Infralittoral 170.4 (15
Venice Lagoon 1445.2Kachelotplate, Spiekeroog Beach 671Norderney Beach 1.45
Belgium Harbour 166.7Beach 92.8Coast 91.9
United Kingdom Subtidal 86b
Estuarine 31b
Beach 8b
Singapore Mangrove 36.8Beach 2.3
a Median concentration (particles kg�1 of dry sediment).b Original unit: fibres per 50 mL.
and reporting under Articles 8, 9 and 10, but locations of sampledsites do not coincide with those herein investigated.
On a broader scale, standardised assessment protocols areneeded to compare debris abundance on coastlines worldwide,and to establish critical thresholds to be respected by stakeholders.It is advised that microplastic quantities be reported in number ofparticles kg�1 of sediment, while macrodebris be reported in num-ber of items meter�2. The Clean Coast Index was developed toassess the actual cleanliness of a beach in an objective and easyway, by quantifying the amount of waste removed, but an impor-tant drawback to this methodology is highlighted in the presentstudy. Scientific studies claim that the major component of marinedebris is plastic, which is used as the input variable for the indexcalculation, and indeed most of the beaches assessed in the presentstudy had higher amounts of plastic than other debris groups. Nev-ertheless, it was possible to observe that plastic does not dominateon all beaches. Glass and ceramics were also an important debrisgroup, highlighting the need for a standard index that accountsfor all debris groups while also allocating higher importance toplastics, and potentially microplastics, on beaches.
According to the recommendations for debris assessment fromthe Marine Strategy Framework Directive (Galgani et al., 2010), cri-teria and methodologies for evaluating the environmental status ofa location should include: (a) quantification, qualification andsource of coastal debris, to measure inputs, aesthetic impacts, pres-ence of toxic compounds, and socio-economical damage; (b) quan-tification and qualification of debris present in the water columnand on the seafloor, to estimate debris dynamics, potential interac-tion with marine life, and to identify areas of debris accumulation;(c) quantification and qualification of debris ingested by animals,to assess temporal and spatial trends, and variation in debris inputand impact on biota; and (d) quantification, qualification and dis-tribution of nektonic and benthic micro-particles to measure quan-tities, types, degradation processes and potential sources ofcontaminants. The combined approach of monitoring the aboveparameters and researching social, economical and ecologicalimpacts of debris can lead to a greater knowledge of the problemand aid in the implementation of more effective solutions.
Overall, it seems only reasonable to classify plastics and associ-ated plasticizers as hazardous materials, due to the overwhelmingevidence of their far-reaching negative effects (Rochman et al.,2013), including on human health (Sheavly and Register, 2007;Swan, 2008; Thompson et al., 2009b). These outweigh by far theeconomical advantages of their widespread distribution, and callfor adequate disposal measures, until more environmentallyfriendly substitutes are in use.
enia (present study data) and other regions of the world.
centration (particles kg�1) Author
3.3a) Present study5.6a) Present study
Vianello et al. (2013)Liebezeit and Dubaish (2012)Dekiff et al. (2014)
Claessens et al. (2011)Claessens et al. (2011)Claessens et al. (2011)
Thompson et al. (2004)Thompson et al. (2004)Thompson et al. (2004)
Mohamed Nor and Obbard (2014)Ng and Obbard (2006)
B.J.L. Laglbauer et al. / Marine Pollution Bulletin 89 (2014) 356–366 365
5. Conclusions
The present study provides the first assessment of macrodebrisand microplastic pollution in six beaches along the Slovenian coast,and a further comparison of the results in relation to tourism activ-ity at each location. A total of 5870 macrodebris units were recov-ered, with a median density of 1.25 items m�2 and weight of4.45 g m�2. Plastic was the dominant group (64% of total units),although glass and ceramics dominated at two beaches (Seca –NT3, and Debeli Rtic – T1). Cigarette filters accounted for a medianof 41.9% of plastics, suggesting that a large proportion of macro-plastics is land-based. All samples revealed secondary microplas-tics (85% of which were fibers), which were recorded at a medianconcentration of 155.6 particles m�2 in the infralittoral zone, and133.3 particles m�2 on the shoreline. A relation between tourismactivity and marine debris distribution at the sampling time couldnot be established. Other factors could be affecting the amount ofmacrodebris and microplastic at beaches in Slovenia, such as beachexposure, wind, waves, fishing fleet activity, and riverine inputs(Andrady, 2011; Browne et al., 2011), which should be assessedin future surveys.
Standardised debris monitoring protocols are needed to estab-lish comparable baselines and to monitor the pollution of coast-lines worldwide, and should include all types of marine debris(not just plastic). The present study provides novel insight intobeach microplastic pollution of the Slovenian coast, and the firstrecords of beach macrodebris in relation to tourism in Slovenia.The baseline assessment described herein can be used to obtaincrucial data for management in the Adriatic region.
Author contributions
Experimental design and sampling: BJLL, MA-C, LB, RMF-S, MP,AP. Data analysis and manuscript ellaboration: BJLL, RMF-S, MA-C,LB, MP, MG. Manuscript revision: MG, AP.
All authors have approved the final version.
Integrity of research and reporting
Ethical standards
The experiments described in the present study comply withthe current laws of the country in which they were performed.
Conflict of Interest
The authors declare that they have no conflict of interest.
Acknowledgements
The authors kindly thank the editor and an anonymousreviewer for their comments that greatly improved the manu-script; the Erasmus Mundus M.Sc. in Marine Biodiversity and Con-servation (EMBC) program (Framework Agreement Number 2008-0089Munb123) and the associated universities and professors;Janez Forte, Boris Petelin, Milijan Šiško and the other professionalsat the Marine Biology Station of Piran; and Margarida Castro, forher statistical advice. This work was conducted in partial fulfilmentof a M.Sc. degree by the authors BJLL, RMF-S (supported by anEMBC graduate scholarship), MA, LB, and MP.
References
Acampora, H., Schuyler, Q.A., Townsend, K.A., Hardesty, B.D., 2014. Comparingplastic ingestion in juvenile and adult stranded short-tailed shearwaters(Puffinus tenuirostris) in eastern Australia. Mar. Pollut. Bull. 78 (1), 63–68.
Alkalay, R., Pasternak, G., Zask, A., 2007. Clean-coast index—a new approach forbeach cleanliness assessment. Ocean Coast. Manage. 50 (5), 352–362.
Andrady, A.L., 2011. Microplastics in the marine environment. Mar. Pollut. Bull. 62(8), 1596–1605.
Arthur, C., Baker, J., Bamford, H. (Eds.), 2009. Proceedings of the InternationalResearch Workshop on the Occurrence, Effects and Fate of Micro-plasticMarine Debris, September 9–11, 2008. NOAA Technical MemorandumNOS-OR&R-30.
Balance, A., Ryan, P.G., Turpie, J.K., 2000. How much is a clean beach worth? Theimpact of litter on beach users in the Cape Peninsula, South Africa. S. Afr. J. Sci.96 (2), 210–213.
Barnes, D.K., 2002. Biodiversity: invasions by marine life on plastic debris. Nature416 (6883), 808–809.
Barnes, D.K., Galgani, F., Thompson, R.C., Barlaz, M., 2009. Accumulation andfragmentation of plastic debris in global environments. Philos. Trans. Roy. Soc.B: Biol. Sci. 364 (1526), 1985–1998.
Betts, K., 2008. Why small plastic particles may pose a big problem in the oceans.Environ. Sci. Technol. 42 (24), 8995–8995.
Bilkovic, D.M., Havens, K.J., Stanhope, D.M., Angstadt, K.T., 2012. Use of fullybiodegradable panels to reduce derelict pot threats to marine fauna. Conserv.Biol. 26 (6), 957–966.
Boerger, C.M., Lattin, G.L., Moore, S.L., Moore, C.J., 2010. Plastic ingestion byplanktivorous fishes in the North Pacific Central Gyre. Mar. Pollut. Bull. 60 (12),2275–2278.
Bravo, M., de los Ángeles Gallardo, M., Luna-Jorquera, G., Núñez, P., Vásquez, N.,Thiel, M., 2009. Anthropogenic debris on beaches in the SE Pacific (Chile):results from a national survey supported by volunteers. Mar. Pollut. Bull. 58(11), 1718–1726.
Browne, M.A., Galloway, T.S., Thompson, R.C., 2010. Spatial patterns of plastic debrisalong estuarine shorelines. Environ. Sci. Technol. 44 (9), 3404–3409.
Browne, M.A., Crump, P., Niven, S.J., Teuten, E., Tonkin, A., Galloway, T., Thompson,R., 2011. Accumulation of microplastic on shorelines woldwide: sources andsinks. Environ. Sci. Technol. 45 (21), 9175–9179.
Carpenter, E.J., Smith, K.L., 1972. Plastics on the Sargasso Sea surface. Science 175,1240–1241.
CBD, 2012. Secretariat of the Convention on Biological Diversity and the Scientificand Technical Advisory Panel GEF. Impacts of Marine Debris on Biodiversity:Current Status and Potential Solutions, Montreal, Technical Series No. 67,61pages.
Cheshire, A., Adler, E., Barbière, J., Cohen, Y., Evans, S., Jarayabhand, S., Westphalen,G., 2009. UNEP/IOC Guidelines on Survey and Monitoring of Marine inthe for.
Claessens, M., Meester, S.D., Landuyt, L.V., Clerck, K.D., Janssen, C.R., 2011.Occurrence and distribution of microplastics in marine sediments along theBelgian coast. Mar. Pollut. Bull. 62 (10), 2199–2204.
Clarke, K.R., Gorley, R.N., 2006. User Manual/Tutorial. PRIMER-E Ltd., Plymouth.Cole, M., Lindeque, P., Halsband, C., Galloway, T.S., 2011. Microplastics as
contaminants in the marine environment: a review. Mar. Pollut. Bull. 62 (12),2588–2597.
Collignon, A., Hecq, J.H., Glagani, F., Voisin, P., Collard, F., Goffart, A., 2012. Neustonicmicroplastic and zooplankton in the North Western Mediterranean Sea. Mar.Pollut. Bull. 64 (4), 861–864.
Costa, M.F., do Sul, J.A.I., Silva-Cavalcanti, J.S., Araújo, M.C.B., Spengler, Â., Tourinho,P.S., 2010. On the importance of size of plastic fragments and pellets on thestrandline: a snapshot of a Brazilian beach. Environ. Monit. Assess. 168 (1-4),299–304.
Costa, M.F., Silva-Cavalcanti, J.S., Barbosa, C.C., Portugal, J.L., Barletta, M., 2011.Plastic buried in the inter-tidal plain of a tropical estuarine ecosystem. J. Coast.Res. SI 64, 339–343.
Dekiff, J.H., Remy, D., Klasmeier, J., Fries, E., 2014. Occurrence and spatialdistribution of microplastics in sediments from Norderney. Environ. Pollut.186, 248–256.
Depledge, M.H., Galgani, F., Panti, C., Caliani, I., Casini, S., Fossi, M.C., 2013. Plasticlitter in the sea. Mar. Environ. Res. 92, 279–281.
Derraik, J.G., 2002. The pollution of the marine environment by plastic debris: areview. Mar. Pollut. Bull. 44 (9), 842–852.
Eriksen, M., Maximenko, N., Thiel, M., Cummins, A., Lattin, G., Wilson, S., Rifman, S.,2013. Plastic pollution in the South Pacific subtropical gyre. Mar. Pollut. Bull. 68(1), 71–76.
Farrell, P., Nelson, K., 2013. Trophic level transfer of microplastic: Mytilus edulis (L.)to Carcinus maenas (L.). Environ. Pollut. 177, 1–3.
Fendall, L.S., Sewell, M.A., 2009. Contributing to marine pollution by washing yourface: microplastics in facial cleansers. Mar. Pollut. Bull. 58 (8), 1225–1228.
Fossi, M.C., Panti, C., Guerranti, C., Coppola, D., Giannetti, M., Marsili, L., Minutoli, R.,2012. Are baleen whales exposed to the threat of microplastics? A case study ofthe Mediterranean fin whale (Balaenoptera physalus). Mar. Pollut. Bull. 64 (11),2374–2379.
Galgani, F., Leaute, J.P., Moguedet, P., Souplet, A., Verin, Y., Carpentier, A., Nerisson,P., 2000. Litter on the sea floor along European coasts. Mar. Pollut. Bull. 40 (6),516–527.
Galgani, F., Fleet, D., Franeker, J.V., Katsanevakis, S., Maes, T., Mouat, J., Janssen, C.,2010. Marine Strategy Framework Directive: Task Group 10 Report MarineLitter. Office for Official Publications of the European Communities.
Galgani, F., Hanke, G., Werner, S., De Vrees, L., 2013. Marine litter within theEuropean Marine Strategy Framework Directive. ICES J. Mar. Sci.: J. Conseil 70(6), 1055–1064.

366 B.J.L. Laglbauer et al. / Marine Pollution Bulletin 89 (2014) 356–366
Gregory, M.R., 2009. Environmental implications of plastic debris in marinesettings—entanglement, ingestion, smothering, hangers-on, hitch-hiking andalien invasions. Philos. Trans. Roy. Soc. B: Biol. Sci. 364 (1526), 2013–2025.
Gregory, M.R., Andrady, A.L., 2003. Plastics in the marine environment. Plast.Environ., 379–401.
Guillory, V., 1993. Ghost fishing in blue crab traps. N. Am. J. Fish. Manage. 13 (3),459–466.
Hidalgo-Ruz, V., Gutow, L., Thompson, R.C., Thiel, M., 2012. Microplastics in themarine environment: a review of the methods used for identification andquantification. Environ. Sci. Technol. 46 (6), 3060–3075.
Hirai, H., Takada, H., Ogata, Y., Yamashita, R., Mizukawa, K., Saha, M., Ward, M.W.,2011. Organic micropollutants in marine plastics debris from the open oceanand remote and urban beaches. Mar. Pollut. Bull. 62 (8), 1683–1692.
Imhof, H.K., Schmid, J., Niessner, R., Ivleva, N.P., Laforsch, C., 2012. A novel, highlyefficient method for the separation and quantification of plastic particles insediments of aquatic environments. Limnol. Oceanogr.: Methods 10, 524–537.
Jang, Y.C., Hong, S., Lee, J., Lee, M.J., Shim, W.J., 2014. Estimation of lost tourismrevenue in Geoje Island from the 2011 marine debris pollution event in SouthKorea. Mar. Pollut. Bull. 81 (1), 49–54.
Kaiser, J., 2010. The dirt on ocean garbage patches. Science 328 (5985), 1506–1506.Katsanevakis, S., 2008. Marine debris, a growing problem: sources, distribution,
composition, and impacts. New Research. Nova Science Publishers, New York,Marine Pollution, 53–100.
Kershaw, P., Katsuhiko, S., Lee, S., Samseth, J., Woodring, D., Smith, J., 2011. Plasticdebris in the ocean. United Nations Environment Programme (UNEP), UNEP. YearBook, 20–33.
Kuo, F.J., Huang, H.W., 2014. Strategy for mitigation of marine debris: analysis ofsources and composition of marine debris in northern Taiwan. Mar. Pollut. Bull..
Kusui, T., Noda, M., 2003. International survey on the distribution of stranded andburied litter on beaches along the Sea of Japan. Mar. Pollut. Bull. 47 (1), 175–179.
Law, K.L., Morét-Ferguson, S., Maximenko, N.A., Proskurowski, G., Peacock, E.E.,Hafner, J., Reddy, C.M., 2010. Plastic accumulation in the North Atlanticsubtropical gyre. Science 329 (5996), 1185–1188.
Lee, J., Hong, S., Song, Y.K., Hong, S.H., Jang, Y.C., Jang, M., Shim, W.J., 2013.Relationships among the abundances of plastic debris in different size classeson beaches in South Korea. Mar. Pollut. Bull. 77 (1), 349–354.
Leslie, H.A., Van der Meulen, M.D., Kleissen, F.M., Verhaak, A.D., 2011. MicroplasticLitter in the Dutch Marine Environment. Providing Facts and Analysis for DutchPolicy Makers Engaged with Plastic Marine Litter.
Liebezeit, G., Dubaish, F., 2012. Microplastics in beaches of the East Frisian islandsSpiekeroog and Kachelotplate. Bull. Environ. Contam. Toxicol. 89 (1), 213–217.
Lobelle, D., Cunliffe, M., 2011. Early microbial biofilm formation on marine plasticdebris. Mar. Pollut. Bull. 62 (1), 197–200.
Lusher, A.L., McHugh, M., Thompson, R.C., 2013. Occurrence of microplastics in thegastrointestinal tract of pelagic and demersal fish from the English Channel.Mar. Pollut. Bull. 67 (1), 94–99.
Malacic, V., Petelin, B., Vodopivec, M., 2012. Topographic control of wind-drivencirculation in the northern Adriatic. J. Geophys. Res.: Oceans (1978–2012) 117(C6).
Matsuoka, T., Nakashima, T., Nagasawa, N., 2005. A review of ghost fishing:scientific approaches to evaluation and solutions. Fish. Sci. 71, 691–702.
McDermid, K.J., McMullen, T.L., 2004. Quantitative analysis of small-plastic debrison beaches in the Hawaiian archipelago. Mar. Pollut. Bull. 48 (7), 790–794.
Mohamed Nor, N.H., Obbard, J.P., 2014. Microplastics in Singapore’s coastalmangrove ecosystems. Mar. Pollut. Bull. 79 (1), 278–283.
Moore, C.J., 2008. Synthetic polymers in the marine environment: a rapidlyincreasing, long-term threat. Environ. Res. 108 (2), 131–139.
Moore, C.J., Moore, S.L., Leecaster, M.K., Weisberg, S.B., 2001. A comparison of plasticand plankton in the North Pacific central gyre. Mar. Pollut. Bull. 42 (12), 1297–1300.
Nash, A.D., 1992. Impacts of marine debris on subsistence fishermen An exploratorystudy. Mar. Pollut. Bull. 24 (3), 150–156.
Ng, K.L., Obbard, J.P., 2006. Prevalence of microplastics in Singapore’s coastal marineenvironment. Mar. Pollut. Bull. 52 (7), 761–767.
Oigman-Pszczol, S.S., Creed, J.C., 2007. Quantification and classification of marinelitter on beaches along Armação dos Búzios, Rio de Janeiro, Brazil. J. Coast. Res.,421–428.
OSPAR, 2009. Marine Litter in the North-east Atlantic Region: Assessment andPriorities for Response. London, United Kingdom, 127pp.
Peterlin, M., Kontic, B., Kross, B.C., 2005. Public perception of environmentalpressures within the Slovene coastal zone. Ocean Coast. Manage. 48 (2), 189–204.
Pichel, W.G., Churnside, J.H., Veenstra, T.S., Foley, D.G., Friedman, K.S., Brainard, R.E.,Nicoll, J.B., Zheng, Q., Clemente-Colon, P., 2007. Marine debris collects within
the North Pacific Subtropical Convergence Zone. Mar. Pollut. Bull. 54, 1207–1211.
Rochman, C.M., Browne, M.A., Halpern, B.S., Hentschel, B.T., Hoh, E., Karapanagioti,H.K., Thompson, R.C., 2013. Policy: classify plastic waste as hazardous. Nature494 (7436), 169–171.
Ryan, P.G., 2013. Litter survey detects the South Atlantic ‘garbage patch’. Mar.Pollut. Bull. 79, 220–224.
Ryan, P.G., Moore, C.J., van Franeker, J.A., Moloney, C.L., 2009. Monitoring theabundance of plastic debris in the marine environment. Philos. Trans. Roy. Soc.B: Biol. Sci. 364 (1526), 1999–2012.
Santos, I.R., Friedrich, A.C., do Sul, J.A.I., 2009. Marine debris contamination alongundeveloped tropical beaches from northeast Brazil. Environ. Monit. Assess.148 (1-4), 455–462.
Setälä, O., Fleming-Lehtinen, V., Lehtiniemi, M., 2014. Ingestion and transfer ofmicroplastics in the planktonic food web. Environ. Pollut. 185, 77–83.
Sheavly, S.B., Register, K.M., 2007. Marine debris & plastics: environmentalconcerns, sources, impacts and solutions. J. Polym. Environ. 15 (4), 301–305.
Slavin, C., Grage, A., Campbell, M.L., 2012. Linking social drivers of marine debriswith actual marine debris on beaches. Mar. Pollut. Bull. 64 (8), 1580–1588.
Spear, L.B., Ainley, D.G., Ribic, C.A., 1995. Incidence of plastic in seabirds from thetropical Pacific, 1984–91 – relation with distribution of species, sex, age, season,year and body-weight. Mar. Environ. Res. 40, 123–146.
Swan, S.H., 2008. Environmental phthalate exposure in relation to reproductiveoutcomes and other health endpoints in humans. Environ. Res. 108 (2), 177–184.
Tanaka, K., Takada, H., Yamashita, R., Mizukawa, K., Fukuwaka, M.A., Watanuki, Y.,2013. Accumulation of plastic-derived chemicals in tissues of seabirds ingestingmarine plastics. Mar. Pollut. Bull. 69 (1), 219–222.
Teuten, E.L., Saquing, J.M., Knappe, D.R., Barlaz, M.A., Jonsson, S., Björn, A., Rowland,S.J., Thompson, R.C., Galloway, T.S., Yamashita, R., Ochi, D., Watanuki, Y., Moore,C., Viet, P.H., Tana, T.S., Prudente, M., Boonyatumanond, R., Zakaria, M.P.,Akkhavong, K., Ogata, Y., Hirai, H., Iwasa, S., Mizukawa, K., Hagino, Y., Imamura,A., Saha, M., Takada, H., 2009. Transport and release of chemicals from plasticsto the environment and to wildlife. Philos. Trans. Roy. Soc. B 364, 2027–2045.
Thompson, R.C., 2006. Plastic debris in the marine environment: consequences andsolutions. Mar. Nat. Conserv. Europe 2006, 107.
Thompson, R.C., Olsen, Y., Mitchell, R.P., Davis, A., Rowland, S.J., John, A.W., Russell,A.E., 2004. Lost at sea: where is all the plastic? Science 304 (5672), 838–838.
Thompson, R.C., Swan, S.H., Moore, C.J., vom Saal, F.S., 2009a. Our plastic age. Philos.Trans. Roy. Soc. B: Biol. Sci. 364 (1526), 1973–1976.
Thompson, R.C., Moore, C.J., vom Saal, F.S., Swan, S.H.(, 2009b. Plastics, theenvironment and human health: current consensus and future trends. Philos.Trans. Roy. Soc. B: Biol. Sci. 364 (1526), 2153–2166.
Turk, R., 1999. An assessment of the vulnerability of the Slovene coastal belt and itscategorisation in view of (in) admissible human pressure, various activities, andland use. Ann., Ser. Hist. Naturalis 15, 37–50.
Turk, D., Malacic, V., DeGrandpre, M.D., McGillis, W.R., 2010. Carbon dioxidevariability and air-sea fluxes in the northern Adriatic Sea. J. Geophys. Res.:Oceans (1978–2012) 115 (C10).
UN/DESA, 2014. World Population Prospects: The 2012 Revision. <http://esa.un.org> (accessed on 03.03.14).
UNEP, 2005. Marine Litter, An Analytical Overview. United Nations EnvironmentProgramme: Nairobi, Kenya.
Van Cauwenberghe, L., Vanreusel, A., Mees, J., Janssen, C.R., 2013. Microplasticpollution in deep-sea sediments. Environ. Pollut. 182, 495–499.
van Franeker, J.V., Heubeck, M., Fairclough, K., Turner, D.M., Grantham, M., Stienen,E.W.M., Olsen, B., 2005. Save the North Sea’Fulmar Study 2002–2004: ARegional Pilot Project for the Fulmar-Litter-EcoQO in the OSPAR area. Alterra-rapport.
Vianello, A., Boldrin, A., Guerriero, P., Moschino, V., Rella, R., Sturaro, A., Da Ros, L.,2013. Microplastic particles in sediments of Lagoon of Venice, Italy: firstobservations on occurrence, spatial patterns and identification. Estuar. Coast.Shelf Sci. 130, 54–61.
Watts, A.J.R., Lewis, C., Goodhead, R.M., Beckett, S.J., Moger, J., Tyler, C.R., Galloway,T.S., 2014. Uptake and retention of microplastics by the shore crab Carcinusmaenas. Environ. Sci. Technol. 48 (15), 8823–8830.
Widmer, W.M., Hennemann, M.C., 2010. Marine debris in the Island of SantaCatarina, South Brazil: spatial patterns, composition, and biological aspects. J.Coast. Res. 26 (6), 993–1000.
Wright, S.L., Thompson, R.C., Galloway, T.S., 2013. The physical impacts ofmicroplastics on marine organisms: a review. Environ. Pollut. 178, 483–492.
Zhou, P., Huang, C., Fang, H., Cai, W., Li, D., Li, X., Yu, H., 2011. The abundance,composition and sources of marine debris in coastal seawaters or beachesaround the northern South China Sea (China). Mar. Pollut. Bull. 62 (9), 1998–2007.