Macrobenthos of Minicoy Island, Lakshadweep
95
4. 1. Composition and distribution 4. 2. Standing stock 4.2. 1. Biomass 4.2.2. Numerical abundance 4. 2. 2. 1. Three way ANOVA 4. 2. 2. 2. Community structure 4. 2. 2. 3. Similarity index 4. 2. 2. 4. Factor analysis 4. 1. Composition and Distribution Chapter. 4 BOTTOM FAUNA The macrobenthic fauna in the study area showed great diversity in seagrass stations and less diversity in mangrove ecosystems. Distinct differences were found in the population density as well as qualitative composition of the various taxa in different areas. Eight major groups identified were gastropods, bivalves, polychaetes, other worms (all worms except polychaetes), crabs, other crustaceans (including shrimps, amphipods, isopods, stomatopods, tanaeids, etc.), and sponges. Altogether under gastropoda there were 58 species under 27 genera, bivalves of 12 species under 7 genera, 'other worms' of 7 species under 6 genera, polychaetes of 27 specIes under 14 genera, crabs of 24 species under 11 genera, other crustaceans of 19 species under 13 genera, echinoderms of 11 species under 7 genera and sponges of 2 species under 2 genera constituting a grand total of 160 species (Table 4. 1). Total number of species found at each station was 137 (station 1), 137 (station 2), 74 (station 3), 62 (station 4), 18 (station 5) and 16 (station 6).
Transcript of Macrobenthos of Minicoy Island, Lakshadweep

4. 1. Composition and distribution
4. 2. Standing stock
4.2. 1. Biomass
4.2.2. Numerical abundance
4. 2. 2. 1. Three way ANOVA
4. 2. 2. 2. Community structure
4. 2. 2. 3. Similarity index
4. 2. 2. 4. Factor analysis
4. 1. Composition and Distribution
Chapter. 4
BOTTOM FAUNA
The macrobenthic fauna in the study area showed great diversity in
seagrass stations and less diversity in mangrove ecosystems. Distinct
differences were found in the population density as well as qualitative
composition of the various taxa in different areas.
Eight major groups identified were gastropods, bivalves,
polychaetes, other worms (all worms except polychaetes), crabs, other
crustaceans (including shrimps, amphipods, isopods, stomatopods,
tanaeids, etc.), e~hinoderms and sponges. Altogether under gastropoda
there were 58 species under 27 genera, bivalves of 12 species under 7
genera, 'other worms' of 7 species under 6 genera, polychaetes of 27
specIes under 14 genera, crabs of 24 species under 11 genera, other
crustaceans of 19 species under 13 genera, echinoderms of 11 species
under 7 genera and sponges of 2 species under 2 genera constituting a
grand total of 160 species (Table 4. 1).
Total number of species found at each station was 137 (station 1),
137 (station 2), 74 (station 3), 62 (station 4), 18 (station 5) and 16 (station
6).

Chapter 4. Bollom/allna
Table 4. 1. Occurrence % of different species at different stations .(no._oftimes_occurre~_24 sampling months)xlOO
SPECIES st. 1 st. 21 st. 3, I . . . -~---- .-.- !
,GASTROPODS
Punctacteon amakusaensis - -
Marania lirata _._._------ ._- -
:Cerithium corallium
iCerithium alveolum f·· - .. -~-.. -
:Cerithium dialeucum
jCerithium rarimaculatum [Cerithi~~··;c~bridum ... 1-!Cerithium rostratum I _ .. _. __ --. -- - ---
Cerithium nesioticum - - -
D)lpeomorus_ corallium
Rhinoclavis sinensis
Pyrene sp.
Pyrene yulpecula___
:Metanachis marquesa
,Conus catus
IConus~ebr:.aeus Co~alliophila costularis
Cyprea annulus
Cyprea arabica I - _. - --.---.. ---
:Cyp~ea _moneta ____ ._._ .. Cypreateres
:Cyprea tigris I· - . . .. ---. -~ ... _ ..
!Mazescala japonica' __ __ _
!Niso heizensis
'Persternispilsbryi
;Littorina undulata , Strigatella litterata
Drupella sp.
Nassarius distortus
INiotha stigmaria I
Zeuxis _sp~ ___ _ Polinices jlemengium
iNotica rufa_ _____ _ ___ _
0.0 I I
16.7
91.7' 54.21
16.7
4.21 I
87.5:
33.3 ' i
29.i
12.5
8.3 70.8:
16.T i-
16.71 I
8.31 , 20.8,
I
29.2: 12.5
16.7
62.5
16.7' I·
12.51 , 0.01
t-
0.01 12.5;
I 12.5'
0.0 4.2 0.0 4.2
12.51
16.7
8.3
16.7
8.3. 91.7 ,. 62.5:
33.3:
4.2,
62.5;
25.0:
41.7
4.2. 12.5
66.7, ,
25.01
12.5' , 29.2:
I
4.21 45.8
1
8.3, t
12.5;
33.3\. 8.3\ ,
12.5: 1
4.2i 12.5!
1
0.0\
20.8i
4.2 8.3, 4.2;
16.7 I
0.0;
0.0:
12.5
12.5
0.01
1
41.71 41.71
8.3; 0.0: , .
45.8
37.5: I
66.71 O.O!
4.2! 87.5:
i
12.51 25.0:
I 33.3;
0.0' i
12.5! I
O.O! 1
0.0 1
16.7,
0.01 1
0.01
0.0'
16.7 ., I
O.Oi
20.81 0.01
0.01 I
0.01 I
8.3! I
0.0, , 25.0:
0.0
st. 41
0.0:
0.01. 58.31
·45.81.
8.3: 0.0;
58.3) 50.0 1
i 79.2; ,
O.oj. 12.5
91.7 1
16.7: t
25.0' I
4.2! I
O.O! ,
8.3 i
0.0'
0.0 0.0':,
0.0'" 0.0,
i 0.0'
1
8.31 0.0:
I·
0.0: 1
O.Oi· 4.2~
0.0: I
12.5i 1
0.01' 8.3 , 0.0,
st. 5
0.0
0.0 , 95.8'
1
0.0
0.0 I
25.0:
20.8 0.0,
0.0 0.0,
0.0 25.0:
0.0: 0.0: , 0.6
I
O.Oi I
0.0 I
O.Oj O.Oi
I
0.0 O.Oi,
o.d 0.0:
!
0.0: i
O.Oi I 95.8, , I
O.Oi 0.0. 0.0, 0.0
0.0 0.0:
0.0
st. 6
0.0 0.0
100.0:
0.0 0.0,
8.3 16.7
0.0 0.0
0.0
0.0
12.5
0.0,
0.0: , 0.0
,
0.0: , 0.0,
I
0.0 0.0 0.0 0.0,
0.0 0.0 0.0 0.0,
95.8
0.0,
0.0
0.0 0.0
0.0 0.0,
0.0

Table 4. 1. contd ....
SPECIES ,-_._----------Smaragdia viridis 1 -- - -~---~--~-
'Smaragdia sove,"-biana __ _ ~
: Vittina _ variegata _ _ __
iTerebralia palustris Agathavirgo __ _
Agatha lepidule __
.Pyrgulina pupula
Cymatium neobaricum
Cymatriton nicobaricum
'Cinctiscala sp.
:Decorifer ins ignis i
- i
Casme!ia ponderisai
Strombus canarium
Strombus mutabilis
Cinguloterebra hedleyana
Margarites helicina
Truncatella pfeifJeri
Unidentified 129 ,
Dolabellarumphii
lPolycera sp.
!aymnodoris ceylonica
1 , , i i
1 I
:Elysia sp. _ _ -- ~~ ~ _ _I Smargdinella canaliculata 1
di~la la uta - ~ ~ ~ - -I - -~--~-~--l
polab~ife,:a_dolabrJfera --i- ~
[BIV AL VES ___ _
:Lunulicardia auricula
!Cardium a;i~tic~m [Corculumimpressurn - ~ :Ctena delicatula
Mactra cuneata
Myadoropsis brevispinious
.Lithophaga nigra
:Modiolus metcalfei
Chapter 4. BOl1om/lIl1l1l1
st. 1 st. 2 st. 3 st. 4 st. 5 st. 6 -_._----------- ------~--.-- - ----
75.0, 83.3· 70.8: 70.8: 16.7 8.3
79.2: 87.5 58.3' 62.5 8.3 20.8
0.0
i
4.21
4.2 i
0.0,
0.01
0.0: I
4.2' , 8.3! O.O!
20.8 i
33.3;
8.3 20.8
0.0:
4.21
37.5
12.51 i 1
4.21 1
292 1
• ! 25.0
4.2; 4.2i
I
1
1
12.51
20.8!
12.51
I 33.3j
8.3~
16.7
20.8
8.3:
,
8.3 16.7: 4.2 0.0 0.0
0.0 0.0 1
i I
0.0' 0.0: , r
0.0 0.0;
4.2 8.3
0.0
12.5'
8.3: 12.5
4.2:
33.3
29.2
25.0
0.0
8.T
41.7
16.7: I
25.0:
4.2 16.7
0.0; 0.0:
i- -
0.0, r
4.2; 8.3!
I
33.3'
4.2 29.2
25.0
16.7
1
20.8 1
,
8.3:
8.3i
0.0:
0.0
0.0
16.7
25.0;
8.3i , 0.0:
1
0.0: I
4.2i 1
0.0: O.O!
1
0.0' 0.0,
t
0.0: I 0.01 I ~
O.O! I 1
0.01
12.5: , 0.0,
e-
8.3! , 0.0:
1
O.O! 1
0.01 I 4.2,
0.0: I
0.0'
0.0
4.2[ I 0.01
0.0:
0.0: i
0.0:
4.2 t 1
1
0.0 1
0.0
8.3' 0.0'
0.0
4.2
0.0: , 0.01
i 0.01 0.0,
0.01
0.0: O.Or
1
0.0 1
0.01
0.01 0.0 0.0:
4.2: , 0.0:
I
8.31
100.0 , 0.0' 0.0
0.0
0.0
0.0
0.0
,
0.0'
0.0'
0.0
0.0
0.0
25.0
0.0'
0.0 0.0: , O.O! 0.0'
I
0.0: 1
0.0 1
0.0
O.O!
0.0'
0.0: O.O! 0.0
I 0.0 0.0 0.0.
0.0
100.0'
0.0
0.0
0.0,
0.0
0.0
0.0
0.0
0.0
0.0
0.0
0.0
29.2
0.0
0.01 i
O.Oi 0.0 0.01
0.0' O.Or
0.0 0.0
0.0 0.0 0.0
0.0 0.0 0.0
0.0 0.0'
,

Chapter -I. BOIIOI1l/llllllll
Table 4. 1. contd ....
'SPECIES st.t st.2 st.3 st.4 ---------------------- ---- ---- -----:Pinna murieata I - _.
lTellina_pa/atum _ _~_~~_ ... gqfrariumdiva~tjeatu~ .
~e~iglypta puerpura
WORMS
Baseodiseus delineatus I
iGo/jingia hespera __ _ , . JPhaseolosoma_ mgreseens
iSiphonosoma australe
iSipuneul~~_ indieu_s
Siboglinum fiordieum
Hoplonemertean sp.
POL YCHAETE WORMS !
,Se%plos sp. __ . ___ .
:Eurythoe eomplanata_.
Eurythoe mathaii ) .- -- --- -- -
INotopygos variabilis I -_. rNotomastes laterieeus I -
Cirratulus sp.
Marphysa maeintoshi
Nematonereis unieornis
'G/yeera_eonvoJuta_ IGlyeera laneadivae
iGlyeera subaena ~ . - - - -
IGlyeeratesselata
:Glyeera sp. I :Goniada emerita
Nephtys dibranehus
Nephtys hombergii
Nephtys inermis
~Ceratonereis erythraensis
Nereis kauderni ,
iNereisJrJJasciata
Arabella irieolor irieolor
41.7 50.0 0.0 0.0
20.8: 12.5, 37.5; 45.8'
66.7, 58.3 100.0: 100.0 ,
12.5 16.7 0.0: 0.0:
33.3 , 25.0:
12.51
16.7!
25.0: ,
20.8!
8.3
, 12.5:
1
20.81 i
16.7i
25.0: , 20.8!
4.2
20.8! I
29.2: 1
66.7
16.7! t
29.21
8.3 1
33.31 -;
33.3
58.3
25.01
0.0
20.8]
375 I
25.0
20.8
25.0'
12.5
0.0 ;
16.7' I
8.3 20.8
4.2
4.2:
12.5;
8.3! 25.0
8.3 4.2
0.0
I
25.0
45.8'
8.1 , 16.7' . 0.0:
: 29.2
1
12.51
37.5i t
20.8: .
8.3i 4.2
i 37.5
12.5
I 41.T
I 29.2:
I
37.5!
16.7'
25.0' I
37.51
4.2:
00, . I 0.01
12.51 1
O.Oi 16.7:
i 0.0: ,
12.5/ 4.2:
I
0.0' ,
8.3' 4.2i ,
37.5
8.3; 1
12.51 I
4.2: , I
4.2i 12.5,
I
16.7i
0.0;
8.3 ,
8.3
, 41.7:
12.51
,
45.8! 1
8.31 16.7!
54.2: I
12.5'
O.ot
33.3 , ;
0.01
4.2[ !
41.71 , 0.0
8.l
0.0'
0.0:
4.2:
O.Oi 50.0!
12.5[
12.5; . 1
0.01 I
0.0 1
I
0.0 , 8.31
8.3 0.0;
o.oi
st.S
0.0
0.0 1
0.01
0.0 . ,
0.0
0.0
0.0
0.0'
0.0,
0.0;
0.0
0.0
0.0
0.0, i
O.Oi 0.0'
, O.Oi
I
0.0
0.0
0.0
O.O~
0.0:
0.0
O.Oi 0.0
i 0.0,
0.01
0.0,
0.0 0.0: O.O!
;
0.0:
st.6
0.0
0.0 ,
0.0
0.0,
0.0
0.0,
0.0
0.0
0.0
0.0
0.0
0.0,
0.0 I
O.Oi
0.0: I
0.0:
0.0,
0.0
0.0
0.0 i
0.0, , 0.0'
0.0
0.0,
0.0 I
0.0
0.0,
0.0
0.0
0.0
0.0,
0.0

Chapter.t. Bol101l1 faunll
Table 4. 1. contd ....
SPECIES st. 1 st. 2~ st. 3; st. 4 st. 5 st. 6, rl ----------+-- -----~------ -..--, ---~-- - -,.---- -,
Qenonefulgida ________ I 12.5! __ 8.3' 0.0: 0.0,_ 0.0. O.Oi
Armandia sp. I 20.8: 16.7 o.oi O.Oi 0.0: 0.0:
~egalom~a_sP· __ ~_~~-=~--1 - 8.3L_ 8.3 ___ 0.0 0.01 o.oi o.oJ iSyllis corn uta _______ ~ ___ 25.01_ 20.8: 8.3_ 8.3i 0.0' 0.0:
iSyllis gracilis 16.7! 25.0, 0.0 0.0, 0.0 0.0 1
! -- ---_._- ;
iEupolymnaJ!ebulosa_ ___ _ 12.5; 12.5' 16.7 29.2; 0.0 0.0;
ICRAB ! ' t "- ... -.------------ -------- j I
I
LeptoduiS sp._ ___ ____ 16.7i 12.5 i i
tolydectuscuc..ulife!_____ 8.3! 4.2!
Megalopa larva ________ _ Calappa hepatica_
:Diogene sp.
:Cardisoma carnifex
'pachygrapsusplicatus __
illlyograpsus paludicola I
iPlagusia sp. I - -- -- -
'Grapsus sp.
Eriphis sp.______
Uca tetragonon
IMacrophthalmus boscii
iUca inversa in versa I
!Tylodipax desigardi ~ilumnus hirtellus ---
[P.innot!ze~e; yisum ~ _ _ __ _ iPinnotheres pinnother.es
Thalamita crenata
'scyjla_serrata ____ _ Portunus orbitosinus
Macropipus cor.rugatus __
:Etisus_splendidus __
Actaeodes tomentosus .- ~-----.- ... --------
!oTHER CRUSTACEANS , - -
iPRA WNS AND SHRIMPS I - ----- --
,~!pheopsis_ equalis__ _ __ _ .Alpheuslottini __ _
37.5! 37.5
50.0;
4.2; 1
o.o~ ,
20.8: I
0.01 I
20.8: , 29.2:
I
29.2!
0.0' I
45.8 i
0.0:
20.81
41.7i I
25.0:
33.31
37.5' i
O.Oi j-- ..
4.2i I
0.0: 29.2, ,
33.3
4.2
4.2 8.3: , 4.2 0.0:
I
8.31 12.5
4.2 12.5
O.O! i
12.5;
16.1' 1
8.3! 16.71 20.8'
0.0
12.5
0.0 1
4.i I
33.31 , 1
I
__ 16.7;
I
i 33.31
0.0,
I I I
12.5' I
0.0
o.oi 0.0:
- 1-0.0:
i··
o.Oj I
4.2:
8.31 I
0.0:
O.O! , 0.0: , 4.21
20.81 I 0.0, I
8.31 , 0.01
I
0.0:
33.3:
4.2; 29.21
I
37.5 i
I 0.01 0.01
0.01 0.0
1 29.21
! I
I
4.2)1 0.0
4.2i , 0.0
1
0.0 1
16.7:
0.0'
0.0
4.2, ,
o.oi I 0.0, I
0.0.
12.5: 1
O.Oi I
29.21
4.2] 125
12.51
4.2i i
33.3'
12.51 , 0.0:
- r 0.0.
0.0' i
O.O! I
0.0;
I
8.3[ -- I
O.O!
0.0
0.0' , 0.0:
I
0.0
0.0
4.2
0.0:
0.0;
0.0: , 0.0: , 0.0
8.3'
0.01
4.2
8.3
0.0 i
0.0'
0.0: I 8.3, I
25.01
O.Oi O.Oi
I
O.O! i
0.0:
,
i O.Oi
I
O.O!
I
0.0
0.0 , 0.0:
0.0: , 0.0
0.0
0.0
4.2: 0.0
0.0
0.01
16.7
0.0
8.3 0.0
0.0, ,
0.0' ,
0.0'
O.Oi 12.5:
0.0
0.0
0.0 , 00' . ,
,
I
0.0;
O.O!

Chapter 4. Bol/o/ll /lIIIIIU
Table 4. 1. contd .... - ... _---- --- --_. --- -
SPECIES st. 1 st. 2 st. 3 st. 4 st. 5 st. 6 -------~- ----- - -
Alpheus sp. 8.3 4.2 0.0 0.0' 0.0 0.0 t
Metabetaeus minutus 8.3 12.5 0.01
0.0 0.0, 0.0 - -- .-- , ,
Nikoides maldivensis 1 O.Oi 8.3' 0.0: 0.0 54.2 33.3 - ,--
,AMPHIPODS I i i I
--- - -"- ---_.- .. _- T -, :Cymadusa imbroglio ! 41.7' 4.2 37.5! 20.8' 0.0 0.0 I - ._- . --- ; I
25.0; I
Maera pacifica I 33.3: 29.2: 33.3 0.0 0.0 , -- .- .. - --t- , -
i Mallacoota Jnsigni~_ i 20.81 20.8; 0.0 0.0 0.0 0.0 I
t --- I I , Slenothoe kaia 33.3 29.2 0.0 1 4.2 0.0 0.0 ISOPODS
f
Cirolana sp. 0.0 8.3 0.0: 0.0: 0.0' 0.0 I I
Seychellana expansa 25.0 12.5 4.2, 0.0 0.0 0.0 --
Accalathura borradailei - I 20.8 8.3' 0.0 0.0 0.0 0.0 i
'Paracilicaca setosa 50.0' 25.0 0.0 0.0 1 0.0 0.0 paraleptospheroma indica 20.8! 16.7 0.0 0.0 0.0 0.0 STOMATOPODS
Gonodactylus.ofs~ithii I 8.3' 8.3 0.0 0.0 0.0: 0.0 I --- ,
Apseudus sp. 0.0 0.0 0.0: 0.0 70.8 58.3 ,
Paratanaeidae sp. 41.7: 25.0 0.0' 0.0 16.7 4.2 Paranebalia sp. 16.7 16.7' O.Oi 0.0 0.0 0.0 'Siriella brevicaudata 20.8 20.8; O.O! 0.0: 0.0' 0.0:
:ECHINODERMS ,
'Linckia multi/ora 12.5: 0.0 0.0 O.Oi 0.0 0.0 I - - - -
I ,
fOphiactis savignyi 29.2: 25.0: 0.0 8.3: 0.0 0.0 I - - - --_. I ; ,
~Op'hicornella_se~l!q.~a 58.31 41.T 8.3: 0.01 0.0' 0.0 I
:Op"~iocoma scoloRendrina 41.7: 20.8 O.O! 00' 0.0 0.0 ---- - :- ----- ,- - I • I
I
Astropyga radiata __ _ _ 4.2: O.Or 0.0, 0.01 0.0: 0.0 - 1- 1
I 12.5' ,
:Echinometra mathaei 20.8, O.Oi 0.0 0.0: 0.0 t .- -- - - I , I
:Echinoneus cyclostomus r
20.8: 0.01 o.oi 16.71 0.0 0.0 iSalmacis bicolor
I :
16.71 4.2 0.0: O.O! 00 0.0 , I ,- • I I
0.0; iBohadschia subruba ____ 125 4.2 0.0, 0.0 0.0 8.3!
! ,Holothuria nobilis __ __ 4.2, 0.0: 0.0' 0.0 0.0 , i Holothuria scabra 125 O.Oi 0.0: 0.0, 0.0 0.0 SPONGES Aaptos cfchromis 33.3 37.5- 0.0: 0.0; 0.0 0.0 Gnachyrella voeltzkowii 0.0:
i 16.7, 12.5 0.0: 0.0 0.0
t • __
Chapter -I. BollolII fOll/llI
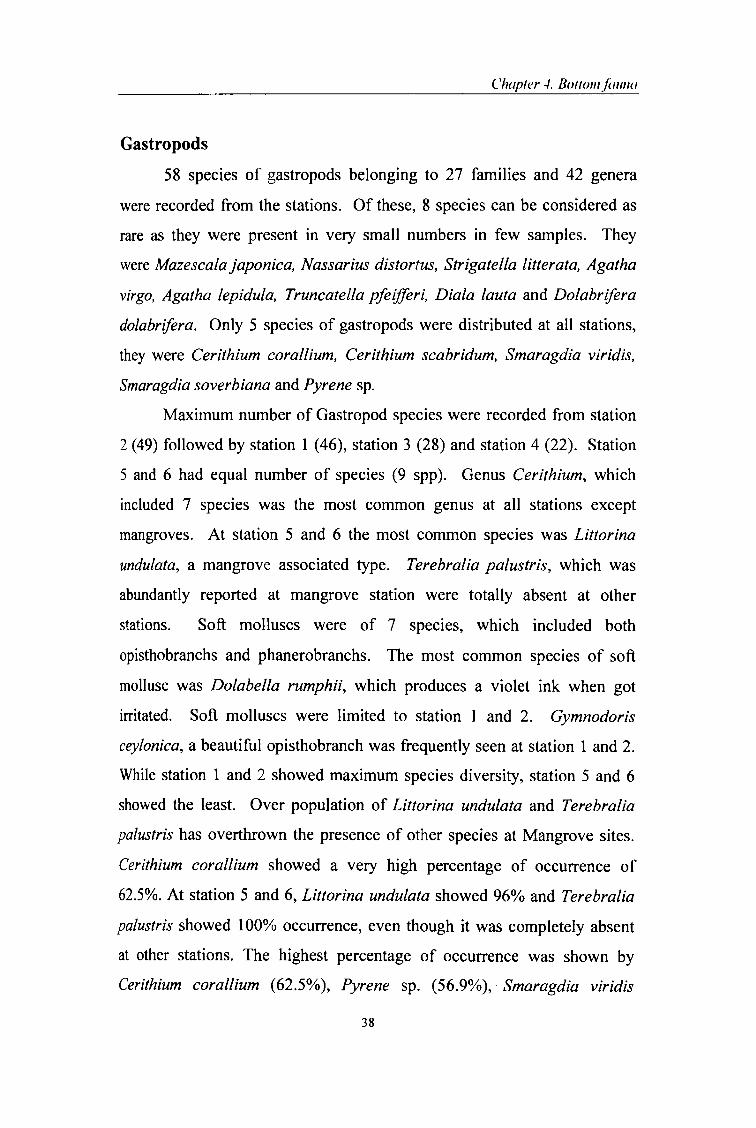
Gastropods
58 species of gastropods belonging to 27 families and 42 genera
were recorded from the stations. Of these, 8 species can be considered as
rare as they were present in very small numbers in few samples. They
were Mazescala japonica, Nassarius distorfus, Strigatella litterata, Agatha
virgo, Agatha lepidula, Truncatella pfeifJeri, Diala lauta and Dolabrifera
dolabrifera. Only 5 species of gastropods were distributed at all stations,
they were Cerithium corallium, Cerithium scabridum, Smaragdia viridis,
Smaragdia soverbiana and Pyrene sp.
Maximum number of Gastropod species were recorded from station
2 (49) followed by station 1 (46), station 3 (28) and station 4 (22). Station
5 and 6 had equal number of species (9 spp). Genus Cerithium, which
included 7 species was the most common genus at all stations except
mangroves. At station 5 and 6 the most common species was Littorina
undulata, a mangrove associated type. Terebralia palustris, which was
abundantly reported at mangrove station were totally absent at other
stations. Soft molluscs were of 7 species, which included both
opisthobranchs and phanerobranchs. The most common species of soft
mollusc was Dolabella rumphii, which produces a violet ink when got
irritated. Soft molluscs were limited to station 1 and 2. Gymnodoris
ceylonica, a beautiful opisthobranch was frequently seen at station 1 and 2.
While station 1 and 2 showed maximum species diversity, station 5 and 6
showed the least. Over population of Littorina undulata and Terebralia
palustris has overthrown the presence of other species at Mangrove sites.
Cerithium corallium showed a very high percentage of occurrence of
62.5%. At station 5 and 6, Littorina undulata showed 96% and Terebralia
palustris showed 100% occurrence, even though it was completely absent
at other stations. The highest percentage of occurrence was shown by
Cerithium corallium (62.5%), Pyrene sp. (56.9%), Smaragdia viridis
38

Chapter -I. BollolII Imllla
(52.8%), Smaragdia soverbiana (50%), Cerithium scabridum (45.8%),
Cerithium nesioticum (36.8%), Littorina undulata (24.3%) etc.
Bivalves
Altogether 12 specIes of bivalves were reported, out of which
station 5 and 6 did not show any occurrence of bivalves. Station 3 and 4
showed the presence of only four bivalves and station 1 and 2 showed 12
and 11 species respectively. Out of the 12 species, Lunulicardia auricula
appeared at station 1 only. Gafrarium divarticatum occurred in good
numbers at seagrass stations. Tellina palatum of different sizes were
obtained from all seagrass stations. Even though Mactra cuneata were
found abundantly at sandy intertidal areas, they were completely absent at
seagrass intertidal meadows. Pinna muricata was obtained only from
station 1 and station 2. Seasonal variations were observed in the
occurrence ofbivalves. They were totally absent at the mangrove sites.
Among bivalves, the highest percentage of occurrence was shown
by Gafrarium divarticatum (54.9%). Frequency occurrence of Tellina
palatum (19.4%), Pinna muricata (16%), Ctena delicatula (11.8%) were
also countable. Gafrarium divarticatum showed hundred percent
frequency of occurrence at station 3 and 4 but only 71 % and 58% at station
I and 2 respectively. Tellina palatum also showed moderate percentage of
occurrence at station 3 (37.5%), station 4 (45.8%), station 1 (20.8%) and 2
(12.5%). Pinna muricata which showed a frequency occurrence of 46% at
station 1 and 50% at station 2 was completely absent at other sites.
'Other Worms'
Wonns other than polychaetes were grouped separately and
constituted by 7 species. They were totally absent at mangrove stations 5
and 6 and at all other stations (seagrass) they were found distributed more
39
Chapter -I. Bolloll1 .fll/II/a
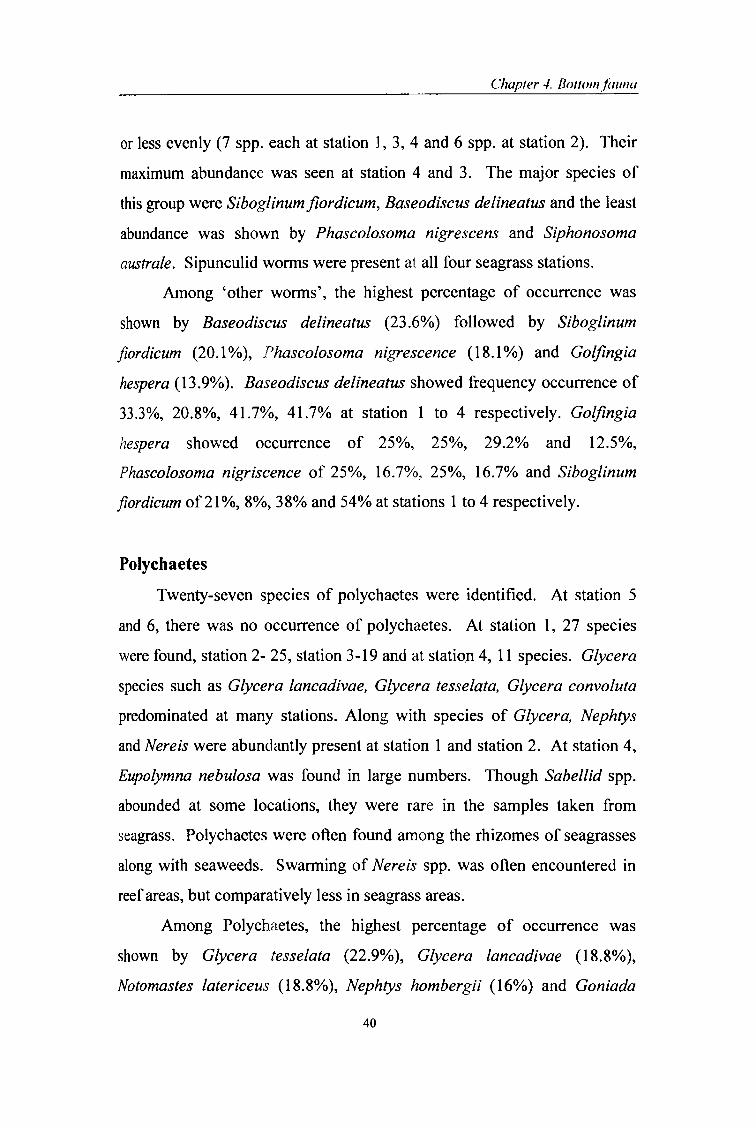
or less evenly (7 spp. each at station], 3, 4 and 6 spp. at station 2). Their
maximum abundance was seen at station 4 and 3. The major species of
this group were Siboglinum fiordicum, Baseodiscus delineatus and the least
abundance was shown by Phascolosoma nigrescens and Siphonosoma
australe. Sipunculid wonns were present at all four seagrass stations.
Among 'other wonns', the highest percentage of occurrence was
shown by Baseodiscus delineatus (23.6%) followed by Siboglinum
fiordicum (20.1 %), Phascolosoma nigrescence (18.1 %) and Golfingia
hespera (13.9%). Baseodiscus delineatus showed frequency occurrence of
33.3%, 20.8%, 41.7%, 41.7% at station 1 to 4 respectively. Golfingia
hespera showed occurrence of 25%, 25%, 29.2% and 12.5%,
Phascolosoma nigriscence of 25%, 16.7%, 25%, 16.7% and Siboglinum
fiordicum of21%, 8%,38% and 54% at stations 1 to 4 respectively.
Polychaetes
Twenty-seven species of polychaetes were identified. At station 5
and 6, there was no occurrence of polychaetes. At station I, 27 species
were found, station 2- 25, station 3-19 and at statio.n 4, 11 species. Glycera
species such as Glycera lancadivae, Glycera tesselata, Glycera convoluta
predominated at many stations. Along with species of Glycera, Nephtys
and Nereis were abundantly present at station 1 and station 2. At station 4,
Eupolymna nebulosa was found in large numbers. Though Sabellid spp.
abounded at some locations, they were rare in the samples taken from
seagrass. Polychaetes were often found among the rhizomes of seagrasses
along with seaweeds. Swanning of Nereis spp. was often encountered in
reef areas, but comparatively less in seagrass areas.
Among Polychaetes, the highest percentage of occurrence was
shown by Glycera tesselata (22.9%), Glycera lancadivae (18.8%),
Notomastes latericeus (18.8%), Nephtys hombergii (16%) and Goniada
40

Chapter -I. BOI/OlllfallllO
emerita (15.3%). At station 1 and 2, species such as Glycera, Goniada and
Nephtys were found at all seasons, while at station 3 and 4 Notomastes
latericeus and Eupolymna nebulosa were found along with Glyceridae
members.
Crabs
Altogether 24 species of crabs were found, out of which 18 were
found at station 1,20 at station 2, 10 at station 3, 11 at station 4,6 at station
5 and 4 at station 6. The most common species at station 1 were Calappa
hepatica, Macrophthalmus boscii and Thalamita crenata. At station 2,
dominant species were Thalamita crenata, Pinnotheres spp. and Calappa
hepatica. Station 3 showed comparatively lesser abundance of crabs. At
station 3, Thalamita crenata, Pinnotheres spp., Actaeodes tomentosus,
Pilumnus hirtellus etc. dominated. At station 4, Macrophthalmus boscii,
Pinnotheres spp., Calappa hepatica and Thalamita crenata were
dominated. At station 5 and station 6, the dominant species observed were
Scylla serrata and Uca spp.
Among crabs the highest percentage of occurrence were shown by
Thalamita crenata (19.4%), Pinnotheres pinnotheres (18.8%), Pilumnus
hirtellus (16.7%), Calappa hepatica (16.7%) and Macrophthalmus boscii
(16%). At station 1, species like Calappa hepatica, Macrophthalmus
boscii, Pilumnus hirtellus etc. exceeded more than 40% frequency of
occurrence. At station 2, no species were represented more than 40%
occurrence. At station 3, Thalamita crenata showed 41 % occurrence.
Other Crustaceans
Shrimps, carridean prawns, amphipods, isopods, stomatopods and
tanaeids were included in this group. Four species of prawns, 4 species of
amphipods, 5 species of isopods, 1 species of stomatopod, 2 species of
41

Chapter -I. BO/lOlII .1(1111 III
tanaeids and 1 paranebalia sp. were reported. The highest diversity of
other crustaceans was observed at station 2 (17 spp.) followed by 15 spp. at
station 1. The other four stations showed almost even distribution (4 spp.
each at both northern seagrass station and 3 spp. each at both mangrove
stations).
Shrimp, Nikoides maldivensis was often found at mangrove sites.
Cariddean prawns were found in seagrass samples intermittently.
Amphipods were present abundantly at seagrass beds but absent at
mangrove sites. Maera pacifica and Cymadusa imbroglio were the
dominant species of amphipods. The most dominant isopod species was
Paracilicacea setosa. Isopods and stomatopods were limited to station 1
and station 2. Tanaeids (Apseudus sp.) were abundantly found at
Mangrove sites. More than 10% frequency of occurrence was shown by
Nikoides maldivensis (11.1%), Cymadusa imbroglio (18.8%), Maera
pacifica (20%), Stenothoe kaia (11 %) and Paracilicacea setosa (12.5%).
Some species showed more than 40% frequency of occurrence at some
stations, which included Nikoides maldivensis (58.3% at station 5),
Cymadusa imbroglio (45.8% and 41.7% at station 1 and 3 respectively),
Paracilicacea setosa (50% at station 1), Apseudus sp., (70.8% and 58.3%
at station 5 and 6 respectively) and Paratanaeidae sp., (41.7% at station 1).
Echinoderms
11 species of Echinoderms were recorded under 8 families. They
were abundantly found at station 1 and 2. They showed a diversity of 11
spp. at station 1 and 8 spp. at station 2. The most dominant species were
Ophicornella sexadia, Ophiocoma scolopendrina and Ophiactis savignyi.
Holothurians and starfishes were comparatively lesser than the brittle stars
at the selected sites. They were showing only meagre presence at station 3
and 4 and completely absent at station 5 and 6.
42

Chap/er -I. Bol/m1/ faw/({
Some species like Ophiactis savignyi (33.3% and 25%),
Ophicornella sexadia (58.3%and 41.7%), Ophiocoma scolopendrina
(45.8% and 20.8%), Echinometra mathai (25% and 12.5%), and
Echinoneus cyclostomus (12.5% and 20.8%) showed high percentage of
frequency of occurrence at station 1 and 2 respectively. Starfish, Linckia
multi/ora showed their presence only at station 1 (12.5%).
Sponges
Two species of sponges Aaptos.cfchromis and Cinachyrella sp.
were frequently found in the benthos samples collected from station 1 and
2. Frequency of occurrence of these two sponges was comparatively
higher at station 1 (Aaptos.cfchromis and Cinachyrella spp. showed 33.3%
and 16.7% respectively) and station 2 (Aaptos.cfchromis and Cinachyrella
spp. showed 37.5% and 12.5% respectively).
Number of species of major groups found at the three different areas
(southern seagrass, northern seagrass and mangrove) are given below:
Major groups s. seagrass N. seagrass Mangroves
Gastropods 48 25 9
Bivalves 12 4
Polychaetes 25 15
Other worms 6 7
Crabs 19 11 5
Other crustaceans 16 4 3
Echinoderms 9 1 0
Sponges 2
Some of the maj or benthic macrofauna species collected during the
study are given in Plate 4.1, 4.2 and 4.3.
43

Chapt('r .J. B(Jffo/ll {allllU
Eurythoe complanala (polychaete) Eurythoe mathaei (po lychaete)
Plate 4.1 Major species of benthic macro fauna obtained from the study area

ChOI)/ I!I" 4. 80/10111./01/1/0
Ceratonereis erythraensis (polychaete) Nematonereis unicornis (polychaete)
Nereis kauderni (polychaete) Marphysa macintoshi (polychaete)
Uca sp. (mangrove crab)
Plate 4. 2 Major species of benthic macrofauna obtained from the study area

Chapter 4. BOllomlcJ/lI/u
Cerithium spp. (gastropod)
Plate 4. 3 Major species of benthic macrofauna obtained from the study area

4. 2. Standing stock
4. 2. 1. Biomass
Chapter -I. BOl/om/mllla
Biomass analysis was carried out at all six stations from September
1999 to August 2001. The individuals were classified into major groups
i.e., gastropods (group 1), bivalves (group 2), worms including polychaetes
(group 3), crabs (group 4), other crustaceans (group 5), echinoderms (group
6) and sponges (group 7). Only group wise wet weight biomass analysis
was conducted. From the mangrove sites, biomass of mangrove whelk,
'Terebralia palustris' was separately analysed because of its high biomass.
All other gastropods except Terebralia palustris were weighed shell-on
owing to their smaller size.
Biomass analysis (wet weight) was made group wise, stationwise,
season wise and month wise. The yearwise and seasonwise biomass
distribution are given in Fig. 4.1 and 4. 2. The monthwise distribution of
biomass at each station are given in Fig. 4.3
The gastropods formed major share of biomass at all stations. From
the station wise analysis, it was found that stations 1 and 2 showed
maximum total average biomass of 184.44 glm2and 165.61 g/m2
respectively. The mangrove sites recorded a total average biomass of 118.3
glm2 and 101.1 glm2 for station 5 and station 6. The lowest total average
biomass of 78.7 g/m2 and 56.5 glm2 for station 3 and 4 respectively were
recorded at the northern seagrass stations. From the seasonwise analysis, it
was found that post-monsoon season contributed major share of total
biomass followed by monsoon at all three areas and the lowest total
biomass was observed in pre-monsoon season at all three areas.
Stationwise analysis
Station wise average biomass of major groups of benthos (glm2) are
given in Table 4. 2.
44

i t I
I I i j Fig. 4. 1. Yearwise total biomass at different stations
C>
$ '" l i ~
s ~ - l ~ -'" ... g ~ t; -~
~ l J I -C> - '" ~ ...
II II II II
Chapter 4. BOllomfauna
l
~ .. •
.Vear1
.Vear2
~
'" .. • I_ monsoon 0 post-mon _ pre-mon 1
Fig. 4. 2. Seasonwise total biomass at different stations

700
600
500
400
300
200
100
0
711
• 511 --
181
601
5111 --280
1" 0
Chapter 4. Bottomfauna
Station 1 Station 2
Station 3 Station"
Station 5 Station 6
ci. ~ c:: .. I 'S a- S c:: .. t 'S ci. ~ c:: .. t '!i a- ~ c:: .. t 'S i • Cl • • D Cl • • D :i 4 .., tI • :I
.., G .., :I :I ..,
Cl) z .., :I :I ..,
Cl) Cl) z .., :I Cl) z 11
fill fill .. fill ... ...
Fig. 4. 3. Monthwise distribution ofbiomass (g/m2) at different stations

Chap/er -I. BollolII /(l/II/{/
Station 1
Total biomass for the pre-monsoon season was estimated as 870.9g.
For monsoon it came up to 1185.6g and for post-monsoon it was 2298g. Of
the total biomass of 4354.6g, Year I contributed 1713g and Year II
contributed 2642g. The groups, which shared biomass, were gastropods
(4030g), bivalves (268g), wonns and polychaetes (18g), crabs (7g),
echinodenns (12g) and sponges (4g). Monthly average was estimated as
168 glm2 for group L 10.5 glm2 for group 2, 0.7 glm2 for group 3, 0.7
gJm2 for group 4, 0.28 glm2 for group 5, 0.5 glm2 for group 6 and 0.18
gJm2 for group 7' Highest values of biomass were noticed at this station
during October, November and December months. Monthly values of
biomass ranged from 18 glm2 in April 2000 to 615 glm2 in October 2000.
Station 2
At station 2, total biomass values for pre-monsoon, monsoon and
post-monsoon were 945g, 1608g and 1421g respectively. Of the total
biomass of 3974g, Year I contributed 1040g and Year 11 contributed
2935g. Groupwise break up showed that group 1-7 contributed 3607 g,
319g, 109, 16g, 6g, 9g and 8g respectively. Monthly biomass values
ranged from Ilg in April 2000 to 421 g in December 2000. Monthly
averages were 150.3 glm2 (group 1), 13.3 glm2 (group 2), 0.4 glm2 (group
3),0.67 glm2 (group 4), 0.23 glm2 (group 5), 0.37 glm2 (group 6) and 0.35
gJm2 (group 7).
Station 3
Total biomass was 39L7g in pre-monsoon, 699.84g in monsoon and
797.28g in post-monsoon and the grand total came up to 1888.8g. Year
wise break up showed that Year I contributed 1217g. and Year Il 671g.
Item wise contribution was 813g (group I), 1015.7g (group 2), 29g (group
45

Chapter -I. BOIIOl1lfUII1U1
3), 27g (group 4), 4g (group 5) and 0.16g (group 6). Group 7 was not
recorded at this station. Monthly biomass values ranged from 12 glm2 in
February 2001 to 188 glm2 in July 2000. Monthly averages were 33.8 glm2
(group 1), 42 glm2 (group 2), 1.2 glm2 (group 3), 1.11 glm2 (group 4) and
0.17 glm2 (group 5). Biomass of group 6 was negligible.
Station 4
Biomass values were 403g during pre-monsoon, 432g during
rnonsoon and 520g during post-monsoon with a grand total of 1355.04g.
Total biomass for Year I and II were 855.4g and 500g respectively. Group
wise contribution was 767g (group 1), 528g (group 2), 33g (group 3), 26g
(group 4), 0.64g (group 5) and 0.48g (group 6). Group 7 was not recorded
at this site. Biomass values ranged from 14 glm2 in March 2001 to 135
glm2 in July 2000. Monthly averages were 31.9 glm2 (group 1), 22 glm2
(group 2), 1.35 glm2 (group 3), 1.08 glm2 (group 4), 0.03 glm2 (group 5)
and 0.02 glm2 (group 6). Biomass of group 7 was negligible.
Station 5
Total biomass observed was 2840g. Out of which 787g, 1032g and
1021g were contributed by pre-monsoon, monsoon and post-monsoon
seasons respectively. Year I contributed 1365g and Year 11, 1475g.
Bivalves, worms including polychaetes, echinoderms and sponges were not
recorded at this station. Group 1 (gastropods), 4 (crabs) and 5 (other
crustaceans) contributed 2772g, 53.6g and 14.88g respectively. Monthly
biomass values ranged from 18 glm2 in April 2000 to 259 glm2 in
December 1999. Monthly averages of groups were 115.5 glm2 (group 1),
2.2 glm2 (group 4) and 0.6 glm2 (group 5).
46

Chapter -I. Bol/o/ll fa/ll/(l
Station 6
Total biomass observed was 2426.24g. For pre-monsoon, monsoon
and post-monsoon the biomass values were 686.4g, 858g and 882g
respectively. Year wise break. up showed that Year I and II contributed
1297g and 1129g respectively. During the period of study Group 1
contributed 2365g, group 4, 38g and group 5 23g. Monthly averages were
98.5 g/m2 (group I), 1.59 g/m2 (group 4) and 0.9 g/m2 (group 5). All other
groups were absent 8.t this site. Monthly biomass values ranged from 43
gJm2 in February 2001 to 259 g/m2 in December 1999.
SeasoDwise analysis
Season wise average biomass values of major groups of benthos
(gJm2) at each area are given in Table 4. 3. In general, a marked seasonal
variation in biomass values of the bottom fauna was observed at different
areas. The gastropods showed their highest biomass value during post
monsoon season at the southern seagrass as well as mangrove region and
during monsoon at the northern seagrass region. They showed their least
biomass values during pre-monsoon at both seagrass regions and during
monsoon at the mangrove area. The bivalves showed their highest and
lowest biomass values at the monsoon and pre-monsoon respectively at
southern seagrass area and post-monsoon and pre-monsoon season at
northern seagrass area. At the mangrove area the dominating mollusc
Terebralia palustris showed their highest and lowest abundance during
monsoon and pre-monsoon respectively. Crabs and echinoderms showed
their highest biomass value during monsoon irrespective of any area and
'other crustaceans' and sponges showr.:!d their maximum biomass during
pre-monsoon at the two seagrass areas.
47

Chapter -I. Bottom fauna
Table __ 4.}._Station ~ise_ avg. biomass of major groups_ofbenthos (g/m2)
iMajorgroups__ _._ area :1 area !2 ____.j area;3 f-.--- ____ .___ ___ i St. 1 i_St. 2 ! St. 3 St. 4_~ St. 5 : St. 6 Q~Vopods ____________ :167.93 :)50.2~_ 33.89 31.96 __ ;)15.48 i 98.53 Bivalves i 11.15 13.30 42.32 22.01: 0.00 0.00 [
0.00 ~~rffi-s_(i~~l._po!y~haete;)]=0.7J-I __ 0.40_ 1.20 1.35--1 0.00 :Crabs ! 0.65 i 0.67 r0ther-~~-;~c~itn~~----~~- ~:-r~ 0.3 _- L 0.23
Echinodenns ________ ----1-- 0.5 -I _0.37 -i Sponges ___________________ 0.18i _0.35 ; Total I 181.44 ! 165.61 ! I _!.
1.11 1.09 I 2.23 1.59 - - ---I
0.17 0.03 I 0.62 0.97 0.01 0.02 0.00 0.00 0.00 0.00 0.00 0.00 78.70 56.46 118.33 101.09
Table __ 4. 3. __ ~~g~_s~asonal biomass of major groups of be nth os (g/m2)
,S()uthern seagr:assar:ea_ ! pre .. mOD! mODsooD_ ~ post-moD Gastropods_________ _; 104.9 I 154.13 ! 218.29 Bivalves i 6.24 17.78 12.65 • - -.. - -- ---- -- ------ --- 1-
Wonns (incl. polychaetes) : 0.72 0.53 0.45 I . --
Crabs 0.57 1.07 0.35 I -- .... -.. _--
Other crustacean 0.52 0.13 0.15 ~chinodenns _ 0.24 0.71 0.35 Sponges 0.33 0.23 0.23 I
Total 113.52 174.58 232.47
Northern seagrass area Gastropods Bivalves !",onns (incl. polychaetes) Crabs 1---- ------ -
pther_ crustacean ___ _ ~chinodenns __ Sponges I ._-_. --
Total
-- - .. - -
Mangrove area __ _ _ _ Gastropods _except Terebralia palustris Terebralia palustris Bivalves
---- ----------- ------_. - .
,Wonns (incl. polychaetes) [
Crabs Other crustacean . - - - -------- _ .. -_ .. Echinodenns 'Sponge_s___ ____ ______ . Total
[
-I
! I
: pre-moD , , 25.76 I
21.74 1.18 0.77
! _ 0.17 I 0.03
o 49.65
! pre-mon! 57.48 31.79 i
o o
1.73 1.08 o o
92.08
mODsOOD 38.37 29.73 0.92 1.65 0.05 0.01 o
70.73
mODsOOD 50.08 64.19
o o
2.67 1.16 o o
118.1
post-mon 34.64 45.03 1.73. 0.88 0.08 o o
82.36
post-moD 53.85 63.63
o o
1.34 0.14 o o
118.96

('hap/er -I. BOllolII fllllllll
4.2.2 Numerical abundance
Yearwise, groupwise and monthwise contribution to numerical
abundance by different stations/areas are given in Fig. 4.4, 4.5 and 4.6.
Gastropods were showing their maximum average monthly
abundance (no.!0.25m2) at station 2 (604) followed by station 1 (362),
station 6 (250), station 5 (212), station 3 (159) and station 4 (137).
The bivalves were distributed only at the seagrass stations and total
numerical abundance of bivalves at each seagrass station was 1524 (25%)
at station 1, 1064 (18%) at station 2, 1516 (25%) at station 3 and 1920
(32%) at station 4. Gafrarium divarticatum itself recorded an abundance
of 1360 at station 1, 796 at station 2, 1364 at station 3 and 1804 at station
4. Bivalves were showing their maximum average monthly abundance
(No.! 0.25m2) at station 4 (80) followed by station 1 (64), station 3 (63) and
station 2 (44).
Total abundance of wonns at different seagrass stations were 300 at
station 1 (18%), 188 at station 2 (11 %), 476 at station 3 (29%) and 708
(42%) at station 4. They were totally absent at station 5 and 6. Siboglinum
fiordicum showed the maximum abundance (164) at station 1, Baseodiscus
delineatus at station 4 (264) and Phascolosoma nigrescens at station 4
(196). The average monthly values (no.!0.25m2) were 12.5, 7.8, 19.8 and
29.5 for stations 1 to 4 respectively.
Total abundance of polychaetes for the entire study period at
different seagrass stations were 1132 (38%) at station 1, 564 (19%) at
station 2, 668 (22%) at station 3 and 644 (21 %) at station 4. They were
totally absent at stations 5 and 6. Polychaetes were showing their
maximum average monthly abundance at station 1 (47 nos.! 0.25m\
followed by station 3 (28 nos.!0.25m2), station 4 (27 nos.!0.25m2
) and
station 2 (24 nos.!0.25m\ Glycera spp. predominated in many samples of
48

Chapter 4. Boltom fauna
Fig. 4. 4. Yearwise total benthic abundance (nos.) at different stations
100%
"'" 60%
.... 20%
... J
j 't_ 11 • • • < E J H • U l 0 I 5 jJ
b. w ;:
• southern seagrass 0 northern seagrass • mangroves
Fig. 4. 5. Areawise share to the numerical abundance of major groups

Chapter 4. Bottomfauna
1158 STATION 1 STATION 2 1_
• 11258 11_
'! 158
j5lO 258
0
1158 STATION 3 STATION 4
1510 .! !1258
11_
'! c5 158 c
510
250
0
1158 STATION 6
15_ STATION 5
1'-1_
. 151 '! :i-
251
I
I Q :lE ..., en Q :lE ..., III Q :lE ..., III Q :lE .. .. .. .. ...
Fig. 4.6. Monthwise distribution ofbenthic abundance (no./O.2Sm2) at different stations
...,

Chapler -I. BoI/OIII/OIllW
which the total number of Glycera lancadivae itself came up to 208 at
station 1 and 96 at station 2. Glycera tesselata dominated at station 3
(136), and station 4 (256). Eurythoe mathaii was abundant at station 3
(172).
Crabs showed their maximum average monthly abundance (nos.!
0.25m2) at station 1 (32), station 2 (18), station 3 (10), station 4 (9), station
5 (2) and station 6 (2).
Crustaceans other than crabs were considered as a single group and
referred as 'other crustaceans'. They showed their maximum average
monthly abundance (nos.!0.25m2) at station 1 (62), station 2 (42), station 3
(20), station 5 (19), station 6 (9) and station 4 (7).
Numerical abundance of echinoderms at different seagrass stations
were 260 at station I, 148 at station 2 and 8 at each station 3 and 4.
Numerical abundance of sponges at station 1 and 2 were 48 and 60
respectively. At all other stations, they were completely absent.
Station wise analysis
Contribution (%) of major benthic group at each area is given in Fig.
4.7. Specieswise contribution to the total abundance at each station is given
in Table 4. 4.
Station 1
Gastropods contributed 62%, bivalves 11 %, other worms 2%,
Polychaetes 8%, crabs 5%, other crustaceans 10% and echinoderms 2%.
Among the gastropods, Cerithium corallium itself represented 25%
of the total. C. alveolum 2%, C. scabridum 13%, Pyrene sp. 2%,
Smaragdia viridis 2% and S. soverbiana 7.5%. All other individuals
represented less than 1 %. Contribution of Mazescala japonica, Niso
he izens is, Vittina variegata, Terebralia palustris, Agatha virgo, A. lepidule,
49

Chapter -I. Bollo//1 fa W III
Table 4.4. Specieswise contribution (% of numerical abundance) to total abundance.
- --- -- ---- -
Species -- - - -------- ~------
St.1 St.2 St.3 St.4 St.S St.6
GASTROPODS - -- - ----- ~-- -
Punctacteon amakusaensis 0.03 0.11 0.22 0.00 0.00 0.00 ----_ .. -_. --
Marania Iirata I
0.14 0.09 0.00 0.00 0.00 0.00 ! - -------- _._.
lCerithium corallium ! 22.58 29.76 3.94 3.85 10.62 ' 11.61
'Cerithium alveolum 3.63 3.12 1.22 1.67 0.00 0.00 -
;Cerithium dialeucum 0.31 0.60 0.50 0.29 0.00 0.00
Cerifhium rarimaculatum i 0.03 0.07 0.00 0.00 0.43 0.19 - - . -_.
i Cerithium scabridum 13.89 I 19.93 , 6.61 8.10 0.50 0.77 ! I I
Cerithium rostratum 0.39 I 1.60 I 7.05 I 4.37 0.00 0.00 I I
Cerithium nesioticum 0.82 5.79 3.00 4.02 0.00 0.00
Clypeomorus corallium 0.06 0.02 0.00 0.00 0.00 0.00
Rhinoclavis sinensis 0.06 0.20 0.06 0.23 0.00 0.00
Pyrenesp. 2.25 1.87 11.83 12.70 0.93 0.38
:Pyreneyulpecula ~ 0.65 ,
0.47 1.50 0.46 0.00 0.00
Metanachis marquesa 0.39 ! 0.27 1.00 3.85 0.00 0.00
Conus catus 0.14 0.38 0.50 I 0.06 0.00 0.00 _ .. _--~ ~
Conus ebraeus 0.17 I 0.02 0.00 0.00 0.00 0.00
Coralliophila costularis 0.51 0.80 0.17 0.23 0.00 I 0.00
Cyprea _ annulus 0.08 0.04 0.00 0.00 0.00 0.00
Cyprea arabica I 0.08 0.07 0.00 0.00 0.00 0.00
Cypreamoneta 0.51 0.27 0.33 0.00 0.00 0.00 I
:Cypr~a teres 0.11 0.04 0.00 0.00 0.00 0.00 I
Cypreafigris __ ~_ 0.08 I 0.07 0.00 0.00 0.00 0.00
ivlazescala japonica 0.00 0.02 0.00 0.00 0.00 0.00 ._j---
Niso heizensis 0.00 0.36 1.50 0.46 0.00 0.00 ! _____ 0 _____ • ____ - -I - t --
~e!ste~niapilsbryj ____ . 0.08 ! 0.00 0.00 0.00 I 0.00 0.00 I , -_.t _0' - ~
Littorina undulafa 0.28 1.36 I 1.33 0.00 I 59.37 ' 66.52 : i - - - -_._----- .- t
Sl~igatella litte!.ata 0.00 ! 0.02 , 0.00 0.00 ,
0.00 0.00 , ---_ .. _--. 1-'--
:Drupella.sp. ______________ 0.03 ; 0.04 0.00 0.06 0.00 , 0.00 I I .- - -- i
!Nassarius distortus --- - j 0.00 0.02 0.00 0.00 i 0.00 0.00 -- i - j
Wiotha stigmaria. __ I 0.03 I 0.40 0.17 0.52 : 0.00 0.00
Zeuxis sp. 0.34 0.00 0.00 0.00 , 0.00 0.00
Polinices flemengium 0.25 0.00 , 1.44 0.11 0.00 0.00
Natica rufa 0.06 0.07 0.00 0.00 0.00 0.00

Chap/er .J. BOllomfllulIlI
Table 4.4. contd ... -,
:Species •. St.t I St.2 St.3 St.4 St.S St.6 - ..
ISmaragdiayiridis _ 2.47 2.83 5.00 !
2.53 0.43 0.19 ,
Sma~agdia sOy!"erbjana 7.84 I 6.97 2.72 2.59 0.14 0.64 I
!
Vittina yariegata __ , __, 0.00 0.78 0.50 0.06 0.00 0.00
irerebralia palustris_ .'_ 0.00 0.00 0.00 0.00 18.03 14.99 ... i
~gatha virgo, ___ .. I 0.00 0.00 0.00 0.00 0.00 0.00
Agatha lepidule I 0.00 0.00 0.00 0.00 0.00 0.00 I .. . .. --.- .. ,.-,-.
[pyrgulina pupula 0.00 0.09 0.72 0.23 0.00 0.00
~Cymatium neobaricum 0.00 0.04 0.11 0.00 0.00 0.00 I
, i .
Cymatriton, nic,l?baricum 0.00 i 0.00 0.11 0.00 0.00 0.00 -- - I I Cinctiscala sp.
I
0.39 0.16 0.00 I 0.00 0.00 0.00 I I
Decorifer insignis 0.11 0.07 0.00 0.00 0.00 0.00
Casmeria ponderisai 0.00 0.07 0.00 0.06 0.00 0.00
Strombus canarium 0.20 0.02 0.17 I 0.00 0.00 0.00
Strombus mutabilis 0.20 0.20 0.28 0.00 0.00 0.00
!Cinguloterebra hedleyana I 0.14 0.49 0.33 0.57 0.00 0.00 l - -- -
iMargarites helicina 0.39 0.38 0.00 0.00 0.57 0.70 I I Truncatella pfeifJeri 0.00 i 0.00 0.00 0.00 0.00 0.00
Unidentified 129 0.51 0.18 0.61 0.34 0.00 0.00
,SOFT MOLLUSCS
polabella rumphii 0.34 0.22 0.00 0.00 0.00 0.00
:Polycera sp. 0.08 0.09 0.00 0.00 0.00 0.00
Gymnodoris ceylonica 0.03 0.02 0.00 0.00 0.00 0.00
!Elysia sp. _ 0.31 0.09 0.00 0.00 0.00 0.00
iSmargdinella,canaliculata 0.20 0.13 0.00 0.00 0.00 0.00
jdiala lauta 0.00 0.00 0.00 0.00 0.00 0.00 I
DolajJr.ifera dolabrifera I 0.00 0.00 0.00 ! 0.00 0.00 0.00 ,- I
,
BIVALVES ---" - - - -
Lunulicardia auricula 0.08 0.00 0.00 0.00 0.00 0.00
Cardium asiaticum 0.37 0.04 0.17 0.00 I 0.00 0.00
~Corculum impressum I 0.11 I 0.04 0.00 0.00 0.00 0.00
!Ctena delicatula 0.42 0.33 0.44 0.00 0.00 0.00
!Mactra c~~e~ta -
I 0.06 0.02 0.00 0.00 0.00 0.00 ,
IMyador.opsis_ brevispinioys 0.17 i 0.20 0.00 0.17 i 0.00 0.00
'Lithophaga nig~a . 0.14 0.13 0.00 I
0.00 0.00 0.00
Mo.diolus _metcalfei _ __ '. ___ 0.06 0.09 0.06 0.11 0.00 0.00

( '/llIpler -I. B01101l1/lllll1l/
Table 4. 4. contd ... -
Species St.l St.2 St.3 St.4 , St.5 St.6
[Pinna m~ricata 0.34 0.29 0.00 0.00 0.00 0.00
!Tellinapala-tul1l-_-_~-__ _ ~ I
0.14 0.07 1.44 1.38 0.00 i I 0.00
- .i-T I
Gaf!arJum divarJ!~catum , 8.74 I 4.43 18.93 ! 25.92 0.00 0.00
Pe~iglypta puerpura __ . 0.08 ,
0.27 0.00 0.00 0.00 0.00
WORMS : . -- - .. _---.------- ----- - - --,
:Baseodiscus delineatus 0.37 ! 0.25 1.22 3.79 0.00 0.00
!Golfingia hespe~a 0.17 0.20 0.67 0.34 I 0.00 0.00
Phascolo!oma.ni1Jr.escens 0.08 0.07 2.22 2.82 0.00 0.00
!Siphonosoma australe i 0.08 0.00 0.33 0.34 ,
0.00 0.00 I
ISipunculus_indicus 0.14 0.09 0.61 0.40 0.00 0.00
Siboglinum fiordicum 1.15 I 0.29 1.33 i 2.13 0.00 0.00
Hoplonemertean sp. 0.11 0.16 0.22 0.34 0.00 0.00
POL YCHAETE WORMS
Scoloplos sp. 0.06 0.02 0.00 0.00 0.00 0.00
Eurythoe complanata 0.28 0.02 0.56 1.84 0.00 0.00
'Eurythoe mathail 0.14 0.07 2.39 0.00 0.00 0.00
!Notopygos variabilis 0.20 0.04 0.00 0.23 0.00 0.00 I
Wotomastes latericeus ! 0.17 0.13 0.39 1.21 0.00 0.00 :
Cirratulus sp. 0.14 0.09 0.00 0.00 0.00 0.00
Marphysa macintoshi 0.03 0.04 0.33 0.52 0.00 0.00
Nematonereis unicornis 0.11 0.00 0.11 0.00 0.00 0.00
Glycera convoluta 0.28 0.16 0.00 0.00 0.00 0.00 --
Glycera _lancadivae 1.46 0.53 0.22 0.11 0.00 0.00
iG1ycera subaena 0.22 0.13 0.50 0.00 0.00 0.00
:GlyceraJesselata 0.22 0.09 1.89 3.68 , 0.00 0.00
'Glycerasp. 0.06 0.00 0.33 0.29 0.00 0.00
Goniada emerita I 0.25 0.20 0.17 0.34 0.00 0.00 I - ----- -- --- i
Nephtys dibranchus i 0.20 0.07 0.06 0.00 0.00 0.00
Nephtys hombergii 1.38 0.25 0.11 I 0.00 0.00 0.00
Nephtys inermis 0.25 0.11 0.22 0.00 0.00 0.00
Ceratonereis erythraensis I 0.22 ,
0.09 0.56 0.17 0.00 0.00
Nereis kauderni 0.28 0.04 0.00 0.17 0.00 0.00
,NereisJ~_ifasciata ___ 1.07 0.42 0.50 0.00 I 0.00 0.00 I I
'Arabella iricolor iricolor 0.17 0.09 0.11 0.00 I 0.00 0.00

Chapter.t. Bollol11 fauna
Table 4. 4. contd ...
Species St.l St.2 St.3 St.4 St.5 St.6 I
. --
iOenone fulgida 0.l7 0.07 0.00 0.00 0.00 0.00
~rmandia sp. ,
0.11 0.09 0.00 0.00 0.00 ! 0.00
iMegalomma sp .. 0.06 0.04 0.00 0.00 0.00 0.00
':Syllis corn uta 0.20 0.l3 0.22 0.l7 0.00 0.00
ISyl/is gracilis_ 0.11 0.13 , 0.22 0.00 0.00 0.00
Eupolymna nebulosa 0.l1 0.07 0.39 0.52 0.00 0.00
CRAB ---~ ---- -
Leptoduis sp. 0.22 0.09 0.00 0.06 0.00 0.00 ,
[Polydectuscuculifer_ _ . ---I 0.06 0.02 0.00 0.00 0.00 0.00
:Megalopa larva I 0.31 0.31 0.00 0.00 0.00 0.00
iCa1appa hepatic~ -
0.82 0.25 0.00 0.34 i 0.00 0.00 I
IDiogene sp. 0.03 0.02 0.06 _j._ 0.00 ,
0.00 0.00 ,
ICardios~ma· ;a~~if~~----- i
0.00 0.02 ,
0.11 0.00 0.07 0.00
f!.achygrapsus pli.catus 0.17 0.04 0.00 0.l1 0.00 0.00
Jllyograpsus paludicola 0.00 0.02 0.00 0.00 0.00 0.06
Plagusia sp. 0.14 0.00 0.00 0.00 0.00 I 0.00
'Grapsus sp. 0.25 i 0.04 0.06 0.00 0.00 0.00 I
IEriphis sp. i
0.20 0.07 0.39 0.17 0.00 0.00 --- ----
iUca tetragonon_ ! 0.00 0.02 0.00 0.00 0.14 0.26 ------------- - ,
iMacrophthalmus_ boscil I 0.93 0.09 0.11 i 0.80 0.00 0.00 - 1--
IUca inversa inversa ,
0.00 0.00 0.00 0.06 0.07 0.13 , - -.. -
Tylodipax desigardi 0.11 0.07 0.00 0.29 0.14 : 0.00
Pilumnus hirtellus 0.45 0.09 0.39 0.29 0.00 0.00 ----- - - ------
Pinnotheres pisum 0.17 ! . 0.04 0.06 0.06 0.00 ! 0.00 ----._- -
,Pinnotheres pinnotheres 0.25 0.47 0.72 0.63 0.00 0.00
iThalamita crenata 0.76 0.49 0.94 0.34 0.14 0.00
,scylla se~~qta. _______ 0.00 i 0.00 0.00 0.00 0.43 0.l9
;Portunus orbitosinus 0.03 0.07 0.00 ,
0.00 0.00 0.00 I
iMacropipus_ corrugatus _ . 0.00 0.00 0.00 ,
0.00 0.00 0.00
£.tisus_ sple ndidus 0.22 0.02 0.00 0.00 0.00 0.00
Actaeodes tomentosus 0.28 0.l1 0.44 0.00 , 0.00 0.00
OTHER CRUSTACEANS -- -
PRAWNS AND SHRIMPS . -
Alpheopsis equa/is 0.25 0.09 0.06 0.11 0.00 : 0.00
Alpheus lottini 0.00 : 0.00 0.00 0.00 0.00 0.00 --_ .. --_. _._- .

Table 4. 4. contd ...
Species __ _. ~lpheus sp. ___ _
iMetabetaeus minutus
Wikoides maldivensis
AMPHIPODS
St.1 0.06
0.06
0.00
i 2.42
Chapter -I. B01l01ll./llllllll
St.2 St.3 St.4! St.5 St.6 1
0.02 0.00 I 0.00 I 0.00 0.00
0.07_: 0.00 ""j_ 0.00 _I 0.00 0.00
0.09 0.00 0.00 I 1.57 0.89
1.09 ! 0.00 , Cymadusa imbroglio
Maera_paeifiea ~ __
Mallaeoota insignis
Stenothoe kaia
ISOPODS
___ L_ 4.39
0.22
3.43
0.31
0.27
4.22
2.33
! 0.00
0.00
1.09 -I ". 0.00 i 0.00 i 0.00 Tt
0.00
0.00
0.00
0.00 '
Cirolana sp. I "
Seychellana expansa
Accalathura borradailei
. i 0.28 I
I 1.10
0.03
0.17
0.14
0.06 I 0.00
0.11 I 0.00
0.09 0.17 0.00 .! 0.00 I 0.00 0.00 0.00 0.00
0.11 0.00 0.00 0.00 0.00
Paracilieaeea setosa I 0.45 0.16
0.09
0.00 1 0.00
0.00 0.00
0.00
0.00
0.00
0.00 Paraleptosphaeroma indiea 0.14
STOMA TOPODS
Gonodaetylus. of smithii."
Apseudus sp.
Paratanaeidae sp.
Paranebalia sp. I
Siriella brevieaudata
ECHINODERMS
Linckia multi/ora
Ophiaetis savignyi ___ " _
Ophieornella sexadia
Ophioeoma seolopendrina
Astropyga radiata
Echinometra mathaei
Echinoneus_ cyclostomus_ .
SalmaGis bieolor - --- -- --- -- - --- -- ----
Bohadsehia subruba
Holothuria nobilis
Holothuria seabra
SPONGES
0.06 0.04
0.03 0.00
0.67 0.22
0.11 0.09
0.14 I 0.18
0.08
0.25
0.62
0.34
0.03
0.17
0.00
0.13
0.31
0.11
0.00
0.07
0.08 0.11
0.11 0.02
0.06 0.02
0.03 1, 0.04 r--
0.06 0.00
0.00
0.00
0.00
0.00
0.00
0.00 i 0.00 0.00
0.00 5.92 2.42
0.00 0.50 0.06
0.00 0.00 0.00
0.00 0.00 0.00
0.00 '0.00 0.00 0.00
0.00 i 0.11 0.00 0.00
0.11 0.00 0.00 0.00
0.00
0.00
0.00 0.00 0.00
0.00 0.00 0.00
0.00 I 0.00 0.00 0.00
0.00
0.00
0.00
0.00
0.00
0.00 0.00 0.00
0.00 ! 0.00 ' 0.00
0.00 0.00 0.00
0.00 0.00 0.00
0.00 0.00 0.00
Aaptos_efehromis "" 0.22
Cinaehyrella_voeltzko_"~JL._ 0.11
0.27 0.00
0.07 i 0.00
0.00 0.00 0.00
0.00 0.00 0.00

Chap/er -I. Bol/om fll/lIIlI
Pyrgulina pupula., Cymatium neobaricum, Casmeria ponderisai and
Truncatella pfeifferi were very less at this station. Among bivalves,
Gafrarium divarticatum contributed 90% of individuals followed by
Cardium asiaticum and Pinna muricata. Siboglinum fiordicum contributed
major share of individuals in the category of "other wonns", Uca spp. and
Scylla serrata were not found at station 1. However Calappa hepatica
fonned the major share of crabs followed by Thalamita crenata. Carridean
prawns fonned 90% of other crustaceans, the major share contributed by
Alpheopsis equalis and Alpheus sp. In seagrass beds, amphipods flourished
seasonally and they contributed 7% of total individuals. The major species
involved were Maera pacifica, Cymadusa imbroglio, Stenothoe kaia and
Mallacoota ins ignis. Isopods fonned only 1 % of total individuals. Major
share of isopods were Paracilicacea setosa and Paraleptospheroma indica.
Echinodenns contributed 2% of the total individuals, of which maJor share
was contributed by Ophiocornella sexadia and Ophiocoma scolopendrina.
Sponge Aaptos cl chromis was found in almost all seagrass samples.
Station 2
The spectrum of various taxa at station 2 comprised of gastropods
(81%), bivalves (6%), other wonns (1 %), polychaetes (3%), crabs (2%),
other crustaceans (6%) and echinodenns (1 %).
All Cerithium spp. together contributed 90% of gastropods.
Smaragdia spp., Pyrene spp. and Littorina sp. contributed the major share
of rest. Opisthobranchs and lamellibranchs were found in seagrass beds
occasionally. Gafrarium divarticatum fanned the major share of bivalves.
Wonns other than polychaetes were present only in minor quantities.
Polychaete species like Glycera, Nereis, and Nephtys were present in
considerable number while the other species of this group were less.
Except Thalamita crenata, Calappa hepatica and Actaeodes tomentosus all
50

Chapter -I. Bolloffl/OIlfW
other crabs contributed very little to the abundance. Amphipods dominated
among other crustaceans, contributed even 4 % of total individuals while
isopods, prawns, stomatopods, etc. together contributed only 1 %.
Echinodenns showed less abundance when compared to station 1 and some
species were found absent at this station during the period of study.
Station 3
The share of numerical abundance of each group at station 3
comprised of gastropods (53%), bivalves (21%), other wonns (7%),
polychaetes (9%), crabs (3%), and other crustaceans (7%).
Of the 53% gastropods, Cerithium spp. contributed 21 % and
Smaragdia spp. 7%. Soft molluscs were not recorded from this station. Of
the 21 % bivalves, major share was sponsored by the single species
Gafrarium divarticatum. Tellina palatum contributed 5 %. Many species
present at station 1 and station 2 were not recorded from this site.
Percentage of wonns was higher at this station. Phasolosoma nigrescens,
Siboglinum fiordicum, Baseodiscus delineatus etc. were present
comparatively in good numbers. Polychaetes were present in good
numbers, even though occurrence of polychaetes were less. Eurythoe
mathaei contributed 25% of total polychactes from this region. Glycera
spp., Notomastes latericeus, Marphysa sp., Nephtys spp., Syllis spp. and
Eupolymna sp. dominated the sample. Out of a crab popUlation of 4%,
Thalamita crenata, Calappa hepatica and Actaeodes tomentosus
dominated the samples. Many species of prawns, amphipods, isopods,
stomatopods, and echinodenns recorded from other sites were not found at
this site, except Alphaeopsis equalis, Cymadusa imbroglio, Maera pacifica
and Seychellana ecpansa. Stomatopods were not recorded at this station.
Only a single species of echinodenn namely Ophiactis savignyi has
appeared at this station.
51

Chapter -I. Bol1ol11 fauna
Station 4
At station 4 gastropods contributed 48%, bivalves 28%, other
wonns 10%, polychaetes 9%, crabs 3%, and other crustaceans 2%.
Out of 48% of gastropods, Cerithium spp. contributed 20%. Pyrene
spp. contributed 12% and Smaragdia spp. 5%. Out of a total of 58 species
gastropods recorded, only 23 species were found at this station. Only 4
species of bivalves were present at this station, of which Gafrarium
divarticatum alone contributed 26% of the total individuals. Tellina spp.
contributed 1% only. Baseodiscus delineatus dominated among wonns
fonning around 4% of total abundance. Phascolosoma nigrescens and
Siboglinum fiordicum fonned 2% each of total abundance. In the case of
polychaete wonns, some members like Glycera spp. dominated.
Abundance of Notomastes spp. and Eurythoe complanata were
comparatively higher at this station. Eleven species of crabs were recorded
at this station, the dominating ones were Macrophthalmus boscii,
Tylodipax desigardii, Pilumnus hirtellus, Pinnotheres spp., Thalamita
crenata and Calappa hepatica. Among echinodenns, only Ophiactis
savignyi was recorded at this station.
Station 5
At this station, 91 % of individuals were gastropods, 1 % crabs and
8% other crustaceans.
Only 9 species of gastropods were recorded, out of which Littorina
undulata fonned about 59% of total abundance. Terebralia palustris
fonned 18% and Cerithium corallium 10%. All other species showed less
than 1 % abundance. Bivalves, wonns, polychaetes, echinodenns and
sponges were not recorded from this station. Six species of crabs were
found, out of which Scylla serrata showed the highest abundance. Uca
spp. and Tylodipax desigardii also were rarely represented. Nikoides
52

.outh.m ............ . 7% 4%
,,%
""
Chapter 4. Bottom fauna
IIDrtMnI 5 a __
~3~ ~O%
Mangrove area
a Gastropods . SMlMtS oWolTTIs~ncluding polyctlaells) oc." . Olller cruslaceans c EchinodelTTls . Sponges
Fig. 4. 7. Groupwise share to numerical abundance at different areas
BOO
700
600
500
400
300
200
100
o
I_ man soon 0 post mansoon • pre monsoon 1
Fig. 4. 8. A vg. seasonal abundance (no'/O.25m2) at different areas

100%
80%
60%
<0%
20%
0%
100%
80%
60%
<W.
20'%
0%
100% 90% 8W. 70% 60% '0% <W. 30% 20% 10% 0'-'
nl
nl
nl
Chapter 4. BOllom fauna
Southern stagns! area
n2 n3 n4 n5 n6 n7 n8
NortherD seagrass area
n2 n3 n4 n5 06 n7 n8
Mangrove area
n2 n3 n4 n5 n6 n7 n8
I_ pre monsoon • monsoon 0 post monsoon 1
nI -gastropods, n2- bivalves, n3-polychaetes, n4-other wonns, n5-crabs, n6-other crustaceans, n7-echinoderms and n8-sponges
Fig. 4. 9. Seasonwise distribution of nwnerical abundance of major groups at different areas

Chapter -I. Bottom jalllw
Table 4.5. Avg. seasonal abundance (no./0.25 m2) of major groups
Southern_ seag!"ass _a~ea_~_
Gastropods ~ ______ ~_. ____ _ Bivalves
------ ~ .. -
Polychaetes __
wonns( exclu~i!lg _polychaetes)
Crabs
Other crustaceans ~--~------
Echinoderms ... - --------- --- - -- -
Spollges_ -- -~--~--.-----Total
Northern sea grass area Gastropods
Bivalves - - --- ---
Polychaetes. wonTls( excludingpolychaetes)
Crabs
Other crustaceans
Echinoderms
Sponges _____ _ Total
Mangrove Area
Ga~tr_opods _ Bivalves
~~I~chaetes _. __ ..... _ ~ onns . (excluding _polychaetes) Crabs
Other crustaceans ,- -- ----
Echinoderms - -- ----- -----.----
Spong~s___ _ _ _ _ Total
.pr:e ... monso.0n __ monsoon _post-monsoon
415.0 482.5 553.0 - - ·t-- .... - .
24.0 80.8 57.0
18.5 6.0 6.0
40.5 32.3 33.3
19.3 35.3 20.0
106.5 17.0 32.5
7.5 10.5 7.5
2.6 1.8 2.5
633.8 666.0 711.8
119.3 158.3 166.8
68.3 54.5 92.0
25.3 18.8 38.0 29.0 13.5 31.5 8.5 12.5 7.5 14.8 4.8 21.3
0.8 0.3 0.0 0.0 0.0 0.0
265.8 ! 262.5 357.0
230.8 202.0 262.8 0.0 0.0 0.0 0.0 0.0 0.0 0.0 0.0 0.0 2.0 1.8 2.3 16.8 15.3 9.3 0.0 0.0 0.0 0.0 0.0 0.0
238.0 ! 209.0 254.5

Chapter -I. Bollo/ll .filiI/ill
maldivensis showed 2% abundance. Apseudus sp. and Paratanaeidae sp.
were also found in almost all samples.
Station 6
At this station, 96% of individuals were gastropods, I % crabs and
the rest 3% were of other crustaceans. Abundance of Littorina undulata
came up to 66% and Terebralia palustris 15%. Four species of crabs were
found at this station. Numerical abundance of all other individuals was
almost similar to that at station 5.
Season wise analysis
The average seasonal values of numerical abundance of major
groups as well as major areas are given in Table 4.5 and Fig. 4. 8. The
seasonwise contribution to major groups is given in Fig. 4. 9. In the
southern seagrass area, gastropods showed a highest seasonal average of
553 nos'/O.25m2 during post-monsoon and the lowest during pre-monsoon
(415 nos./O.25m2). Bivalves, crabs and echinoderms showed their highest
abundance at monsoon and other crustaceans showed a very high
abundance at the pre-monsoon season. In ~he northern seagrass area, most
of the major groups like gastropods, bivalves, polychaetes and other
crustaceans showed their highest average seasonal abundance values at the
post-monsoon season. The total abundance at mangrove areas showed the
highest value in post-monsoon.
4.2. 2. 1. Three-way ANOV A
Three way ANOV A applied on the benthic data showed that there
was significant difference between stations and abundance of various
benthic groups. Station-group interaction was high indicating a location
specificity for the benthic groups. Station month interaction was also high.
53

Chapter -I. BOl/oll1falllw
Students t test was applied to see which of the stations were significantly
different. Three way ANOV A for comparing between stations, months and
benthic groups and first order interaction effects between these three
factors are given in Table 4. 6.
Comparison of stations based on biomass:
Regarding the distribution of major groups of benthic organisms,
highest average wet weight biomass was observed for gastropods (shell-on)
at station 1 (X -167.927 g/m2) and least at station 4 ( X -31.96 g/m2) with
maximum variation at station 1 (83.11%) and least at station 6 (67.19%).
Bivalves were absent at stations 5 and 6 and maximum at station 3 (X-
42.32 glm2) and least biomass at station 1 (X-l1.147 g/m2) with
maximum variation (128.71 %). Worms were also absent at stations 5 and
6 and maximum biomass at station 4 (X -1.353 g/m2) with highest
variation over time (157.29%) and least at station 2 (X - 0.400 g/m2) and
least variation with distribution over time was observed at station 1
(68.97%). Biomass of Crabs was highest at station 5 ( X -2.233 g/m2) and
least at station 1 ( X -0.653 g/m2) with least variation (71.37%), and highest
temporal variation was observed at station 4 (205.87%). Other crustaceans
have maximum biomass at station 6 (X -0.967 g/m2) with maximum
variation, 253.53%. Least biomass was at station 4 (X -0.027 g/m2) and
least variation was at station 1 (91.49%). Echinoderms and Sponges were
absent at stations 5 and 6 with very stray occurrence at other stations ( X -
0,007-0.5 glm2 for echinoderms and 0.035-0.347 g/m2 for sponges).
Average total biomass was maximum at station 1 (X -181.440 g/m2) and
least average biomass was at station 4 ( X -56.48 g/m2) with least temporal
variation at station 5 (42.879%) and maximum at station 1 (79.928%)
(Table 4. 7).
54

Chapter 4. Bottolll fauna
Table 4. 6. Three way ANOVA for comparing between stations, months and benthic groups and first order interaction effects between these three factors
.--.--- --- ----------_ .. _--- ." - - -- -- --
Source Sum of DOF Mean Sum F Ratio
- - -squares of squares
(A) Stations . 126890.0 5 (25378.0) 44.685 ** -- --" .-- --- -- -
(B) Groups ' 2137510.0 8 (267189) 9.793 **
(C) Months • 127698.0 23 5652.098 3.281 *
AxB .2989080.0 53 56397.74
BxC 2657300.0 215 12359.53
,AxC . 592078.0 143 , 4140.406 ._ ...
AB interaction 40 18117.0 14.354**
BC interaction 184 2130.91 1.688 .. - -
AC interaction 115 2934.69 i 2.325* .----- - -
! 1161150.0 . Error 920 1262.12 I 1-
Total I 1295
• Calculated F is significant at 5% level (P<0.05)
** Calculated F is significant at 1 % level (P<O.O 1)

Chapter -I. Bollol11 fauna
Table 4.7. Avg. (X), standard deviation (S. D.) and co-efficient of variation(C.Y.%) of bent hie biomass (wet wt. glm2Jat station 1 to 6.
StatioIlJ____ ___ _ __ . X : S.D _ c.v. (%) : _ LCL, ~as1!0pods __________ ~)67.9271 ±j_ 139.563:_ _ 83.11 O~ -105.617 i Bivalves ~ 11.147 ±i 14.346! 128.705 j -16.972 j
!V~~~ (Inc~pol~ch~etes) f: 0.733~_-_-~---- 0.506C~_68.971J --- -0.2581
Crabs r-- 0.653~ -1- __ 0.466; ___ )} .370 J- _ -0.26] I Other crustaceans _____~ 0.300i±f __ 0.274; 91.490_~_ _ -0.238; Echinoderms ___________ , ___ 0.500I_±"f 0.362; 72.333' -0.209. Sponges_~ ____________ : __ 0.180; -:1 0.267: 148.1 02 -0.343: Total____ ;_181.440 1 143.928 79.326 -100.660:
Station 2 X ; S.D c.v. (%) I
LCL -- -" ;- ---- I i - .
Gastropods ; 150.287! ±j 116.938 77.810 i -78.912' ~- _. ----~ -
Bivalves 13.300 , ± 13.736 103.278 , -13.623: I - - -- -- --
I - ,- - -,
Worms (Inc. polychaetes) 0.400 ~ 0.355' 88.694 -0.295 , Crabs 0.673 ~ 0.993: 147.438 -1.272
- _ .. _---
Other crustaceans 0.233 0.5371 229.978 -0.818; : ! --Echinoderms : 0.367 ±: 0.290 79.148
I -0.202 :
! , -
Sponges __ 0.347 I ±; 0.473: 136.308 -0.580: , I
±[ I I
Total 165.607 I 122.647 74.059 -74.781 • I
VCL 44] .47]
39.265 1.725 1.567 0.838 1.209 0.703 I
; 282.100 '
VCL 379.485
40.223 1.095 2.619 ] .285 0.935 ].273
240.388 !
Station 3 X S.D c.v. (%)' LCL VCL Gastropods i Bivalves I Worms (Inc. polychaetes) I C~bs -- - -,
-
33.887 ' 42.320 !
1.20Qi 1.113: ,
Other crustaceans Echinoderms
- -- --------0.173 !
.-- 0.0071
Sponges Total
: 0.0001
1
78.700,
± 27.080 ;
±I I 43.219 ,
±! 1.350 ± I 1.348
I
±: 0.269 , ±:
I 0.032 -:id 0.000
I __ ±t 49.048 .
LCL - Lower Confidence limit at 95% confidence UCL - Upper Confidence limit at 95% confidence
79.914 I -19.191 : 86.964 102.125 -42.390: 127.030 ] ] 2.480 -1.446 I 3.846 121.057 -1.528 3.755 155.186 -0.354 0.70] 479.583 -0.056 0.069 ; 479.583 0.000 0.000 62.323 -17.434 96.134,

Table 4. 7. contd ...
Station 4 Gastropods Bivalves
---- -- ----
Worms (Inc. polycpaetes) Crabs Other crustaceans
. ----~--
Echinodenns Sponges Total
Station 5 Gastropods Terebralia paiustris
I -Bivalves I
Worms (Inc. polychaetes) . Crabs Other crustaceans Echinodenns Sponges Total
Chapler -I. BOl/omfulIIW
x S.D 31.960 ± 20.887
C.V. (%) LCL 65.353 -8.978
UCL 72.898 52.254 5.525
.. I
22.013 ±; 15.429' 70.088 ~ -8.227 : , 1.353 ' ±. 2.129 I 157.290 1-2.819 :
___ 1.087; ± 0.027 ±.
0.020 0.000
56.460 , ,
X 55.807 59.673 0.000 , 0.000: 2.233
±' :
1 ± ±:
I
±,
± ± ± 0.620.
0.000;' ±;
0.000' ,
± 118.333
1 I ±
2.237 i 205.871 i -3.298 5.471 0.060; 223.607: -0.090, 0.144
1 ---- r I
0.070; 351.188 i-0.118; 0.158 0.000 351.188 i 0.000 0.000
26.726 : 47.337 1
S.D C.V. (%) 37.500' 67.196 29.053 48.688
0.000 48.688 0.000' 48.688 3.035; 135.875 1.189 191.721 0.000 191.721 0.000, 191.721
50.740 42.879
, 4.076: 52.384
LCL UCL . -17.694 129.307
2.729 116.618 0.000 0.000 0.000 0.000
. -3.714 8.181 -1.710 2.950 0.000 0.000 0.000 0.000 18.882 99.451
Station 6 X S.D C.V. (%) ; LCL VCL Gastropods 51.800' ±i 21.155, 40.840 I 10.336 : 93.264 I
, , I
Terebraliapaiustris 46.733, ± 30.559' 65.390 : -13.162 106.628· Bivalves 0.000: ± 0.000' 65.390 0.000 0.000 Worms (I~~c. p~ly~haetes) O.OOOi ±; 0.000, 65.390 ; 0.000 0.000 Crabs ,1.593i ± 2.622 164.532 i -3.545 6.732 Other~rust;c~~s-- i 0.9671 ±: 2.45I; 253.530 ! -3.837 : 5.770 ' Echin~de~s .~ ==-:.-=--i '0.0001- -~ --o.OOO;~ 253.530 _ 0.000 0.000 Sponges i 0.000 ±I 0.000, 253.530 0.000 i 0.000 Total_~=-~~_-~~=~~=~[--101.093[~-- ~--46.422! 45.920 10.105: 90.988 .
LCL - Lower Confidence limit at 95% confidence UCL - Upper Confidence limit at 95% confidence

Chapter -I. BOI/Ol1lfUlIlIU
Comparison of stations based on numerical abundance:
Mean Gastropod abundance was maximum at station 2 (X-
604.33/0.25m2) and least at station 4 (X 137.33). At the other stations
average gastropod abundance ranged between 158.8 (station 3) and 362.7
(station 1). Seasonal variations in the gastropod distribution was highest at
station 5 (220.62%) and least variation with respect to seasons was at
station 6 (202.95%) (Table 4. 8).
Bivalves were occurring only at station 1 (X -63.5), station 2 (least
abundance X -44.3), station 3 ( X - 63.17) and station 4 (highest abundance
X -80). Bivalves were negligible/ absent at stations 5 and 6. This reveals
group specificity for some locations. Worm's distribution was similar to
that of gastropods and bivalves, occurring only at stations I to 4 with
maximum average abundance of 29.5 at station 4 with highest spatial
variation (c.V.% = 791 at station 1) and totally absent at stations 5 and 6.
Polychaetes were distributed with maximum average abundance at station
I ( X - 47.17) and found negligibly absent at stations 5 and 6. Crabs were
distributed more or less with same average abundance at stations 3 and 4
and having maximum abundance at station I. Stations 1 & 5 and stations 2
& 5 showed high differences in the abundance of crabs (P<.05). High
variation was observed for crustaceans other than crabs at different stations
with highest abundance at station 1 (X - 63) followed by station 2 (X-
41.8) and least abundance at station 4 ( X - 6.8). Seasonal variations were
also found high at all stations for this group. In respect of the remaining
two benthic groups, stations 1& 2 and 3 & 4 the difference was not very
high. Echinoderms were high at Sts. 1 and 2 and least at station 3 to 6
(P<O.OI). Based on total benthic abundance, stations I and 2 were highly
different from stations 3 and 4 and so also at station 6 (P<0.05). In terms
55

I I Sr, I Sf. 2 5t,:3 5 t, 4 St. 5 St,6
------r---- -I
i Sti . - Ea •• •• I ..... (0
iSt2 I ..... -I 10 • • • •
Cl ()
() . ; "\ 0 0 ... t:J_
~St6; ..,~'" ItjQJ t,;P) +jq, 0·... _.
a. Gastropods
._ ........... _._--_._------, -- 1'--.5f.1 5t.2 5t.3 5t.4 Sf.~ St.6
c. Worms
Clwpfer 4. Botfml/ (aul/u I" .-....... ........... -..................... -.. --. . ........ -..... -. . St1 St2 St3 St4 St5 St6
.5t.1 . () • • ! ~~ St2 o· - • () ••
St.! +j~'O Itj0" _ () • •
.... 4. !1- ~ •• St.4 q;"" q;O q;' -
St, 5 ~-:\' r;,..ro'" Oc·roOJ roq:,"'J - ~ I
Is 6 1 ,\' ","> ",C1J -'" .00 I ; t, .". ()I' Oc.' Q)''U' 0 L ......... J . __ ..... ____ ..... __ ... __ .
b. Bivalves
d. Crabs
EB - t statistic is not significant, t < 2·074
• - t ~ 2.578 7 t is significant ot 1 % level P< ·01
Cl - t ~. 196 8c t <: 2,578 I t is significant at 5 % level P < 0-05
Fig.4. 10. a-d Trellis diagram for comparing between stations based on numerical abundance of gastropods, bivalves, worms (including polychaetes) and crabs.

('/WI},er 4. ilmrolll /alllla
1 " St.1 St.2 St.3 St.4 St~ 5t.6 I ,5t1 St2 St3 St4 St~ St6
Sf. 1 I :" \St.t - Ea ••••
, ~
ISt.2\ O~ . St. 2 "",'b •••• , (() q,
·St.31,·" O·Do.
I ~ ~ ~ Sf. 4\ ~ro ,,'b q;fj
i CO c.f1, '1,.ro ~OJ St.~ I ,!1; " " q;
I 11 0 r,.o .,Do. tO~ re' 1St. 6
"..." " .J " 0'
Sf.:3' ro"f)., f)'~' Ea E9 EB I ;St.4 t;"''' ., . ., ... 0·9>"> ffi ffi I i i 'l- !!, ~ ".Q) _ I iSt. 5 .,4;) ,.." o·'b O' () I 1st. 6 .,~'l, _~.Ol~ o~~._o·~OJ _o~~_, ~~
e. Other Crustaceans f. Echinoderms I
-----I , I ;St.1 5t.2 St.3 5t.4 St.5 Sr.6 i Sf. 1 5t.2 St.3 St4 sr.5 St.6
~--- +---_ ........ , ,- -.----_. _. __ . _ ..... -St. 1 \ - EB Cl () ~ () St 1 . G) • • () ()
, Do.'\
: r,.,O Sr.2 . • • • .' 15t.2 · O· • • ~ et
I " I
~ ~ ffi El) ffil
0. re ffi () ffi St.3 "C?> q;'b St.3 ~f};. +j ..... I OJOj tJ 0° I
o~ ~ 9)' eil ,St.4 q;9i Ea EB' 5t.4 e I
, o· I 01 I)' , ffi 11
I OjOJ to'" 0 0 9\ OJ'b ~' tJC!J ~ Sf. ~ St.5 " q; 00 QO
" , 'V'
.,. JI 0°
I ~ '1Jb 0° "V0 ,~
4:) 0° 0° .,0)
Sf.S q;'b - St.6 tr;~ 0' o· 0' 'l, " c.' " ---
g·Sponges h.TotoL abundance
Ea - t statistic IS not significant, t < 2·074
• -I ~ 2,578, t is significant at 1 %level P< ·01
et - t ~ 196 8 t <. 2·578} t is significant at 5 % level P < 0 ·05
Fig. 4. 10 e-h Trellis diagram for comparing between stations based on numerical abundance of other crustaceans, echinoderms, sponges and all groups together.

Chapter -I. BOIIOm/lIl11ll1
Table 4. 8. Avg. (X), standard deviation (S. D.) and co-efficient of variation (C.V.%) of bent hie numerical abundance (no./O.25m2) at station 1 to 6.
IGro~p;----··- -: .. X ISt;~~~li C.v. (%)'.-- --X '. ~St;~~~ ~ c.v. (%) . . --- -.- ---, -.- .. - ) -! - - .-~.. -- .;-_. :
Gastropods _______ ~_ 3_62.71 194 . .4: _ 214.412! 604.33[. _323.81 214.288 Bivalves __ . ___ ~ '. __ 63.5
f ____ 68.52; . 431.6281 44.3321 _63.36i 571.672
Wonns 12.5! 24.721 791.044; 7.8321 9.3441 477.128 :P~lych~~t~~---------47.17i . 22.06[ 187.081- 23.5; -. 9.612[ 163.632 1- .---- -- -------- -- r- I ~ I
Crabs 29.51 16.24' 220.208: 17.668: 17.24 390.344 iO~her_~~~tac~ans __ 1 ____ 63 _}6.072[ _ 483 41.832 , 92.66 885.964:
lEchin~derms __ . __ Ll-0.83 __ . 4.24f. __ 156.532[ 6.168/_ _ 3.46 224.44, Sponges ___ ._~ __ L_2.2 2.308[ 461.88; 2.5 2.784: 445.42,
- _.- - _.- .. - - - _. -----
Station3 - 1------ -,
Groups X i S.D. C.V. (%)_ -, Gastropods .i._ . 158.81 _83.528: . 210.348
.
Bivalves ,
63.17: 52.876: 334.84 I
I 1 Wonns 19.831 18.708; 377.296
! ,
36.96! Polychaetes 27.87! 531.148 1-- [ ;Crabs 9.832/ 8.944
1 363.772
:Other crustaceans 20.33 483.96 24.61 IEchinoderms 0.332
1 1.104i 1326.65
Sponges _0.3321 1.104: 1326.65
iStationS , Groups__ _ X i S.D. i C.V. (%) _. Gastropods 212.8~ 11}.39; _ . 220.62: Hivalves 0.168/ 0.81 1918.33' Wonns -0.1680.8/ 1918.33:
- j-'.- - 1-· -- ,
Polychaetes .0.1681 0.8/ ___ .1918.33: Crabs 2.332 2.8081 481.496: Other crustaceans 18.67 _25.0241_ 536.236 Echinoderms i 0.168 0.8: __ 1918.33; Sponges ---:--O~168 -- 0.8! 1918.33 __ . _______ J_ _ ____ ._
Station 4 X i S.D. 137.33' 74.98
80: 50.58 , i , 29.5 25.61
26.832; 29.06 i
9.1681 8.444 I 6.832, 9.964,
0.332i ,
1.104 0.332 1.104:
Station 6 X S.D.
I
250.83' 127.3 I·-
0.168: 0.8 t -
0.168 0.8
0.168/ 0.8 1.6681 2.284:
I
_ 8.8321 ._7.744 O.l68 i 0.8
0.1681 _ 0.8
C.V. (%) 218.392 252.916
347.22
433.232 368.476 583.328 1326.65, 1326.65:
c.v. (%) 202.948; , 1918.33; 1918.33; 1918.33:
I
548.452 350.68i
I
1918.33:
1918.33:

Chapter 4. BOl1om/alllla
Table 4. 9. Avg. (X), standard deviation (S. D.) and co-efficient of variation (C.V.%) of benthic numerical abundance (noJO.25m2
) from 1999 Sep.-200 1 Aug. . -.. - ---, ------ -T ----- .- ----- - - "
I iStation 1 iStation 2 iMo~th;-- ·j----x----i S.D. 1 C.V.(%). X i S.D. C.V.(%) 11999 SEP- :--- 89 154.4 693.9281
1 94.51 209.76: 887.876 loci---l-~123.5---2-15.848 699.1i 5S: 89.9761 620.536] 1- ---------- - 1 I.
!ri~~ -----.---68~ji 1~~~3~:1-~~~:~~~1 -~!~:~lli 38~~:2~i, ::~:~::! 2ooo~iA::N_--[=_-59-"~r -- 89.8321' 603.912 55.51 90.12: 649.52
FEB ___ ._ ... -.1- ___ 2Z~5i ._. _ 28.668; 416.964; _ 44.5/ 90.696[ 815.244 MAR : 125 179.072 573.032 136.51 202.736 1 594.096 'APR '11, - --- -- 78 102.196; 524.081 651 124.592' 766.716 ;MAY -,-- -- 60' 66.8441 445.621 80.5: 188.896 938.616
I ' r )UN 34.5 35.66! 413.468: 68 142.66 839.18
I I :JUL , 34 44.812: 527.1841 116.5 265.092] 910.188, lAVa T - --80.5' 138.572r 688.5481 67.5; :SEP_ ---- ___891 156.6241 703.928j 41.5
1 OCT 111.51 217.6081 780.66 34.5
1 NOV ] - 67.5! 124.392 737.148 95, DEC . ;- - 76 145.916' 767.988 114!
200t'JAN _ l-- ___ 46 78.512 1 682.704; 71; ;FEB ! 106.5, 189.196! 710.6 99.5' :MAR--' ---1---' 125- -252.3321 807.46: 82.5!
T
124.152j 84.641
I
74.7241 i
219.896: T
268.521
153.436/ 169.5]
176.5321
735.716: I
815.796; 866.372: 925.884; 942.184i
I
864.436] i
1
855.916; ! . --- - -i -_. -- - ----- 1 ; !
IAPR ___ ------1 ___ 46.5 t---- 39.492 __ )39.732 l 80.5 i.- 187.421 931.272 IM,t\ ! ______ -t' _____ 6? _138.836_ 804.8361 43i 86.872 1' 808.124 [JUN ~___ ~5..!, __ ~7).128,_557~856 ________ 151[ ___ 31..6.8961 998.4
"J_UL ____ J ___ .8...6LJ01.608r _____ .472.5921_. ___ 170.51 ..... __ ).38.3361 793.752 ~_lIG [ 56.?~53.2321 ___ 376.872__ ____ 981 ___ 213.861 872.896

Table 4. 9. contd ...
1 Station 3 I --------.----
'Months X, S.D. _______________ ---~ ---- --I .-
c.v.(%)., 567.34 1 1999 SEP 1 32: 45.388
~~~ . ~+::~}:~Ij~:~~!; .. !~~:!i~: IDE<~_:-_~_[_~_~63.51- _)7.0281 - 548.204;_ 2000 JAN I 71.5 110.9121 620.492: :FEB ' J--~4-0.5~ --- 40.4681' 399.696i
. i iMAR ___ ' 22.5 29.32\' 521.272[ !AP~,_____ , 4-9t_ 54.98 448.832\ MAY "_ " 19.5: 28.3841 582.272~ JUN 37.5 48.7 519.47i - - 1_ .-- .--- 1
JUL AUO SEP OCT i - --, NOV ' inEC- i-i2001'iAN
!FEB
i . 67.5, 100.648 - f 21.5
1 21.5~ ,
27: 26.5
, ,-
28.5 22 13
-- i
30.064
35.941
35.541
-
44.94' 30.1641
I
30.5961
596.424: 559.}
668.668 I
526.5: , 678.364: 423.328! 556.256~ , 582.992'
MAR APR 'MAY JUN
22.51 22' I 53
1 40.5
18.9481
34.6361 1
31.748, 98.688: 84.816: 52.3841
615.776 577.256 744.804 837.688' 748.332:
, :JUL i ~--
:AUO i ._ _ _ _ . __ _
281 36
I
69.972: 777.46i
Chapter -I. Bol/olII fauna
Station 4 X S.D.
24.51 , 431 49!
r -69.5,
431 i
40 35i
I
61.5: , 44:
1
24i t
46, I
351 I
41 31.5
, 17.5! 27S
I
20; 40
21.5 31.5 18.5 21.5
,
55.008 94.716 61.116 64.712 53.208,
34.06: 58.948; , 82.192'1 57.028i , 31.368' 77.768 44.124 71.936 41.544 57.584: 51.612' 28.208
36.9 I
221 83.5
32.368 51.516 34.288 32.12
,
,
i
c.v.(%) 898.072' 881.072,
498.896 372.448 494.952 340.588 673.704 534.592
518.42 522.81i 676.252 504.284 701.828
527.52 479.872 543.304 644.78
536.756 440
834.984 602.212 654.152 741.388 597.596;
I

Table 4. 9. contd ...
---------. -1-
Months ~ .. _ I. 1999 SEP OCT
,. :
NOV DEC ,
~ -
Station 5 ' I
X , S.D. I 315 73.032, , ,
11 i 19.26, 30.5' 74.752i
I .
79 209.016[ I
c.v.(%) 927.396 700.412: 980.344:
1058.3: I
i2000JAN ~ ___ 26~51 990.692j 987.732l
.. 65.6321
1
'FEB MAR APR MAY JUN JUL , .
AUG SEP OCT NOV DEC 2001 JAN FEB
25 12 , 21 i
-- - I
18.5i ·3·6.5r·
29 1
201 28 33 29 371
9.5! 41
61.732, -. I
23.324: 1 49.668; ,
45.996
92.12:
.63.961
I
777.46: 946.076: 994.536 ,
1009.512 882.22: ,
44.544, 890.844 66.724' 953.192! 87.308: 1058.3 66.596i 918.564!
91.996: 994.536: 23.661 996.168
I
104.016 1 1014.776, MAR 41! 104.016 1014.776 I ~
APR 61.5, 119.532, 776.132 MAY 181 43.176
1 959.424;
~-=±jl~~:·-~HEI •. _l~~t~~j
Chap/er -I. BoJlolI/ fauna
X Station 6
S.D. 72.828
1
32~ , lIS 19.02: , 30.5: 74.752
79 1 209.016' t- - - r
58.5' 153.272i 56.5; 142.02; 53.51 140.04:
1
29.5! 78.048: 36.5: 90.752
1
32.5; 85.988' 25.5; 63.052'
34 1 85.464 I
36 90.796 17.5 46.3
I
28: 69.6 I
43.51 107.728~
27 65.596' 13 34.396' , 21 52.564'
i ,
165 36.684; . ,
34.5! 91.28 29
1
21 : 20 1
L
, 70.872
i 55.56
1 45.652,
C.V.(%) I 910.356 661.556 980.344
1058.3. 1048
1005.452: 1047.044
1058.3 993.688
1058.3'
989.076 1005.452 1008.848
1058.3 994.268
990.62 971.812
1058.3 1001.224
889.32 1058.3' 977.56 1058.3;
I 913.016;

Chapter -I. Bottom fmll1(1
of numerical abundance, stations can be graded as st.l> st.2> st.5> st.6>
st.3> and sto4. Fig. 4.10 a-h is the Trellis diagram for comparing between
stations based on numerical abundance of major groups.
At station 1, the month of March 2000 showed highest average
abundance (X -125) followed by October 1999 (X -123.5). The least
average abundance was seen in July 2000 ( X -34). At station 2 the highest
abundance was in 1999 November (X -216.5) and least was in October
2000 ( X -34.5). Station 3 showed the highest abundance in 2000 January
(X -71.5) and least abundance in February 2001 (X -13). At station 4 the
highest abundance was in 1999 December (X -69.5) and the lowest
abundance was in 2001 January (X -17.5). The highest abundance (X -61.
5) was reported from station 5 during April 2001 and station 6 during 2000
January ( X -58.5) (Table 4. 9).
4. 2. 2. 2. Community structure
Species richness
Based on average diversity indices computed for each station, it was
noticed that there was a steady decrease for species richness index from
station 1 to station 6 with a gradual increase in temporal variation even
though overall variation was less «36.26%) except at station 2, where
coefficient of variation was the least for species richness (15049%).
Species concentration
Species concentration index decreased from station 1 to station 2
and after that again increased and following the second peak, it steadily
decreased from station 3 onwards to station 6. Maximum concentration
was at station 1 (0.843). Temporal variation also showed the same trend
with average concentration factor with maximum temporal variation at
56

Chapter 4. Bol/oll1 fauna
station 6 (C.V.%- 26.696) and least temporal variation or high consistency
with respect to seasons for species concentration factor at station 3 (C.V.%
- 9.388).
Species diversity
Shannon weaver diversity was maximum (3.649) at station 1 and
least at station 6 (1.453). Spatial distribution showed a positively skewed
curve, for diversity as that for concentration with bimodal pattern the first
mode at station 1 and second at station 3, whereas for richness, a steep
steady decreasing pattern with rate of change of 4.396 per station was
observed. Temporal variation was least at Station 1 and Station 3
«13.9482%) showing high consistency in the diversity, during the study
period at these two stations and maximum variation at station 6
(28.3285%) showing high fluctuation in the number of species and
abundance at station 6, during the period of 2 years.
Species dominance
Dominance was least at station 2 (0.47) and maximum at station 3
(0.8034). Pattern of distribution was same as that of diversity and
concentration with two modal values, one at station 1 and other at station 3.
Temporal variation was maximum at station 2 (87.62%) and least at station
3, (13.052%) implying that dominance remained almost same for all the
months, while at station 2, the least dominance was highly varying from
period to period.
Species evenness
Uniformity in the distribution was high at station 3 (1.6669) and
least at station 2 (0.6923) with least variation at station 3 (29.98%) and
maximum variation at station 2 (49.98%). Evenness was least at station 2
57

Chapter 4. Bollol1l fauna
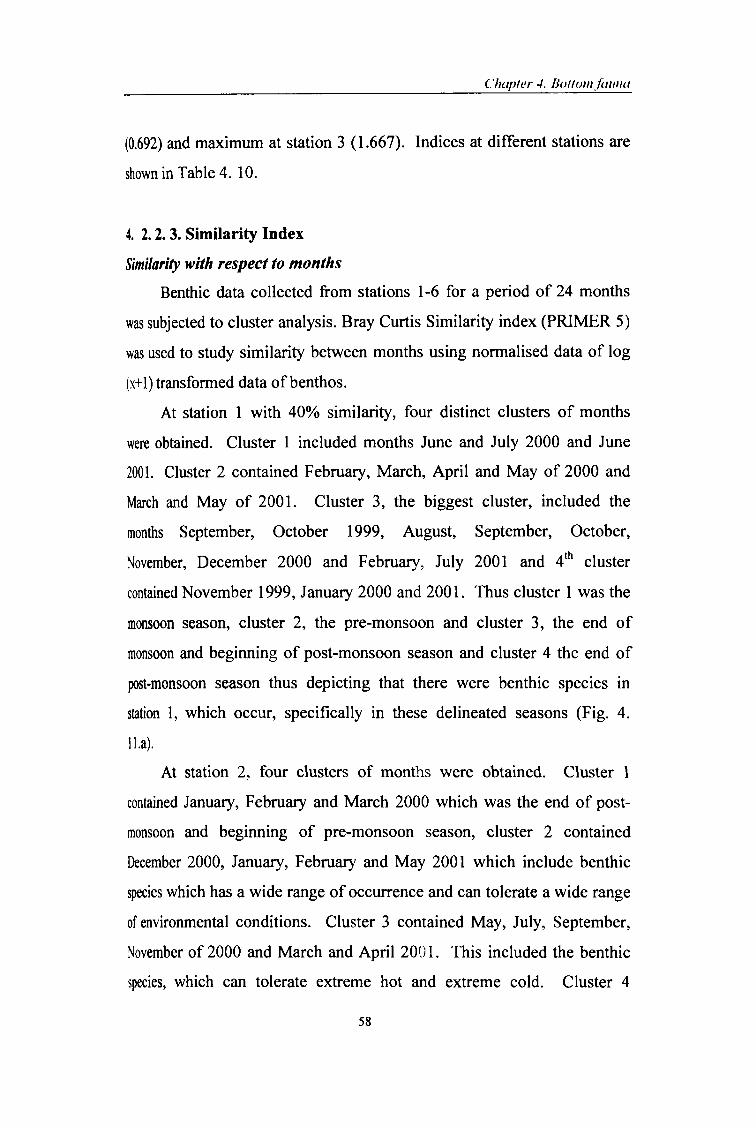
Chapler -I. BOl/olllful/I/(/
(0.692) and maximum at station 3 (1.667). Indices at different stations are
shown in Table 4. 10.
4. 2. 2. 3. Similarity Index
Similarity with respect to months
Benthic data collected from stations 1-6 for a period of 24 months
was subjected to cluster analysis. Bray Curtis Similarity index (PRIMER 5)
was used to study similarity between months using normalised data of log
(x+l) transformed data of be nth os.
At station 1 with 40% similarity, four distinct clusters of months
were obtained. Cluster 1 included months June and July 2000 and June
2001. Cluster 2 contained February, March, April and May of 2000 and
March and May of 2001. Cluster 3, the biggest cluster, included the
months September, October 1999, August, September, October,
\fovember, December 2000 and February, July 2001 and 4th cluster
contained November 1999 , January 2000 and 2001. Thus cluster 1 was the
monsoon season, cluster 2, the pre-monsoon and cluster 3, the end of
monsoon and beginning of post-monsoon season and cluster 4 the end of
post-monsoon season thus depicting that there were benthic species in
station 1, which occur, specifically in these delineated seasons (Fig. 4.
Il.a).
At station 2, four clusters of months were obtained. Cluster I
contained January, February and March 2000 which was the end of post
monsoon and beginning of pre-monsoon season, cluster 2 contained
December 2000, January, February and May 2001 which include benthic
species which has a wide range of occurrence and can tolerate a wide range
of environmental conditions. Cluster 3 contained May, July, September,
November of 2000 and March and April 2001. This included the benthic
species, which can tolerate extreme hot and extreme cold. Cluster 4
58
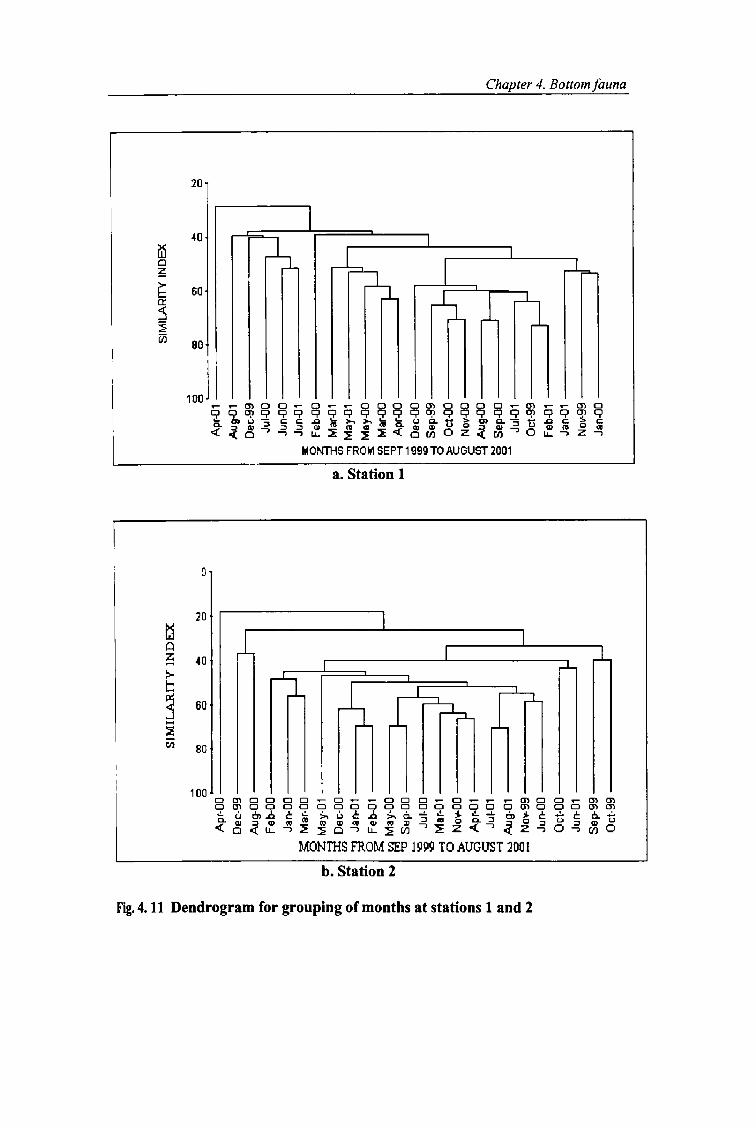
:!1
~ ~ - - 1:;1 ~ 1:1
Q
. ., =
(J'Q
., ~ s ;- ., (J'Q
., = =
~
c::r
_. 1:1
. (J
'Q
r".J ....
=
~
.... :to
S
=
=
1:1
1:1
N
.... I:S"
~
~ .... ~ .... ~ :t. =
1:1 ~ -~ 1:1
Q.
N
SIM
ILA
RIT
Y I
ND
EX
t-.I
0
0
co
om
oCJ
... oCJ
co
0
Apr-oo==:::==:::====~-
Q co
Oee
-SS
----------,
Au~oo---------~
Fe~OO-------,
Jan
-O
O----------,
:s:: M
ar-O~
Q Z
May
-D1
5! O
ae-o
o U
l ;:3
Jan-
01
§: Fe
~01
~ M
ay-O
O
_ Sap-O~
'0
Jut-D
D
'0
'0
......:t
M
ar·0
1 Q
>
No .
... OO
g A
pr·o
1 ~
Jut-D
1 ....
..:t ~
Aug
-01
o N
o..,.
99
Jun-
oo
Oct
·oo
Jun-
01
Sap
-99
Oct
-99
F
r".J .... ~ :t. =
1:1 -
SIM
ILA
RIT
Y I
ND
EX
Q
~
~
~
~
00
00
0
Apr
-01
I '
, ,
I
Aug
-01
L O
ae-9
9 --------------.
Jul-O
O ----------,
Jun-
OO
---------,
E
Jun-
01
~
feb-
OO
M
ar-O
1
:t
(J) ;a
May
-01
~
May
-OO
~
Mar
-OO
~
Apr
-OO
l8
Dac
-Oo
~
Sap
-99
~L
0 ~
Oct
-OO
g
Nov
-OO
~
Aug
-OO
~
Sep-
Oo
Jul-0
1 O
cl-9
9
fab-
01
Jan-
01
Nov
-99
Jan-
OO
I--
l-
Q
~ -~ ""! :"'- ttI
c - S :; ~
:3 1::1

Chapter -I. Bottom/lulIIlI
included the months November 1999, June 2000, July and August 200 I,
which sustained only those benthic species, which can occur exclusively
during monsoon period (Fig.4.II.b).
At Station 3, four clusters were obtained. Cluster 1 consisted of
February, May and June 2001. Cluster 2 consisted of months April, June,
August and October 2000. Cluster 3 consisted of October, November,
December 99, January, February, March, May, November, December 2000
and January 2001 which could also be splitted into subclusters of months
as October 1999, November 1999, January 2000, March 2000, May 2000
which contained exclusively post-monsoon and pre-monsoon benthic
species, which can tolerate the environmental conditions prevailing in post
and pre-monsoon seasons. The other subc1uster consisted of November
2000, February 2000, December 2000, December 1999 and January 2001,
which was post-monsoon of each successive year. Hence for these species,
there was a rhythmic occurrence i.e., they occur only during post-monsoon
season. Cluster 4 consisted of September 1999 and July, August 2001
which contained species which can tolerate only the conditions prevailing
in monsoon season of every year or which can be designated as monsoon
species or low salinity tolerating benthic species (Fig. 4.12.a).
At station 4 seven clusters were obtained. Cluster 1 consisted of
March and May 2000 (pre-monsoon preferring species), cluster 2 (June
2000 and January 2001) may be opportunistic species because two widely
separated months were clustered. Similarly cluster 3 contained March and
July 2001. Cluster 4 contained December 1999 and April, July 2000
showing a wide range of period being clustered together, may probably be
persisting opportunistic species, cluster 5 was more of a unique nature
containing November 1999, January, February, August and October 2000
and February 200 I probably be classified as cool temperature preferring
benthic species or monsoon middle and post-monsoon end preferring
59

~
~
'!"- -N ~
~
1:1
C. ... =
~
SI)
3 8' ... ~ =
C
"Cl _. 1:1
IrQ
?"
=
0
0
.... ....
3 S
I) a.
=
=
1:1
1:1
.... =-.,.
foil
SI)
.... foil .... SI)
a. =
1:1
foil CM
S
I)
1:1
C. .,.
SIM
1LA
RlT
Y l
ND
EX
=
o a:
> o C
l)
o
Mar
-OO -----~
~
o
t------,
May
-OO
__
__
_ ---
-J
SBP-
OO ----------..,
Jun-
OO
--------,
Jall-
01 _
__
__
_ ---
-..J
~ M
ar-m
------~
3 Ju
l-Ol
E;1S Jul-lIl-------~
~ O
Be-9
9 -----
o :s:: Ap
r...o
o _
__
__
-----
..J
en
Aug
-W -
------------.
~ Ja
f'loOO
--------,
~
FBG
-ffi --------'
'0
'0
NO'Y
-99 _
__
__
__
, ..
; ~ ~ec:
, ___
_ ----
J
~ Se~99-----,
: O
ct-g
g --------'
~
NO't'-
OO -
----,
Oec
...oo
----
........
May
-m -
--------,
Apr
-Dl -------....,
Ju!l-
Ol ----_
_,
Aug
-Ol --------'
~
o =
o
SIM
ILA
RIT
Y I
ND
EX
ex)
o 0
)
o .. o
t-.J
o
Sep-
OO
~=~==~==~=~
Jun-
01 -----------,
F eb
-01 -----------,
May
-01 ----------'
~~OO-----------,
~ ~r-OO -------------,
~
Jun-
OO
S
I)
V5 O
ct-O
O -------
........
~
;3 O
et-9
9 --------,
....
0 S
I)
:s:: N
OII-
99 -
-----------'
a. = 1
9 Ja
n-O
O
I ~
..;
Mar
·OO
I
:0 M
ay-O
O --~
'0 :=;
NOII-
OO ----------,
o Fe
b-O
O ---------,
>:
c O
ec-O
O -------,
Cl ~
O8c
-99 -------,
~
Jan-
01 ----~
g Ju
~01 --------,
- Sep
-99 ----------,
~~01 -----~
~r-01 ----------,
Ju~OO -----------,
Mar
-01 -------------'
Q
-§ ~ :I>.. g ~
::s ~
::: ::s
tl

Chapfer -I. Bollolllfalllw
species, cluster 6 contained September and October 1999, November and
December 2000 showing a rhythmic occurrence, preferring exclusively
monsoon season and cluster 7 consisted of April, May, June and August
2001, more preferably end of pre-monsoon and up to middle end of
monsoon (Fig. 4. 12. b).
At station 5, four clusters of months were obtained. Cluster 1
consisted of November 1999, January and July 2000, January and July
2001, which was a combination of monsoon and post-monsoon period.
Cluster 2 consisted of August 2000, June and November 2001 i.e. monsoon
and beginning of post-monsoon period, cluster 3 (February and March
2001) constituted by highly pre-monsoon and cluster 4 (February, May,
June, September and December 2000) of a widely spread combination of
period implying occurrence of benthic species which occur periodically
with a period of2 months (Fig. 4. 13. a).
At station 6, 40% similarity included all the months except October
1999 and so also 60% similarities, which included all the months. At 80%
similarity, 5 clusters were obtained. Cluster I contained (June and July
2001) exactly monsoon months, cluster 2 (November 1999, May and
December 2000), a grouping with a period of 5 months, cluster 3 contained
January, April and September 2000 with a period of 3 to 4 months, cluster
4 consisted of December 1999, March, June and October 2000, February,
May and July 2001 with a period of3 months, cluster 5 contained February
and November 2000, January and August 2001 comprising end of post
monsoon and monsoon specific species (Fig. 4. 13. b).
Similarity with respect to species
At station 1, at 40% similarity, 8 clustures were obtained. Cluster I
contained the species Nereis trifasciata, Maera pacifica and Stenothoe
kaia. Cluster 2 contained Nephtys inermis, Grapsus sp. and Mallacoota
60

~
~ ~ -w '=' ~ =
C.
""'I =
IJQ
""
'I =
8 =' ""'I IJQ
""
'I = =
"C Er
IJQ
= .... 8 = =
.... = II!I =
.... II!I
.... =
::1 = =
II!I
UI = =
C.
0\
SIM
ILA
RIT
Y I
ND
EX
o Cl
01
) C
l ~
o
Ocl
-99 --
----
----
-==
==
Sv~99----------
,A;lr
-01 _
__
__
--l
Ju
l-O
O---
Jun-
01
~
~
Nov
-99 ----
~ M
ay-O
O
r:r
Vi O
oc-o
o _
_ --l
~
;a So
~oo ---
....
0 ~
:(
Jan-
OO
~ ~
,A;lr
-OO
0
\ .;
Mar
-OD -.---
~
Jun-
oo
:::
Ocl
-oo
~
Jul-0
1 8
May
-01
5i O
ee-9
9 :!
Feb-
01
~ A
ug-O
O -
-----,
Mar
-01
----
----
-'
Fob-
DO
Ja
n-01
N ov
-oO
------,
Aug-
01 _
_ ---
-.J
.... o C
l o
SIM
ILA
RIT
Y IN
DEX
.... o
ON
o
-.
o en
o
<-'\
o
Ocl
-99 ---------------------~
.A.p
r-01 ----------~
Aflr-
OO
--------......,
Nov
-99 -------.
Jul-0
1 _
__
_ --
-1
~ Jan-01--------~
~
Jan-
OO
=
Vi
Jul-O
O _
__
_ ...J
~
;a Au
g-O
O
it ~N
ov-C
O ~
::1
~ ~
Jun-
01
UI
: Se~9'J --
----.1
-1 _
_
:s M
ay-0
1 _
_ -.
-J
::: O
ec-9
9 I
o O
ct-O
O _
_ -.
-J.
~ F
eb-0
1 11
--__
_ --,
5i
Mar
-01
:! F
eb-O
O -----.
o := O
ee-C
O _
_ ---
-.J
Se~CO ------,
May
-OO
Jun-
OO
Mar
-OO
-------~
Aug-
01 _
__
__
__
...J
Q
-§ ~ :I>.. ~ - c ;;
~ :: I:
l

Chapler .J. Bof/omfulIl/o
insignis. Cluster 3 contained Cymadusa imbroglio, Ophiactis savignyi,
Syllis corn uta, Cerithium alveolum, Eriphis sp., Glycera convoluta,
Pilumnus hirtellus, Pinnotheres pinnotheres, Pinnotheres pisum and
Thalamita crenata. Cluster 4 contained Dolabella rumphii, Baseodiscus
delineatus, Ophiocoma scolopendrina, Coralliophila costularis and Elysia
sp. Cluster 5 contained Etisus splendidus and Goniada emerita. Cluter 6
contained Aaptos.cfchromis, Megalopa larva, Cerithium rarimaculatum
and Strombus mutabilis. Cluster 7 contained Alpheopsis equalis,
Actaeodes tomentosus, Macrophthalmus boscii, Ophicornella sexadia,
Nephtys hombergii and Paratanaeidae sp. Cluster 8 contained Ctena
delicatula, Cerithium scabridum, Cerithium corallium, Smaragdia
soverbiana, Pyrene sp., Smaragdia viridis, Cyprea moneta, Paracilicacea
setosa, Calappa hepatica, Pinna muricata, Gafrarium divarticatum,
Glycera lancadivae and Nephtys dibranchus (Fig. 4. 14).
The species, which showed maximum co-existence at Station 1 were
Pyrene sp. and Smaragdia viridis (85%). These two species together
showed co-existence with Smaragdia soverbiana at 75% level. More than
70% similarity occurred between Pinna muricata and Gafrarium
divarticatum (75%), Cyprea moneta and Parasilicacea setosa (70%).
Cerithium scabridum, Cerithium corallium, Smaragdia soverbiana, Pyrene
sp. and Smaragdia viridis c1ustures with more than 60% similarity. Same
was the case with species Cyprea moneta, Parasilicacea setosa, Calappa
hepatica, Pinna muricata, Gafrarium divarticatum, Glycera tesselata and
Sephtys dibranchus which c1ustures with more than 60% similarity.
Ophicornella sexadia, Macrophthalmus boscii, Actaeodus tomentosus and
Alpheus equalis c1ustured with more than 60% similarity. Glycera
convoluta, Pilumnus hirtellus, Pinnotheres pinnotheres, Pinnotheres
pisum, and Thalamita crenata c1ustured with more than 50% similarity.
61

~
~ ~
Scy.C:\p I
1\cr.lri. Mac.pac.
Stl'.kai. NCp.UlC. Gra.sps. ytal.ms.
F.ch.111<I1. (cr.llcs. SIr.can.
~ C}lI1.imh . .... 0J.h.s31'. ~
~ yl.cor. Ccr.nlv.
~ Eri.sps . .... Gly.COD
tJ = Pil.hir ~ ~ Pin. pitl. ::s
Z Pin·ris. e. ""1 "'i 1b1l.ere 0
=: Dol.nlm (IQ ""1
Has.del ~ ('l 8 (JJ Oph.sco. Q'l ":l (ot.~os.
t'Il Ely.sps ""1
I"l (IQ - Gon.eme ""1 ~ Eli.sftl 0
c:: (JJ Aap.c lC. "0 ..... Me,g.iar ::s
(IQ (crnr 0 Str.mut ~
cr" Gll'.les. ~ AJp.equ. ::s
Ac1.tom -::s- Mac.bos. n' Oph.scx tn
"0 Nep.bom ~ Par.sps (')
(D' lIe.del tn Cer.6CIl ~
Cer.cor -tn Sm3.sov. -~ Pyr.sps -..... 0 Sma.vir ::s - (yp.mon
Par. set Cal.hcp Pin.mur Gafdiv Gly.lan Ncp.dib.
QC o
SIMILARITY INDEX
"" !
l
.1:0 = ~
I
f
~ ) ___ t-
I
I . I
I . -I I
~ I
I
I
I- I I I
Ir-
~ I I
I
....!. I I
I I
I , I
I
I
N e

Speci~s}isted)n dendrogram 4.14. __ SI. No. Abbreviation used Species
--------t---
I I i Sey.exp. Seycftellana expansa -~-I·- .
: 2 I Ner.tri. Nereis trifasciata 1---- --I I----!-I- Mae.pac._ Maera pacifica . --
Ste.kai. :Stenothoe kaia I -- 5·----t
____ Nep.ine. ___ ___ Wephtys inermis r-- ---. Gra.sps. __ prapsus species 6
r ----- -"-----,--- - ------
7 Mal.ins. :Mallacoota jnsignis __
8 Ech.mat. iEchinometra mathaei _ - ----1-··
iCerithium nesioticum 9 Cer.nes
10 Str.can Strombus canarium
I I Cym.imb. -- iCymadusaimbroglio
12 Oph.sav. _ Ophiactis savignyi
13 Sy1.cor. ,Syllis cornuta
14 Cer.alv Cerithium alveolum
15 _Eri.sps .. ,Eriphis species .. _. - -
16 Gly.con. iGlycera convoluta
17 Pil.hir Pilumnus hirtellus , 18 Pin. pin. Pinnotheres pinnotheres
19 Pin.pis. Pinnotheres pisum , 20 Tha.cre. iThalamita crenata
21 Dol.rum. Dolabella rumphii
l 22 Bas.del. Baseodiscus delineatus
--
23 Oph.sco. Ophiocoma scolopendrina
24 Cor.cos. roralliophila costularis
25 Ely.sps. Elysia sps.
26 Gon.eme. Goniada emerita
27 Eti. sp I. Etisus splendidus
28 Aap.chr. Aaptos cfchromis
29 Meg.lar .. ,Megalopa larva 30
- ; Cer.ros :Cerithium rostratum
31 Str.mut ;Strombus mutabi/is 32 Alp.equ. Alpheopsis equalis
33 Gly.tes. Cfycera tesselata
34 Acttom. A ctaeodes tomentosus 35 Mac.bos. ;Macrophthalmus boscii 36 Ophi.sex. _. iOphicornella sexadia _ 37 Nep.hom. 'Nephtys hombergii
r 38 Par.sps. iParatanaeidae species
1
39 Cte.del. :Ctena delicatula 40 Cer.sca ICerithium scabrid~m 41 Cer.cor ICerithium corallium
- - -1--
42 Sma.sov. iSmargdia soverbiana 43 .... Pyr.sps.
I ,Pyrene sps. 12 ,
44 , Sma.vir. . ____ Smargdia viridis --4-5--r-Cyp.mon ,Cyprea moneta _____ __ .
--·~t
-:~~--I- Par.set. ,Paracilicaca setosa
___ Cal.hep. (alappa hepatica 48 i Pin.mur. Pinna muricata 49 Gaf.div. !Gajrarium divarticatum i-50 _ Gly.lan_ fGlycera lancadivae , ,
I - . , i 51 Nep.dib. iNephtys dibranchus

Chapter -I. BOl/OInfallna
At station 2, only those species, which occurred mainly at least in
20% of the sampled months, were considered by Bray Curtis similarity
index. The 50 species which occurred in at least 20% of the sampled
months were grouped into 12 clustures at 40% similarity level (Fig. 4. 15).
The clustures were
Cluster 1- Maera pacifica, Stenothoe kaia, Baseodiscus delineatus and Syllis cornuta
Cluster 2- Malacoota ins ignis, Hoplonemertean sp. and Glycera convoluta
Cluster 3- Ophicornella sexadia, Myadoropsis brevispinious and Syllis gracilis.
Cluster 4- Pyrene vulpecula, Cinguloterebra hedleyana and Margarites helicinia
Cluster 5- Gymnodoris ceylonica, Cerithium dialeucum and Golfingia hespera
Cluster 6- Thalamita crenata,Siriella brevicaudata,Cyprea moneta,Nereis trifasciata
Cluster 7- Lithophaga nigra, Strombus mutabilis and Calappa hepatica
Cluster 8- Echinoneus cyclostomus, Nephtys inermis and Ophiocoma scolopendrina
Cluster 9- Cerithium alveolum, Cerithium scabridum, Aaptos.Cjchromis, Coralliophila costularis and Pyrene sp.
ClusterlO- Notomastes latericeus, Nephtys hombergii, Glycera lancadivae, Goniada emerita, Dolabella rumphii, Pinna muricata, Ctena delicatula and Gafrarium divarticatum.
C1usterll- Megalopa larva, Ophiactis savignyi
Clusterl2- Conus catus, Paratanaeidae sp.
The pairs of species which showed more than 70% similarity at
station 2 include Maera pacifica and Stenothoe kaia, Hoplonemertean sp.
and Glycera convoluta, Cinguloterebra hedleyana and Margarites
helicina, Pyrene sp. and Cerithium corallium, Smaragdia soverbiana and
Smaragdia viridis, Glycera lancadivae and Goniada emerita, Dolabriftra
sp. and Pinna muricata.
62

~ _. ~ f'--U'I
0 (1) ::s 0.. ""1 0 ~ ~
3 0' ""1 = (IQ ""1
~ 0 c: '0 -l s· e (IQ
0 n """"> cr" rn (1)
~ ::s ..... ::r (=i' n rJl
~ '0 (1)
CI.l ~. (1) rJl
~ ..... rJl ..... ~ ..... o· ::s N
SIMILARITY INDEX
100 80 Par. set.
Mae.pac. Ste.kai. Bas.del. Syl.cor Lit.und. Mal.ins. Hop.sps. Gly.con. Cer.Des. Oph.sex. Mya.bre. Syl.gra. rtr.ws. Pyr.vul. Cin.bed. Mar.bel
Gym.cey. Cer.diL GoI.hes. 1ba.cre. Sir.bre.
Cyp.mon. Ner.tri. Lit.nig. Str.mut Cal.hep Ech.cyc Nep.ine. Oph.sco Cer.aJv. Cer.sea
Aap.chr . Cor.cos. Pyr.sps. Cer.cor.
Sma.vir. Sma.sov.
Notlat Nep.bom. Gly.lan
Gon.erne DoLrum Pin.mur ete.del
Gaf.div Meg.lar. Oph.sav. Con.cat Par.sps
I I
1
~
--- - ----- ----- ----
I
60 40 20 I I I
}-1-
l-I-
I I
1- ~
jJ ,
I
f--I I
1- I--
~
r ~
-- I-
J }-
---

Species~ listed in dendrogram 4. 15.
I SI. ~o·_l_~ Abbreviation used , 1 iPar.set.
! ~ Species Paracilicaca setosa
Maera pacifica~ Stenothoe kaia
Baseodiscus delineatus
,Syllis cornuta~
iLillorina undulata
. --~--~-- I ~._. ____ 2fMae.p~c.-• 3ISte.kal. ,. I 4 Bas.del.
, ___ ~ ___ } Syl.cor. __ 6 Lit.und - i - -~.-.
7 Mal.ins.
. ~_ 8.f:lop.sps. ~_~ ___ ~~Gly.con.
IOCer.nes 1- -__~_I)pphi.sex.
12:Mya.bre. ~ - I
, ____ ~_I3ISyl.gra.
. __14iCer.ros
____ 151Pyr·vul ___ 16
jCin.hed.
17;Mar.hel 18Gym.cey.
19.Cer.dia 20 Gol.hes.
21 'Tha.cre. 22:Sir.bre. 23,Cyp.mon
1
24'Ner.tri. - I' ..
___ 25 iLIt.mg .
. . 26:Str.mut 27'Cal.hep.
- _ 28'Ech.cyc.
~ ~ 29Nep.ine.
3°.oPh.sco. 31tCer.alv 32iCer.sca
--~~ I I ___~33:Aap.chr.
1 __ ~34ICor.cos.
f ~-----j~r&::~~' ~ I~-=~~~ 37lsma. vi~.~ l-~ ~_}8ISma.sov. _
39Not.lat.
4Q.~ep.hom.
4~Gly.lan 4iGon.eme.
-~-j ~
_ 43iDol.rum. 44!Pin.mur.
!~- --- ~--I -
i___45iCte.del. 46 Gaf.div.
47lMeg.lar.
48!Oph.sav. I
49ICon.cat.
, ~. _ 50_Par.sps._~
-I Mal/acoota insignis _
_:Hoplonemertean.species
,Glycera convoluta . 1 - . ~
:Cerithium nesioticum I .' . Ophlcornel/a sexadla
IMyadoropsis brevispinious
Syllis gracilis
Cerithium rostratum
Pyrene vulpecula
~,Cinguloterebra hedleyana
_ ,Margarites helicina _
.!Gymnodoris ceylonica
'Cerithium dialeucum , poljingia hespera
; Thalamita crenata
'Siriel/a brevicaudata
Cyprea moneta
Nereis trifasciata
Lithophaga nigra
Strombus mutabilis
,Calappa hepatica
'Echinoneus eyc/ostomus
,Nephtys inermis
iOphiucuma sculupendrina
iCerithium alveolum
iCerithium scabridum
Aaptoscfchromis ~ _
__ . _ . __ ~ Coralliophila costularis ,Pyrene sps. 12
Cerithium corallium
,Smargdia viridis
Smargdia soverbiana
'Notomastes latericeus
Wephtys hombergii
,Glycera lancadivae
:Goniada emerita
jDolabel/a rumphii(violetink)
Pinna muricata
Ctena delicatula
Gafrarium divarticatum
,Megalopa larva
;Ophiactis savignyi ,Conus catus
Paratanaeidae species

"rj ~.
~ I-" 0'1
0 0 ::s 0.. '"1 0
(IQ '"1 ~
3 0> '"1
(IQ '"1 0 c:
"0 _. ::s
(IQ
0 ~ cr-0 ::s -=r _. (")
tIl "0 0 ~. 0 tIl
~ -tIl -~. 0 ::s w
Car.asi. Cer.ery . Eur.mat. Nep.ine.
Cer.dia Cer.ros
Mar.mac. Cor.cos. Pyr.pup.
Pun.ama. Pol.1le. Pyr.vul
Gol.hes.
~
Cl Cl
I
Pil.hir Cyp.mon
Nis.hei. Str.mut Sip.ind.
tJj Cer.cor
~ kt.tom. Tel.pal . ...,
::c Eii.sps. - Con.cat. (") Gly.tes.
U2 Pin.pin. "'0 tTJ Sas.del.
Cer.sca (") fi1 Cym.imb. U2 Sib.1io.
Tha.cre. Cer.nes
Pyr.sps. Ga1.div. Sma.vir.
Sma.sov. Str.can
Eup.neb. Cer.alv \At.var.
Eur.com. Not.var.
Ut.und Mae.pac. sip.aus.
SIMILARITY INDEX
co Cl
I
0)
Cl I
I I
~ Cl
I
I I
I'-..)
Cl I
-I--
I
J-
~ --vJ-
I- -I
~
r- r-
r-- I-
-
~~
r-J-I I
Met.mar. Pha.nig.
Gon.eme.
~
======:J---1~
Cl I

Chapter -I. BolIOI1l jillllla
At station 3, the species, which occurred in less than 10% of the
sampled months, were deleted. The 47 species thus remained were
characterized into 10 clustures (Fig. 4.16).
Cluster 1- Ceratonereis erythraensis, Eurythoe mathaii and Nephtys inermis
Cluster 2 - Marphysa macinoshi, Coralliophila costularis and Pyrgulina pupula
Cluster 3 - Pyrene vulpecula, Golfingia hespera, Pilumnus hirtellus, Cyprea moneta and Niso heizensis.
Cluster 4 - Strombus mutabilis and Sipunculus indicus
Cluster 5 - Cerithium corallium, Actaeodes tomentosus, Tellina palatum and Eriphis sp.
Cluster 6 - Conus catus, Glycera tesselata and Pinnotheres pinnotheres
Cluster 7 - Baseodiscus delineatus, Cerithium scabridum, Cymadusa imbroglio, Siboglinum fiordicum, Thalamita crenata, Cerithium nesioticum, Pyrene sp., Gafrarium divarticatum, Smaragdia viridis and Smaragdia soverbiana.
Cluster 8 - Cerithium alveolum and Vittina variegata
Cluster 9 - Notomastes latericeus, Littorina undulata and Maera pacifica
Cluster 10- Metanachis marquesa, Phascolosoma nigrescens and Goniada emerita
The similarity analysis confirmed that many pairs of species were
showing more than 60% similarity. These pairs include Eurythoe ma/haei
and Nephtys inermis (90%), Cyprea moneta and Niso heizensis (75%),
Pyrene sp. and Gafrarium divarticatum (75%), Smaragdia viridis and
Smaragdia soverbiana (72%), Strombus mutabilis and Sipunculus indicus
(60%), Glycera tesselata and Pinnotheres pinnotheres (65%), Tellina
palatum and Eriphis sp. (65%).
At station 4, the species, which occurred in less than 5% of the
63

Species listed in dendrogram 4. 16. SI. No. 1 Abbreviation used
- ·11C~.asi.
... 2Cer.ery .. 3 Eur.mat.
. . _ .. ~ ~ep.ine.
i --
; 1
i
I
I I 1
SCer.dia ._- \
6Cer.ros
1'Mar.mac. ---- -1
· .~. 8ICor.cos.
.... 9 IPyr·pup. _ lOiPun.ama.
· . IIIPol.fle . 12 Pyr.vul 13 Got.hes. 14Pil.hir
· ._.l~Fyp·mon 16:Nis.hei. _. , 17:Str.mut .. -_. + IS'Sip.ind. 19:Cer.cor
I 20Acttom.
I
21,Tel.pat. 22Eri.sps. 23 Con.cat.
24 Gty.tes.
25Pin.pin. 26 Bas.del.
27Cer.sca 2S;Cym.imb.
29iSib.fiO. 30,Tha.cre.
31!cer.nes 32 Pyr.sps._ 33Ioaf.div.
34Sma.vir. 35Bma.sov. ., 36,Str.can
, _ 37;Eup.neb.
,. 3SiC~r.atv 39iV1t.var.
.. 401
'Eur.com .. 41 Not.var. ., -
42lLit.und _43fMae.pac. _ 44~sip.aus. ... __ . _or - -
45Met.mar. ._ • _0--- _ ,-
46Pha.nig. 47Gon.eme.
Species
Cardium asialicum I
Ceralonereis erylhraensis
:Eurylhoe mathaii . ,Nephtys inermis
Cerithium dialeucum Cerithium rostratum , Marphysa macintoshi
Coralliophila costularis Pyrgulina pupula
Punctacteon amakusaensis
Polinices jlemengium
,Pyrene vulpecula .. Golflngia hespera
Pilumnus hirtellus
.Cyprea moneta iNiso heizensis
Strombus mutabilis
Sipunculus indicus , Cerithium corallium
Actaeodes tomentosus
Tellina palatum
Eriphis species
Conus catus
Glycera tesselata
Pinnotheres pinnotheres
Baseodiscus delineatus
Cerithium scabridum
Cymadusa imbroglio
Siboglinum fiordicum Thalamita crenata
Cerithium nesioticum
Pyrene sps. 12
:Gajrarium divarticatum :Smargdia viridis :Smargdia soverbiana
'Strombus canarium
:Eupolymna nebulosa ,cerithium alveolum
Vittina variegata,. Eurythoe complanata
Notomastes latericeus
Littorina undulata I
;Maera pacifica . "1
!Siphonosoma australe I '
'Metanachis marquesa I·
'Phascolosoma nigrescens 'Goniada emerita I

Chapter -I. Bottom'/clllI/o
samples, were deleted. The 48 species, which occurred in more than 95%
of the sampled months, were grouped in to 11 clusters of species (Fig.
4.17).
Clusterl-Thalamita crenata, Ceratonereis erythraensis, Alpheopsis equalis and Ophiactis savignyi
Cluster 2- Rhinoclavis sinensis, Polinices jlemengium and Glycera sp.
Cluster 3- Siphonosoma australe and Eupolymna nebulosa
Cluster 4- Nereis kaudata and Pilumnus hirtellus
Cluster 5-Niotha stigmaria and -Modiolus metcalfei
Cluster 6 -Marphysa macintoshi, Eriphis sp., Coralliophila costularis and Cinguloterebra hedleyana
Cluster 7- Tylodipax desigardi, Niso heizensis and Syllis corn uta
Cluster 8- Calappa hepatica and Maera pacifica
Cluster 9- Hoplonemertean sp., Goniada emerita, Eurythoe complanata and Macrophthalmus boscii
Clusterl0-Cerithium alveolum, Pyrene vulpecula and Cymadusa imbroglio
Cluster ll-Cerithium corallium, Notomastes later ice us, Phascolosoma nigrescens, Siboglinum fiordicum. Glycera tesselata, Cerithium rostratum, Cerithium scabridum, Cerithium nesioticum, Pyrene sp., Gafrarium divarticatum, Smaragdia viridis and Smaragdia soverbiana.
Station 4 showed many pairs of close similarity. Marphysa
macintoshi and Eriphis sp. (80%), Smaragdia viridis and Smaragdia
soverbiana (70%), Niso heizensis and Syllis cornuta (60%),
Hoplonemertean sp .. and Goniada emerita (60%), Macrophthalmus boscii
and Eurythoe complanata (60%) come under this. Many other clustures
were showing more than 50% similarity, which include Rhinoclavis
sinensis, Polinices jlemengium and Glycera spp. Cluster 3 showed more
than 70% similarity. The cluster 11 can be subclustered into two. The first
sub cluster, which included Cerithium corallium, Notomastes latericeus,
64

~ _. ~ f*-~
-..I
0 (D ::s 0.. ..., 0
(IQ ..., ~
3 CP tJj ...,
~ ~ 0 ..., c ::c "'0 _. -::s (")
(IQ
0 U2 ~ t-c1 eT M (D ::s (") ...... -::; M _. () U2 tIl
"'0 (D () _. (D tIl
~ ...... tIl ...... ~ ...... _. 0 ::s .J:>.
........ C) C)
Cer.dia I
Tha.cre. Cer.ery . Alp.equ. I
Oph.sav. GoLhes.
Rhi.sin PoLfle.
Gly.sps. sip.aus.
8.Jp.neb. Ner.kau.
Pil.hir Sip.ind. Nio.sti.
tubd.met. Mar.mac.
Eri.sps. Cor.cos. Cin.hed .
Met.mar. TyLdes. Nis.hei. SyLcor. Cal.hep.
Mae.pac. Tel.pal. Pin.pin.
Hop.sps. Gon.eme. 8.Jr.com. Mac.bos.
Cer.alv Pyr.vul
Cym.imb . Sas.del . Cer.cor Not.lat.
Pha.nig . Sib.fio.
Gly.tes. Cer.ros Cer.sca Cer.nes
Pyr.sps. Gaf.div. Sma.vir.
Sma.sov.
SIMILARITY INDEX
co C)
I
I
0') C)
I
I
~
II f.I
,.J----f--
I
l-
~ C)
I
I
~
~
I I
I I
I
I I
,
I--
-
I-
I'-J C)
I
-
-
I--
Cl I
-

Species listed in dendrogram 4. 17.
SI. No. Abbreviation used lCer.dia
2:Tha.cre.
3:Cer.ery. _ 4;Alp.equ.
SOph.sav. - I
6 Gol.hes.
71Rh' . i I.SIn
8'Pol.fle. , 9Gly.sps. I.
IOislp.aus. I
Il,Eup.neb.
12:Ner.kau.
13Pil.hir I .. d 14,Slp.In .
lSNio.sti. -- ---- - 1 -- -
_ 16iMod.met. 17Mar.mac. , 18 Eri.sps.
I
19ICor.cos. , 20Cin.hed.
21 jMet.mar.
22Tyl.des.
23 Nis.hei.
24Syl.cor.
2S,cal.hep. I
26:Mae.pac.
27;Tel.pal.
28 Pin. pin. -~-- t
29Hop.sps. 1
30IGon.eme.
31IEur.com. 32 Mac.bos.
33 Cer.alv
34Pyr.vul
3S,Cym.imb. 36:Bas.del.
37iCer.cor
38,Notlat.
39jPha.nig.
40:Sib.fio.
41!Gly.tes.
421Cer.ros 43Cer.sca
44Cer.nes
45Pyr.sps.
46 Gaf.div.
47:Sma.vir.
48:Sma.sov.
Species Cerithium dialeucum
Thalamita crenata
Ceratonereis erythraensis
~/pheopsis equalis :Ophiaclis savignyi
Golfingia hespera Rhinoclavis sinensis
Polinices flemengium
Glycera species
':Wphonosoma auslrale
'Eupolymna nebulosa I
iNereis kauderni
Pilumnus hirtellus iSipunculus indicus
lNiotha stig-"'aria
]Modiolus metcalfei Marphysa macintoshi
Eriphis species_
Coralliophila costularis
Cinguloterebra hedleyana -I :Metanachis marquesa
,Tylodipax desigardi
Niso heizensis
/;yllis cornula
Calappa hepatica
,Maera pacifica
1 Tellina palatum
Pinnotheres pinnotheres
Hoplonemertean species
Goniada em er ita
Eurythoe complanata
Macrophthalmus boscii
Cerithium alveolum
,Pyrene vulpecula
,Cymadusa imbroglio IBaseodiscus delineatus
~Cerithium corallium Nolomastes latericeus
Phascolosoma nigrescens
Siboglinum fiordicum
Glycera tesselala
:Cerithium rostratum - I
Cerithium scabridum
:Cerithium nesioticum Pyrene sps. J 2 I pajrarium divarticatum
;Smargdia viridis :Smargdia soverbiana

Chapter -I. Bottoll/ .llllma
Phascolosoma nigrescence, Siboglinum fiordicum, Glycera tesselata,
Cerithium rostratum and Cerithium scabridum showed a similarity more
than 60%. The second sub c1usture, which included Cerithium nesioticum,
Pyrene spp., Gafrarium divarticatum, Smaragdia viridis and Smaragdia
soverbiana showed about 68% similarity.
At station 5, there were 18 species and can be grouped into 5
clustures (Fig.4.18).
The cluster 1 contained Cardiosoma carnifex and Thalamita crenata
(more than 65% similarity). Cluster 2 contained Cerithium rarimaculatum
and Cerithium scabridum (60% similarity). Smaragdia soverbiana and
Tylodipax desigardi (50% similarity) were included in cluster 3. Cluster 4
contained Nikoides maldivensis, Apseudus sp., Terebralia palustris,
Cerithium corallium and Littorina undulata (showing more than 60 %
similarity) and the final cluster 5 contained Margarites helicinia and Scylla
serrata.
At this station, between Cerithium corallium and Littorina undulata
85% of similarity observed and this in turn with Terebralium palustris
showed 82% similarity.
The 16 species of station 6 were classified into 5 clustures (Fig.
4.19) of similar species at 40% similarity level. The clustures were
Cluster 1- Smaragdia viridis, Uca in versa
Cluster 2- Cerithium scabridum, Smaragdia soverbiana
Cluster 3- Cerithium rarimaculatum, Pyrene sp. and Nikoides maldivensis
Cluster 4-Apseudus sp., Terebralia palustris,Cerithium corallium,Littorina undulata
Cluster 5- Margarites helicinia, Uca tetragonon.
The similarity values observed were, between Smaragdia viridis and
Uca inversa -50%, Cerithium scabridum and Smaragdia soverbiana -45%.
65

-
o
.------
r-
Cl N
r-
I I
~
I I
I I
I I
X'3GNI l...LI"HV1IWIS
Cl CO
~
'Jas'A~S
'Ialj" JgV\j
'sds'JAd
'pun'l!l
JO~' Ja:;, V)
= 0 ,-'lgd'Ja! .....
~ ..... en .....
'sds'sdV' ~ en
U2 (1)
'(3 'lgW'>t!N r.z..l (1) - 0..
U en r.z..l u
'sds'Jgd p" :.a U2 .....
= U (1)
'J.al'g~n - ..0
::r: to...
f--4 0
'J!A'gWS ~ Ol)
= 'a a:I ;::::3
'Sap'IA! 0 .... Ol)
.... 'AOS'gWS t.S
E ~
g~S'Ja:;, bh 0 ....
"Cj 'JgJ' Ja:;, = (1)
0 'aJ~'gLl!
00 ~
'Jg~'Jg:;, ~ bil .-
'AUrg~n ~
Cl Cl T"""

Species listed in dendrogram 4. 18.
SI. No. Abbreviation used
1 Uca.inv.
2Car.car.
3ITha.cre. 41Cer.rar. , S;Cer.sca.
--- - 1
i - 6iSma.sov.
1_ --- - --- 7lTyl.des. ___ 8
iSma.vir. --
9Uca.tet. , ) 0 Par.sps. _ 11 Nik.mal.
12 aps.sps.
13,Ter.pal. 14Cer.cor
IS Lit.und. 16
ipyr.sps.
17iMar.hel. - ---- ---I
18iScy.ser.
Species
Uca inversa inversa
Cardisoma carnifex
Thalamita crenata I
Cerithium rarimaculatum
Cerithium scabridum
Smargdia soverbiana
Tylodipax desigardi _ Smargdia viridis
Uca tetragonon
Paratanaeidae species
Nikoides maldivensis
Apseudus species
,Terebralia palustris
Cerithium corallium
Lillorina undulata
Pyrene sps. 12
Margarites helicina scyl/a serrata

-
r--
r---
o N
-
-
r-
Cl 0)
X3: a N I A~I"HVl I IAI I S
Cl Cl ....-
"19P3~n
"18LI" J9V'J
"pun"~!l
JO~" J~:;' \0 c::
"S2 ...... "19d"J~1 ~ ......
(J)
...... ~
"sds"sdV' (J) d)
"u d)
tr.I 0.. "J8S"A~S r..x..l
(J)
u - :.a u ...... r..x..l c::
"19W">I!N 0.. d)
.0 tr.I ~
U 0
"SdS"JAd - bl)
::r: c:: f- "S.
~ =s
"J9J" J~:;' 0
'"' p:j bl)
'"' "AOS"9WS
~ E ~
'"' bl) 9:JS" J~:;' 0
'"' '"0 c:: d)
"AUr9~n Cl
0'1 ..... "J!A"9WS ~
~ .-"SdS"J9d ~
"19d"1II

Species listed in dendrogram 4. 19.
SI. No. Abbreviation used Species 1 II\.pa\. I/Iyograpsus paludicol a
-----...------- -- ----- -----
2 -··1-
Par.sps. ,Paratanaeidae species 3[ Sma.vir. iSmargdia viridis 4 Uca.inv. !Uca inversa inversa , 5' Cer.sca. Cerithium scabridum
- I Cer.rar. Cerithium rarimaculatum 61
I ---------- 1--Sma.sov. Smargdia soverbiana i 7 '. __ .... - -- I
8: - I Pyr.sps. ,Pyrene sps. 12
9: Nik.ma\. Nikoides maldivensis I
scyl/a serrata 10' Scy.ser. 11 aps.sps. Apseudus species 12 Ter.pa\. ,Terebralia palustris I" ' ,)' Cer.cor :Cerithium corallium 14 Lit.und.
I :Lillorina undulata
IS Mar.he\. jMargarites helicina 16 Uca.tet. . Uca tetragonon

Chapter -I. Bolloll1 fauno
Cerithium corallium, Littorina undulata and Terebralia palustris were
showed the same pattern like that at station 5.
4. 2. 2. 4. Factor analysis-grouping of months (R-mode) and species (Q-mode)
Station 1
R-mode: Factors 1 and 2 (Table 4. 11) were differential factor groups.
Factor 1 comprised of post-monsoon and monsoon season. Pre-monsoon
season showed a benthic distribution different from that of the other two
seasons. All the factor groups were having high negative factor loadings
except factor 4, 5 and 6. This showed that the months contained in factors
1,2 and 3 were negatively correlated with the months included in factors 4,
5 and 6. Months included in factors 1 and 2 formed the differential factor
group periods and they impart with the sufficient information about the
benthic temporal distribution at this station. These were the indicator
periods and to be given due importance. Deletion of any of these months
will lead to reduction in the information gathered. Addition of any of the
remaining months will not add to the information about benthic distribution
at this station.
Q-mode: 50 species observed at station 1 were classified into 10 significant
factor groups (A> 1). Of these 10 significant factor groups of species,
factors I to 5 were differential factor groups. The species included in these
5 factor groups constituted about 64% of the total number of species
studied at this station. These 32 species were to be given due importance
in future studies of benthic species from this area. Factor groups I, 2, 4
and 6 were having negative factor loadings, which implied that they were
favoured by environmental condition unfavourable to the species of other
factor groups (Table 4. 12).
66

Chap/er -I. BOl/ol1l/£IlIl1£1
Table 4. 11. Station l-R-mode factor analysis
-_ .. _--------.-----_ .. _- - ---
F.~O~ s;,::thS_. 4.:
2
I Oct.99 : 6.04 i I
i Nov.99 3.53
Dec.99 2.85
Jul.OO
Oct.OO
Nov.OO
I Dec.OO
I Jan.Ol , i Feb.Ol
May.Ol
Jun.Ol
Mar.OO
Apr.OO
May.OO
1.83
6.25
3.99
4.40
2.45
5.82
4.21
2.85
7.28
4.49
: 3.56
3 - -, Aug.OO -.. ~ --j-4.46
Sep.OO 5.2
Jul.Ol 4.77
Aug.Ol
4 Apr.Ol
3.07
1.64 ----- ._-_._ .. - -- - --_.
5 Jan.OO 3.5 --
6 Feb.OO I 1.02 t- - .---- L. -_... . - - --- ___ ..J ___ . - - -. -
Differential factor groups
Maximum factor load
-- - -
Eigen value
--- -- - -----t-- ----
-0.8132
-0.8021
-0.9038
-0.8686
-0.9683
-0.9665 13.61
-0.9609
-0.8513
-0.5710
-0.9510
-0.6616
-0.8856
-0.8533
Variance Variance value 0/0
9.8732 ! 41.1382*
-0.8974 3.839 ' 3.581 14.921 *
-0.9367
.. -
-0.7030
-0.7375
-0.7458
-0.8834
+0.9856
+0.7692
1.788
1.330
: 1.009
+0.8982 I 0.7965
i
I I
i 3.4799
I i 1.1378
. 1.4793
1.1991
: 14.4996
4.7409
6.1637
. 4.9963

Chapter -I. Bol1ofll fallllll
Table 4. 12. Station l-Q mode factor analysis - ~--- .. _-_._--_.- - ------ -----
I Factor i Species ;% Maximum' Eigen Max. Variation I
~alue ,
; factor load' value %
Cerithium corallium '28.95 ' -0.6845 16.49 7.1869 14.38*
Pyrene sp. 2.54 -0.7560
Cyprea moneta 0.62 -0.6345
Smaragdia viridis 2.79 -0.7332
Ctena delicatula I 0.5 ' -0.6485
I Pinna muricata 0.43 : -0.7168 I I
: Gafrarium divarticatum : 10.53 -0.8487 I
i Calappa hepatica 1.15 -0.6395
I Etisus splendidus ' 0.34 : -0.4647
Paracilicacea setosa 0.56 -0.5640
2 Cerithium scabridum 15.33 -0.5965 3.91 4.8427 9.68* I
: Nereis trifasciata ; 1.18 -0.8231
Maera pacifica 4.83 -0.9585
Stenothoe kaia , 1.21 ! -0.8738 i
: 4.8271 3 Nephtys hombergii 1.46 0.6379 13.506 • 9.65*
Macrophthalmus boscii 0.96 i 0.6359
Actaeodes tomentosus 10.28 0.7399
Alpheopsis equalis 0.28 0.8783
, Seychellana expansa 0.12 : 0.4668 I I i Paratanaeidae sp. : 0.74 , 0.5888 I
I Ophicornella sexadia 10.62 ! 0.8621 ------~ - -- --- -- I :
I 8.16* 4 Cerithium rostratum 3.03 • -0.5923 • 3.208 i 4.0805
Syllis corn uta 0.28 -0.7404
Eriphis sp. : 0.22 -0.6201
Pinnotheres pinnotheres 0.25 -0.5523
Thalamita crenata 0.68 -0.8707
Cymadusa imbroglio I 12.69 -0.7748

Table 4. 12. contd ...
5 I Cerithium alveolum I
6
: Strombus mutabilis
. Glycera lancadivae
Nephtys dibranchus
Megalopa larva
Cerithium nesioticum
Grapsus sp.
Mallacoota ins ignis
I Ophiactis savignyi ,
7 . ,-C~;:alliophiJa ·cos/ularis
Smargdia soverbiana
Dolabella rumphii
Baseodiscus delineatus
Glycera convoluta
0.43
:0.28
1.67
; 0.25
i°.34
0.93
0.28
0.31
0.34
~0.46
: 8.64
0.31
0.34 i
: 0.22
Ophiocoma scolopendrina i 0.34 ..
8 Strombus canarium 0.19
: Elysis sp.
I G . A . Onlaua emerzta
9 Glycera tesselata
Nephtys inermis
Pilumnus hirtellus
I Pinnotheres pisum I
-lOl-E-c-h-in-o-m-e-tr-a mathaei I
-. Differential factor groups . __ .
0.37
, 0.28
;0.25
0.25
0.46
0.15
0.12
, 0.7556
0.8031
0.5284
i 0.7407
Chap/er 4. Bol/om fllunll
2.831 4.5225 9.05*
10.5646 I
.: -0.9098 1 2.596 [ 3.6388 I 7.28
; -0.6981
-0.8826 I
-0.6230
. 0.8246
• 0.5138
· 0.7727
0.5982
, 0.5265
0.6403
0.6137
-0.4706
0.7246
0.6832
0.5188
0.7418
0.5792
-0.5556
,
i .. l 2.362 I 3.9247 I 7.85
I
I i I
! 2.014 2.5149 5.03
i
1.684 i 2.8214 : 5.64
1.574! 1.8171 3.63

Chapter .J. BollolII fall/Ill
Station 2
R-mode: 24 months considered in the study of temporal variation when
subjected to R-mode factor analysis, it divided the study period into 6
significant factor groups with factors 1 and 2 constituting the differential
factor groups. These two factors were exclusively monsoon and post
monsoon almost excluding pre-monsoon season. From this it become
cleared that monsoon and post-monsoon season showed variation in the
benthic community structure as well as in its distribution (Table 4. 13).
Q-mode: 49 benthic species collected from station 2 for a period of 24
months were classified into 10 factor groups, which were all statistically
significant (A> 1). Factor groups 1, 5 and 8 were having high negative
factor loadings where as the other factor groups have high positive factor
loadings implying that the conditions favourable to the former were
unfavourable to the latter. Also species included in the same factor group
have the same sign implying the co-existence tendency for these species.
Factors 1 to 6 were differential factor groups implying that maximum
information can be obtained from the species of these factor groups, which
was about 71.43% of the total 49 species collected from this station. The
remaining 28.57% of the species do not supplement the information
already contributed by the differential factor group species (Table 4. 14).
Station 3
R-mode: 24 months data on benthos from station 3 during the period,
Sept.1999 to Aug 2001, were subjected to R-mode analysis for grouping
months into factors. R-mode analysis after varimax rotation to simple
structure classified these periods into 10 factor groups of which only 7
factors were statistically significant (A> 1). (Table 4. 15)
Q-mode: The factors 1-4 were designated as the differential factor groups.
These include the post-monsoon season and monsoon season. Just as at
67

Chapter 4. Bol/om fauna
Table 4. 13. Station 2 R-mode factor analysis .. -- -_. - -
Factor Months % Maximum Eigen Variance Variance
factor load value value --- ----r---6ct.99~·-2~69 -0.9449 13.26 10.088 42.032*
I
Sep.OO 1.87
Oct.OO 1.48
Nov.OO 4.34
Dec.OO 5.41
Jan.Ol 3.23
Feb.Ol 4.46
May.Ol 1.72
JUll.Ol I 7.15
Jul.Ol 7.93
-0.6892
-0.9702
-0.7146
-0.9784
-0.9674
-0.9620
-0.8412
-0.9663
-0.9292
Aug.Ol 4.71 -0.9558 '------~-- --------~---+----.------.-. -- - - _. - --
I 2 Sep.99 4.24 -0.9942 5.145
Nov.99 10.07 -0.9637
Jan.OO 2.28 -0.8247 I
Feb.OO : 1.92 -0.9300 I
May.OO i 3.64 -0.7242
Jun.OO 2.91 ' -0.8546
Jul.OO 5.43 -0.9882
-0.8880 t
-0.9809 i 1.946
6 Apr.Ol 3.57 ~t----- ---- ~-~- - . -- - -
Differential factor groups
-0.9804
-0.9233 ,1.394
-0.9916 ~. 0.9388
I -0.8152 1 _
I 0.5804
: 7.591
>
, 1.9391
-
1.2964
1.0195
\ 1.3316.
31.629*
18.0796
5.4018
4.2479
5.5483

Chap/er 4. Bol/om fauna
Table 4. 14. Station 2 Q -mode factor analysis
Factor i Species I
Conus catus
Pyrene vulpecula
--- -- - ---~ . ---- -.-.-------~-- - - --
% r"aximum ! Eigeo I'variation :Variation.
factor load I value I value % I
I r ! 6.31 • -0.9243 ,13.77 . 5.2308 i 10.67*
0.41 I -0.9001
3.08 -0.4457
Cinguloterebra hedleyana : 0.53 • -0.6911
Margarites helicinia '0.41 • -0.7677
2
Myadoropsis brevispinious
i Nephtys hombergii
Coralliophila costularis
Smaragdia soverbiana
Nereis trifasciata
Maera pacifica
Stenothoe kaia
Ophiactis savignyi ,- ---- 1 .. ---- -----------------
3 ; Cerithium alveolum
4
I I
i Lithophaga nigra
Gafrarium divarticatum
i Notomastes latericeus I
Calappa hepatica
Echinoneus cyclostomatus
Cerithium scabridum
j Pyrene vulpecula I
! Strombus mutabilis
Ctena delicatula
Pinna muricata
Glycera lancadivae
Goniada emerita
10.22 !
I
10.27
, 0.87
-0.6334
-0.8192
I 0.6078
7.59 ! 0.5710
0.46 0.6484
3.74 0.9064
i 0.29 0.8258
0.15 0.5403
I 3.4 I I
I
: 0.7481 i
: 0.15 • 0.8044
! 4.83 '0.6847
0.15 : 0.5688
• 0.27 0.7311
: 0.12 I
21.7
0.51
: 0.6716 I ---10.7570
: 0.7977 I
I 0.22 I 0.6611
0.36 0.7247
: 0.32 0.6836
0.58 I 0.7473
: 0.22 0.7006
; 4.537 4.3021 , 8.78*
3.897 5.1586 ! 10.53*
I
3.113 i 5.5007 i ,
:
: 11.23*

Table 4. 14. contd ...
. - 5--~Ce~ithiumco~ai[;um I
: Littorina undulata
i Hoplonemertean sp.
Nephtys inermis
Megalopa larva
Paratanaeidae sp. I--~----~--·· --.- .. _-
6 ! Cerithium dialeucum I
Gymnodoris ceylonica
Golfingia hespera
7 Cerithium rostratum
i Paraciliaceae setosa
Chapter -I. BOllomjllll11l1
32.40 -0.6080 2.926 3.7825 7.72 *
,1.48 -0.8841
0.17 -0.8083
, 0.12 -0.5670
0.34 -0.5745
0.24 . -0.5388
0.65 0.8657 ,2.481 2.7474 5.61*
• 0.15 : 0.5721
10.22 0.7918
l.75 I .-
~ 0.6788 I • 2.354 2.6012 5.309
; 0.17 • 0.5721
I Ophiocoma scolopendrina ' 0.12 I .
0.7918
8 Pyrene sp.
Dolabella rumphii
Sy/lis corn uta
Mallacoota ins ignis - - ----" --
9 ,Syllis gracilis ,
! Thalamita crenata
Ophicornella sexadia
----- -- ------- -------_.--
10 Cyprea moneta
Glycera convoluta
Siriella brevicaudata . - - -- ._--------
* Differential factor groups
2.04 . -0.5634 [l.969: 3.9049 : 7.97
0.24 -0.5316 I
I 0.15 '-0.7372
0.34 -0.6640
0.15
i 0.53
0.34 , .--
0.29 I
0.5219
0.6493
0.5972
r 0.5763
0.17 : 0.5626
0.19 0.7975
1.849 • 2.7472 5.61
1.748 I 2.6629 5.43

Chapter -I. Bo((omjill/l/(/
station 1 and 2, pre-monsoon season was not in the differential group. This
implied that information contributed by the distribution of benthos in this
season was not additional, but only contributed to the already gathered
information during monsoon and post-monsoon season. Factor loadings of
the factors 1, 3 and 4 were highly negative whereas that of 2 was highly
positive. The same sign for the elements of a factor implied that these
months were highly positively correlated whereas that of 1, 3 and 4 and,
that of2 were negatively correlated or disassociated (Table 4. 16).
47 benthic species collected during a period of 24 months were
subjected to Q-mode factor analysis for grouping of these species into
associated groups. This analysis classified the 47 species into 10
significant factor groups, all of which statistically significant (A> 1). First 5
factor groups, which explained about 50% of the total variability, were
delineated as the differential factor groups. Species included in these
groups were the indicator species. About 70.21 % of the benthic species
collected were included in the differential factor groups.
Station 4
R-mode: Benthic data collected for 24 months at station 4 was subjected to
R-mode analysis for temporal grouping. 24 months of this study were
classified into 10 distinct and unique factor groups of which only 4 factors
were statistically significant (A> 1) and of these 4 factors, only the first
three were as sub designated as differential factor groups of months. Hence
these factors explained about 50% of the temporal variations. The
differential factor months were end of post-monsoon and middle to end of
monsoon season were more frequent. Factor groups 1 and 3 were having
negative factor loadings whereas factors 2 and 4 were having positive
factor loadings. Periods of each of the factor groups were highly co
existing indicated by the same sign for all the months of a factor group
68

Table 4. 15. Station 3 R-mode factor analysis
Factor Months 0/0 Maxi Eigen Variance Variance
factor value value 0/0
loading
1 Nov.99 7.73 -0.8513 11.00 6.0361 25.1504*
Dec.99 7.09 -0.8646
Jan.OO 8.38 -0.5684
Feb.OO 3.81 -0.7784
Jun. 00 4.22 -0.7814
Dec.OO 3.34 -0.8329
Jan.Ol 2.58 -0.9181
2 Sep.99 3.63 0.6500 2.444 3.7781 15.74*
Apr.OO 5.33 0.5490
Aug. 00 2.23 0.8406
Oct.OO 2.87 0.7595
Nov.OO 2.99 0.8465
3 May.Ol 5.92 -0.9709 2.182 2.1614 9.006*
Jun.Ol 4.69 -0.9802
4 Oct.99 6.74 -0.5638 1.503 2.6297 10.95*
Jul.Ol 3.10 -0.9378
Aug.Ol 3.98 -0.9383
5 Apr.Ol 2.52 -0.9383 1.219 1.3605 5.669
6 Mar. 00 2.52 -0.8873 1.059 2.0764 8.65
May.OO 2.23 -0.8766
7 Sep.OO 2.46 0.9002 1.0141 1.3466 5.61
8 Jul.OO 7.91 -0.6278 0.7381 1.2438 5.18
Mar. 0 1 2.34 -0.6253
9 Feb.Ol 1.41 0.7520 0.5962 1.0016 4.17
:11: Differential factor groups

Chapter 4. Bottom fauna
Table 4. 16. Station 3 Q-mode factor analysis
Factor I Species I % I Maximum Eigen jVariation IVariation , I I I I
I factor load value I value 0/0 ,
1 Pyrene sp. 12.48 -0.5488 11.80 4.2136 8.97*
Smaragdia viridis 5.27 I -0.5657
Goljingia hespcra 0.7 -0.5558
Sipunculusindicus 0.64 -0.6305 I I
I Thalamita crenata 1 -0.7303 I
Actaeodes tomentosus 0.47 -0.6968 I
I Maera pacifica 2.46 -0.6074 I I
I 2 Punctacteon amakusaensis 0.23 -0.8578 5.737 8.0314 17.09*
Cerithium alveolum 1.29 -0.6951
Conus catus 0.53 -0.3980
Coralliophila costularis 0.18 -0.7041
Polinices flemengium 1.52 -0.9590
Smargdia soverbiana 2.87 -0.8847 ! ~ Pyrgulina pupula 0.76 -0.8079 ,
Tellina palatum 1.52 -0.7959
Marphysa macintoshi 0.35 -0.8701
Eriphis sp. 0.41 -0.8293
Pinnotheres pinnotheres 0.76 -0.9242
3 Cardium asiaticum 0.18 0.6351 3.750 4.7804 10.17*
Gafrarium divarticatum 19.98 0.5262
Baseodiscus delineatus 1.29 0.6096
Eurythoe mathaei 2.52 0.9589
Nephtys inermis 0.23 0.8937
Ceratonereis erythraensis 0.59 0.8359
Cymadusa imbroglio 4.45 0.6867

Chapter 4. Bottom fauna
Table 4. 16. contd ...
4 i Cyprea moneta i 035 i -07945 i 3020 14093 1871* I I I I I , I I I I
I Niso heizensis I 1.58 i -0.8426 I I I
Phascolosoma nigrescens 2.34 -0.8398
Goniada emerita 0.18 -0.6946
Pilumnus hitellus 0.41 -0.5710
5 Littorina undulata 1.41 -0.5294 3.750 4.7804 6.65*
Notomastes latericeus 0.41 -0.8229
I Eurythoe complanata 0.59 -0.7646
--
6 Cerithium dialeucum 0.53 -0.5721 2.495 2.8338 6.03
Cerithium rostratum 7.44 -0.7611
Cerithium nesioticum 3.16 -0.5283
Sibogl inum jiordicum 1.41 -0.6864
Glycera tesselata 1.99 -0.8146 ---
7 Strombus canarium 0.18 -0.7835 2.230 3.0977 6.59
: 8 Pyrene vulpecula 1.58 -0.8888 2.167 2.3157 4.93 I
Vittina variegata 0.53 -0.9315 I
--
9 Metanachis marquesa 1.05 0.7076 1.954 2.4782 5.27
Strombus mutabilis 0.29 0.8046
10 Cerithium corallium 4.16 0.7798 1.558 2.5705 5.47
Siphonosoma australe 0.35 0.8836 --
* Differential factor groups

Chapter -I. Bollo/ll faul/lI
except factor 7 which has two months with opposite signs for factor
loadings denoting them as disassociating periods, having species favoured
by different environmental conditions (Table 4. 17).
Q-mode: 48 benthic species collected from station 4 for a period of 24
months were subjected to Q-mode factor analysis for grouping of species
and thereby to determine the indicator species. Q-mode analysis divided
the 48 benthic species into 10 significant (A> 1) factor groups of which first
7 factor groups formed the differential factor groups. About 79.16% of the
species were designated as the differential benthic species. At this station
all the factor groups explained almost the same amount of variability in the
benthic distribution [6.011% (factor 6)- 9.938% (factor 4] implying that
almost all the species contribute to the total variability especially the
species of factors 1 to 6 were very important and their contribution was
validated by their designated label as differential species. These species
are to be considered in any future study, deletion of any of these 79% of
the species will lead to loss of information (Table 4. 18).
Station 5
R-mode: Benthic species collected for a period of 24 months at station 5
were subjected to R-mode factor analysis for grouping of months. This
analysis divided the 24 months into 2 main factor groups, which explained
a total variability of 94.05%, and factor 1 was the differential factor group
and this factor contained months from Dec. 99 to Aug.200 1 whereas factor
2 contains Sep.99, Oct.99 and Nov.99. Both factors were having high
negative factor loadings implying that benthic distribution in the periods
from Dec.99 to Aug.O 1 were controlled by physico- chemical factors,
which were different from that which control benthic population during
Sep.99 to Nov.99. The R- mode analysis revealed that factor 2 elements
were not so important as that of factor 1 elements, latter being the
differential factor group (Table 4. 19).
69

Chapter 4. Bottom fauna
Table 4. 17. Station 4 R-mode factor analysis
, F : M h I % M· I E· I
actor ont s I
0 aXI I
Igen anance I arlance
factor I value value I 0/0 I I
i load I
v . v .
1 Nov.99 2.86
I -0.6311 14.22 8.2791 34.49*
Jan.OO 5.03 -0.7169
Feb.OO 14.5 -0.8360
Mar.OO 3.86 -0.9499
May.OO 5.14 -0.9420
Aug.OO 4.09 -0.8074 I
Oct.OO 3.62 -0.5371
Dec.OO 4.44 -0.7830
Jan.Ol 2.05 -0.8873 I
Feb.Ol ! 3.04 -0.6934
Mar.Ol 2.34 -0.6174
2 Sep.99 2.86 0.6824 2.594 2.9506 12.29* I
I Oct.99 4.97 0.9408
3 Apr.OO 7.13 -0.7310 1.409 2.4264 10.11*
Jul.OO 5.38 -0.6666
Sep.OO ,4.21 -0.8466
4 Apr. 0 1 4.68 0.9369 1.193 2.1322 8.88
Jun.Ol 3.68 0.6450
Aug.Ol 2.45 0.6434 ,
5 May.Ol 2.51 -0.8809 0.9303 1.8709 7.80
6 Ju1.01 2.10 -0.7934 0.8047 1.5711 6.55 --
7 Dec.99 7.77 0.7368 0.5895 1.4405 6.00
Nov.OO I 5.61 -0.6119
8 Jun.OO 2.81 -0.7240 0.5274 0.8076 3.365 ---
• Differential factor groups

Chapter 4. Bottom fauna
Table 4. 18. Station 4 Q-mode factor analysis -~---. ----~--KT-~-
I Factor Species . % raximum Eigen I ariation Variation I
factor load value !value 0/0 ----J--- --- ---- ~- ..
Cerithium alveolum 1.09 1-0.6266 10.71 I 3.8388 8.00*
Niso heizensis 0.47 I -0.9360 I I
Syllis cornuta 0.18 r -0.8692
Tylodipax desigardi 0.29 \-0.7645 I Cymadusa imbroglio 1.11 1-0.7152 I I I
L- -- -2.sTT -O~4517- --
2 Smargdia viridis 4.547 4.7393 9.87*
Tellina palatum 1.4 I -0.9397 I
I Ceratonereis erythraensis 0.18 i -0.8705 I
Pinnotheres pinnotheres 0.64 I I -0.7561 I
Thalamita crenata 0.35 i -0.9322
I Alpheopsis equalis I
0.12 1-0.7619
Ophiactis savignyi 0.12 -0.7619 ---- ------ -- -- -
3 Cerithium rostratum 4.44 0.7918 3.863 3.9078 8.14*
Cerithium nesioticum 4.09 0.6421
Rhinoclavis sinensis 10.23 0.6341
Polinices flemengium 0.12 0.7941
Golfingia hespera 0.35 0.7038
I I Glycera sp. 0.29 0.7096 I I ------- - ---- ---" - .. _- ._- -" -n I Cerithium corallium 3.92 -0.7595 3.567 4.7702 9.94*
I I Coralliophila costularis 0.23 -0.7092
Smaragdia soverbiana 2.63 -0.6514
Cinguloterebra 0.58 -0.6648
hedleyana 1.23 -0.5800
Notomastes latericeus 0.53 -0.8812
Marphysa macintoshi 0.18 -0.7832
Eriphis sp. 0.82 I -0.4569
Macrophthalmus boscii I
"----.- ... _----------- -

Chapter 4. Bottom fauna
Fig. 4. 18. contd ... --------:----,---- ~-~-----~--~-~--- -- ~---,----- - - ~ -~-~~~-
5 : Gafrarium divarticatum 26.36 : -0.5794 . 3.229 I 3.5154 : 7.32*
I Nereiskauderni 0.18 : -0.8617
! Eupolymna nebulosa 0.53 : -0.6543
! Pilumnus hirtellus ! 0.29 1 -0.6122
I Maera pacifica ! 1.11 • -0.6187 !-------::-----::-----1-61 Niotha stigmaria
i Modiolus metcalfei I I
I I Sipunculus indicus I , r-- 7-----1-P-y-r-en-e-v-u--lp-e-c-ul-a-
t- -----: 8
Hoplonemenrtean sp.
Goniada emerita
Eurythoe complanata
Metanachis marquesa
Phascolosoma nigrescence
Calappa hepatica ---- -- ---------------- -
9 Cerithium dialeucucm
Pyrene sp.
Siboglinum fiordicum
Glycera tesselata
10 Cerithium scabridum
Baseodiscus delineatus
I Siphonosoma australe _--=--=-=--,---1 _________ ~ ___ ~~ .. ~ __ ~ * Differential factor groups
0.12 1-0.7145
0.41 i -0.7609 ----- -L--------0.47 1-0.6805
I 0.35 : -0.6558 i
0.35 I -0.8920
1.87 · -0.6961 _ .. - - -- -.--
3.92 0.7971
2.86 0.8270
0.35 0.8216 - - - -"- - --
0.29 -0.5830
12.92 -0.4629
2.16 -0.6171
3.74 • -0.8754 -
8.24 0.6007
3.86 0.8127
0.35 0.5530
2.699-j 3.6089i 7.52' , '
i , 2.327 I 4.0982 [ 8.54
i
1.965 ! 3.2617 6.8
~ ~ -
1.814 2.9819 6.21

Chapter -I. Bollo11ljlllma
Q-mode: 18 benthic species collected from station 5 for a period of 24
months showed that these 18 species could be classified into 10 factor
groups of which only 7 factors were statistically significant- (A> 1) and
factors 1 to 5 were differential factor groups and species contained in these
factors were indicator species of this station. Factors 1, 3, 4 and 5 have
high negative factor loadings where as factor 2 has high positive factor
loadings. Benthic species included in each of these factor groups were
distinct and unique with respect to their affinity between each other as well
as affinity for environmental parameters according as they were controlled
or limited in production by these parameters. These species constituted
about 66.67% of the benthic community at this station (Table 4.20).
Station 6
R-mode: A period of 24 months of data when subjected to R-mode factor
analysis showed that these 24 months could be classified into 2 significant
factor groups.
Q-mode: The 24 months when subjected to factor analysis by R- mode
showed that these 24 months could be broadly classified into 2 significant
(1-.>1) factor groups and only Sept. 99, Oct.99 and Nov. 99 as factor groups
2. All the months included in factor group have factor loadings all
negative in the range, -0.993 to -0.729. Factor group, explains about
79.56% of the temporal variability whereas factor 2 explains 4.337 ie,
18.07% of the observed temporal variability in the benthic distribution
(Table 4. 21). The 16 species of station 6 was grouped in to 6 factor
groups of which the first 5 factor groups were differential factor groups.
The number of species included in each factor group decreases from factor
I down to factor 6. The more number of factors and less number of species
in each group was an indication of highly varying environment over the
period of two years.
70

Chapter 4. Bol/om fauna
Table 4. 19. Station 5 R-mode factor analysis
! Factor: Months % --Maximum i Eigen i Variance~:Va~i~~ce i ~ i I I 1 i ! i factor load i value value 1
----------i----l------ - I ------ --
1 I Dec.99 I 11.26 . -0.8946
2
1
1 lan.OO I 3.78 • -0.9344
Feb.OO I 3.56 ; -0.9430
i Mar.OO ! 1.71 -0.8692
I Apr.OO 2.99 -0.9394 I
I May .00 2.64 -0.9572
11 Jun.OO 5.20, -0.8975
lul.OO 4.13 i -0.7837
I Aug.OO 2.85 I I
i
, -0.8168 , ,
Sep.OO 3.99 , -0.9521
Oct.OO
Nov.OO
Dec.OO
lan.Ol
Feb.Ol
Mar. 0 1
Apr. 0 1
May.Ol
lun.Ol
lul.Ol
Aug.Ol
Sep.99
Oct.99
Nov.99
4.70 -0.9095
4.13 0.8715
5.27 0.9660
1.35 -0.7141
5.84 -0.9537 ,
5.84 il -0.9537
8.77 -0.9468
2.57 -0.9146
3.99 -0.8087
3.06
12.14
4.42
1.5
4.28
-0.8740
-0.7903
-0.7484
-0.9968
-0.0008
• Differential factor groups
1.640 5.0283 20.9514*

Table 4.20. Station 5 Q-mode factor analysis
Factor Species % Maximum Eigen Variation Variation
factor load value value 0/0
1 Smaragdia soverbiana 0.14 -0.9352 5.100 1.5944 8.86*
Apseudus sp. 5.92 -0.6130
2 Cardiosoma carnifex 0.07 0.9364 2.555 1.7432 9.68*
Thalamita crenata 0.14 0.8390
3 Cerithium corallium 10.62 -0.8737 2.016 3.2404 18.00*
Littorina undulata 59.37 -0.7812
Terebralia palustris 18.03 -0.7940
Margarites helicinia 0.57 -0.9177
4 Uca in versa inversa 0.07 -0.9635 1.595 1.698 9.43*
Scylla serrata 0.43 -0.4198
Nikoid.es maldivensis 1.57 -0.7427
5 Uca tetragonon 0.14 -0.9570 1.301 1.2535 6.96*
6 Tylodipax desigardi 0.43 0.4152 1.054 1.2365 6.87
Paratanaeidae sp. 0.50 0.9806
7 Pyrene sp. 0.93 0.9415 1.047 1.1573 6.43
8 Smaragdia viridis 0.43 0.8481 0.908 1.1737 6.52
9 Cerithium rarimaculatum 0.43 -0.8873 0.632 2.0898 11.61
Cerithium scabridum 0.50 -0.8406
* Differential factor groups.

Chapter.t. BollolII fauna
Table 4.21. Station 6 Q-Mode factor analysis ---_.- ---- . ----_. -- -------------
. Factor : Species ;% Maximum Eigen :Variation Variation I !
ractor load value I value 0/0 I ...
. Cerithium corallium 11.61 . -0.8538 . 4.912 3.0566 19.104* I
i Littorina undulata • 66.52 :
-0.8023 i
: -0.7434 I Terebralia paluslris 14.99 I
I Margarites helicinia 10.70 -0.8512
2 I Cerithi~~ ~cabridum i 0.77 0.8256 1.975 1.7490 10.93*
; Smaragdia soverbiana ; 0.64 : 0.9082 i
3 ! C~rithium rarimaculatum I ; 0.19 , -0.9497 1.630 1.334 8.34*
4 I Smaragdia viridis 0.19 I 0.8231 1.373 1.6882 10.55*
i Uca inversa in versa 0.13 0.9369 I
: Jllyograpsus paludicola ;
5 0.06 -0.9712 1.271 1.156 7.22*
6 ! Paratanaeidae sp. 0.06 '0.9899 1.097 1.097 6.86
* Differential factor groups