Macro stability - inflation Gene Chang. Inflation Another macro instability in a market system, in...
22
Macro stability - inflation Gene Chang
-
Upload
eleanor-garrett -
Category
Documents
-
view
237 -
download
2
Transcript of Macro stability - inflation Gene Chang. Inflation Another macro instability in a market system, in...

Macro stability - inflation
Gene Chang

Inflation
Another macro instability in a market system, in business cycles, is the price level
Inflation
deflation
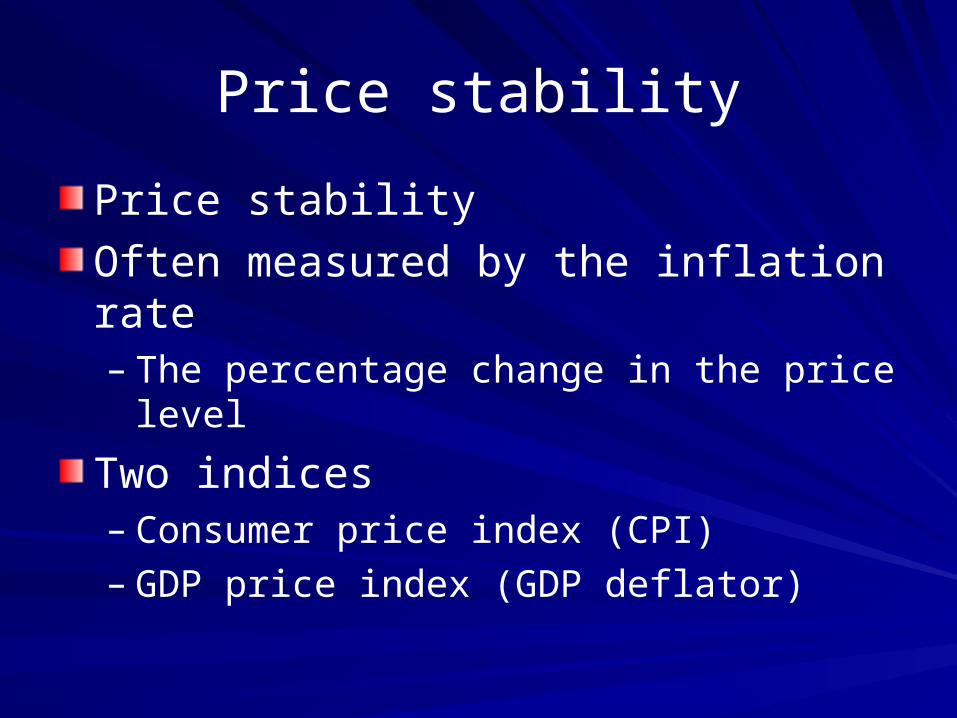
Price stability
Price stability
Often measured by the inflation rate– The percentage change in the price level
Two indices– Consumer price index (CPI)– GDP price index (GDP deflator)

Consumer Price Index (CPI)
CPI
bureau of Labor Statistics surveys the average consumption basket of urban residents.
Measuring the cost of living of a typical urban household
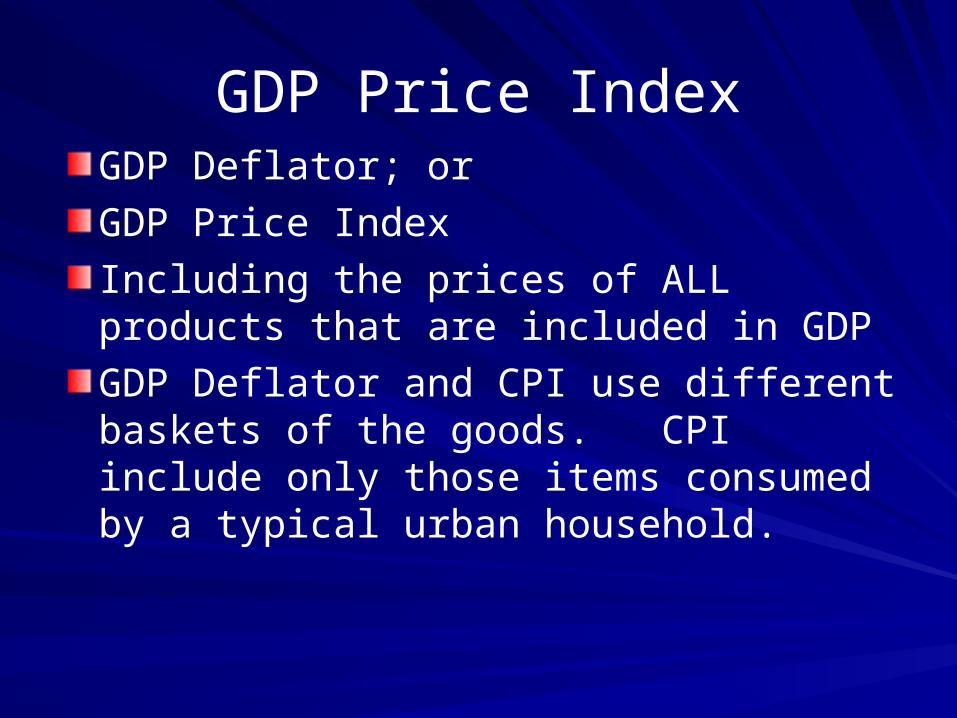
GDP Price IndexGDP Deflator; or
GDP Price Index
Including the prices of ALL products that are included in GDP
GDP Deflator and CPI use different baskets of the goods. CPI include only those items consumed by a typical urban household.

The inflation rate in the United States since 1870, CPI
6
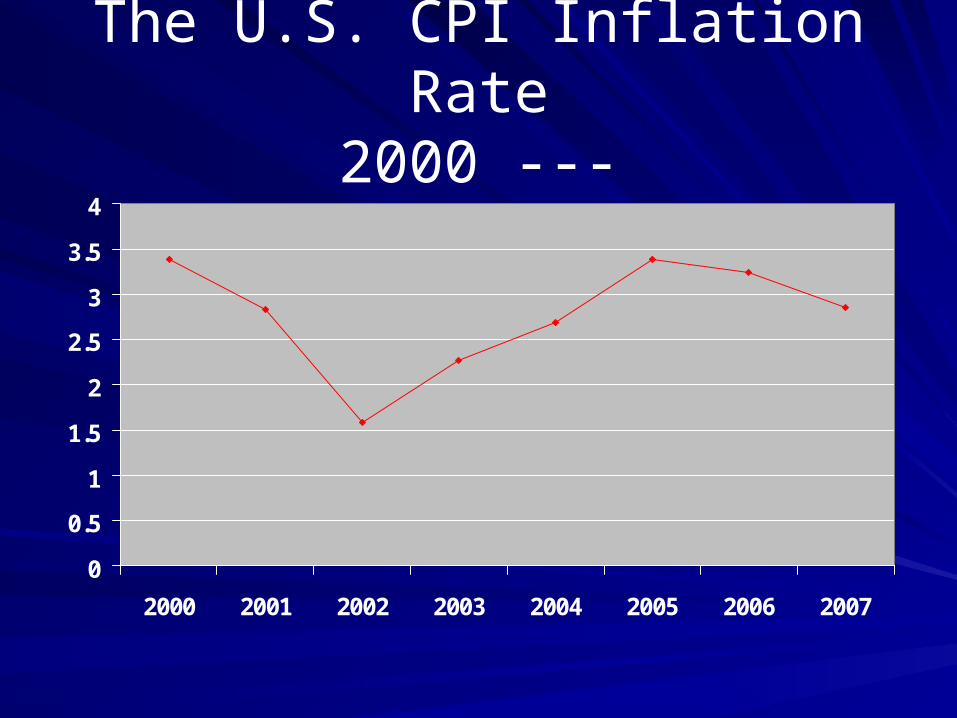
The U.S. CPI Inflation Rate2000 ---
0
0.5
1
1.5
2
2.5
3
3.5
4
2000 2001 2002 2003 2004 2005 2006 2007

Inflation history in the U.S.1968-69 inflation. Reasons: tax cut, defense spending associated with the Viet Nam War1972-74 inflation. Reasons: Poor harvest, oil shock and loose monetary policy during the Johnson period. Stagflation.Inflation in 1979, second oil shock 1980s. Price stabilization. Reagan administration. Monetary contraction and high interest rate. Economic recession in 1982.1990s. Low inflation as productivity rose.

Dis- or De-flation
Disinflation
-- Inflation decelerates
(The absolute price level increases, but at a
diminishing rate)
Deflation
-- Price falls

International comparisonCPI Inflation rates 2004Country Inflation Rate
Zimbabwe 419.9
Iraq 25.4
Russia 11.5
China 4.1
The U.S. 2.4
U.K. 1.4
Japan -0.1
Hong Kong -0.3

Inflation by countries 2007

Inflation by countries 2008
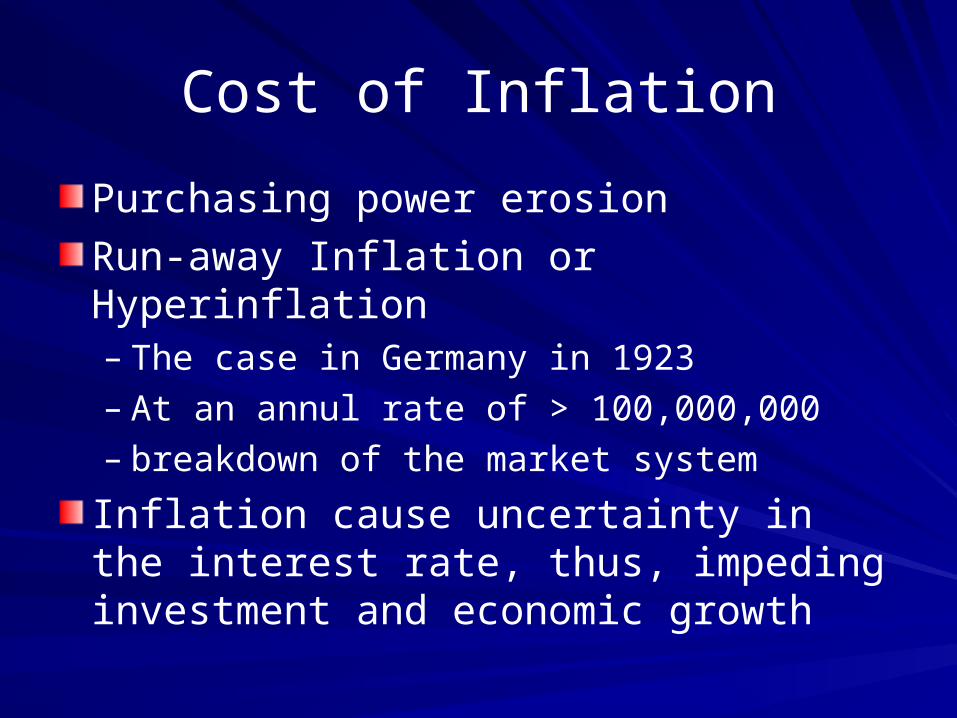
Cost of Inflation
Purchasing power erosion
Run-away Inflation or Hyperinflation – The case in Germany in 1923– At an annul rate of > 100,000,000– breakdown of the market system
Inflation cause uncertainty in the interest rate, thus, impeding investment and economic growth
Hyper inflation
Above 50%
Germany in 1923
Southern American countries, Brazil, Agentina
Hyper inflation for Latin American countriesin 1980s
Hyperinflation Threatens Brazil by Lawrence W. Reed
Origins of the Chinese Hyperinflation
Hyperinflation in Germany
Hyper inflation in Yugoslavia
Hyper inflation in Israel
Hyper inflation for Latin American countries in 1980s
Hyperinflation in Argentina, Bolivia. and Brazil. How would you like to live in an economy without memory, where you don’t know the price of anything day to day or the value of the wage you are paid? That’s what it’s like under hyperinflation, in Argentina, supermarket prices are increased twice daily. During the two weeks we were in Brazil in 1986, interest rates rose 100% from 330% to 430%. Bolivia’s demand for money is so great that its third largest import is currency.

Reasons for hyper inflation in Southern American countries
•Exploding government spending•Ineffective tax system•Strong unions, rigid labor laws and indexed wage system•Price/wage spiral
Inflation in CPEs
Under CPEs, prices were controlled
Prices can be fixed for several years
Widespread shortages in most commodities
Black market prices
Economics of shortage
Repressed inflation
Inflation in transitional economies
Price liberalization
Shock therapy
Poland
Russia
Lessons: instead of predicted one time price jump, those countries experienced chronic inflation for long time in the transition.

Reasons for chronic inflation in transition
Structural inflation in the former CPE countries
Asymmetric response in prices flexibility
Asymmetric response in increasing output
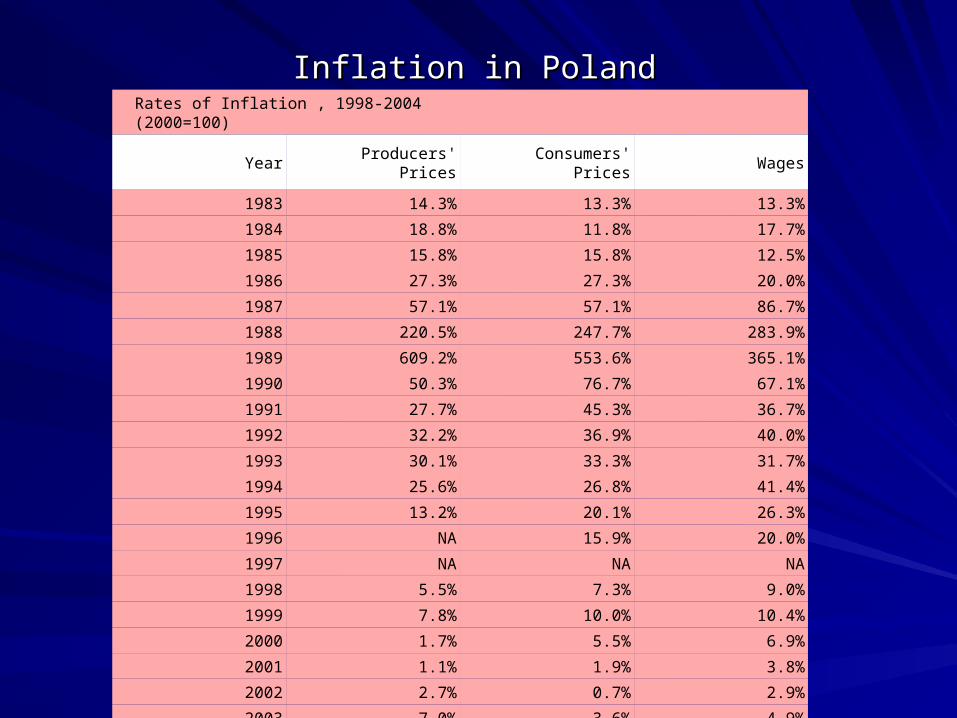
Inflation in PolandInflation in PolandRates of Inflation , 1998-2004(2000=100)
YearProducers'
PricesConsumers'
PricesWages
1983 14.3% 13.3% 13.3%
1984 18.8% 11.8% 17.7%
1985 15.8% 15.8% 12.5%
1986 27.3% 27.3% 20.0%
1987 57.1% 57.1% 86.7%
1988 220.5% 247.7% 283.9%
1989 609.2% 553.6% 365.1%
1990 50.3% 76.7% 67.1%
1991 27.7% 45.3% 36.7%
1992 32.2% 36.9% 40.0%
1993 30.1% 33.3% 31.7%
1994 25.6% 26.8% 41.4%
1995 13.2% 20.1% 26.3%
1996 NA 15.9% 20.0%
1997 NA NA NA
1998 5.5% 7.3% 9.0%
1999 7.8% 10.0% 10.4%
2000 1.7% 5.5% 6.9%
2001 1.1% 1.9% 3.8%
2002 2.7% 0.7% 2.9%
2003 7.0% 3.6% 4.9%
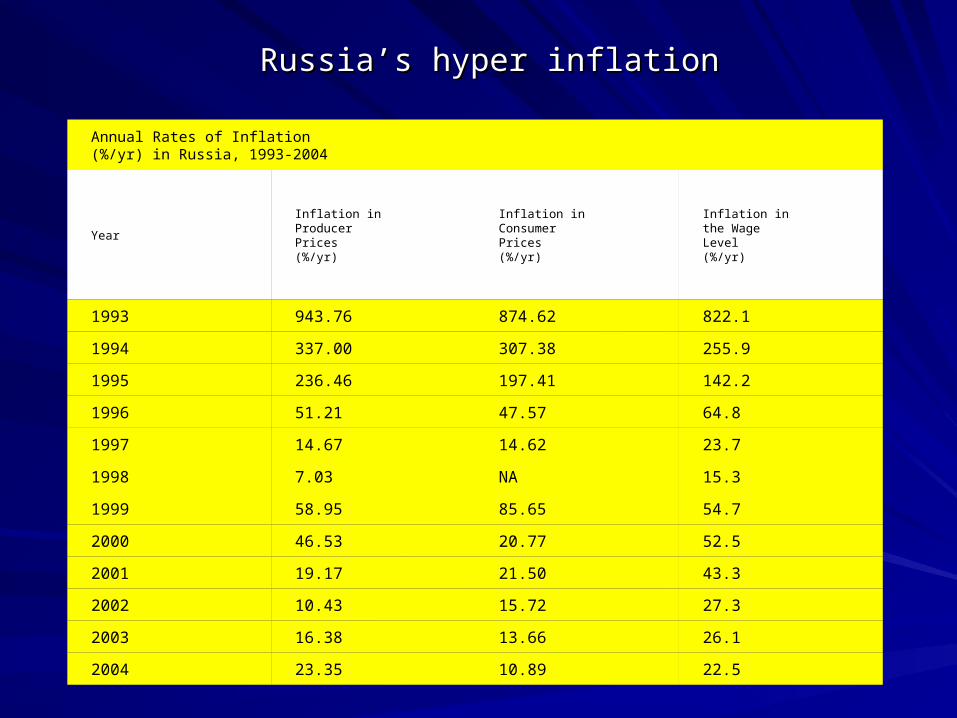
Russia’s hyper inflationRussia’s hyper inflation
Annual Rates of Inflation (%/yr) in Russia, 1993-2004
Year
Inflation inProducerPrices(%/yr)
Inflation in ConsumerPrices(%/yr)
Inflation inthe WageLevel(%/yr)
1993 943.76 874.62 822.1
1994 337.00 307.38 255.9
1995 236.46 197.41 142.2
1996 51.21 47.57 64.8
1997 14.67 14.62 23.7
1998 7.03 NA 15.3
1999 58.95 85.65 54.7
2000 46.53 20.77 52.5
2001 19.17 21.50 43.3
2002 10.43 15.72 27.3
2003 16.38 13.66 26.1
2004 23.35 10.89 22.5