
Machinability of hypereutectic cast Al–Si alloys processed ...
14
Machinability of hypereutectic cast Al–Si alloys processed by SSM processing technique P K SOOD 1, * , RAKESH SEHGAL 1 and D K DWIVEDI 2 1 Department of Mechanical Engineering, National Institute of Technology, Hamirpur 177005, India 2 Department of Mechanical and Industrial Engineering, Indian Institute of Technology, Roorkee 247667, India e-mail: [email protected] MS received 28 July 2015; revised 16 March 2016; accepted 11 November 2016 Abstract. Experimental investigation carried out on the machinability studies to determine the influence of semi-solid metal processing and modification on hypereutectic Al–20Si–0.5Mg–1.2Fe-based alloy produced by conventional cast and semi-solid metal processing technique (mechanical stirring) and modified with iron correctors (Be and Cd) has been presented in this paper. The alloys under investigation were prepared by controlling melt using an induction melting furnace. Stirring of semi-solid metal takes place at constant cooling conditions from liquidus temperature at a constant stirring speed of 400 rpm. To determine the machining performance characteristics an orthogonal array, signal-to-noise ratio and statistical tool analysis of variance were jointly used during experimentation. A CNC lathe was used to conduct experiments in dry condition and coated carbide inserts were used as tool inserts. Machining variables like cutting velocity, approaching angle, feed rate and depth of cut, which can be considered as process parameters, are taken into account. The combined effect of modification and semi-solid metal processing has a significant effect on the machining characteristics, which was concluded from study. The modified alloy processed by semi-solid metal processing technique exhibits better machinability conditions when compared with the conventional cast. The feed rate has more effect on machining behaviour. Keywords. Machinability; hypereutectic Al–Si alloy; Taguchi method; analysis of variance; beryllium and cadmium; CNC turning centre. 1. Introduction Hypereutectic aluminium–silicon alloys have wide range of excellent mechanical and thermal properties due to which they are well-known, used materials for manufacturing parts of automobile, aircraft and electronic equipment. They are extensively used for engine parts (propeller cas- ing) and air compressor cylinder and machining, which are generally required in producing automobile parts (rims, disc brakes, etc.). Hypereutectic aluminium–silicon alloys are said to be the most difficult to machine among the various aluminium alloys as the occurrence of prime coarse crystal-free silicon causes rapid tool wear because of their hardness. Brittle intermetallic phases deteriorate the mechanical properties of Al–Si alloy, which are generally formed by combining iron into aluminium and silicon (mostly iron is present in little quantity in aluminium alloy). Out of these intermetallic phases observed in aluminium alloy it is generally expected that plate-type shapes are the most harmful to mechanical properties (e.g., elongation). Changing the shape of intermetallic phases from plate type to Chinese script will improve the properties and structure of hypereutectic Al–Si alloy. Many investigators tried to improve the machinability of alloys by adding special alloying elements and behaviour of primary silicon particles by controlling the solidification to acquire the desired properties [1–3]. It was reported by Liebermann that cooling rate during solidification affects the primary Si particle. Finer structure can be obtained by spray casting, melt spinning and by semi-solid metal processing. The semi-solid metal processing (mechanical stirring) is one of the tools for enhancement of localized surface properties. It increases the ductility and strength and also improves the surface properties during machining operation. Beryllium and cadmium (iron correctors) are added generally to improve the machinability [4, 5]. For higher production rates, machines with higher degree of automation are to be used. The most significant are NC/CNC machine tools, which have been provided with higher power, greater spindle speed, spindle accuracy, better control systems and wide range of speeds and feeds [6]. Economy in various applications is generally obtained by analysing machinability of material and varies according to the requirements. The magnitude of cutting force components acting on the tool, power *For correspondence 365 Sa ¯dhana ¯ Vol. 42, No. 3, March 2017, pp. 365–378 Ó Indian Academy of Sciences DOI 10.1007/s12046-017-0609-9
Transcript of Machinability of hypereutectic cast Al–Si alloys processed ...
Machinability of hypereutectic cast Al–Si alloys processed by SSMprocessing technique
P K SOOD1,*, RAKESH SEHGAL1 and D K DWIVEDI2
1Department of Mechanical Engineering, National Institute of Technology, Hamirpur 177005, India2Department of Mechanical and Industrial Engineering, Indian Institute of Technology, Roorkee 247667, India
e-mail: [email protected]
MS received 28 July 2015; revised 16 March 2016; accepted 11 November 2016
Abstract. Experimental investigation carried out on the machinability studies to determine the influence of
semi-solid metal processing and modification on hypereutectic Al–20Si–0.5Mg–1.2Fe-based alloy produced by
conventional cast and semi-solid metal processing technique (mechanical stirring) and modified with iron
correctors (Be and Cd) has been presented in this paper. The alloys under investigation were prepared by
controlling melt using an induction melting furnace. Stirring of semi-solid metal takes place at constant cooling
conditions from liquidus temperature at a constant stirring speed of 400 rpm. To determine the machining
performance characteristics an orthogonal array, signal-to-noise ratio and statistical tool analysis of variance
were jointly used during experimentation. A CNC lathe was used to conduct experiments in dry condition and
coated carbide inserts were used as tool inserts. Machining variables like cutting velocity, approaching angle,
feed rate and depth of cut, which can be considered as process parameters, are taken into account. The combined
effect of modification and semi-solid metal processing has a significant effect on the machining characteristics,
which was concluded from study. The modified alloy processed by semi-solid metal processing technique
exhibits better machinability conditions when compared with the conventional cast. The feed rate has more
effect on machining behaviour.
Keywords. Machinability; hypereutectic Al–Si alloy; Taguchi method; analysis of variance; beryllium and
cadmium; CNC turning centre.
1. Introduction
Hypereutectic aluminium–silicon alloys have wide range of
excellent mechanical and thermal properties due to which
they are well-known, used materials for manufacturing
parts of automobile, aircraft and electronic equipment.
They are extensively used for engine parts (propeller cas-
ing) and air compressor cylinder and machining, which are
generally required in producing automobile parts (rims,
disc brakes, etc.). Hypereutectic aluminium–silicon alloys
are said to be the most difficult to machine among the
various aluminium alloys as the occurrence of prime coarse
crystal-free silicon causes rapid tool wear because of their
hardness. Brittle intermetallic phases deteriorate the
mechanical properties of Al–Si alloy, which are generally
formed by combining iron into aluminium and silicon
(mostly iron is present in little quantity in aluminium alloy).
Out of these intermetallic phases observed in aluminium
alloy it is generally expected that plate-type shapes are the
most harmful to mechanical properties (e.g., elongation).
Changing the shape of intermetallic phases from plate type
to Chinese script will improve the properties and structure
of hypereutectic Al–Si alloy.
Many investigators tried to improve the machinability of
alloys by adding special alloying elements and behaviour of
primary silicon particles by controlling the solidification to
acquire the desired properties [1–3]. It was reported by
Liebermann that cooling rate during solidification affects the
primary Si particle. Finer structure can be obtained by spray
casting, melt spinning and by semi-solid metal processing.
The semi-solid metal processing (mechanical stirring) is one
of the tools for enhancement of localized surface properties.
It increases the ductility and strength and also improves the
surface properties during machining operation. Beryllium
and cadmium (iron correctors) are added generally to
improve themachinability [4, 5]. For higher production rates,
machines with higher degree of automation are to be used.
Themost significant are NC/CNCmachine tools, which have
been provided with higher power, greater spindle speed,
spindle accuracy, better control systems and wide range of
speeds and feeds [6]. Economy in various applications is
generally obtained by analysing machinability of material
and varies according to the requirements. The magnitude of
cutting force components acting on the tool, power*For correspondence
365
Sadhana Vol. 42, No. 3, March 2017, pp. 365–378 � Indian Academy of Sciences
DOI 10.1007/s12046-017-0609-9
consumed, surface quality and chip form produced under
specified conditions are some of the criteria that are com-
monly used according to requirements for evaluation of
machinability [7, 8]. Cutting forces are generally affected by
machining variables and other factors like un-deformed chip
thickness and properties of cutting tool material, type of tool
wear and geometry of tool [9]. There are two sources of
power consumption in CNC machine tools: peripheral
devices, i.e., spindle, servo motor and linear motor. The first
is considered as constant power consumed during idle time
and is constant over the time the machine is turned on. The
second ones are machining variables, which affect the power
consumption. As compared with conventional machining on
a simple lathe it is necessary to operate CNC machines
economically and efficiently because of high cost of CNC
machines tools [10]. Machining of metals means the removal
of extramaterial from themetal by the process like facing and
turning. The material is removed from the workpiece in the
form of chips. Nature of chips depends upon the operation,
properties of workmaterial and cutting conditions. The chips
are produced by localized shearing, which takes place
between the tool and workpiece point of contact over a very
narrow region called shear plane or shear zone. Detrimental
effect on surface finish is caused by chip shape and various
sizes of widely undesirable chip formation. To study the
machining behaviour the types of chips formed are of
importance inmachining [11, 12]. Geometry of the tool insert
and substrate coating has direct influence on the performance
of coated tool and hence enhances the tool life because of
high hardness, wear resistance and chemical stability of these
coatings [13]. For robust design the Taguchi parameter
design is an important one and offers a systematic approach
to optimize design. Signal to noise ratio measures quality
with emphasis on variation and orthogonal array and
accommodates many design factors simultaneously, for
which two major tools are used [14]. The higher iron content
in anAl–12Si–Cu–Mg alloy that contains coarser iron-richb-phase intermetallic compounds results in more quantity than
in low iron content alloy [15]. Joining of Al-based MMCs
was reported and suitable joining techniques and processes
involved are defined [16]. A hypereutectic Al–Si alloy that
turns with CVD diamond-coated Si4N4 tool inserts was
investigated in order to study its machining behaviour and to
carry out machining, diamond tools of complex geometry are
used due to their good mechanical properties [17].
In the current investigation an attempt has been made to
carry out the refinement and modifications of micro-con-
stituents of alloys before casting, which in turn changes the
microstructure, improves the mechanical properties and
also affects the machinability. The aim of this investigation
is to study the effects of cutting variables along with
geometry and orientation of tool insert on machining
behaviour and chip formation during CNC turning of
developed hypereutectic aluminium–silicon alloys with and
without iron correctors (beryllium and cadmium) and the
secondary objective is to optimize the machining process.
2. Experimental work
This section deals with preparation of experimental
hypereutectic aluminium–silicon alloys and microscopy;
machinability tests performed have been discussed.
2.1 Materials
The experimental alloy (Al–20Si–0.5Mg–1.2Fe) was pre-
pared by melting of master alloys Al–30%Si, Al–10%Mg
and Al–10%Fe in suitable quantities with 99.99% of alu-
minium in a graphite crucible using an induction furnace.
To avoid oxidation the melt was covered with flux. Hexa-
chloro-ethane was used for the degassing. The molten alloy
was cast in a metallic mould (37 mm 9 150 mm) after
proper mixing to make samples for machining by a con-
ventional casting through stir cast technique. Inclusions and
dross particles if found were trapped by a filter, which was
kept at the top. Stir casting was performed at 800�C using a
stirrer rotating at a constant speed of 400 rpm for a period
of 120 s. Beryllium and cadmium (0.03 wt.%) were added
into the molten alloys in elemental form followed by con-
ventional and stir casting. The nominal composition of
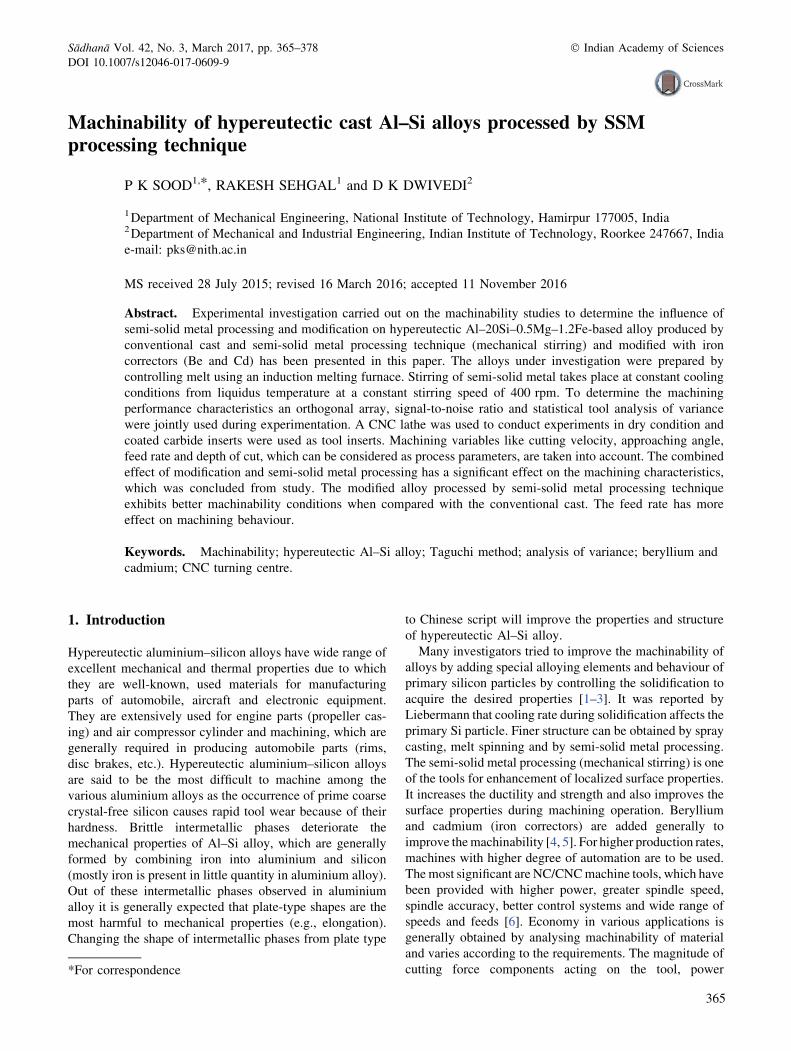
alloys prepared is shown in table 1; the induction furnace
used for the purpose is shown in figure 1. The mechanical
properties of developed alloy are presented in table 2.
2.2 Metallographic observation
Microstructural evaluation studies were carried out on the
alloys developed to investigate the morphological changes
in the phases due to stirring and modification by the iron
correctors (beryllium and cadmium), using a scanning
electron microscope, and its impact on the machinability.
2.3 Machining experiments
A high-precision CNC turning centre Sprit 16 TC equipped
with a Siemens control system having two simultaneously
controlled axes, namely, Z-axis, movement of carriage
parallel to spindle axis (longitudinal), and X-axis, move-
ment of turret slide at right angle to spindle axis (cross),
Table 1. Nominal composition of Al–Si alloys (element–wt.%).
Sl. no. Composition
Elements
Si Mg Fe Be Cd
1 Alloy 1 Conventional cast 20 0.50 1.2 – –
2 Alloy 2 Stir cast 20 0.50 1.2 – –
3 Alloy 3 Conventional cast 20 0.50 1.2 0.03 –
4 Alloy 4 Stir cast 20 0.50 1.2 0.03 –
5 Alloy 5 Conventional cast 20 0.50 1.2 – 0.03
6 Alloy 6 Stir cast 20 0.50 1.2 – 0.03
366 P K Sood et al
both these axes can be traversed in rapid feed and jog mode,
was used for turning the alloys developed. Coated carbide
inserts (CCMT09304) and a CVD multilayer coated,
cobalt-enriched substrate manufactured by WIDIA were
used for machining. The machining process was carried out
without using a coolant or any lubricant (i.e., dry turning)
and sample length of 20 mm was kept for each experiment
during investigation. The machining parameters fixed for
investigation are shown in table 3. These parameters were
selected based upon the literature survey and capability of
tool insert used for machining. Four factors were consid-
ered and for each factor four levels were chosen for con-
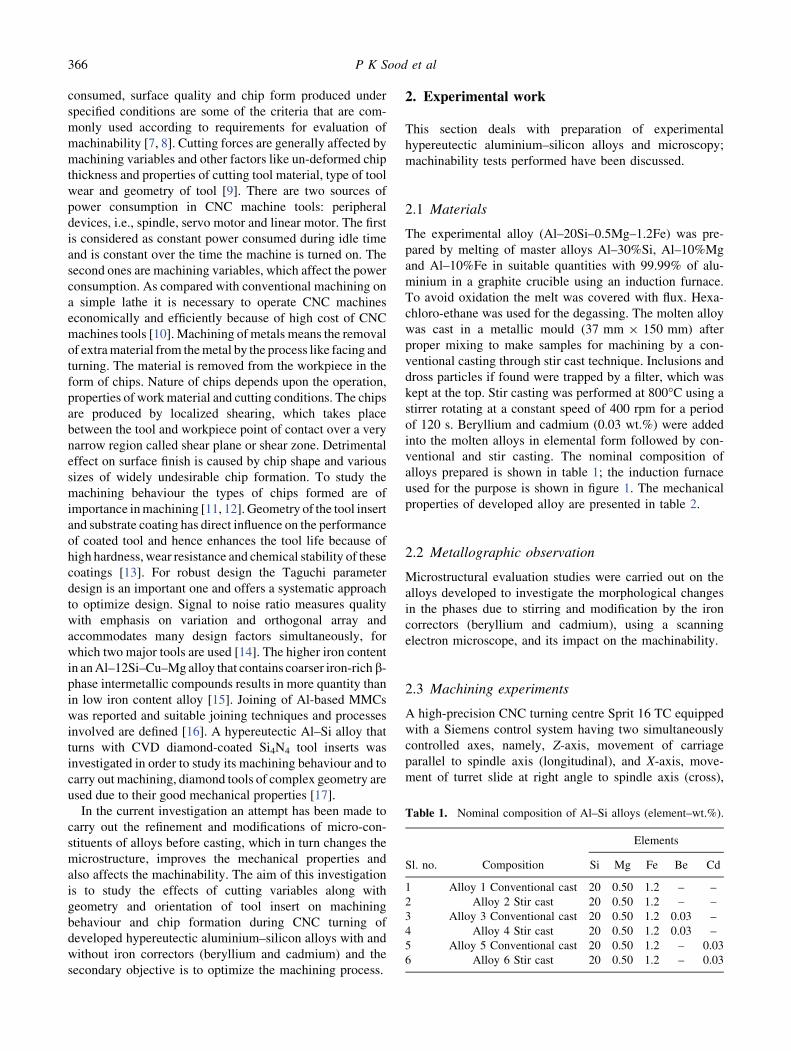
ducting experiments. Figure 2 shows an experimental set-
up having three-component turning dynamometer (TeLC
with DKM 2010 software), which was used for evaluation
of the main cutting force (Fc) and power consumption. The
response parameters like main cutting force, feed force and
passive components of forces were measured with the help
of the dynamometer, which was equipped with three load
cells bolted rigidly on the tool turret. Study of chip analysis
was carried out by considering the size of chip using
number of chips per gramme criteria, and variation in
number of chips per gramme has been observed. The chip
shape was reported in the form of photographs using a
conventional camera. To assess the surface roughness for
investigation the arithmetic average (Ra) parameter was
used. A surface roughness tester of Mitutoyo make (model
no. SJ 301) was used to measure the surface roughness of
machined surface after each experiment.
2.4 Optimization
Effect of four machining process parameters, i.e., cutting
speed, feed rate, depth of cut and approaching angle, on
machining process was observed using the Taguchi
method, on which the design of experiment was based as
per investigation plan. MINTAB software was used to
analyse the results. Optimized cutting parameters for
machining characteristics are obtained based on the
results. To confirm the effectiveness of the approach
among the three categories of quality characteristics, i.e.,
lower the better, higher the better and nominal the better,
signal-to-noise ratio (S/N) was used for design opti-
mization in order to examine the experimental results.
Lower the better characteristic, adapted for the present
study to evaluate machining characteristics, has been
taken into consideration. Next, ANOVA analysis was
used to check the significance of each parameter. The
parameter levels for the experiments are shown in
table 4.
Figure 1. Induction melting furnace.
Table 2. Mechanical properties of alloys (element–wt.%).
Mechanical properties Alloy 1 Alloy 2 Alloy 3 Alloy 4 Alloy 5 Alloy 6
Tensile strength (MPA) 160 171 170 187 174 195
Hardness (HRB) 82 76 78 70 79 71
Elongation (%) 1.2 2.3 1.8 2.9 2.0 2.9
Table 3. Cutting parameters used for machinability study.
Symbol Cutting parameter Unit Level 1 Level 2 Level 3 Level 4
A Cutting speed m/min 100 125 150 175
B Feed rate mm/rev 0.1 0.2 0.3 0.4
C Depth of cut mm 1.0 1.5 2.0 2.5
D Approaching angle deg 45 60 75 90
Machinability of hypereutectic cast Al–Si alloys 367
3. Results and analysis
The following sub-sections explain the experimental results
obtained in the present study, which are analysed and
discussed.
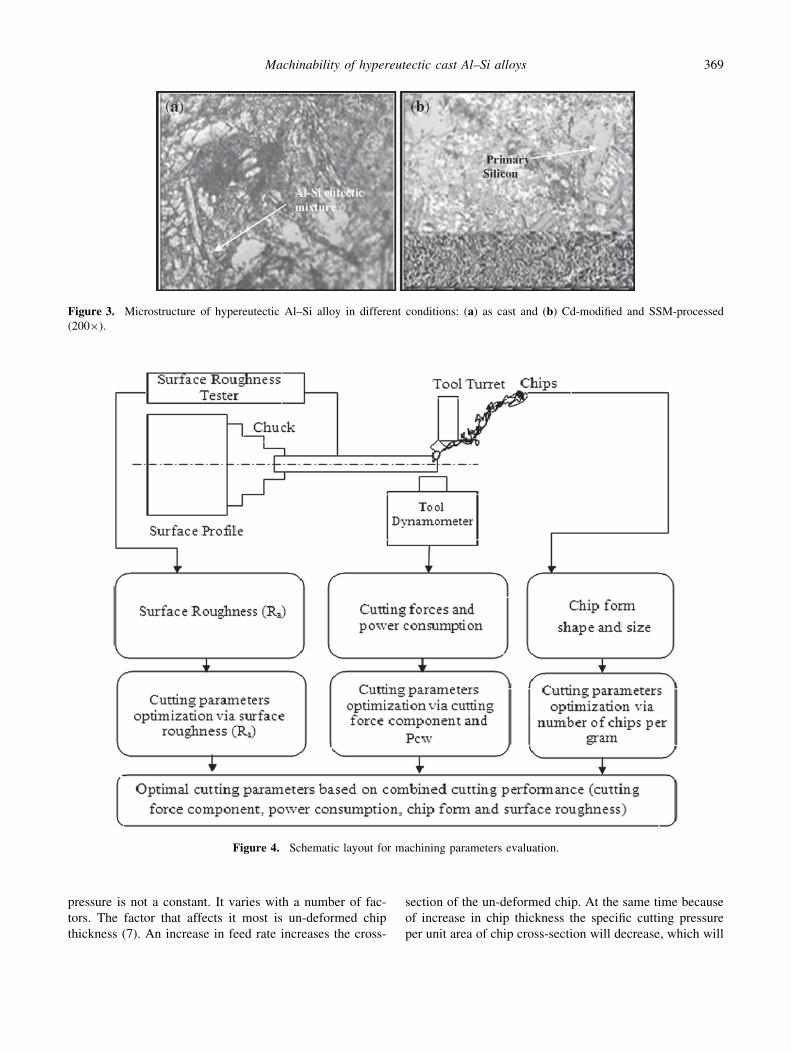
3.1 Microstructural evaluations
Microstructure of cast hypereutectic alloy without iron
corrector is shown in figure 3a. It can be observed that large
cubed primary silicon particles along with needle shape b-
phase intermetallic are primarily present in the
microstructure. The effect of semi-solid metal processing of
unmodified and Cd-modified hypereutectic alloy system on
the microstructure is shown in figure 3b. From the
microstructure it can be observed that semi-solid metal
processing of Cd-modified alloy system almost eliminates
the harmful b-phase needle shape intermetallic compounds
from the microstructure. It is expected that these variations
in the microstructure of the alloy due to Cd/Be modification
and semi-solid processing will affect the machinability.
3.2 Machining results
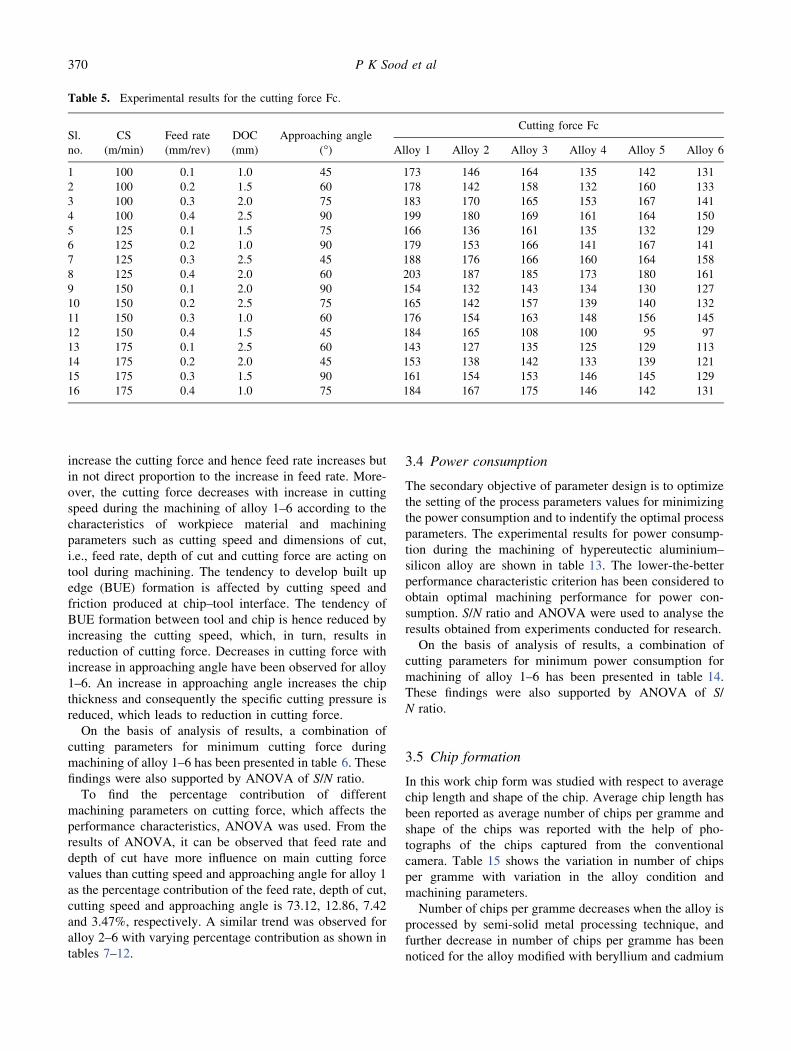
With respect to response parameters the machining beha-
viour of Al–Si alloys is studied using an L16 orthogonal
array experimental design. Figure 4 illustrates the details of
schematic approach followed for the evaluation of
machining parameters as per experimental plan.
3.3 Cutting forces
An orthogonal array was used to reduce the number of
experiments for determining the optimal cutting parame-
ters, for which the Taguchi-method-based DOE was used
for hypereutectic aluminium–silicon alloys developed in
the present study. The result for machining performance of
the alloy developed is shown in table 5.
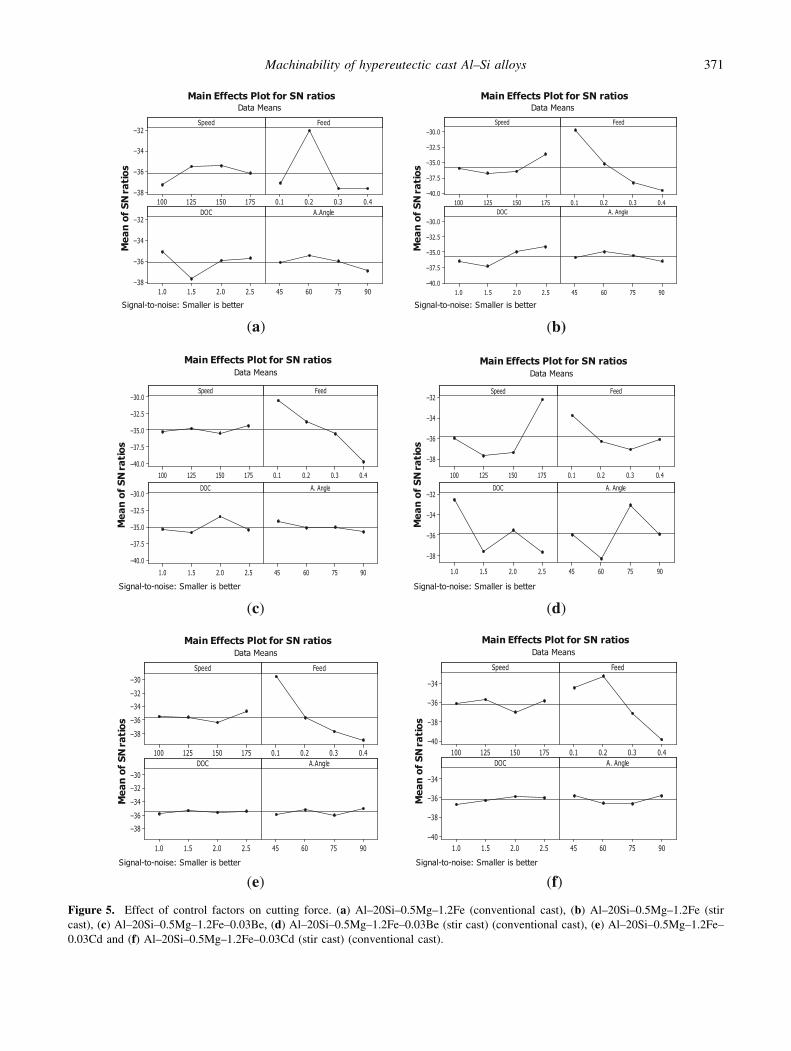
The effect of each control factor is observed through
response table/response graphs. The response graphs for all
control factors are shown in figure 5a–f. To identify the
machining parameters that are statistically significant for
cutting force (Fc), statistical analysis of variance (ANOVA)
is performed. The results of ANOVA are shown in
tables 7–12. Response graph 6a for alloy-1 indicates that
the feed rate and depth of cut have more influence than
cutting speed and approaching angle, in light of their delta
value. Based on the response graph, it can be noted that
during turning of alloy 1, the minimum cutting forces are
generated on the cutting tool for 150 m/min cutting speed,
0.2 mm/rev feed rate, 1.0 mm depth of cut and 60�approaching angle. In the same manner, S/N ratio analysis
was completed to show the influence of cutting parameters
on main cutting force during the machining of alloy 2–6. It
was found that in case of alloys 2–4, feed rate and depth of
cut have more effect on cutting force than cutting speed and
approaching angle, while in the case of alloys 5 and 6, feed
rate and cutting speed have more effect on cutting force
than approaching angle and depth of cut.
With increase in cutting force, feed rate also increases
during the machining of alloy 1–6 in all conditions. Cutting
force in turning operation can be computed as a product of
specific cutting pressure and uncut chip cross-sec-
tion. Specific pressure is the cutting force per unit area of
un-deformed chip cross-section. The specific cutting
Figure 2. Experimental set-up.
Table 4. Experimental designs for using L16 orthogonal array.
Experiment
no.
Cutting
speed
(m/min)
Feed rate
(mm/rev)
Depth of
cut (mm)
Approaching
angle (�)
1 100 0.1 1.0 45
2 100 0.2 1.5 60
3 100 0.3 2.0 75
4 100 0.4 2.5 90
5 125 0.1 1.5 75
6 125 0.2 1.0 90
7 125 0.3 2.5 45
8 125 0.4 2.0 60
9 150 0.1 2.0 90
10 150 0.2 2.5 75
11 150 0.3 1.0 60
12 150 0.4 1.5 45
13 175 0.1 2.5 60
14 175 0.2 2.0 45
15 175 0.3 1.5 90
16 175 0.4 1.0 75
368 P K Sood et al
pressure is not a constant. It varies with a number of fac-
tors. The factor that affects it most is un-deformed chip
thickness (7). An increase in feed rate increases the cross-
section of the un-deformed chip. At the same time because
of increase in chip thickness the specific cutting pressure
per unit area of chip cross-section will decrease, which will
Figure 3. Microstructure of hypereutectic Al–Si alloy in different conditions: (a) as cast and (b) Cd-modified and SSM-processed
(2009).
Figure 4. Schematic layout for machining parameters evaluation.
Machinability of hypereutectic cast Al–Si alloys 369
increase the cutting force and hence feed rate increases but
in not direct proportion to the increase in feed rate. More-
over, the cutting force decreases with increase in cutting
speed during the machining of alloy 1–6 according to the
characteristics of workpiece material and machining
parameters such as cutting speed and dimensions of cut,
i.e., feed rate, depth of cut and cutting force are acting on
tool during machining. The tendency to develop built up
edge (BUE) formation is affected by cutting speed and
friction produced at chip–tool interface. The tendency of
BUE formation between tool and chip is hence reduced by
increasing the cutting speed, which, in turn, results in
reduction of cutting force. Decreases in cutting force with
increase in approaching angle have been observed for alloy
1–6. An increase in approaching angle increases the chip
thickness and consequently the specific cutting pressure is
reduced, which leads to reduction in cutting force.
On the basis of analysis of results, a combination of
cutting parameters for minimum cutting force during
machining of alloy 1–6 has been presented in table 6. These
findings were also supported by ANOVA of S/N ratio.
To find the percentage contribution of different
machining parameters on cutting force, which affects the
performance characteristics, ANOVA was used. From the
results of ANOVA, it can be observed that feed rate and
depth of cut have more influence on main cutting force
values than cutting speed and approaching angle for alloy 1
as the percentage contribution of the feed rate, depth of cut,
cutting speed and approaching angle is 73.12, 12.86, 7.42
and 3.47%, respectively. A similar trend was observed for
alloy 2–6 with varying percentage contribution as shown in
tables 7–12.
3.4 Power consumption
The secondary objective of parameter design is to optimize
the setting of the process parameters values for minimizing
the power consumption and to indentify the optimal process
parameters. The experimental results for power consump-
tion during the machining of hypereutectic aluminium–
silicon alloy are shown in table 13. The lower-the-better
performance characteristic criterion has been considered to
obtain optimal machining performance for power con-
sumption. S/N ratio and ANOVA were used to analyse the
results obtained from experiments conducted for research.
On the basis of analysis of results, a combination of
cutting parameters for minimum power consumption for
machining of alloy 1–6 has been presented in table 14.
These findings were also supported by ANOVA of S/
N ratio.
3.5 Chip formation
In this work chip form was studied with respect to average
chip length and shape of the chip. Average chip length has
been reported as average number of chips per gramme and
shape of the chips was reported with the help of pho-
tographs of the chips captured from the conventional
camera. Table 15 shows the variation in number of chips
per gramme with variation in the alloy condition and
machining parameters.
Number of chips per gramme decreases when the alloy is
processed by semi-solid metal processing technique, and
further decrease in number of chips per gramme has been
noticed for the alloy modified with beryllium and cadmium
Table 5. Experimental results for the cutting force Fc.
Sl.
no.
CS
(m/min)
Feed rate
(mm/rev)
DOC
(mm)
Approaching angle
(�)
Cutting force Fc
Alloy 1 Alloy 2 Alloy 3 Alloy 4 Alloy 5 Alloy 6
1 100 0.1 1.0 45 173 146 164 135 142 131
2 100 0.2 1.5 60 178 142 158 132 160 133
3 100 0.3 2.0 75 183 170 165 153 167 141
4 100 0.4 2.5 90 199 180 169 161 164 150
5 125 0.1 1.5 75 166 136 161 135 132 129
6 125 0.2 1.0 90 179 153 166 141 167 141
7 125 0.3 2.5 45 188 176 166 160 164 158
8 125 0.4 2.0 60 203 187 185 173 180 161
9 150 0.1 2.0 90 154 132 143 134 130 127
10 150 0.2 2.5 75 165 142 157 139 140 132
11 150 0.3 1.0 60 176 154 163 148 156 145
12 150 0.4 1.5 45 184 165 108 100 95 97
13 175 0.1 2.5 60 143 127 135 125 129 113
14 175 0.2 2.0 45 153 138 142 133 139 121
15 175 0.3 1.5 90 161 154 153 146 145 129
16 175 0.4 1.0 75 184 167 175 146 142 131
370 P K Sood et al
175150125100
–32
–34
–36
–380.40.30.20.1
2.52.01.51.0
–32
–34
–36
–3890756045
SpeedMeanofSNratios
Feed
DOC A.Angle
Main Effects Plot for SN ratiosData Means
Signal-to-noise: Smaller is better
175150125100
–30.0
–32.5
–35.0
–37.5
–40.00.40.30.20.1
2.52.01.51.0
–30.0
–32.5
–35.0
–37.5
–40.090756045
Speed
MeanofSNratios
Feed
DOC A. Angle
Main Effects Plot for SN ratiosData Means
Signal-to-noise: Smaller is better
(a) (b)
175150125100
–30.0
–32.5
–35.0
–37.5
–40.00.40.30.20.1
2.52.01.51.0
–30.0
–32.5
–35.0
–37.5
–40.0
90756045
Speed
MeanofSNratios
Feed
DOC A. Angle
Main Effects Plot for SN ratiosData Means
Signal-to-noise: Smaller is better
175150125100
–32
–34
–36
–38
0.40.30.20.1
2.52.01.51.0
–32
–34
–36
–38
90756045
Speed
MeanofSNratios
Feed
DOC A. Angle
Main Effects Plot for SN ratiosData Means
Signal-to-noise: Smaller is better
(c) (d)
175150125100
–30
–32
–34
–36
–38
0.40.30.20.1
2.52.01.51.0
–30
–32
–34
–36
–38
90756045
Speed
MeanofSNratios
Feed
DOC A.Angle
Main Effects Plot for SN ratiosData Means
Signal-to-noise: Smaller is better
175150125100
–34
–36
–38
–400.40.30.20.1
2.52.01.51.0
–34
–36
–38
–4090756045
Speed
MeanofSNratios
Feed
DOC A. Angle
Main Effects Plot for SN ratiosData Means
Signal-to-noise: Smaller is better
(e) (f)
Figure 5. Effect of control factors on cutting force. (a) Al–20Si–0.5Mg–1.2Fe (conventional cast), (b) Al–20Si–0.5Mg–1.2Fe (stir
cast), (c) Al–20Si–0.5Mg–1.2Fe–0.03Be, (d) Al–20Si–0.5Mg–1.2Fe–0.03Be (stir cast) (conventional cast), (e) Al–20Si–0.5Mg–1.2Fe–
0.03Cd and (f) Al–20Si–0.5Mg–1.2Fe–0.03Cd (stir cast) (conventional cast).
Machinability of hypereutectic cast Al–Si alloys 371
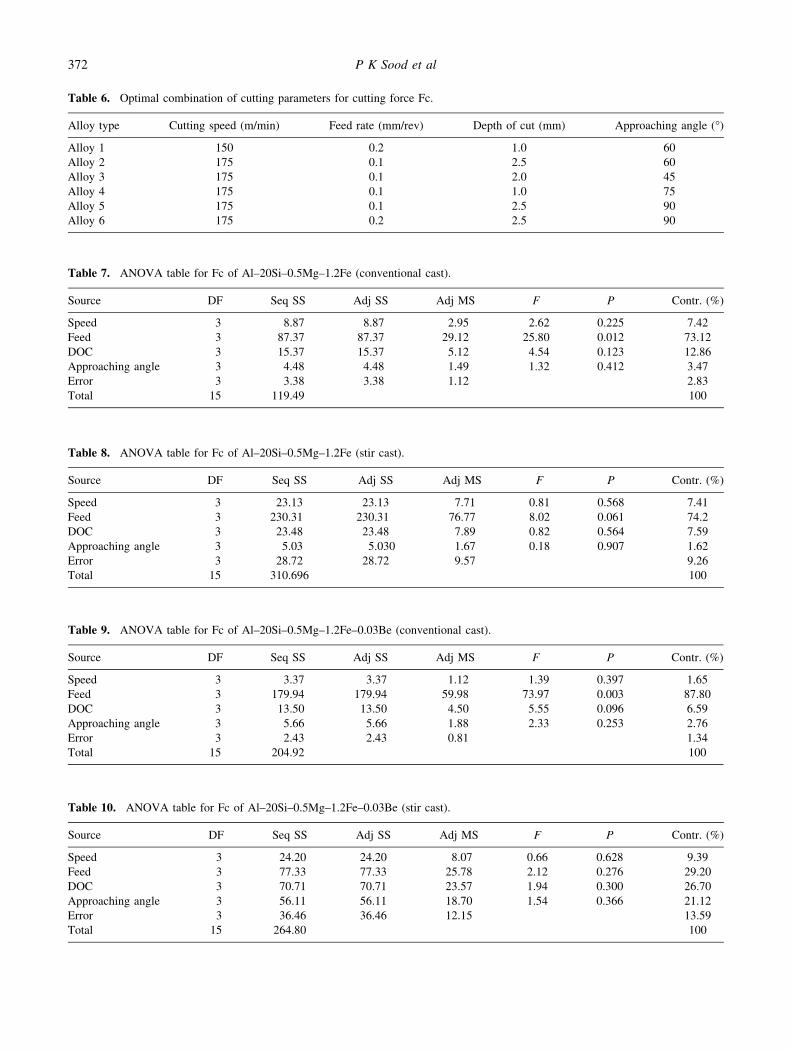
Table 10. ANOVA table for Fc of Al–20Si–0.5Mg–1.2Fe–0.03Be (stir cast).
Source DF Seq SS Adj SS Adj MS F P Contr. (%)
Speed 3 24.20 24.20 8.07 0.66 0.628 9.39
Feed 3 77.33 77.33 25.78 2.12 0.276 29.20
DOC 3 70.71 70.71 23.57 1.94 0.300 26.70
Approaching angle 3 56.11 56.11 18.70 1.54 0.366 21.12
Error 3 36.46 36.46 12.15 13.59
Total 15 264.80 100
Table 8. ANOVA table for Fc of Al–20Si–0.5Mg–1.2Fe (stir cast).
Source DF Seq SS Adj SS Adj MS F P Contr. (%)
Speed 3 23.13 23.13 7.71 0.81 0.568 7.41
Feed 3 230.31 230.31 76.77 8.02 0.061 74.2
DOC 3 23.48 23.48 7.89 0.82 0.564 7.59
Approaching angle 3 5.03 5.030 1.67 0.18 0.907 1.62
Error 3 28.72 28.72 9.57 9.26
Total 15 310.696 100
Table 9. ANOVA table for Fc of Al–20Si–0.5Mg–1.2Fe–0.03Be (conventional cast).
Source DF Seq SS Adj SS Adj MS F P Contr. (%)
Speed 3 3.37 3.37 1.12 1.39 0.397 1.65
Feed 3 179.94 179.94 59.98 73.97 0.003 87.80
DOC 3 13.50 13.50 4.50 5.55 0.096 6.59
Approaching angle 3 5.66 5.66 1.88 2.33 0.253 2.76
Error 3 2.43 2.43 0.81 1.34
Total 15 204.92 100
Table 6. Optimal combination of cutting parameters for cutting force Fc.
Alloy type Cutting speed (m/min) Feed rate (mm/rev) Depth of cut (mm) Approaching angle (�)
Alloy 1 150 0.2 1.0 60
Alloy 2 175 0.1 2.5 60
Alloy 3 175 0.1 2.0 45
Alloy 4 175 0.1 1.0 75
Alloy 5 175 0.1 2.5 90
Alloy 6 175 0.2 2.5 90
Table 7. ANOVA table for Fc of Al–20Si–0.5Mg–1.2Fe (conventional cast).
Source DF Seq SS Adj SS Adj MS F P Contr. (%)
Speed 3 8.87 8.87 2.95 2.62 0.225 7.42
Feed 3 87.37 87.37 29.12 25.80 0.012 73.12
DOC 3 15.37 15.37 5.12 4.54 0.123 12.86
Approaching angle 3 4.48 4.48 1.49 1.32 0.412 3.47
Error 3 3.38 3.38 1.12 2.83
Total 15 119.49 100
372 P K Sood et al
addition. The chip form (shape) depends upon the cutting
conditions, method of alloy developed as well as modifi-
cation of alloy.
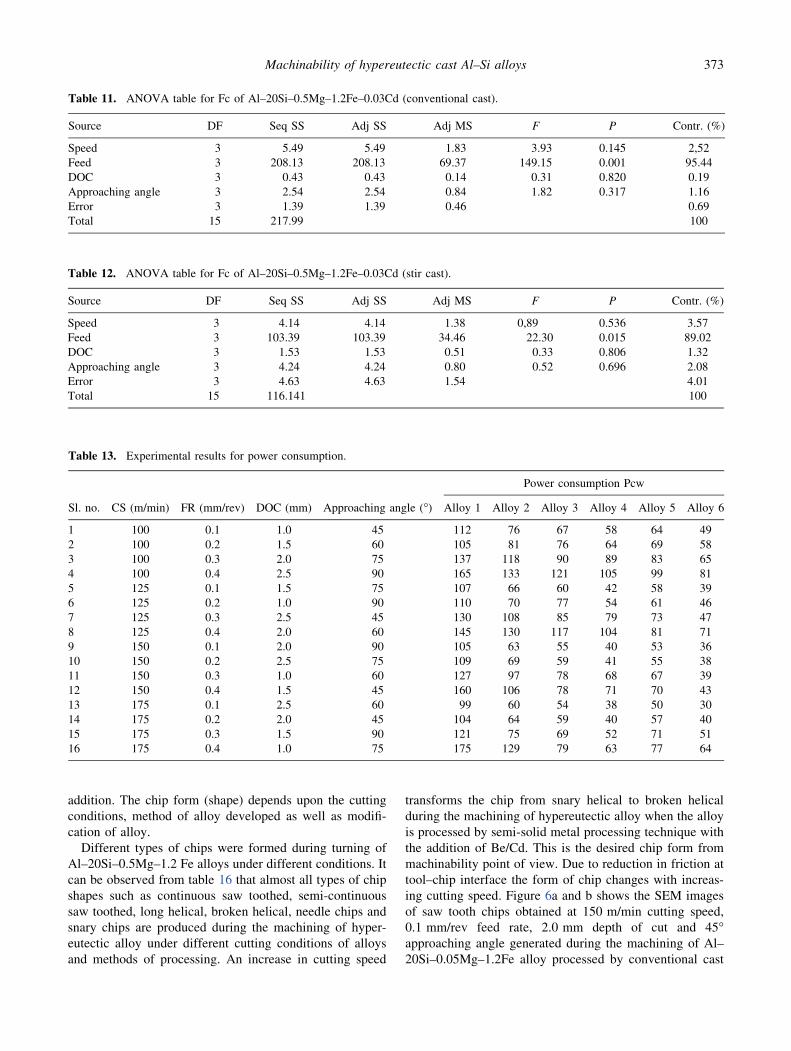
Different types of chips were formed during turning of
Al–20Si–0.5Mg–1.2 Fe alloys under different conditions. It
can be observed from table 16 that almost all types of chip
shapes such as continuous saw toothed, semi-continuous
saw toothed, long helical, broken helical, needle chips and
snary chips are produced during the machining of hyper-
eutectic alloy under different cutting conditions of alloys
and methods of processing. An increase in cutting speed
transforms the chip from snary helical to broken helical
during the machining of hypereutectic alloy when the alloy
is processed by semi-solid metal processing technique with
the addition of Be/Cd. This is the desired chip form from
machinability point of view. Due to reduction in friction at
tool–chip interface the form of chip changes with increas-
ing cutting speed. Figure 6a and b shows the SEM images
of saw tooth chips obtained at 150 m/min cutting speed,
0.1 mm/rev feed rate, 2.0 mm depth of cut and 45�approaching angle generated during the machining of Al–
20Si–0.05Mg–1.2Fe alloy processed by conventional cast
Table 11. ANOVA table for Fc of Al–20Si–0.5Mg–1.2Fe–0.03Cd (conventional cast).
Source DF Seq SS Adj SS Adj MS F P Contr. (%)
Speed 3 5.49 5.49 1.83 3.93 0.145 2,52
Feed 3 208.13 208.13 69.37 149.15 0.001 95.44
DOC 3 0.43 0.43 0.14 0.31 0.820 0.19
Approaching angle 3 2.54 2.54 0.84 1.82 0.317 1.16
Error 3 1.39 1.39 0.46 0.69
Total 15 217.99 100
Table 12. ANOVA table for Fc of Al–20Si–0.5Mg–1.2Fe–0.03Cd (stir cast).
Source DF Seq SS Adj SS Adj MS F P Contr. (%)
Speed 3 4.14 4.14 1.38 0,89 0.536 3.57
Feed 3 103.39 103.39 34.46 22.30 0.015 89.02
DOC 3 1.53 1.53 0.51 0.33 0.806 1.32
Approaching angle 3 4.24 4.24 0.80 0.52 0.696 2.08
Error 3 4.63 4.63 1.54 4.01
Total 15 116.141 100
Table 13. Experimental results for power consumption.
Sl. no. CS (m/min) FR (mm/rev) DOC (mm) Approaching angle (�)
Power consumption Pcw
Alloy 1 Alloy 2 Alloy 3 Alloy 4 Alloy 5 Alloy 6
1 100 0.1 1.0 45 112 76 67 58 64 49
2 100 0.2 1.5 60 105 81 76 64 69 58
3 100 0.3 2.0 75 137 118 90 89 83 65
4 100 0.4 2.5 90 165 133 121 105 99 81
5 125 0.1 1.5 75 107 66 60 42 58 39
6 125 0.2 1.0 90 110 70 77 54 61 46
7 125 0.3 2.5 45 130 108 85 79 73 47
8 125 0.4 2.0 60 145 130 117 104 81 71
9 150 0.1 2.0 90 105 63 55 40 53 36
10 150 0.2 2.5 75 109 69 59 41 55 38
11 150 0.3 1.0 60 127 97 78 68 67 39
12 150 0.4 1.5 45 160 106 78 71 70 43
13 175 0.1 2.5 60 99 60 54 38 50 30
14 175 0.2 2.0 45 104 64 59 40 57 40
15 175 0.3 1.5 90 121 75 69 52 71 51
16 175 0.4 1.0 75 175 129 79 63 77 64
Machinability of hypereutectic cast Al–Si alloys 373
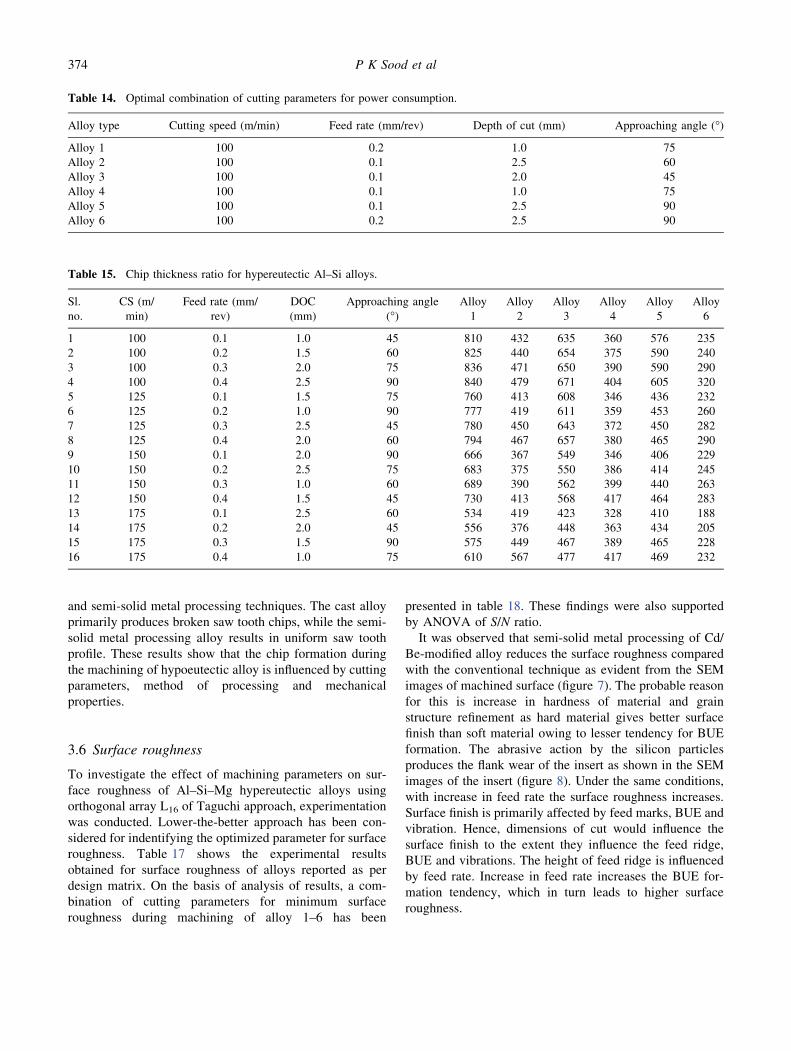
and semi-solid metal processing techniques. The cast alloy
primarily produces broken saw tooth chips, while the semi-
solid metal processing alloy results in uniform saw tooth
profile. These results show that the chip formation during
the machining of hypoeutectic alloy is influenced by cutting
parameters, method of processing and mechanical
properties.
3.6 Surface roughness
To investigate the effect of machining parameters on sur-
face roughness of Al–Si–Mg hypereutectic alloys using
orthogonal array L16 of Taguchi approach, experimentation
was conducted. Lower-the-better approach has been con-
sidered for indentifying the optimized parameter for surface
roughness. Table 17 shows the experimental results
obtained for surface roughness of alloys reported as per
design matrix. On the basis of analysis of results, a com-
bination of cutting parameters for minimum surface
roughness during machining of alloy 1–6 has been
presented in table 18. These findings were also supported
by ANOVA of S/N ratio.
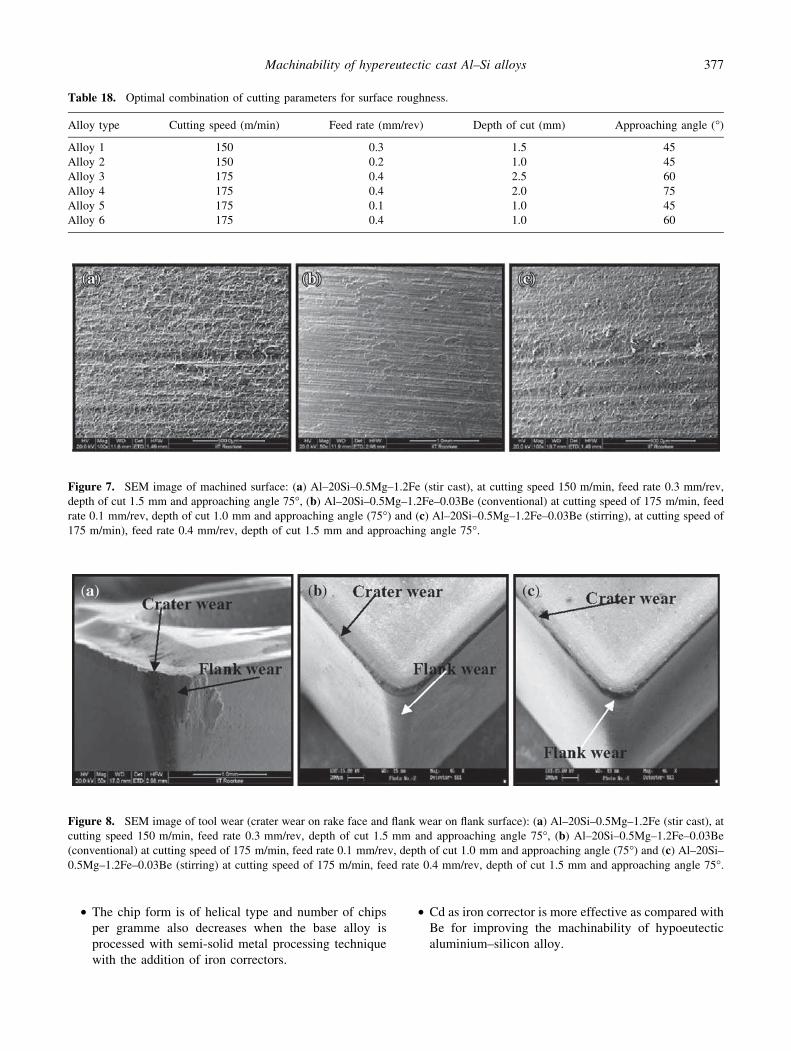
It was observed that semi-solid metal processing of Cd/
Be-modified alloy reduces the surface roughness compared
with the conventional technique as evident from the SEM
images of machined surface (figure 7). The probable reason
for this is increase in hardness of material and grain
structure refinement as hard material gives better surface
finish than soft material owing to lesser tendency for BUE
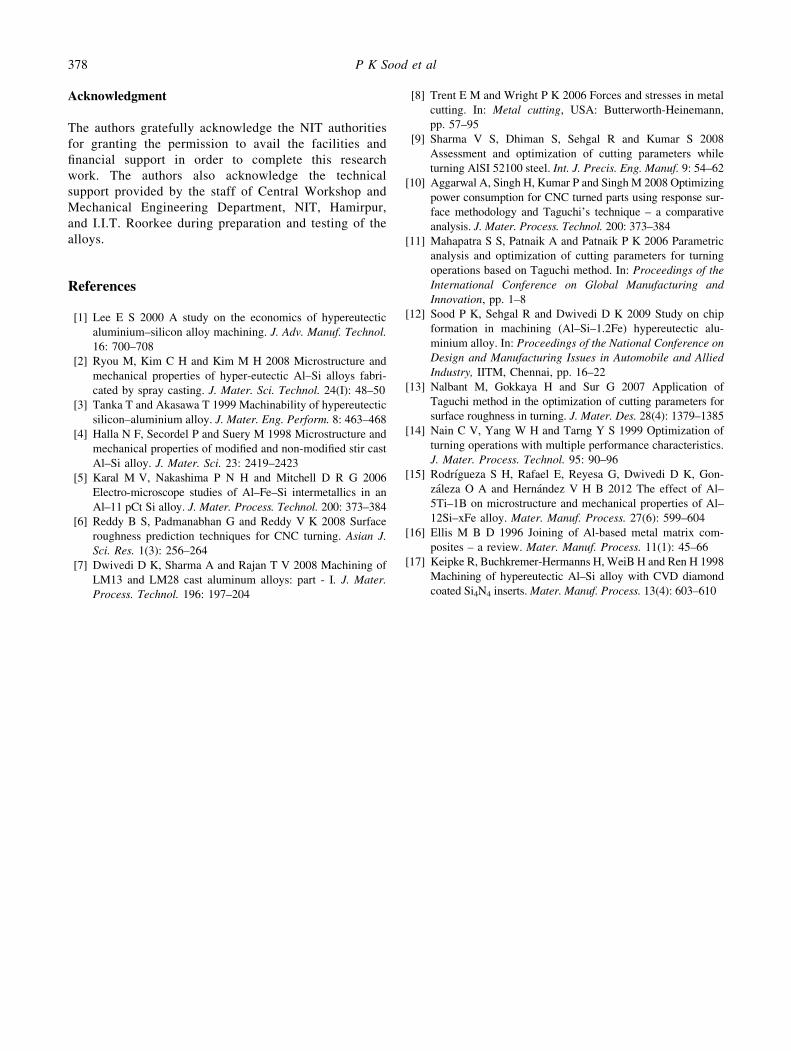
formation. The abrasive action by the silicon particles
produces the flank wear of the insert as shown in the SEM
images of the insert (figure 8). Under the same conditions,
with increase in feed rate the surface roughness increases.
Surface finish is primarily affected by feed marks, BUE and
vibration. Hence, dimensions of cut would influence the
surface finish to the extent they influence the feed ridge,
BUE and vibrations. The height of feed ridge is influenced
by feed rate. Increase in feed rate increases the BUE for-
mation tendency, which in turn leads to higher surface
roughness.
Table 14. Optimal combination of cutting parameters for power consumption.
Alloy type Cutting speed (m/min) Feed rate (mm/rev) Depth of cut (mm) Approaching angle (�)
Alloy 1 100 0.2 1.0 75
Alloy 2 100 0.1 2.5 60
Alloy 3 100 0.1 2.0 45
Alloy 4 100 0.1 1.0 75
Alloy 5 100 0.1 2.5 90
Alloy 6 100 0.2 2.5 90
Table 15. Chip thickness ratio for hypereutectic Al–Si alloys.
Sl.
no.
CS (m/
min)
Feed rate (mm/
rev)
DOC
(mm)
Approaching angle
(�)Alloy
1
Alloy
2
Alloy
3
Alloy
4
Alloy
5
Alloy
6
1 100 0.1 1.0 45 810 432 635 360 576 235
2 100 0.2 1.5 60 825 440 654 375 590 240
3 100 0.3 2.0 75 836 471 650 390 590 290
4 100 0.4 2.5 90 840 479 671 404 605 320
5 125 0.1 1.5 75 760 413 608 346 436 232
6 125 0.2 1.0 90 777 419 611 359 453 260
7 125 0.3 2.5 45 780 450 643 372 450 282
8 125 0.4 2.0 60 794 467 657 380 465 290
9 150 0.1 2.0 90 666 367 549 346 406 229
10 150 0.2 2.5 75 683 375 550 386 414 245
11 150 0.3 1.0 60 689 390 562 399 440 263
12 150 0.4 1.5 45 730 413 568 417 464 283
13 175 0.1 2.5 60 534 419 423 328 410 188
14 175 0.2 2.0 45 556 376 448 363 434 205
15 175 0.3 1.5 90 575 449 467 389 465 228
16 175 0.4 1.0 75 610 567 477 417 469 232
374 P K Sood et al
Table 16. Chip shape under different machining conditions for hypereutectic alloys.
Alloy condition
cutting speed (100 m/min), feed rate (0.1 mm/rev) depth of cut (1 mm) and approaching angle (45°)
cutting speed (175 m/min), feed rate (0.1 mm/rev) depth of cut (2.5 mm) and approaching angle (45°)
Alloy 1
N=810 N=534
Alloy 2
N=432 N=419
Alloy 3
N=635 N=423
Alloy 4
N=360 N=328
Alloy 5
N=576 N=410
Alloy 6
N=235 N=188
Machinability of hypereutectic cast Al–Si alloys 375
4. Conclusions
The major conclusions of the study are as follows:
• Feed rate is the only significant factor that influences
the machining characteristics such as cutting forces,
power consumption, chip thickness ratio chip and
surface roughness in all the stages of alloy developed
by conventional casting and semi-solid metal process-
ing technique with the addition of iron corrector (Be
and Cd) due to refinement and modification of micro-
constituents.
• The addition of cadmium, i.e., Al–20Si–0.5Mg–
1.2Fe–0.03Cd and semi-solid metal processing result
in lower cutting force component, power consump-
tion and surface roughness because of improved
homogeneity of elements. The main reason is that
Cd is used to reduce the oxidation at elevated
temperatures; addition of Cd changes the morphol-
ogy of iron-containing particles and almost elimi-
nates the harmful b phase needle shape intermetallic
compounds from microstructure, thus improving the
machinability.
Figure 6. SEM image of a saw-toothed chip at 150 m/min cutting speed, 0.1 mm/rev feed rate, 2.0 mm depth of cut and 45�approaching angle. (a) Al–20Si–0.5Mg–1.2Fe (conventional cast) and (b) Al–20Si–0.5Mg–1.2Fe (semi-solid metal processing).
Table 17. Experimental results for surface roughness.
Sl.
no.
CS (m/
min)
Feed rate (mm/
rev)
DOC
(mm)
Approaching angle
(�)
Surface roughness Ra
Alloy
1
Alloy
2
Alloy
3
Alloy
4
Alloy
5
Alloy
6
1 100 0.1 1.0 45 5.58 4.15 4.75 4.67 3.88 3.78
2 100 0.2 1.5 60 4.07 4.37 5.16 5.14 6.60 3.47
3 100 0.3 2.0 75 4.66 6.26 4.40 4.33 8.34 3.56
4 100 0.4 2.5 90 7.46 6.67 7.04 4.42 6.43 4.18
5 125 0.1 1.5 75 5.96 3.65 4.64 5.87 3.78 2.91
6 125 0.2 1.0 90 3.24 5.21 4.41 4.40 6.55 3.19
7 125 0.3 2.5 45 4.17 3.9 5.98 6.68 7.08 5.12
8 125 0.4 2.0 60 4.12 3.90 7.61 3.59 3.75 5.87
9 150 0.1 2.0 90 4.01 2.33 4.04 4.41 3.25 3.96
10 150 0.2 2.5 75 2.14 2.00 4.88 3.50 6.92 3.68
11 150 0.3 1.0 60 5.40 3.08 5.82 5.29 5.23 4.80
12 150 0.4 1.5 45 3.05 2.66 6.71 5.30 3.61 3.74
13 175 0.1 2.5 60 5.12 3.34 3.95 4.57 2.48 3.40
14 175 0.2 2.0 45 4.26 3.59 4.45 3.18 4.80 3.63
15 175 0.3 1.5 90 5.40 4.14 6.10 3.94 5.45 3.98
16 175 0.4 1.0 75 7.87 5.59 6.76 6.10 3.52 4.06
376 P K Sood et al
• The chip form is of helical type and number of chips
per gramme also decreases when the base alloy is
processed with semi-solid metal processing technique
with the addition of iron correctors.
• Cd as iron corrector is more effective as compared with
Be for improving the machinability of hypoeutectic
aluminium–silicon alloy.
Figure 7. SEM image of machined surface: (a) Al–20Si–0.5Mg–1.2Fe (stir cast), at cutting speed 150 m/min, feed rate 0.3 mm/rev,
depth of cut 1.5 mm and approaching angle 75�, (b) Al–20Si–0.5Mg–1.2Fe–0.03Be (conventional) at cutting speed of 175 m/min, feed
rate 0.1 mm/rev, depth of cut 1.0 mm and approaching angle (75�) and (c) Al–20Si–0.5Mg–1.2Fe–0.03Be (stirring), at cutting speed of
175 m/min), feed rate 0.4 mm/rev, depth of cut 1.5 mm and approaching angle 75�.
Figure 8. SEM image of tool wear (crater wear on rake face and flank wear on flank surface): (a) Al–20Si–0.5Mg–1.2Fe (stir cast), at
cutting speed 150 m/min, feed rate 0.3 mm/rev, depth of cut 1.5 mm and approaching angle 75�, (b) Al–20Si–0.5Mg–1.2Fe–0.03Be
(conventional) at cutting speed of 175 m/min, feed rate 0.1 mm/rev, depth of cut 1.0 mm and approaching angle (75�) and (c) Al–20Si–0.5Mg–1.2Fe–0.03Be (stirring) at cutting speed of 175 m/min, feed rate 0.4 mm/rev, depth of cut 1.5 mm and approaching angle 75�.
Table 18. Optimal combination of cutting parameters for surface roughness.
Alloy type Cutting speed (m/min) Feed rate (mm/rev) Depth of cut (mm) Approaching angle (�)
Alloy 1 150 0.3 1.5 45
Alloy 2 150 0.2 1.0 45
Alloy 3 175 0.4 2.5 60
Alloy 4 175 0.4 2.0 75
Alloy 5 175 0.1 1.0 45
Alloy 6 175 0.4 1.0 60
Machinability of hypereutectic cast Al–Si alloys 377
Acknowledgment
The authors gratefully acknowledge the NIT authorities
for granting the permission to avail the facilities and
financial support in order to complete this research
work. The authors also acknowledge the technical
support provided by the staff of Central Workshop and
Mechanical Engineering Department, NIT, Hamirpur,
and I.I.T. Roorkee during preparation and testing of the
alloys.
References
[1] Lee E S 2000 A study on the economics of hypereutectic
aluminium–silicon alloy machining. J. Adv. Manuf. Technol.
16: 700–708
[2] Ryou M, Kim C H and Kim M H 2008 Microstructure and
mechanical properties of hyper-eutectic Al–Si alloys fabri-
cated by spray casting. J. Mater. Sci. Technol. 24(I): 48–50
[3] Tanka T and Akasawa T 1999 Machinability of hypereutectic
silicon–aluminium alloy. J. Mater. Eng. Perform. 8: 463–468
[4] Halla N F, Secordel P and Suery M 1998 Microstructure and
mechanical properties of modified and non-modified stir cast
Al–Si alloy. J. Mater. Sci. 23: 2419–2423
[5] Karal M V, Nakashima P N H and Mitchell D R G 2006
Electro-microscope studies of Al–Fe–Si intermetallics in an
Al–11 pCt Si alloy. J. Mater. Process. Technol. 200: 373–384
[6] Reddy B S, Padmanabhan G and Reddy V K 2008 Surface
roughness prediction techniques for CNC turning. Asian J.
Sci. Res. 1(3): 256–264
[7] Dwivedi D K, Sharma A and Rajan T V 2008 Machining of
LM13 and LM28 cast aluminum alloys: part - I. J. Mater.
Process. Technol. 196: 197–204
[8] Trent E M and Wright P K 2006 Forces and stresses in metal
cutting. In: Metal cutting, USA: Butterworth-Heinemann,
pp. 57–95
[9] Sharma V S, Dhiman S, Sehgal R and Kumar S 2008
Assessment and optimization of cutting parameters while
turning AlSI 52100 steel. Int. J. Precis. Eng. Manuf. 9: 54–62
[10] Aggarwal A, Singh H, Kumar P and Singh M 2008 Optimizing
power consumption for CNC turned parts using response sur-
face methodology and Taguchi’s technique – a comparative
analysis. J. Mater. Process. Technol. 200: 373–384
[11] Mahapatra S S, Patnaik A and Patnaik P K 2006 Parametric
analysis and optimization of cutting parameters for turning
operations based on Taguchi method. In: Proceedings of the
International Conference on Global Manufacturing and
Innovation, pp. 1–8
[12] Sood P K, Sehgal R and Dwivedi D K 2009 Study on chip
formation in machining (Al–Si–1.2Fe) hypereutectic alu-
minium alloy. In: Proceedings of the National Conference on
Design and Manufacturing Issues in Automobile and Allied
Industry, IITM, Chennai, pp. 16–22
[13] Nalbant M, Gokkaya H and Sur G 2007 Application of
Taguchi method in the optimization of cutting parameters for
surface roughness in turning. J. Mater. Des. 28(4): 1379–1385
[14] Nain C V, Yang W H and Tarng Y S 1999 Optimization of
turning operations with multiple performance characteristics.
J. Mater. Process. Technol. 95: 90–96
[15] Rodrıgueza S H, Rafael E, Reyesa G, Dwivedi D K, Gon-
zaleza O A and Hernandez V H B 2012 The effect of Al–
5Ti–1B on microstructure and mechanical properties of Al–
12Si–xFe alloy. Mater. Manuf. Process. 27(6): 599–604
[16] Ellis M B D 1996 Joining of Al-based metal matrix com-
posites – a review. Mater. Manuf. Process. 11(1): 45–66
[17] Keipke R, Buchkremer-Hermanns H,WeiB H and Ren H 1998
Machining of hypereutectic Al–Si alloy with CVD diamond
coated Si4N4 inserts.Mater. Manuf. Process. 13(4): 603–610
378 P K Sood et al