Machinability and Energy Efficiency in Micro-EDM Milling ...
18
General rights Copyright and moral rights for the publications made accessible in the public portal are retained by the authors and/or other copyright owners and it is a condition of accessing publications that users recognise and abide by the legal requirements associated with these rights. Users may download and print one copy of any publication from the public portal for the purpose of private study or research. You may not further distribute the material or use it for any profit-making activity or commercial gain You may freely distribute the URL identifying the publication in the public portal If you believe that this document breaches copyright please contact us providing details, and we will remove access to the work immediately and investigate your claim. Downloaded from orbit.dtu.dk on: Oct 16, 2021 Machinability and Energy Efficiency in Micro-EDM Milling of Zirconium Boride Reinforced with Silicon Carbide Fibers Quarto, Mariangela; Bissacco, Giuliano; D'Urso, Gianluca Published in: Materials Link to article, DOI: 10.3390/ma12233920 Publication date: 2019 Document Version Publisher's PDF, also known as Version of record Link back to DTU Orbit Citation (APA): Quarto, M., Bissacco, G., & D'Urso, G. (2019). Machinability and Energy Efficiency in Micro-EDM Milling of Zirconium Boride Reinforced with Silicon Carbide Fibers. Materials, 12(23), [3920]. https://doi.org/10.3390/ma12233920
Transcript of Machinability and Energy Efficiency in Micro-EDM Milling ...

General rights Copyright and moral rights for the publications made accessible in the public portal are retained by the authors and/or other copyright owners and it is a condition of accessing publications that users recognise and abide by the legal requirements associated with these rights.
Users may download and print one copy of any publication from the public portal for the purpose of private study or research.
You may not further distribute the material or use it for any profit-making activity or commercial gain
You may freely distribute the URL identifying the publication in the public portal If you believe that this document breaches copyright please contact us providing details, and we will remove access to the work immediately and investigate your claim.
Downloaded from orbit.dtu.dk on: Oct 16, 2021
Machinability and Energy Efficiency in Micro-EDM Milling of Zirconium BorideReinforced with Silicon Carbide Fibers
Quarto, Mariangela; Bissacco, Giuliano; D'Urso, Gianluca
Published in:Materials
Link to article, DOI:10.3390/ma12233920
Publication date:2019
Document VersionPublisher's PDF, also known as Version of record
Link back to DTU Orbit
Citation (APA):Quarto, M., Bissacco, G., & D'Urso, G. (2019). Machinability and Energy Efficiency in Micro-EDM Milling ofZirconium Boride Reinforced with Silicon Carbide Fibers. Materials, 12(23), [3920].https://doi.org/10.3390/ma12233920

materials
Article
Machinability and Energy Efficiency in Micro-EDMMilling of Zirconium Boride Reinforced with SiliconCarbide Fibers
Mariangela Quarto 1, Giuliano Bissacco 2 and Gianluca D’Urso 1,*1 Department of Management, Information and Production Engineering, University of Bergamo,
Via Pasubio 7/b, 24044 Dalmine, Italy; [email protected] Department of Mechanical Engineering, Technical University of Denmark, Produktionstorvet, Building 425,
2800 Kgs. Lyngby, Denmark; [email protected]* Correspondence: [email protected]; Tel.: +39-035-2052330
Received: 22 October 2019; Accepted: 25 November 2019; Published: 27 November 2019 �����������������
Abstract: Several types of advanced materials have been developed to be applied in many industrialapplication fields to satisfy the high performance required. Despite this, research and development ofprocess suited to machine are still limited. Due to the high mechanical properties, advanced materialsare often considered as difficult to cut. For this reason, EDM (Electrical Discharge Machining) can bedefined as a good option for the machining of micro components made of difficult to cut electricallyconductive materials. This paper presents an investigation on the applicability of the EDM process tomachine ZrB2 reinforced by SiC fibers, with assessment of process performance and energy efficiency.Different fractions of the additive SiC fibers were taken into account to evaluate the stability andrepeatability of the process. Circular pocket features were machined by using a micro-EDM machineand the results from different process parameters combinations were analyzed with respect to materialremoval, electrode wear and cavity surface quality. Discharges data were collected and characterizedto define the actual values of process parameters (peak current, pulse duration and energy perdischarge). The characteristics of the pulses were used to evaluate the machinability and to investigatethe energy efficiency of the process. The main process performance indicators were calculated as afunction of the number of occurred discharges and the energy of a single discharge. The results showinteresting aspects related to the process from both the performances and the removal mechanismpoint of view.
Keywords: micro-EDM; zirconium boride; silicon carbide fibers; machinability; advanced material
1. Introduction
The term advanced ceramics refers to a group of materials achieved starting from inorganic rawmaterials characterized by a high grade of purity, obtained at high sintering temperatures by meansof powder metallurgy technologies. In this way, high-density materials with good mechanical andcorrosion characteristics can be obtained. The most important application fields are the realizationof medical and dental prosthesis, mechanical components (e.g., ball bearings), extrusion matrix andcutting tools. Some other significant applications are related to high mechanical resistance in criticalenvironments (e.g., gas turbines and heat exchanges), magnetic applications (e.g., insulating material orcoating for nuclear reactors) and nanotechnology applications (e.g., nano-turbines) [1–3]. A particulargroup of advanced ceramics is defined as ultra-high-temperature ceramics (UHTCs). UHTCs materialsare characterized by excellent performance in an extreme environment and are usually made of borides(ZrB2 and HfB2), carbides (ZrC, HfC and TaC) and nitrides (HfN). This base structure assigns a highmelting point and hardness, relatively good resistance to oxidation and chemical inertness.
Materials 2019, 12, 3920; doi:10.3390/ma12233920 www.mdpi.com/journal/materials
Materials 2019, 12, 3920 2 of 17
During the last years, several studies have argued that the diborides of the group IVb are the mostresistant to oxidation and among these compounds, HfB2 and ZrB2, are the best performing [1,4,5].Low theoretical density, high melting point over 3000 ◦C, high electrical conductivity, high fracturetoughness and chemical stability in severe conditions make ZrB2 a very attractive for applications incritical conditions such as refractories crucible, high-temperature structural components in aerospace,nozzles or armor, passive electronic components for subsystems as the printers, injection systems,the optical and medical devices, actuators and sensors.
Examples of aerospace applications and performances are described in [1,5], which characterize twopromising UHTC materials applicable in hot structures for hypersonic and atmospheric re-entry vehiclesand a small nose cone have been manufactured and tested at ultra-high temperature. In particular,in [5], they verified the feasibility of a special capsule namely SHARK. This capsule presented anUHTC nose tip manufactured by EDM, and just this tip represented the core of the investigation;in fact, this work identified the instant of the fracture. In the electronics industry, they are applied suchas components obtained by laminate and substrate technology. In particular, these special materialscan be used for MEMS devices such as pressure transducer and electrostatic actuators. In addition,due to the high wear resistance, ZrB2 is a good option for sinking EDM electrodes production [6].Despite all these characteristics, the application of pure borides is subject to three majors’ limitations.Firstly, the densification process is hindered by the strong covalent bonds; in fact, these materials arecharacterized by a highly porous structure and very low apparent density, usually about 85% vol.Secondly, ZrB2 oxidation generates ZrO2, which is characterized by many porosities and thereforenon-protective, and B2O3, which readily evaporates. Thirdly, it is fragile and liable to thermal shockfailure. However, the use of pure materials is not enough, especially for structural applications inthe high-temperature environment. Thus, to mitigate the shortcoming reported above, the additionof secondary phases, composed of a non-reactive additive like niobium (Nb), disilicides and siliconcarbide (SiC), vanadium (V) and carbon (C), is essential and it is the object of many researches [3,7–13].The addition of these components allows reducing relative porosity and mechanical and physicalproperties. Among the additives already studied, SiC is one of the most used and it seems to be themost valuable to enhance the resistance to oxidation by the formation of borosilicate glass, to promotedensification by restricting the growth of diboride grains and to lower their sintering temperature [4,6,9].The double phase materials are usually obtained by a hot pressing process, which, despite the highpressures required (30–50 MPa), allows us to reduce the densification temperature [13–15].
Studies related to the microstructure and the characterization of ZrB2 sintered with a differentcompound fraction of silicon carbide (SiC) demonstrated that a high additive fraction reduces the grainsize down to 2–3 µm and allows us to increase the flexural strength to 700–1000 MPa. In particular,the addition of 10% vol. of SiC, allows reaching 93.2% relative density. This is enough to limit the graingrowth and maximize the strength. Specifically, previous works affirmed that the addition of 20% of SiCgenerates the best combination of oxidation resistance and mechanical behavior [8,16–20]. Materialscharacterized by high mechanical properties tend to be really difficult to be processed and ceramicmaterials are not an exception. Two main categories of machining are effective for processing thesekinds of materials: abrasive particle processes (such as grinding, ultrasonic machining and abrasivewater-jet) and thermal processes (such as laser ablation and electrical discharge machining) [20]. Today,two main aspects are investigated for ZrB2 based ceramics: the application of these materials aselectrode and the machining of a ZrB2 based ceramics workpiece. In particular, the studies of machiningon ZrB2 based materials allows increasing process precision and efficiency of these advanced ceramics,and contribute to make the application of ZrB2 based ceramics more common [21]. An example ofthe industrial application of this kind of material is related to micro-nozzles for micropropulsionsystems. In [22] a possible application of micro-EDM was explained for manufacturing micro-nozzlewith a conical convergent section and a parabolic divergent section. In this work the micro-nozzle wassuccessfully machined, exhibiting high processing efficiency and machining accuracy. As anticipated inthe first part of the introduction, another interesting application of ZrB2 based ceramic is the nose tip of
Materials 2019, 12, 3920 3 of 17
the sounding hypersonic atmospheric re-entering “kapsule” (SHARK). This tip represents the final partof a re-entering capsule and in the inner part is characterized by a micro-hole where a thermocoupleis placed to be protected from the ground impact [5]. This kind of components requires the useof advanced ceramics or advanced materials (for critical environment applications) in combinationwith features characterized by strict tolerances. In this study, micro-EDM is applied because of thepromising results of earlier research in the field [20,23]. Based on the impressive characteristics foundin literature, the workpieces are represented by a ZrB2 base matrix with the addition of SiC fibers.In this work, the EDM machinability of ZrB2 reinforced by SiC fibers is studied with a focus onprocess stability and process performances. In particular, the effects of a different additive fractionare evaluated. The discharges are characterized, firstly to determine the trigger level for countingdischarges, and then to estimate the process performances by verifying the repeatability of the sampledistribution. The surface aspect is evaluated by SEM images and by the estimation of surface roughness.All these aspects allow us to identify the main differences with the ED-machining on metal materialsand to define if the material removal mechanism is characterized by a different approach.
2. Materials and Methods
2.1. Materials
2.1.1. Materials Production
The materials investigated were provided by the ISTEC-CNR of Faenza (Italy) and they wereprepared as reported in [24] by hot-pressed ZrB2 with different fractions of non-reactive additive toreduce the porosity and to improve their high-temperature mechanical properties. ZrB2 Grade B (H.C.Starck, Goslar, Germany) and SiC HI Nicalon-chopped fibers (CNR-ISTEC, Faenza, Ravenna, Italy),Si:C:O = 62:37:0.5, characterized by 15 µm diameter and 300 µm length were used for preparing thecomposites materials. Table 1 summarizes the main structural, physical and thermodynamic propertiesof ZrB2.
Table 1. ZrB2 characteristics [11,15,25].
Property ZrB2
Crystal system space group HexagonalDensity 6.119 g/cm3
Melting temperature 3245 ◦CYoung’s modulus 489 GPa
Hardness 23 GPaCoefficient of thermal expansion 5.9 × 10⁻⁶ K−1
Heat capacity at 25 ◦C 48.2 J/(mol · K)Electrical conductivity 1.0 × 10⁷ S/mThermal conductivity 60 W/(m · K)
The powder mixtures were ball milled for 24 h in pure ethanol using silicon carbide media; then,the dirtiness was withered in a rotary evaporator (ISTEC-CNR, Faenza, Ravenna, Italy). Hot-pressingwas performed in a low vacuum environment (∼100 Pa) taking an induction-heated graphite die andapplying uniaxial pressure equal to 30 MPa during the heating and increased up to 50 MPa at 1700 ◦C.The maximum value of the sintering temperature was fixed taking into account the shrinkage curveand a free cooling followed. Table 2 shows the relative density of the samples taken into account.

Materials 2019, 12, 3920 4 of 17
Table 2. Relative density of the raw materials considered.
Materials Relative Density (δ) Sample Name
ZrB2 ~83% ZrBZrB2 + 5% SiC ~92% ZrB5ZrB2 + 20% SiC ~97% ZrB20ZrB2 + 30% SiC ~91% ZrB30ZrB2 + 50% SiC ~94% ZrB50
2.1.2. Materials Characteristics
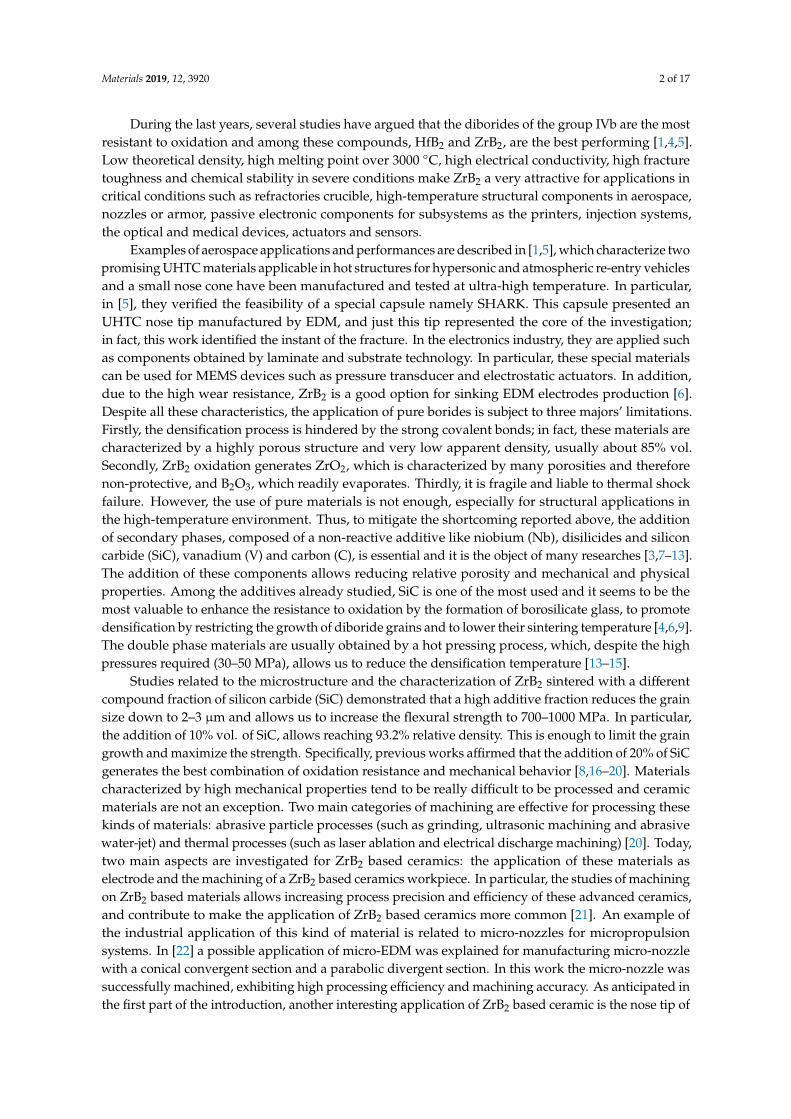
The raw materials were analyzed by a scanning electron microscope (SEM), which allows observingwell dispersion of the fibers into the ZrB2-base matrix. The fibers are still recognizable as elongateddark structures in backscattered SEM images. Figure 1 reports an example of the typical appearanceof ZrB5 and ZrB50. It is possible to notice the different aspects related to the additive fraction.The fibers were distributed homogeneously since no agglomeration was observed. As reported inthe literature by [26,27], the fibers tend to align themselves orthogonally to the direction of appliedpressure. The fibers inside the base matrix are characterized by a shorter length than one of the startingmixtures. The reduction in length is due to the applied pressure reached during the sintering. In fact,after the preparation, the SiC fibers had dimensions of about 10 µm in diameter and 200 µm in length(Figure 2). Characterization of the as-sintered microstructure by scanning electron microscopy coupledwith energy dispersive X-ray analysis (SEM-EDX) was performed. As illustrated in Figure 3, there wasa clear separation between the base matrix and the additive, evidence that during the sintering processthe base matrix and the additive did not undergo chemical reactions.
Materials 2019, 12, x FOR PEER REVIEW 4 of 18
Table 2. Relative density of the raw materials considered.
Materials Relative Density (𝜹) Sample Name ZrB2 ~83% ZrB
ZrB2 + 5% SiC ~92% ZrB5 ZrB2 + 20% SiC ~97% ZrB20 ZrB2 + 30% SiC ~91% ZrB30 ZrB2 + 50% SiC ~94% ZrB50
2.1.2. Materials Characteristics
The raw materials were analyzed by a scanning electron microscope (SEM), which allows observing well dispersion of the fibers into the ZrB2-base matrix. The fibers are still recognizable as elongated dark structures in backscattered SEM images. Figure 1 reports an example of the typical appearance of ZrB5 and ZrB50. It is possible to notice the different aspects related to the additive fraction. The fibers were distributed homogeneously since no agglomeration was observed. As reported in the literature by [26,27], the fibers tend to align themselves orthogonally to the direction of applied pressure. The fibers inside the base matrix are characterized by a shorter length than one of the starting mixtures. The reduction in length is due to the applied pressure reached during the sintering. In fact, after the preparation, the SiC fibers had dimensions of about 10 μm in diameter and 200 μm in length (Figure 2). Characterization of the as-sintered microstructure by scanning electron microscopy coupled with energy dispersive X-ray analysis (SEM-EDX) was performed. As illustrated in Figure 3, there was a clear separation between the base matrix and the additive, evidence that during the sintering process the base matrix and the additive did not undergo chemical reactions.
Figure 1. SEM backscatter images of the typical appearance of ZrB5 (left) and ZrB50 (right).
Figure 1. SEM backscatter images of the typical appearance of ZrB5 (left) and ZrB50 (right).
Materials 2019, 12, x FOR PEER REVIEW 4 of 18
Table 2. Relative density of the raw materials considered.
Materials Relative Density (𝜹) Sample Name ZrB2 ~83% ZrB
ZrB2 + 5% SiC ~92% ZrB5 ZrB2 + 20% SiC ~97% ZrB20 ZrB2 + 30% SiC ~91% ZrB30 ZrB2 + 50% SiC ~94% ZrB50
2.1.2. Materials Characteristics
The raw materials were analyzed by a scanning electron microscope (SEM), which allows observing well dispersion of the fibers into the ZrB2-base matrix. The fibers are still recognizable as elongated dark structures in backscattered SEM images. Figure 1 reports an example of the typical appearance of ZrB5 and ZrB50. It is possible to notice the different aspects related to the additive fraction. The fibers were distributed homogeneously since no agglomeration was observed. As reported in the literature by [26,27], the fibers tend to align themselves orthogonally to the direction of applied pressure. The fibers inside the base matrix are characterized by a shorter length than one of the starting mixtures. The reduction in length is due to the applied pressure reached during the sintering. In fact, after the preparation, the SiC fibers had dimensions of about 10 μm in diameter and 200 μm in length (Figure 2). Characterization of the as-sintered microstructure by scanning electron microscopy coupled with energy dispersive X-ray analysis (SEM-EDX) was performed. As illustrated in Figure 3, there was a clear separation between the base matrix and the additive, evidence that during the sintering process the base matrix and the additive did not undergo chemical reactions.
Figure 1. SEM backscatter images of the typical appearance of ZrB5 (left) and ZrB50 (right).
Figure 2. SEM backscatter image showing fibers dimensions.
Materials 2019, 12, 3920 5 of 17Materials 2019, 12, x FOR PEER REVIEW 5 of 18
Figure 2. SEM backscatter image showing fibers dimensions.
Figure 3. Example of an energy dispersive X-ray (EDX) analysis of the base material ZrB5.
2.2. Methods
2.2.1. Experimental Set-Up
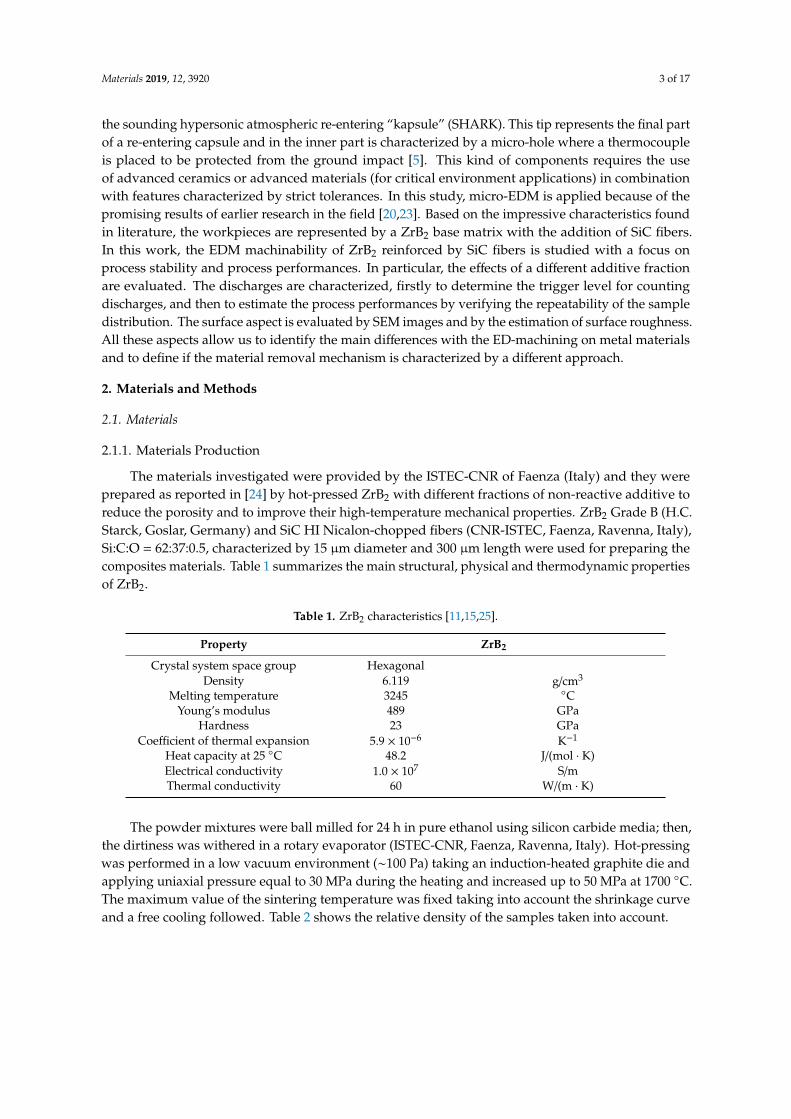
In order to explore the EDM machinability of the selected materials, EDM milling tests were carried out with a focus on process stability and process performances. The test feature selected was a circular pocket having a diameter equal to 1 mm and a nominal depth of 200 μm. These micro-features were processed by μEDM milling using a SARIX® SX-200 machine (Sarix SA, Sant'Antonino, Svizzera). Solid tungsten carbide electrodes with a diameter of 300 μm were used as a tool, while the dielectric fluid was hydrocarbon oil. Three different process parameters settings were used to conduct the experimental tests and each of these settings corresponds to a different pulse shape. It is important to remark that in the Sarix EDM machine (Sarix SA, Sant'Antonino, Svizzera), some process parameters such as the peak current and the width are expressed as indexes and the instantaneous values cannot be set because the machine has an autoregulating system. For this reason, the stability and repeatability of the process were investigated by monitoring the discharge characteristics (peak current and discharge energy) and analyzing the distribution of such characteristics during the EDM milling process. This task was performed using a current probe and a voltage probe to measure electric current and voltage during machining. A current monitor with a bandwidth of 200 MHz connected to a Rohde & Schwarz RTO1014 digital oscilloscope (Rohde & Schwarz, Benjamin Franklin Drive, Columbia, MD, USA)was used to acquire the current waveforms. Furthermore, a Hameg HM8123 programmable counter (Rohde & Schwarz, Benjamin Franklin Drive, Columbia, MD, USA) was dedicated to count the occurred discharges. A diagram of the machine set up is shown in Figure 4.
Optimal process parameters were defined for each combination of workpiece material and pulse type and an experimental campaign was performed based on a general full factorial design Table 3). Two factors were taken into account: the additive fraction, defined by five levels, and the pulse type, defined by three levels. Different levels of pulse types identify the different duration of the discharges; in particular, pulse type A is referred to long pulses and high energy per discharge, while pulse-type C identifies short pulses and low energy per discharge. Furthermore, the pulse type is characterized by the different set of process parameters defined by the preliminary tests. Four repetitions were performed for each run [28].
Figure 3. Example of an energy dispersive X-ray (EDX) analysis of the base material ZrB5.
2.2. Methods
2.2.1. Experimental Set-Up
In order to explore the EDM machinability of the selected materials, EDM milling tests werecarried out with a focus on process stability and process performances. The test feature selected was acircular pocket having a diameter equal to 1 mm and a nominal depth of 200 µm. These micro-featureswere processed by µEDM milling using a SARIX®SX-200 machine (Sarix SA, Sant’Antonino, Svizzera).Solid tungsten carbide electrodes with a diameter of 300 µm were used as a tool, while the dielectricfluid was hydrocarbon oil. Three different process parameters settings were used to conduct theexperimental tests and each of these settings corresponds to a different pulse shape. It is important toremark that in the Sarix EDM machine (Sarix SA, Sant’Antonino, Svizzera), some process parameterssuch as the peak current and the width are expressed as indexes and the instantaneous values cannot beset because the machine has an autoregulating system. For this reason, the stability and repeatability ofthe process were investigated by monitoring the discharge characteristics (peak current and dischargeenergy) and analyzing the distribution of such characteristics during the EDM milling process. Thistask was performed using a current probe and a voltage probe to measure electric current and voltageduring machining. A current monitor with a bandwidth of 200 MHz connected to a Rohde & SchwarzRTO1014 digital oscilloscope (Rohde & Schwarz, Benjamin Franklin Drive, Columbia, MD, USA)wasused to acquire the current waveforms. Furthermore, a Hameg HM8123 programmable counter (Rohde& Schwarz, Benjamin Franklin Drive, Columbia, MD, USA) was dedicated to count the occurreddischarges. A diagram of the machine set up is shown in Figure 4.
Optimal process parameters were defined for each combination of workpiece material and pulsetype and an experimental campaign was performed based on a general full factorial design Table 3).Two factors were taken into account: the additive fraction, defined by five levels, and the pulse type,defined by three levels. Different levels of pulse types identify the different duration of the discharges;in particular, pulse type A is referred to long pulses and high energy per discharge, while pulse-type Cidentifies short pulses and low energy per discharge. Furthermore, the pulse type is characterizedby the different set of process parameters defined by the preliminary tests. Four repetitions wereperformed for each run [28].
Materials 2019, 12, 3920 6 of 17Materials 2019, 12, x FOR PEER REVIEW 6 of 18
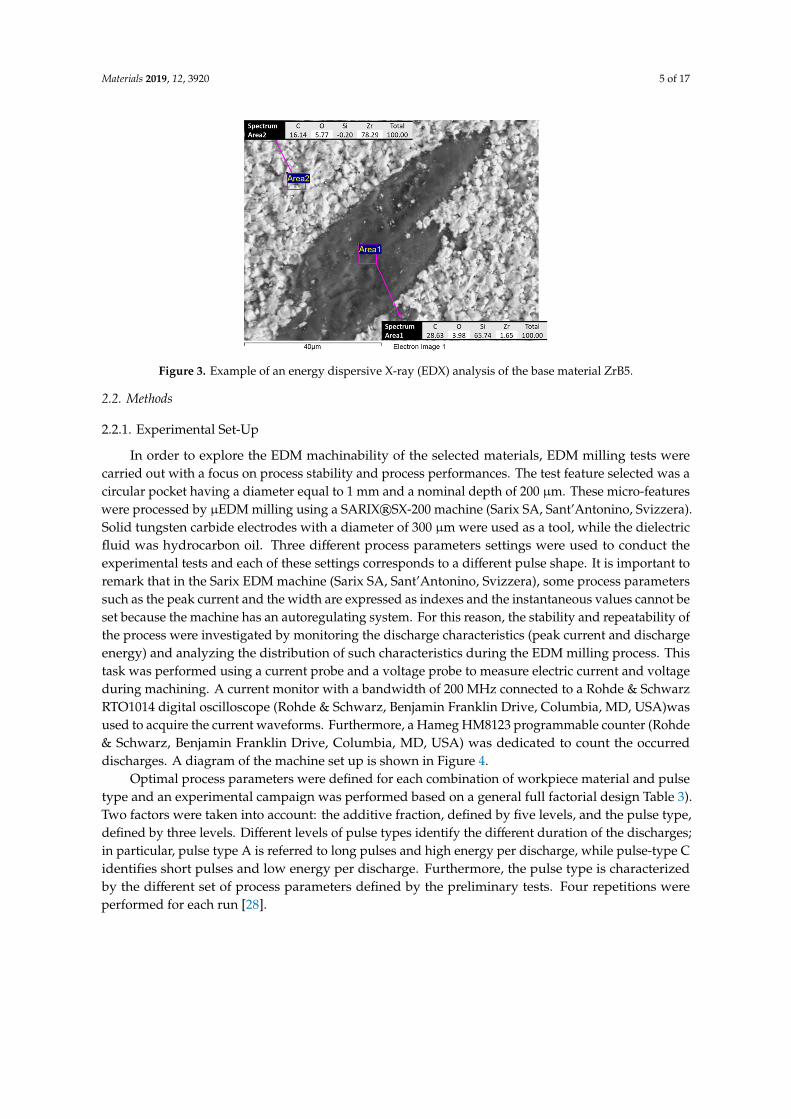
Figure 4. A scheme of the experimental equipment set-up.
Table 3. General full factorial design.
Factors Additive Fraction Pulse Type
Leve
ls
0 5 A
20 B 30 C 50
2.2.2. Discharge Population Characterization
In order to determine the trigger level for counting sparks, the discharges population has to be characterized during the EDM process. To do that, the measurement and assessment both of the current and the voltage delivered to the workpiece and the electrode were performed. For this goal, probes dedicated to the current and to the voltage were used. The discharge population is characterized for the purpose of “quantifying” the stability of the process and evaluating the process performances for the machining of the advanced materials selected for this study. The discharge population was characterized by repeated waveform samples of current and voltage signals for the selected pulse types, combined with each material. Waveform acquisition was carried out using a sampling frequency of 40 MSa/s. The trigger level was set-up equal to a very low value for the acquisition process, in order to acquire all the discharge current waveforms, which were stored in the oscilloscope buffer and transferred to a computer. Then, the collected waveforms were elaborated to extract peak current, average discharge voltage, width and energy per discharge. For each waveform sample, the frequency distribution histogram was plotted. Figures 5–7 show the distributions of the discharge current for all the combinations grouped according to the pulse type. The histograms
Figure 4. A scheme of the experimental equipment set-up.
Table 3. General full factorial design.
Factors
Additive Fraction Pulse Type
Levels
05 A20 B30 C50
2.2.2. Discharge Population Characterization
In order to determine the trigger level for counting sparks, the discharges population has to becharacterized during the EDM process. To do that, the measurement and assessment both of the currentand the voltage delivered to the workpiece and the electrode were performed. For this goal, probesdedicated to the current and to the voltage were used. The discharge population is characterized forthe purpose of “quantifying” the stability of the process and evaluating the process performancesfor the machining of the advanced materials selected for this study. The discharge population wascharacterized by repeated waveform samples of current and voltage signals for the selected pulsetypes, combined with each material. Waveform acquisition was carried out using a sampling frequencyof 40 MSa/s. The trigger level was set-up equal to a very low value for the acquisition process, in orderto acquire all the discharge current waveforms, which were stored in the oscilloscope buffer andtransferred to a computer. Then, the collected waveforms were elaborated to extract peak current,average discharge voltage, width and energy per discharge. For each waveform sample, the frequencydistribution histogram was plotted. Figures 5–7 show the distributions of the discharge current for allthe combinations grouped according to the pulse type. The histograms provide an overview regarding
Materials 2019, 12, 3920 7 of 17
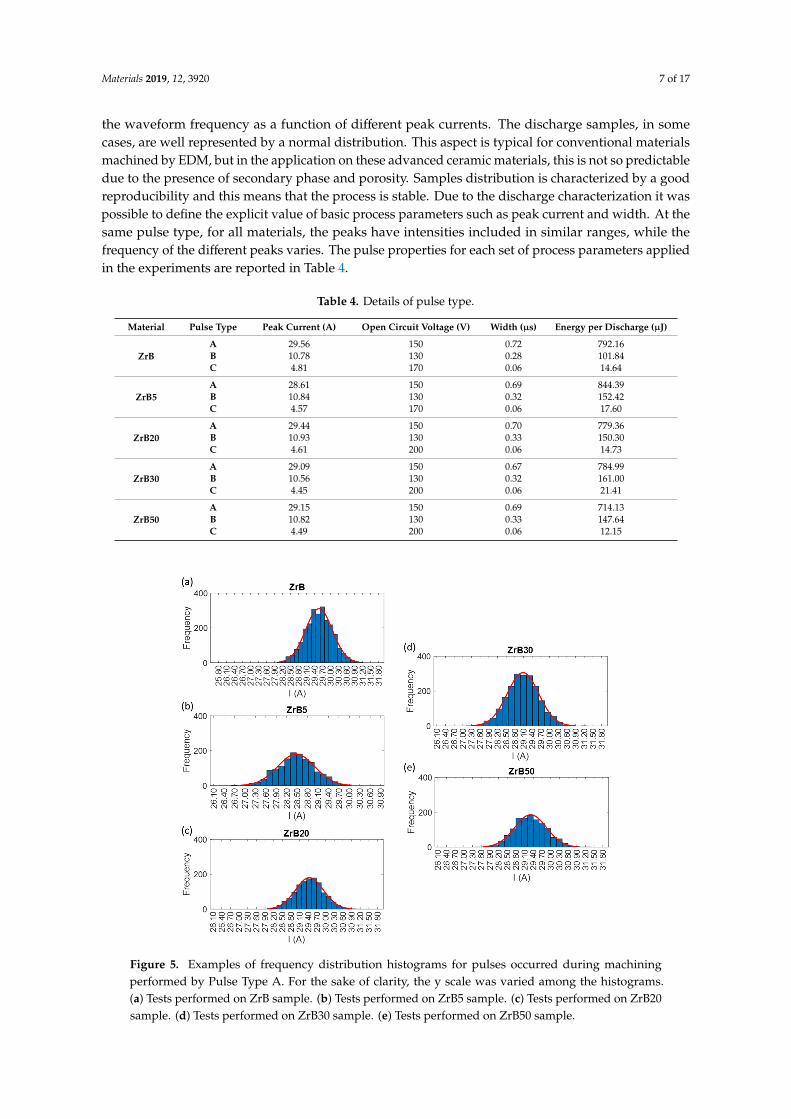
the waveform frequency as a function of different peak currents. The discharge samples, in somecases, are well represented by a normal distribution. This aspect is typical for conventional materialsmachined by EDM, but in the application on these advanced ceramic materials, this is not so predictabledue to the presence of secondary phase and porosity. Samples distribution is characterized by a goodreproducibility and this means that the process is stable. Due to the discharge characterization it waspossible to define the explicit value of basic process parameters such as peak current and width. At thesame pulse type, for all materials, the peaks have intensities included in similar ranges, while thefrequency of the different peaks varies. The pulse properties for each set of process parameters appliedin the experiments are reported in Table 4.
Table 4. Details of pulse type.
Material Pulse Type Peak Current (A) Open Circuit Voltage (V) Width (µs) Energy per Discharge (µJ)
ZrBA 29.56 150 0.72 792.16B 10.78 130 0.28 101.84C 4.81 170 0.06 14.64
ZrB5A 28.61 150 0.69 844.39B 10.84 130 0.32 152.42C 4.57 170 0.06 17.60
ZrB20A 29.44 150 0.70 779.36B 10.93 130 0.33 150.30C 4.61 200 0.06 14.73
ZrB30A 29.09 150 0.67 784.99B 10.56 130 0.32 161.00C 4.45 200 0.06 21.41
ZrB50A 29.15 150 0.69 714.13B 10.82 130 0.33 147.64C 4.49 200 0.06 12.15
Materials 2019, 12, x FOR PEER REVIEW 8 of 18
Figure 5. Examples of frequency distribution histograms for pulses occurred during machining performed by Pulse Type A. For the sake of clarity, the y scale was varied among the histograms. (a) Tests performed on ZrB sample. (b) Tests performed on ZrB5 sample. (c) Tests performed on ZrB20 sample. (d) Tests performed on ZrB30 sample. (e) Tests performed on ZrB50 sample.
Figure 5. Examples of frequency distribution histograms for pulses occurred during machiningperformed by Pulse Type A. For the sake of clarity, the y scale was varied among the histograms.(a) Tests performed on ZrB sample. (b) Tests performed on ZrB5 sample. (c) Tests performed on ZrB20sample. (d) Tests performed on ZrB30 sample. (e) Tests performed on ZrB50 sample.
Materials 2019, 12, 3920 8 of 17
Materials 2019, 12, x FOR PEER REVIEW 8 of 18
Figure 5. Examples of frequency distribution histograms for pulses occurred during machining performed by Pulse Type A. For the sake of clarity, the y scale was varied among the histograms. (a) Tests performed on ZrB sample. (b) Tests performed on ZrB5 sample. (c) Tests performed on ZrB20 sample. (d) Tests performed on ZrB30 sample. (e) Tests performed on ZrB50 sample.
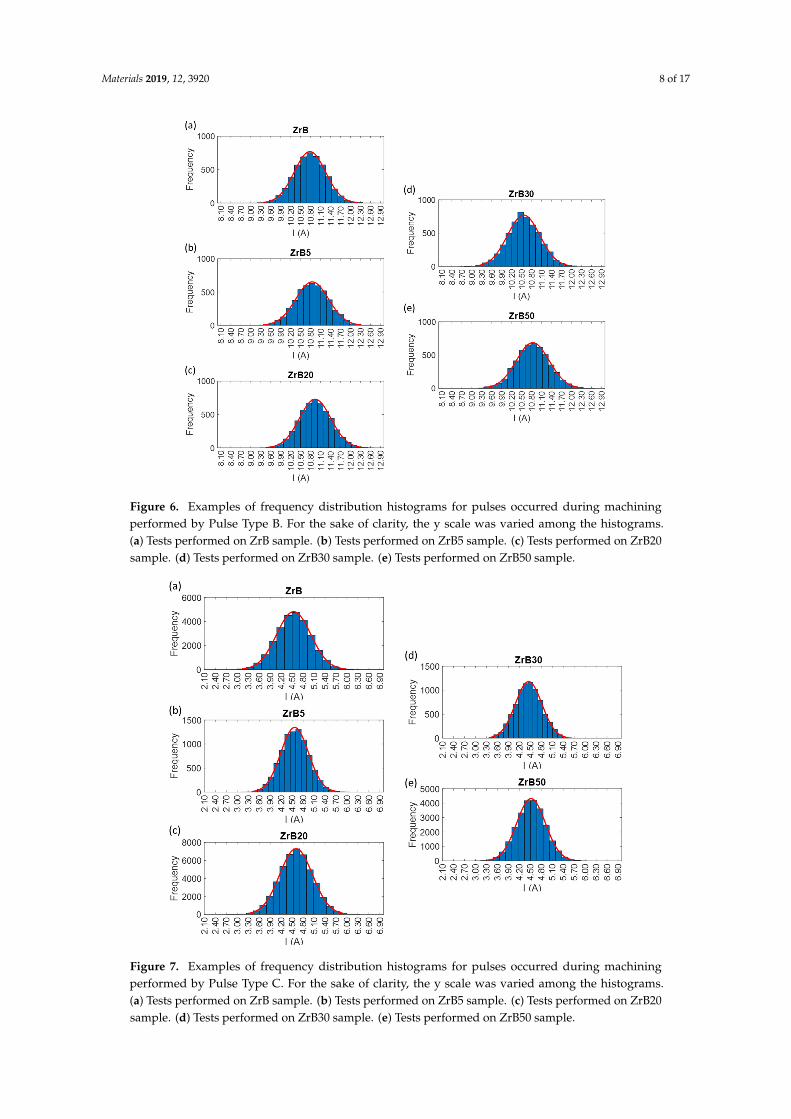
Figure 6. Examples of frequency distribution histograms for pulses occurred during machiningperformed by Pulse Type B. For the sake of clarity, the y scale was varied among the histograms.(a) Tests performed on ZrB sample. (b) Tests performed on ZrB5 sample. (c) Tests performed on ZrB20sample. (d) Tests performed on ZrB30 sample. (e) Tests performed on ZrB50 sample.
Materials 2019, 12, x FOR PEER REVIEW 9 of 18
Figure 6. Examples of frequency distribution histograms for pulses occurred during machining performed by Pulse Type B. For the sake of clarity, the y scale was varied among the histograms. (a) Tests performed on ZrB sample. (b) Tests performed on ZrB5 sample. (c) Tests performed on ZrB20 sample. (d) Tests performed on ZrB30 sample. (e) Tests performed on ZrB50 sample.
Figure 7. Examples of frequency distribution histograms for pulses occurred during machining performed by Pulse Type C. For the sake of clarity, the y scale was varied among the histograms. (a) Tests performed on ZrB sample. (b) Tests performed on ZrB5 sample. (c) Tests performed on ZrB20 sample. (d) Tests performed on ZrB30 sample. (e) Tests performed on ZrB50 sample.
2.2.3. Characterization Procedure
A 3D characterization of the micro-slots was performed by a confocal laser scanning microscope (Olympus LEXT, Southend, Essex, UK) with a magnification of 20×. After the data acquisition by the laser microscope, the images were analyzed with a scanning probe image processor software (SPIP, 6.7.3, Image Metrology, Lyngby-Denmark). A plane correction was performed on all the images to level the surfaces prior to assessing the geometrical elements.
This software was used to assess the surface roughness (Sa) based on the international standard UNI EN ISO 25178:2017[29]. Figure 8 shows an example of the texture of a machined surface portion.
Tool wear per discharge (TWD), material removal per discharge (MRD) and tool wear ratio (TWR) were selected as the main performance criteria for the process evaluation. TWD (Equation 1) was calculated as the ratio between the material removed from the electrode (MRT (mm3)) and the number of discharges (N) recorded. The length of the tool wear was measured through a touching procedure executed in a reference position: the length of the electrode was measured before and after the single EDM milling operation. The electrode wear volume was estimated starting from the tool wear length, considering the electrode as a cylindrical part. TWD = . (1)
Figure 7. Examples of frequency distribution histograms for pulses occurred during machiningperformed by Pulse Type C. For the sake of clarity, the y scale was varied among the histograms.(a) Tests performed on ZrB sample. (b) Tests performed on ZrB5 sample. (c) Tests performed on ZrB20sample. (d) Tests performed on ZrB30 sample. (e) Tests performed on ZrB50 sample.

Materials 2019, 12, 3920 9 of 17
2.2.3. Characterization Procedure
A 3D characterization of the micro-slots was performed by a confocal laser scanning microscope(Olympus LEXT, Southend, Essex, UK) with a magnification of 20×. After the data acquisition by thelaser microscope, the images were analyzed with a scanning probe image processor software (SPIP,6.7.3, Image Metrology, Lyngby-Denmark). A plane correction was performed on all the images tolevel the surfaces prior to assessing the geometrical elements.
This software was used to assess the surface roughness (Sa) based on the international standardUNI EN ISO 25178:2017 [29]. Figure 8 shows an example of the texture of a machined surface portion.
Tool wear per discharge (TWD), material removal per discharge (MRD) and tool wear ratio (TWR)were selected as the main performance criteria for the process evaluation. TWD (Equation (1)) wascalculated as the ratio between the material removed from the electrode (MRT (mm3)) and the numberof discharges (N) recorded. The length of the tool wear was measured through a touching procedureexecuted in a reference position: the length of the electrode was measured before and after the singleEDM milling operation. The electrode wear volume was estimated starting from the tool wear length,considering the electrode as a cylindrical part.
TWD =MRT
N. (1)
MRD (Equation (2)) was calculated as the ratio between the material removed from the workpiece(MRW (mm3)), estimated from the confocal microscope measurements as the volume of micro-cavities,and the number of discharges (N), recorded during the machining of each cavity.
MRD =MRW
N. (2)
TWR (Equation (3)) was calculated as the ratio between TWD and MRD.
TWR =TWDMRD
=MRTMRW
. (3)
Finally, the machined surfaces were observed by scanning electron microscopy (SEM). Thesequalitative observations allowed analyzing the microscopic aspects and identifying the possiblepresence of imperfection related to the process.
Materials 2019, 12, x FOR PEER REVIEW 10 of 18
MRD (Equation (2)) was calculated as the ratio between the material removed from the workpiece (MRW (mm3)), estimated from the confocal microscope measurements as the volume of micro-cavities, and the number of discharges (N), recorded during the machining of each cavity. MRD = MRWN . (2)
TWR (Equation (3)) was calculated as the ratio between TWD and MRD. TWR = TWDMRD = MRTMRW. (3)
Finally, the machined surfaces were observed by scanning electron microscopy (SEM). These qualitative observations allowed analyzing the microscopic aspects and identifying the possible presence of imperfection related to the process.
Figure 8. Example of the machined surface.
3. Results and Discussion
Figure 9 shows the tool wear per discharge (TWD) divided by the energy of single discharge, as a function of the additive fraction and the pulse type.
The energy efficiency of TWD is lower for the pulse type A. This is a positive aspect because it indicates less impact on the electrode wear. It is possible to observe a common trend as a function of the additive fraction, an exception is represented by ZrB, which presents a large data scatter. The high variation in machining carried out on ZrB could be related to the high level of porosity, which generates an unstable and less repeatable process.
To evaluate the MRD in the correct way, the volume of the micro-slots was adjusted considering the relative density (δ) defined in Table 2. The MRD estimated as reported in Equation (4) was considered for the analysis. MRD = MRW ∙ δN = MRD ∙ δ. (4)
Figure 8. Example of the machined surface.
Materials 2019, 12, 3920 10 of 17
3. Results and Discussion
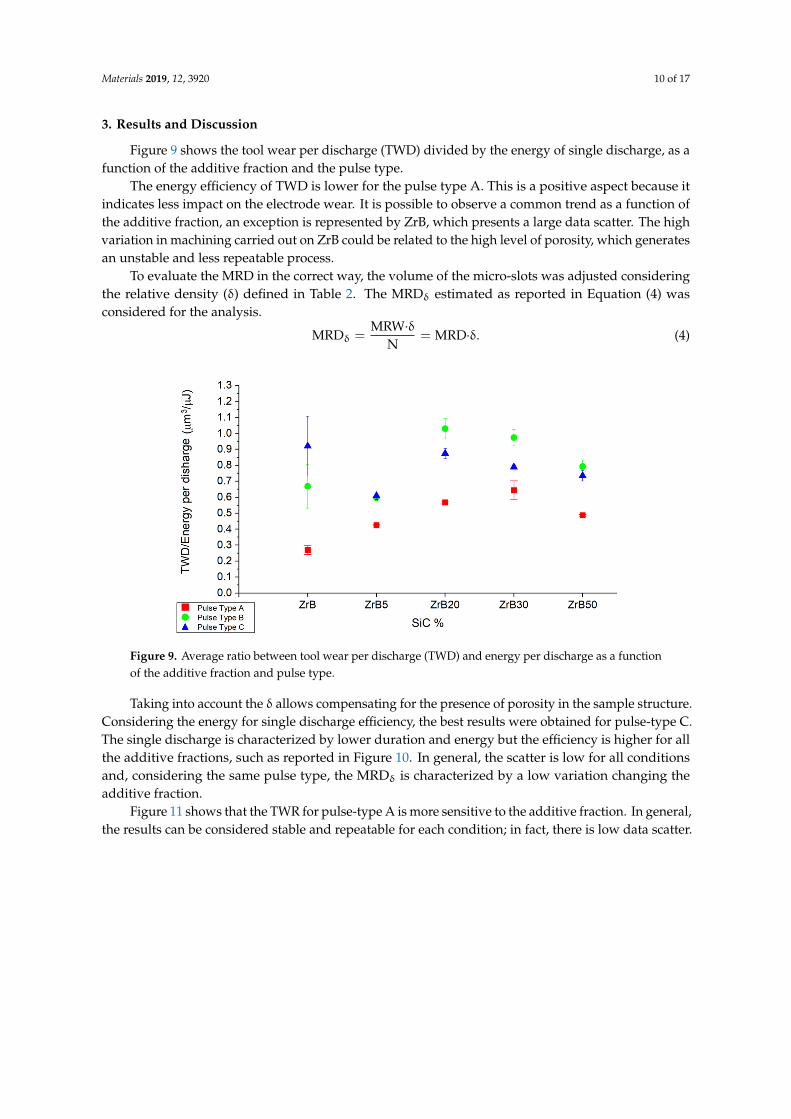
Figure 9 shows the tool wear per discharge (TWD) divided by the energy of single discharge, as afunction of the additive fraction and the pulse type.
The energy efficiency of TWD is lower for the pulse type A. This is a positive aspect because itindicates less impact on the electrode wear. It is possible to observe a common trend as a function ofthe additive fraction, an exception is represented by ZrB, which presents a large data scatter. The highvariation in machining carried out on ZrB could be related to the high level of porosity, which generatesan unstable and less repeatable process.
To evaluate the MRD in the correct way, the volume of the micro-slots was adjusted consideringthe relative density (δ) defined in Table 2. The MRDδ estimated as reported in Equation (4) wasconsidered for the analysis.
MRDδ =MRW·δ
N= MRD·δ. (4)
Materials 2019, 12, x FOR PEER REVIEW 11 of 18
Figure 9. Average ratio between tool wear per discharge (TWD) and energy per discharge as a function of the additive fraction and pulse type.
Taking into account the δ allows compensating for the presence of porosity in the sample structure. Considering the energy for single discharge efficiency, the best results were obtained for pulse-type C. The single discharge is characterized by lower duration and energy but the efficiency is higher for all the additive fractions, such as reported in Figure 10. In general, the scatter is low for all conditions and, considering the same pulse type, the MRD is characterized by a low variation changing the additive fraction.
Figure 11 shows that the TWR for pulse-type A is more sensitive to the additive fraction. In general, the results can be considered stable and repeatable for each condition; in fact, there is low data scatter.
Figure 10. Average ratio between material removal per discharge (MRD) and energy per discharge estimated considering the relative density, the additive fraction and pulse type.
Figure 9. Average ratio between tool wear per discharge (TWD) and energy per discharge as a functionof the additive fraction and pulse type.
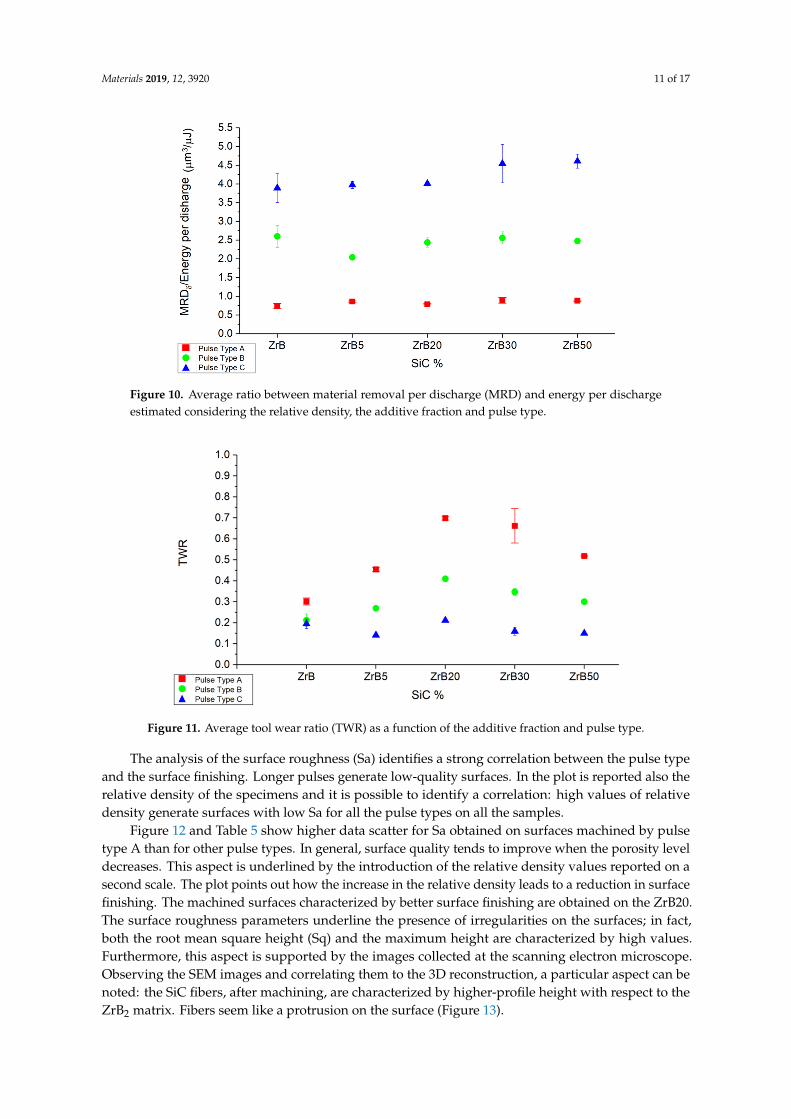
Taking into account the δ allows compensating for the presence of porosity in the sample structure.Considering the energy for single discharge efficiency, the best results were obtained for pulse-type C.The single discharge is characterized by lower duration and energy but the efficiency is higher for allthe additive fractions, such as reported in Figure 10. In general, the scatter is low for all conditionsand, considering the same pulse type, the MRDδ is characterized by a low variation changing theadditive fraction.
Figure 11 shows that the TWR for pulse-type A is more sensitive to the additive fraction. In general,the results can be considered stable and repeatable for each condition; in fact, there is low data scatter.
Materials 2019, 12, 3920 11 of 17
Materials 2019, 12, x FOR PEER REVIEW 11 of 18
Figure 9. Average ratio between tool wear per discharge (TWD) and energy per discharge as a function of the additive fraction and pulse type.
Taking into account the δ allows compensating for the presence of porosity in the sample structure. Considering the energy for single discharge efficiency, the best results were obtained for pulse-type C. The single discharge is characterized by lower duration and energy but the efficiency is higher for all the additive fractions, such as reported in Figure 10. In general, the scatter is low for all conditions and, considering the same pulse type, the MRD is characterized by a low variation changing the additive fraction.
Figure 11 shows that the TWR for pulse-type A is more sensitive to the additive fraction. In general, the results can be considered stable and repeatable for each condition; in fact, there is low data scatter.
Figure 10. Average ratio between material removal per discharge (MRD) and energy per discharge estimated considering the relative density, the additive fraction and pulse type.
Figure 10. Average ratio between material removal per discharge (MRD) and energy per dischargeestimated considering the relative density, the additive fraction and pulse type.Materials 2019, 12, x FOR PEER REVIEW 12 of 18
Figure 11. Average tool wear ratio (TWR) as a function of the additive fraction and pulse type.
The analysis of the surface roughness (Sa) identifies a strong correlation between the pulse type and the surface finishing. Longer pulses generate low-quality surfaces. In the plot is reported also the relative density of the specimens and it is possible to identify a correlation: high values of relative density generate surfaces with low Sa for all the pulse types on all the samples.
Figure 12 and Table 5 show higher data scatter for Sa obtained on surfaces machined by pulse type A than for other pulse types. In general, surface quality tends to improve when the porosity level decreases. This aspect is underlined by the introduction of the relative density values reported on a second scale. The plot points out how the increase in the relative density leads to a reduction in surface finishing. The machined surfaces characterized by better surface finishing are obtained on the ZrB20. The surface roughness parameters underline the presence of irregularities on the surfaces; in fact, both the root mean square height (Sq) and the maximum height are characterized by high values. Furthermore, this aspect is supported by the images collected at the scanning electron microscope. Observing the SEM images and correlating them to the 3D reconstruction, a particular aspect can be noted: the SiC fibers, after machining, are characterized by higher-profile height with respect to the ZrB2 matrix. Fibers seem like a protrusion on the surface (Figure 13).
Figure 12. Average values and standard deviation of surface roughness (Sa).
Table 5. Average values of main surface roughness parameters.
Material Pulse Type Sa
(μm) Sz
(μm)
Figure 11. Average tool wear ratio (TWR) as a function of the additive fraction and pulse type.
The analysis of the surface roughness (Sa) identifies a strong correlation between the pulse typeand the surface finishing. Longer pulses generate low-quality surfaces. In the plot is reported also therelative density of the specimens and it is possible to identify a correlation: high values of relativedensity generate surfaces with low Sa for all the pulse types on all the samples.
Figure 12 and Table 5 show higher data scatter for Sa obtained on surfaces machined by pulsetype A than for other pulse types. In general, surface quality tends to improve when the porosity leveldecreases. This aspect is underlined by the introduction of the relative density values reported on asecond scale. The plot points out how the increase in the relative density leads to a reduction in surfacefinishing. The machined surfaces characterized by better surface finishing are obtained on the ZrB20.The surface roughness parameters underline the presence of irregularities on the surfaces; in fact,both the root mean square height (Sq) and the maximum height are characterized by high values.Furthermore, this aspect is supported by the images collected at the scanning electron microscope.Observing the SEM images and correlating them to the 3D reconstruction, a particular aspect can benoted: the SiC fibers, after machining, are characterized by higher-profile height with respect to theZrB2 matrix. Fibers seem like a protrusion on the surface (Figure 13).

Materials 2019, 12, 3920 12 of 17
Materials 2019, 12, x FOR PEER REVIEW 12 of 18
Figure 11. Average tool wear ratio (TWR) as a function of the additive fraction and pulse type.
The analysis of the surface roughness (Sa) identifies a strong correlation between the pulse type and the surface finishing. Longer pulses generate low-quality surfaces. In the plot is reported also the relative density of the specimens and it is possible to identify a correlation: high values of relative density generate surfaces with low Sa for all the pulse types on all the samples.
Figure 12 and Table 5 show higher data scatter for Sa obtained on surfaces machined by pulse type A than for other pulse types. In general, surface quality tends to improve when the porosity level decreases. This aspect is underlined by the introduction of the relative density values reported on a second scale. The plot points out how the increase in the relative density leads to a reduction in surface finishing. The machined surfaces characterized by better surface finishing are obtained on the ZrB20. The surface roughness parameters underline the presence of irregularities on the surfaces; in fact, both the root mean square height (Sq) and the maximum height are characterized by high values. Furthermore, this aspect is supported by the images collected at the scanning electron microscope. Observing the SEM images and correlating them to the 3D reconstruction, a particular aspect can be noted: the SiC fibers, after machining, are characterized by higher-profile height with respect to the ZrB2 matrix. Fibers seem like a protrusion on the surface (Figure 13).
Figure 12. Average values and standard deviation of surface roughness (Sa).
Table 5. Average values of main surface roughness parameters.
Material Pulse Type Sa
(μm) Sz
(μm)
Figure 12. Average values and standard deviation of surface roughness (Sa).
Table 5. Average values of main surface roughness parameters.
Material Pulse Type Sa (µm) Sz (µm)
ZrBA 2.385 23.610B 1.335 15.544C 0.600 8.898
ZrB5A 2.075 22.466B 1.321 17.590C 0.631 13.569
ZrB20A 1.720 17.763B 0.904 11.430C 0.439 7.644
ZrB30A 2.221 24.999B 1.154 17.144C 0.525 13.538
ZrB50A 1.961 27.203B 1.177 24.310C 0.570 15.387
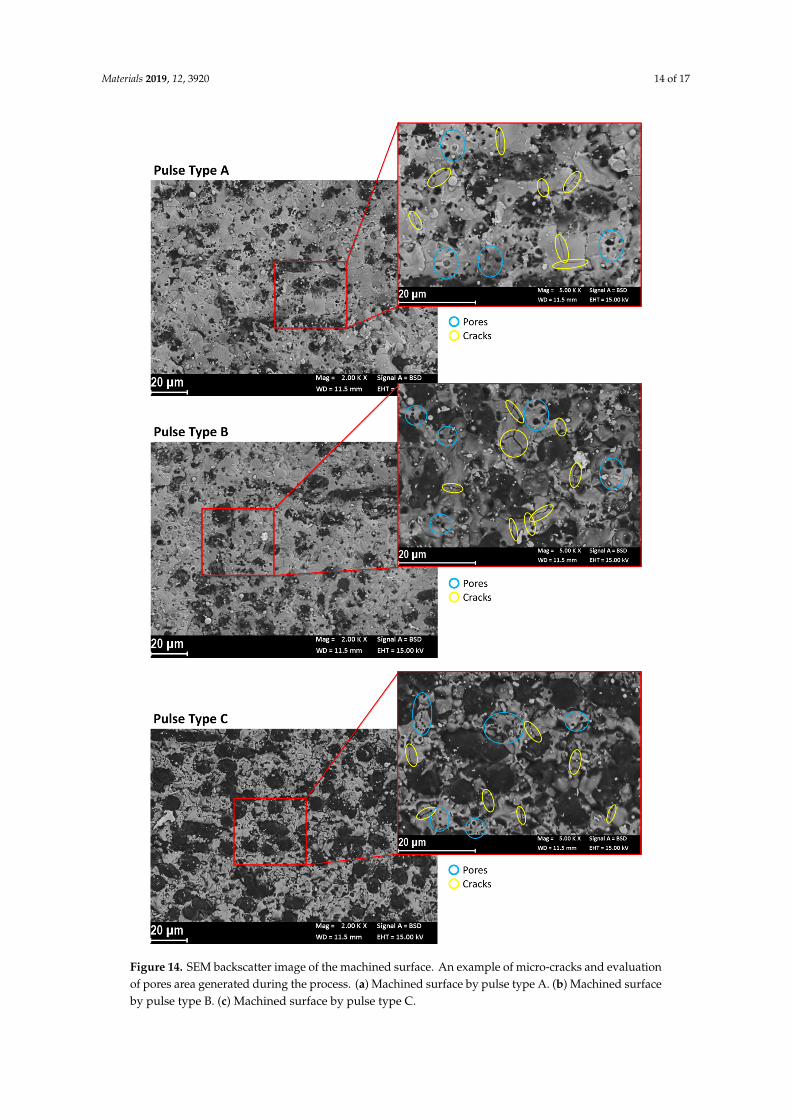
Another aspect identified thanks to the backscatter SEM images is the surface texture. The imagesshow a non-uniform aspect of the recast layer. This represents a relevant difference comparing thesesurfaces to the metal ones. In fact, metal workpieces (e.g., stainless steel or aluminum) usually showa uniform structure on surfaces with well-defined craters. On these ceramic materials, the textureshows some microcracks and pores. Figure 14 shows some examples of the topography of machinedsurfaces. The pores are probably related to the formation of gas bubbles and their “explosion” duringthe removal process. The dimensions of the pores, in terms of area and numerosity, are characterized bya high level of variability; in particular, shorter pulses generate less and smaller pores. The microcracksmorphology is comparable to the typical structure, which indicates the occurrence of an oxidizedsurface. This aspect might be related to a hot oxidation process or chemical oxidation due to thepresence of oxygen in the dielectric medium. It is not to underestimate the possibility of a chemicaloxidation process enhanced by the high temperature reached during the EDM process in the machinedarea. The microcracks formed as a result of an oxidation process are created due to the different thermalcoefficients, which characterize the oxidized surface and the raw workpiece material. This means thatthe microcracks affect only the thickness of the recast layer. Then, these microcracks do not impacton fatigue resistance during the activity of the produced parts. The oxide is more fragile than thebase material and then, in the worst case, the oxide could detach from it. Further investigation couldinvolve the analysis of the structure and the inner part of the microcracks by means of the micro-CT

Materials 2019, 12, 3920 13 of 17
scan. The extension of the recast layer is reduced by short pulses; in fact, on the surfaces processedby pulse type C, it is possible to clearly identify the SiC fibers, which are difficult to be observed onsurfaces machined with long pulses.
Materials 2019, 12, x FOR PEER REVIEW 13 of 18
ZrB A 2.385 23.610 B 1.335 15.544 C 0.600 8.898
ZrB5 A 2.075 22.466 B 1.321 17.590 C 0.631 13.569
ZrB20 A 1.720 17.763 B 0.904 11.430 C 0.439 7.644
ZrB30 A 2.221 24.999 B 1.154 17.144 C 0.525 13.538
ZrB50 A 1.961 27.203 B 1.177 24.310 C 0.570 15.387
Figure 13. Details of a SiC fiber (backscattering magnification 500×–3D reconstruction magnification 100×).
Another aspect identified thanks to the backscatter SEM images is the surface texture. The images show a non-uniform aspect of the recast layer. This represents a relevant difference comparing these surfaces to the metal ones. In fact, metal workpieces (e.g., stainless steel or aluminum) usually show a uniform structure on surfaces with well-defined craters. On these ceramic materials, the texture shows some microcracks and pores. Figure 14 shows some examples of the topography of machined surfaces. The pores are probably related to the formation of gas bubbles and their “explosion” during the removal process. The dimensions of the pores, in terms of area and numerosity, are characterized by a high level of variability; in particular, shorter pulses generate less and smaller pores. The microcracks morphology is comparable to the typical structure, which indicates the occurrence of an oxidized surface. This aspect might be related to a hot oxidation process
Figure 13. Details of a SiC fiber (backscattering magnification 500×–3D reconstruction magnification 100×).
All these observations suggest that this kind of material is not affected by the typical EDM materialremoval mechanism. The protrusion of the SiC fibers suggests that these parts are not affected bythe sparks because of their low electrical conductivity property. Despite the presence of microcracksand pores, there are no fracture surfaces; therefore, it is possible to exclude a mechanical removalmechanism. The available material removal mechanism models of EDM are focused on the sparkserosion with melting and vaporization of workpiece material. Anyhow, in EDM of low conductivematerials, the removal mechanism is not well-known and the main hypothesis suggests randomspalling, oxidation and decomposition due to alternating thermal stress. This is in agreement with theliterature outcomes [30,31].
Materials 2019, 12, 3920 14 of 17
Materials 2019, 12, x FOR PEER REVIEW 15 of 18
Materials 2019, 12, x FOR PEER REVIEW 16 of 18
Figure 14. SEM backscatter image of the machined surface. An example of micro-cracks and evaluation of pores area generated during the process. (a) Machined surface by pulse type A. (b) Machined surface by pulse type B. (c) Machined surface by pulse type C.
4. Conclusions
A machinability evaluation of advanced ceramic materials composed by ZrB2 based matrix hot-pressed with different fractions of non-reactive additive (SiC) was performed in this work. The stability and repeatability of the μEDM process were investigated to identify if the additive fraction influences the process results.
The first step was the characterization of discharges to feature the different pulse types. In this way, it was possible to: • Define the real value of process parameters such as peak current, pulse duration and energy of
each discharge; • Analyze the discharges distribution highlighting the good reproducibility and stability of the
performed tests. Process performance was evaluated taking into account the energy per discharge to analyze the
energy efficiency of the process. Both for the TWD and MRD analysis, the short pulses resulted to be the ones with higher energy efficiency. Low energy per discharge had a higher impact on the material removal rate on both tool and workpiece. The high energy efficiency was positive from the MRD point of view; on the contrary, for the TWD point of view, it was a negative result because it involved higher electrode wear.
In general, there was not a sample with better results than others in terms of overall process performance. An exception could be the ZrB, which was characterized by high scatter data, so the performance was not so repeatable as for other samples. Considering the surface roughness, ZrB20 presents an improvement in the surface quality in comparison to the other materials. This aspect was probably related to the low level of porosity and the high mechanical properties typical of these materials.
The machined surface topography demonstrates that the EDM process on UHTCs materials was characterized by different material removal mechanisms with respect to the EDM machining of well-known materials (e.g., metals). Not only melting and vaporization processes, but also other phenomena, such as oxidation, were involved in the removal of material. The typical phenomena of melting and vaporization were characterized by a lower efficiency because of the high melting temperature and the presence of non-electrically (or low-electrically) conductive parts in the workpiece.
Figure 14. SEM backscatter image of the machined surface. An example of micro-cracks and evaluationof pores area generated during the process. (a) Machined surface by pulse type A. (b) Machined surfaceby pulse type B. (c) Machined surface by pulse type C.

Materials 2019, 12, 3920 15 of 17
4. Conclusions
A machinability evaluation of advanced ceramic materials composed by ZrB2 based matrixhot-pressed with different fractions of non-reactive additive (SiC) was performed in this work.The stability and repeatability of the µEDM process were investigated to identify if the additive fractioninfluences the process results.
The first step was the characterization of discharges to feature the different pulse types. In this way,it was possible to:
• Define the real value of process parameters such as peak current, pulse duration and energy ofeach discharge;
• Analyze the discharges distribution highlighting the good reproducibility and stability of theperformed tests.
Process performance was evaluated taking into account the energy per discharge to analyze theenergy efficiency of the process. Both for the TWD and MRD analysis, the short pulses resulted to bethe ones with higher energy efficiency. Low energy per discharge had a higher impact on the materialremoval rate on both tool and workpiece. The high energy efficiency was positive from the MRD pointof view; on the contrary, for the TWD point of view, it was a negative result because it involved higherelectrode wear.
In general, there was not a sample with better results than others in terms of overall processperformance. An exception could be the ZrB, which was characterized by high scatter data, sothe performance was not so repeatable as for other samples. Considering the surface roughness,ZrB20 presents an improvement in the surface quality in comparison to the other materials. Thisaspect was probably related to the low level of porosity and the high mechanical properties typical ofthese materials.
The machined surface topography demonstrates that the EDM process on UHTCs materialswas characterized by different material removal mechanisms with respect to the EDM machiningof well-known materials (e.g., metals). Not only melting and vaporization processes, but also otherphenomena, such as oxidation, were involved in the removal of material. The typical phenomenaof melting and vaporization were characterized by a lower efficiency because of the high meltingtemperature and the presence of non-electrically (or low-electrically) conductive parts in the workpiece.
Formation of cracks in the ZrB matrix were observed for pulses type A and B, characterizedby higher energy content. For pulses type C, with lower energy content, cracks were not observed.The formation of cracks during EDM processing of the investigated materials generated concerns whenthese were to be subjected to cyclic loading conditions in operations, particularly if involving tensileloads. The results of the present investigation clearly show that, in such cases, a finishing pass withlow energy pulses is a mandatory step to ensure structural integrity. The fatigue performance of suchmaterials as a function of the process parameter combinations shall be characterized.
Author Contributions: Conceptualization, M.Q., G.B. and G.D.; methodology, M.Q., G.B. and G.D.; software, M.Q.,G.B.; formal analysis, M.Q.; data curation, M.Q., G.B.; Writing—original draft preparation, M.Q., Writing—reviewand editing, G.B., G.D.; supervision, G.B., G.D.
Funding: This research received no external funding
Acknowledgments: The authors would like to thank Diletta Sciti and Laura Silvestroni from ISTEC–CNR ofFaenza (Ravenna, Italy) for the production and supply of the materials used in this study.
Conflicts of Interest: The authors declare no conflict of interest.
References
1. Scatteia, L.; Monteverde, F.; Alfano, D.; Cantoni, S. Advances in ultra high temperature ceramics for hotstructures. Trans. JSASS Sp. Tech. Jpn. 2009, 7, 73–78. [CrossRef]
Materials 2019, 12, 3920 16 of 17
2. Upadhya, K.; Yang, J.M.; Hoffman, W. Advanced materials for ultrahigh temperature structural applicationsabove 2000 ◦C. Am. Ceram. Soc. Bull. 1997, 58, 51–56.
3. Levine, S.R.; Opila, E.J.; Halbig, M.C.; Kiser, J.D.; Singh, M.; Salem, J.A. Evaluation of ultra-high temperatureceramics for aeropropulsion use. J. Eur. Ceram. Soc. 2002, 22, 2757–2767. [CrossRef]
4. Justin, J.F.; Jankowiak, A. Ultra high temperature ceramics: densification, properties and thermal stability.AerospaceLab J. 2011, 3, AL3-08.
5. Saccone, G.; Gardi, R.; Alfano, D.; Ferrigno, A.; Del Vecchio, A. Laboratory, on-ground and in-flightinvestigation of ultra high temperature ceramic composite materials. Aerosp. Sci. Technol. 2016, 58, 490–497.[CrossRef]
6. Liew, L.A.; Zhang, W.; An, L.; Shah, S.; Luo, R.; Liu, Y.; Cross, T.; Dunn, M.L.; Bright, V.; Daily, J.W.; et al.Ceramic MEMS new materials, innovative processing and future applications. Am. Ceram. Soc. Bull. 2001,80, 25–30.
7. Opeka, M.M.; Talmy, I.G.; Zaykoski, J.A. Oxidation-based materials selection for 2000 ◦C + hypersonicaerosurfaces: theoretical considerations and historical experience. J. Mater. Sci. 2004, 39, 5887–5904.[CrossRef]
8. Opeka, M.M.; Talmy, I.G.; Wuchina, E.J.; Zaykoski, J.A.; Causey, S.J. Mechanical, thermal, and oxidationproperties of refractory hafnium and zirconium compounds. J. Eur. Ceram. Soc. 1999, 19, 2405–2414.[CrossRef]
9. Monteverde, F.; Guicciardi, S.; Bellosi, A. Advances in microstructure and mechanical properties of zirconiumdiboride based ceramics. Mater. Sci. Eng. A 2003, 346, 310–319. [CrossRef]
10. Hirsch, M.J. Comments on a california proposal to merge medical and optometrical state boards of examiners.Optom. Vis. Sci. 1967, 44, 821–822. [CrossRef]
11. Fahrenholtz, W.G.; Hilmas, G.E.; Talmy, I.G.; Zaykoski, J.A. Refractory diborides of zirconium and hafnium.J. Am. Ceram. Soc. 2007, 90, 1347–1364. [CrossRef]
12. Bellosi, A.; Monteverde, F. Ultra-high temperature ceramics: microstructure control and propertiesimprovement related to materials design and processing procedures. Eur. Sp. Agency, Special Publ.ESA SP 2006, 1–8.
13. Silvestroni, L.; Landi, E.; Bejtka, K.; Chiodoni, A.; Sciti, D. Oxidation behavior and kinetics of ZrB2 containingsic chopped fibers. J. Eur. Ceram. Soc. 2015, 35, 4377–4387. [CrossRef]
14. Silvestroni, L.; Failla, S.; Neshpor, I.; Grigoriev, O. Method to improve the oxidation resistance of ZrB2-basedceramics for reusable space systems. J. Eur. Ceram. Soc. 2018, 38, 2467–2476. [CrossRef]
15. Chamberlain, A.L.; Fahrenholtz, W.G.; Hilmas, G.E.; Ellerby, D.T. High-strength zirconium diboride-basedceramics. J. Am. Ceram. Soc. 2004, 87, 1170–1172. [CrossRef]
16. Rezaie, A.; Fahrenholtz, W.G.; Hilmas, G.E. The effect of a graphite addition on oxidation of ZrB2-SiC in airat 1500 ◦C. J. Eur. Ceram. Soc. 2013, 33, 413–421. [CrossRef]
17. Hwang, S.S.; Vasiliev, A.L.; Padture, N.P. Improved processing and oxidation-resistance of ZrB2 ultra-hightemperature ceramics containing SiC nanodispersoids. Mater. Sci. Eng. A 2007, 464, 216–224. [CrossRef]
18. Zhang, X.; Liu, R.; Zhang, X.; Zhu, Y.; Sun, W.; Xiong, X. Densification and ablation behavior of ZrB2 ceramicwith SiC and/or Fe additives fabricated at 1600 and 1800 ◦C. Ceram. Int. 2016, 42, 17074–17080. [CrossRef]
19. Zhang, L.; Kurokawa, K. Effect of SiC addition on oxidation behavior of ZrB2 at 1273 K and 1473 K. Oxid.Met. 2016, 85, 311–320. [CrossRef]
20. Gadow, R.; Landfried, R.; Kern, F. Materials and Process Development for Wear Resistant Precision Tools withHigh Geometrical Complexity. In Proceedings of the III Advanced Ceramics and Applications Conference,Belgrade, Serbia; 2014; pp. 25–32.
21. Yongfeng, G.; Yerui, F.; Li, W.; Kelie, D.; Changjin, M.; Lin, T. Experimental Investigation of EDM Parametersfor ZrB2-SiC Ceramics Machining. In Procedia CIRP; Elsevier B.V.: Amsterdam, The Netherlands, 2018;Volume 68, pp. 46–51.
22. Li, H.; Wang, Y.; Wang, Z.; Zhao, Z. Fabrication of ZrB2–SiC–graphite ceramic micro-nozzle by micro-EDMsegmented milling. J. Micromechanics Microengineering 2018, 28, 105022. [CrossRef]
23. Ferraris, E.; Vleugels, J.; Guo, Y.; Bourell, D.; Kruth, J.P.; Lauwers, B. Shaping of engineering ceramics byelectro, chemical and physical processes. CIRP Ann.-Manuf. Technol. 2016, 65, 761–784. [CrossRef]
24. Silvestroni, L.; Sciti, D.; Melandri, C.; Guicciardi, S. Toughened ZrB2-based ceramics through SiC whisker orSiC chopped fiber additions. J. Eur. Ceram. Soc. 2010, 30, 2155–2164. [CrossRef]

Materials 2019, 12, 3920 17 of 17
25. Raji, A.O.; Ahemen, S.A. Engineering Properties of Tacca Involucrata Tubers. J. Food Process. Eng. 2011, 34,267–280. [CrossRef]
26. Sciti, D.; Guicciardi, S.; Silvestroni, L. SiC chopped fibers reinforced ZrB2: effect of the sintering aid. Scr.Mater. 2011, 64, 769–772. [CrossRef]
27. Monteverde, F.; Silvestroni, L. Combined effects of WC and SiC on densification and thermo-mechanicalstability of ZrB2ceramics. Mater. Des. 2016, 109, 396–407. [CrossRef]
28. Bissacco, G.; Hansen, H.N.; Tristo, G.; Valentincic, J. Feasibility of wear compensation in micro EDM millingbased on discharge counting and discharge population characterization. CIRP Ann.-Manuf. Technol. 2011, 60,231–234. [CrossRef]
29. Geometrical product Specification (GPS)–Surface Texture: Areal; 25178: 2017; CEN-CENELEC ManagementCentre: Brussels, Belgium, 2017.
30. Lauwers, B.; Kruth, J.P.; Liu, W.; Eeraerts, W.; Schacht, B.; Bleys, P. Investigation of material removalmechanisms in EDM of composite ceramic materials. J. Mater. Process. Technol. 2004, 149, 347–352. [CrossRef]
31. Trueman, C.; Huddleston, J. Material removal by spalling during EDM of ceramics. J. Eur. Ceram. Soc. 2000,20, 1629–1635. [CrossRef]
© 2019 by the authors. Licensee MDPI, Basel, Switzerland. This article is an open accessarticle distributed under the terms and conditions of the Creative Commons Attribution(CC BY) license (http://creativecommons.org/licenses/by/4.0/).