M&A project.
25
March 8, 2015 2015 Merger and Acquisition – Project Submitted to: Dr. Sheeba Kapil INDIAN INSTITUTE OF FOREIGN TRADE [ ] GROUP- 1 (EPGDIB VSAT-2014-15) Name Roll No Sanjay Vaid 47 Puneet Diwan 39 Narendra Kumar 31 Komal Grovar 24 Anuj Abrol 10
-
Upload
sanjay-vaid -
Category
Education
-
view
152 -
download
2
Transcript of M&A project.

Ma
rc
h 8
, 2
01
5
2015
Merger and Acquisition – Project Submitted to: Dr. Sheeba Kapil
INDIAN INSTITUTE OF FOREIGN TRADE [ ]
GROUP- 1 (EPGDIB VSAT-2014-15)
Name Roll No
Sanjay Vaid 47
Puneet Diwan 39
Narendra Kumar 31
Komal Grovar 24
Anuj Abrol 10

Indian Institute of Foreign Trade
M e r g e r a n d A c q u i s i t i o n P r o j e c t
Page 1
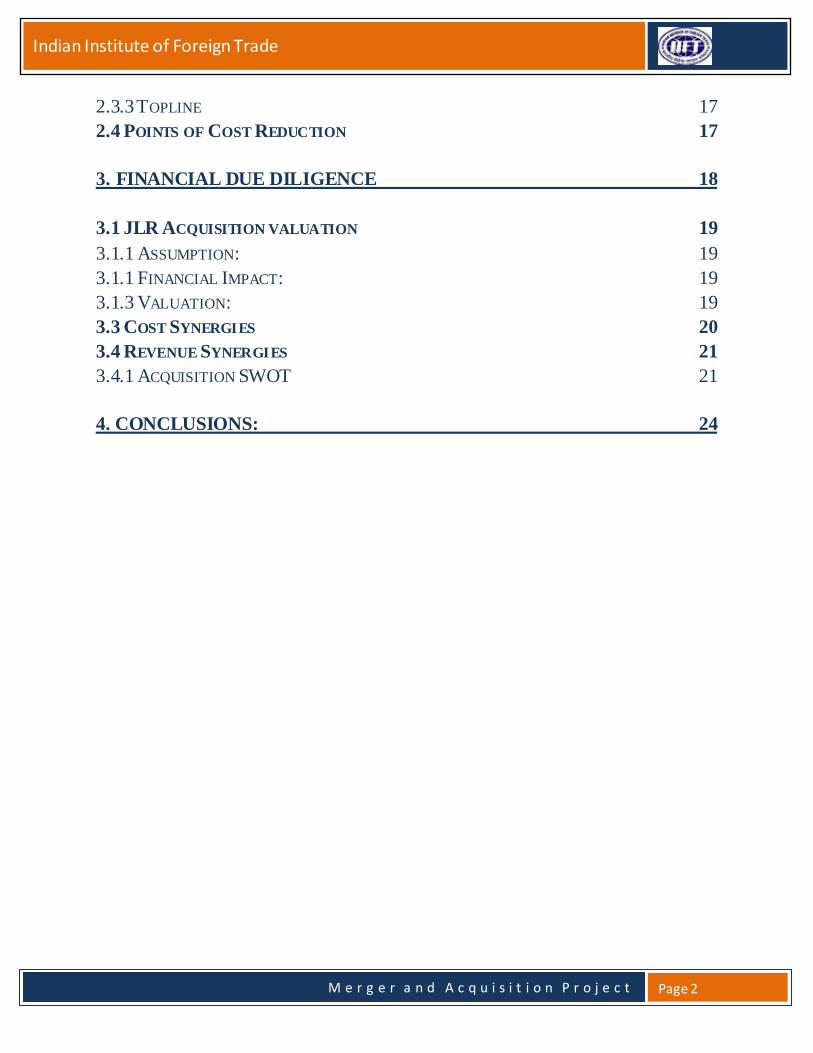
Table of Content
1. 3 COMPANY ANALYSIS:
1.1 TATA GROUP: 3
1.1.1 TATA GROUP SECTOR WISE: 3
1.1.2 MARKET CAPITALIZATIONS OF TATA GROUP COMPANIES: 4
1.1.1TATA MOTORS: 4
1.1.2.1 SWOT TATA MOTORS: 6
1.1.2.3: TATA Motors Strength 6
1.1.2.3 Tata Motors Weakness 6
1.1.2.4 Opportunities for Tata Motors: 7
1.1.2.5 Threats for Tata Motors: 7
1.2 FORD MOTORS 7
1.2.2 FORD SWOT ANALYSIS 8
1.2.3 Ford Motors Strength: 8
1.2.2 Ford Motors Weakness: 9
1.2.3 Opportunities for Ford Motor Company: 9
1.2.4 Threat to Ford Motors Company: 9
1.3 JAGUAR LAND ROVER: 10
1.2.1 JAGUAR LAND ROVER FINANCIALS: 10
1.3 BACK DROP OF M&A: 11
1.4 THE DEAL: 12
2. THE BENEFIT FROM ACQUISITION: 13
2.1 STRATEGIC BENEFIT: 14
2.2 UNDERSTANDING THE SOURCE OF SYNERGY GAINS 14
2.3 POINT OF REVENUE INCREASE. 15
2.3.1 MARKET CAPITALIZATION: 16
2.3.2 BRAND VALUE: 17
2.3.3 CASH FLOWS AND BOTTOM LINE 17
Indian Institute of Foreign Trade
M e r g e r a n d A c q u i s i t i o n P r o j e c t
Page 2
2.3.3 TOPLINE 17
2.4 POINTS OF COST REDUCTION 17
3. FINANCIAL DUE DILIGENCE 18
3.1 JLR ACQUISITION VALUATION 19
3.1.1 ASSUMPTION: 19
3.1.1 FINANCIAL IMPACT: 19
3.1.3 VALUATION: 19
3.3 COST SYNERGIES 20
3.4 REVENUE SYNERGIES 21
3.4.1 ACQUISITION SWOT 21
4. CONCLUSIONS: 24

Indian Institute of Foreign Trade
M e r g e r a n d A c q u i s i t i o n P r o j e c t
Page 3
1. Company Analysis:
1.1 Tata Group:
The Tata group’s core purpose is to improve the quality of life of the communities it serves
globally, through long-term stakeholder value creation based on leadership with trust .
Founded by Jamsetji Tata in 1868, the Tata group is a global enterprise headquartered in India,
and comprises over 100 operating companies, with operations in more than 100 countries
across six continents, exporting products and services to over 150 countries. The revenue of
Tata companies, taken together, was $103.27 billion (around Rs624,757 crore) in 2013 -14, with
67.2 percent of this coming from businesses outside India. Tata companies employ over
581,000 people worldwide.
Good corporate citizenship is part of the Tata group’s DNA. Sixty six percent of the equity of
Tata Sons, the promoter holding company, is held by philanthropic trusts, thereby returning
wealth to society. As a result of this unique ownership structure and ethos of serving the
community, the Tata name has been respected for more than 140 years and is trusted for its
adherence to strong values and business ethics.
Each Tata company or enterprise operates independently and has its own board of directors
and shareholders, to whom it is answerable. There are 32 publicly-listed Tata enterprises and
they have a combined market capitalisation of about $137.0 billion (as on 26th February 2015),
and a shareholder base of 3.9 million. Tata companies with significant scale include Tata Steel,
Tata Motors, Tata Consultancy Services , Tata Power, Tata Chemicals, Tata Global Beverages,
Tata Teleservices, Titan, Tata Communications and Indian Hotels.
1.1.1 Tata Group Sector Wise:
Indian Institute of Foreign Trade
M e r g e r a n d A c q u i s i t i o n P r o j e c t
Page 4
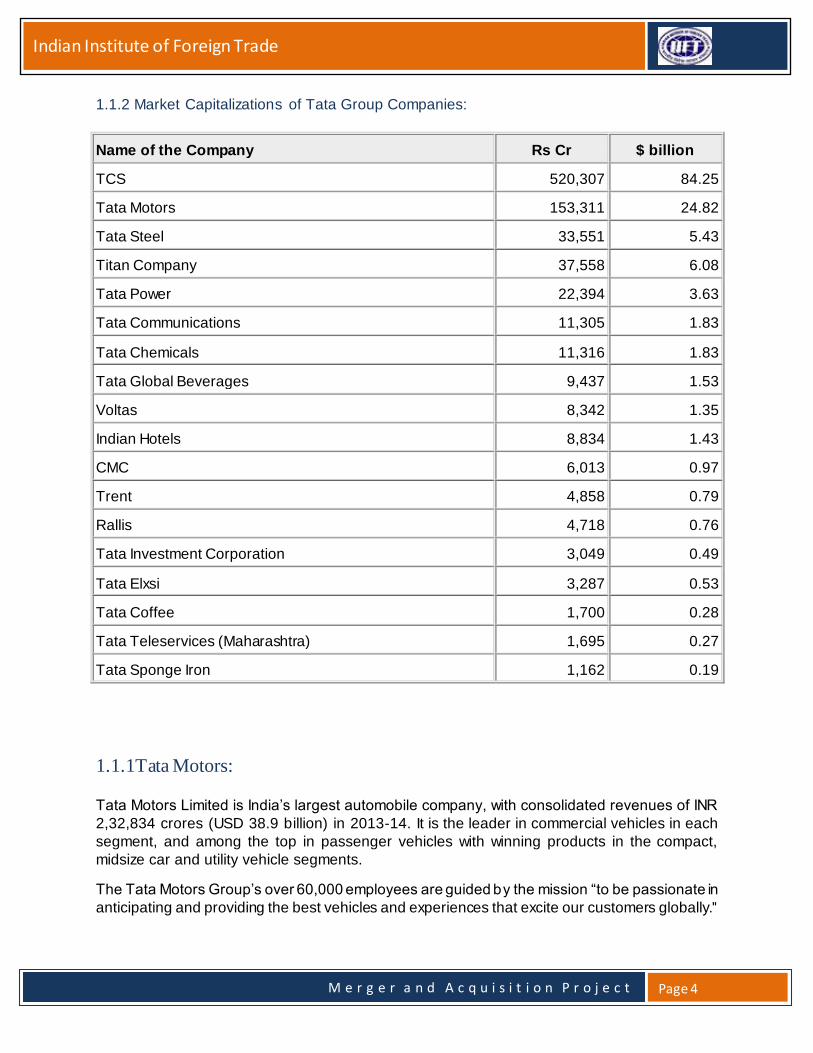
1.1.2 Market Capitalizations of Tata Group Companies:
Name of the Company Rs Cr $ billion
TCS 520,307 84.25
Tata Motors 153,311 24.82
Tata Steel 33,551 5.43
Titan Company 37,558 6.08
Tata Power 22,394 3.63
Tata Communications 11,305 1.83
Tata Chemicals 11,316 1.83
Tata Global Beverages 9,437 1.53
Voltas 8,342 1.35
Indian Hotels 8,834 1.43
CMC 6,013 0.97
Trent 4,858 0.79
Rallis 4,718 0.76
Tata Investment Corporation 3,049 0.49
Tata Elxsi 3,287 0.53
Tata Coffee 1,700 0.28
Tata Teleservices (Maharashtra) 1,695 0.27
Tata Sponge Iron 1,162 0.19
1.1.1Tata Motors:
Tata Motors Limited is India’s largest automobile company, with consolidated revenues of INR
2,32,834 crores (USD 38.9 billion) in 2013-14. It is the leader in commercial vehicles in each
segment, and among the top in passenger vehicles with winning products in the compact,
midsize car and utility vehicle segments.
The Tata Motors Group’s over 60,000 employees are guided by the mission “to be passionate in
anticipating and providing the best vehicles and experiences that excite our customers globally.''
Indian Institute of Foreign Trade
M e r g e r a n d A c q u i s i t i o n P r o j e c t
Page 5
Established in 1945, Tata Motors’ presence cuts across the length and breadth of India. Over 8
million Tata vehicles ply on Indian roads, since the first rolled out in 1954. The company’s
manufacturing base in India is spread across Jamshedpur (Jharkhand), Pune (Maharashtra),
Lucknow (Uttar Pradesh), Pantnagar (Uttarakhand), Sanand (Gujarat) and Dharwad
(Karnataka). Following a strategic alliance with Fiat in 2005, it has set up an industrial joint venture with Fiat Group Automobiles at Ranjangaon (Maharashtra) to produce both Fiat and
Tata cars and Fiat powertrains. The company’s dealership, sales, services and spare parts
network comprises over 6,600 touch points, across the world.
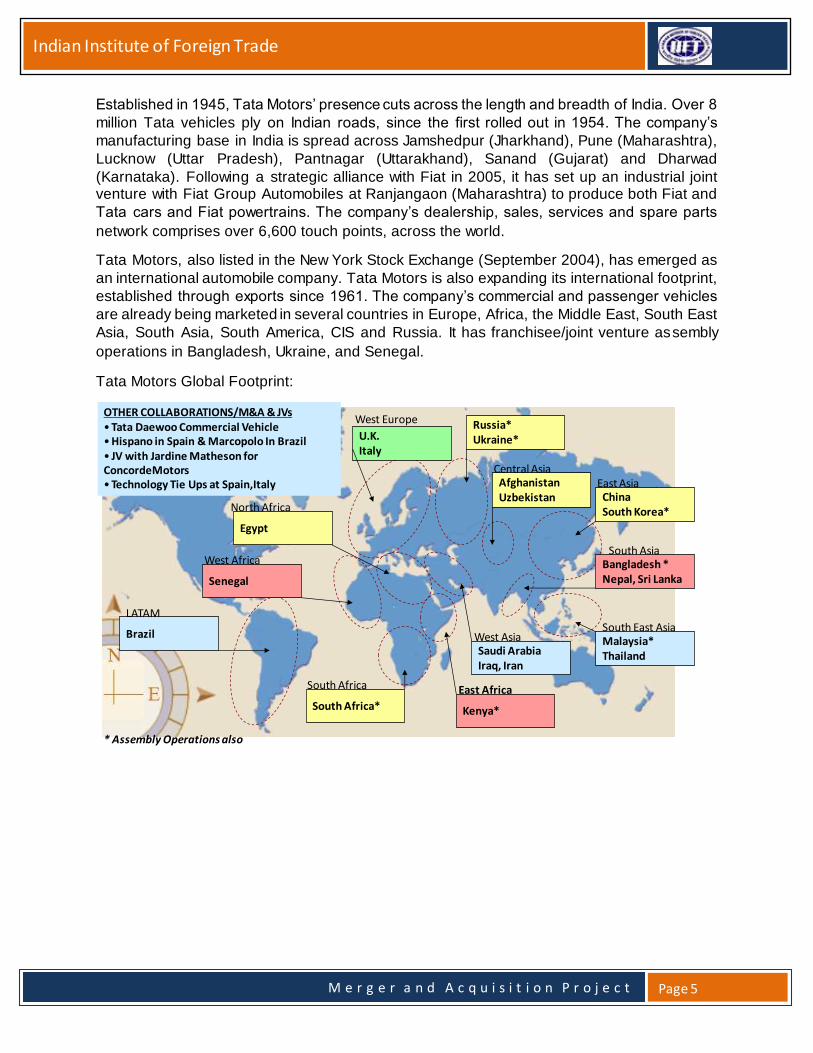
Tata Motors, also listed in the New York Stock Exchange (September 2004), has emerged as
an international automobile company. Tata Motors is also expanding its international footprint,
established through exports since 1961. The company’s commercial and passenger vehicles
are already being marketed in several countries in Europe, Africa, the Middle East, South East
Asia, South Asia, South America, CIS and Russia. It has franchisee/joint venture assembly
operations in Bangladesh, Ukraine, and Senegal.
Tata Motors Global Footprint:
Malaysia*Thailand
Bangladesh *Nepal, Sri Lanka
Kenya*
Russia*Ukraine* U.K.
Italy
Senegal
Afghanistan Uzbekistan
Brazil
South Africa*
Egypt
Saudi Arabia Iraq, Iran
China South Korea*
LATAM
West Africa
North Africa
West Europe
Central Asia East Asia
South Asia
South East Asia West Asia
East Africa South Africa
* Assembly Operations also
OTHER COLLABORATIONS/M&A & JVs•Tata Daewoo Commercial Vehicle•Hispano in Spain & Marcopolo In Brazil• JV with Jardine Matheson for ConcordeMotors•Technology Tie Ups at Spain,Italy

Indian Institute of Foreign Trade
M e r g e r a n d A c q u i s i t i o n P r o j e c t
Page 6
1.1.2.1 SWOT Tata Motors:
Following is the SWOT analysis of Tata Motors:
1.1.2.3: TATA Motors Strength
Excellent brand equity and strength in Indian Market.
Legacy and Dignity of Tata brand heritage which is as old as ford motors.
Sound global recognition in light trucks and bus.
Some fundamentals in turbo diesel engines that they developed in joint venture with
Cummins.
Sound presence in Asian Market.
Ownership of the heritage British motors brands – Land Rover Jaguar.
World class quality accreditations (ISO 9001, ISO 20000, ISO 14001)
Experienced, high quality, Productive and low cost work force.
Ownership of some of the largest automobile manufacturing plants of the world.
Diversification strengths due to other large businesses of Tata Group.
Excellent financial Strength - Revenue of USD 38.6 Billion.
Sound Parent group support – Tata Group revenue of 103.27 billion.
1.1.2.3 Tata Motors Weakness
Do not have history of done well in US, UK and Europe market.
For expanding and growing Jaguar Land Rover business or even managing the current
business Tata Motors seems to not have that level of exposed and experience human
resources and managers and would have to depend on Jaguar Land Rover
management skills.

Indian Institute of Foreign Trade
M e r g e r a n d A c q u i s i t i o n P r o j e c t
Page 7
Weak technical competencies when compared to companies like Ford Motors Company.
Yet to build Tata Motors are Global Brand.
1.1.2.4 Opportunities for Tata Motors:
Gain Control over UK and Europe market by re-enforcing the heritage of Jaguar and
Land Rover.
Tata Nano is a brand that can be taken to the world, needs long term branding
commitment.
Launch new products under Jaguar and Land product variants.
Leverage from the technology and process know how from Jaguar Land Rover to
improve the quality of other products.
Leverage from the enhanced economy of scale and scope.
1.1.2.5 Threats for Tata Motors:
Jaguar and Land Rover requires funds initially which might affect strip down their cash
level.
Inexperience of handling Unions in UK.
Increase completion in domestics market.
Reducing market share in domestic market.
1.2 Ford Motors
Ford Motor Company is an American multinational corporation and one of the world's largest
automaker based on worldwide vehicle sales. It has manufactures and distributes automobiles in
200 markets across six continents and has about 300,000 employees and 108 plants worldwide.
Ford now encompasses many global brands, including Lincoln and Mercury of the US, Jaguar
and Land Rover of the UK, and Volvo of Sweden and one-third controlling interest in Mazda as
well. Ford introduced methods for large-scale manufacturing of cars under different brands and
large-scale management of an industrial workforce and its combination of highly efficient
factories and low prices revolutionized manufacturing had made the company successfully
become a world leading auto manufacture.
Ford Motor Co., five-component disaggregation of ROE
ROE = Tax Burden ×Interest
Burden× EBIT Margin ×
Asset
Turnover× Leverage
Dec 31, 2014 12.85% 0.73 0.84 3.79% 0.65 8.48
Dec 31, 2013 27.12% 1.02 0.89 5.62% 0.68 7.72
Dec 31, 2012 35.52% 0.73 0.92 6.66% 0.66 12.06
Dec 31, 2011 134.50% 2.33 0.91 7.40% 0.72 11.93
Dec 31, 2010 – 0.92 0.80 7.51% 0.72 –
Source: Based on data from Ford Motor Co. Annual Reports

Indian Institute of Foreign Trade
M e r g e r a n d A c q u i s i t i o n P r o j e c t
Page 8
1.2.2 FORD SWOT Analysis
Following is the SWOT Analysis of Ford Motors Company:
1.2.3 Ford Motors Strength:
Innovation in Technology and Procedures like virtual assembly line, single supplier model, and
centralized global risk management frame work etc.
Commitment of technologies – like same spares can be used in multiple models in what they
termed as virtual assembly lines.
Excellent engineering and production workforce possessing global competencies as well as
capabilities of localization of products in respective countries.
Excellent Knowledge and analytics of the global market that helped them grow into truly global
company.
Capabilities to reach out to developing like India Indonesia etc and adjust to local geographical
condition while having strong market share in Developed countries.
Proud owner of some of the best car models of the world.
Excellent leadership and management strengths.
Ford Motor Co., four-way decomposition of ROA
ROA = Tax Burden ×Interest
Burden× EBIT Margin ×
Asset
Turnover
Dec 31, 2014 1.51% 0.73 0.84 3.79% 0.65
Dec 31, 2013 3.51% 1.02 0.89 5.62% 0.68
Dec 31, 2012 2.94% 0.73 0.92 6.66% 0.66
Dec 31, 2011 11.28% 2.33 0.91 7.40% 0.72
Dec 31, 2010 3.96% 0.92 0.80 7.51% 0.72
Source: Based on data from Ford Motor Co. Annual Reports
Ford Motor Co., EV calculation
Dec 31, 2014 Dec 31, 2013 Dec 31, 2012 Dec 31, 2011 Dec 31, 2010
No. shares of common stock outstanding 3,955,941,825 3,943,822,377 3,922,247,667 3,800,746,841 3,782,710,935
Share price (USD $) 16.30 15.39 12.99 12.53 15.05
USD $ in millionsCommon equity (market value) 64,482 60,695 50,950 47,623 56,930
Add: Equity attributable to noncontrolling interests
(per books) 27 33 42 43 31
Total equity 64,509 60,728 50,992 47,666 56,961
Add: Debt payable within one year (per books) 2,501 1,257 1,386 1,033 2,049
Add: Long-term debt, excluding payable within one
year (per books) 11,323 14,426 12,870 12,061 17,028
Total equity and debt 78,333 76,411 65,248 60,760 76,038
Less: Cash and cash equivalents 4,567 4,959 6,247 7,965 6,301
Less: Marketable securities 17,135 20,157 18,178 14,984 14,207
Enterprise value (EV) 56,631 51,295 40,823 37,811 55,530

Indian Institute of Foreign Trade
M e r g e r a n d A c q u i s i t i o n P r o j e c t
Page 9
Excellent marketing abilities in countries that are still out of reach of many competitors of Ford
Motors Company.
Excellent network of suppliers and supply chain management.
Excellent management of global workforce with less unionization except for UK where shop
floor militancy led to closure of Dagenham manufacturing plant.
1.2.2 Ford Motors Weakness:
Not successful in withstanding against competition like Toyota.
Falling sales and revenues (faced whopping $5.45 billion in 2001 that improved to $2 Billion loss
before the Jaguar and Land Rover companies were sold to Tata Motors India) poor financial
condition continuing for a number of years.
Yet to capitalize to their potential opportunities in Small and Medium segment where the motor
market is the largest.
Inability to establish sustainable markets in high end car models that led to sale of Land Rover
and Jaguar Car Models.
Losing strength in local US market.
High Debt but no tangible consolidated efforts of cost management – still believe in paying
premium in single supplier model. (Probably to support their core strength of Virtual assembly
lines and interchangeable parts).
No diversification – entire business dependent on automotive manufacturing and supply (except
Ford Finance which is not large enough to save the company from turmoil.)
No Parent Company – Hence all responsibility of make or break lies with Ford motor company.
1.2.3 Opportunities for Ford Motor Company:
Recovery of US and growth of US and global economies.
Growing motors market in small and medium segments in the third world countries.
Development of Hybrid cars and Electric Cars.
Growing economies in Asia where Ford is already present or can enter easily due to regional
strengths.
Promoting their powerful Volvo vehicles in the Bus and Truck markets of Asia where the local
brands like Tata Motors are very strong.
Local sourcing and Manufacturing in Emerging Markets like India.
1.2.4 Threat to Ford Motors Company:
The western car markets have been hit very badly due to stagnation and the current economic
crisis.
Stringent Emission norms in Europe, UK and US.
Japanese and Korean competitors are very aggressive in the western markets resulting in
reduced grip of Ford motor company in US market.
Poor customer service network and supply chain management in some of Emerging and
Developing countries..
Indian Institute of Foreign Trade
M e r g e r a n d A c q u i s i t i o n P r o j e c t
Page 10
1.3 Jaguar Land Rover:
Jaguar Land Rover is a Premium Car Maker headquartered in Whitley, Coventry, United
Kingdom. Its principal activity is the design, development, manufacture and sale of vehicles
bearing the Jaguar and Land Rover (including Range Rover) marques. Both marques have long
and complex histories prior to their merger going back to the 1940s, first coming together in
1968 as part of the ill-fated British Leyland conglomerate; and later existed independent of each
other as subsidiaries of BMW (in the case of Land Rover), and Ford (in the case of Jaguar);
Ford later acquired Land Rover from BMW in 2000 following the break-up of the former Rover
Group; which was effectively the remainder of British Leyland.
The Jaguar Land-Rover business employs over 16,000 people, predominantly in the UK,
including some 3,500 engineers at two product development centers, in Coventry and
Warwickshire. Jaguar Cars, founded in 1922, is one of the world's premier manufacturers of
luxury saloons and sports cars. Land Rover has been manufacturing 4x4s since 1948. Its
products have defined the segments in which they operate. JLR sell cars in almost 100
countries, supported by 18 National Sales Companies in major markets, and importers in
others. –
Jaguar Land Rover Automotive is a public limited company incorporated under the laws of
England and Wales (Company No. 06477691). The immediate parent undertaking of Jaguar
Land Rover Automotive PLC is TML Singapore Pte Limited and the ultimate parent undertak ing
and controlling party is Tata Motors Limited of India.
Jaguar Land Rover Automotive PLC's principal active subsidiaries are:
Jaguar Land Rover Holdings Limited Jaguar Land Rover Limited (designs, manufactures and sells Jaguar Cars and Land
Rover vehicles)
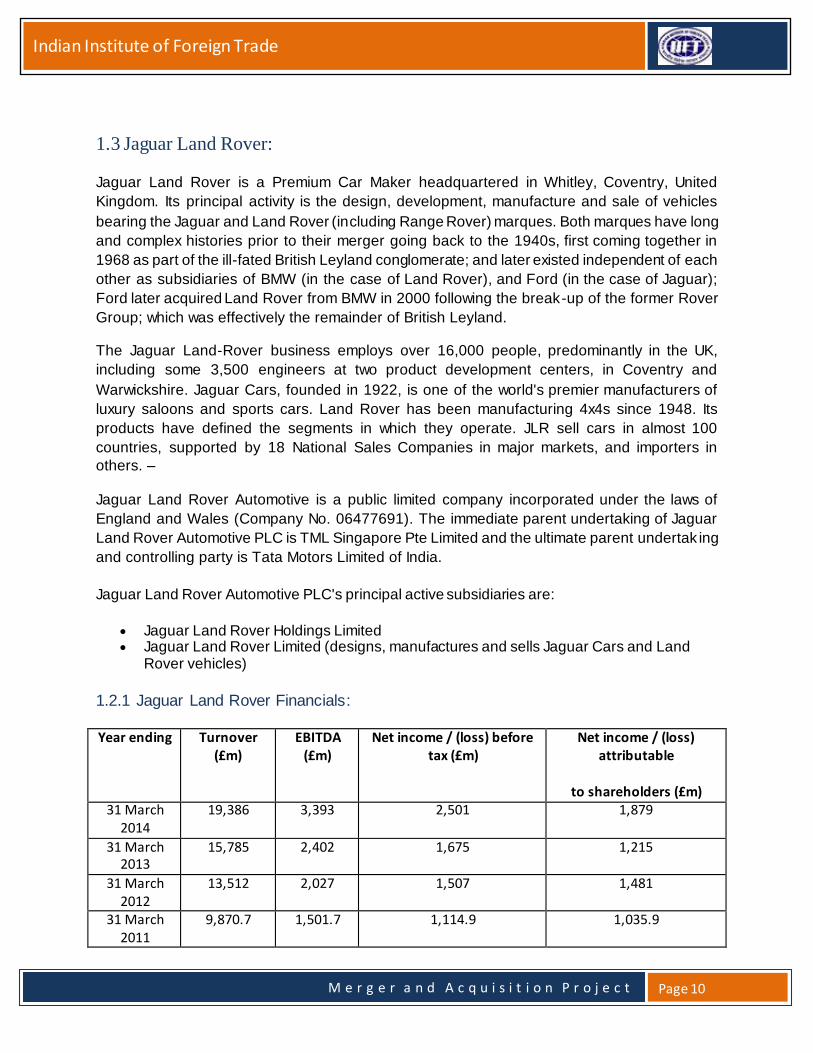
1.2.1 Jaguar Land Rover Financials:
Year ending Turnover (£m)
EBITDA (£m)
Net income / (loss) before tax (£m)
Net income / (loss) attributable
to shareholders (£m) 31 March
2014 19,386 3,393 2,501 1,879
31 March 2013
15,785 2,402 1,675 1,215
31 March 2012
13,512 2,027 1,507 1,481
31 March 2011
9,870.7 1,501.7 1,114.9 1,035.9

Indian Institute of Foreign Trade
M e r g e r a n d A c q u i s i t i o n P r o j e c t
Page 11
31 March 2010
6,527.2 349.1 51.4 23.5
31 March 2009
4,949.5 (83.9) (375.7) (402.4)
Year
ending
Turnover
(£m)
EBITDA
(£m)
Net income
/ (loss)
before tax
(£m)
Net income /
(loss) attributable
to shareholders
(£m)
31-Mar-14
19,386 3,393 2,501 1,879
31-Mar-13
15,785 2,402 1,675 1,215
31-Mar-12
13,512 2,027 1,507 1,481
31-Mar-11
9,870.70 1,501.70 1,114.90 1,035.90
31-Mar-
10 6,527.20 349.1 51.4 23.5
31-Mar-09
4,949.50 -83.9 -375.7 -402.4
1.3 Back Drop of M&A:
Ford Motors became cash strapped due to the US recession, and in order to save itself from bankruptcy they needed immediate cash flow. This lead to the sale of their luxury brands; Jaguar, Land Rover and Aston Martin, probably their biggest mistake ever.
Ford took over Jaguar in 1989 while Land Rover came under its wing much later in 2000. Both brands had iconic status in the market, but somehow Ford got it all wrong and failed to improvise, because of which JLR ran into losses worth billions.
On the other Hand Tata’s Majority of Sales were still in Domestic Market and for meeting their Global Ambition Jaguar Land Rover gave right platform, Market access and the access to the value chain – Manufacturing facility in Europe, Inbound Logistics, Operations – Production, Assembly, Testing, Outbound Logistic – Order Processing, Distribution, Marketing and Sales – Advertising, Sales Organization, Service, Procurement, Research and development, Human resources management and Infrastructure.

Indian Institute of Foreign Trade
M e r g e r a n d A c q u i s i t i o n P r o j e c t
Page 12
Ford had bought Jaguar and Land Rover brands for approximately $5.3 billion and sold it to
Tata Motors for just $2.3 billion in 2008
.
An Automobile Manufacture Typical Manufacturing Stage.
1.4 The Deal: 1.4.1 On 12 June 2007, Ford announced its plan to sell Land Rover and Jaguar.
1.4.2 August 2007 Major bidder for JLR were:
1.4.2.1 TATA Motors
1.4.2.2 Mahindra & Mahindra
1.4.2.3 Cereberus Capital Management
1.4.2.4 TPG Capital.
1.4.2.5 Apollo Management
1.4.3 03 January, 2008 Ford announces TATA as the preferred bidders.
1.4.4 26th March 2008 Ford agreed to sell their Jaguar Land Rover operations to Tata Motors.
1.4.5 2ndJune 2008 Acquisition was complete.
1.4.6 This was a Horizontal Acquisition where TATA Motors had acquired a company in
1.4.7 The Deal took over 2 years to agree- which helped the post –merger integration, also Tata
recognized that it would continue to need support from Ford who is main supplier of car
component to the two brands.
1.4.8 Legal Facilitators:
1.4.8.1 Ford Financial Advisor Glodman Sachs, HSBC Investment Bank, KPMG, Morgan Stanley.
1.4.8.2 TATA Motors Financial Advisor: JP Morgan; CitiBank
1.4.8.3 Ford legal advisor: Lovells, Blanke, Cassels & Graydon, Hogan & Hartson.
1.4.9 Tata Motors legal advisor: Allen & Overy, Herbert Smith, Gleiss Lutz, Stibbe.
1.4.10 $2.3 billion paid to Ford + $ 0.7 billion towards Working Capital = $ 3 Billion Bridge Loan.
1.4.11 Ford agreed to pay $ 600 million towards Pension Funds.
Production of engine
Component Engine assembly
Production of other components
Building
vehicle
bodies
Painting
Vehicle bodies
Vehicle
Assembly
Stamp Vehicle
body parts

Indian Institute of Foreign Trade
M e r g e r a n d A c q u i s i t i o n P r o j e c t
Page 13
1.4.12 Refinancing of Bridge Loan:
Point in Time Source Amount Jan 2005 Sale of Stake in Tata Steel &
Tata Tele Services to other group companies.
$ 1.11 billion
April 2009 Secured Non Convertible Debentures (NCD)
$ 0.89 billion
May 2009 External Commercial Borrowing (ECB)
$ 1 billion
Refinance Concluded in May 2009 Total $ 3 billon
1.4.12 Jaguar Existing employees are an asset to the firm, because of their skill base and experience.
However before taking over the company mutually beneficial agreements were established.
2. The Benefit from Acquisition:
TATA Jaguar- Land Deal This deal has provided the Leveraged to TATA Group in many ways to repay the amount for the deal.
Rs. 1.92 Billion underwriting agreement with J M financial Consultants. Rs.1.75 Billion was raised through a deposits scheme from the Public. Additional subscriptions by promoter companies such as TATA sons, TATA Capital and
Investment. · And above that TATA was leveraged by Brit ish Government also.
Buyout was done to improve the following things but its shrink back the issues such as Cost Rationalization initiatives were taken to improve cash flows, Single shifts and down time at all three UK assembly plants, Supplier payment terms extended from 45 to 60 days in line with industry standard, Receivables reduced by £133 million from 38 to 27 days and Inventory reduced by £217m between June 2008 and March 2009 from 70 to 50 days.
Establish Communication with the Union
Establish Gloals for the Union
Reward and Control
•Reassure them of Job Security
•Gain the Trust of the Union.
•Establish Productivity goals and polocies. •Inform them about sitiuation of the Firm.
•Cosult with Union and setup accepted performance reward scheme. •Reward and impose sanctions as neccessary.

Indian Institute of Foreign Trade
M e r g e r a n d A c q u i s i t i o n P r o j e c t
Page 14
Tata Motors had to incur a huge capital expenditure as it planned to invest another US$ 1 billion in JLR deal. This was in addition to the US$ 2.3 billion it had spent on the acquisition. Tata Motors had also incurred huge capital expenditure on the development and launch of the small car Nano and on a joint venture with Fiat to manufacture some of the company’s vehicles in India and Thailand. Basically in this deal FORD had leveraged by TATA for relinquish of the past losses and to run the production at the required phase. But the above mention benefits recoil for the TATA’s to work out the future scenario for the running the operations as per desired manner.
2.1 Strategic Benefit:
Tata Motors stood to gain on several fronts from the deal. One, the acquisition would help
the company acquire a global footprint and enter the high-end premier segment of the global
automobile market.
Jaguar Land Rover are very good brand and FORD Motors Company was selling them
because they were in Financial Trouble, plus they had bought the company for USD5.3
billion USD which they sold at USD 2.3 Billion, so Tata picked up there firms at a pretty good
price and at point that they are already at an upswing towards being in better shape.
It gave Tata Motors access to the Local Value chain for Land River Jaguar in Europe of
Supplier, Supply Chain, Process, Manufacturing, R&D, Operations, HR, and Dealer etc.
Technology and Intellectual Property rights.
That key Strategic product, technology and size.
2.2 Understanding the source of Synergy Gains
Acquiring JLR would provide significant potential for revenue synergies, including giving Tata greater international distribution, broader product range and better customer service skills
Tata gains access to world-class engineering capability
One of the main reasons that push companies to merge is the possibility to obtain synergies to
reinforce the competitive position. In this case, there was great potential for new synergies. In
particular, they would arise with some of the companies held in Tata’s portfolio. The companies
in question were: Tata Steel, TACO and TCS.
• Tata Steel (part of Corus group, also owned by Tata), is a multinational based in London,
which produces steel. It’s the second largest European steel producer.
• TACO (Tata AutoComp Systems Limited) is another company owned by Tata, specialized in
the provision of products and services in the automotive industry.
• TCS (Tata Consultancy Services) is an Indian multinational information technology services,
business solutions and consulting company headquartered in Mumbai.
On its side, Tata would be assisted in improving the quality of its current products in the Indian
market by capitalizing on the design capability and experience of JLR. According to Mohandas
(2010), the design and aesthetics of the new models will stay in the UK, which is the hallmark of

Indian Institute of Foreign Trade
M e r g e r a n d A c q u i s i t i o n P r o j e c t
Page 15
the iconic luxury brands, but such designs would be also provided to other companies of Tata,
especially those based in India. Also, by acquiring JLR Tata managed to soften competition in
the segment it wanted to enter.
2.3 Point of Revenue Increase.
The deal was that JLR acquisition increased Tata Motor’s debt-equity ratio 3.03 IN 2008-09 1.1
a year agao. Just after taking over, Tata Motors faced its toughest challenge when it incurred a
GBP 300 Million loss in the first year with JLR sales slumping by a third. This was followed by
Labour problems and negotiation with the British government for access to loans and
guarantees. However, in August 2009,it raised GBO 469 million through global depository
shares. It was the beginning of the turnaround Story.
Since then the company has raised money through several bond issues, which allowed it
greater strategic flexibility in investment in modernization of plant, product development and
expansion into emerging markets.
The company turned Profit in 2010-11, when it reported GBP 1.03 billion.

Indian Institute of Foreign Trade
M e r g e r a n d A c q u i s i t i o n P r o j e c t
Page 16
JLR has become crown jewel of Tata Motors, contributing 67 percent of revenues and 81 percent of
operating profits.
2.3.1 Market Capitalization:
Two months before it acquired JAGUAR AND LANDROVER (JLR) in March2008, TATA MOTOR Shad a market capitalisation of Rs 24,000 crore. Five months after the deal, it had plunged to Rs 6,500 crore. The market as whole during that time negated the acquisition as
Mar '14 Mar '13 Mar '12 Mar '11 Mar '10 Mar '09 Mar '08 Mar '07 Mar '06 Mar '05
Net Sales/Income from
operations230,677.10 187,652.84 164,854.52 122,426.19 92,519.25 70,938.85 35,651.48 32,426.41 23,718.17 19,532.84
Other Operating Income 2,156.56 1,164.79 799.97 707.11 -- -- -- -- -- --
Total Income From
Operations232,833.66 188,817.63 165,654.49 123,133.30 92,519.25 70,938.85 35,651.48 32,426.41 23,718.17 19,532.84
Consumption of Raw
Materials135,550.04 111,600.44 100,797.44 70,453.73 54,105.54 40,509.68 22,057.63 22,372.59 16,259.20 13,489.26
Purchase of Traded Goods 10,876.95 11,752.07 11,205.86 10,390.84 -- -- -- -- -- --
Increase/Decrease in
Stocks-2,840.58 -3,031.43 -2,535.72 -1,836.19 -1,148.67 602.92 -0.3 -411.26 -238.3 -216.84
Power & Fuel -- -- -- -- -- -- -- -- -- --
Employees Cost 21,556.42 16,584.05 12,298.45 9,342.67 8,751.77 7,297.42 2,745.16 2,415.53 1,777.43 1,429.94
Depreciation 11,078.16 7,569.30 5,625.38 4,655.51 3,887.13 2,506.77 782.07 688.09 623.31 531.01
Excise Duty -- -- -- -- -- -- -- -- -- --
Admin. And Selling
Expenses-- -- -- -- -- -- -- -- -- --
R & D Expenses -- -- -- -- -- 347.75 65.95 85.02 -- --
Provisions And
Contingencies-- -- -- -- -- -- -- -- -19.11 -27.87
Exp. Capitalised -13,537.85 -10,191.97 -8,265.98 -5,741.25 -4,592.50 -4,669.77 -- -- -- --
Other Expenses 46,390.98 37,557.17 29,843.20 23,706.02 27,287.15 25,002.10 6,439.10 3,934.37 2,945.09 2,415.66
P/L Before Other Inc., Int.,
Excpt. Items & Tax23,759.54 16,978.00 16,685.86 12,161.97 4,228.83 -658.02 3,561.87 3,342.07 2,370.55 1,911.68
Other Income 828.59 811.53 661.77 89.61 1,793.12 798.96 267.48 153.18 243.55 133.94
P/L Before Int., Excpt.
Items & Tax24,588.13 17,789.53 17,347.63 12,251.58 6,021.95 140.94 3,829.35 3,495.25 2,614.10 2,045.62
Interest 4,733.78 3,553.34 2,982.22 2,045.42 2,239.71 1,930.90 743.06 405.81 246.01 169.66
P/L Before Exceptional
Items & Tax19,854.35 14,236.19 14,365.41 10,206.16 3,782.24 -1,789.96 3,086.29 3,089.44 2,368.09 1,875.96
Exceptional Items -985.38 -602.71 -831.54 231.01 -- -- -- -- -- --
P/L Before Tax 18,868.97 13,633.48 13,533.87 10,437.17 3,782.24 -1,789.96 3,086.29 3,089.44 2,368.09 1,875.96
Tax 4,764.79 3,770.99 -40.04 1,216.38 1,005.75 335.75 851.54 883.21 640 490.62
P/L After Tax from
Ordinary Activities14,104.18 9,862.49 13,573.91 9,220.79 2,776.49 -2,125.71 2,234.75 2,206.23 1,728.09 1,385.34
Prior Year Adjustments -- -- -- -- -- -- -- -- -- --
Extra Ordinary Items -- -- -- -- -259.6 -339.29 -- -1.44 -- --
Net Profit/(Loss) For the
Period14,104.18 9,862.49 13,573.91 9,220.79 2,516.89 -2,465.00 2,234.75 2,204.79 1,728.09 1,385.34
Minority Interest -59.45 -83.67 -82.33 -48.52 -30.33 11.48 -132.25 -74.22 -- --
Share Of P/L Of Associates -53.71 113.79 24.92 101.35 84.5 -51.73 65.2 39.42 -- --
Net P/L After M.I &
Associates13,991.02 9,892.61 13,516.50 9,273.62 2,571.06 -2,505.25 2,167.70 2,169.99 1,728.09 1,385.34
Equity Share Capital 643.78 638.07 634.75 637.71 570.6 514.05 385.54 385.41 382.87 361.79
Reserves Excluding
Revaluation Reserves64,936.80 36,959.63 32,422.28 18,389.13 7,450.15 5,315.84 8,286.47 7,310.31 5,722.21 4,035.37
Equity Dividend Rate (%) -- -- -- -- -- -- -- -- -- --
Consolidated yearly Results
EXPENDITURE

Indian Institute of Foreign Trade
M e r g e r a n d A c q u i s i t i o n P r o j e c t
Page 17
both the companies JAGUARAND LANDROVER had been making losses under their former owner ford motors, however there was an opportunity hidden in exploring the strong brand value and research and development hidden behind both the companies and eventually this opportunity was utilized to the fullest extent by tata motors and its market capitilasation now stands at 71500 crore which is more than a tenfold rise from the initial post acquisition low.
2.3.2 Brand Value:
Recently TATA MOTORS drove past Reliance Industries to top the 2010 edition of India’s Most Valuable Brands survey with a valuation of $8.45billion. A major part of this success can be attributed to the JAGUAR ANDLANDROVER brands. Jaguar and land rover both have been part of a larger conglomerate for a long time, however their potential was not unlocked then, TATA MOTORS succeeded in doing that. Jaguar and land rover steadily started regaining their rhythm in the market and contributed towards creating a good brand value for TATA MOTORS. TATA MOTORS-JLR brand soared 172%in one year to $8.45 billion from only $3.1 billion in 2008-09.
2.3.3 Cash Flows and Bottom Line
During the quarter ended june 2010 JAGUAR LAND ROVER has generated a positive cash flow of £23 million, post capital and product development expenses the first such instance since the deal. Moreover It posted a profit of £221 million (Rs 1,613 crore) for the quarter ended June against a loss of £64million in the corresponding quarter. The margin expansion was driven by cost cutting measures and currency tailwinds as well as sales of higher variants of landrover and increasing sales in china and USA.
2.3.3 Topline
JAGUAR LANDROVER global sales in July 2010 were 19,386 vehicles, higher by 30%. Jaguar sales for the month were 5,676, higher by 26%, while Land Rover sales were 13,710, higher by 31%. Cumulative sales of Jaguar Land Rover for the fiscal are 76,539 nos., higher by 50%. Cumulative sales of Jaguar are 21,131 nos., higher by 31%, while cumulative sales of Land Roverare 55,408 nos., higher by 59%.
2.4 Points of Cost Reduction
2.4.1 Tata also managed to lower its operations costs considerably. For example it acquired
numerous new technologies saving a lot of money in R&D expenses.
2.4.2 Furthermore, the costs of manpower were also reduced, by outsourcing it from India to
Britain and vice versa. For instance, off shoring engineering services to India was one ways
money was saved.

Indian Institute of Foreign Trade
M e r g e r a n d A c q u i s i t i o n P r o j e c t
Page 18
2.4.3 Tata Steel anticipated that the combined entity would save $450 million in production,
procurement, financing, and other synergies over the first three years after the acquisition.
2.4.4 In addition, there were enhanced technologies, skills and knowledge transfers from India
to Britain and vice versa.
2.4.5 In conclusion acquiring JLR will improve Tata’s balance sheet in the sense that its
revenues will increase owing to the reduced cost of production. Also, expenses regarding
engineering and designs services will be lowered and Tata will enjoy lower production 48cost.
2.4.6 Apart from sharing designs, knowledge and skills as well as reducing competition in the
market, the acquisition of JLR also reduced the cost of production thanks to the synergies with
other Tata Companies such as Corus.
3. Financial Due Diligence
100% stake in Jaguar and Land Rover business
TAMO has acquired the business and initially they will be operated independently of the parent, most senior manager would continue
3 plants in UK These are well invested modern plants 2 Advance design and engineering centers 4-500 engineers engaged in testing, prototype
building, design and powertrain engineering, development and integration.
26 national sales companies Both existing national sales companies of Jaguar/Land Rover and also those that are to be carved out of the current Ford operations.
Intellectual Property right This covers all key technologies to be transferred to JLR and perpetual royalty free licenses on technologies shared with For.
Capital allowance A minimum guarantee amount of $ 1.1 bn which will help in managing tax going forward.
Support allowance Support from Ford Motors Credit
Ford motors credit will continue to support the sales of Jaguar and Land Rover for around 12 months for Acquisition.
Pension contribution by Ford Ford contributed $ 600 mn to the pension funds and the next accrual valuation will take place only in April 2009.
PAG – Recurring PBT (4Q07) 59 Based on FORD 10K. This also includes the impact of Volvo CARS. However FORD in its Sept-07 10q filing commented that JLR is profitable whereas Volvo cars

Indian Institute of Foreign Trade
M e r g e r a n d A c q u i s i t i o n P r o j e c t
Page 19
made a loss. We have assumed that entire 4Q recurring PBT of PAG to come from Jagaur/Land Rover.
JLR – Annulised 236 JLR – Depr & Amount 699
JLR - EBITDA 935 EV/EBITDA 2.46
JLR Sales (4Q07) 3,554 JLR Sales - Annualized 14,214
EV/Sales 0.16 JLR implicit EBITDA margin 6.58%
JLR – Shareholders equity 2.456 FORD 10K indicates that shareholders equity of JLR is
$2.5 Bn. Purchase price 2.300
Price to Book 0.94
3.1 JLR Acquisition valuation
3.1.1 Assumption:
Tata Motors Limited (TML) acquisition cost at $3bn assumed to debt funded on it’s
books
No asset sales
3.1.1 Financial Impact:
Leverage increases but coverage ratios reasonable
Debt/equity of TML will increase to 2.5X from 1X
Excluding the vehicle finance, leverage would go to 1.2X
EBITDA/Interest remains at 5.0
3.1.3 Valuation:
TML traded inline/modest discount to global peers
EV/Sales (1 yr forward) of 0.5x vs 0.4x for global peers
P/E (1 yr forward) of 6.5x vs 8.5x for global peers

Indian Institute of Foreign Trade
M e r g e r a n d A c q u i s i t i o n P r o j e c t
Page 20
3.3 Cost Synergies
TML has multiple levers
TML has a rich ecosystem of JVs with leading players in Auto ancillary space
TCS, Corus & Tata Technologies have varied competence in the Auto space
3.3.1 JLR Cost Synergies Land Rover Jaguar Jaguar & Land Rover In GBP 2005 2006 2005 2006 2005 2006 Material cost/car
20,254 21,243 16,299 16,298 18,919 19,976
Employee cost/car
2,565 2,444 4,316 4,706 3,156 3,108
GBP/USD 1.82 1.82 1.82 1.82 1.82 1.82 % of Sales
Material cost
84.5% 85.4% 112.8% 91.7% 91.7% 90.3%
Employees 9.6% 8.9% 24.3% 13.4% 13.4% 12.4%

Indian Institute of Foreign Trade
M e r g e r a n d A c q u i s i t i o n P r o j e c t
Page 21
3.4 Revenue Synergies
Limited in mid-term (2-3) years but In long run, Tata Group & TML’s footprint in South-East
Asia should help JLR diversify their geographic dependence from US (30% volume) & Western
Europe (55% volume)
3.4.1 Acquisition SWOT

Indian Institute of Foreign Trade
M e r g e r a n d A c q u i s i t i o n P r o j e c t
Page 22
TML & JLR: Leverage &
Valuation Ratios
Column1 Column2 Column3 Column4
Financial Stability ratios
TML ($m) JLR ($m) Consolidated
Net Debt 2664 5664 This debt includes $3bn raised for acquisition
Net Debt - excluding vehicle finance biz
-271 -2729 TML auto business is currently minimally leveraged - if we netoff the vehicle financing receivables against net debt
Net Debt/Equity 1.15 2.45 TML leverage looks adverse however coverage ratios are reasonable
Net Debt/EBITDA 2.23 2.66
EBITDA/Interest 8.56 5.32
Share price 630
O/S shares 385
Mkt Cap ($m) 6070
Net Debt ($m) 5664 Includes $3bn raised for acquisition
EV ($m) 11735
EV ($m) 0.48
EV/EBITDA (1 yr forward)
5.5
P/E (1 yr forward) 6.65
Net Tangible Asset 2510 2246 4756
Net intangible Asset 111 2010 2121
Vehicle Financing Receivables
2935 2935
Net Current Asset -56 -107 537 Assuming TML will put $700 as operating cash in JLR consolidation, hence NCA of TML & JLR will not add up
Cash & Eqv 638 638 The cash equivalents includes shares of Tata Steel worth $400m held at cost of $50m
Trade Investments 233 233
Pension Asset 696 696
Other Asset 3 297 300

Indian Institute of Foreign Trade
M e r g e r a n d A c q u i s i t i o n P r o j e c t
Page 23
Total Asset 6373 5142 12215
Warranty Liability & other provisions
489 2667 3156
Pension Liabilities 19 19
Def Tax Liability 238 238
Shareholder's equity 2314 2456 2314
Capital Asset 156 Since the acquisiton cost ($2.3bn) is less than net asset value of JLR, there is capital asset instead of goodwill
Minority Interest 30 30
Debt 3302 6302 $3bn acquisition cost ($2.3bn paid to Ford, balance as operating cost in JLR)
Toatl Liabilities 6373 5142 12215
TML & JLR: Cash Flow (FY 2009)
Column1 Column2 Column3 Column4 Column5
Proforma Cash Flow ($m) TML JLR SPV Consolidated
Cash Profit 949 893 -225 1617
Change in Working Capital 238 -256 -18 TML has robust WC mgt in auto biz. Inventory and receivable days at around 30 & 9 respectively & creditors @ 40 days
Cashflow from Operating activities 1187 637 -225 1599
Increase in vehicle loan receivables -776 -776
Capex -813 -635 -1447
Trade Investment -38 -38
Change in associates 16 16
Cashflow from Investing activities -835 -635 -1469
Change in minorities -30 -30
Change in Debt 949 3000 3949
Dividend -154 -154
Cash flow from financing activities 766 3000 3766
Chg in Cash 343 3 2775 3120

Indian Institute of Foreign Trade
M e r g e r a n d A c q u i s i t i o n P r o j e c t
Page 24
Operating Cash Flow - Capex 337 3 -225 115 JLR has a positive pretax cashflow
4. Conclusions:
The acquisition of JLR by TATA motor was Strategically a very good move by TATA Motor
taking in consideration their Global Ambition, However they would need maximize the leverage
by not just increasing Sales or getting technological, supply chain, IPR or management
expertise but hey need to make sure that the TATA Group which has over 90 companies
together are participate the JLR value chain by provide cost, quality, customization and timely
output and gain from the share of JLR business expenses towards their respective line of
business however taking into consideration JLR management perspective.
JLR acquisition also possess some challenges high interest rate of Debt effecting profitability
but the more important one would be JLR would now have more share or percentage of
revenue in Tata Motors overall revenue and challenge is going to be to keep the pace and
leverage by TATA motors legacy products to increase their revenue share and also since the
majority of revenue would now come from outside India Tata Motors would have re look at their
Organization Structure to transform into a Transnational Organization and relook at their goals.
Over all it a good Acquisition which has increase TATA motors market share, Brand Value and
recognition and a very high amount of Synergy Gain in Supply chain, Technology, IPR ,
Visibility, Assets in EU Market and Access whole new segment of Luxury Sedan and Premium
SUV.
It has also helped TATA Motors in Domestic Market in India to increase the sales and revenue
and equipped them to compete with Foreign MNC’s in Indian Market.