MergePDF - Kar NRR/Genenral... · MergePDF - Kar ... Title: MergePDF
Upload
central-department-of-geologyCategory
view
220download
0
8/8/2019 Ma Harjan and Tamra Kar
http://slidepdf.com/reader/full/ma-harjan-and-tamra-kar 1/8
Bulletin of the Department of Geology, Tribhuvan University, Kathmandu, Nepal, Vol. 10, 2007, pp. 99–106
Evaluation of gravel for concrete and road aggregates, Rapti River,
Central Nepal Sub-Himalaya
*Surendra Maharjan and Naresh Kazi Tamrakar
Central Department of Geology, Tribhuvan University, Kathmandu, Nepal
ABSTRACT
Several local mining sites of sand and gravel have been operating for decades in the Rapti River. River gravels are consumed
in Hetauda, Narayanghad and areas in India near the border between Nepal and India. Until now little known about consumers
concerning about quality of gravel. The present study was carried out to evaluate quality of river gravel to know its suitability for
aggregate (raw material for concrete and road). The samples of river gravel were analysed for petrographic, physical, mechanical
and chemical properties. Samples were categorised as quartzite group, carbonate group and granite group according to British
Standard Institution (BSI). Among these, samples of quartzite group were found dominant. Image analysis of gravel showed that
clasts were well graded. The majority of the samples had rounded, high sphericity and oblate triaxial clasts. The surface texture of
clasts was rough to smooth. In terms of shape, workability of gravel was satisfactory. Gravel samples possessed low water absorption
value (0.69 to 1.12%) and low effective porosity. Dry density of samples ranged from 2460 to 2680 kg/m3. Aggregate impact values
of samples (14.2 to 16.1%) showed good soundness. Los Angeles abrasion test also showed consistent hardness of each of the
samples as uniformity factor did not exceed 0.2. Magnesium sulphate values ranged between 4.46% and 7.29% suggesting good
resistance against chemical weathering and frosting. Comparing with the existing Nepal Standard, British Standard and American
Standard of Testing Material, the studied samples were suitable for concrete and road aggregates.
*Corresponding author:
E-mail address: [email protected]
Bulletin of the Department of Geology
INTRODUCTION
The Rapti River is known for carrying large
amount of sediments from the Lesser and the Sub-
Himalayas. The river sediments are chiefly gravel
with few sand and mud. Gravel (coarse aggregates
greater than 4.75 mm) can be easily collected from
the river area after deposition during each flood
season. Hence, the river is perennial source of coarse
aggregates. The use of coarse aggregate from the
Rapti River as construction material has been
extensive because of high demand in major cities
like Hetauda and Narayanghad. Gravel is also
exported to nearby border towns in India. About 3.4
million m3 of boulders, gravel and sand are reported
to be present for the depth of one meter in the major
rivers of the Central Development Region (Duvadi
et al. 2006). From this region the construction material
of worth Rs. 53 million has been exported to India
in the year 2000/2001 (DMG 2004). Therefore, the
sediments of the Rapti River are of economic
importance of the Central Development Region.
Although coarse aggregates have been used for
concrete and filling material for road embankment
in the area, there is little concern about quality.
Therefore, authors obtained samples from the riverelements (side and mid bars) and analysed to evaluate
quality of coarse aggregate.
STUDY AREA
The study area lies in Hetauda Dun Valley, Central
Nepal (Fig. 1). The Rapti River flows northeast to
southwest and contributes the Narayani River. It is
a meandering river in the upper stretch and becomes
braided in the middle to downstream stretches. It
includes different bar deposits containing huge amount
of gravel and minor sand. The East-West Highway
C e n
t r a l D e p a r t
m e n t
o f G e
o l o
g y
K ir t i p u r

8/8/2019 Ma Harjan and Tamra Kar
http://slidepdf.com/reader/full/ma-harjan-and-tamra-kar 2/8
100
S. Maharjan and N. K. Tamrakar/ Bulletin of the Department of Geology, Vol. 10, 2007, pp. 99–106
runs along the right bank of the river which is the
main access of the study area. Gravel roads and foot
trails link the river from the highway.
Material and method
Altogether 12 samples from bar deposit (surface)of the river were taken for analysis (Fig. 1). Sampling
was made following the method of Howard (1993).
About 10 kg of each sample was collected. The
photographs of the sampling spots were obtained and
image analyser was used for photo sieving. The gravel
samples were utilised in determining composition,
texture, aggregate impact value, abrasion value and
chemical durability.
The samples were washed to remove surface
coating of organic material and clay, if any present
for easy identification of clast type. Then, the sampleswere grouped into categories after BSI (1975). About
100 clasts of each sample were measured for their
three mutually perpendicular axes; longest (a),
intermediate (b) and shortest (c) axes to determine
shapes of clasts (Fig. 2). The physical properties such
as water absorption and dry density were determined
after ISRM (1979). Aggregate Impact Test and Los
Angeles Abrasion Test were made to obtain
mechanical soundness and hardness of samples. To
obtain soundness of aggregates against frosting and
chemical weathering, Sodium Sulphate Soundness
Test was made based on ASTM (1978 and 1989).
RESULTS
Composition and texture
The major constituents of gravel samples were
quartzite, sandstone, granite gneiss and limestone.
Among them, quartzite is the dominant constituent
in all the samples (Table 1). The clasts of amphibolite,
schist, phyllite, slate, quartz and feldspar were
commonly found in all the samples. The samples
were categorised as quartzite group, carbonate group,
schist group and granite group (BSI 1975) (Table 1).
Surface texture defines the periphery of aggregates
whether it is smooth, rough, honeycombed, granular
and crystalline (BSI 1989). From the observation,
quartzite clasts had smooth surface texture whereas
granite, sandstone, carbonate, gneiss, schist, phyllite
and slate clasts had rough surface texture. Therefore,
the samples had mixed type of surface texture which
should provide sufficient bonding with cement.
The clast shape was quantified in terms of
elongation ratio (q = b/a) and flatness ratio (p = c/b)
(Table 2). The shape factor (F = p/q) ranged from
0.82 to 1.03 showing nearly equant shape of clasts.
The plots of elongation and flatness ratios on the
modified Zingg’s (1935) shape classification diagram
after Lees (1964) showed that the clasts were oblate
Fig. 1 Location map of study
area showing sampling points
of river sediment
Rapt i R i v e r
N a r a
y a n i
R i v e r
N
8 160 24 Km4
I N
D
I A
HETAUDA
MEGHAULI
M A H A B H A R A T R A N G E
S I W AL I K RAN G E
S I W A L I K
D U N VA L L E Y
R A N G E
R11R12R13
R10 R8R9
R6
R5R2
R4R3
R7
R2 River bar sample
Main Boundary Thrust Watershed boundary
International boundary
85o 6’42”
2 7 o
3 2 ’ 4 1 ”
2 7 o
2 0 ’ 4 1 ”
84o 54’42”84o 42’42”84o 30’42”84o 18’42”84o6’42”
2 7 o 3 2 ’ 4 1 ”
2 7 o
2 0 ’ 4 1 ”
I N D I A
N E P A L
C H I N A
80
30
26
86
Hetauda

8/8/2019 Ma Harjan and Tamra Kar
http://slidepdf.com/reader/full/ma-harjan-and-tamra-kar 3/8
101
triaxial (Fig. 3).
Sphericity (Y ) was calculated using the expression
of Aschenbrenner (1956) as:
Y = {12.8 (p2q)0.3}/{1+p (1+q)
+ 6 (1+ p2 (1+q2))0.5} (1)
Sphericity ranged from 0.84 to 0.91 (Table 2),
therefore the clasts possessed high sphericity (Fig.3).
Roundness of clasts was calculated after Janoo
(1998) as:
R = 4p A/P2 (2)
where, A is area and P is perimeter of a clast. The
average roundness (R) varied between 0.81 and 0.86
(Table 2) and were subrounded to rounded.
The river gravel had dominantly rounded, prolate
triaxial and high sphericity clasts. These shape
attributes suggest that the gravel when it will be used
Table 1: Composition of gravel of the Rapti River
Fig. 2 Clasts used for measuring the longest, the intermediate and the shortest axes to determine shape of clasts in samples; (a) sampleR5 and (b) sample R7
Evaluation of gravel for concrete and road aggregates, Rapti River, Central Nepal Sub-Himalaya
(a) (b)
Samples
Composition (%) R2 R3 R4 R5 R6 R7 R8 R9 R10 R11 R12 R13
Sandstone 9 6 6 12 12 10 13 15 15 17 9 13
Limestone, dolomite and marble 25 22 26 28 11 6 2 4 12 7 8 6
Quartzite 28 21 29 42 50 55 60 66 48 62 62 44
Slate and phyllite 12 20 15 2 6 2 2 0 2 1 0 0
Schist 15 11 6 3 1 1 0 0 2 0 0 3
Gneiss 5 11 6 2 2 2 4 1 4 1 1 7
Granite and pegmatite 2 5 5 4 10 15 18 9 15 10 18 25
Amphibolite 2 3 4 0 2 3 1 1 1 2 0 1
Vein quartz 2 1 2 6 5 5 0 3 1 0 1 0
Feldspar 0 0 0 0 0 0 0 0 0 0 0 1
Undifferentiated grains 0 0 1 1 1 1 0 1 0 0 1 0
*Compositional group QG- SG- QG- QG- QG QG- QG- QG QG- QG QG- QG-
SG-CG QG-CG CG CG GG GG GG GG GG
*(BSI 1975): QG = Quartzite group; SG = Schist group; CG = Carbonate group; GG = Granite group

8/8/2019 Ma Harjan and Tamra Kar
http://slidepdf.com/reader/full/ma-harjan-and-tamra-kar 4/8
102
as aggregate will provide good workability with
cement. In fact the shape of coarse aggregates affects
workability and mobility of concrete (Lees 1963).
Workability decreases if the majority of clasts are
disc and rod shaped (Neville 1996). If the clasts are
angular, they can decrease workability by 10%
(Kaplan 1958). Particle shape and surface texture
influence the properties of freshly mixed concretemore than the properties of hardened concrete. Angular
and rod shaped particles require more water to produce
workable concrete than rounded and compact particles
in aggregate. In this case cement should also be
increased to maintain the water-cement ratio.
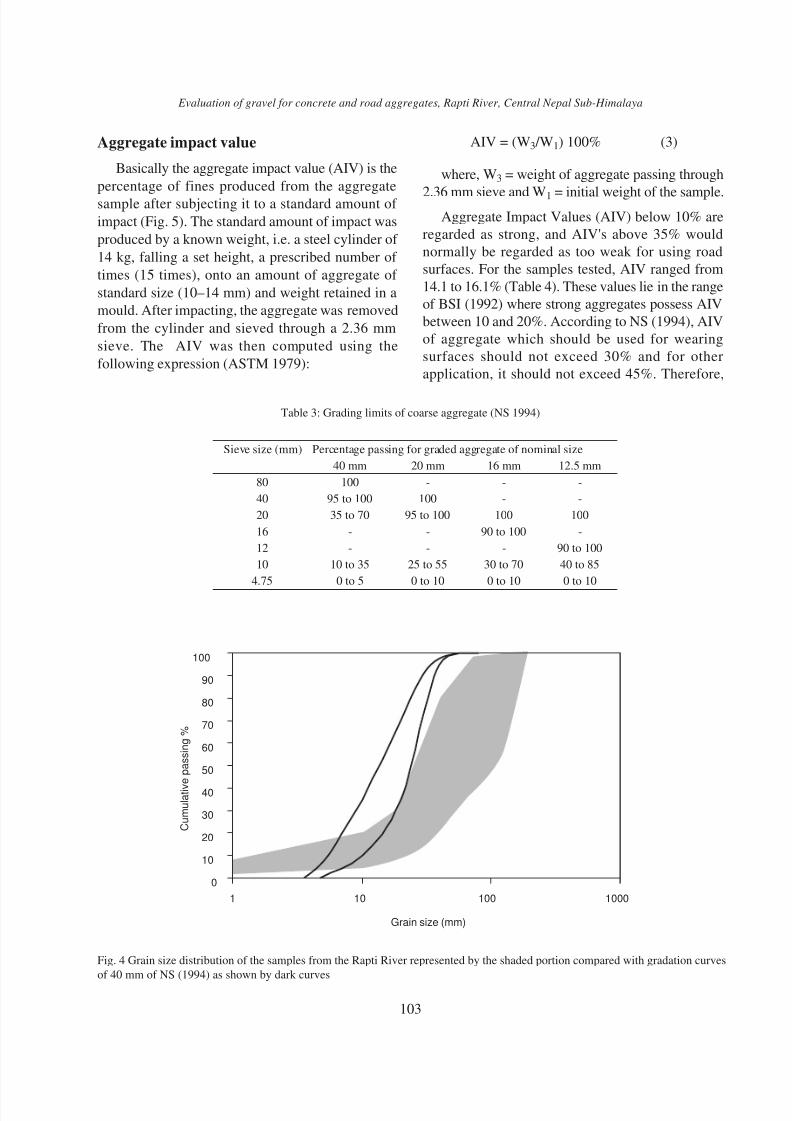
The average median grain size varied from 59.71
to 13.93 mm (Table 2). The river gravel had well
graded clasts. The grading curves of the samples
were compared with that of the coarse aggregate, 40
mm of NS (1994) as shown in Table 3 and Fig. 4.
The gradation lines of the samples do not lie within
the gradation zone and are coarser compared with
the standard grading. The river gravel may therefore
be crushed and screened to obtain appropriate grading
before using as coarse aggregate.
Water absorption and dry density
Water absorption ranged from 0.69 to 1.12%
(Table 4). It is less than 3% indicating very low
effective porosity of clasts (BSI 1987). The aggregates
having clasts with low effective porosity are strong
enough to withstand chemical decomposition against
cement and weathering fluid.
Dry density varied from 2460 to 2680 kg/m3
(Table 4). This range falls into the normal density
category of aggregates (NF 1983). The density ranging
between 2000 and 3000 kg/m3 can also be considered
medium weight aggregate, and the samples which
have dry density exceeding 2600 kg/m3 are more
suitable for aggregate (Zafir amd Majid 2000).
Table 2: Results of form, sphericity, roundness and size of clasts of the gravel samples
Fig. 3 Shape of clasts on modified Zingg’s diagram after Lees
(1964); the parameters are after Aschenbrenner (1959)
S. Maharjan and N. K. Tamrakar/ Bulletin of the Department of Geology, Vol. 10, 2007, pp. 99–106
Samples Elongation ratio Flatness ratio Shape factor Sphericity Roundness Median grain size
q p SF Y R d50 (mm)
R2 0.7 0.58 0.82 0.85 0.86* 34.3
R3 0.7 0.57 0.82 0.84 0.84* 34.3
R4 0.68 0.62 0.91 0.86 0.81a
13.9
R5 0.72 0.64 0.89 0.88 0.82* 15.5
R6 0.71 0.66 0.94 0.88 0.83* 21.1
R7 0.73 0.63 0.86 0.88 0.85* 15.5
R8 0.72 0.69 0.96 0.89 0.83* 23.4
R9 0.74 0.76 1.03 0.91 0.85* 19.7
R10 0.72 0.66 0.92 0.88 0.86* 39.4
R11 0.71 0.63 0.88 0.87 0.82* 22.6
R12 0.74 0.66 0.88 0.89 0.84* 21.9
R13 0.74 0.67 0.9 0.89 0.84* 59.7
interpretation of roundness after Folk's roundness ( r ): r = 10.83 log (R) + 6.18asubrounded; * rounded;
DISC CUBIC
BLADE ROD = 0 .4
y = 0 .5
y = 0 .6
y = 0 .7
y = 0 .8
y = 0 .9
y = 0 . 9 5
F = 3. 0 F =
1 . 5 F =
1 . 0 F
= 0 . 6
F = 0
. 3 3
0.0 0.2 0.4 0.6 0.8 1.00.0
0.2
0.4
0.8
0.6
1.0
I /
L = q
S/I = P
Oblate biaxial
O b l a t e t r i a x i a l
P r o l a t e
t r i a x i a l
P r ol a
t e b i ax i al
P r o l a t e b l a d e
O b l a t e
b l a d e
8/8/2019 Ma Harjan and Tamra Kar
http://slidepdf.com/reader/full/ma-harjan-and-tamra-kar 5/8
103
Aggregate impact value
Basically the aggregate impact value (AIV) is the
percentage of fines produced from the aggregate
sample after subjecting it to a standard amount of
impact (Fig. 5). The standard amount of impact was
produced by a known weight, i.e. a steel cylinder of
14 kg, falling a set height, a prescribed number of
times (15 times), onto an amount of aggregate of
standard size (10–14 mm) and weight retained in a
mould. After impacting, the aggregate was removed
from the cylinder and sieved through a 2.36 mm
sieve. The AIV was then computed using the
following expression (ASTM 1979):
AIV = (W3 /W1) 100% (3)
where, W3 = weight of aggregate passing through
2.36 mm sieve and W1 = initial weight of the sample.Aggregate Impact Values (AIV) below 10% are
regarded as strong, and AIV's above 35% would
normally be regarded as too weak for using road
surfaces. For the samples tested, AIV ranged from
14.1 to 16.1% (Table 4). These values lie in the range
of BSI (1992) where strong aggregates possess AIV
between 10 and 20%. According to NS (1994), AIV
of aggregate which should be used for wearing
surfaces should not exceed 30% and for other
application, it should not exceed 45%. Therefore,
Fig. 4 Grain size distribution of the samples from the Rapti River represented by the shaded portion compared with gradation curves
of 40 mm of NS (1994) as shown by dark curves
Table 3: Grading limits of coarse aggregate (NS 1994)
Evaluation of gravel for concrete and road aggregates, Rapti River, Central Nepal Sub-Himalaya
Sieve size (mm) Percentage passing for graded aggregate of nominal size
40 mm 20 mm 16 mm 12.5 mm
80 100 - - -
40 95 to 100 100 - -
20 35 to 70 95 to 100 100 100
16 - - 90 to 100 -
12 - - - 90 to 100
10 10 to 35 25 to 55 30 to 70 40 to 85
4.75 0 to 5 0 to 10 0 to 10 0 to 10
0
10
20
30
40
50
60
70
80
90
100
1 10 100 1000
Grain size (mm)
C u m u l a t i v e p a s s i n g %

8/8/2019 Ma Harjan and Tamra Kar
http://slidepdf.com/reader/full/ma-harjan-and-tamra-kar 6/8
104
AIV of the studied samples lies within the standards
of both NS (1994) and BSI (1992).
Los Angeles abrasion valueHardness (wearing property) and toughness
(breaking property) of aggregates associated together
are often carried out in Los Angeles test. The principle
of the test is to obtain percent wear due to relative
rubbing action between aggregates and steel balls
used as an abrasive charge. Uniform factor and wear
of gravel were determined by Los Angeles test
(ASTM 1989). Los Angeles abrasion value was
calculated as:
Wr100 = {(W–W100)/W}.100% (4)
Wr500 = {(W–W500)/W}.100% (5)
where, Wr100 = %wear for 100 revolutions, Wr500
= %wear for 500 revolutions, W = initial weight of
sample, W100 = weight of sample retained on 1.7 mm
after 100 revolutions and W500 = weight of sample
retained on 1.7 mm after 500 revolutions. Uniformity
factor (UF) was obtained as:
UF = (W–W100)/(W–W500) (6)
UF should not exceed 0.2 for material of uniform
hardness (ASTM 1989).
Mixture of samples R5, R6 and R7 was crushed
to produce Grade A sample (Table 5) for Los Angeles
test because there was no large variation in proportion
of constituents and textures of clasts in these samples.
UF did not exceed 0.2 indicating that the hardness
of sample was uniform (Table 4). The Los Angeles
abrasion value of 500 revolutions (Wr500) was 29.83%.
This value falls within the specification of 30% of
NS (1994) for coarse concrete aggregate.
Sodium sulphate soundness value
Sodium sulphate test was carried out to test for
chemical durability of samples. Sample of size 10–14
mm and weight 425±5 grams were immersed in the
sodium sulphate solution of specific gravity 1.162
for 48 hours and were subsequently dried. The process
was repeated five times and sodium sulphateFig. 5 Diagram showing aggregate impact test
soundness value (SSV) was obtained as below:
SSV = {(W1–W2)/W1} . 100% (7)
where, W1 = initial weight of the sample and W2
= weight retained on 10 mm after the test.
Minimum allowance of SSV for coarse aggregate
is 10% for concrete (ASTM 1978). The SSV of the
tested samples varied from 4.46 to 7.29% (Table 4).
The samples fall within specified range and are
resistant against chemical weathering and frosting.
EVALUATION OF GRAVEL
The Rapti River samples of gravel are dominantly
quartzite group with few carbonate, schist and granite
groups. Surface texture is smooth to rough. Clasts
are mostly subrounded, oblate triaxial and sphered
suggesting good workability. The samples are well
graded but do not lie within the grading zone of
standard.
Absortion values of the studied samples do not
exceed the standard value of 3% as suggested by BSI
S. Maharjan and N. K. Tamrakar/ Bulletin of the Department of Geology, Vol. 10, 2007, pp. 99–106

8/8/2019 Ma Harjan and Tamra Kar
http://slidepdf.com/reader/full/ma-harjan-and-tamra-kar 7/8
105
Table 4: Results of water absorption, dry density, AIV, Los Angeles value and SSV
Table 5: Grading of test samples of coarse aggregates for Los Angeles abrasion test (ASTM 1989)
(1987). The samples also have medium density
varying within 2000 and 3000 kg/m3 and are
considered good for medium weight concrete
aggregates. Similarly, AIV varies between 10 and
20% of BSI (1992) and lies below 30% of NS (1994).
Therefore, the gravel of the Rapti River can be used
as aggregate for heavy duty concrete floor finishes,
pavement wearing surfaces, sub-base, roadbase andfor other concrete.
The Los Angeles abrasion value (Wr500) of the
test sample does not exceed 30%. The sample also
abrades uniformly with time having UF around 0.2.
Based on the specification of NS (1994), the Rapti
River gravel is suitable for road and concrete
aggregates.
Regarding chemical durability, the minimum
allowance of SSV for coarse aggregate is 10% for
concrete (ASTM 1978). As the SSV of the test samples
is less than 10%, aggregate of the Rapti River gravel
offer good resistance against chemical weathering.
CONCLUSIONS
The gravel samples from the Rapti River are
dominantly of quartzite group with few carbonate,
schist and granite groups. They are mostly subrounded,
oblate triaxial ellipsoid with high sphericity and rough
to smooth surface texture. Workability of gravel is
good considering the textural attributes. Grading is
coarser compared with the Nepal standard.
AIV and Los Angeles values suggest that gravels
are mechanically sound. They have normal density
of medium weight aggregates. Water absorption value
Evaluation of gravel for concrete and road aggregates, Rapti River, Central Nepal Sub-Himalaya
Samples rdry (kg/m3) Water absorption Samples Los Angeles Value SSV
(%) Wr100 (%) Wr500 (%) UF (%)R2 2630 0.74
R3 2680 0.69 15.3 5.39
R4 2590 0.75
R5 2460 0.84
R6 2470 0.96 14.1 6.44
R7 2460 1.01 16.1 6.43
R8 2620 1.10 4.46
R9 2500 1.12 15.3 7.29
R10 2620 0.96
R11 2610 1.10
R12 2560 1.11 14.2 7.27
R13 2630 0.95
Mixture of R6, R7,
R8, R9 and R10 5.35 29.83 0.19
Sieve size (mm) Grade of sample (Wt. of fraction by sieving), gram
Opening (mm) Retaining (mm) Grade A Grade B Grade C Grade D
40 28 1250± 25
28 19 1250± 25
19 12.5 1250± 25 2500± 10
12.5 9.5 1250± 25 2500± 10
9.5 6.3 2500± 10
6.3 4.75 2500± 10
4.75 2.36 5000±10
Total weight 5000±25 5000±10 5000±10 5000±10

8/8/2019 Ma Harjan and Tamra Kar
http://slidepdf.com/reader/full/ma-harjan-and-tamra-kar 8/8
106
is also low and is less than the standard, 3% (0.69 to
1.12%). SSV falls below 10% suggesting that gravel
samples are competent against frosting and chemical
decomposition. The results from different tests fallwithin the specified values of standards, suggesting
that the Rapti River gravel materials are appropriate
for concrete and road aggregates.
ACKNOWLEDGEMENTS
We thank Central Department of Geology,
Tribhuvan University, Kathmandu, and Soil and Rock
Testing Laboratory, Nepal Electricity Authority,
Swayambhu, Kathmandu for providing facilities. We
also thank Raghubanshi U. and Otto for their helps
during sampling.
REFERENCES
Aschenbrenner, B.C., 1956. A new method of expressing
particle sphericity. Jour. . Sed. Petrology, v. 26, pp.
15–72.
ASTM, 1978. Book of American Standard of Testing
Materials Standards, Part 14, Concrete and Mineral
Aggregates specification C33, pp. 15–22.
ASTM, 1989. Test for resistance to abrasion of coarse
aggregate particle by use of the Los Angeles machine,
specification C131, American Standard of Testing
Materials Standards.BSI, 1975. Methods of sampling and testing of mineral
aggregates, sands, fillers. BS 812, Part 1, British
Standard Institution (BSI), London.
BSI, 1987. Code of practice for design of concrete structures
for retaining aqueous liquids, BS 8007, British Standard
Institution (BSI), London.
BSI, 1989. Description of surface texture, BS 812, Part
102, British Standard Institution (BSI), London.
BSI, 1992. Specification for aggregates from natural
sources of concrete, BS 882, British Standard Institution
(BSI), London.
DMG, 2004. Mineral resources of Nepal, Department of
Mines and Geology (DMG), Government of Nepal,
Lainchaur, Kathmandu, pp. 37–38.
Duvadi, A.K., Koirala, A., Rimal, L.N., Nepali, D., Piya,
B. and Manandhar, S.P., 2006. Engineering and
environmental geology mapping of Hetauda and
surrounding areas, Annual report of Department of
Mines and Geology, v. 3, pp. 50–59.Howard, J.L., 1993. The statistics of counting clast in
rudites: a review with example from the Upper
Paleogene of southern California USA, Jour.
Sedimentology, v. 40, pp. 157–174.
ISRM, 1979. Suggested methods of determining water
content, porosity, density, absorption and related
properties and swelling and slake durability index
properties: Intl. Soc. Rock Mech. Comm. on
Standardization of Laboratory and Field Tests, Intl.
Jour. Rock Mech. Min. Sci. and Geomech. Abstract,
v. 16, pp. 141–156.
Janoo, V.C., 1998. Quantification of shape, angularity andsurface texture of base-coarse materials, US Army
Corporation of Engineers, Special Report 98-1, pp.
1–22.
Kaplan, M.F., 1958. The effects of the properties of coarse
aggregates on the workability of concrete, Magazine
of Concrete Research, v. 10, pp. 63–74.
Lees, G., 1963. A new method for determining the
angularity of particles, Jour. Sedimentology, v. 3, pp.
2–22.
Lees, G., 1964. The measurement of particle shape and
its influence in engineering materials. Jour. British
Granite and Whinstone Federation, London 4 and 5,
pp. 1–22.
Neville, A.M., 1996. Properties of concrete. Fourth Edition,
Addison Wesley Longman, Essex, England.
NF, 1983. L’Association Francaise de Normalisation,
Franulates, Vocabulaire-Defenations-Classification,
pp. 18–101.
NS, 1994. Specification for aggregate, Nepal Standard
(NS) 297–2054, U.D.C. 620, 113, NBSM, Balaju,
Kathmandu, pp. 1–5.
Zafir, N. and Majid, A., 2000. The influence of aggregates
properties on strength of concrete, Series on K-economy,
Civil and Structural Engineering Works, Malayasia,
pp. 1–22.
Zingg, T., 1935. Beitrage Zur Schott enanlyse Mineral,
Schweiz, Petrog. Mitt. Schweiz, v. 15, pp. 39–140.
S. Maharjan and N. K. Tamrakar/ Bulletin of the Department of Geology, Vol. 10, 2007, pp. 99–106