M Le Bras, C Wilkie, S Bourbigot-Fire Retardancy of Polymers New Applications of Mineral...
433
-
Upload
michaux-gwenaelle -
Category
Documents
-
view
392 -
download
14
Transcript of M Le Bras, C Wilkie, S Bourbigot-Fire Retardancy of Polymers New Applications of Mineral...


Fire Retardancy of Polymers
New Applications of Mineral Fillers

Fire Retardancy of PolymersNew Applications of Mineral Fillers
Edited by
Michel Le BrasEcole Nationale Supérieure de Chimie de Lille, France
Charles A. WilkieDepartment of Chemistry, Marquette University, USA
Serge BourbigotP.E.R.F., Ecole Nationale Supérieure de Chimie de Lille, France
Co-editors
Sophie DuquesnePERF, Ecole Nationale Supérieure de Chimie de Lille, France
Charafeddine JamaPERF, Ecole Nationale Supérieure de Chimie de Lille, France
advancing the chemical sciences

Most of the papers have been presented at the 9th European Meeting on FireRetardancy and Protection of Materials (FRPM’03) organized jointly by the EcoleNationale Supérieure de Chimie de Lille, the Ecole Nationale Supérieure des Arts etIndustries Textiles de Roubaix and the Université des Sciences et Technologies de Lille,at the University of Lille (France) on the 15-17th September 2003.
ISBN 0-85404-582-1
A catalogue record for this book is available from the British Library
© The Royal Society of Chemistry 2005
All rights reserved
Apart from any fair dealing for the purposes of research for non-commercial purposesor for private study, criticism or review, as permitted under the Copyright, Designs andPatents Act 1988 and the Copyright and Related Rights Regulations 2003, thispublication may not be reproduced, stored or transmitted, in any form or by any means,without the prior permission in writing of The Royal Society of Chemistry, or in thecase of reproduction in accordance with the terms of licences issued by the CopyrightLicensing Agency in the UK, or in accordance with the terms of the licences issued bythe appropriate Reproduction Rights Organization outside the UK. Enquiries concerningreproduction outside the terms stated here should be sent to The Royal Society ofChemistry at the address printed on this page.
Published by The Royal Society of Chemistry,Thomas Graham House, Science Park, Milton Road,Cambridge CB4 0WF, UK
Registered Charity Number 207890
For further information see our web site at www.rsc.org
Typeset by the Charlesworth Group, Wakefield, UKPrinted by Athenaeum Press Ltd, Gateshead, Tyne and Wear, UK

Preface
The utilization of polymeric materials continues to increase each year. Scientistsand engineers are now able to develop new materials that meet specific needs. Inancient times, warriors wore metal to protect themselves in battle; now soldierswear synthetics, and they are quite possibly safer than the early warriors were.In the home, plastic has replaced many items that were once metal. In the trans-portation field, the weight savings achieved by replacing a metal with a plasticis a potent driving force.
All of these changes provide opportunities for scientists, because plastic mate-rials are inherently flammable, unlike the metal items that they have replaced.For many years, halogens led the list of fire retardant elements; it did not workin every instance but one could frequently find a halogen-containing compoundthat would work. Following the change in policies in Europe in the 1990s,there has been a renaissance of activity in diverse areas, including micro- andnanocomposites.
The early history of fire retardant systems begins with the painting of woodfortifications with vinegar in 360 BC. In the 1600s, a combination of clay andgypsum was used to fire retard canvas. The first patent was granted in 1735in England for fire retardancy of textiles using alum, borax and vitriol (zinc,copper or iron sulfate). In 1820 Gay Lussac suggested the use of a mixture ofammonium phosphate, ammonium chloride and borax for textiles.
Modern fire retardants include the use of compounds of halogen, phosphorus,boron, nitrogen, aluminium, magnesium, sulfur and others. At this moment intime the halogens and phosphorus compounds appear to find the most use, butthis is certain to change. The use of halogen is diminishing in Europe, while thisprocess has begun in the United States, it is not yet complete. Fire retardantshave been applied to all types of materials, ranging from fabrics to hardplastics. There is no universally accepted material that can be used with all, oreven with several, polymers. One must discover the appropriate system for eachpolymer. As the use of halogen has declined, the need for other materials hasbecome evident.
In 1997, at the sixth European Meeting on the Fire retardancy of PolymericMaterials, several the papers were focused on the topic of intumescence and abook on this topic was produced. At the ninth meeting, held in 2003, the focus

was on mineral additives, especially those that form either micro- or nano-composites. Typical additives that may give a microcomposite are aluminatrihydrate, Al(OH)3, and magnesium hydroxide, Mg(OH)2, both of whichdecompose endothermically and release water. These materials remove a gooddeal of the heat evolved in a degradation and thus can prevent further degrada-tion. To be effective, they must be used at very high loadings, which lead insome instances to the loss of mechanical properties of interest.
Nanocomposites are formed when a small amount of an organically-modifiedaluminosilicate clay is added to a polymer. The presence of only a smallamount of clay can give a significant reduction in the peak heat release rate. Inaddition to clays, nanocomposites have been prepared using polyhedraloligosilsesquioxanes, POSS, graphites and carbon nanotubes. Clay systems arethe most well-developed, followed by POSS; little work has been performedusing graphite–polymer and nanotube–polymer nanocomposites.
The difference between the microcomposite and the nanocomposite is thedispersion of the material in the polymer. In a nanocomposite, the clay, or thenano-filler/additive, is well dispersed throughout the polymer. The typical clayconsists of particles with a high aspect ratio, their length is much longer thantheir width. Dispersion of the filler in the nanometer scale generally gives inter-esting insulation properties to a polymer, the fire retardancy being generallypoor.
Recent work deals with the association of micro-sized additives with otheradditives and/or fillers to decrease needed loadings and obtain synergistic effectsresulting from the association of nanosized additives with other additives toreach optimized fire retardancy performance. Typical studies are the object ofchapters of this book.
It gives me great pleasure to acknowledge the contributions of the organizingcommittee for this, the ninth European Meeting on Fire Retardancy ofPolymeric Materials, and especially Michel Le Bras, who took on the veryimportant function of arranging this Meeting.
Charles A. Wilkie
The latest European Meeting on Fire Retardancy and Protection of materials(FRPM’03) was held in Lille, France in September 2003. A large number of the106 presented contributions dealt with the use of halogen-free additive systemsand, more precisely, with the importance of mineral additives used alone orin association with synergistic agents (33 presentations). Two types of mineraladditives were clearly presented, depending on their initial size or on theirdistribution in the fire retarded polymeric materials.
This book presents most of the original reviews and work presented atFRPM’03, to which the Editors have added two invited reviews and four invitedpapers.
vi Preface

The various chapters have been written by experts in fire retardancy of poly-mers using microsized additives, nanosized additives or hybrid nanocompositematerials. In all, twenty Academic Research Teams and nine Institutes or Indus-trial Groups have contributed to this book and proposed different chemical orphysical approaches for the modes of protection developed by mineral additivesand fillers and their eventual economical applications. A comparatively shortlast section (4 papers) deals with the toxicity of some of these additives and of theproducts resulting from the degradation of the mineral additives/polymer formu-lations.
I should like to express my gratitude to my co-editors, every co-author and tothe numerous experts who have agreed to review these chapters.
Michel Le Bras
Preface vii

Acknowledgements
For their invaluable help with refereeing the papers included in this volume theeditors would like to thank:
Dr P. Anna (Budapest University of Technology and Economics, Hungary),Professor G. Camino (Politecnico di Torino, Alessandria, Italy),Professor P. Degée (University of Mons-Hainaut, Belgium),Professor E. Devaux (ENSAIT, Roubaix, France),Dr X. Flambard (ENSAIT, Roubaix, France),Dr P. Georlette (Dead Sea Bromide, Beer Sheva, Israel),Professor R. Hull (Bolton Institute, U.K.),Dr E. Kicko-Walczak (Instytut Chemii Przemyslowej, Warsaw, Poland)Dr S. Levchik (Akzo Nobel Functional Chemicals, New York, U.S.A.),Dr R. Lyons, (F.A.A., Atlantic City International Airport, NJ, U.S.A.),Professor Gy. Marosi (Budapest University of Technology and Economics,Hungary),Professor G. Nelson (Florida Institute of Technology, Melbourne, U.S.A.),Dr M. Nyden (BFRL, NIST, Gaithersburg, U.S.A.),Professor E. Pearce (Polytechnic University of New York, U.S.A.),Dr B. Schartel (B.A.M., Berlin, Germany),Dr K.K. Shen, (Borax/Luzenac America, Denver, U.S.A.),Professor W.H. Starnes (William and Mary College, Williamsburg (VA),U.S.A),Dr J. Troitzsch (Fire Protection Service, Wiesbaden, Germany),Professor E. Weil (Polytechnic University of New York, U.S.A.)

Contents
Abbreviations xxiv
General Considerations on the Use of Fillers and Nanocomposites
Chapter 1 An Introduction to the Use of Fillers and Nanocomposites inFire Retardancy (Invited Review) 1C.A. Wilkie1.1 Introduction 31.2 Characterization of Fire Retardancy of Polymers 31.3 Fire Retardant Fillers for Polymers 41.4 Nanocomposites 5
1.4.1 Preparation and Modeling of Nanocomposites 71.4.2 Organic Clay Modification 81.4.3 Determination of the Morphology of
Nanocomposites 91.4.4 Utility of Nanocomposites 101.4.5 Modeling of Fire Retardancy Due to
Nanocomposite Formation 101.4.6 Mechanisms by which Nanocomposites Enhance
the Fire Retardancy of Polymers 101.4.7 Fire Retardancy Due to Nanocomposite
Formation 121.5 Conclusion – the Future of Fillers and Nanocomposites
in Fire Retardancy 131.6 References 13
Micro-sized Fire Retardant Fillers
Chapter 2 Fire Retardant Fillers for Polymers (Invited Review) 19P.R. Hornsby and R.N. Rothon2.1 Fire Retardant Fillers Available 19
2.1.1 Aluminium Hydroxides 202.1.2 Magnesium Hydroxide, Mg(OH)2 202.1.3 Basic Magnesium Carbonates 212.1.4 Boehmite, AlO(OH) 21

xii Contents
2.1.5 Calcium Sulphate Dihydrate, (Gypsum)CaSO4·2H2O 21
2.2 Mechanistic Studies 222.2.1 Flame Retardancy 22
2.2.1.1 Thermal Effects from Filler 232.2.1.2 Dilution of Combustible Polymer 242.2.1.3 Filler/Polymer Interactions 252.2.1.4 Vapour Phase Action 252.2.1.5 Effects of Filler Particle Size and
Morphology 262.2.2 Smoke Suppression 262.2.3 Incandescence 27
2.3 Synergists for Hydrated Fillers 272.4 Processing and Considerations on Mechanical Property 31
2.4.1 Rheological Issues 312.4.2 Enhancement of Mechanical Properties 342.4.3 Alternative Processing Strategies for Hydrated
Fillers 352.5 Conclusions 362.6 References 37
Chapter 3 Lamellar Double Hydroxides/Polymer Composites: A NewClass of Fire Retardant Materials 42J. Lefebvre, M. Le Bras and S. Bourbigot3.1 Introduction 423.2 Description of LDHs materials 433.3 Synthesis of LDHs/Polymer nanocomposites 44
3.3.1 Intercalation of monomer molecules followedby “in situ” polymerization 44
3.3.2 Direct Intercalation of Extended Polymer ChainsBetween Ldhs Layers 44
3.3.3 Transformation of Host Material into a ColloidSystem and Precipitation in the Presence of thePolymer 44
3.4 Mechanical properties of LDHs/Polymer composites 453.5 Thermal Stability of LDHs/Polymer Nanocomposites 473.6 Flame Resistance of LDHs/Polymer Composites 503.7 Conclusions 513.8 References 52
Chapter 4 Effect of a Small Amount of Flame Retardant on theCombustion of PC, PBT and PET 54T. Ohkawa, T. Ishikawa and K. Takeda4.1 Introduction 544.2 Experimental 554.3 Results 56

xiiiContents
4.3.1 Combustion Data of Blends with PPFBS, PTFMSand PPh 56
4.3.2 Combustion of Blends with Metal Oxides, RedPhosphorous 58
4.3.3 TGA and Elemental Analysis of PC 594.4 Discussion 60
4.4.1 Degradation at Different Temperatures 614.4.2 Degradation Paths of Neat-PC and Blends 614.4.3 Estimated Char Structures 624.4.4 Degradation Routes and Flame Retardancy 63
4.5 Acknowledgement 664.6 References 66
Chapter 5 Intumescent Silicates: Synthesis, Characterization and FireProtective Effect 68C. Pélégris, M. Rivenet and M. Traisnel5.1 Introduction 685.2 Silicate Solution Chemistry 695.3 Experimental 70
5.3.1 Sample Preparation 705.3.1.1 Aqueous Silicates 705.3.1.2 Dried Silicates 71
5.3.2 Blending of Dried Silicates Powders and EthylVinyl Acetate (EVA-19%) Polymer 71
5.3.3 Characterisation 715.3.3.1 Intumescence Test 715.3.3.2 TGA Studies 71
5.3.3.3 Lixiviation Test 725.3.3.4 Infrared Spectroscopy 725.3.3.5 Fire Protective Effect 72
5.4 Results and Discussion 725.5 Conclusion 775.6 References 78
Use of Nanocomposite Materials
Chapter 6 Flammability of Nanocomposites: Effects of the Shape ofNanoparticles (Invited Review) 81T. Kashiwagi6.1 Introduction 816.2 Flammability Measurement 826.3 Polymer-Nanosilica Nanocomposites 826.4 Polymer–Clay Nanocomposites 866.5 Polymer–Carbon Nanotube Nanocomposites 916.6 Discussion 956.7 Conclusion 97

xiv Contents
6.6 Acknowledgement 986.7 References 99
Chapter 7 Thermal Degradation and Combustibility of PolypropyleneFilled with Magnesium Hydroxide Micro-filler andPolypropylene Nano-filled Aluminosilicate Composite 100S.M. Lomakin, G.E. Zaikov and E.V. Koverzanova7.1 Introduction 1007.2 Experimental 102
7.2.1 Materials 1027.2.2 Thermal Analysis 1027.2.3 Gas Chromatography/Mass Spectrometry
Analysis (GC-MS) 1027.2.4 Clay and Composite Characterization 103
7.3 Results and Discussion 1037.4 References 113
Chapter 8 Effect of the Processing Conditions on the Fire Retardant andThermo-mechanical Properties of PP–Clay Nanocomposites 114A. Bendaoudi, S. Duquesne, C. Jama, M. Le Bras, R. Delobel,P. Recourt, J.-M. Gloaguen, J.-M. Lefebvre and A. Addad8.1 Introduction 1148.2 Experimental 115
8.2.1 Materials 1158.2.2 Cone Calorimetry 1168.2.3 Thermogravimetry 1168.2.4 Dynamic Mechanical Analysis 1178.2.5 Characterization of Nanocomposites 1178.2.6 Experimental Design 117
8.3 Results and Discussion 1178.3.1 Fire Retardant Performance of PP
Nanocomposites 1178.3.2 Thermal Stability of PP/PP-g-MA/20A
Nanocomposites 1198.3.3 Dynamic Thermo-Mechanical Properties of PP
Nanocomposites 1218.3.4 Characterization of PP Nanocomposites 121
8.4 Conclusion 1238.5 References 124
Chapter 9 Fire Retardancy of Polystyrene – Hectorite Nanocomposite 126D. Wang, B. N. Jang, S. Su, J. Zhang, X. Zheng,G. Chigwada, D. D. Jiang, and C. A. Wilkie9.1 Introduction 1269.2 Experimental 127
9.2.1 Materials 1279.2.2 Organic Modification of Hectorite 128
xvContents
9.2.3 Preparation of Nanocomposites 1289.2.4 Instrumentation 128
9.3 Results and Discussions 1299.3.1 X-ray Diffraction 1299.3.2 Transmission Electron Microscopy 1299.3.3 Thermogravimetric Analysis 1319.3.4 Cone Calorimetry 131
9.4 Conclusions 1369.5 Acknowledgement 1379.6 References 137
Chapter 10 Pyrolysis and Flammability of Polyurethane – OrganophilicClay Nanocomposite 139G.E. Zaikov, S.M. Lomakin and R.A. Sheptalin10.1 Introduction 13910.2 Experimental 140
10.2.1 Materials 14010.2.2 Preparation of Organophilic Montmorillonite
(OM) 14010.2.3 Synthesis of Propylene Oxide-OM (PO-OM) 14010.2.4 Synthesis of Polyurethane–Organophilic
Montmorillonite Nanocomposite (PU-OM) 14010.2.5 XRD Characterization 14110.2.6 Pyrolysis 14110.2.7 Gas Chromatography/Mass Spectrometry
(GC-MS) Analysis 14110.2.8 Combustion Tests 142
10.3 Results and Discussion 14210.4 References 146
Chapter 11 Thermal Degradation Behaviour Of Flame–RetardantUnsaturated Polyester Resins Incorporating FunctionalisedNanoclays 147B.K. Kandola, S. Nazare and A.R. Horrocks11.1 Introduction 14711.2 Experimental 148
11.2.1 Materials 14811.2.2 Preparation of Polyester–Clay
Nanocomposites 14911.2.3 Equipment 149
11.3 Results and Discussion 14911.3.1 Thermal Degradation of Clays 15011.3.2 Thermal Degradation of Resin 15311.3.3 Effect of Different Clays on Thermal
Degradation of Resin 15311.3.4 Effect of Flame Retardants on Thermal
Degradation of Polyester Resin 155

xvi Contents
11.3.5 Effect of Clays on Thermal Degradation ofFlame Retarded Resin 156
11.4 Conclusions 15911.5 Acknowledgements 15911.6 References 159
Chapter 12 Comparative Study of Nano-effect on Fire Retardancy ofPolymer–Graphite Oxide Nanocomposites 161J. Wang and Z. Han12.1 Introduction 16112.2 Experimental 162
12.2.1 Sample Preparation 16212.2.2 Characterization Techniques 162
12.3 Results and Discussion 16212.3.1 Morphological Structure 16212.3.2 Fire Retardancy 16312.3.3 Mechanistic Study (TGA/XPS) 167
12.4 Conclusions 17412.5 References 175
Chapter 13 Styrene-Acrylonitrile Copolymer MontmorilloniteNanocomposite: Processing, Characterization andFlammability 177J.W. Gilman, S. Bellayer, S. Bourbigot, H. Stretz andD.R. Paul13.1 Introduction 17713.2 Experimentala 178
13.2.1 Preparation of Nanocomposites 17813.2.2 NMR Spectroscopy 17913.2.3 Transmission Electron Microscopy 17913.2.4 Tensile Properties 18013.2.5 Cone Calorimetry by Mass Loss Calorimeter 180
13.3 Results and Discussion 18013.3.1 Characterization by XRD and TEM 18013.3.2 T1H of Nanocomposite 18113.3.3 Tensile Properties 18313.3.4 Flammability Properties 184
13.4 Conclusion 18513.5 References 185
Micro-sized Fire Retarding Mineral Fillers
Chapter 14 Polyhedral Oligomeric Silsesquioxanes: Application toFlame Retardant Textiles (Invited Paper) 189S. Bourbigot , M. Le Bras, X. Flambard, M. Rochery,E. Devaux and J.D. Lichtenhan
xviiContents
14.1 Introduction 18914.2 Experimental 192
14.2.1 Raw Materials 19214.2.2 Processing of Nanocomposite Textiles 193
14.2.2.1 PP-POSS Multifilament Yarns 19314.2.2.2 Knitted Fabric of PP-POSS
Multifilament Yarns 19314.2.2.3 Synthesis of Polyurethane
Nanocomposite 19314.2.2.4 Polyester Fabric Coated with
Polyurethane Nanocomposite 19314.2.3 Solid State NMR 19414.2.4 Thermogravimetric Analysis 19414.2.5 Cone Calorimetry by Oxygen Consumption 194
14.3 Results and Discussion 19514.3.1 PP-POSS Multifilament Yarns 19514.3.2 TPU-POSS Coating 197
14.4 Conclusion 19914.5 Acknowledgements 20014.6 References 200
Chapter 15 Octaisobutyl POSS Thermal Degradation 202A. Fina, D. Tabuani, A. Frache, E. Boccaleri and G. Camino15.1 Introduction 20215.2 Experimental 20415.3 Results and Discussion 205
15.3.1 Thermal Degradation in Inert Conditions 20515.3.2 Thermal Degradation in Oxidative
Conditions 21015.4 Conclusions 21815.5 Acknowledgements 21915.6 References 219
Mineral Fillers in Synergistic Systems
Chapter 16 Interactions between Nanoclays and Flame Retardant Additivesin Polyamide 6, and Polyamide 6.6 Films (Invited Paper) 223A.R. Horrocks, B.K. Kandola and S.A. Padbury16.1 Introduction 22316.2 Experimental 224
16.2.1 Materials 22416.2.2 Film Preparation 22516.2.3 Flammability Measurement 22516.2.4 Thermal Analysis 225
16.3 Results and Discussion 22516.3.1 Thermal Analytical Behaviour:
Nanocomposite Character 225
xviii Contents
16.3.2 Limiting Oxygen Index Measurements 22916.3.2.1 Polyamide 6.6 22916.3.2.2 Polyamide 6 233
16.4 A Simple Model for Nanoclay–Fr Interation 23516.5 References 237
Chapter 17 Use of Clay–Nanocomposite Matrixes in Fire RetardantPolyolefin-based Intumescent Systems 239S. Duquesne, S. Bourbigot, M. Le Bras, C. Jama andR. Delobel17.1 Introduction 23917.2 Experimental 240
17.2.1 Materials 24017.2.1.1 EVA, Nanocomposite 24017.2.1.2 PP Nanocomposite 24017.2.1.3 Intumescent Systems 241
17.2.2 Fire Testing 24117.2.2.1 Cone Calorimeter 24117.2.2.2 Limiting Oxygen Index 24117.2.2.3 UL-94 242
17.3 Results and Discussion 24217.3.1 Fire Retardant Performance of EVA Based
Systems 24217.3.2 Fire Retardant Performance of PP Based
Systems 24317.4 Conclusion 24617.5 Acknowledgement 24617.6 References 246
Chapter 18 Effect of Hydroxides on Fire Retardance Mechanism ofIntumescent EVA Composition 248G. Camino, A. Riva, D. Vizzini, A. Castrovinci,P. Amigouët and P. Bras Pereira18.1 Introduction 24818.2 Experimental 249
18.2.1 Materials 24918.2.2 Combined Thermogravimetry–infrared–
evolved Gas Analysis (TGA-FTIR-EGA) 24918.2.3 Expansion Measurements 25018.2.4 Oxygen Consumption Calorimetry
(Cone Calorimeter) 25018.3 Results and Discussion 251
18.3.1 Flammability Behaviour 25118.3.2 Thermal Degradation of APP in the Presence
of MH or ATH 25218.3.2.1 ATH and MH 253
xixContents
18.3.2.2 APP 25318.3.2.3 APP–MH mixtures 25418.3.2.4 APP–ATH mixtures 257
18.3.3 Expansion Behaviour of Intumescent MixturesContaining MH 259
18.4 Conclusions 26218.5 References 263
Chapter 19 Barrier Effects for the Fire Retardancy of Polymers 264B. Schartel, M. Bartholmai and U. Braun19.1 Introduction 26419.2 Experimental 26519.3 Results and discussion 266
19.3.1 Role of Barrier Effects and Residue in CharForming Systems 266
19.3.2 The Effect of Inorganic Residue in Contrastto Char 269
19.3.3 The Role of Insulation Properties in Contrastto Mass Transfer Barrier 271
19.4 Conclusion 27319.5 Acknowledgements 27419.6 References 274
Chapter 20 Plasma Assisted Process for Fire Properties Improvement ofPolyamide and Clay Nanocomposite Reinforced Polyamide:A Scale-up Study 276A. Quédé, B. Mutel, C. Jama, P. Goudmand, M. Le Bras,O. Dessaux and R. Delobel20.1 Introduction 27620.2 Experimental 277
20.2.1 Reactor 27720.2.2 Characterization Techniques 27820.2.3 Samples 279
20.3 Results 27920.3.1 Influence of d is on Both the Deposition Rate
and The Radial Thickness Homogeneity ofFilms Deposited in the L-reactor 279
20.3.2 Comparison of Deposition Rate, RadialHomogeneity and Specific Gravity of theFilms Obtained with the Two Reactors 280
20.3.3 FTIR Study: Comparison of the ChemicalStructure of Films Obtained with the TwoReactors 280
20.3.4 SEM Study: Comparison of the Morphologyof Films Obtained with the Two Reactors 280
20.3.5 Flame Retardant Properties 282
xx Contents
20.3.5.1 LOI Tests 28220.3.5.2 Cone Calorimeter Measurements 285
20.4 Conclusions 28720.5 Acknowledgments 28920.6 References 289
Chapter 21 Fire Retardant Polypropylene/flax Blends: Use ofHydroxides 291M. Fois, M. Grisel, M. Le Bras, S. Duquesne and F. Poutch21.1 Introduction 29121.2 Experimental 293
21.2.1 Materials 29321.2.2 Fire Testings 29321.2.3 Thermogravimetric Analyses 29321.2.4 Mechanical Characterisations 294
21.3 Results and Discussion 29421.3.1 Fire Performances 29421.3.2 Mechanical Properties 298
21.4 Conclusion 29921.5 References 299
Chapter 22 Intumescence in Ethylene-Vinyl Acetate Copolymer filledwith Magnesium Hydroxide and Organoclays 302L. Ferry, P. Gaudon, E. Leroy and J.-M. Lopez Cuesta22.1 Introduction 30222.2 Experimental 303
22.2.1 Materials 30322.2.2 Processing 30322.2.3 Experimental Techniques 304
22.3 Results and Discussion 30522.3.1 Structural Characterization 30522.3.2 Thermal Analysis 30622.3.3 Fire Properties 307
22.3.3.1 Epiradiateur Test 30722.3.3.2 LOI Test 30822.3.3.3 Cone Calorimeter 309
22.4 Conclusions 31222.5 References 312
Chapter 23 Spent Oil Refinery Catalyst: A Synergistic Agent inIntumescent Formulations for Polyethylenic Materials 313L.R. de Moura Estevão, R.S.V. Nascimento,M. Le Bras and R. Delobel23.1 Introduction 31323.2 Protection Via Intumescence 314
23.2.1 Intumescent Formulations 315
xxiContents
23.3 Synergistic Agents 31523.4 Oil Cracking Catalyst 315
23.4.1 The FCC Process and Catalyst – BasicConcepts 316
23.4.2 Chemical Composition and PhysicalProperties of the Spent FCC Catalyst 316
23.5 Effect of the Catalyst on Fire Performance ofIntumescent Formulations: Are the Additives inSynergy? 31723.5.1 Effect of Catalyst Loading 31823.5.2 Effect of the Catalyst’s Particle Size 31923.5.3 Effect of the Catalyst’s Components on Flame
Retardancy 31923.5.4 Spent Catalyst and the Intumescent Layer 321
23.6 Conclusion 32423.7 Acknowledgements 32423.8 References 324
Chapter 24 Zinc Borates as Synergists for Flame Retarded Polymers(Invited Paper) 327S. Bourbigot, M. Le Bras and S. Duquesne24.1 Introduction 32724.2 Zinc Borates in Eva-Metal Hydroxides Systems 32824.3 Zinc Borates in PP-Based Intumescent Systems 33224.4 Conclusions 33424.5 References 334
Chapter 25 Fire Retardancy of Engineering Polymer Composites 336P. Anna, S. Matkó, G. Marosi, G. Nagy, X. Alméras andM. Le Bras25.1 Introduction 33625.2 Experimental 337
25.2.1 Components of Polypropylene Compounds 33725.2.2 Components of 3P Composites 33725.2.3 Compounding of Thermoplastic Composites 337
25.3 Results and Discussion 33825.3.1 Intumescent PP Compounds Containing
PA 6 Charring Component and Talc as MeltRheology Controller 338
25.3.2 Intumescent PP Compounds Containing PA 6Charring Component and Nano-Clay as MeltRheology Controller 341
25.3.3 Flame Retarded and Basalt Fibre ReinforcedThermosetting Polymer (3P) Composites 342
25.4 Conclusion 34525.5 Acknowledgement 34525.6 References 345

xxii Contents
Chapter 26 Flame Retardant Mechanisms Facilitating Safety inTransportation 347G. Marosi, S. Keszei, A. Márton, A. Szép, M. Le Bras,R. Delobel and P. Hornsby26.1 Introduction 34726.2 Experimental 350
26.2.1 Materials 35026.2.2 Methods 351
26.3 Results and Discussion 35126.3.1 Development of Nanocomposites for Forming
Internal Panels 35126.3.2 New Mechanisms for Delivering FR
Components to the Surface 35326.3.3 Development of Flame Retarded Noise
Insulating Sheets 35626.4 Conclusions 35826.5 Acknowledgement 35926.6 References 359
Effect of the Addition of Mineral Fillers and Additiveson the Toxicity of Fire Effluents from Polymers
Chapter 27 Comparison of the Degradation Products of Polyurethane andPolyurethane–Organophilic Clay Nanocomposite – AToxicological Approach (Invited Paper) 363G.E. Zaikov, S.M. Lomakin and R.A. Sheptalin27.1 Ecological Issue of Isocyanates and Pyrolysis of
Polyurethane Nanocomposite 36327.2 Occupational Exposure 36427.3 Health Effects 365
27.3.1 GC-MS Pyrolysis 36527.4 Conclusion 37027.5 References 370
Chapter 28 Mechanisms of Smoke and CO Suppression from EVAComposites 372T.R. Hull, C.L.Wills, T. Artingstall, D. Price and G.J. Milnes28.1 Introduction 37228.2 Experimental 376
28.2.1 Materials 37628.2.2 Burning Behaviour 376
28.3 Results 37728.3.1 Correlation of Physical Fire Models 37728.3.2 Smoke 382
28.4 Conclusions 38228.5 Acknowledgements 38428.6 References 384

xxiiiContents
Chapter 29 Products of Incomplete Combustion from Fire Studies in thePurser Furnace 386C.L. Wills, J. Arotsky, T.R. Hull, D. Price, D.A. Purser andJ. Purser29.1 Introduction 38629.2 Experimental 387
29.2.1 Materials 38729.2.2 Apparatus 38729.2.3 Secondary Oxidiser 389
29.3 Results 38929.3.1 Mass Loss 38929.3.2 Effluent Oxygen 39029.3.3 Carbon Dioxide 39029.3.4 CO2/CO Ratio 39129.3.5 Secondary Oxidiser 39229.3.6 CO Yield 39329.3.7 Smoke 394
29.4 Discussion 39429.5 Conclusions 39729.6 Acknowledgements 39729.7 References 397
Chapter 30 Improved and Cost-efficient Brominated Fire RetardantSystems for Plastics and Textiles by Reducing orEliminating Antimony Trioxide 399R. Borms, R. Wilmer, M. Peled, N. Kornberg, R. Mazor,Y. Bar Yaakov, J. Scheinert and P. Georlette30.1 Introduction 39930.2 Polypropylene (PP) 39930.3 High Impact Polystyrene (HIPS) 40130.4 Styrenic Copolymers 40330.5 Polyamide 40430.6 Polycarbonate (PC) and its Alloys with ABS 40630.7 Textile Back-Coating 40830.8 Conclusion 40930.9 Aknowledgement 40930.10 References 409
Subject Index 412
Abbreviations
Polymers and ProductsABS acrylonitrile-butadiene-styrene copolymerBPO benzyl peroxideBSil polyboroxosiloxane elastomersEP epoxy resinEVA copolymer ethylene/vinyl acetateHDI hexamethylene diisocyanateHIPS high impact polystyreneIPP intumescent polypropyleneLLDPE, LDPE linear, low density polyethyleneMDI methylenediphenyl diisocyanate oligomerPAE poly(acrylic ester)PAN poly(acrylonitrile)PA-6 polyamide-6PA11 polyamide 11PA-6,6 polyamide-6.6PBT poly(butylene terephthalate)PC polycarbonatePE polyethylene“PEMUBEL” EVA/SBS/PS blendPEO poly(ethylene oxide)PET poly(ethylene terephthalate)PLGO polymer-layered graphite oxidePLS polymer-layered silicatesPMMA poly(methyl methacrylate)PO propylene oxidePP polypropylenePP/MA, PPgMA polypropylene graft maleic anhydridePPO poly(phenylene oxide)PS polystyrenePS-b-PEO poly(styrene-ethylene oxide) block copolymerPU polyurethanePVA poly(vinyl alcohol)PVC poly(vinyl chloride)PVDC poly(vinylidene chloride)SAN styrene-acrylonitrile copolymerSBS styrene-butadiene-styrene triblock polymerTDI toluene diisocyanate

THF tetrahydrofuranTPU thermoplastic PUVB, VB16 styryldimethylhexadecylammonium chloride3P system of methyldiphenyl isocyanate oligomer and water
glass
AdditivesAPP ammonium polyphosphateATH alumina trihydrate (aluminium hydroxide)BD butanediolBentone SD-1 organophilic montmorilloniteBEO brominated epoxy resinCl clayCloisite organically modified montmorilloniteC20A modified montmorillonite (cloisite 20A)DPDPO decabromodiphenyl oxideDPO diphenyl oxide groupDP-POSS dodecaphenyl-POSSE. Cat exhaust FCC catalystENC expandable nanocompositeFBZB, FB290, zinc boratesFB415, FB500FCC fluid-bed catalytic crackingFQ-POSS poly(vinylsilsesquioxane)FR-245 tris(tribromophenyl) cyanurateFR-1808 brominated trimethylphenyl indanF-3020 tribromophenol end-capped brominated epoxyG5 glass fibreIPDI isophorone diisocyanateKC8 potassium graphiteLDHs layered double hydroxidesM adhesion promoter in intumescent PPMB magnesium tetraborateMEG milled and sifted ECatmelabis bis(2,6,7-trioxa-1-phosphabicyclo[2.2.2]octane-4-
methanol) phosphateMH magnesium hydroxideMMT modified montmorilloniteMWNT multi-walled carbon nanotubeNH melamine phosphateNW dipentaerythritol/melamine phosphateOib-POSS octaisobutyl POSSOM organophilic montmorillonitePER pentaerythritolPOL polyol; pentaerythritol

POSS polyhedral oligomeric silsesquioxanesPOTM polyoxytetramethylene glycolPPFBS perfluorobutane sulfonic acid potassium saltsPPh polyhydroxyphenolPPOL phosphorylated polyolPr red phosphorusPTFMS trifluoromethane sulfonic acid potassium saltsRed-P red phosphorusT talcTHPC-urea tetrakis(hydroxymethyl)phosphonium chloride urea
precondensateTMDS tetramethyldisiloxaneZB, Zn B zinc borateZHS (Flamtard H) zinc hydroxystannate10A dimethylbenzylhydrogenated tallow

General Considerations on the Use ofFillers and Nanocomposites
3
CHAPTER 1
An Introduction to the Use ofFillers and Nanocomposites inFire RetardancyCHARLES A. WILKIE
Department of Chemistry, Marquette University, PO Box 1881, Milwaukee,WI 53201, U.S.A. ([email protected])
1.1 IntroductionThis chapter is to serve as an introduction to the very broad topic of the use offillers, both well-dispersed and less well-dispersed, in polymers. When the filleris well-dispersed, a nanocomposite results in which a layered material has beenseparated into its constituent layers and these can either maintain the registrybetween the layers, an intercalated system, or this registry may be lost, an exfo-liated system. When a well-dispersed system is obtained, loadings of 3 to 5% aresufficient to cause a large increase in mechanical properties and a significantreduction in the rate of peak heat release. Conversely, if the layers are not well-separated, or if there are no layers that can be separated, the filler is not well-dispersed and a simple filled system is obtained; typical loadings of 60% ormore are required to confer fire retardancy in such systems and this invariablyhas an adverse effect on both strength and toughness of the composite, which canbe ameliorated by judicious use of surface treatments.
1.2 Characterization of Fire Retardancy of PolymersThe evaluation of fire retardancy is carried out by a variety of techniques, mostof which do not correlate well with other test protocols. The three most commonmethods that are used are the oxygen index, the UL-94 test, and cone calori-metry. Oxygen index is an evaluation of the ease of extinction of a fire, howrapidly does the flame chemistry lead to extinction. The measurement consistsof determining the minimum concentration of oxygen in a nitrogen–oxygenmixture that will sustain combustion. The more the value of the oxygen index is

4 Chapter 1
above the percentage of oxygen in the air, the better the system is considered tobe. This does not mean that a material with a high oxygen index will not burn,the test measures the ease of extinction of the fire. The UL-94 test measures theease of ignition; in this test a sample is ignited and the time for self extinguish-ment is determined. The results of this test permit a ranking of the material. Thecone calorimeter measures a third parameter, the rate at which heat is releasedin a fire. In many cases, this is considered to be the most definitive test, but itstill does not necessarily correlate with the other tests. From a cone calorimetryexperiment, one can obtain the mass loss rate, the total heat released, the quan-tity of smoke that is produced and the amount of carbon monoxide and carbondioxide that are evolved.
1.3 Fire Retardant Fillers for PolymersThe major materials that are used as fire retardant fillers for polymers arealumina trihydrate, ATH, (Al2O3·3H2O) and magnesium hydroxide, MH,(Mg(OH)2).1,2 There are various forms for both of these materials, both naturallyoccurring and synthetic, and the reader is referred to references 1 and 2 for infor-mation on these forms. These two materials account for more than 50% byweight of the world-wide sales of fire retardants; as much as 400 kt annum−1 iscurrently used. Most of this is low cost ATH that is used in thermosetting resins.The use of ATH is limited to those polymers processed below about 200°C whileMH is stable above 300°C and thus can be used in polymers that must beprocessed at higher temperatures. Their effectiveness comes from the fact thatthey both decompose endothermically and consume a large amount of heat,while also liberating water, which can dilute any volatiles and thus decrease thepossibility of fire. For ATH, decomposition begins near 300°C and consumes1270 joules per gram of ATH; for MH, decomposition begins at somewhathigher temperature, near 400°C, and consumes 1244 joules per gram of MH.There is some tendency for MH to catalyze the degradation of some polymers;in unsaturated polyester resins it can act as a chain extender, affecting resinrheology. A major use of both ATH and MH is in low smoke, halogen-free wireand cable applications, where there is significant commercial activity.3
With some polymers, the resin and the additive might interact, and so onemust be aware of these possibilities as these will influence the mode of action.4
With polypropylene, 60% loading of MH gives an oxygen index of 26, whilewith polyamide-6, the same loading gives an oxygen index of almost 70.5 Boththe heat capacity of the filler and the endothermic decomposition may affectthe fire retardancy. Analysis of the combustion gases produced just above theoxygen index value can enable one to ascertain the relative contributions ofthe decomposition endotherm and the heat capacity.2 With polypropylene,polyphenylene oxide, poly(butadiene terephthalte) and acrylonitrile-butadiene-styrene terpolymer, both MH and ATH break down to give the metal oxides,which, when combined with whatever amount of carbonaceous char is formed,provide an effective thermally insulating barrier, leading to fire retardancy.

5Use of Fillers and Nanocomposites in Fire Retardancy
In a cone calorimetry study, compositions of polypropylene (PP) that containthe same mass of either glass beads or MH have been examined. In both casesthe heat release rates were significantly reduced, but the reduction was fargreater for MH, even though both materials are considered to be inert fillers.6
This may suggest that MH is not simply an inert filler. The degradation of MHfilled PA-6 and PA-6,6 has been studied and it was found that the presence ofMH enhances the degradation of the polyamide.7 This was attributed to therelease of water from the decomposition of MH and its subsequent attackon the polyamide. With PA-6,6, polymer degradation occurred before MHdecomposition, while with PA-6 there is better overlap between MH and PA-6degradations, resulting in enhanced fire retardancy.
With polyethylene, both MH and ATH give the same oxygen index at anequivalent loading level. Conversely, in EVA (30% vinyl acetate content) MHgives an oxygen index of 46 while with ATH the value is 37. It was suggestedthat this difference is due to the loss of acetic acid from the polymer either delay-ing water loss (ATH) or accelerating this process (MH).8
Another area in which the metal hydroxides excel is smoke suppression.These hydrated fillers not only reduce the smoke release but they also can delaythe time at which it is released, and thus provide additional time for escape froma fire.5 Little work has been done on the process by which smoke suppressionmay occur, but the best guess is that carbon, from polymer degradation, isdeposited on the oxide and this is then volatilized as carbon dioxide, resultingin no smoke.9 This may be an area in which someone can make a very usefulcontribution.
As in any fire retardant system, synergy can be useful. Combinations thathave been used include ATH with MH (giving an increased range of endother-mic decomposition),10 ATH with red phosphorus (enabling lower loadings),11
MH with melamine and novolac in PP;12 several additional examples are givenin reference 2.
1.4 NanocompositesNanocomposites are a new class of inorganic materials that only somewhatrecently have begun to be used to achieve fire retardancy. The initial discoveryis that a polyamide-6clay nanocomposite, containing 5% clay, shows anincrease of 40% in tensile strength, 68% in tensile modulus, 60% in flexuralstrength and 126% in flexural modulus, while the heat distortion temperatureincreases from 65 to 152°C and the impact strength is lowered by only 10%.12,13
The initial work, which was not yet recognized as nanocomposites, actuallytook place sometime earlier when Blumstein synthesized poly(methyl methacry-late) in the presence of a clay and found that the clay had a templating effect onthe formation of the polymer.14–19 The significance of these observations was notrealized for several years and this work has taken on more importance since theadvent of the nano era.
6 Chapter 1
Nanocomposites may be produced using several different materials for thenano-dimensional material, including clays, graphites, carbon nanotubes, andpolyhedral oligosilsesquioxanes, POSS. Most work to date has been with clays,particularly with montmorillonite clay, an alumina-silicate material. A widevariety of other clays naturally occur, but, for some reason, montmorillonitehas been by far the chosen material, probably because interesting results wereobtained with this clay.
Surprisingly, graphite has not been more widely used; one concern may bethat the d-spacing in most organically-modified montmorillonites is in the rangeof 2 or 3 nm while graphite has a d-spacing of about 2 or 3 Å. To form ananocomposite, the polymer must be able to enter into the gallery space of thenanomaterial, and this may require that this space be large enough to permit thepolymer to begin to enter. Graphite does form a number of intercalation com-pounds in which the d-spacing is large. For instance, potassium graphite, KC8has a d-spacing of 5.5 Å and that of graphite sulfuric acid is even larger.20,21
Possibly, if one begins with an already expanded graphite, a d-spacing inthe range of 2 to 3 nm at least, that graphite may become more useful as anano-dimensional material for nanocomposite formation.
Carbon nanotubes are, of course, a newer discovery and they are still quiteexpensive. There is still some activity in this area;22–24 the major difficulty withthe single wall nanotubes appears to be the need to organically-modify thenanotubes to make them more organophilic, this is probably also a limitationwith the graphite system also. The multi-wall nanotubes do not require organicmodification for nanocomposite formation. There has been little work on the fireretardancy of nanocomposites using carbon nanotubes.25–27 The polymers thathave been investigated include polypropylene and ethylene/vinyl acetate, EVA,and the reductions in PHRR are comparable to those seen with clays.
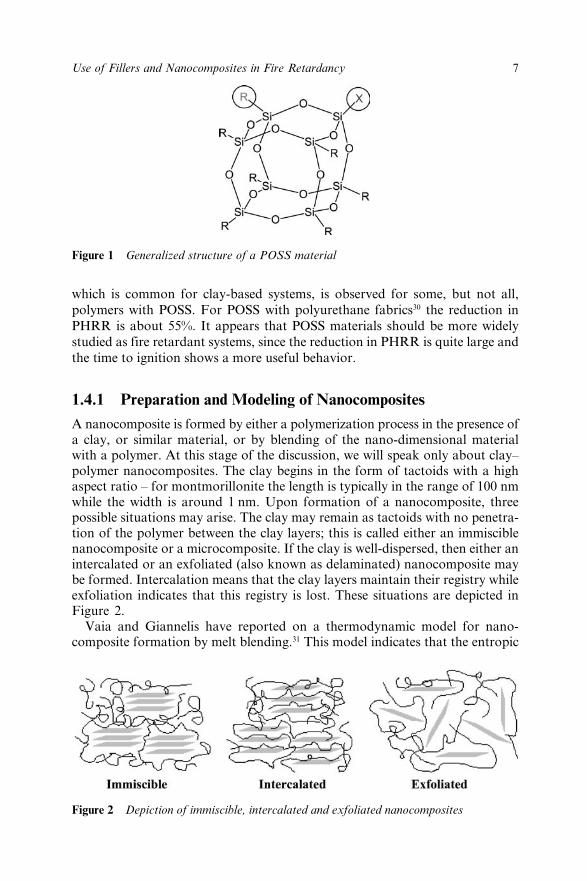
Polyhedral oligomeric silsequioxanes, POSS, are a unique class of materialsthat have the general formula (RSiO1.5)n.28 At least some of the R groupsare usually unreactive, as phenyl, methyl, etc., but one can also incorporateone or more reactive groups, e.g., styryl, methacrylate, etc. The presence of apolymerizable substituent enables the formation of polymers, either by directpolymerization or co-polymerization with another monomer. The diameter ofthe POSS is typically on the order of 15 Å and they are, in general, easily incor-porated into a polymer matrix. The generalized structure of a POSS systemis shown in Figure 1. This consists of substituents R, which are unreactive andprovide for compatibilization and solubility, and reactive groups X (only one ofwhich is shown in this figure but more are possible) attached to a chemically andthermally robust hybrid framework. The composition is intermediate betweenthat of silica and silicones; it offers a precise three-dimensional structure forreinforcement at the molecular level of polymers segments.
There has been much less work in fire retardancy with POSS than with clays,one US patent29 and one paper.30 The patent shows that POSS significantlyreduces the PHRR for a polyether-block-polyamide system (50–70% reduction),for polypropylene (a 40% reduction) and a styrene-butadiene-styrene (SBS)triblock polymer (40–60% reduction). The decrease in the time to ignition,
7Use of Fillers and Nanocomposites in Fire Retardancy
which is common for clay-based systems, is observed for some, but not all,polymers with POSS. For POSS with polyurethane fabrics30 the reduction inPHRR is about 55%. It appears that POSS materials should be more widelystudied as fire retardant systems, since the reduction in PHRR is quite large andthe time to ignition shows a more useful behavior.
1.4.1 Preparation and Modeling of NanocompositesA nanocomposite is formed by either a polymerization process in the presence ofa clay, or similar material, or by blending of the nano-dimensional materialwith a polymer. At this stage of the discussion, we will speak only about clay–polymer nanocomposites. The clay begins in the form of tactoids with a highaspect ratio – for montmorillonite the length is typically in the range of 100 nmwhile the width is around 1 nm. Upon formation of a nanocomposite, threepossible situations may arise. The clay may remain as tactoids with no penetra-tion of the polymer between the clay layers; this is called either an immisciblenanocomposite or a microcomposite. If the clay is well-dispersed, then either anintercalated or an exfoliated (also known as delaminated) nanocomposite maybe formed. Intercalation means that the clay layers maintain their registry whileexfoliation indicates that this registry is lost. These situations are depicted inFigure 2.
Vaia and Giannelis have reported on a thermodynamic model for nano-composite formation by melt blending.31 This model indicates that the entropic
Figure 1 Generalized structure of a POSS material
Figure 2 Depiction of immiscible, intercalated and exfoliated nanocomposites

8 Chapter 1
penalty for polymer confinement may be compensated by the increased confor-mational freedom of the tethered chains as the clay layers separate. Completelayer separation depends upon the establishment of very favorable polymer–organically modified clay interactions to overcome the penalty of polymerconfinement. The total entropy change is near zero, if complete layer separationis achieved, and the polymer is now not confined.
Balazs et al.32 have also modeled the behavior of polymer–clay nano-composites and they have shown that immiscibility occurs for the naturalclay and polymers with a degree of polymerization of 100. When the clay isorganically-modified, there can be favorable enthalpic interactions between thesurfactant and the polymer, which can overcome the unfavorable entropy termand lead to efficient mixing. The formation on a intercalated or exfoliatedsystem depends upon the length of the surfactant chain, the density of the surfac-tant on the clay, and the molecular weight of the polymer. It appears that if thelength of the surfactant and the polymer are similar, then some of the entropicbarrier is overcome and this will lead to easier nano-dispersion. When theamount of surfactant increases, the surfactant becomes denser and it becomesmore difficult for the polymer chains to penetrate and good nano-dispersionwill become more difficult. Finally, if one can produce attractions between thesurfactants and the polymer, this highly attractive surface interaction canlead to exfoliation. Thus, one may conclude that the design of the surfactantis extremely important for success in the preparation of polymer–claynanocomposites.
1.4.2 Organic Clay Modification
The gallery space of a typical clay is hydrophilic, based on the presence of thesodium cations and the alumino-silicate framework of the clay. To permit theinsertion of a hydrophobic polymer within this gallery space, one must firstrender this gallery space organophilic. This is most typically accomplished byion exchanging the sodium cation for an organophilic ammonium salt; the usualrequirement is that there must be at least one long chain or twelve carbons ormore on the nitrogen atom of the ammonium cation. As noted above, theoreticalstudies have shown that an attractive interaction between the surfactant and thepolymer greatly enhances the possibility of nano-dispersion of the clay withinthe polymer. Thus, one should pay careful attention to the type of surfactantthat is used. In addition, the thermal degradation of many surfactants begins attemperatures as low as 200°C by the Hofmann elimination, giving an olefin anda tri-substituted ammonium cation.33,34 The loss of the long chain will frequentlyeliminate the possibility of nano-dispersion.
Several different counterions have been used to enhance the organophilicityof the clays; the reader will usually think of the ‘onium’ ion, which is usuallytaken to include ammonium and phosphonium ions. Brief mention should bemade of the single example of a stibonium-substituted clay and its polystyrenenanocomposite.35 The initial degradation step, which is the loss of the olefin,occurs at slightly higher temperature but the degradation stops at this stage and

9Use of Fillers and Nanocomposites in Fire Retardancy
there is no loss of the stibine, meaning that the counterion of the clay is R3SbH+
and this should impart additional thermal stability to the clay and itsnanocomposites. There has been some work in which oligomeric ammoniumand phosphonium ions have been used to enhance the interaction between thepolymer and the surfactant.36–40 Three types of oligomers have been examined,styrene, methacrylate and butadiene. For both styrene and methacrylate,copolymers of the monomer with vinylbenzyl chloride, containing about 1 to 2benzylic chlorides per oligomer, have been prepared and then the benzylicchloride has been used to quaternize an amine, giving a new ammonium salt.For butadiene, the authors used an oligomeric polybutadiene and graft copoly-merized vinylbenzyl chloride to the butadiene. Best results were obtained withthe styrenic copolymer; exfoliation was observed when this organically-modified clay was melt blended with polystyrene in a Brabender mixer. Evenwith unmodified polypropylene, an almost exfoliated nanocomposite is formedin the Brabender; it is assumed that complete exfoliation will be obtained ifhigher shear is applied. With both the methacrylate-modified and the butadiene-modified clays, immiscible materials are usually formed. Quite recently, Zhanghas shown that one may use a substituted tropylium ion as the counterion for theclay and produce styrene nanocomposites.41
1.4.3 Determination of the Morphology of Nanocomposites
The determination of morphology is usually dominated by two techniques,X-ray diffraction, XRD, and transmission electron microscopy, TEM. XRDenables the determination of the d-spacing of the clay. An immiscible system isobtained if the d-spacing in the presence of the polymer is unchanged from thatof the pristine clay. If the d-spacing increases, this indicates that intercalationhas occurred. Since the registry between the clay layers is lost in an exfoliatedsystem, no peak is expected. Unfortunately, this same situation will occur if theclay has extensively disordered, so XRD information alone is not enough toidentify the morphology. TEM is usually used to address this question, since onecan directly image the clay and polymer and identify the type of morphology.This type of measurement is frequently considered to be definitive. One mustremember that to obtain one TEM requires only a miniscule piece of materialand one cannot be certain that this is representative of the whole. The morphol-ogy can only be clearly determined by either sampling enough of the materialby TEM so that one has statistical significance or by sampling the bulk of thesample.
A recently reported NMR technique to identify the morphology is based onproton NMR relaxation measurements.42–44 The relaxation time depends uponthe separation between nearest polymer–clay interfaces and the efficiency ofparamagnetically-induced relaxation,45 due to iron that is naturally present inthe clay. An immiscible system will have the largest separation and thus thelongest relaxation time while an exfoliated system has the smallest distance andthe shortest time.

10 Chapter 1
It appears that cone calorimetry may also be used as a method to samplethe bulk. Some of the early work on nanocomposites showed that immisciblesystems showed no reduction in the peak heat release rate, PHRR, while interca-lated and exfoliated nanocomposites gave significant reductions.46 In work fromthese laboratories, we have confirmed this observation and shown that thereseems to be a correlation between the extent of nano-dispersion and the reduc-tion in PHRR.
The classic definition of intercalation and exfoliation depends on the XRDand there is a need for new definitions based on other techniques. At this time,one can never be sure how an author is defining the nano-morphology so theseterms are somewhat ambiguous.
1.4.4 Utility of NanocompositesThere are currently believed to be four areas in which nanocomposite formationmay be important: permeability, heat distortion temperature, flexural modulusand fire retardancy. A review has covered many of these enhanced properties.47
The type of nanocomposite is important for some of these properties but unim-portant for others. The permeability of a polymer is attributed to the tortuosityof the path that a gas must follow to penetrate a polymer, and the presenceof exfoliated clay layers will make the path more difficult and thus lead to adecrease in permeability. It is also felt that exfoliation is an advantage formechanical properties. However, there appears to be no difference betweenintercalated and exfoliated polymer–clay nanocomposites for fire properties.
1.4.5 Modeling of Fire Retardancy Due to NanocompositeFormation
Nyden and Gilman48 have simulated the thermal degradation of polypropylenethat is nano-confined in a graphite matrix. They used graphite for convenience,since they have computational experience dealing with hydrocarbons but notwith clays. The model consisted of four chains of isotatic polypropylene, eachwith 48 monomer units, contained within a graphite sheet of 600 carbons, end-capped with hydrogens. The degradation mechanism for the virgin polymer andthe nanocomposite were unchanged in this simulation; the process involves therandom scission of the CH–CH3 bonds, followed by b-scission of the backbone toproduce secondary free radicals, which then can unzip. Interactions with thegraphite layer imparts a degree of stabilization when the graphite layers areseparated by 2.8 to 3.2 nm. There is no reason to think that the results would besignificantly different if clay were the nano-dimensional material.
1.4.6 Mechanisms by which Nanocomposites Enhance the FireRetardancy of Polymers
Two mechanisms have been proposed to explain how nanocomposite formationcan reduce the PHRR of a polymer. Gilman et al.49 have proposed that the

11Use of Fillers and Nanocomposites in Fire Retardancy
degradation of the nanocomposite produces a multi-layered carbonaceous-silicate structure that may act as an excellent insulator and also as a barrier tomass transport. Zhu et al.50 have shown that the presence of iron in the clay canlead to some radical trapping reactions that will lower the heat release rate. Itappears that at low amounts of clay the paramagnetic radical trapping is effec-tive while the barrier mechanism becomes more important at higher amounts ofclay. In a series of papers, Wang et al.51 have shown that the alumino-silicatebarrier proposed by Gilman et al. does form for both polystyrene and methylmethacrylate nanocomposites. For nanocomposites of poly(vinyl chloride), thesurface is covered with carbon. This difference is no doubt due to the differentdegradation pathways of the polymers; PVC normally degrades to give charwhile neither PS or PMMA are char-formers.
Gilman et al.49 have found that polystyrene-fluorohectorite nanocompositesdo not show a reduced PHRR, even though the same polymer with montmorillo-nite gives a reduction of more than 50% in PHRR. They note that there isa difference in chemical composition, aspect ratio, and nano-morphology andthat they cannot assign the difference to any one of these. In recent work fromthis laboratory, polystyrene-magadiite nanocomposites have been prepared.52
Magadiite, like fluorohectorite, is an all silicate material. Again no reduction inPHRR is observed and the differences include the composition, aspect ratio andnano-morphology. With magadiite, the morphology, based on TEM, shows arather large immiscible component; the improvement in mechanical propertiesargues that there is also a large intercalated or exfoliated component. Polysty-rene-hectorite nanocomposites53 have also been examined. Here the PHRRshows a reduction, but only at greater than 3% clay. With montmorillonite,a reduction is seen even when the clay amount is as low as 0.1% organically-modified clay. Advances in fire retardancy will require an identification of whatcauses these various clays to behave differently.
To further complicate the situation, work has been carried out using graphiteas the nano-dimensional material. The graphite that has been used is both sulfu-ric acid-graphite and modified graphite oxides.54–56 In both cases, the reductionin PHRR is equivalent to the best values that have been obtained with montmo-rillonite. One may well expect that the nano-morphology, the aspect ratio and,certainly, the chemical composition of graphite are quite different than those ofany of the clays, yet the fire retardancy, at least as measured by the reductionin PHRR, is equivalent. This is an additional area of challenge for the FRnanocomposite community to attempt to explain these observations.
The reduction in PHRR is different for each polymer and the values for bothmontmorillonite and graphite systems are shown in Table 1. The differences arestriking, for instance with clay-PMMA, the best reduction in PHRR is 25%while polyamide-6 and polystyrene give values in the 60% range. If the mecha-nism is barrier formation, one would expect that the same barrier would be builtin each case and this would be expected to lead to similar reductions for eachcase. Recent work using TGA/FTIR methods has shown that the clay appears tochange the degradation pathway of polystyrene.57 The degradation of polysty-rene proceeds to give a mixture of oligomer and monomer; this is expectedbased upon the structure, which requires that a secondary and a primary radical

12 Chapter 1
be produced upon bond cleavage. These unstable radicals will hydrogenabstract, giving a more stable radical with concomitant formation of oligomer.The degradation process of a PS-montmorillonite clay nanocomposite ischanged so that much less monomer is seen, but oligomer is still produced.
1.4.7 Fire Retardancy Due to Nanocomposite FormationThe literature on the fire retardancy of nanocomposites has been recentlyreviewed58 and the reader is referred to this review for specific information onpolymers that have been studied. In this section, we will only describe thegeneral details of fire retardancy due to nanocomposite formation. Fire retar-dancy is usually measured by cone calorimetry, particularly the reduction in thepeak heat release rate, PHRR. Notably, a nanocomposite in which the clayis well-dispersed, whether intercalated or exfoliated, appears to give the samereduction in the PHRR. However, if one considers that all of the heat from thepolymer is eventually released, the nanocomposite does not truly form a perma-nent barrier but rather an impermanent barrier that still permits the remainingpolymer to degrade. It is the opinion of this author that nanocomposites alonewill never solve the problem of fire retardancy but they can be a component ofthe solution. This author advocates the synergistic combination of a clay withsome other fire retardant system. In such a system, the role of the clay will likelybe to maintain the desirable mechanical properties of the polymer that maybe lost by the presence of some other additive. In this case, the type of nano-dispersion may be very important and the formation of exfoliated systemsmay be required to achieve the level of fire retardancy required while maintain-ing the needed mechanical properties.
One advantage that nanocomposite formation may have for fire retardancypurposes is the improvement in mechanical properties that usually occursthrough the formation of the nanocomposite. Many fire retardants are used atvery high loadings, which can significantly impact the physical properties of thepolymer. Clays may function synergistically with other fire retardants, andthe presence of the clay may counteract any deleterious effects from the fireretardant and make these more useful.
Table 1 Reduction in PHRR for clay–polymer and graphite–polymer nano-composites; values taken from references cited in the text.(irradiance level is 35 kW m−2 in every case)
% reduction for clay-polymer % reduction for graphite–Polymer nanocomposite polymer nanocomposite
Polystyrene 57 48HIPS 40 36ABS 45 48Polyamide-6 63 62Poly(methyl methacrylate) 25 35PP-g-MA 54EVA 47

13Use of Fillers and Nanocomposites in Fire Retardancy
The usual measure that is used to evaluate the fire retardancy of nano-composites is the cone calorimeter, which measures the rate of heat release andmass loss rate, along with smoke and carbon monoxide and carbon dioxide, asa function of the applied radiant energy. The effects that one would like to seeare that the time to ignition and the time to peak heat release are increased whilethe peak heat release rate (PHRR), the total heat released and the mass loss rateare lowered; if one can have every wish, the amount of smoke and CO will alsobe reduced. In actuality, the peak heat release rate is usually decreased uponnanocomposite formation but the time to PHRR is unchanged and the timeto ignition is decreased. Significantly, the total heat released is unchanged,which means that all of the polymer does eventually burn. Nanocompositeformation appears to lengthen the time of burning but none of the polymer isretained. The mass loss rate is somewhat decreased and the smoke is not muchchanged.
1.5 Conclusion – the Future of Fillers andNanocomposites in Fire Retardancy
The role of the ATH and MA type filler in fire retardancy is assured, since theseare now used on a commercial scale and they are affordable. The rather highprice currently charged for modified clays means that the clays must clearlyoutperform other systems before they will make inroads into the marketplace. Itis the opinion of this author that clays alone will not be used as fire retardantsbut they may be a component of the solution to the problem of fire retardancy.Synergy has been demonstrated between conventional fire retardants andnanocomposite formation in a few cases.59–62 There will need to be additionalinvestigations of this type to confirm the observations that have been made andto evaluate the different conventional fire retardants that could be used. Theadvantage that the clay brings to fire retardancy is the improvement in mechani-cal properties and this means that one can add some other material, the fireretardant, that may cause a deterioration of the mechanical properties. Thisopens the door to new opportunities with combinations of materials.
1.6 References1. W.E. Horn, Jr., in Fire Retardancy of Polymeric Materials, A.F. Grand
and C.A. Wilkie (eds.), Marcel Dekker, New York, 2000, pp. 285–352.2. P.R. Hornsby, Int. Mater. Rev., 2001, 46, 199.3. J. Jow and D. Gomolka, US Patent 5482990A, 1996; E. Sezaki, M. Akami
and H. Endo, European Patent 0331358; Y. Yamamoto and M. Tanmachi,Japanese Patent 04253748.
4. P.R. Hornsby, Macromol. Symp., 1996, 108, 203.5. P.R. Hornsby, Fire Mater., 1994, 18, 269.6. P.R. Hornsby and A. Mthupha, Plast. Rubber Compos. Process. Appl.,
1996, 25, 347.

14 Chapter 1
7. P.R. Hornsby, J. Wang, G. Jackson, R. N. Rothon, G. Wilkinson andK. Cosstick, Polym. Degrad. Stab., 1996, 51, 235.
8. J. Rychly, K. Vesely, E. Gal, M. Kummer, J. Jancar and L. Rychly,Polym. Degrad. Stab., 1990, 30, 57.
9. P.R. Hornsby and C.L. Watson, Plast. Rubber Process. Appl., 1989, 11,45.
10. G.L. Kirshenbaum, Kunstst. J., 1989, 79, 62.11. H. Staendeke, FRCA meeting, Spring 1988.12. E.D. Weil, M. Lewin and H.S. Lin, J. Fire Sci., 1998, 16, 383.13. Y. Kojima, A. Usuki, M. Kawasumi, A. Okada, Y. Fukushima,
T. Kurauchi and O. Kamigaito, J. Mater. Res., 1993, 8, 1185.14. A. Blumstein, J. Polym. Sci.: Part A, 1965, 3, 2653.15. A. Blumstein, J. Polym. Sci.: Part A, 1965, 3, 2665.16. A. Blumstein and F. W. Billmeyer, J. Polym. Sci.: Part A-2, 1966, 4, 465.17. A. Blumstein, R. Blumstein and T.H. Vandersppurt, J. Colloid Interface
Sci., 1969, 31, 236.18. A. Blumstein, S. L. Malhotra and A. C. Watterson, J. Polym. Sci.: Part
A-2, 1970, 8, 1599.19. A. Blumstein, K.K. Parikh, S.L. Malhotra and R. Blumstein, J. Polym.
Sci.: Part A-2, 1971, 9, 1681.20. W. Rudroff, Adv. Inorg. Radiochem., 1959, 1, 233.21. G.R. Henning, Prog. Inorg. Chem., 1959, 2, 125.22. C.A. Mitchell and R. Krishnamoorti, Proc. Addit. 2003, April, 2003.23. H. Koerner, C.-S. Wang, R.A. Vaia, M.D. Alexander, N.A. Pearce and
H. Bentley, Proc. Addit. 2003, April, 2003.24. C.A. Mitchell, J.L. Bahr, S. Arepalli, J.M. Tour and R. Krishnamoorti,
Macromolecules, 2002, 35, 8825.25. G. Beyer, Fire Mater., 2002, 26, 291.26. T. Kashiwagi, E. Grulke, J. Hilding, R. Harris, W. Walid and J. Douglas,
Macromol. Rapid Commun., 2002, 23, 761.27. T. Kashiwagi, E. Grulke, J. Hilding, J. Shields, R. Harris, W. Awad
and J. Douglas, Abstract of 9th European Meeting on Fire Retardancy,September, 2003.
28. G. Li, L. Wang, H. Ni and C. U. Pittman, Jr., J. Inorg. Organmet. Chem.,2002, 11, 123.
29. J.D. Lichtenhan and J.W. Gilman, “Preceramic additives as fire retardantsfor plastics,” US 6,362,279 B2, issued March 26, 2002.
30. E. Devaux, M. Rochery and S. Bourbigot, Fire Mater., 2002, 26, 155.31. R.A. Vaia and E.P. Giannelis, Macromolecules, 1997, 30, 7990.32. A.C. Balazs, C. Singh, E. Zhulina and Y. Lyatskaya, Acc. Chem. Res.,
1999, 32, 651.33. W. Xie, Z. Gao W-P. Pan, R. Vaia, D. Hunter and A. Singh, Polym.
Mater. Sci Eng., 2000, 83, 284.34. J. Zhu, A.B. Morgan, F.J. Lamelas and C.A. Wilkie, Chem. Mater., 2001,
13, 3774.35. D. Wang and C.A. Wilkie, Polym. Degrad. Stab., 2003, 82, 309.

15Use of Fillers and Nanocomposites in Fire Retardancy
36. S. Su, D.D. Jiang and C.A. Wilkie, Polym. Degrad. Stab., 2004, 83, 321.37. S. Su, D.D. Jiang and C.A. Wilkie, Polym. Degrad. Stab., 2004, 83, 333.38. S. Su, D.D. Jiang and C.A. Wilkie, Polym. Degrad. Stab., 2004, 84, 279.39. S. Su, D.D. Jiang and C.A. Wilkie, Polym. Adv. Tech., 2004, 15, 225.40. S. Su, D.D. Jiang and C.A. Wilkie, J. Vinyl Add. Tech., 2004, 10, 44.41. J. Zhang and C.A.Wilkie, Polym. Degrad. Stab., 2004, 83, 301.42. D.L. VanderHart, A. Asano and J.W. Gilman, Macromol., 2001, 34,
2001, 3819.43. D.L. VanderHart, A. Asano and J.W. Gilman, Chem. Mater., 2001, 13,
3781.44. D.L. VanderHart, A. Asano and J.W. Gilman, Chem. Mater., 2001, 13,
3796.45. S. Bourbigot, D.L. VanderHart, J.W. Gilman, W.H. Awad, R.D. Davis,
A.B. Morgan and C.A. Wilkie, J. Polym. Sci.: Part B: Polym. Phys, 2003,41, 3188.
46. J.W. Gilman, T. Kashiwagi, M. Nyden, J.E.T. Brown, C.L. Jackson,S. Lomakin, E.P. Giannelis and E. Manias, in Chemistry and Technologyof Polymer Additives, S. Al-Malaika, A. Golovoy and C.A. Wilkie (eds.),Blackwell Scientific, Oxford, 1999, pp. 249–265.
47. M. Alexandre and P. Dubois, Mater. Sci & Eng., 2000, R28, 1.48. M.R. Nyden and J.W. Gilman, Comp. Theor. Polym. Sci., 1997, 7, 191.49. J.W. Gilman, C.L. Jackson, A.B. Morgan, R. Harris, Jr., E. Manias,
E.P. Giannelis, M. Wuthenow, D. Hilton and S.H. Phillips, Chem. Mater.,2000, 12, 1866.
50. J. Zhu, F.M. Uhl, A.B. Morgan and C.A. Wilkie, Chem. Mater., 2001, 13,4649.
51. J. Wang, J. Hao, J. Zhu and C.A. Wilkie, Polym. Degrad. Stab., 2002, 77,249; J. Du, J. Zhu, C.A. Wilkie and J. Wang, Polym. Degrad. Stab., 2002,77, 377; J. Du, D. Wang, C.A. Wilkie and J. Wang, Polym. Degrad. Stab.2003, 79, 319; J. Du, J. Wang, S. Su and C.A. Wilkie, Polym. Degrad.Stab., 2004, 83, 29.
52. D. Wang, D.D. Jiang, J. Pabst, Z. Han, J. Wang and C.A. Wilkie,Polym. Eng. Sci., 2004, 44, 1122.
53. D. Wang, B.N. Jang, S. Su, J. Zhang, X. Zheng, G. Chigwada, D.D. Jiangand C.A. Wilkie, this book, chapter 5.
54. F.M. Uhl and C. A. Wilkie, Polym. Degrad. Stab., 2002, 76, 111.55. F.M. Uhl and C.A. Wilkie, Polym. Degrad. Stab., 2004, 84, 215.56. F.M. Uhl, Q. Yao and C.A. Wilkie, Polym. Deg. Stab., submitted.57. S. Su and C.A. Wilkie, Polym. Degrad. Stab., 2004, 83, 347.58. D. Wang and C.A. Wilkie, in Fire Behaviour of Composite Materials,
G. Gibson and A. Mouritz (eds.), Kluwer Press, 2005 in press.59. G. Chigwada and C.A. Wilkie, Polym. Degrad. Stab., 2003, 81, 551.60. X. Zheng and C.A. Wilkie, Polym. Degrad. Stab., 2003, 81, 539.61. M. Zanetti, G. Camino, D. Canavese, A.B. Morgan, F.J. Lamelas and
C.A. Wilkie, Chem. Mater., 2002, 14, 189.62. G. Beyer, Fire Mater., 2001, 25, 193.

Micro-sized Fire Retardant Fillers

19
CHAPTER 2
Fire Retardant Fillers forPolymersPETER R. HORNSBY1 AND ROGER N. ROTHON1School of Mechanical and Manufacturing Engineering, Queen’s UniverstityBelfast, Belfast, BT9 5AH, UK2Rothon Consultants, UK, 3 Orchard Croft, Guilden Sutton, Chester,CH3 7SL, UK
The term “fire retardant fillers” usually refers to products, like the metalhydroxides, which decompose endothermically and can function as fire retar-dants on their own, without the addition of other additives. This terminologywill be adopted in this chapter. Several other types of filler play important rolesin fire retardant applications, notably ammonium polyphosphate, antimonyoxides, borates, nano-layer silicates and stannates, but these are normally usedin combination with other fire retardant types.
2.1 Fire Retardant Fillers AvailableFire retardant fillers make up a very significant part of the fire retardantadditive market. Worldwide sales are estimated as about 500,000 tonnes orabout 40% of the total market by weight. They function by endothermic decom-position, with release of inert gasses (water and/or carbon dioxide). This decom-position needs to occur above the polymer processing temperature, but nearto the polymer degradation temperature. Fire retardant mechanisms will bediscussed in detail later, but one of the main advantages of this type of fire retar-dant is that it doesn’t generate the smoke and fume hazards typical of some otherapproaches. However, high levels of additive are needed and this can adverselyaffect cost, processing and mechanical properties.
Potential products have recently been summarised.1 For successfulcommercial use, a candidate material must have the following properties:
(i) A significant endothermic decomposition. This should be in thetemperature range 100–300°C, depending on the polymer, and byexperience needs to result in the release of at least 25% by weight ofwater and/ or carbon dioxide.
20 Chapter 2
(ii) Ready availability and low cost.(iii) Low toxicity.(iv) Readily processable into small particle sizes capable of giving high
filler loadings.(v) Low solubility.(vi) Low levels of extractable salts and of potentially detrimental impurities
(such as those causing premature polymer degradation).(vii) No colour.
Few materials meet all of these requirements and are predominately hydrox-ides, hydroxy carbonates and hydrates of aluminium, calcium and magnesium.Despite the large volumes involved, there only about five different materials inuse commercially, with one, aluminium hydroxide, making up about 90% of themarket by tonnage. The main commercial products are discussed below.
2.1.1 Aluminium HydroxidesAs already mentioned, this product (also known as alumina trihydrate, ATH:Al(OH)3) dominates the market. This is because it best fulfils the criteriaoutlined above, especially with regards to cost. Decomposition starts at about200°C, which is very suitable for most polymers, and results in the loss of 34.5%of water. Because of its importance, its production will be described in moredetail than for the other fillers.
Aluminium hydroxide is produced from the mineral bauxite (a crude form ofaluminium hydroxide). The process involves dissolution with sodium hydroxideto form a solution of sodium aluminate, followed by controlled precipitation.The low cost is due to the ability to link the production of fire retardant grades tothat of the same material produced on a vast scale as an intermediate in theBayer process for the manufacture of alumina.
There are two main grades of aluminium hydroxide fire retardant. The first isproduced by milling of the large (about 70 µm) aggregates produced in theBayer process itself. These are the lowest cost, but have platy, irregular par-ticles, not ideally suited for many applications. The second, often referred to asprecipitated, grades are specially precipitated from purified sodium aluminate,using conditions that give control of shape and size and remove the need formilling.
Aluminium hydroxide is available in a wide range of sizes and shapes andwith different surface treatments. Grades with specially tailored particle sizedistributions are available for applications requiring very high loadings. It iswidely used in elastomer and thermoset applications, but is of limited use inthermoplastics, due to the decomposition temperature being too low.
2.1.2 Magnesium Hydroxide, Mg(OH)2
This is the second most widely used fire retardant filler. It is more expensivethan aluminium hydroxide, but has a higher decomposition temperature (about300°C), making it more suitable for use in thermoplastics applications.
21Fire Retardant Fillers for Polymers
There are several origins for this product.2 First, there is limited use of millednatural product (known as brucite). This is suitable for some applications, butcurrently has inadequate performance for most of the market. Secondly, there ismaterial precipitated with lime from sea-water and brines. This is already pro-duced in large quantities for other uses and is of relatively low cost, but againthe properties are currently only suitable for a small part of the market.
Finally, there are specially made products, with optimised morphology,which are suitable for the more demanding applications. Production methodsare quite complex, with raw materials ranging from serpentine (a magnesiumsilicate) brines and magnesium oxides and will not be covered here. A recentdevelopment has been the introduction of nickel-doped forms of magnesiumhydroxide, which are claimed to have superior fire retardant properties.3
2.1.3 Basic Magnesium Carbonates
These products are related to the mineral hydromagnesite [4MgCO3·Mg(OH)2·4H2O]. This decomposes over a range of temperatures, starting about 220°Cand with a total weight loss of 57%. In principle, they should be excellent fireretardants for many polymers, including some thermoplastics, but marketacceptance has, so far, been limited. This is mainly due to their unsuitablemorphology and the relatively high price of current products.
There are natural forms of hydromagnesite available, but these are mixedwith varying amounts of other minerals, notably huntite (a calcium magnesiumcarbonate), which is less effective and has a platy morphology, which can affectprocessing.4 The huntite content can be up to 50 wt%.
Products approximating to the hydromagnesite composition can also be pre-cipitated from solutions of magnesium salts and this process has been used.Unfortunately, the product formed has a poor morphology for use at high load-ings and is mainly sold for smoke suppressing applications, where it is effectiveat lower levels than those needed for fire retardancy.
2.1.4 Boehmite, AlO(OH)
Boehmite is, in effect, partly decomposed aluminium hydroxide, where twothirds of the water has been removed. It has been promoted as a fire retardant inits own right but, because of the relatively low water content, does not seem tohave a high fire retardant effectiveness. However, it does seem to have somepotential in mixtures with other fire retardant fillers and this is where it is nowbeing targeted.5
2.1.5 Calcium Sulphate Dihydrate, (Gypsum) CaSO4·2H2O
This is a low cost material. Its fire retardant properties are limited and it has alow onset of decomposition (under 100°C), but it is reported to find some use asa fire retardant in unsaturated polyester resins.6
22 Chapter 2
2.2 Mechanistic StudiesBefore discussing mechanistic aspects in detail, it must be pointed out that thedetermination of fire retardant performance is a complex and somewhat contro-versial topic. Most product development and mechanistic studies are carried outwith very simple, small scale, laboratory tests, which may not relate well withreal fire scenarios.
The main laboratory tests used with fire retardant fillers are described inreference.7 The principal tests are Oxygen Index, Underwriters LaboratoryVertical Burn Test UL94 and the cone calorimeter.
2.2.1 Flame Retardancy
The relative performance of hydrated fire retardant fillers in polymers stronglydepends on the nature and origin of the filler type and the chemical characteris-tics of the host polymer, in particular its decomposition mechanism. Addition-ally, specific interactions may exist between certain polymers and fillers, whichinfluence their mechanism of action.8
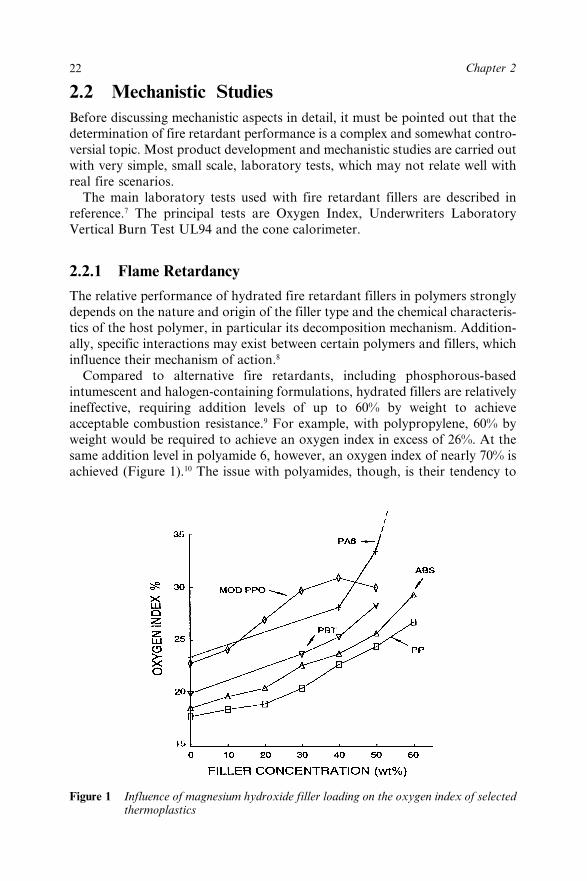
Compared to alternative fire retardants, including phosphorous-basedintumescent and halogen-containing formulations, hydrated fillers are relativelyineffective, requiring addition levels of up to 60% by weight to achieveacceptable combustion resistance.9 For example, with polypropylene, 60% byweight would be required to achieve an oxygen index in excess of 26%. At thesame addition level in polyamide 6, however, an oxygen index of nearly 70% isachieved (Figure 1).10 The issue with polyamides, though, is their tendency to
Figure 1 Influence of magnesium hydroxide filler loading on the oxygen index of selectedthermoplastics

23Fire Retardant Fillers for Polymers
form ignitable drips during combustion; however, by increasing the filler levelthe viscosity of the decomposing polymer is increased and dripping is limited.11
Several contributing effects that may combine to influence the mechanisticbehaviour of fire retardant fillers are discussed below.
2.2.1.1 Thermal Effects from Filler
A characteristic of hydrated fire retardant fillers is that their thermal decompo-sition is endothermic and can adsorb significant quantities of heat. Differentialscanning calorimetry (DSC) and thermogravimetric analysis (TGA) have beenwidely applied to study this behaviour.12 Comparing magnesium hydroxidegrades, differences have been reported in the magnitude of decomposition endot-herm and the decomposition temperature.13 Furthermore, it is significant thatsample size, rate of heating, rate of inert gas flow rate and degree to which thepan is sealed can all influence the measured result.12 Also, different grades ofmagnesium hydroxide may degrade at different rates, which appears to dependon the filler morphology and/or its surface area.14
The endothermic decomposition of aluminium hydroxide has been exten-sively studied. The enthalpy for complete decomposition is about 1300 kJ kg−1.However, decomposition temperatures relevant to polymer applications arehard to define precisely. They depend very much on heating rates and on theability of gaseous decomposition products to escape from the system. Isothermalstudies provide the best information and show that decomposition starts about200°C. It does appear to vary with the exact nature of the sample however,with precipitated grades being reported as significantly more stable than thoseproduced by grinding.15
Although, the decomposition of aluminium hydroxide to oxide is usuallywritten as one step, it can proceed through an intermediate mono-hydroxide[boehmite, AlO(OH)]. Boehmite is much more stabile than the hydroxide,decomposing about 550°C and its presence can reduce fire retardant effective-ness in some tests. Boehmite formation is favoured when escape of water is hin-dered. This can occur in the centre of large filler particles,16 or in thick polymercomposites especially with hard, impermeable polymers.17
The heat capacity of hydrated fillers and, in particular, their strong endot-herm can greatly influence the input of heat required for polymer decompositionand release of combustible volatiles.10 In this connection, the most thoroughmechanistic work has been carried out for the oxygen index test, although this isthought to be the least realistic. A full heat balance model has been worked outfor fire retardant fillers in this test.18 With the exception of very fine fillers, thismodel fits experimental data very well. The fire retardant effect is found to comefrom three sources; the endotherm itself, the heat capacity of the oxide residueand the heat capacity of the evolved gasses. For aluminium hydroxide, theendotherm contributes about 51% of the effect, the oxide residue about 19% andthe evolved gases about 30%.
Particle size of the filler also plays a role in flammability resistance. Forexample, below a certain particle size (about 1–2 µm), in many tests, including

24 Chapter 2
oxygen index, aluminium hydroxide shows enhanced fire retardant perfor-mance.19 The reasons for this are not clear, but in the oxygen index test at leastit seems that a more persistent ash is formed. This ash is raised to very high tem-peratures, increasing the heat capacity effect from this component. Strangely, ithas been reported that the particle size effect is absent, or less pronounced, in thecone calorimeter test.20
At sufficiently high filler levels, hydrated fillers can also reduce the massburning rate by inhibiting the rates of heat transfer from the flame to the under-lying matrix. As a consequence, the supply of fuel necessary to continue thecombustion process diminishes, causing the flame to extinguish due to fuel star-vation.21 Hence reductions in applied heat flux or increased surface heat losseswill lead to a decrease in the mass burning rate of the polymer, as reported foraluminium hydroxide filled–polypropylene compositions.22
This thermal insulating effect has been demonstrated experimentally throughforced combustion studies with a range of polymer types, including polypropy-lene, modified polyphenylene oxide (PPO), polybutylene terephthalate (PBT)and acrylonitrile-butadiene-styrene copolymer (ABS), designed to measure ratesof heat transfer through a fire-retardant polymer composition exposed to anignition source at its outer surface. On thermal breakdown, magnesium andaluminium hydroxides decompose to their respective oxides, which, togetherwith any carbonaceous char produced, provide an effective thermal barrier,reducing heat transmission to the underlying substrate.23,9
Microscopic analysis of the oxide/char residue formed following combustionof magnesium hydroxide-filled polypropylene has revealed an oxide morphol-ogy similar in form to the parent hydroxide.24 In this example, hexagonal plate-lets appear to align predominantly in the same plane and in some cases overlap,which contrasts with large aggregated oxide structures derived from hydroxideparticles formed from association of small crystallites. There is some evidenceof increased crystal growth and that the coherency of the oxide particles contrib-utes to the stability of the decomposition residue observed from combustionproducts arising from oxygen index tests. Oxide residues may, possibly, alsoundergo partial sintering reactions, leading to the development of stronger ashstructures, which may account for differences in performance observed betweendifferent grades of the same filler.12 It may also be significant that the strengthof agglomerates containing magnesium hydroxide pseudomorphs has beenestimated as 50 MN m−2, arising from physio-chemical association betweenmagnesium oxide and water.25
2.2.1.2 Dilution of Combustible Polymer
The presence of up to 60% by weight of fire retardant filler results in around 35%by volume reduction of combustible polymer (in the case of magnesium hydrox-ide). In studies using polypropylene compositions containing different grades ofmagnesium hydroxide, magnesium oxide and glass beads, values of heat releaserate (HRR) were determined by cone calorimetry.24 The rates of heat releasewere significantly reduced, after allowing for the volume dilution of each of

25Fire Retardant Fillers for Polymers
these fillers. However, magnesium oxide was far more effective than the glassbeads, even though both are nominally considered to be inert, suggesting thateven the physical and/or chemical nature of non-hydrated fillers may influencebehaviour.
2.2.1.3 Filler/Polymer Interactions
TGA and DSC analytical techniques can provide useful information concerningthe nature of filler–polymer interaction, together with their relative decomposi-tion temperatures, when used in combination with evolved gas analysis (EGA)and on-line FTIR techniques. Using these methods, it was demonstrated that, onthermal breakdown, magnesium hydroxide exerts a significant pro-degradativeaction on polyamide 6 (PA-6) and polyamide 6.6 (PA-66), which was attributedto water release and resulting hydrolysis of the polymer chains.26 Evolved gasesreleased from both filled and unfilled PA compositions were shown to be water,carbon monoxide, carbon dioxide, ammonia and various hydrocarbon frag-ments. Importantly in PA-66, polymer degradation occurred before magnesiumhydroxide breakdown, whereas there was much greater overlap in the caseof decomposition of PA-6 and this filler, resulting in significantly improvedflammability resistance with this composition.
Different magnesium hydroxide filler types influence the rheological behavi-our of thermally decomposing polyamides in different ways and hence theirresistance to dripping,27 with plate-like filler particles being more effectively inthis regard.28
Several comparisons exist on the relative efficiency of magnesium andaluminium hydroxides in the same polymer type. Care must be taken in theirinterpretation, however, due to the particle size effects described above. Onestudy using polyethylene showed that, at the same additive loading, these fillersgave an equivalent oxygen index.29 However, in ethylene-vinyl acetate copoly-mer (EVA) with 30% vinyl acetate content, magnesium hydroxide yielded anoxygen index of 46%, whereas when using aluminium hydroxide this was only37%. Results from non-isothermal thermogravimetric analysis, suggestedthat water release was delayed from aluminium hydroxide, yet acceleratedfrom magnesium hydroxide, possibly arising from reaction with acetic acid,generated during polymer decomposition.
2.2.1.4 Vapour Phase Action
Although the primary fire retardant action of hydrated fillers is in the condensedphase, the release of water and/or inert gas into the vapour phase on decomposi-tion also contributes to the overall fire retardation mechanism. Little detailedanalysis has been undertaken in this area; however, it is generally consideredthat water release into the vapour phase exerts a beneficial effect throughdilution and cooling of flammable volatiles produced on polymer degradation.10

26 Chapter 2
2.2.1.5 Effects of Filler Particle Size and Morphology
It has sometimes been observed that different grades of the same fire retardantfiller can give significantly different effects, despite apparent similarities in theirendothermic decomposition or release of inert gas. Whilst this may, in part, bean outcome of the flammability test procedure applied, distinct particle size andparticle morphology effects have been reported. These factors also have a sig-nificant bearing on the mechanical properties and melt rheology of polymercomposites containing hydrated fillers.
In relation to flammability, however, it has been shown using the UL94vertical burn test that the effectiveness of magnesium hydroxide in polypropy-lene increased with decreasing particle size.30 Similarly, in studies involvingPMMA modified with ATH, fine grades (<1 µm) gave markedly higher oxygenindex values than coarser (45 µm) grades, particularly at filler loadings above50% by weight.31,12 ATH is reported to be less thermally stable as the particlesize increases.32 Early in the decomposition process the alumina produced isvery reactive, readily combining with water vapour to rehydrate to ATH. Inlarger particles, water escaping nearer the centre of the particle has a larger dif-fusion path, giving more time to react with alumina formed near the surface ofthe decomposing particle. During this process boehmite or psuedo-boehmite isformed and, being a partial decomposition product, is more stable than ATH,decomposing at about 450°C. In relation to the effects of particle size on thermalstability, there is a greater transition from gibbsite to pseudo-boehmite as theparticle size increases.15
2.2.2 Smoke Suppression
An early study discussed the effects of calcium carbonate, aluminium hydroxideand magnesium hydroxide fillers on smoke production from styrene butadiene(SBR) foams.33 All these fillers evidently reduced soot formation relative tounfilled foam, with the hydrated fillers being more effective than the calciumcarbonate, which was considered to act merely as a matrix diluent. Aluminiumand magnesium hydroxides gave enhanced char formation and promotedsolid-state crosslinking, as opposed to pyrolytic degradation. The occurrence ofafterglow, after extinction of the flame, was noted with MH and attributed toslow combustion of carbon residues. Several other reports have demonstratedthe smoke suppressing tendencies of hydrated fillers in various polymers, includ-ing ethylene-propylene-diene elastomers, polypropylene, polystyrene, modifiedpolyphenylene oxide, polybutylene terephthalate and ABS.9,34,35 These hydratedfillers can also delay the onset of smoke evolution in the event of a fire.10
Although there has been extensive analysis of the composition and formationof soot from polymers undergoing combustion,36,37 limited work has been pub-lished on the mechanism of smoke suppression using hydrated fillers. It seemslikely, however, that the process is a consequence of the deposition of carbononto the oxide surface, produced on decomposition of the hydrated filler.9
Volatilisation of carbonaceous residue as carbon oxides subsequently occurs,

27Fire Retardant Fillers for Polymers
which does not contribute to the obscuration effects of smoke. On hydroxidedecomposition, these oxides have high surface areas and are catalyticallyactive,38 promoting both the carbon deposition and subsequent oxidationprocesses.39 The reduced combustion rate arising from the effects of the fireretardant filler will also play a part in lowering the rate of smoke evolution andalso in improving oxygen-to-fuel ratios, further limiting obscuration.
The role of evolved water from hydroxide decomposition is of interest, sincewater can also oxidise carbon. In this connection, the smoke yields frompolypropylene compounds containing magnesium hydroxide and magnesiumoxide were compared.9 These results showed little difference in levels of smokeevolution, suggesting that water has limited effect on the smoke suppressionmechanism. These data are supported by CO emission from burning ABS, whichagain demonstrate little distinction between oxide and hydrate forms of thismagnesium compound23 and also by the fact that the so-called water–gas oxida-tion reaction occurs at temperatures and pressures in excess of those normallyfound at the burning surface of a polymer.40
2.2.3 Incandescence
Other aspects of fire retardant performance include the effect of the additives onsmoke, afterglow and incandescence, and these topics appear to be related.Smoke reduction is primarily due to the trapping of smoke precursors by thehigh surface area oxides formed on filler decomposition. These trapped speciesare then oxidised on the surface. This oxidation process is probably the cause ofafterglow problems sometimes observed with fire retardant fillers.41 In studies onthe ignition and incandescence of filled polymers, both ATH and MH werefound to increase the self-ignition temperature, but to decrease the incandes-cence temperature of an EVA copolymer42 Using TGA, in these systems it wasconcluded that the solid state after-glow effects observed were due to oxidationof carbonaceous residues.
2.3 Synergists for Hydrated FillersThe ability of fire retardant fillers to meet the most demanding specifications islimited. The high filler levels needed also causes problems with processingand mechanical properties. To some extent these drawbacks can be reduced bysurface treatments, as will be discussed later, but there is a continuing search forsynergists that allow overall filler levels to be reduced, or higher specificationsto be achieved.
As the following examples demonstrate, potentially the problems resultingfrom high filler loadings can be reduced by introducing other fire retardantcomponents into the composition to act in a synergistic manner, thereby increas-ing fire retardant action and enabling an overall reduction in filler content.However, in general, most of the literature on synergistic effects is in the patentliterature and thus scientific explanation is scarce.

28 Chapter 2
Although not exhaustive, Table 1 gives an overview of synergists reported orpatented for use in combination with hydrated fillers, such as magnesium andaluminium hydroxides, in various polymer matrices. An indication of observed
Table 1 Examples of reported synergists for metal hydroxides
HydratedCo-additives Filler(s) Polymer(s) Effect(s)
Antimony trioxide ATH PVC Reduced overall filler level/Increased(flexible) smoke
Antimony trioxide/ ATH PVC Reduced overall filler level/lowerzinc borate (flexible) smokeBorate compounds ATH EVA Enhanced flammability resistance at low(zinc borate/calcium co-additive additionsIncreased charborate) promotionMH/ATH ATH PVC Reduced flammabilitycombinations MH Wider range of endotherm and water
releaseEnhanced oxide thermal barrier(?)
Molybdenum ATH PVC Reduced flammability and smokecompounds MH emission(molybdenum Increased char promotionoxide/molybdatesalts)Red phosphorus ATH Reduced overall filler levels
MH Suppression of phosphine formation bymetal hydroxideColoured formulationsLow co-additive additions
Silicon-containing ATH Polyolefins Enhanced flammability resistance /compounds MH reduced smoke(organosilicones) Improved processibility and physical
propertiesHandling issuesPolyacrylonitrile ATH Polyolefins Char promotionfibres MH Reduced filler levels
Can be pigmentedTransitionl metal ATH Polyolefins Reduced overall filler levelsoxides (nickel MH Colour limitationsoxide/cobalt oxide) Toxicity concerns(?)Metal nitrates ATH EVA Enhanced flammability resistance with(copper nitrate/iron low co-additive additionsnitrate)Melamine ATH PP Improved fire retardancy
MH Reduced after-glowTin compounds ATH PVC Enhanced flammability resistance /(zinc stannate/zinc MH Cl-Rubbers reduced smoke especially with ZH/ZHS-hydroxystannate) EVA coated filler variantsNano-clays ATH EVA Lower heat release rates/reduced smoke
MH emission Used in combination with tincompounds

29Fire Retardant Fillers for Polymers
effects and possible modes of action is also given, where this has been proposed.Reasons for use of synergistic co-additives include enhanced fire retardancy,reduced smoke emission (particularly in halogenated formulations), and often acombination of these benefits. Examples of such systems are discussed brieflybelow.
Combinations of MH and ATH give improved performance when usedtogether, due to the increased range of endothermic reaction (180–400°C) andrelease of water in the vapour phase.43,44 The different metal oxides produced ondehydration may also contribute to this effect.
Mixtures of zinc borate, antimony trioxide, ATH and MH can be combinedto enhance oxygen index and reduce smoke emission, the proportions varyingdepending on the end-use requirements.
The addition of low levels (~3%) of zinc borate to metal hydroxides can givesynergistic effects.45 For example, in an EVA/MH formulation, the oxygenindex increased from 39 to 42%. In EVA, small levels of ZB (around 6% byweight) together with ATH or MH yield significant increases in oxygenindex (Figure 2), presumably due to the greater char forming tendency of theco-additive and its ability to bind together oxide residue produced on decompo-sition of the hydrated filler.
ATH and red phosphorus (3–5%) have also been used in synergistic mixtureswith metal hydroxides to increase fire retardancy and enable lower fillerloadings.46
The addition of melamine and novolac (~1%) to PP/MH mixtures enables aUL 94 V-O rating to be reached at lower filler levels (30–50%), allowing theformulation to be mechanically more flexible. The novolac causes a structurallystabilising effect above the melting point of PP. Thermal evidence suggests thata novolac magnesia gel may be formed.47
Figure 2 Effect of zinc borate (BZn) substitution on the oxygen index of EVA24/MHand EVA24/ATH compositions (constant overall filler loading of 60% byweight; (�) ATH, (�) MH)

30 Chapter 2
Metal hydroxides in combination with various formulations of silicon-containing compounds have been used to reduce the amount of additive requiredto achieve a required level of flame retardancy in various polymeric materials,including polyolefins.48,49 There is little insight into how these formulationswork; however, it seems likely that the silicon compounds bond with the metalhydroxides. Systems, which have been used, contain a combination of reactivesilicone polymers, a linear silicone fluid or gum and a silicone resin, which issoluble in the fluid, plus a metal soap, in particular magnesium stearate.
The loading levels of metal hydroxides required to flame retard polyolefinscan be reduced by addition of transition metal oxides as synergistic agents.3 Forexample, combination of 47.6% MH modified with nickel oxide in PP gave aUL94-VO flammability rating that would require ~55% of unmodified MH.50
These systems, however, can only be used where the colour of the product is notimportant.
The addition of metal nitrates to improve the flame retardancy of metalhydroxides and EVA has been reported.51 Synergistic behaviour was observedby addition of 2% of copper nitrate to EVA containing only 33% ATH, in whichthe oxygen index was raised from 19.9 to 30.0%.
A natural mineral filler, containing mainly huntite and hydromagnesite, hasbeen used, together with a blend of antimony trioxide (Sb2O3) and decabromodi-phenyl oxide (DPDPO), to reduce the flammability of an ethylene-propylenecopolymer.52
There are reports that additions of very small amounts (< 5% by weight) ofpolyacrylonitrile fibres or carbon powder to formulations, including MH orATH hydrated fillers, can enable UL94 VO ratings to be obtained at overallfiller levels well below that necessary in the absence of these co-additives.53,54
For example, in LLDPE containing ATH, addition of only 1% of PAN fibresyielded a filler reduction of 8% for the same UL94 flammability ranking,thereby resulting in improved mechanical properties. These effects are thoughtto result from the charring action of the co-additives.
The flammability properties of an intumescent fire retardant PP formulationwith added MH has been investigated.55 The results show that the intumescentflame retardant ammonium polyphosphate-filled PP has superior flammabilityproperties, but gives higher CO and smoke evolution. The addition of MHreduced smoke density and CO emissions, in addition to giving superior fireresistance.
Addition of silane cross-linkable PE copolymer to PE/metallic hydroxidesystems can significantly improve the flame retardant properties of thesematerials, allowing lower filler levels to be used.56
The combination of melamine with hydrated mineral fillers can improve thefire retardancy behaviour of PP, eliminating at the same time the after-glowphenomenon associated with these fillers used in isolation.57 Similarly, in EVAcopolymer, antimony trioxide used in combination with metal hydroxidesreportedly reduces incandescence.58 Furthermore, chlorinated and brominatedflame retardants are sometimes used in combination with metal hydroxides toprovide enhanced fire retardant efficiency, lower smoke evolution and lower

31Fire Retardant Fillers for Polymers
overall filler levels. For example, in polyolefin wire and cable formulations,magnesium, hydroxide in combination with chlorinated additives was reportedto show synergism and reduced smoke emission.59
Zinc stannates are effective fire retardants and smoke suppressants in haloge-nated polymers, such as PVC; however, when combined as a physical mixturewith MH in ethylene-acrylate copolymer, a significant enhancement in oxygenindex results compared to the hydrated filler in isolation. In addition, techniqueshave been developed for applying coatings of zinc stannate or zinc hydroxy-stannate onto hydrated fillers.60,61 These novel systems provide a more effectivemeans for presenting the tin-containing synergist to the polymer, yielding mark-edly improved flammability performance relative to physical admixtures ofthese fire retardant types. Results obtained using PVC offer the prospect of gain-ing acceptable fire retardancy behaviour at much lower overall filler levels.Similar effects have been found in EVA copolymer, where ZHS-coated hydratedfillers enable large reductions in heat release rate and smoke emission, eventhough halogens are absent in this system (Figure 3).
The combination of 10phr silicate layer nanoclay with hydrated fillerssignificantly improves fire performance (Figure 4) for EVA filled with ATH andnanoclay–ATH mixtures.62 This apparent synergism arises from increased charpromotion evident when the nanoclay is present. However, it is significant thatinclusion of ZHS to this system, either as an admixture or in coated form, yieldsa further improvement in performance with this polymer. Using MH in place ofATH gives even better results (Figure 5).
2.4 Processing and Considerations on MechanicalProperty
2.4.1 Rheological Issues
Extensive literature on the rheology of polymer suspensions containing rigidfillers demonstrates that their flow behaviour is strongly affected by the filler
Figure 3 Heat release rate from EVA compositions filled with ATH, MH and coatedvariants of these fillers
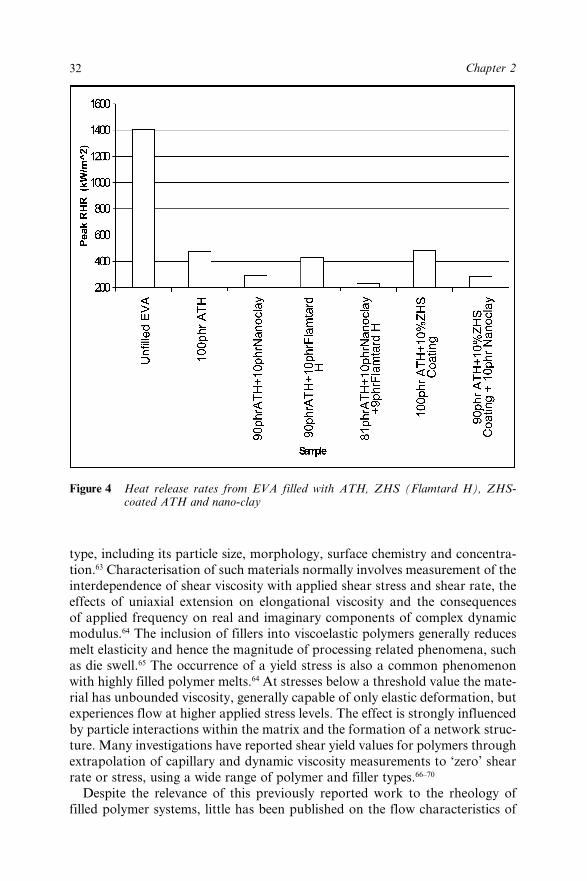
32 Chapter 2
type, including its particle size, morphology, surface chemistry and concentra-tion.63 Characterisation of such materials normally involves measurement of theinterdependence of shear viscosity with applied shear stress and shear rate, theeffects of uniaxial extension on elongational viscosity and the consequencesof applied frequency on real and imaginary components of complex dynamicmodulus.64 The inclusion of fillers into viscoelastic polymers generally reducesmelt elasticity and hence the magnitude of processing related phenomena, suchas die swell.65 The occurrence of a yield stress is also a common phenomenonwith highly filled polymer melts.64 At stresses below a threshold value the mate-rial has unbounded viscosity, generally capable of only elastic deformation, butexperiences flow at higher applied stress levels. The effect is strongly influencedby particle interactions within the matrix and the formation of a network struc-ture. Many investigations have reported shear yield values for polymers throughextrapolation of capillary and dynamic viscosity measurements to ‘zero’ shearrate or stress, using a wide range of polymer and filler types.66–70
Despite the relevance of this previously reported work to the rheology offilled polymer systems, little has been published on the flow characteristics of
Figure 4 Heat release rates from EVA filled with ATH, ZHS (Flamtard H), ZHS-coated ATH and nano-clay

33Fire Retardant Fillers for Polymers
polymers containing hydrated fillers. However, it has been shown, using bothcapillary and dynamic viscosity measurements, that magnesium hydroxide par-ticle morphology, size and applied surface treatment all influence the rheologyof filled polypropylene melts.71 At a filler concentration of 60% by weight, thepresence of magnesium hydroxide caused a significant increase in the shear vis-cosity of polypropylene relative to unfilled polymer, although this was much lesspronounced using magnesium stearate surface treated filler, especially at lowshear rates. Complex viscosity and storage modulus data, obtained at very lowshear rates (0.002 s−1), demonstrated the presence of a critical shear yield stressfor flow to occur, which was greatest for compositions containing uncoated fill-ers with very small particle size. These effects were attributed to the formation ofnetwork structures, arising from strong interactive forces between the particles.
Rheological effects, resulting from inclusion of magnesium hydroxide havealso been investigated in relation to dripping tendencies of filled polyamide 6and 6,6 composites during combustion.72 Low shear dynamic viscosity measure-ments were undertaken on polymer compositions filled with magnesium hydrox-ide variants differing in particle surface area and filler morphology. Plate-likemagnesium hydroxide particles gave the highest viscosity in both polymers
Figure 5 Heat release rates from EVA filled with MH (Britmag), ZHS, ZHS-coatedMH and nano-clay
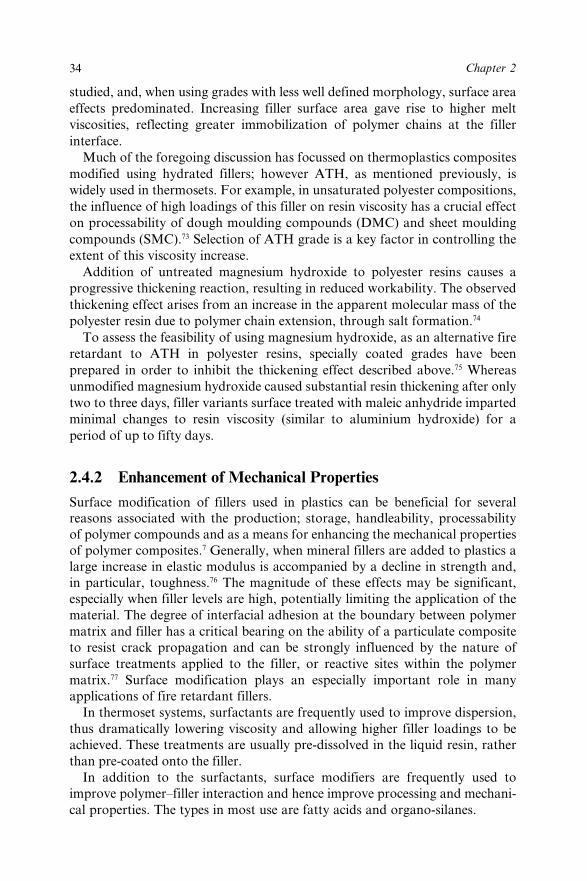
34 Chapter 2
studied, and, when using grades with less well defined morphology, surface areaeffects predominated. Increasing filler surface area gave rise to higher meltviscosities, reflecting greater immobilization of polymer chains at the fillerinterface.
Much of the foregoing discussion has focussed on thermoplastics compositesmodified using hydrated fillers; however ATH, as mentioned previously, iswidely used in thermosets. For example, in unsaturated polyester compositions,the influence of high loadings of this filler on resin viscosity has a crucial effecton processability of dough moulding compounds (DMC) and sheet mouldingcompounds (SMC).73 Selection of ATH grade is a key factor in controlling theextent of this viscosity increase.
Addition of untreated magnesium hydroxide to polyester resins causes aprogressive thickening reaction, resulting in reduced workability. The observedthickening effect arises from an increase in the apparent molecular mass of thepolyester resin due to polymer chain extension, through salt formation.74
To assess the feasibility of using magnesium hydroxide, as an alternative fireretardant to ATH in polyester resins, specially coated grades have beenprepared in order to inhibit the thickening effect described above.75 Whereasunmodified magnesium hydroxide caused substantial resin thickening after onlytwo to three days, filler variants surface treated with maleic anhydride impartedminimal changes to resin viscosity (similar to aluminium hydroxide) for aperiod of up to fifty days.
2.4.2 Enhancement of Mechanical Properties
Surface modification of fillers used in plastics can be beneficial for severalreasons associated with the production; storage, handleability, processabilityof polymer compounds and as a means for enhancing the mechanical propertiesof polymer composites.7 Generally, when mineral fillers are added to plastics alarge increase in elastic modulus is accompanied by a decline in strength and,in particular, toughness.76 The magnitude of these effects may be significant,especially when filler levels are high, potentially limiting the application of thematerial. The degree of interfacial adhesion at the boundary between polymermatrix and filler has a critical bearing on the ability of a particulate compositeto resist crack propagation and can be strongly influenced by the nature ofsurface treatments applied to the filler, or reactive sites within the polymermatrix.77 Surface modification plays an especially important role in manyapplications of fire retardant fillers.
In thermoset systems, surfactants are frequently used to improve dispersion,thus dramatically lowering viscosity and allowing higher filler loadings to beachieved. These treatments are usually pre-dissolved in the liquid resin, ratherthan pre-coated onto the filler.
In addition to the surfactants, surface modifiers are frequently used toimprove polymer–filler interaction and hence improve processing and mechani-cal properties. The types in most use are fatty acids and organo-silanes.
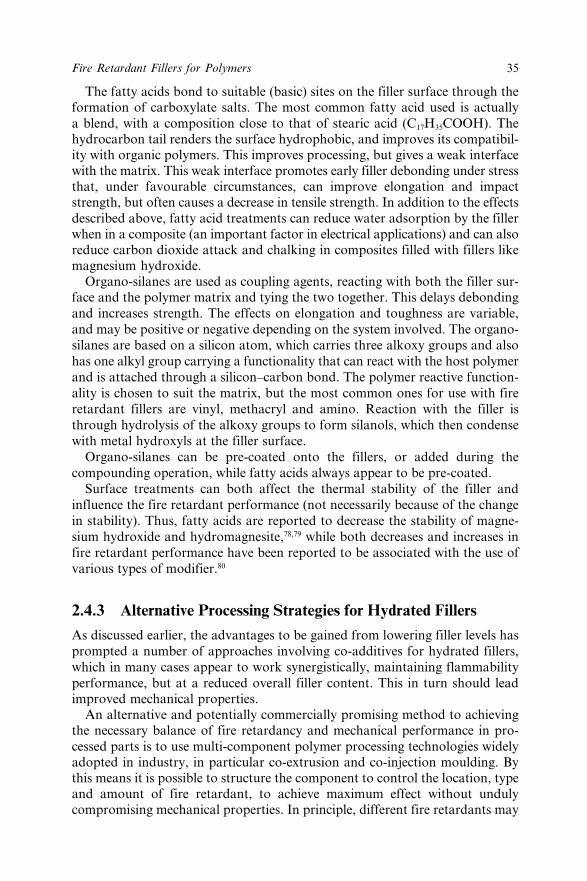
35Fire Retardant Fillers for Polymers
The fatty acids bond to suitable (basic) sites on the filler surface through theformation of carboxylate salts. The most common fatty acid used is actuallya blend, with a composition close to that of stearic acid (C17H35COOH). Thehydrocarbon tail renders the surface hydrophobic, and improves its compatibil-ity with organic polymers. This improves processing, but gives a weak interfacewith the matrix. This weak interface promotes early filler debonding under stressthat, under favourable circumstances, can improve elongation and impactstrength, but often causes a decrease in tensile strength. In addition to the effectsdescribed above, fatty acid treatments can reduce water adsorption by the fillerwhen in a composite (an important factor in electrical applications) and can alsoreduce carbon dioxide attack and chalking in composites filled with fillers likemagnesium hydroxide.
Organo-silanes are used as coupling agents, reacting with both the filler sur-face and the polymer matrix and tying the two together. This delays debondingand increases strength. The effects on elongation and toughness are variable,and may be positive or negative depending on the system involved. The organo-silanes are based on a silicon atom, which carries three alkoxy groups and alsohas one alkyl group carrying a functionality that can react with the host polymerand is attached through a silicon–carbon bond. The polymer reactive function-ality is chosen to suit the matrix, but the most common ones for use with fireretardant fillers are vinyl, methacryl and amino. Reaction with the filler isthrough hydrolysis of the alkoxy groups to form silanols, which then condensewith metal hydroxyls at the filler surface.
Organo-silanes can be pre-coated onto the fillers, or added during thecompounding operation, while fatty acids always appear to be pre-coated.
Surface treatments can both affect the thermal stability of the filler andinfluence the fire retardant performance (not necessarily because of the changein stability). Thus, fatty acids are reported to decrease the stability of magne-sium hydroxide and hydromagnesite,78,79 while both decreases and increases infire retardant performance have been reported to be associated with the use ofvarious types of modifier.80
2.4.3 Alternative Processing Strategies for Hydrated Fillers
As discussed earlier, the advantages to be gained from lowering filler levels hasprompted a number of approaches involving co-additives for hydrated fillers,which in many cases appear to work synergistically, maintaining flammabilityperformance, but at a reduced overall filler content. This in turn should leadimproved mechanical properties.
An alternative and potentially commercially promising method to achievingthe necessary balance of fire retardancy and mechanical performance in pro-cessed parts is to use multi-component polymer processing technologies widelyadopted in industry, in particular co-extrusion and co-injection moulding. Bythis means it is possible to structure the component to control the location, typeand amount of fire retardant, to achieve maximum effect without undulycompromising mechanical properties. In principle, different fire retardants may

36 Chapter 2
be combined, fire retardant level may be graded and/or reinforcing additivesmay be judiciously introduced all within the same part.81
Using this concept, it has been shown that over a 3 min combustion period,6 mm thick laminated structures, made with different skin-core combinationsmade by compression moulding a series of 1 mm thick injection mouldings,can give similar resistance to ignition and comparable HRR and SEA resultsto fully fire retardant compositions (Figure 6). Using co-injection mouldingtechnology, similar effects were seen in 3 mm thick parts made with 0.5 and1 mm thick fire retardant skins. Mechanical properties, in particular impactstrength, were also greatly enhanced by this approach, since less fire retardantfiller is present in the material (Figure 7).
2.5 ConclusionsThe application of fire retardant fillers in plastics is dominated by two majortypes, aluminium and magnesium hydroxides, although there are many variantsof these, which differ in their particle size, particle morphology, chemical purityand origin. They are widely used on account of their environmental acceptabil-ity, being free from halogen and phosphorus compounds, and their strongsmoke suppressing tendencies. Their major drawback is their relative fire retard-ing inefficiency, necessitating use of high filler loadings to obtain acceptableperformance levels, which adversely influences mechanical properties andprocessability. Use of filler surface treatments and melt processing aids canoffset these physical limitations, however, and, in addition, the application oftwo-component processing technologies offers a promising alternative approachto achieve the same end.
Fire retardant fillers function principally in the condensed phase, throughendothermic decomposition, water release, and oxide residue formation, which
Figure 6 Heat release rate from 6 mm thick single component and multilayer fireretardant materials

37Fire Retardant Fillers for Polymers
inhibits thermal feedback. Combination with fire retardant synergists cansignificantly reduce overall filler level to achieve an acceptable level ofperformance and forms an active area of current research.
2.6 References1. R.N. Rothon, in Particulate Filled Polymer Composites, 2nd Edn, R.N.
Rothon (ed.), RAPRA Technology, Shawbury Shrewsbury, U.K., 2003,ISBN: 1-85957-382-7, pp. 270–273.
2. M. Hancock and R.N. Rothon, in reference 1, pp. 88–90.3. H. Kurisu, T. Kodani, A. Kawase and T. Oki, US Patent 5,766,568, 1998,
Tateho Chemical Industries Co Ltd assignees.4. M. Doyle, M. Clemens, G. Lees, C. Briggs and R. Day, Proceedings of
Flame Retardants ’94, Interscience, London, 1994, p. 193.5. R. Sauerwein, Proceedings of Fire and Materials 2001, Interscience, San
Francisco, 2001, 395.6. D.A. Rust, Proceedings of Functional Fillers and Reinforcements ’99,
Intertech, Atlanta, Georgia, USA, Paper 22, 1999.7. R.N. Rothon, in reference 1, pp. 264–269.8. P.R. Hornsby, Macromol. Symp., 1996, 108, 203.9. P.R. Hornsby and C.L. Watson, Plastics Rubber Process. Applic., 1989,
11, 45–51.
Figure 7 Force deflection curves from falling weight impact tests on single- and two-component injection moulded polypropylene (Ultracarb filler)

38 Chapter 2
10. P.R. Hornsby, Fire Mater., 1994, 18, 269.11. P.R. Hornsby, J. Wang, K. Cosstick, R. Rothon, G. Jackson and
G. Wilkinson, Progr. Rubber Plastics Technol., 1994, 10(3), 204–220.12. R.N. Rothon, in Particulate Filled Polymer Composites, R.N. Rothon
(ed.), Longman, New York, 1995, Chapter 6.13. P.R. Hornsby and C.L. Watson, in IOP Short Meetings Series No 4,
Institute of Physics, London, April 1997, p. 17.14. P.R. Hornsby and A. Mthupha, “Mechanism of fire retardancy in magne-
sium hydroxide filled polypropylene”, in Proceedings from Society ofPlastics Engineering, Annual Technical Conference (ANTEC ’93) NewOrleans, May 9–13 1993, pp. 1954–1956.
15. N.R. Dando, T.R. Clever, A. Pearson, J.M. Stinson, P.L. Kolok andE.S. Martin, “Aluminium trihydroxide (ATH) as a filler for polymer com-posites: Improvements in thermal stability by controlled precipitation”, inProceedings from 50th Annual Technical Conference, Composite Institute,Society of Plastics Industry Inc, Session 1-D, p1-4, 1995.
16. I. Sobolev and E.A. Woycheshin, in Handbook of Fillers for Plastics, H.S.Katz and J.V. Milewski (eds.), Van Nostrand Reinhold, New York, 1987,Chapter 16.
17. G.V. Jackson, R.N. Rothon and G.A. Moorman, in Proceedings ofFillplas’92, Manchester, U.K., Paper No. 10, 1992.
18. R.N. Rothon, in reference 1, pp. 277–280.19. P. Hughes, G.V. Jackson and R.N. Rothon, Makromol. Chem. Makromol.
Symp., 1993, 74, 179.20. M.J. Herbert, in Proceedings of Flame Retardants’94, Interscience,
London, 1994, p. 59.21. A. Tewarson, in Flame Retardant Polymeric Materials, M Lewin, S.M.
Atlas and E.M. Pearse (eds.), Plenum Press, New York, 1982.22. I. Spilda, M. Kosik and A. Blazej, J. Appl. Polym. Sci., 1986, 31, 589.23. P.R. Hornsby and C.L. Watson, Polym. Degrad. Stab., 1990, 30, 73–87.24. P.R. Hornsby and A. Mthupha, Plastics, Rubber Composites Process.
Applicat., 1996, 25, 347–355.25. K. Itatani, J. Mater. Sci., 1988, 23, 3405.26. P.R. Hornsby, J. Wang, R. Rothon, G. Jackson, G Wilkinson and
K. Cosstick, Polym. Degrad. Stab., 1996, 51, 235–249.27. P.R. Hornsby, J. Wang, G. Jackson, R.N. Rothon, G. Wilkinson and
K. Cosstick, “Analysis of fire retardancy in polyamides modified with mag-nesium hydroxide filler”, in Proceedings from Society of Plastics EngineersAnnual Technical Conference (ANTEC ’94), 1–5 May 1994, SanFrancisco, pp. 2834–2839.
28. J. Wang, Mechanism of Flame Retardancy in Polyamides ContainingMagnesium Hydroxide, PhD thesis, Brunel University, U.K., 1994.
29. J. Rychlý, K. Vesely, E. Gal, M. Kummer, J. Jancar and L. Rychla,Polym. Degrad. Stab., 1990, 30, 57.
30. S. Miyata, T. Imahshi and H. Anabuki, J. Appl. Polym. Sci., 1980, 25,415.

39Fire Retardant Fillers for Polymers
31. W.E. Horn, in Fire Retardancy of Polymeric Materials, A.F. Grand andC.A. Wilkie (eds.), Marcel Dekker, Basel, Swisserland, 2000, Chapter 9.
32. M. Hancock and R. Rothon, in Particulate-Filled Polymer Composites,R. Rothon (ed.), Longman, Harlow, 1995.
33. D.F. Lawson, E.L. Kay and D.T. Roberts, Rubber Chem. Technol., 1975,48, 124.
34. M. Moseman and J.D. Ingham, Chem. Technol., 1978, 51, 970.35. M.M. Hirschler and T.R. Thevaranjan, Eur. Polym. J., 1985, 21(4), 371.36. J. Lahaye, Polym. Degrad. Stab., 1990, 30, 111–121.37. I. Jagoda, G. Prado and J. Lahaye, Combus. Flame, 1980, 37, 261.38. O.V. Krylov, in Catalysis by Non-Metals, Academic Press, London, 1970.39. D.W. McKee in “The catalyzed gasification reactions of carbon”, in
Chemistry and Physics of Carbon, P.L. Walker and P.A. Thrower (eds.),Marcel Dekker, New York, 1981, Volume 16.
40. P.L. Walker, M. Shelef and R.A. Anderson, “Catalysis of carbon gasifica-tion” in Chemistry and Physics of Carbon, P.L.Walker Jr. (ed.), EdwardArnold, London, 1968, Volume 4.
41. C. Baillet, L. Delfosse, S. Antonik and M. Lucquin, C.R. Acad. Sci., Ser.C, 1972, 274, 146.
42. L. Delfosse, C. Baillet, A. Brault and D. Brault, Polym. Degrad. Stab.,1989, 23, 337.
43. G.S. Kirschbaum, in Proceedings of the 1995 Fall Conference of the FireRetardant Chemical Association, Rancho Mirage, CA, October 29–November 1 1995, Technomic Publishing Co., Lancaster, 1995, p. 145.
44. G.S. Kirschbaum, Kunststoffe, 1989, 79(11), 62–64.45. S. Bourbigot, F. Carpentier, C. Fernandez, J.P. Amoureux, M. Le Bras
and B. Revel, in Proceedings from 6th European Meeting on FireRetardancy of Polymeric Materials (F.R.P.M.’97), M. Le Bras et al.(eds.), AGIR/MITI Pub., Lille, France, 1997, pp. 120–121.
46. H. Staendeke, in Proceedings of the Spring Conference of the Fire Retar-dant Chemical Association, March 20–23, (1988), F.L. Grenelefe (ed.),Technomic Publishing Co., Lancaster, PA, 1988, p. 32.
47. E.D. Weil, M. Lewin and H.S. Lin, J. Fire Sci., 1998, 16, 383–404.48. M.J. Chavez, D.J. Romanesco, in Proceedings of the 1995 Fall Conference
of the Fire Retardant Chemical Association, Rancho Mirage, CA, October29–November 1 1995, Technomic Publishing Co., Lancaster, PA, 1995,p. 169.
49. M.S. Huber, in Proceedings of the Spring Conference of the Fire RetardantChemical Association, March 25–28 1990, New Orleans, FL TechnomicPublishing Co., Lancaster, PA, 1990, p. 237.
50. T. Imahasi, A. Okada and T. Abe, U.S. Patent 5,583,172, Dec. 10 1996.51. W. Zhu and E.D. Weil, J. Appl. Polym Sci., 1995, 56, 925–933.52. B. Toure, J.M.L. Cuesta, P Gaudon, A. Benhassaine and A. Crespy,
Polym. Degrad. Stab., 1996, 53, 371–379.53. Y. Namike, Y. Kato, Y. Kitano, H. Kuriso and Y. Yokata, US Patent
No. 5,654,356, August 5th 1997.

40 Chapter 2
54. S.H. Chiu, and W.K. Wang, Polymer, 1998, 39, 1951–1955.55. J.T. Yeh, H.M. Yang and S.S. Huang, Polym. Degrad. Stab., 1995, 50,
229–234.56. G. Bertelli, P. Goberti, R. Marchini, G. Camino and M.P. Luda,
“Combined malamine/mineral fillers as fire retardants for polypropylene”in Proceedings 6th European Meeting on Fire Retardancy of PolymericMaterials (F.R.P.M. ’97), M. Le Bras et al. (eds.), AGIR/MITI Pub.,Lille, France, 1997, p. 34.
57. C. Baillet and L. Delfosse, Polym. Degrad. Stab., 1990, 30, 89–99.58. R.L. Markezich and D.G. Aschbacker, ACS Symposium Series, 1995, 599,
65–75.59. S. Miyata and T. Imahasi, US Patent No.5,094,781, March 10th 1992.60. R.G. Baggaley, P.R. Hornsby, R. Yahya, P.A. Cusack and A.W. Monk,
Fire Mater., 1997, 21, 179.61. P.A. Cusack and P.R. Hornsby, J. Vinyl Additive Technol., 1999, 5,
21–30.62. M. Cross, The Development and Application of Halogen-Free Tin-based
Fire-Retardant Additives in EVA, EngD Thesis, Brunel University, UK,2004.
63. P.R. Hornsby, in Advances in Polymer Science: Mineral Fillers in Thermo-plastics, J. Jancar (ed.), Springer-Verlag, Munich, Germany, 1999,Volume 139, pp. 155–217.
64. A.Y. Malkin, Adv. in Polym. Sci., 1990, 96, 69.65. P.J. Carreau and P.A. Lavoie, Macromol. Symp., 1996, 108, 111.66. Y. Suetsugu and J.L. White, J. Appl. Polym. Sci., 1983, 28, 1481.67. C.D. Han, in Multiphase Flow in Polymer Processing, Academic Press,
New York, 1981, Chapter 3.68. C.D. Suh and S.L. White, J. Non-Newtonian Fluid Mech., 1996, 62, 175.69. L. Lin and T. Masuda, Polym. Eng. Sci., 1990, 30(14), 841.70. G.J. Osanaiye, A.I. Leonov and J.L. White, J. Non-Newtonian Fluid
Mech., 1993, 49, 87.71. P.R. Hornsby and A. Mthupha, J. Mater. Sci., 1994, 29, 5293.72. P.R. Hornsby, J. Wang, K. Cosstick, R. Rothon, G. Jackson and
G. Wilkinson, Progr. Rubber Plastics Technol., 1994, 10(3), 204.73. E.A Woycheshin and I Sobolev, “Alumina trihydrate”, in Handbook of
Fillers and Reinforcements for Plastics, H.S. Katz and J.V. Milewski (eds.),Van Nostrand Reinhold, Amsterdam, 1978, Chapter 14.
74. V.I. Szmercsanyi and A. Szilagyi, J. Polym. Sci. Polym. Chem., 1974, 12,2155–2163.
75. W.Z.A. Wan Hanafi, A Study of Magnesium Hydroxide as A FlameRetardant and Smoke Suppressant Filler for Unsaturated Polyesters, MPhilThesis, Brunel University, Uxbridge, UK, 1988.
76. P.R. Hornsby and C.L. Watson, Plast. Rubber Proc. Appl., 1986, 6, 169.77. P.R. Hornsby and C.L. Watson, J. Mater. Sci., 1995, 30, 5347–5355.78. M. Hancock and R. N. Rothon, in reference 1, p. 90.

41Fire Retardant Fillers for Polymers
79. L. Haurie, A. I. Fernandez, J. L. Velasco, J. M. Chimenos, J. R. TicoGrau and F. Espeill, in Proceedings of Eurofillers’03, Alicante, Spain,Paper A3, September 2003.
80. R.J. Ashley and R.N. Rothon, Plastics, Rubber Composites Process.Applicat., 1991, 15, 19.
81. P.R. Hornsby, A. Ahmadnia, G. Marosi and P. Anna, “Tailoring the fireretardant performance of polymers using multi-component processingtechnologies” in Proceeding from Society of Plastics Engineers AnnualTechnical Conference (ANTEC ’03), Nashville, USA, 5–8 May 2003,Soc. of Plastics Engineers, Brookfield, CT, USA, 2003.

42
CHAPTER 3
Lamellar Double Hydroxides/Polymer Composites:A New Class of Fire RetardantMaterialsJÉRÔME LEFEBVRE, MICHEL LE BRAS AND SERGEBOURBIGOT
PERF (Procédés d’Elaboration de Revêtements Fonctionnels), UPRES EA1040, E.N.S.C.L.-U.S.T.L, BP108, F-59652 Villeneuve d’Ascq Cedex,France ([email protected])
3.1 IntroductionIn recent years polymeric materials have been filled with several syntheticand/or natural minerals to improve mechanical properties (such as modulus,tensile strength, hardness, etc.) and/or to increase the fire properties of thematerials. In the field of fireproofing, the use of inorganic additives enables oneto replace advantageously halogen-based fire retardants in many applicationsbecause of their better environmental impact. The most widely studied inorganicflame retardant additives are metallic hydroxides, phosphorilated compoundsand clays.
Systems based on metallic hydroxides develop, during their degradation, oneor more endothermic reactions. A part of the heat fed back heat to the virginpolymer is used degrade the hydroxides and so reduce the degradation ofthe polymer. The resulting water production acts in the gas phase by dilution.1
Hydroxides also act as catalysts for the oxidation of the polymeric matrix and/or the products of its degradation and lead to a decrease in the CO/CO2 ratio.2
The oxides, produced by the decomposition, can contribute to the formationof an insulative charred layer acting as a further protection for the polymer.3
Currently, the processes of fireproofing using hydroxides find significant appli-cation in the field of electrical cable-making. However, to be effective, thesecompounds must be used in large quantities, often higher than 60% in mass,
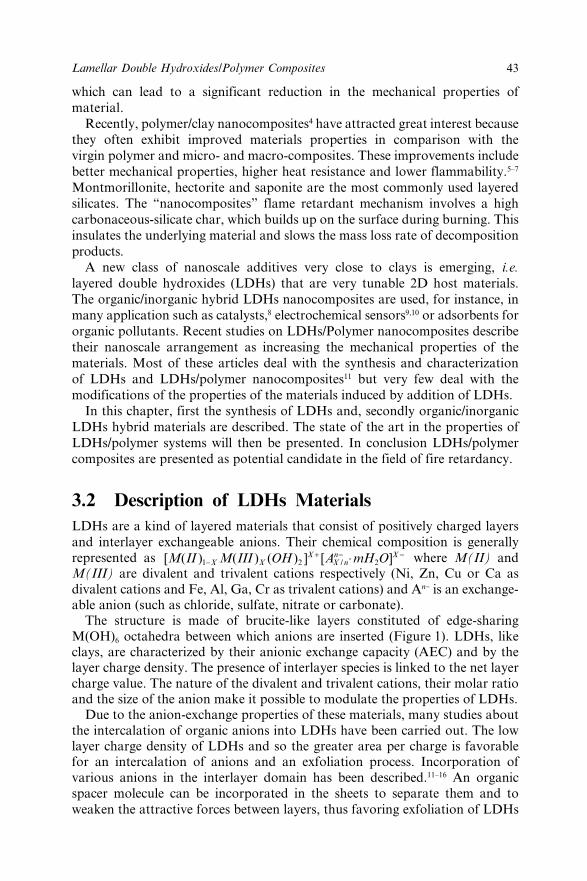
43Lamellar Double Hydroxides/Polymer Composites
which can lead to a significant reduction in the mechanical properties ofmaterial.
Recently, polymer/clay nanocomposites4 have attracted great interest becausethey often exhibit improved materials properties in comparison with thevirgin polymer and micro- and macro-composites. These improvements includebetter mechanical properties, higher heat resistance and lower flammability.5–7
Montmorillonite, hectorite and saponite are the most commonly used layeredsilicates. The “nanocomposites” flame retardant mechanism involves a highcarbonaceous-silicate char, which builds up on the surface during burning. Thisinsulates the underlying material and slows the mass loss rate of decompositionproducts.
A new class of nanoscale additives very close to clays is emerging, i.e.layered double hydroxides (LDHs) that are very tunable 2D host materials.The organic/inorganic hybrid LDHs nanocomposites are used, for instance, inmany application such as catalysts,8 electrochemical sensors9,10 or adsorbents fororganic pollutants. Recent studies on LDHs/Polymer nanocomposites describetheir nanoscale arrangement as increasing the mechanical properties of thematerials. Most of these articles deal with the synthesis and characterizationof LDHs and LDHs/polymer nanocomposites11 but very few deal with themodifications of the properties of the materials induced by addition of LDHs.
In this chapter, first the synthesis of LDHs and, secondly organic/inorganicLDHs hybrid materials are described. The state of the art in the properties ofLDHs/polymer systems will then be presented. In conclusion LDHs/polymercomposites are presented as potential candidate in the field of fire retardancy.
3.2 Description of LDHs MaterialsLDHs are a kind of layered materials that consist of positively charged layersand interlayer exchangeable anions. Their chemical composition is generallyrepresented as [ ( ) ( ) ( ) ] [ ]/M II M III OH A mH OX X
XX nn X
1 2 2−+ − −⋅ where M(II) and
M(III) are divalent and trivalent cations respectively (Ni, Zn, Cu or Ca asdivalent cations and Fe, Al, Ga, Cr as trivalent cations) and An− is an exchange-able anion (such as chloride, sulfate, nitrate or carbonate).
The structure is made of brucite-like layers constituted of edge-sharingM(OH)6 octahedra between which anions are inserted (Figure 1). LDHs, likeclays, are characterized by their anionic exchange capacity (AEC) and by thelayer charge density. The presence of interlayer species is linked to the net layercharge value. The nature of the divalent and trivalent cations, their molar ratioand the size of the anion make it possible to modulate the properties of LDHs.
Due to the anion-exchange properties of these materials, many studies aboutthe intercalation of organic anions into LDHs have been carried out. The lowlayer charge density of LDHs and so the greater area per charge is favorablefor an intercalation of anions and an exfoliation process. Incorporation ofvarious anions in the interlayer domain has been described.11–16 An organicspacer molecule can be incorporated in the sheets to separate them and toweaken the attractive forces between layers, thus favoring exfoliation of LDHs

44 Chapter 3
layers. The only criterion the anion has to satisfy is not to form a strong complexwith the present cations. Intercalation can be obtained via exchange, copreci-pitation or reconstruction.17,18 A two-step method based on delamination andrestacking has been also developed.19
3.3 Synthesis of LDHs/Polymer NanocompositesPolymer/LDHs nanocomposites can be referred to as organoceramics. Thereare many ways to synthesize LDHs/polymer nanocomposites11 that can be listedas three principal options (Figure 2).
3.3.1 Intercalation of Monomer Molecules Followed by “in situ”Polymerization
Polymerization is carried out between the sheets by thermal, photoinduced orheat treatment. However, the size and the affinity of LDHs with the polymericmatrix can disturb the incorporation. This can be avoided by pre-intercalationof a spacer-molecule, a modifying layer agent or an in situ reactant. The “in situpolymerization” is limited by the degree of freedom of the monomers (affinitywith the LDHs) and by some conditions of polymerization that can modify thelayered structure.
3.3.2 Direct Intercalation of Extended Polymer Chains betweenLDHs Layers
After expansion and chemical change of the layers, the polymer can be incorpo-rated between the layers.
3.3.3 Transformation of Host Material into a Colloid System andPrecipitation in the Presence of the Polymer
Nanocomposite systems can be formed by restacking exfoliated layers. Thismethod is only available for LDHs that can be delaminated. The layers arerestacked on the monomer or on the whole polymer.
Figure 1 Schematic structure of layered double hydroxides
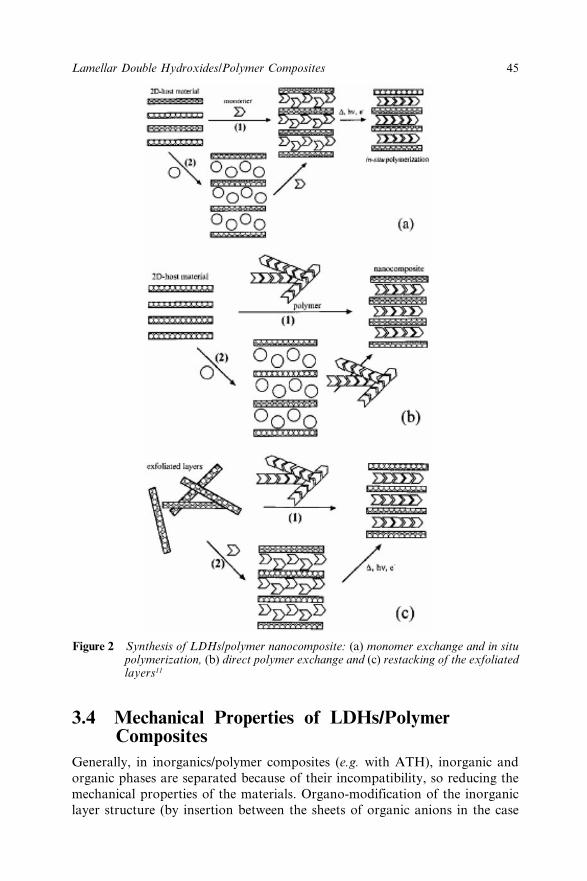
45Lamellar Double Hydroxides/Polymer Composites
3.4 Mechanical Properties of LDHs/PolymerComposites
Generally, in inorganics/polymer composites (e.g. with ATH), inorganic andorganic phases are separated because of their incompatibility, so reducing themechanical properties of the materials. Organo-modification of the inorganiclayer structure (by insertion between the sheets of organic anions in the case
Figure 2 Synthesis of LDHs/polymer nanocomposite: (a) monomer exchange and in situpolymerization, (b) direct polymer exchange and (c) restacking of the exfoliatedlayers11

46 Chapter 3
of LDHs or cations in the case of clays) allows a significant increase inthe compatibility between the organic and inorganic phases, so leading toimproved mechanical properties of interest. Hsueh et al. have discussed themodification of the tensile and viscoelastic properties of LDHs/epoxy15 andLDHs/polyimide14 nanocomposites systems using, respectively, amino laurateand amino benzoate as intercalated agents.
For epoxy resins, an organo-modified LDHs was prepared by intercalationof amino laurate into the LDHs layers via a coprecipitation method. Reactionbetween the intercalated amino laurate and the epoxy molecules favors the com-patibility of the exfoliated nanocomposite system. A study of the mechanicalproperties (Figure 3) versus the LDH content clearly proves that the tensilestrength and the Young’s modulus are correlated with the content of LDHs: thehigher the LDHs content, the higher the tensile strength and the Young’s modu-lus. The strain at break increases and reaches a maximum at about 3 wt% LDH.With higher levels of LDHs the strain at break then decreases.
The elastics modulus of these nanocomposites increases with the LDHs con-tent because of improved stiffness, and the loss modulus is slightly increased.This may be explained by a loss of mobility of the extensive segments of theepoxy main chain, leading to an increase in the glass transition temperature(from 48°C for 0 wt% LDH to 61°C for 7 wt% LDH; Figure 4).
Figure 3 Effect of LDHs on the mechanical properties of LDHs/epoxy nanocomposites15
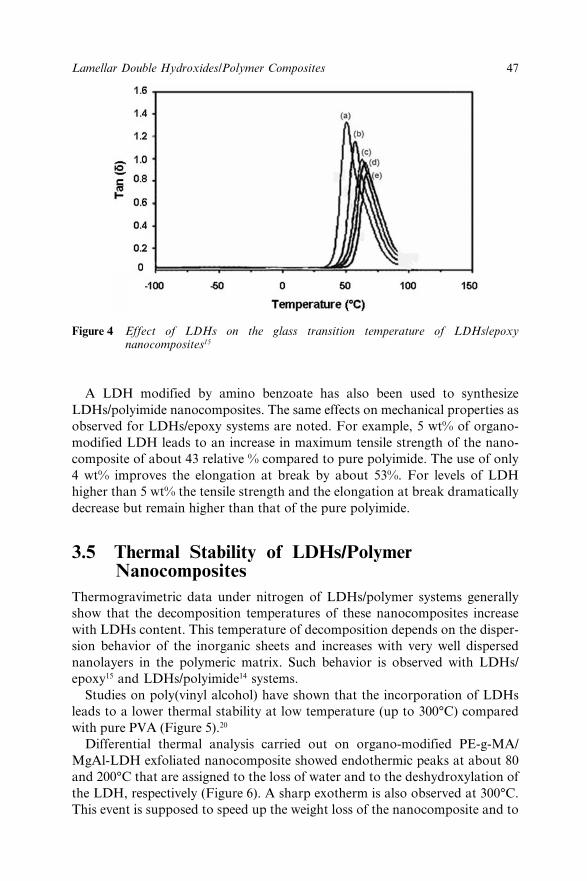
47Lamellar Double Hydroxides/Polymer Composites
A LDH modified by amino benzoate has also been used to synthesizeLDHs/polyimide nanocomposites. The same effects on mechanical properties asobserved for LDHs/epoxy systems are noted. For example, 5 wt% of organo-modified LDH leads to an increase in maximum tensile strength of the nano-composite of about 43 relative % compared to pure polyimide. The use of only4 wt% improves the elongation at break by about 53%. For levels of LDHhigher than 5 wt% the tensile strength and the elongation at break dramaticallydecrease but remain higher than that of the pure polyimide.
3.5 Thermal Stability of LDHs/PolymerNanocomposites
Thermogravimetric data under nitrogen of LDHs/polymer systems generallyshow that the decomposition temperatures of these nanocomposites increasewith LDHs content. This temperature of decomposition depends on the disper-sion behavior of the inorganic sheets and increases with very well dispersednanolayers in the polymeric matrix. Such behavior is observed with LDHs/epoxy15 and LDHs/polyimide14 systems.
Studies on poly(vinyl alcohol) have shown that the incorporation of LDHsleads to a lower thermal stability at low temperature (up to 300°C) comparedwith pure PVA (Figure 5).20
Differential thermal analysis carried out on organo-modified PE-g-MA/MgAl-LDH exfoliated nanocomposite showed endothermic peaks at about 80and 200°C that are assigned to the loss of water and to the deshydroxylation ofthe LDH, respectively (Figure 6). A sharp exotherm is also observed at 300°C.This event is supposed to speed up the weight loss of the nanocomposite and to
Figure 4 Effect of LDHs on the glass transition temperature of LDHs/epoxynanocomposites15
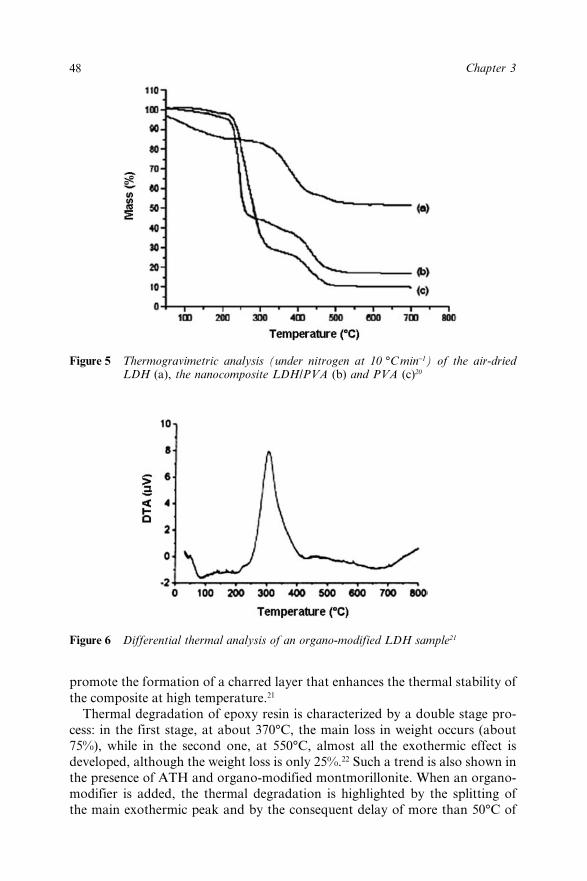
48 Chapter 3
promote the formation of a charred layer that enhances the thermal stability ofthe composite at high temperature.21
Thermal degradation of epoxy resin is characterized by a double stage pro-cess: in the first stage, at about 370°C, the main loss in weight occurs (about75%), while in the second one, at 550°C, almost all the exothermic effect isdeveloped, although the weight loss is only 25%.22 Such a trend is also shown inthe presence of ATH and organo-modified montmorillonite. When an organo-modifier is added, the thermal degradation is highlighted by the splitting ofthe main exothermic peak and by the consequent delay of more than 50°C of
Figure 5 Thermogravimetric analysis (under nitrogen at 10 °C min−1) of the air-driedLDH (a), the nanocomposite LDH/PVA (b) and PVA (c)20
Figure 6 Differential thermal analysis of an organo-modified LDH sample21
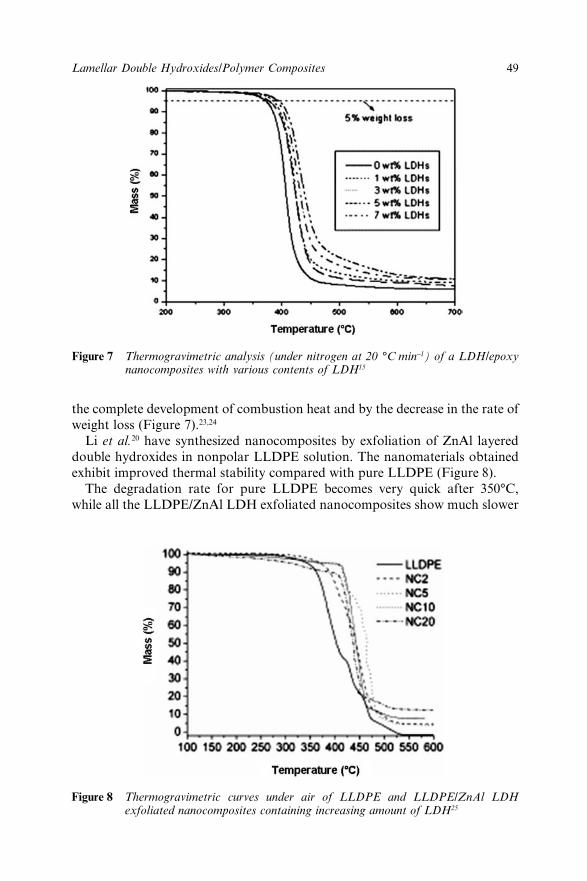
49Lamellar Double Hydroxides/Polymer Composites
the complete development of combustion heat and by the decrease in the rate ofweight loss (Figure 7).23,24
Li et al.20 have synthesized nanocomposites by exfoliation of ZnAl layereddouble hydroxides in nonpolar LLDPE solution. The nanomaterials obtainedexhibit improved thermal stability compared with pure LLDPE (Figure 8).
The degradation rate for pure LLDPE becomes very quick after 350°C,while all the LLDPE/ZnAl LDH exfoliated nanocomposites show much slower
Figure 7 Thermogravimetric analysis (under nitrogen at 20 °C min−1) of a LDH/epoxynanocomposites with various contents of LDH15
Figure 8 Thermogravimetric curves under air of LLDPE and LLDPE/ZnAl LDHexfoliated nanocomposites containing increasing amount of LDH25

50 Chapter 3
degradation rates before 400°C. There is around 10% weight loss with eachLLDPE/ZnAl LDH exfoliated nanocomposite in the range 200–400°C due todehydration of ZnAl hydroxide sheets, thermal degradation of alkyl chains, andvolatilization of thermo-oxidative product of LLDPE.
3.6 Flame Resistance of LDHs/Polymer CompositesLDHs inorganic fillers are described in the literature as agents that reduce theflammability of polymeric matrices. They are supposed to act by producing arefractory oxide on the surface of the material and by releasing aqueous vapourand carbon dioxide during its decomposition. This endothermic effect andthe release of dilution gases increase the time to ignition and reduce the heatreleased during combustion.1,23
Zammarano et al. have studied the fire retardant properties of LDHs/epoxynanocomposites and compared them with classical formulations containing alu-minum trihydroxide, montmorillonite and ammonium polyphosphate.24 Fromthe UL94 horizontal burning test, organo-modified LDHs based nanocom-posites show higher fireproof properties than conventional microcomposite for-mulations containing montmorillonite, ATH and neat LDH. This phenomenonmay be explained by the formation of an intercalated nanostructure of metaloxides and char (LDHs maintain their layered structure after thermal decompo-sition26). Cone calorimeter testing of organo-modified LDH containing epoxyshows a reduction of the peak of heat release of about 51% compared with thevirgin epoxy resin, while this reduction is about 27% for organo-modified claysand 62% for APP containing resins. In terms of weight loss, organo-modifiedclays and organo-modified LDHs have the same efficiency (9% residual weight)while APP leads to a final weight of about 90%. However, notably, like clays,LDHs do not modify the time to ignition of the material, which is 30 s higherthan in the case of formulation containing APP.24
The smoke suppressing action of LDHs in polymeric matrices is the maintopic discussed in the literature. Flame retardancy effects of LDH nanocom-posites on epoxy resin (EP), poly(vinyl chloride) (PVC) and polyethylene (PE)and polyamide-6 (PA6)/polypropylene (PP) blends were studied. This has beenhighlighted using classical fire and smoke emission tests.
The oxygen index and the smoke density of LDHs/EP nanocomposite materi-als in conditions of no flaming combustion have been investigated.27 The oxygenindex of EP increased slightly, but the smoke suppression effect was remarkablewhen LDH was added in 20–60 parts per 100 parts of resin. The porous thermaldecomposition products of LDH with large specific surface area gives smokesuppression effects by adsorbing the smoke and gases produced during combus-tion. Influences of LDHs on inflaming and smoking behavior of PVC have beenstudied by a NBS smoke density chamber.28,29 Effects of loading of LDHs and itsdispersion in PVC on smoke suppression were also investigated. The experimen-tal results show that the smoke suppressing efficiency of PVC induced by LDHspowder doesn’t increase as the contents of LDHs increases. However, betterdispersed LDHs have a better smoke suppressing effect. LDHs have obviously

51Lamellar Double Hydroxides/Polymer Composites
different effects on smoke suppressing of PVC by different inflaming testmeans.28 The results show that only 3–5% of LDHs can make the smoke-suppressing efficienly for the PVC/LDHs system reach up to 50%.29 In addition,the smoke generation rate and maximum density of smoke of LDHs/PVC nano-composite decrease by 40% with about 20–40 phr of LDH in comparisonwith pure PVC.30 The combustion and thermal degradation behavior of pol-yamide 6 (PA-6)/polypropylene (PP) blends containing nano-layered doublehydroxides (LDH) and ammonium polyphosphate (APP) were studied.31 Theflame-retardancy was improved by the synergistic LDH/APP addition. LDHspromote crosslinking and char formation during thermal degradation of theblends. The flame-retarding mechanism is related to the chemical and physicaleffects of the reaction products of LDHs and APP.
These results tend to show that LDH materials have a strong ability to modifythe processes of degradation and combustion of polymers, leading to bothcondensed phase and gas phase mechanisms.
3.7 ConclusionsPolymer-layered silicate nanocomposites have been widely studied and presentimproved mechanical and fire properties. Layered double hydroxydes present,like clays, a layered structure and show the benefits of containing hydroxylsgroups and water molecules. The synthesis of LDHs and LDHs/polymer nano-composites have been investigated but few studies describe the contribution ofLDHs in term of fire behavior and mechanical properties.
The possibility of synthesizing organo-modified LDHs allows improved com-patibility between the mineral load and the polymer. This is due to improvedmechanical properties of the composite and, in particular, to an increase intensile strength and Young’s modulus. However, as with clays, LDHs must beused with relatively weak contents of about 5 wt%.
Because of its layered structure, its hydroxyls groups and its water molecules,LDHs are supposed to be very efficient flame retardant. Moreover, it satisfiesabsolutely the global desire to develop environmentally friendly, cheap flameretardant additives. The few published studies show that nanocompositessystems LDHs/polymer have a reduced flammability compared with virginpolymer. This improvement of fire behavior results mainly in a significantdecrease in the release of smoke during combustion. Testing using a cone calo-rimeter also reveals that LDH/polymer nanocomposites exhibit a lower peak ofheat released than the virgin polymer. Possible synergistic effects, in particularwith ammonium polyphosphate, have been shown. This association enablesmuch improved fire properties.
LDHs/polymer nanocomposites can offer useful new properties comparedto conventional materials and can lead to the emergence of a new class ofmultifunctional hybrid materials that may be suitable for various applicationsas diverse as protonic conductors, photochromic materials or fire retardantmaterials.

52 Chapter 3
3.8 References1. G. Camino, A. Maffezzoli, M. Braglia, M. De Lazzaro and M. Zammarano,
Polym. Degrad. Stab., 2001, 74, 457–464.2. L. Delfosse, C. Baillet, A. Brault and D. Brault, Polym. Degrad. Stab.,
1989, 23, 337–347.3. J. Yeh, M. Yang and S. Hsieh, Polym. Degrad. Stab., 1998, 61, 465–472.4. S. Sinha Ray and M. Okamoto, Prog. Polym. Sci., 2003, 28, 1539–1641.5. F. Dabrowski, M. Le Bras, S. Bourbigot, J.W. Gilman and T. Kashiwagi, in
Proceedings of Euro-fillers’99, Lyon-Villerbanne, France, 6–9 September1999.
6. S. Bourbigot, M. Le Bras, F. Dabrowski, J.W. Gilman and T. Kashiwagi,Fire Mater., 2000, 24, 201–208.
7. J.W. Gilman, T. Kashiwagi, E.P. Giannelis, E. Manias, S. Lomakin,J.D. Lichtenhan and P. Jones, ‘Flammability properties of polymer-layered silicate nanocomposites’ in Chemistry and Technology of PolymerAdditives, S. Al-Malaika, A. Golovoy and C.A. Wilkie (eds.), BlackwellScience Pub., Oxford, UK, 1999, Chapter 14.
8. A. Vaccari, Appl. Clay Sci., 1999, 14(4), 161–198.9. B.R. Shaw and K.E. Creasy, J. Electroanal. Chem., 1988, 243(1),
209–217.10. J. Qiu and G. Villemure, J. Electroanal. Chem., 1988, 428(1–2), 165–172.11. F. Leroux and J.P. Besse, Chem. Mater., 2001, 13, 3507–3515.12. F. Malherbe, and J.P. Besse, J. Sol. State Chem., 2000, 155(2), 332–341.13. M. Badreddine, A. Legroui, A. Barroug, A. De Roy and J.P. Besse, Mat.
Lett., 1999, 38(6), 391–395.14. H.B. Hsueh and C.Y. Chen, Polymer, 2003, 44, 1151–1161.15. H.B. Hsueh and C.Y Chen, Polymer, 2003, 44, 5275–5283.16. M. Lakraimi, A. Legroui, A. Barroug, A. De Roy and J.P. Besse,
J. Mater. Chem., 2000, 10(4), 1007–1011.17. S. Miyata, Clays Clay Miner., 1975, 23(5), 369–375.18. F. Kooli, I.C. Chisem, M. Vucelic and W.Jones, Chem. Mater., 1996, 8(8),
1969–1977.19. F. Leroux, M. Adachi-Pagano, M. Intissar, S. Chauviere, C. Forano and
J.P. Besse, J. Mater. Chem., 2001, 11(1), 105–112.20. B. Li, Y. Hu, R. Zhang, Z. Chen and W. Fan, Mater. Res. Bull., 2003, 38,
1567–1572.21. W. Chen and B. Qu, Chem. Mater., 2003, 15, 3208–3213.22. R. Kotsilkova, V. Petkova and Y. Pelovski, J. Therm. An. Cal., 2001, 64,
591–598.23. M. Zammarano, Modifica delle Proprieta di ritardo alla fiamma del
poli-(etilene-co-acetato di vinile) con cariche inorganiche. Degree Thesis,University of Lecce, Italy, July 2000.
24. M. Zammarano, M. Franceschi, F. Mantovani, A. Minigher, M. Celottoand S. Meriani, “Flame resistance properties of layered-double-hydroxides/epoxy nanocomposites.” in Proceed. 9th european meeting on Fire
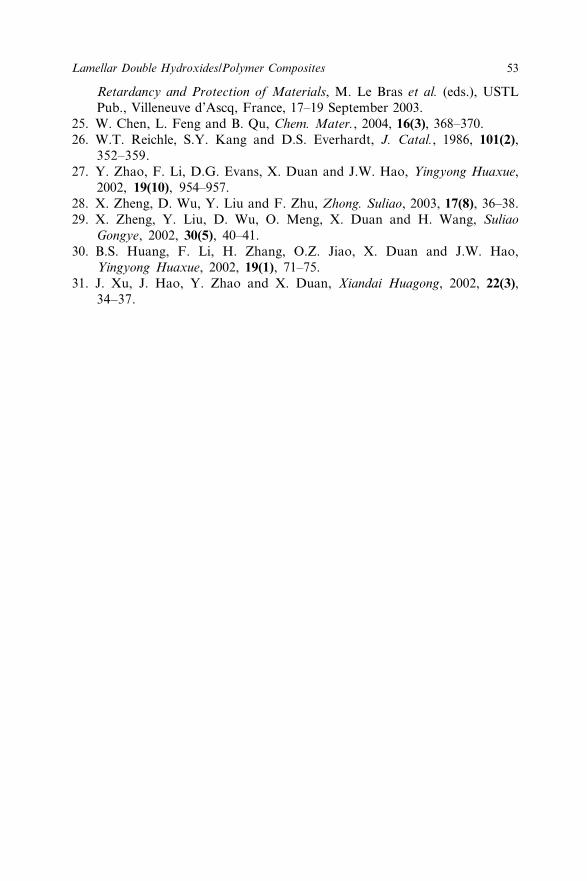
53Lamellar Double Hydroxides/Polymer Composites
Retardancy and Protection of Materials, M. Le Bras et al. (eds.), USTLPub., Villeneuve d’Ascq, France, 17–19 September 2003.
25. W. Chen, L. Feng and B. Qu, Chem. Mater., 2004, 16(3), 368–370.26. W.T. Reichle, S.Y. Kang and D.S. Everhardt, J. Catal., 1986, 101(2),
352–359.27. Y. Zhao, F. Li, D.G. Evans, X. Duan and J.W. Hao, Yingyong Huaxue,
2002, 19(10), 954–957.28. X. Zheng, D. Wu, Y. Liu and F. Zhu, Zhong. Suliao, 2003, 17(8), 36–38.29. X. Zheng, Y. Liu, D. Wu, O. Meng, X. Duan and H. Wang, Suliao
Gongye, 2002, 30(5), 40–41.30. B.S. Huang, F. Li, H. Zhang, O.Z. Jiao, X. Duan and J.W. Hao,
Yingyong Huaxue, 2002, 19(1), 71–75.31. J. Xu, J. Hao, Y. Zhao and X. Duan, Xiandai Huagong, 2002, 22(3),
34–37.

54
CHAPTER 4
Effect of a Small Amount ofFlame Retardant on theCombustion of PC, PBT andPETTOMOHIRO OHKAWA,1 TOMOYUKI ISHIKAWA2 ANDKUNIHIKO TAKEDA2
1Department of Materials, Physics and Energy Engineering, Graduate Schoolof Engineering, Nagoya University, Furo-cho, Chikusa-ku, Nagoya 464-8603Japan2Institute for Advanced Research, Nagoya University, Furo-cho, Chikusa-ku,Nagoya 464-8603 Japan [email protected]
4.1 IntroductionIt has long been known that a small amount of red phosphorous is effectivein flame retardancy.1 Gilman and his co-workers discovered some nano-composites that can be used as flame retardants when blended by 2–3% to poly-mers such as polyamide and polystyrene.2 These compounds are noteworthybecause the necessary amount of additives is small, whereas almost all otherflame retardants need to be added to plastics by 10% or more to clear the V-0level of the UL-94 test.3,4
Generally, it is very desirable for industry to decrease the amount of flameretardants added to plastics. This has especially been expected in the fields ofelectronic equipments and other sophisticated industries. When a flame retar-dant is freely soluble in polymer, the thermal durability, such as the heat distor-tion temperature, drops. Conversely, if it is insoluble, it reduces the mechanicalstrength, in particular, the impact strength. Researchers at General Electric(G.E.) and we have observed that 0.1 wt% or less of several compounds suchas fluoroalkane sulfonic acid salts and polyphenols retard the combustion ofplastics.

55Effect of Flame Retardant on the Combustion of PC, PBT and PET
In particular, this study focused on the flame retardancy of polycarbonate(PC) because PC polymerized bisphenol-A is one of the most useful engineeringplastics due to its toughness, transparency, easy processability and flameretardancy.5–7 Thermal degradation, light stability and other characteristics ofPC have been well studied because of its high practical use.8–10 Many researchershave also studied the flame retardancy of PC and have proposed the mechanismand the method to enhance the flame retardancy.11–13
We have studyed the thermal degradation of engineering plastics and thecausal relationship between thermal degradation routes and flame retardancy.14–17
The thermal degradation routes and the computer simulation by which the routescan be quantitatively analyzed were partially successful, but the relation betweenthe above two phenomena were not always recognized clearly. In particular,the flame retardancy cannot always be improved even when the polymer issuccessfully stabilized.18,19 In this chapter, we analyze the degradation route andthe kinetics problems of the blended-PC with the strong acid salt compare withthat of red phosphorous.20–22
4.2 ExperimentalPC, polybutylene terephthalate (PBT) and polyethylene terephthalate (PET)used in this study were manufactured by GE Co., Japan (Lexan-121), by TeijinCo., Ltd. C7000 and Kurare (KS-750RC). Perfluorobutane sulfonic acid potas-sium salts (PPFBS), trifluoromethane sulfonic acid potassium salts (PTFMS),polyhydroxyphenol (PPh), red phosphorous (Red-P) and metal oxides such asZnO, La2O3, Cr2O3 were used as flame retardants.
These metal oxides were adsorbed on very fine porous silica particles assupporting materials that had been prepared as follows. An SiO2/inorganicsalt mixture solution was dried at 80°C and, subsequently, the dried lumps werecalcined at 600°C. After cooling, the samples were dipped into hot water toleach the inorganic salt. The metal nitrates were dissolved in water and theporous silica was dipped in the solution. Subsequently, the slurry was dried bya rotary evaporator. The thin layer of the metal oxides on the silica particleswas formed after calcination at 600°C. The metal oxides were analyzed andobserved by SEM-EDX. (Scanning electron microscope/energy dispersive X-rayspectroscopy).
Figure 1 shows the X-ray diffraction diagram of Zn/silica powder. The sig-nals of the specimens coincided with that of the authentic sample. The broadpeak at 21° was assigned to the cristobalite-type crystal of silica. Very fine silicaparticles were observed by SEM.
The chemicals and the silica particle were processed with PC and PBT bya twin rotor manufactured by Custom Scientific Instruments (CSI) Co., MaxMixing Extruder CS-194A. The blended-PC with each flame retardant (FR) iswritten here as FR/PC. For example, Red-P/PC means the blended-PC with redphosphorous.
Py-GC/MS (manufactured by Shimadzu, Py: PYR-4A, and GC/MS:QP-5000) and TGA (Shimadzu: TGA-50) were used in analysing pyrolysis

56 Chapter 4
products and thermogravimetry, respectively. UL-test and a cone calorimeter(CC: manufactured by Toyo Seiki Seisaku-sho: C3 type) were used to measureflame retardancy.23–25 Ten specimens per kind of samples were prepared in theUL-test, five of which were for measuring the flaming combustion time of theUL (Underwriter laboratory)-94 method, which is well-known as a burning testfor plastics. The other five were used for “ignition time”, which is defined as thetime at which the observer judged the specimen began to fire by the same styleof UL-test. It was difficult to decide the ignition time because two kinds of fires(a burner and a flaming combustion fire of specimen) could not be exactly recog-nized. Thus, the average of three specimens was calculated after the longest andthe shortest times were eliminated. The Molic mouse method, developed by us,was applied for the computer simulation.26,27
4.3 Results4.3.1 Combustion Data of Blends with PPFBS, PTFMS and
PPh
The flaming combustion times of the UL-94V test as a function of the amount ofadditives (PPFBS in PC and PPh in PET) are plotted in Figure 2. Both examplesrestrained remarkably the flammability at a very low concentration level.
Figure 1 X-Ray diffraction diagram of Zn/silica

57Effect of Flame Retardant on the Combustion of PC, PBT and PET
The flaming combustion times of PPFBS/PC and PTFMS/PC are comparedin Figure 3 where the ignition and flaming combustion times can be simulta-neously understood. A shift of the bar to the left means that the ignition time islonger and the flaming combustion time is shorter. A small amount of PTFMSas well as PPFBS to PC was effective on the flaming combustion time whereasthe ignition times did not change clearly [Figure 3 (left)]. The results with PBTblends were more complex than those of PC. Only 0.5% of PTFMS was effectivein shortening the flaming combustion time.
The tendency of the PET and PBT blends, both of which are classified aspolyester group, was different (Figure 4). The flaming combustion time of thePPh/PET decreased with increasing PPh but that of PPh/PBT did not show sucha clear tendency. The ignition times of various blends of these two polymers didnot depend on the amount of the additives (Figures 3 and 4).
The heat fluxes of the specimens were observed by a cone calorimeter and theresults are plotted in Figure 5 (left). Neat-PC ignited after 100 s and the heat
Figure 2 Flaming combustion time as a function of the amount of additives
Figure 3 Ignition and flaming combustion times of PPFBS/PC and PTFMS/PC (left)and FR/PBT (right)

58 Chapter 4
release rate curve rised rapidly to 780 kW m−2. A carbon layer formed on thesurface and the heat release rate dropped after 130 s and was restrained to about500 kW m−2. Carbon dioxide and other scission products broke the surface layerat 200 s. The blended-PC had a faster ignition time than neat-PC. The additivesretarded the flammability but the effects were not remarkable compared with theresults of the UL-test.
The profile of the blend with fluoroalkane sulfonic acid salts to PBT [Figure 5(right)] was much simpler than that of PC. The ignition time of 5% of PTFMSwas 30 s, which was shorter than that of neat-PBT. After ignition, a vigorous firewas observed and the heat release rate indicated 2000 kW m−2 or more.
4.3.2. Combustion of Blends with Metal Oxides,Red Phosphorous
To compare the effects of other compounds in the region of small additiveamount, the effects of metal oxides on porous silica and red phosphorouswere studied. The ignition times of the blends were shorter than that of neat-PC[Figure 6 (left)] and the flaming combustion times were also clearly shorter.Generally, a shorter ignition time means that the specimen tends to burn easily.
Figure 4 Flaming combustion times of blends with PPh of PET (left) and PBT (right)
Figure 5 Heat release rate of the blends of PC (left) and PBT (right) with fluoroalkanesulfonic acid salts

59Effect of Flame Retardant on the Combustion of PC, PBT and PET
As the results in Figure 6 (left) differ from the general tendency it of interest tostudy the mechanism of the flame retardancy.
Although, many metal oxides were tried to improve the flame retardancyof the blended PBT, only ZnO was effective, when added by 10% [Figure 6(right)]. As ZnO is amphoteric and is expected to coordinate with O-containingcompounds, it is seemed that it interacts with the silica surface or polycarbonate.
4.3.3 TGA and Elemental Analysis of PC
Thermal degradation is important to consider in flame retardancy. Both igni-tion and flaming combustion times are expected to depend on degradationbecause the combustion heat is decided by the amount or the species of scissionproducts. Each degradation profile of the blends of PC with fluoroalkanesulfonic acid salts (Figure 7 left) and of PBT did not shift from those of neatplastics. TGA curves of the blends with oxides differed [Figure 7 (right)]. The50% degradation temperature of Red-P/PC shifted to 620°C and the residueincreased from 26% to 42% at 800°C. The results supported the idea that the
Figure 6 Effect on UL-test of metal oxides on porous silica (PC: left, PBT: right)
Figure 7 TGA profiles of neat- and blended-PC (left: blended with fluoroalkane sulfonicacid salts, right: metal oxide)
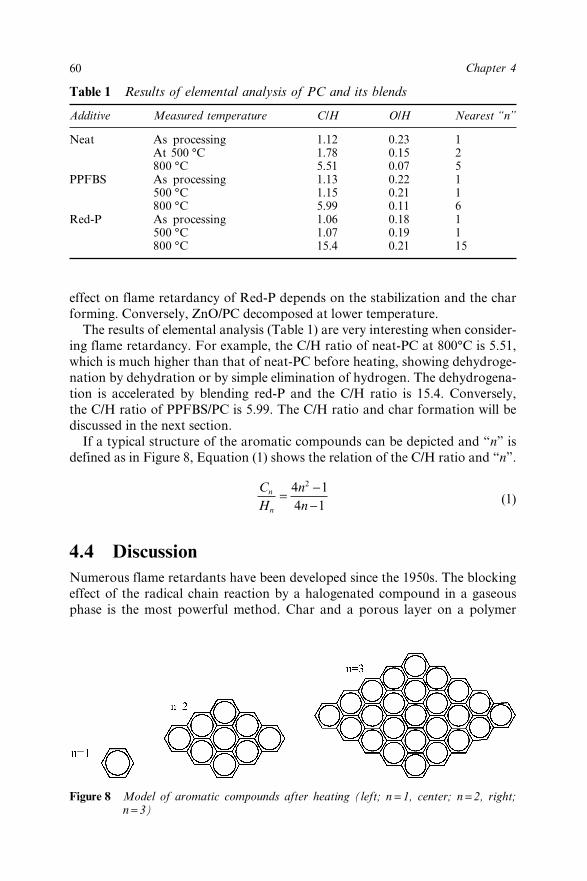
60 Chapter 4
effect on flame retardancy of Red-P depends on the stabilization and the charforming. Conversely, ZnO/PC decomposed at lower temperature.
The results of elemental analysis (Table 1) are very interesting when consider-ing flame retardancy. For example, the C/H ratio of neat-PC at 800°C is 5.51,which is much higher than that of neat-PC before heating, showing dehydroge-nation by dehydration or by simple elimination of hydrogen. The dehydrogena-tion is accelerated by blending red-P and the C/H ratio is 15.4. Conversely,the C/H ratio of PPFBS/PC is 5.99. The C/H ratio and char formation will bediscussed in the next section.
If a typical structure of the aromatic compounds can be depicted and “n” isdefined as in Figure 8, Equation (1) shows the relation of the C/H ratio and “n”.
CH
nn
n
n
= −−
4 14 1
2
(1)
4.4 DiscussionNumerous flame retardants have been developed since the 1950s. The blockingeffect of the radical chain reaction by a halogenated compound in a gaseousphase is the most powerful method. Char and a porous layer on a polymer
Table 1 Results of elemental analysis of PC and its blends
Additive Measured temperature C/H O/H Nearest “n”
Neat As processing 1.12 0.23 1At 500 °C 1.78 0.15 2800 °C 5.51 0.07 5
PPFBS As processing 1.13 0.22 1500 °C 1.15 0.21 1800 °C 5.99 0.11 6
Red-P As processing 1.06 0.18 1500 °C 1.07 0.19 1800 °C 15.4 0.21 15
Figure 8 Model of aromatic compounds after heating (left; n = 1, center; n = 2, right;n = 3)

61Effect of Flame Retardant on the Combustion of PC, PBT and PET
surface, which can be increased by phosphorous compounds and the blendingof inorganic compounds, are other known methods. A satisfactory level can beobtained when those flame retardants are added by 10 wt% or more.
Conversely, the surface temperature of the polymer is approximately equal tothe decomposition temperature of polymer in the initial stage of the combustionbecause the entire heat generation by oxidation reactions in a gaseous phase isnot sufficient to elevate the temperature to 800°C or more. So, the temperatureof the polymer is the same as the degradation temperature. Degradation pathsof condensed-type polymers such as PC and PBT in the region can be dividedinto three categories. The first is the inverse reactions of the polymerization orsimilar degradations and the second is the more complicated paths through radi-cal transfer of direct scission. The third path is the subsequent degradation of thescission products. The following discussion on the flame retardancy and themechanism of neat- and blended-PCs is based on the above recognition on flameretardancy and thermal degradation.
4.4.1 Degradation at Different Temperatures
The amounts of the scission products of neat-PC and PPFBS/PC are plotted inFigure 9. Abbreviated symbols of the scission products are listed in Table 2.
The thermal degradation started at 500°C and the rate reached the maximumat 600°C at which point the scission products belonging to the A4 group wasmajor. The ratio of A4 of neat-PC in the entire scission products was about 50%and that of B2 was the second largest. However, the distribution of the blend wasmore complicated. A4 and B3 were major and the ratios were about 30%. B2,whose ratio was 30% of neat-PC, dropped to 12%. In particular, the ratio of B3,most of which was bisphenol-A, changed drastically as a result of adding PPFBSto PC.
4.4.2 Degradation Paths of Neat-PC and Blends
Many studies of PC thermal degradation have been conducted and some of theresults have been reported by Tsuge,28 Montaudo et al.,29 and McNeil et al.,8 in
Figure 9 Scission product distribution of neat-PC (left), PPFBS/PC (middle) andred-P/PC (right) as a function of temperature

62 Chapter 4
which the scission products were assigned. De-carbonation, dehydrogenation,and Fries rearrangement are typical reactions in the initial stage. Successively,cross-linking, cyclization and many other side reactions occur. Although thereare many routes and the reactions are very complicated, the final productsare limited. Some major products are bisphenol-A, alkyl phenols, and a cycliccompound. Thus, only the main routes were selected among these knownmechanisms in this study (Figure 10).
Two major paths can be considered. One is decarbonation (route-C) andthe other is the scission between two benzene rings prior to dehydrogenationfrom the isopropylidene groups (route-P). Successively, four routes, the C1-,C2-, P1- and P2-routes, might be considered to produce more small scissionproducts as shown in Figure 10. After the two-step degradation, the probabilityis divided into 16 kinds. For example, the probability of route-C of neat-PC was94.5% and that of route-P was only 5.5% for neat-PC at 495°C measured byTGA-PyGC-MS.
The scission probabilities of neat- and blended-PC at various temperatureshave been calculated (Table 3).
4.4.3 Estimated Char Structures
The Fries rearrangement reaction has been considered as a typical reactionat the initial stage of the chemical structure of the PC main chain. Subsequently,a dehyroxy-reaction occurs and several complicated paths can be reasonedby comparing with other polymer degradations. The C/H ratio of neat-PC is1.17 and those of the two intermediates in Figure 11 are 1.17 and 1.33, whichare much lower than the experimental data at 800°C. The final structure ofFigure 11 is presumed to be the char structure of neat-PC after degradation.That of the blend with red phosphorous was much larger because the C/H ratioand the “n” was about 15.
Table 2 Abbreviated symbols of PC scission products
A B C
A-1 B-1 C-1
1
A-2 B-2 C-2
2
A-3 B-3 C-3
3A-4 B-4 C-4
4
CH3
—C— CH3
–– —O–C–O—
=
O
CH3
—C— CH3
–– —OH
CH3
—C— CH3
–– —OHOH—
—O–C–O—
=
OR—
—O–C–O—
=
OR— —R
R—
R— —OH
—OH
— —

63Effect of Flame Retardant on the Combustion of PC, PBT and PET
4.4.4 Degradation Routes and Flame Retardancy
The amount of the strong acid potassium salt in this study is about 100 timessmaller than that of red phosphorous and nano-composites. The result of thisstudy should be discussed from the viewpoint of the degradation paths in PC andthe mobility of the additives in the polymer network.
The degradation of PC at just below the degradation temperature is importantfor the control of combustion. The degradation paths of PC in the region canbe divided into two categories. One is relatively simple and can be grouped intotwo reactions types. The de-carbonation due to the scission of the carbonatebond made phenol type and phenyl type ends [Figure 12 (left)]. There was littlepossibility for these to recombine with other fragments. So the products seemedto be simple if the degradation is dominated by decarbonation.
On the contrary, dehydrogenation from the isopropylidene group tendedto lead to subsequent reactions such as cross-linking, transfer of the radicals,and the generation of a cyclic compound. The volatile products could not beexpected because the scission product had a high boiling point.
Carbon-rich materials were generated at higher temperature and Red-P accel-erated it. Conversely, the C/H ratio of PPFBS/PC was about the same as thatof neat-PC. Adding flame retardants is considered to restrain the flammability
Figure 10 Simplified degradation paths of PC and the degradation ratio of each path ofneat-PC at 495 °C

64 Chapter 4
Tab
le3
Sci
ssio
n pr
obab
ility
tab
le
Pro
babi
lity
Deg
rada
tion
rou
tes
Nea
tP
PF
BS
Red
P
495°
C54
5°C
595°
C64
5°C
495°
C54
5°C
595°
C64
5°C
495°
C54
5°C
595°
C64
5°C
C94
.558
.161
.366
.076
.857
69.5
70.9
77.5
70.2
52.5
71.3
CC
291
.515
.518
.420
.341
.818
40.2
36.8
55.9
41.2
13.4
53.6
CP
22.
740
.224
.425
.63.
136
.820
.43.
28.
619
.132
.411
CP
10.
10.
10.
86.
80.
00.
10.
90.
82.
20.
92.
43.
9C
C1
0.2
2.2
17.7
13.3
31.9
2.1
830
10.8
9.3
4.3
2.8
P5.
551
.938
.734
.023
.243
30.5
29.1
22.5
29.8
47.5
28.7
PP
10.
00.
42.
90.
32.
62.
61.
87.
71.
31.
72.
32.
8P
C1
0.7
2.0
0.6
9.0
0.3
3.9
3.4
1.2
3.2
2.3
5.4
4.4
PC
22.
138
.324
.623
.42.
833
17.9
2.8
7.6
18.4
29.4
10.5
PP
22.
70.
110
.61.
317
.53.
57.
417
.510
.47.
410
.411
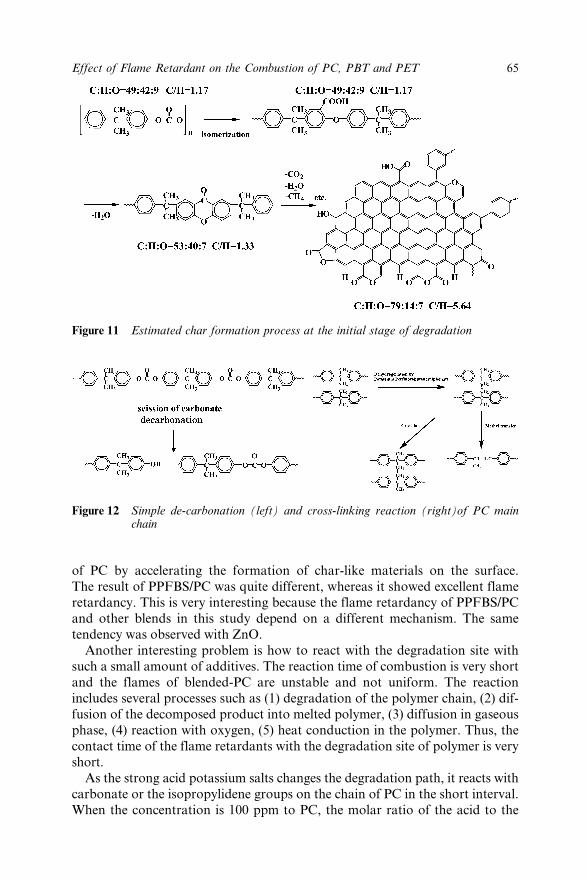
65Effect of Flame Retardant on the Combustion of PC, PBT and PET
of PC by accelerating the formation of char-like materials on the surface.The result of PPFBS/PC was quite different, whereas it showed excellent flameretardancy. This is very interesting because the flame retardancy of PPFBS/PCand other blends in this study depend on a different mechanism. The sametendency was observed with ZnO.
Another interesting problem is how to react with the degradation site withsuch a small amount of additives. The reaction time of combustion is very shortand the flames of blended-PC are unstable and not uniform. The reactionincludes several processes such as (1) degradation of the polymer chain, (2) dif-fusion of the decomposed product into melted polymer, (3) diffusion in gaseousphase, (4) reaction with oxygen, (5) heat conduction in the polymer. Thus, thecontact time of the flame retardants with the degradation site of polymer is veryshort.
As the strong acid potassium salts changes the degradation path, it reacts withcarbonate or the isopropylidene groups on the chain of PC in the short interval.When the concentration is 100 ppm to PC, the molar ratio of the acid to the
Figure 11 Estimated char formation process at the initial stage of degradation
Figure 12 Simple de-carbonation (left) and cross-linking reaction (right)of PC mainchain
66 Chapter 4
groups on the PC chain are 7300 in PPFMS/PC and about 13300 in that ofPPFBS/PC.
It is very difficult to find a reasonable mechanism to explain why the smallamount of acid can react with the enormous groups on the PC chain in such ashort time. PC is a rigid plastic and the diffusion constant is about 10–13 m2 s−1.The radius of the sphere in which about 10000 groups are included is calculatedto be about 10 nm. The half-time calculated by equation (2) in which the strongacid diffuses in the sphere is 10 ms or less,
τ50 0 0075= .dD
(2)
where t50 is the half-time of the completed reaction, d is the diameter, and D isdiffusion constant.30
Consequently, these contradictory phenomena could be explained by consid-ering that the interaction of the PC chain is too weak to construct solid materialsin such a small space whose dimension is about 10 nm or less. The molecularforce between the two chains of PC is supposed to be very small, like otherpolymers. PC is in a solid state is not because of the mutual interaction betweenthe adjacent chains but because of the entanglement between several chains. So,the mobility of the strong acid salt is high even in the solid state.
The carbon content of the residue is smaller than those of neat-PC and red-P/PC. Many researchers studying flame retardancy recognize that char formingon the surface of PC can restrain combustion. So, the additives that decreasethe char should not be effective. The strong acid salt creates a different kindof circumstance in a very small space of PC polymers and accelerates thedegradation of all PC chains in it, as observed in the cone calorimeter test. Thedecomposed PC changes into a different structure as compared to the original.The cross-link or other reactions are supposed to occur mainly by dehydrogena-tion instead of dehydration and the structure after degradation in the early stagechanges without generating few volatile products.
Simply speaking, four major effects have been recognized to reduce theflammability of polymers. They are the radical trap in a gaseous phase, charformation on the surface of polymer, the blending of inorganic compounds, andthe so-called “intumescent” method. The mechanism described in this chapterdiffers from these four types.
4.5 AcknowledgementThe authors sincerely appreciate the assistance given by Dr S. Nikkeshi whokindly offered the data on polyphenols, which was one of his excellent studieswhen he worked at the Tohoku Munekata Co. Ltd., IM Dept.
4.6 References1. M.T. Huggard, Recent Adv. Flame Retardancy Polym. Mater., 1992, 3,
192–207.

67Effect of Flame Retardant on the Combustion of PC, PBT and PET
2. J.W. Gilman and T. Kashiwagi, SAMPE J., 1997, 44(3), 40–46.3. J.W. Lyons, J. Fire & Flamm., 1970, 1(9), 302–311.4. S. Bourbigot, M. Le Bras, R. Leeuwendal, K. Shen and D. Schubert,
Polym. Degrad. Stab., 1999, 64, 419–425.5. W.H. Carothers and F.J. van Natta, J. Am. Chem. Soc., 1930, 53, 314.6. P.V. Kozlov, Vysokomol. Soedin., 1961, 3, 462.7. R.A. Ekvall and J.R. Low, Jr., J. Appl. Polymer Sci., 1964, 8, 1677.8. I.C. McNeil and A. Rincon, Polym. Degrad. Stab., 1993, 39, 13–19.9. A. Factor, Polym. Durability, 1996, 59–76.
10. C.A. Pryde, ACS Symp. Ser., 1985, 280, 329.11. R.P. Kambour, J. Appl. Polym. Sci., 1981, 26, 861–877.12. M.R. Mclaury and A.L. Schroll, J. Appl. Polym. Sci., 1985, 30, 461–472.13. C.P. Fenimore and F.J. Martin, Combustion Flame, 1965, 10, 135–139.14. S. Takayama and K. Takeda, Polym. Degrad. Stab., 1995, 50(4), 277–284.15. M. Kinoshita and K. Takeda, Polym. Degrad. Stab., 1995, 68, 437–443.16. S. Takayama and K. Takeda, J. Appl. Polym. Sci., 1999, 70, 2521–2526.17. K. Takeda and T. Nemoto, in Proceedings of the 10th Annual Symposium
of BBC, Business Communications Company, INC., Norwalk, 1999, 1–9.18. K. Takeda, Polym. Degrad. Stab., 2000, 69, 191–196.19. K. Takeda, K. Minamitani and T. Nemoto, in Proceedings of the 11th
Annual Symposium of BBC, Business Communications Company, INC.,Norwalk, 2000, 11–18.
20. K. Takeda, F. Amemiya and A. Nanasawa, J. Appl. Polym. Sci., 1997,64, 1175–1183.
21. T. Ohkawa and K. Takeda, Soc. Polym. Sci., 2001, 10, 163–164.22. Y. Ikeda and K. Takeda, Polym. Preprints, 2001, 50(3), 579.23. J. Rycchly, Polym. Degrad. Stab., 1996, 54, 249–254.24. M. Foley, Fire Mater., 1994, 18, 385–387.25. H.W. Emmons, Fire Mater., 1990, 67–83.26. T. Koshiduka, T. Ohkawa and K. Takeda, Polym. Degrad. Stab., 2003,
79, 1–12.27. T. Ishikawa, T. Ohkawa, M. Suzuki, T. Tsuchiya and K. Takeda, J. Appl.
Polym. Sci., 2003, 88, 1465–1472.28. S. Tsuge, T. Okumoto, Y. Sugimura and T. Takeuchi, J. Chromatogr. Sci.,
1969, 7 (April) 253–256.29. A. Ballistreri, G. Montaudo and E. Scamporrino, J. Polym. Sci. Part A,
1988, 26, 2115–2121.30. K. Takeda and K. Morita, Separat. Sci. Technol., 1996, 31(19), 2665–2670.

68
CHAPTER 5
Intumescent Silicates: Synthesis,Characterization and FireProtective EffectCHRISTINE PÉLÉGRIS, MURIELLE RIVENET ANDMICHEL TRAISNEL
Laboratoire PERF, ENSCL, USTL, BP 108, F-59652 Villeneuve d’AscqCedex, France ([email protected])
5.1 IntroductionSoluble alkali silicates are well-known as fire-proofing materials in buildingconstruction.1 They have long been used to impregnate wood to increase itsresistance against fire.2 More recently, they have been introduced in paintings,enamels, polymers3,4 or used as coating for fire resistant glasses.5 The extensiveuse of alkali silicates is due to their property of swelling when heated or exposedto flame, forming a solid, rigid insulating foam. Moreover, no toxic fumes arereleased when they are dried, they are environmentally compatible and are inabundant supply. However, their poor water resistance and hygroscopic naturelimit their application as coatings.
The mechanisms by which silicates act as fire retardant have been identifiedas
• Diluting effect due to water vaporisation.• Cooling effect due to endothermic phenomena related to water
vaporisation.• Thermal and diffusion barrier effects owing to the formation of a mineral
foam when heated.4,6
The literature also evidenced that, if the water contained in silicates, ionic waterhas a drastic effect on volume expansion.4,6,7 Intumescence is allowed by theformation of a viscous phase that forms at the same temperature as thevaporisation temperature of ionic water molecules.8 Owing to the influence of
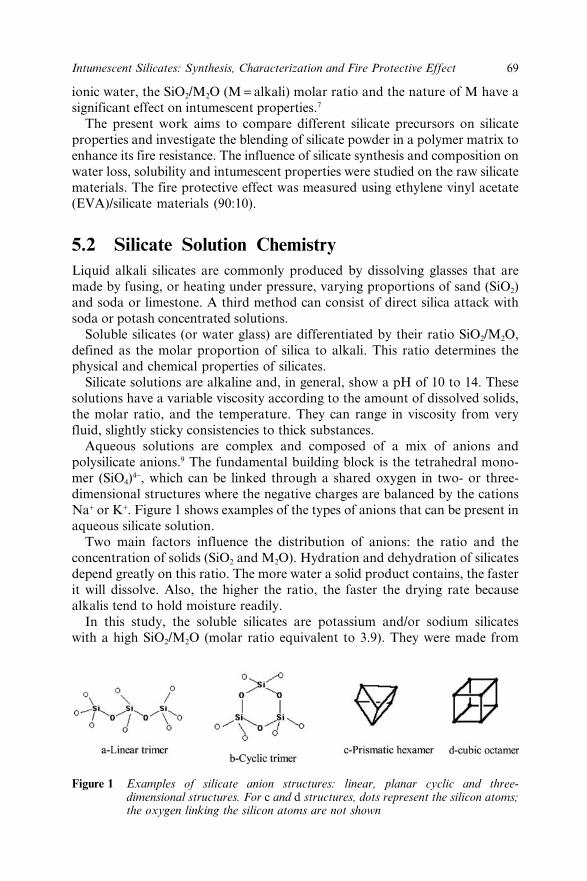
69Intumescent Silicates: Synthesis, Characterization and Fire Protective Effect
ionic water, the SiO2/M2O (M = alkali) molar ratio and the nature of M have asignificant effect on intumescent properties.7
The present work aims to compare different silicate precursors on silicateproperties and investigate the blending of silicate powder in a polymer matrix toenhance its fire resistance. The influence of silicate synthesis and composition onwater loss, solubility and intumescent properties were studied on the raw silicatematerials. The fire protective effect was measured using ethylene vinyl acetate(EVA)/silicate materials (90:10).
5.2 Silicate Solution ChemistryLiquid alkali silicates are commonly produced by dissolving glasses that aremade by fusing, or heating under pressure, varying proportions of sand (SiO2)and soda or limestone. A third method can consist of direct silica attack withsoda or potash concentrated solutions.
Soluble silicates (or water glass) are differentiated by their ratio SiO2/M2O,defined as the molar proportion of silica to alkali. This ratio determines thephysical and chemical properties of silicates.
Silicate solutions are alkaline and, in general, show a pH of 10 to 14. Thesesolutions have a variable viscosity according to the amount of dissolved solids,the molar ratio, and the temperature. They can range in viscosity from veryfluid, slightly sticky consistencies to thick substances.
Aqueous solutions are complex and composed of a mix of anions andpolysilicate anions.9 The fundamental building block is the tetrahedral mono-mer (SiO4)4−, which can be linked through a shared oxygen in two- or three-dimensional structures where the negative charges are balanced by the cationsNa+ or K+. Figure 1 shows examples of the types of anions that can be present inaqueous silicate solution.
Two main factors influence the distribution of anions: the ratio and theconcentration of solids (SiO2 and M2O). Hydration and dehydration of silicatesdepend greatly on this ratio. The more water a solid product contains, the fasterit will dissolve. Also, the higher the ratio, the faster the drying rate becausealkalis tend to hold moisture readily.
In this study, the soluble silicates are potassium and/or sodium silicateswith a high SiO2/M2O (molar ratio equivalent to 3.9). They were made from
Figure 1 Examples of silicate anion structures: linear, planar cyclic and three-dimensional structures. For c and d structures, dots represent the silicon atoms;the oxygen linking the silicon atoms are not shown

70 Chapter 5
commercial solutions of either potassium or sodium silicate with fumed silica, orby depolymerization of silica in concentrated alkaline solutions.
5.3 Experimental5.3.1 Sample Preparation
5.3.1.1 Aqueous Silicates
Silicate solutions were prepared with a molar ratio equivalent to 3.9. Theirreference and composition are reported in Table 1.
K-100 and Na-100 were prepared from two commercial solutions, respec-tively, Kasil#6 from PQ Corporation and a sodium trisilicate solution fromRiedel-de-Haën; their characteristics are summarized in Table 2. Fumed silica(380 m² g−1 – Aldrich) was incorporated in the two solutions to increase themolar ratio until 3.9. A mixture of potassium and sodium silicate was also
Table 1 Silicate materials synthesis
Amount forSilicate materials references Raw materials synthesis (g)
K-100 K2O,SiO2 (Kasil#6) 100PQ CorporationFumed silica (380 m² g−1) Aldrich 5
Na-100 NaOH,SiO2 Riedel-de-Haën 100Fumed silica (380 m² g−1) Aldrich 2
K-Na 50/50 K2O,SiO2 (Kasil#6) PQ 50CorporationNaOH,SiO2 Riedel-de-Haën 53Fumed silica (380 m² g−1) Aldrich 4.5
PK Fumed silica (380 m² g−1) Aldrich 40KOH solution, 37.7% 50
PNa Fumed silica (380 m² g−1) Aldrich 40NaOH solution, 37.7% 68
Table 2 Chemical and physical properties of commercial silicate solutions
Kasil“#6 Sodium trisilicate solution
%K2O 12.7%NaOH 10%SiO2 26.5 27Molar ratio 3.29Weight ratio 2.1pH 12.7Viscosity 1050 ctpSpecific gravity 1.39 g cm−3 (20 °C) 1.39 g cm−3 (20 °C)M 242.23 g mol−1

71Intumescent Silicates: Synthesis, Characterization and Fire Protective Effect
studied through the K-Na 50/50 sample. In each case, samples were synthesizedat ambient temperature in Teflon beakers, and were stirred manually. Toprepare PK and PNa samples, fumed silica was incorporated, respectively, in acold solution of KOH (37.7%) and NaOH (20%), and stirred in beakers placedin ice. Depending on the cation, samples appear as a viscous liquid in the case ofsodium silicate or a paste with the potassium precursors.
5.3.1.2 Dried Silicates
Silicates were dried at 100°C before characterization and incorporation in thepolymer matrix. For intumescence tests, samples were deposited on aluminiumboards and dried overnight at 100°C. For TGA, infrared spectroscopy, lixivia-tion tests and measure of fire protective effect, samples were dried at 100°C for24 hours on Teflon supports, then powdered.
5.3.2 Blending of Dried Silicates Powders and Ethyl VinylAcetate (EVA-19%) Polymer
A 20 g charge of silicate and polymer in the respective proportions 2:18 g wasfed into the preheated (160°C) mixer. All blends were mixed using the BrabenderLaboratory mixer measuring head (type 350/EH, roller blades, mixingconditions were checked using the data processing torque rheometer systemBrabender Plasticorder PL2000, constant shear rate: 50 rpm). Then, eachsystem was compression moulded into plates of 100 × 100 × 3 mm2 under 40 kNat 160°C.
5.3.3 Characterisation
5.3.3.1 Intumescence Test
Each dried sample was submitted to a thermal shock for 1 hour. The thicknessof each sample was measured before (ei) and after (ef) the thermal treatment todetermine the degree of intumescence, which was defined by Equation (1)
I =−e e
ef i
i(1)
Tests were performed at 200, 400 and 600 °C.
5.3.3.2 TGA Studies
Dried samples were powdered in a mortar and then thermogravimetricallyanalysed using a Setarum TGA 92 analyser. TGA tests were conducted in the20–600°C range at a heating rate of 10°C min–1.

72 Chapter 5
5.3.3.3 Lixiviation Test
After drying for 24 h at 100°C, each sample was powdered in a mortar andimmersed in a tray of 500 mL distilled water at 22°C for 1 h. For each sample,about 6 g was used. The water was stirred manually every 5 mins. Then thesample was removed, filtered and allowed to dry overnight before weighing todetermine the mass loss.
5.3.3.4 Infrared Spectroscopy
Infrared spectroscopy was used to gain information on the structure of the sili-cate at the end of the intumescence test. The intumesced samples were powderedand diluted with KBr (10% of silicate), then pressed at 5 bar. The analysiswas performed with an FTIR Nicolet Impact 400D apparatus over the4000–600 cm−1 region.
5.3.3.5 Fire Protective Effect
The fire protective effect of silicates was evaluated on the silicate-EVA systems.Each plate was placed under a radiant heat source at an appropriate distance toraise and keep the temperature at the surface of the plate to 350°C. A thermo-couple placed underneath the plate followed the temperature on the other side ofthe sample versus exposure time. The heat source was an epiradiator made ofviteous silica, with a radiant heat surface of 100 mm diameter and a nominalpower of 500 W.
5.4 Results and DiscussionIntumescence tests are reported in Figure 2. Whatever the temperature, thesodium-based silicates exhibit the highest swelling properties. The degree of
Figure 2 Influence of silicates composition and temperature on the degree of intumescence
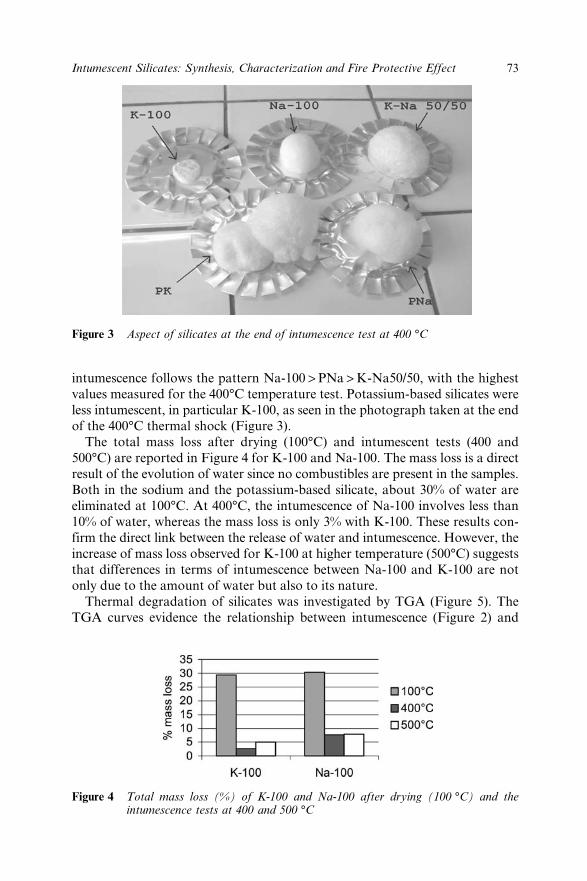
73Intumescent Silicates: Synthesis, Characterization and Fire Protective Effect
intumescence follows the pattern Na-100 > PNa > K-Na50/50, with the highestvalues measured for the 400°C temperature test. Potassium-based silicates wereless intumescent, in particular K-100, as seen in the photograph taken at the endof the 400°C thermal shock (Figure 3).
The total mass loss after drying (100°C) and intumescent tests (400 and500°C) are reported in Figure 4 for K-100 and Na-100. The mass loss is a directresult of the evolution of water since no combustibles are present in the samples.Both in the sodium and the potassium-based silicate, about 30% of water areeliminated at 100°C. At 400°C, the intumescence of Na-100 involves less than10% of water, whereas the mass loss is only 3% with K-100. These results con-firm the direct link between the release of water and intumescence. However, theincrease of mass loss observed for K-100 at higher temperature (500°C) suggeststhat differences in terms of intumescence between Na-100 and K-100 are notonly due to the amount of water but also to its nature.
Thermal degradation of silicates was investigated by TGA (Figure 5). TheTGA curves evidence the relationship between intumescence (Figure 2) and
Figure 3 Aspect of silicates at the end of intumescence test at 400 °C
Figure 4 Total mass loss (%) of K-100 and Na-100 after drying (100 °C) and theintumescence tests at 400 and 500 °C

74 Chapter 5
release of water when we compare Na-100 and K-100. Moreover, they indicatethat the water evolution is function of the nature of the cation. Indeed, the evolu-tion of water takes place in one step with the sodium based silicates (Na-100,PNa and K-Na50/50), in the wide range from 100 to 500°C, whereas for thepotassium silicates K-100 and PK it involves two steps: one in the interval 180–400°C, the other in the narrow range 400–500°C. According to the literature, thewater contained in silicates is described as free water and bound water.7 Freewater corresponds to the water physically adsorbed by hydrogen-bonding tosilanol groups. As shown in Figure 5, free water has been totally eliminated bydrying at 100°C. The mass loss recorded from 100°C by TGA corresponds tobound water, which is identified as ionic water in the temperature range 100 to200°C,7 and is due to the various hydrated species of the silicate anions. Clearly,from Figure 5, ionic water is present in Na-100 whereas for K-100 the releaserecorded from 180°C corresponds to more strongly bonded water.
The rapid evolution of the water vapour in this region reportedly resulted inthe initial intumescence of the alkali silicates.7 In this study, maximum of intu-mescence is observed at higher temperature and so cannot be only related toionic water but to water resulting from the condensation of silanol groups by thefollowing reaction, with the formation of siloxane bonds.
≡Si—OH + HO—Si≡ ≡Si—O—Si≡ + H2O
Evolution of water in the sodium-based silicates occurs gradually over a widerange of temperature (Figure 5). This phenomenon is assigned to the dehydra-tion of silanol having an irregular arrangement, associated to the irregularpolysilicate ions.7 In contrast, for K-100 and PK, the mass loss observed in thenarrow temperature range (400–500°C) involves the loss of more stronglybonded water. This water has been identified in potassium-based silicates asstructural water, and could be the result of the reaction of dehydration ofKHSi2O5:
Figure 5 TGA traces of the degradation of the silicates under air flow

75Intumescent Silicates: Synthesis, Characterization and Fire Protective Effect
2KHSi2O5 K2Si4O9 + H2O
evidenced by X-Ray diffraction as a significant component in the silicatematrix. The structural water would result from the reaction of silanol groupshaving an orderly arrangement (i.e. belonging to KHSi2O5). Infrared analysiswas performed on K-100 after the intumescence tests at 200, 400 and 600°C.The corresponding spectra (4000–600 cm−1) are reported in Figure 6.
Although the spectra show great similarity in the 600–1100 cm−1 region, thetrend of the band at 1000 cm−1, assigned to the Si–O–Si stretching frequency, isdifferent when K-100 is heated at 600°C. The broadness of this band observed inthe corresponding spectrum is indicative of an irregular structure.7 In contrast,the narrow band observed at 200 and 400°C suggests an orderly structure.Therefore, if we combine the IR results with the TGA data, the K-100 silicateprecursor would lead to the formation of an organized phase in the temperaturerange of interest for intumescence (200–400°C), whereas for Na-100 anamorphous phase would be obtained.
K-100 was also submitted to irradiance at 350°C (cf. the test for fire protectiveeffect), then analysed by IR spectroscopy. The corresponding spectrum is
Figure 6 Infrared spectra of K-100 at the end of intumescent tests at 200, 400and 500 °C, and after exposure to irradiance at 350 °C (cf. measure of fireprotective effect)
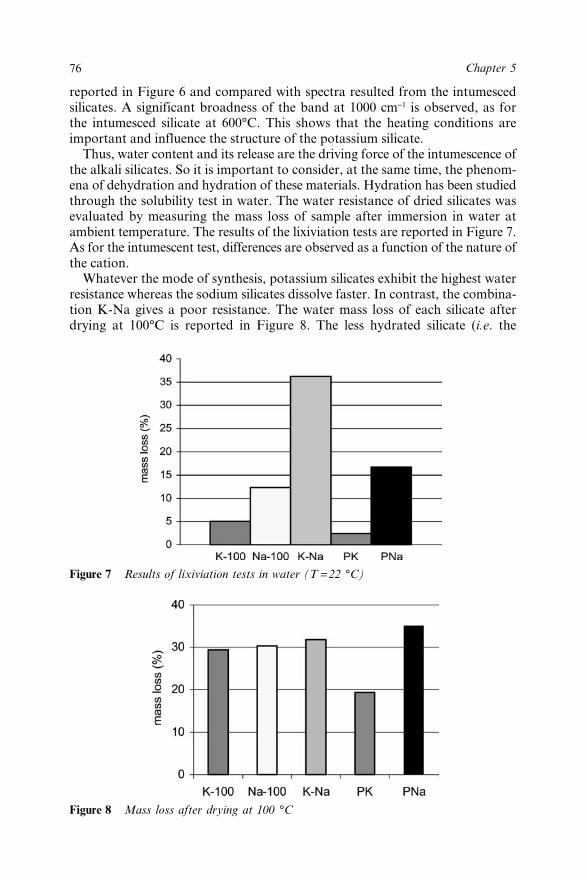
76 Chapter 5
reported in Figure 6 and compared with spectra resulted from the intumescedsilicates. A significant broadness of the band at 1000 cm−1 is observed, as forthe intumesced silicate at 600°C. This shows that the heating conditions areimportant and influence the structure of the potassium silicate.
Thus, water content and its release are the driving force of the intumescence ofthe alkali silicates. So it is important to consider, at the same time, the phenom-ena of dehydration and hydration of these materials. Hydration has been studiedthrough the solubility test in water. The water resistance of dried silicates wasevaluated by measuring the mass loss of sample after immersion in water atambient temperature. The results of the lixiviation tests are reported in Figure 7.As for the intumescent test, differences are observed as a function of the nature ofthe cation.
Whatever the mode of synthesis, potassium silicates exhibit the highest waterresistance whereas the sodium silicates dissolve faster. In contrast, the combina-tion K-Na gives a poor resistance. The water mass loss of each silicate afterdrying at 100°C is reported in Figure 8. The less hydrated silicate (i.e. the
Figure 8 Mass loss after drying at 100 °C
Figure 7 Results of lixiviation tests in water (T = 22 °C)

77Intumescent Silicates: Synthesis, Characterization and Fire Protective Effect
potassium silicate PK), appears as the more water resistant. The intumescencerelated to the amount of water could also be associated to the solubility in water.
After the study of silicates properties, we tested each of them as fire retardantadditive in a polymer matrix. The influence of the various silicate precursors onthermal barrier was investigated with blending of silicate powder in ethyl vinylacetate polymer at concentration of 10%. Compression moulded plates weresubmitted to an irradiance regulated at 350°C. The temperature of the unex-posed side sample was followed during exposure and is reported in Figure 9.The samples swelled immediately after the exposure. As can be seen in Figure 9,the mode of synthesis has a significant influence on fire retardant performance.The mixes PK and PNa give poor fire protective effects whereas a good thermalshield is obtained using K-100, the mix of Kasil#6 and fumed silica.
Comparison of Figures 2 and 9 evidences that the protective effect of K-100can not be related directly to the intumescence properties, but involves eitherchemical reactions between the silicate and EVA matrix or the physical andstructural properties of the silicate foam. Thus further analyses are needed tounderstand the thermal behaviour of the two antagonist samples K-100 andNa-100.
5.5 ConclusionOur goal was to study the influence of various alkali silicates as potential fireretardant additives in polymer matrix. First, we studied the influence of synthe-sis and composition (nature of the alkali) on intumescence, and the solubilityin water of the silicates materials with formulations corresponding to a molarratio SiO2/M2O equal to 3.9. Two modes of synthesis were compared: silicatesprepared from commercial alkali silicates in which fumed silica was added, andsilicates obtained by depolymerization of silica in concentrated alkalinesolution.
Whatever the mode of synthesis, the sodium-based silicates exhibit the highestswelling properties. Intumescence occurred in the temperature range 200 to
Figure 9 Measurement of the silicates fire protective effect in an EVA matrix

78 Chapter 5
400°C, with a maximum expansion observed at the end of the test at 400°C forall silicates. The best results are obtained with Na-100: the mix of the commer-cial sodium trisilicate solution and fumed silica. In contrast, the equivalentpotassium silicate K-100, obtained using the mix of Kasil#6 and silica, showsthe lowest intumescent behaviour whatever the temperature test.
Intumescence of the sodium-based silicates is related to the amount of water,and is associated with the release of bound water resulting from the condensationof silanol groups contained in an amorphous phase.
For the potassium-based silicates, however, in particular K-100, the releaseof more strongly bounded water above 400°C would be associated with the con-densation of silanol units contained in a crystalline phase. Also, the heatingconditions influence the structural arrangement in this silicate.
The sodium-based silicates dissolve faster than the potassium-based in water.Thus, intumescence could be related to the water content and a high solubility inwater.
Fire behaviour was evaluated with blending of silicate powder and the EVApolymer matrix. A good thermal shield was obtained using K-100. The protec-tive effect of K-100 can not be explained on the basis of intumescent propertiesbut involves either chemical reactions between the potassium silicate and EVAor either the physical properties of the mineral foam.
5.6 References1. W. Becker, Fire Mater., 1991, 15, 169–173.2. Slimack, US Patent, 6,303,234, 2001.3. E. Metcalfe, Z. Feng and D. Kendrick, Recent Adv. Flame Retard. Polym.
Mater., 1997, 8, 129–135.4. T.M. Liu, W.E. Baker, K.B. Langille, D.T. Nguyen and J.O. Bernt,
J. Vinyl Addit. Technol., 1998, 4, 246–258.5. H. Horacek, and S. Pieh, Polym. Int., 2000, 49, 1106–1114.6. E.M. Bulewicz, A. Pelc, R. Kozlowski and A. Miciukiewicz, Fire Mater.,
1985, 9, 171–175.7. K.B. Langille, D.T. Nguyen, J.O. Bernt, D.E. Veinot and M.K. Murthy,
J. Mater. Sci., 1991, 26, 695–710.8. G. Yakovlev and V. Kodolov, Int. J. Polym. Mater., 2000, 47, 107–115.9. J.L. Bass, G.L. Turner and M.D. Morris, Macromol. Symp., 1999, 140,
263–270.

Use of Nanocomposite Materials

81
CHAPTER 6
Flammability ofNanocomposites: Effects of theShape of NanoparticlesTAKASHI KASHIWAGI
Fire Research Division, National Institute of Standards and Technology,Gaithersburg, MD 20899-8665, USA ([email protected])
6.1 IntroductionThere is a high level of interest in using nanoscale reinforcing fillers for makingpolymeric nanocomposite materials with exceptional properties.1–3 Nanocom-posites are particle-filled polymers where at least one dimension of the dispersedparticle is on the nanometer scale. When all three dimensions are of the order ofnanometers, we are dealing with true nanoparticles, such as spherical silica,having an aspect ratio of 1. Another type of nanocomposite is characterized byparticles having only one dimension on the nanometer scale. In this case, thefiller is present as sheets/layers, such as layered silicate or graphite, whichare one to a few nanometers thick and hundreds to thousands of nanometers inthe other two dimensions. At present, the most common approach to improvingflammability is the use of layered silicates having large aspect ratios. Whentwo dimensions are on the nanometer scale and the third is larger, forming anelongated structure, we speak of nanotubes, whiskers, or rods with a high aspectratio.
Flammability properties of polymers have been improved with nanoscaleadditives and these filled systems provide an alternative to conventional flameretardants. It is important to explore how the asymmetry (aspect ratio) andother geometrical effects of nanoparticle additives influence the flammabilityproperties of polymer nanocomposites. This chapter describes flammabilityproperties of nanocomposites based on the three different shapes of nanoscaleadditives, such as nanosilica, clay, and carbon nanotube. Dispersion of thenanoscale particles, sample behavior during gasification, and the shape and thestructure of the sample residues after a gasification test are described, as are

82 Chapter 6
the flammability characteristics of each nanocomposite based on the differentshapes of nanoscale particles.
6.2 Flammability MeasurementEvaluation of flammability properties was achieved using the Cone calorimeter,which was designed and built at NIST (ASTM E 1354-92). Aluminum foil waswrapped around the sample, except on the irradiated surface, to form a samplecontainer instead of using the standard, heavy metal container. Tests wereperformed either at an incident radiant flux of 40 or at 50 kW m−2 in air. Heatrelease rate and mass loss rate are reproducible to within ±10%. Another device,a radiative gasification instrument similar to the Cone calorimeter, was used toobserve the gasification behavior and to measure mass loss rate of the samplein a nitrogen atmosphere (no burning) at 40 or at 50 kW m−2. A more detaileddiscussion of the device is given in our previous study.4 The unique advantagesof this device are twofold: first, the results obtained are based only on the con-densed phase processes due to the absence of any gas phase oxidation reactions;second, it enables visual observation of gasification phenomena under a heatflux similar to that of a fire without interference from a flame.
6.3 Polymer-Nanosilica NanocompositesDetailed preparation of the poly(methyl methacrylate) (PMMA)/nanosilicananocomposites is described in reference 5. The average diameter of the nano-silica particles used in this study was ca. 12 nm. The sample was made by in situpolymerization of methyl methacrylate in the presence of nanosilica particles.The disk shaped sample were ca. 8 cm diameter and 0.6 cm thick. The numberaveraged molecular weight of this PMMA, measured by size-exclusion chroma-tography, was 147000 ± 1000a and that of the PMMA in the nanosilica compositewas 183000 ± 8000. The polydispersities of both samples were 1.9 ± 0.1. Theactual content of silica particles in the PMMA/nanosilica nanocomposite wasdetermined by pyrolysing the sample in air at 900°C in a muffle furnace. Byweighing the white powdery residue, a value of 13 ± 1% by mass was found ratherthan the originally intended value of 10%.
The two polymerized samples, the PMMA/nanosilica nanocomposite andthe pristine PMMA (polymerized by the same procedure as for the nanocom-posite), were transparent (Figure 1). Although the transparency of the sampleswith nanosilica particles suggests reasonably good dispersion of the particlesin the PMMA, TEM and AFM images were taken to examine dispersion atthe silica scale. TEM analysis of the PMMA/nanosilica nanocomposite at lowmagnification shows well dispersed areas and also areas of greater silica particle
aAccording to ISO 31-8, the term “molecular weight” has been replaced with “relative molecularmass,” symbol Mr. The conventional notation, rather than the ISO notation, has been employedhere.
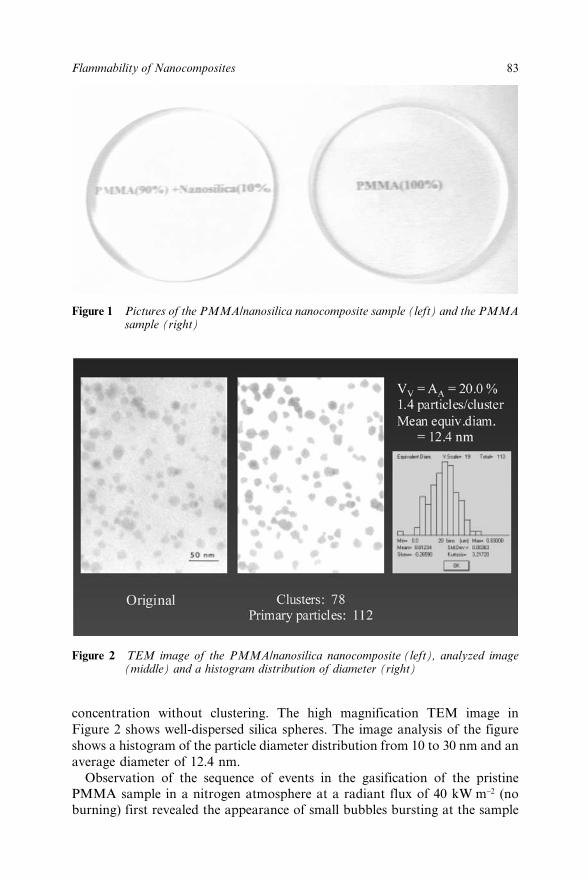
83Flammability of Nanocomposites
concentration without clustering. The high magnification TEM image inFigure 2 shows well-dispersed silica spheres. The image analysis of the figureshows a histogram of the particle diameter distribution from 10 to 30 nm and anaverage diameter of 12.4 nm.
Observation of the sequence of events in the gasification of the pristinePMMA sample in a nitrogen atmosphere at a radiant flux of 40 kW m−2 (noburning) first revealed the appearance of small bubbles bursting at the sample
Figure 1 Pictures of the PMMA/nanosilica nanocomposite sample (left) and the PMMAsample (right)
Figure 2 TEM image of the PMMA/nanosilica nanocomposite (left), analyzed image(middle) and a histogram distribution of diameter (right)

84 Chapter 6
surface around 15 s after the start of irradiation, followed by a rapid increase inthe number of bubbles bursting so that they covered the entire sample surfaceafter about 30 s. Around 120 s, the sample surface acquired the appearance of afluid with larger bursting bubbles and with slight swelling, as shown in Figure 3.More vigorous bubbling appeared for times greater than 120 s and the samplebecame less viscous (more fluid in appearance). After 240 s, the surface wascovered by large bursting bubbles and vigorous bubbling with a very fluidsample continued. At the end of the test, no significant amount of residue wasleft except a thin, black coating on the container surface.
The gasification behavior of the PMMA/nanosilica nanocomposite wasquite different from that of the above PMMA sample. Many small, bubbles wereobserved initially, but at about 60 s many white islands appeared on the samplesurface with vigorous bursting of small bubbles around the islands. Around120 s, the islands became darker and irregular (Figure 3, top right). The islandsappeared to be made of coarse, granular particle clumps. The fractional cover-age of the sample surface by the islands continued to increase and a randommotion of the granular particle clumps on the sample surface was oftenobserved. At about 300 s, the sample surface was completely covered by coarse,granular particle clumps (Figure 3, bottom right). Also, the sample surface was
Figure 3 Selected sequence of video images of gasification phenomena of PMMAand PMMA/nanosilica samples in N2 at 40 kW m−2 (Left column: PMMA,and right column: PMMA/nanosilica, time at 120 s, 240 s, and 300 s from top.The container of the PMMA sample was held by four small wires to avoid itsmovement)

85Flammability of Nanocomposites
slowly receding. At the end of the test, a dark, coarse powdery layer was left inthe sample container (Figure 4). The highly fluid behavior observed for thePMMA sample was not seen for this sample. The mass of the residue was almostthe same as that of the initial weight of nanosilica and the thickness of theresidual layer at the end of the test was roughly half of the initial samplethickness.
The calculated mass loss rates from the measured sample masses of pristinePMMA and PMMA/nanosilica samples are plotted in Figure 5. The peak massloss rate of the PMMA/nanosilica nanocomposite is roughly 40% less than thatof pristine PMMA. However, the mass loss rate up to 50 s and the total samplemass loss (integrated values of the mass loss curve) are about the same forboth samples. These trends are very similar to those of a low molecular weightPMMA/silica gel sample.6
The heat release rates of pristine PMMA and the PMMA/nanosilica nano-composite are shown in Figure 6. The addition of the nanosilica reduced thepeak heat release rate of the PMMA sample to roughly 50% of the pristinePMMA value, but the ignition delay time and the total heat release (integratedvalues of the heat release rate curve) are about the same for both samples. Thetrends of the measured mass loss rate (burning rate) curves (not shown) are veryclose to those of the heat release rate curves and thus the calculated specific heatof combustion (measured heat release rate divided by measured mass loss rate)is 24 ± 2 MJ kg−1 for both types of sample. Furthermore, the trends of the heatrelease rate curves are very similar to those of the mass loss rate in nitrogen, as
Figure 4 Picture of the residue of the PMMA/nanosilica nanocomposite consisting ofgranular, coarse particles after the gasification test in nitrogen at 40 kW m−2

86 Chapter 6
shown in Figure 5. The PMMA/nanosilica nanocomposite residue after the conecalorimeter tests was a gray layer consisting of coarse, granular powder accu-mulated at the bottom of the sample container, which is very similar to thatshown in Figure 4.
6.4 Polymer-Clay NanocompositesPolyamide 6, PA6, was selected as a resin for this study and commerciallyavailable PA6/clay samples were used. They were PA6 homopolymer (molecu-lar mass (Mw) of about 15000 g mol−1, UBE 1015Bb), PA6 (Mw ≈ 15,000) withmontmorillonite (MMT) of 2% by mass (UBE 1015C2), and PA6 (Mw ≈ 18,000)with MMT of 5% by mass (UBE 1018C5). They were selected due to their exfo-liated clay dispersion in PA6. Sample disks (75 mm diameter and 8 mm thick)were injection molded. TEM images of the original sample show that the clay
bCertain commercial equipment, instruments, materials, services or companies are identified inthis article to specify adequately the experimental procedure. This in no way implies endorse-ment or recommendation by the National Institutes of Standards and Technology (NIST).
Figure 5 Effects of nanosilica addition on mass loss rate of PMMA at 40 kW m−2 innitrogen

87Flammability of Nanocomposites
platelets were fully exfoliated (Figure 7). Note at the position labeled “A” in thefigure, two platelets spaced approximately 1.5 nm apart can be seen clearly.However, such close platelets were rare. Wide-angle XRD measurements wereconducted to obtain the clay particle structure in the sample. A comparison ofthe XRD data between clay and PA6/clay(5%) sample is shown in Figure 8.XRD data of the original Na-clay shows many peaks with a d-spacing of about1.19 nm (at 2h of about 7.44°). However, the PA6/clay(5%) sample shows asharp peak at 2h of about 21.4°, corresponding to the c crystalline phase of PA6,without any peak corresponding to the clay. The results indicate that clay plate-lets were fully exfoliated, in agreement with the TEM images. More detaileddiscussion of the dispersion of clay platelates in PA6 and further XRD data ofcollected residues are given in our previous publication.7
Observation of the sequence of events in the non-flaming gasification of thePA6 sample without clay first revealed small bubbles of evolved degradationproducts at the sample surface, followed by the appearance of many large bubbles.About 60 s after the start of irradiation, the bubbles became gradually smallerand around 120 s many small bubbles, with few larger bubbles, appeared
Figure 6 Effects of nanosilica addition on heat release rate of PMMA at 40 kW m−2
(Dashed lines were the results of three replica of nanocomposites made at threedifferent times)

88 Chapter 6
Figure 7 TEM image of the PA6/clay(5%) sample
Figure 8 XRD of Na+ clay and PA6/clay(5%)
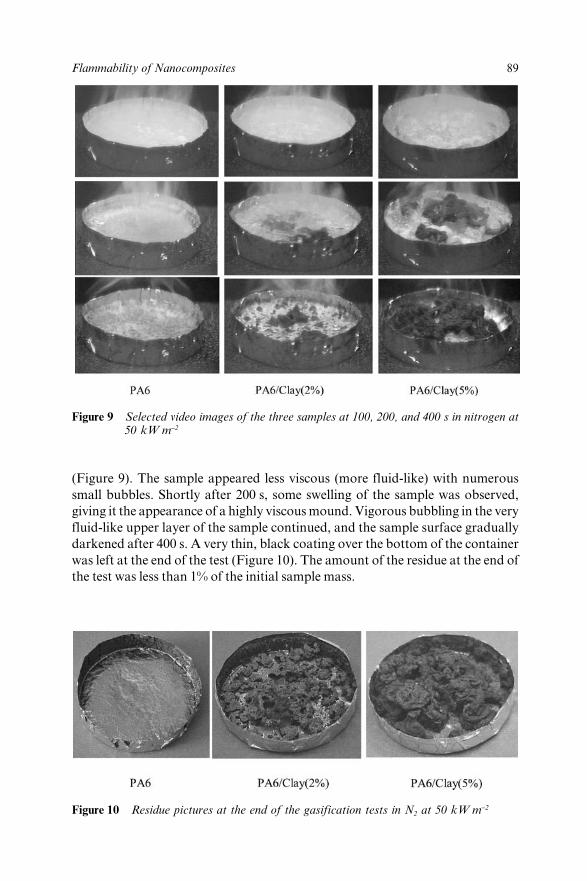
89Flammability of Nanocomposites
(Figure 9). The sample appeared less viscous (more fluid-like) with numeroussmall bubbles. Shortly after 200 s, some swelling of the sample was observed,giving it the appearance of a highly viscous mound. Vigorous bubbling in the veryfluid-like upper layer of the sample continued, and the sample surface graduallydarkened after 400 s. A very thin, black coating over the bottom of the containerwas left at the end of the test (Figure 10). The amount of the residue at the end ofthe test was less than 1% of the initial sample mass.
Figure 9 Selected video images of the three samples at 100, 200, and 400 s in nitrogen at50 kW m−2
Figure 10 Residue pictures at the end of the gasification tests in N2 at 50 kW m−2
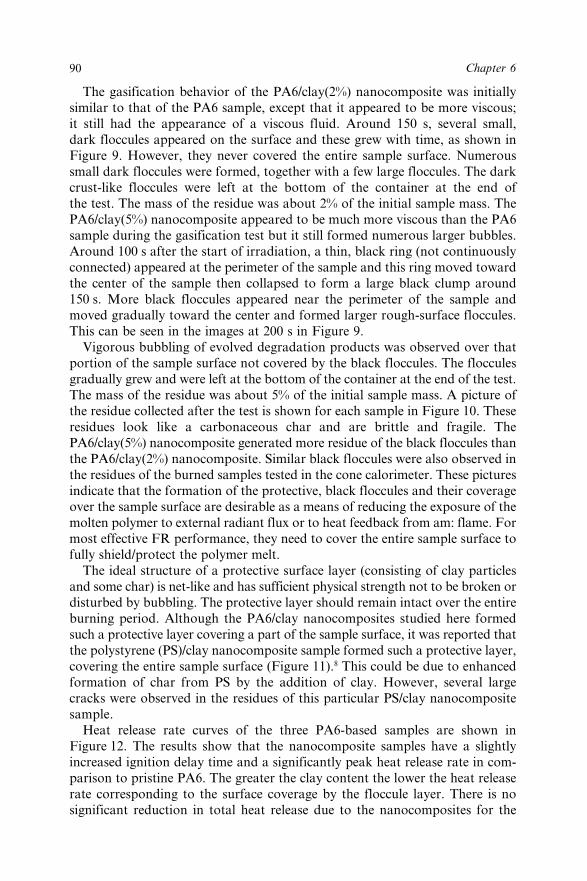
90 Chapter 6
The gasification behavior of the PA6/clay(2%) nanocomposite was initiallysimilar to that of the PA6 sample, except that it appeared to be more viscous;it still had the appearance of a viscous fluid. Around 150 s, several small,dark floccules appeared on the surface and these grew with time, as shown inFigure 9. However, they never covered the entire sample surface. Numeroussmall dark floccules were formed, together with a few large floccules. The darkcrust-like floccules were left at the bottom of the container at the end ofthe test. The mass of the residue was about 2% of the initial sample mass. ThePA6/clay(5%) nanocomposite appeared to be much more viscous than the PA6sample during the gasification test but it still formed numerous larger bubbles.Around 100 s after the start of irradiation, a thin, black ring (not continuouslyconnected) appeared at the perimeter of the sample and this ring moved towardthe center of the sample then collapsed to form a large black clump around150 s. More black floccules appeared near the perimeter of the sample andmoved gradually toward the center and formed larger rough-surface floccules.This can be seen in the images at 200 s in Figure 9.
Vigorous bubbling of evolved degradation products was observed over thatportion of the sample surface not covered by the black floccules. The flocculesgradually grew and were left at the bottom of the container at the end of the test.The mass of the residue was about 5% of the initial sample mass. A picture ofthe residue collected after the test is shown for each sample in Figure 10. Theseresidues look like a carbonaceous char and are brittle and fragile. ThePA6/clay(5%) nanocomposite generated more residue of the black floccules thanthe PA6/clay(2%) nanocomposite. Similar black floccules were also observed inthe residues of the burned samples tested in the cone calorimeter. These picturesindicate that the formation of the protective, black floccules and their coverageover the sample surface are desirable as a means of reducing the exposure of themolten polymer to external radiant flux or to heat feedback from am: flame. Formost effective FR performance, they need to cover the entire sample surface tofully shield/protect the polymer melt.
The ideal structure of a protective surface layer (consisting of clay particlesand some char) is net-like and has sufficient physical strength not to be broken ordisturbed by bubbling. The protective layer should remain intact over the entireburning period. Although the PA6/clay nanocomposites studied here formedsuch a protective layer covering a part of the sample surface, it was reported thatthe polystyrene (PS)/clay nanocomposite sample formed such a protective layer,covering the entire sample surface (Figure 11).8 This could be due to enhancedformation of char from PS by the addition of clay. However, several largecracks were observed in the residues of this particular PS/clay nanocompositesample.
Heat release rate curves of the three PA6-based samples are shown inFigure 12. The results show that the nanocomposite samples have a slightlyincreased ignition delay time and a significantly peak heat release rate in com-parison to pristine PA6. The greater the clay content the lower the heat releaserate corresponding to the surface coverage by the floccule layer. There is nosignificant reduction in total heat release due to the nanocomposites for the
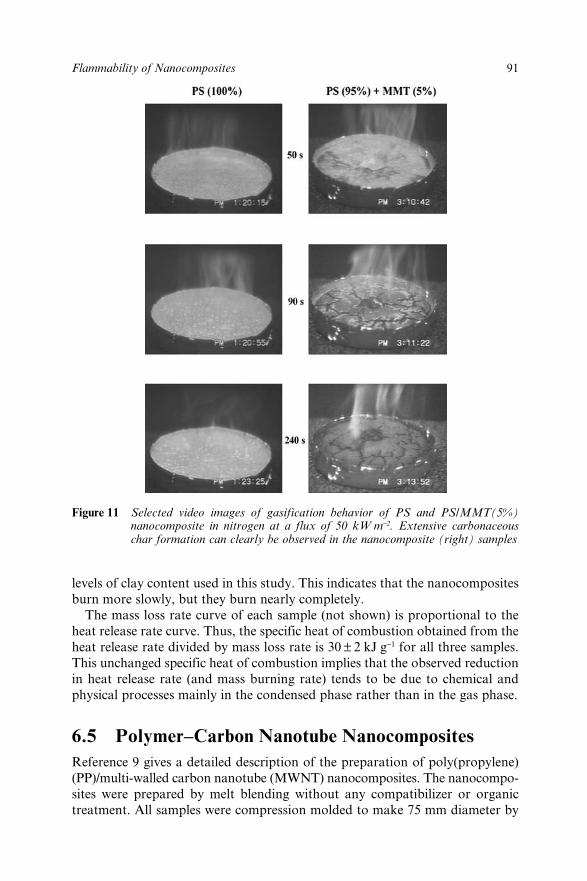
91Flammability of Nanocomposites
levels of clay content used in this study. This indicates that the nanocompositesburn more slowly, but they burn nearly completely.
The mass loss rate curve of each sample (not shown) is proportional to theheat release rate curve. Thus, the specific heat of combustion obtained from theheat release rate divided by mass loss rate is 30 ± 2 kJ g−1 for all three samples.This unchanged specific heat of combustion implies that the observed reductionin heat release rate (and mass burning rate) tends to be due to chemical andphysical processes mainly in the condensed phase rather than in the gas phase.
6.5 Polymer–Carbon Nanotube NanocompositesReference 9 gives a detailed description of the preparation of poly(propylene)(PP)/multi-walled carbon nanotube (MWNT) nanocomposites. The nanocompo-sites were prepared by melt blending without any compatibilizer or organictreatment. All samples were compression molded to make 75 mm diameter by
Figure 11 Selected video images of gasification behavior of PS and PS/MMT(5%)nanocomposite in nitrogen at a flux of 50 kW m−2. Extensive carbonaceouschar formation can clearly be observed in the nanocomposite (right) samples
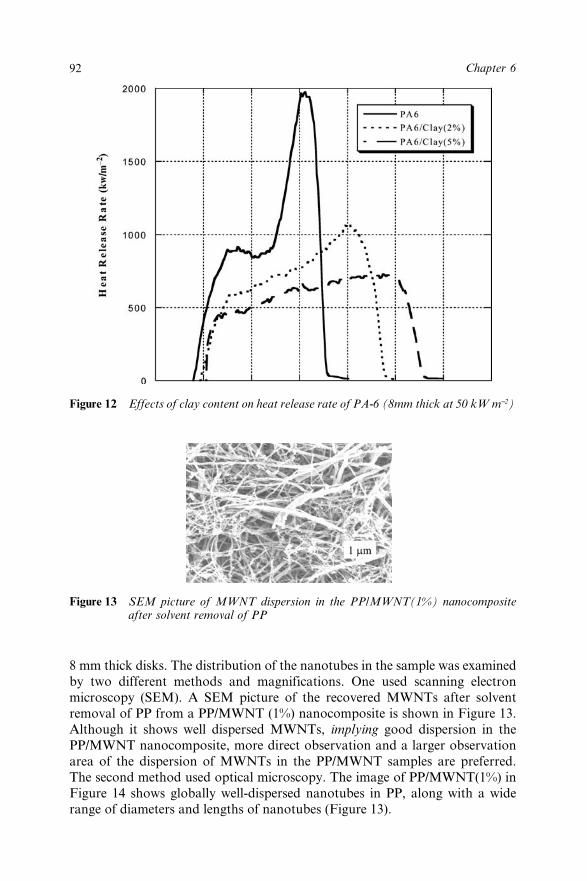
92 Chapter 6
8 mm thick disks. The distribution of the nanotubes in the sample was examinedby two different methods and magnifications. One used scanning electronmicroscopy (SEM). A SEM picture of the recovered MWNTs after solventremoval of PP from a PP/MWNT (1%) nanocomposite is shown in Figure 13.Although it shows well dispersed MWNTs, implying good dispersion in thePP/MWNT nanocomposite, more direct observation and a larger observationarea of the dispersion of MWNTs in the PP/MWNT samples are preferred.The second method used optical microscopy. The image of PP/MWNT(1%) inFigure 14 shows globally well-dispersed nanotubes in PP, along with a widerange of diameters and lengths of nanotubes (Figure 13).
Figure 12 Effects of clay content on heat release rate of PA-6 (8mm thick at 50 kW m−2)
Figure 13 SEM picture of MWNT dispersion in the PP/MWNT(1%) nanocompositeafter solvent removal of PP

93Flammability of Nanocomposites
The physical behavior of the PP/MWNT nanocomposites was significantlydifferent from that of pristine PP during the gasification test. As shown inFigure 15(a), the pristine PP sample behaved like a liquid with a fine froth layergenerated by the bursting of numerous small bubbles at the sample surface. Nochar was left at the end of the test. However, all PP/MWNT samples tested inthis study behaved like a solid without any visible melting, except at the verybeginning of the test, and the shape of the sample did not significantly change
Figure 14 Optical microscopy image of MWNT/PP(1%) nanocomposite in the melt
Figure 15 Sample behavior in the gasification test of (a) PP, and (b) PP/MWNT(1%) at50 kW m−2 in nitrogen

94 Chapter 6
during the test. A picture of the residue of the PP/MWNT(1%) nanocomposite isshown in Figure 16. The shape of the residue was nearly the same as the originalsample except for slight shrinkage. No cracks were observed in any residue ofthe PP/MWNT nanocomposites studied here. The networked floccule residuesof the PP/MWNT samples covered the entire sample surface and extended tothe bottom of the residue (Figure 17). The floccule residue was porous, buthad physical integrity and did not break when lightly picked at by one’s fingers.The mass of the floccule residue was very close to the initial mass of carbonnanotubes in the original nanocomposite. This indicates that the networkedfloccule did not enhance char formation from PP.
Figure 18 compares the heat release rate curves among the three samples.The results show that the heat release rates of the PP/MWNT nanocomposites
Figure 16 Residue of PP/MWNT(1%) after the gasification test in nitrogen at 50kW m−2
Figure 17 Cross section of the residue of the PP/MWNT (1%) nanocomposite shown inFigure 15(b)

95Flammability of Nanocomposites
are much lower than that of pristine PP even though the amount of MWNT inPP is quite small. The total heat release, the integral of the heat release ratecurve over the duration of the experiment, is about the same for the threesamples. The curves of the mass loss rate per unit surface area for the threesamples are very similar to those of the heat release rate. Since the specific heatof combustion value is calculated by dividing measured heat release rate withmeasured mass loss rate, this indicates that the specific heat of combustion isabout the same for the three samples. The calculated specific heat of combustionof each sample is 43 ± 1 MJ kg−1. The above results indicate that the PP/MWNTnanocomposites burn much slower than PP, but they all burn nearly completely.
These observations are similar to those made with clay-nanocompositesand with composites made by the addition of nanoscale silica in PMMA, asdescribed above. This indicates that the observed FR performance of thePP/MWNT nanocomposite is mainly due to chemical and/or physical processesin the condensed phase instead of in the gas phase.
6.6 DiscussionHeat release rate curves of the three different types of nanocomposites show thata large reduction in heat release rate is achieved in the following decreasing
Figure 18 Comparison of heat release rate curves among PP and PP/MWNTnanocomposites at 50 kW m−2

96 Chapter 6
order: polymer–MWNT nanocomposites, polymer–clay nanocomposite, andpolymer–nanosilica nanocomposites. The residues of these nanocompositesshow (1) a low density network-like protective layer covering the entire samplesurface without any cracks for the PP/MWNT nanocomposite, (2) floccularislands consisting of clay and char for the PA6/clay nanocomposites, and (3)the formation of coarse, granular particulate clumps for the PMMA/nanosilicananocomposites. This suggests that the formation of a continuous network-likeprotective layer that covers the entire sample surface is critical to significantlyreduce the heat release rate with only a small mass of these nanoscale particles.Some polymer–clay nanocomposites can form such a layer with the PS/MMTnanocomposites8 and the PP/polypropylene-grafted maleic anhydrate (PP-g-MA)/MMT nanocomposites.10 However, their residues were slightly brittleand were cracked. Therefore, it appears that a higher clay content (5–10%) inpolymers is needed to obtain a similar amount of reduction in heat release rateas that of the PP/MWNT (1%) nanocomposite.
The formation of a continuous, low-density network-structured protectivelayer is easiest with high aspect ratio nanoscale particles. The aspect ratio ofthe nanosilica in PMMA is about 1, and coarse, granular particulate clumps,probably coagulated silica particles, were formed instead of a network structure.The effects of aspect ratio for plate-like clay particles on the heat release rateof polymer/clay nanocomposites were determined using three different clays;synthetic mica (aspect ratio of roughly one thousand), MMT (about 100), andsynthetic hectolite (few hundreds). The PP/PP-g-MA/clay nanocomposites(all had 7.7% clay by mass) were prepared by melt mixing and the mass lossrate of each sample was measured in nitrogen in the gasification test at50 kW m−2. The sample was a 10 × 10 × 0.3 cm thick plate. The results areshown in Figure 19.
The lowest mass loss rate was observed for the sample with synthetic mica,which generated a significantly lower mass loss rate than those with MMT andsynthetic hectolite. There was little difference in mass loss rate between thesample with MMT and with synthetic hectolite. Figure 20 shows pictures ofthe residues of the four samples after the tests. The surface of the residue of thesample with synthetic mica is relatively smooth without any large cracks.However, the two samples with the other two clays show large cracks (in par-ticular, with synthetic hectolite). Melting and vigorous bubbling were observedin the large cracks during the test. Similar behavior was observed at the exposedsample surface of PA6/clay (Figure 9). The different types of clay in thePP/PP-g-MA/clay nanocomposites formed a slightly different structure of theprotective layer during the test. This appears to be caused by the difference inaspect ratio among the three clays. Nanoscale particles with higher aspect ratiotend to form a network-like structure of a protective layer, covering the entiresurface without any significant cracks.
Dispersion of the clay particles in a polymer/clay nanocomposite has signifi-cant effects on the reduction in heat release rate. If the clay particles are notwell dispersed in the nanocomposite, no significant reduction in heat releaserate has been reported for the PS/MMT sample.8 A similar trend was recently

97Flammability of Nanocomposites
observed with polymer/MWNT nanocomposites. Therefore, nanoscale particlesin a polymer nanocomposite should be well dispersed to obtain the maximumperformance in reducing heat release rate.
Nanocomposites generally reduce heat release rate, in particular the peakheat release rate. However, they tend to have slightly shorter ignition delaytimes (or no significant increase in ignition delay) and about the same total heatrelease as those of pristine polymers. As described here, nanocomposites tendto burn slowly and nearly completely. Although the use of a small quantity ofnanoscale particles in polymers to form nanocomposites could be one of thealternatives to conventional flame retardants, nanocomposites need furtherimprovements to increase ignition delay time and reduce total heat release.
6.7 ConclusionNanocomposites based on three different shapes of nanoscale particles, sphere(silica), plate (clay), and tube (carbon nanotube) were prepared and the disper-sion of the particles in the nanocomposites was confirmed by various techniques(TEM, SEM, optical microscopy, and XRD). Their flammability properties
Figure 19 Effects of clay type on mass loss rate of PP(92.3%)/PPgMA(7.7%) andPP(84.6%)/PPgMA(7.7%)/clay(7.7%) samples in nitrogen at 50 kW m−2

98 Chapter 6
were measured by using a cone calorimeter and a radiative gasification appara-tus in nitrogen. Residues of these nanocomposites after the gasification testwere collected and their shape and structure examined. The results show thatthe reduction in heat release rate is achieved in the order: carbon nanotubes,clay platelets, and silica spheres, providing these particles are well dispersedin the sample. It appears that the particles having higher aspect ratio tend toform an effective protective layer consisting of network-structured floccule thatcovers the entire sample surface without forming any cracks during burning.The formation of such a layer is critical to obtain low heat release rate fromnanocomposites.
6.8 AcknowledgementThis chapter is based on results obtained from many different projects, asdescribed in references 6–8, with the collaboration of many people. The authorthanks Richard Harris, John Shields, Alexander Morgan (currently at Dow
Figure 20 Effects of clay type on the surface pattern of the residues of PP(92.7%)/PPgMA(7.7%) and PP(84.7%)/PPgMA(7.7%)/clay(7.7%) samples (aftergasification test in nitrogen at 50 kW m−2).
99Flammability of Nanocomposites
Chemical Co.), Kathryn Butler, and Jeffrey Gilman at the Fire Research Divisionfor their collaboration, Xin Zhang and Robert Briber at the Department ofMaterials Science and Engineering of University of Maryland for collaborationwith the PA6/clay work, Jenny Hilding and Eric Grulke at the Department ofChemical and Materials Engineering of University of Kentucky for their col-laboration with the PP/MWNT work, Joseph Antonucci, Semen Kharchenkoand Jack Douglas of the Polymers Division of NIST for the preparation ofPMMA/nanosilica nanocomposites and valuable discussions about the propertiesof polymer nanocomposites, and, finally, Koichi Iwasa at Sekisui ChemicalCo. for collaboration with PP/PP-g-MA/clay work.
6.9 References1. Y. Kojima, A. Usuki, M. Kawasumu, A. Okada, Y. Fukushima,
T. Kurauchi and O. Kamigaito, J. Mater. Res., 1993, 8, 1185–1189.2. E.P. Giannelis, Adv. Mater., 1996, 8, 29–35.3. Z. Wang and T.J. Pinnavaia, Chem. Mater., 1998, 10, 1820–1826.4. P.J. Austin, R.R. Buch and T. Kashiwagi, Fire Mater., 1998, 22, 221–237.5. T. Kashiwagi, A.B. Morgan, J.A. Antonucci, .M.R. VanLandingham,
R.H. Jr Harris, W.H. Awad and J.R. Shields, J. Appl. Polym. Sci., 2003,89, 2072–2078.
6. T. Kashiwagi, J.R. Shields, R.H. Jr Harris and R.D. Davis, J. Appl.Polym. Sci., 2003, 87, 1541–1553.
7. T. Kashiwagi, R.H. Jr Harris, X. Zhang, R.M. Briber, B.H. Cipriano, S.R.Raghaven, W.H. Awad and J.R. Shields, Polymer, 2004, 45, 881–891.
8. A.B. Morgan, R.H. Jr Harris, T. Kashiwagi, L.J. Chyall and J.W.Gilman, Fire Mater., 2002, 26, 247–253.
9. T. Kashiwagi, E. Grulke, J. Hilding, R.H. Jr Harris, W.H. Awad andJ. Douglas, Macromol. Rapid Commun., 2002, 23, 761–765.
10. A.B. Morgan, T. Kashiwagi, R.H. Harris, J.R. Campbell, K. Shibayama,K. Iwasa and J.W. Gilman, in Fire and Polymers, G.L. Nelson andC.A. Wilkie (eds.), ACS Sym. Series, 2001, Volume 797, pp. 9–23.

100
CHAPTER 7
Thermal Degradation andCombustibility of PolypropyleneFilled with MagnesiumHydroxide Micro-Filler andPolypropylene Nano-FilledAluminosilicate CompositeSERGEI M. LOMAKIN,1 GENNADY E. ZAIKOV1 ANDELENA V. KOVERZANOVA2
1Institute of Biochemical Physics of Russian Academy of Sciences, 4 KosyginStreet, Moscow, 119991, Russia ([email protected])2Institute of Chemical Physics of Russian Academy of Sciences, 4 KosyginStreet, Moscow, 119991, Russia
7.1 IntroductionMineral fillers, metals, and fibers have been added to thermoplastics andthermosets for decades to form composites. Compared to the neat resins, thesecomposites show improved properties including tensile strength, heat distortiontemperature, and modulus. Thus, for structural applications, composites havebecome very popular and are sold in billion pound quantities. These filledthermoplastics are sold in even larger volumes than neat thermoplastics.Furthermore, the volume of fillers sold is roughly equal to that of thermoplasticresin sold. Clearly, the idea of adding fillers to thermoplastics and thermosets toimprove properties, and in some cases decrease costs, has been very successfulfor many years. More recently, advances in synthetic techniques and the abilityto readily characterize materials on an atomic scale have lead to interestin nanometer-size materials. Since nanometer-size grains, fibers and plateshave dramatically increased surface area compared to their conventional

101Thermal Degradation and Combustibility of Polypropylene
micrometer-size materials, the chemistry of these nanosized materials is alteredcompared to conventional materials.1 Emerging nanotechnologies offer thepotential for revolutionary new polymer materials with enhanced physicalfeatures: reduced flammability, thermal expansion coefficients, increased stiff-ness and strength, barrier properties, and heat resistance, without loss of impactstrength.
Nanocomposites, which contain nanometer-scale particles that are homo-geneously dispersed throughout traditional polymers, can provide a stiffness andstrength approaching that of metals, but with significant reductions in weight.Reinforcing polymers at the molecular level with inorganic fillers can bringabout property improvements in polymeric materials.
The commercial importance of polypropylene (PP) has driven the investi-gation of PP composites reinforced by particulates, fibers, and layered inorganicfillers. Specifically, with respect to layered inorganic fillers, the aluminosilicateminerals talc and mica have been of greatest interest. However, recent advancesin polymer/clay and polymer/silicate nanocomposite materials have motivatedefforts to disperse fillers in PP based on montmorillonite, a naturally occurringmineral in the 2 : 1 aluminosilicate family. Because of the PP nonpolar (ali-phatic) nature, it has proved challenging to develop a clay-based filler that isdirectly miscible with neat (i.e. nonfunctionalized) PP.
General interest in the flammability reduction and thermal degradation ofPP arose in the second half of the 20th century. Halogen-based flame retardantsare the most commonly used due to their high efficiency, but this use is nowreversing due to the presumed high toxicity and corrosiveness of its breakdownproducts. Nowadays, the main interest in flame retardancy research is focusedin halogen-free flame retardants. Both magnesium hydroxide and nanocom-posite compositions with PP present a flame retardancy effect in addition to totalharmlessness. However, for PP composition with Mg(OH)2 the utilization of thiskind of filler involves important changes in the mechanical properties of thepolymer due to the high filling level required to obtain a good flame retardancy(weight concentrations up to 60% may be required). In general, dispersion in PPof fillers such as AI(OH)3 and Mg(OH)2 provokes a decrease in tensile yieldstrength and fracture toughness measured at high rate on the homopolymerbased compounds or measured at low strain rate on the block copolymer PPcompounds.
The ability of nanoclay incorporation to reduce the flammability ofpolymeric materials has been a major theme of publications.2,3 Gilman et al.demonstrated the extent to which flammability behaviour could be restrictedin polymers such as PP with only 2% nanoclay loading. In particular, heatrelease rates were found to decrease substantially with nanoclay incorporation.4
Although conventional microparticle filler incorporation, together with theuse of flame retardant and intumescent agents, would also minimise flamma-bility behavior, this is usually accompanied by reductions in various otherimportant properties. With the nanoclay approach, this is usually achievedwhilst maintaining or enhancing other properties and characteristics.
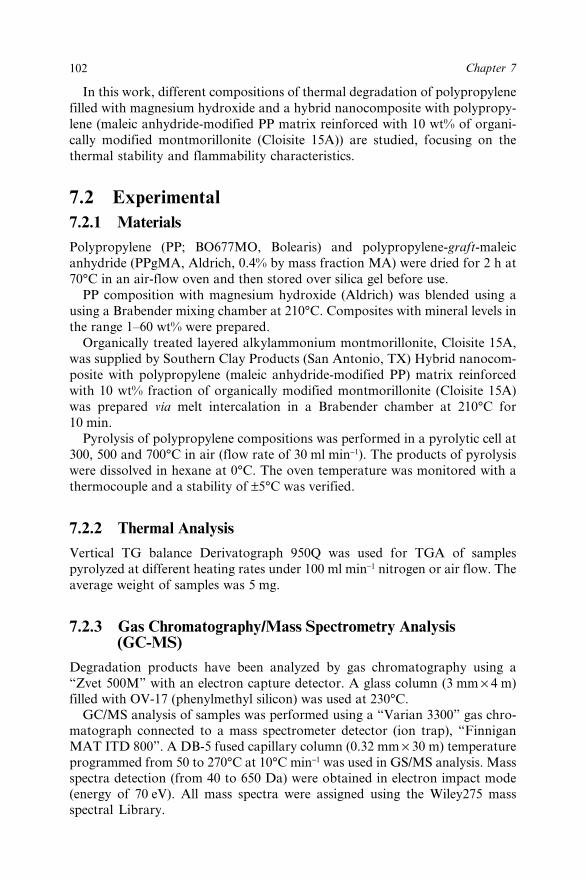
102 Chapter 7
In this work, different compositions of thermal degradation of polypropylenefilled with magnesium hydroxide and a hybrid nanocomposite with polypropy-lene (maleic anhydride-modified PP matrix reinforced with 10 wt% of organi-cally modified montmorillonite (Cloisite 15A)) are studied, focusing on thethermal stability and flammability characteristics.
7.2 Experimental7.2.1 Materials
Polypropylene (PP; BO677MO, Bolearis) and polypropylene-graft-maleicanhydride (PPgMA, Aldrich, 0.4% by mass fraction MA) were dried for 2 h at70°C in an air-flow oven and then stored over silica gel before use.
PP composition with magnesium hydroxide (Aldrich) was blended using ausing a Brabender mixing chamber at 210°C. Composites with mineral levels inthe range 1–60 wt% were prepared.
Organically treated layered alkylammonium montmorillonite, Cloisite 15A,was supplied by Southern Clay Products (San Antonio, TX) Hybrid nanocom-posite with polypropylene (maleic anhydride-modified PP) matrix reinforcedwith 10 wt% fraction of organically modified montmorillonite (Cloisite 15A)was prepared via melt intercalation in a Brabender chamber at 210°C for10 min.
Pyrolysis of polypropylene compositions was performed in a pyrolytic cell at300, 500 and 700°C in air (flow rate of 30 ml min−1). The products of pyrolysiswere dissolved in hexane at 0°C. The oven temperature was monitored with athermocouple and a stability of ±5°C was verified.
7.2.2 Thermal Analysis
Vertical TG balance Derivatograph 950Q was used for TGA of samplespyrolyzed at different heating rates under 100 ml min−1 nitrogen or air flow. Theaverage weight of samples was 5 mg.
7.2.3 Gas Chromatography/Mass Spectrometry Analysis(GC-MS)
Degradation products have been analyzed by gas chromatography using a“Zvet 500M” with an electron capture detector. A glass column (3 mm × 4 m)filled with OV-17 (phenylmethyl silicon) was used at 230°C.
GC/MS analysis of samples was performed using a “Varian 3300” gas chro-matograph connected to a mass spectrometer detector (ion trap), “FinniganMAT ITD 800”. A DB-5 fused capillary column (0.32 mm × 30 m) temperatureprogrammed from 50 to 270°C at 10°C min−1 was used in GS/MS analysis. Massspectra detection (from 40 to 650 Da) were obtained in electron impact mode(energy of 70 eV). All mass spectra were assigned using the Wiley275 massspectral Library.

103Thermal Degradation and Combustibility of Polypropylene
7.2.4 Clay and Composite Characterization
Microstructures of Cloisite 15A and PPgMA-Cloisite 15A nanocompositewere characterized using XRD on a Philips diffractometer using Cu Ka radia-tion (l = 0.1540562 nm). XRD patterns of Cloisite 15A and PPgMA-Cloisite15A nanocomposite, which reveal the intercalated structure of Cloisite 15A andexfoliated structure of PP nanocomposite, are shown in Figure 1. The interlayerspacing (d001) for the Cloisite 15A is 3.18 nm.
Generally, XRD data gives an initial picture of the clay distribution. In inter-calated nanocomposites the dimension and distribution of tactoids could be veryvariable and a complete characterization of the nanocomposite morphologycould be achieved using transmission electron microscopy. TEM images of PPnanocomposite samples (cooled at −70°C and then microtomed with a diamondknife at ca. −50°C) are obtained at 80 kV, with a ZEISS EM 900. An image of aPP nanocomposite (10 wt%) is presented (Figure 2). The micrograph shows thelayers of the clay (dark lines in the micrograph represent an aluminosilicatelayer): a part of them being well dispersed with the presence of tactoïds. Thisproves a partial exfoliation of the clay throughout the PP matrix.
7.3 Results and DiscussionAs mentioned in previous studies, the thermal degradation behavior of polymercompositions directly influences their combustibility. The first routine procedureto evaluate this behavior is a formal kinetic approach based on TGA data.Improved thermal stability of PP compositions of PPgMA-Cloisite 15A nanocom-posite and PP-Mg(OH2) (60%) was demonstrated by thermogravimetric analysis.
Figure 1 XRD of Cloisite 15A and PPgMA-nanocomposite

104 Chapter 7
The thermal stability at 50% weight loss was increased by 60°C (Figure 3).However, the extent of thermal stability is related to the chemical nature and thedegradation mechanism of the pristine polymer. TG traces of a PP conventionallyfilled with 60% of Mg(OH)2 and an exfoliated nanocomposite of PPgMA-Cloisite15A (10 wt% clay fraction) in air and under nitrogen are given in Figure 3.
Figure 2 TEM image of PPgMA-nanocomposite (10 wt% of Cloisite 15A)
Figure 3 TGA of poly(propylene) formulations (10 °C min−1, in air)

105Thermal Degradation and Combustibility of Polypropylene
At the initial stage of thermal degradation in air, the nanocomposite showedpoorer performance than the conventional PP and Mg(OH)2-filled PP, which maybe explained by the low thermal stability of the compatibilising agent (octadec-ylammonium ions). Therefore, the choice of the compatibilising agent is obvi-ously important. Generally, an increase in the maximum of the mass loss rate ofPPgMA-Cloisite 15A in comparison with PP can be described by a diffusionprocess that limits the evolution of the gaseous products.
Whereas thermal degradation process of PP and PPgMA-Cloisite 15A (10%),PP + 50% Mg(OH)2 proceeds in the stage the degradation of PP filled with 60%of Mg(OH)2 is a multistage process (Figure 4).
As mentioned above, an excess of organo-modifier (alkylammonium ions)destabilizes PP at the initial stage of thermal degradation. The initial tempera-ture of thermal degradation of PPgMA-Cloisite 15A is 228°C, whereas the purePP starts to decompose at 268°C (Figures 3 and 4).
The complexity of TGA data does not allow easy reliable mechanistic conclu-sions. Thus, GC-MS analysis became a very important procedure to evaluatethe thermal degradation mechanism of the studied formulations. Such analysishas shown that at 300 and 500°C the basic products of the thermal degradationare aliphatic saturated and unsaturated hydrocarbons, ketones and alcoholswith siding methyl side groups.
Identification of these products is quite complicated because of aliphatichydrocarbons and alcohols C2H5
+, the ions with odd and even mass number ofelectrons are formed under ionization: C2H5
+, C3H7+, C4H9
+, etc. Intensities ofpeaks of ions are the greatest in the field of mass numbers 43, 57, 71. Intrinsicmass spectra of methyl ketones have ions with mass 43, 57, 71 and 85, which
Figure 4 DTG of polypropylene compositions (10 °C min−1, in air)

106 Chapter 7
are formed by the breaking of the bond in a to the carbonyl group. GC-MSchromatograms of alcohol products of pyrolysis with m/z 45, 59, 73 and 87and ketones with m/z 58, 72 and 86, respectively, are presented in the Figures 5and 6.
Retention times and concentrations of the pyrolysis products for various PPsamples are given in Table 1. The most abundant product (retention time 4 min)
Figure 5 GC-MS chromatograms of typical pyrolysis products of PP (A) andPP-Mg(OH)2 (60%) (B) [alcohols (at 500 °C) with m/z = 43, 55, 56, 57, 69and 71]
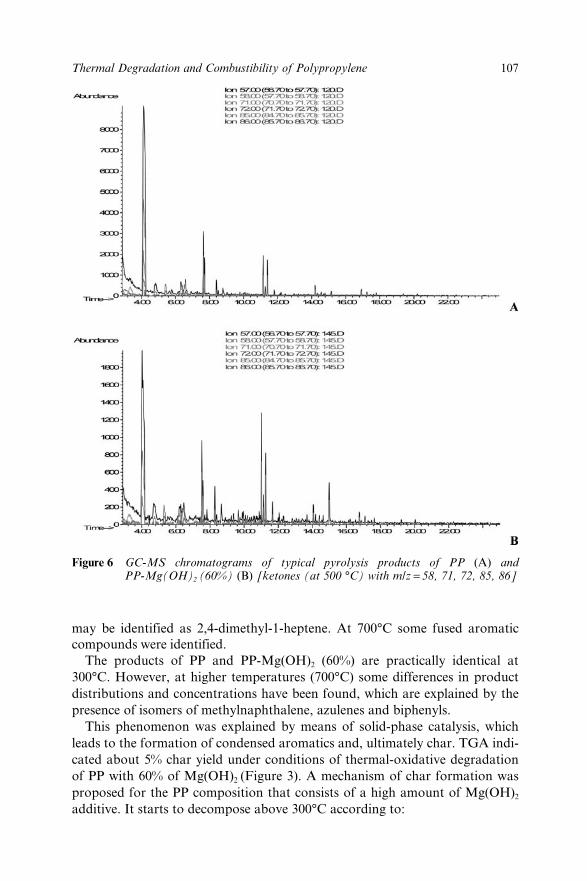
107Thermal Degradation and Combustibility of Polypropylene
may be identified as 2,4-dimethyl-1-heptene. At 700°C some fused aromaticcompounds were identified.
The products of PP and PP-Mg(OH)2 (60%) are practically identical at300°C. However, at higher temperatures (700°C) some differences in productdistributions and concentrations have been found, which are explained by thepresence of isomers of methylnaphthalene, azulenes and biphenyls.
This phenomenon was explained by means of solid-phase catalysis, whichleads to the formation of condensed aromatics and, ultimately char. TGA indi-cated about 5% char yield under conditions of thermal-oxidative degradationof PP with 60% of Mg(OH)2 (Figure 3). A mechanism of char formation wasproposed for the PP composition that consists of a high amount of Mg(OH)2
additive. It starts to decompose above 300°C according to:
Figure 6 GC-MS chromatograms of typical pyrolysis products of PP (A) andPP-Mg(OH)2 (60%) (B) [ketones (at 500 °C) with m/z = 58, 71, 72, 85, 86]

108 Chapter 7
Table 1 Thermal degradation products of polypropylene formulations vs. tem-perature. Glossary: tr: retention time, PP/Mg : PP/Mg(OH)2 (60%)
Concentrations (wt%)
300 500 700
Pyrolysis T (°C) Products tr (min) PP PP/Mg PP PP/Mg PP PP/Mg
Methylbenzene 3:16 – – – – 16.2 19.3
3:31 – 1.8 1.8 – – –
2,4-Dimethyl-1or3-heptene 4:01 7.0 4.6 33.2 18.2 7.9 –
Ethylbenzene 4:23 – – – – 6.9 9.94:26 – 1.0 0.6 1.4 – –
2,4-Dimethylnonane 4:41 1.6 2.2 1.7 2.3 – –
Dimethylbenzene 4:42 – – – – 5.3 7.64:59 1.1 1.4 1.6 1.3 – –
4-Methyl-2-heptanone 5:17 7.5 6.8 1.2 0.9 – –
Isomers of methyethyllbenzene 5:42 – – – – 1.4 2.06:01 – – – – 1.2 1.3
2,4,6-Trimethyl-2-nonane 6:05 5.6 3.8 – – – –6:12 – – 2.8 1.5 3.8 –
2,6-Dimethyl-4-heptanone 6:15 10.2 8.5 4.4 3.6 – –6:26 3.2 1.4 1.4 0.9 0.6 0.46:42 – – – – 0.6 –7:10 0.8 – 0.7 0.9 0.5 4.77:16 0.8 0.5 0.5 0.6 0.4 –
Isomers of dimethyloctanol 7:26 4.7 2.0 – 0.3 1.0 –7:30 5.1 3.5 9.8 7.4 2.8 –7:34 4.5 3.4 5.9 3.9 1.5 –7:40 – – 0.5 0.8 1.0 0.87:52 0.6 0.8 – 0.3 – 0.78:13 2.2 – 1.9 – 1.4 –
3-Methy-3,5-hexadiene 8:16 1.1 2.0 0.4 1.0 0.2 –8:22 0.2 1.2 – 2.5 0.7 –
2,5,5-Trimethyl-1,6-heptadiene 8:39 3.8 3.8 5.7 0.5 2.1 –4,8-Dimethyl-1,7-nonadiene 8:41 1.6 – 1.3 6.0 – –
8:53 0.4 – 0.5 – 0.2 2.5
Azulene 8:58 – – – – – 1.1
9:01 1.8 1.8 0.2 – 0.4 –9:06 1.7 1.2 0.4 0.4 0.5 –
Naphthalene 9:17 – – – – 6.8 14.69:38 – – 0.7 1.1 1.4 –
9:46 1.1 1.1 – 0.5 – 0.44,6-Dimethyl-5-hepten-2-one 10:06 6.0 5.1 0.4 0.9 0.9 0.4
10:11 2.9 2.8 0.2 0.3 0.4 –10:21 – – 0.1 0.6 – –10:22 – – – – – –10:31 – – – 0.8 – 0.810:42 0.6 – 0.5 1.3 1.7 –

109Thermal Degradation and Combustibility of Polypropylene
[Mg(OH)2 = MgO + H2O]
Magnesium oxide is a well-known catalyst for the dehydrogenetion of aliphaticand aromatic substitutes due to its low-basic properties and high surface area.5,6
During high temperature pyrolysis or under combustion conditions, PP-Mg(OH)2
undergoes a solid-phase catalytical condensation, with polycyclization followedby char formation on the activated surface of MgO (Scheme 1). The concentra-tions of methylnaphthalenes, azulenes and biphenyls, as well as methylbenzene,ethylbenzene, naphthalene and substituted biphenyls tend to grow significantly incomparison with conventional PP (Table 1). From the above results and discus-sion, the incorporation of Mg(OH)2 clearly leads to flame retardancy of poly-propylene, initiated in the gaseous phase, followed by a solid-phase catalytic charformation.
Table 1 Continue
Concentrations (wt%)
300 500 700
Pyrolysis T (°C) Products tr (min) PP PP/Mg PP PP/Mg PP PP/Mg
Methylnaphthalene 10:59 – – – – – 5.5
2,4,6,8-Tetramethyl-1-undecene 11:00 5.1 4.3 6.7 11.5 18.0 –11:07 2.5 2.2 1.4 2.4 2.4 –11:15 3.5 3.5 4.9 7.8 10.2 –
Dimethylnaphthalene 11:15 – – – – – 3.311:20 1.9 0.5 0.1 0.2 – –11:28 1.1 0.3 0.1 0.1 – –11:39 0.9 0.7 0.7 1.6 1.6 0.112:02 1.7 2.3 1.6 3.5 3.6 0.4
1,1-Biphenyl 12:12 – – – – – 3.213:22 1.9 2.1 0.3 0.6 – –13:32 1.0 0.7 0.1 0.2 – –13:40 1.1 – 0.1 0.4 – 2.113:47 0.1 – 0.5 0.6 0.5 0.214:03 0.3 0.8 1.3 1.5 1.0 0.9
1-(2-Phenylethylnyl)-benzene 14:11 0.4 1.1 0.3 1.7 – 0.814:36 – – 0.3 0.9 0.4 0.314:59 0.7 11.4 1.9 2.5 0.8 2.9
1-(3-Phenylpropyl)-benzene 15:51 – 6.2 – 0.4 – –16:12 0.8 1.0 0.1 0.3 – –16:32 – – 0.3 0.4 – –16:49 0.3 1.0 0.8 1.0 0.7 0.217:04 0.2 0.4 0.5 0.6 0.2 –17:37 0.3 0.6 1.0 0.9 0.6 –19:12 – – 0.2 0.3 0.4 –20:01 0.2 – 0.4 0.4 0.3 –
Total S (prod.) 100.0 100.0 100.0 100.0 100.0 100.0
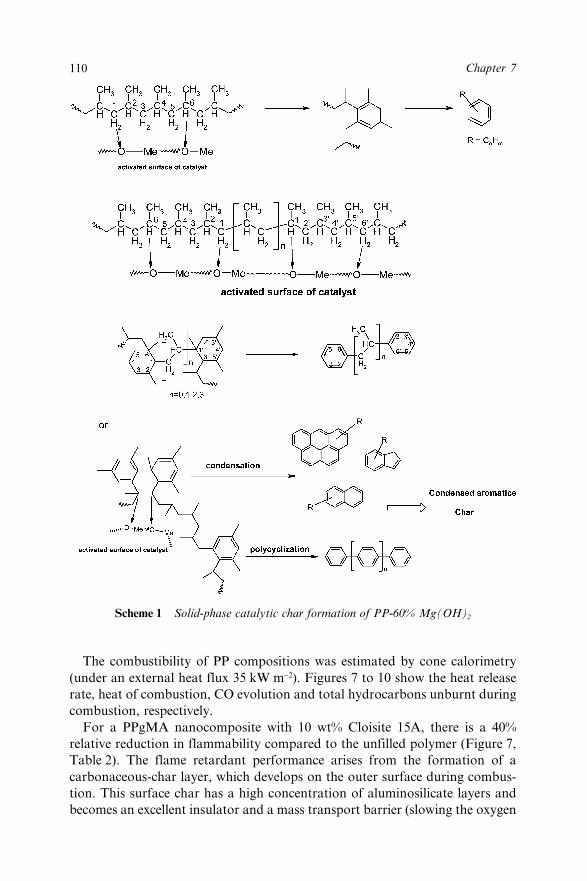
110 Chapter 7
The combustibility of PP compositions was estimated by cone calorimetry(under an external heat flux 35 kW m−2). Figures 7 to 10 show the heat releaserate, heat of combustion, CO evolution and total hydrocarbons unburnt duringcombustion, respectively.
For a PPgMA nanocomposite with 10 wt% Cloisite 15A, there is a 40%relative reduction in flammability compared to the unfilled polymer (Figure 7,Table 2). The flame retardant performance arises from the formation of acarbonaceous-char layer, which develops on the outer surface during combus-tion. This surface char has a high concentration of aluminosilicate layers andbecomes an excellent insulator and a mass transport barrier (slowing the oxygen
Scheme 1 Solid-phase catalytic char formation of PP-60% Mg(OH)2

111Thermal Degradation and Combustibility of Polypropylene
Figure 7 Maximum heat of release for PP and PPgMA-Cloisite 15A (cone calorimeter;external heat flux: 35 kW m−2)
Table 2 RHR values from cone calorimetry of PP formulation
Samples RHR (kW m−2) PP PP-60%Mg(OH)2 PP-g-Ma / OMC 15A-10%
PkRHR 1480 593 907Average RHR 577 401 472
Figure 8 Heat of combustion of PP and PPgMA-Cloisite 15A vs. time (external heatflux: 35 kW m−2)

112 Chapter 7
Figure 9 Carbon monoxide yield for PP and PPgMA-Cloisite 15A vs. time (externalheat flux: 35 kW m−2)
Figure 10 Unburnt hydrocarbons for PP and PPgMA-Cloisite 15A vs. time (externalheat flux: 35 kW m−2)

113Thermal Degradation and Combustibility of Polypropylene
supply as well as the escape of the combustion products generated duringdecomposition). Conversely, the reduction in flammability for PP-Mg(OH2)(60%) over the PP is equal to 60%, which is more significant than for thenanocomposite (Table 2).
However, from a practical viewpoint, because only a few percent of inorganicfillers are needed in the PP-layered silicates nanocomposites, the resultinghybrids are lightweight and tend to preserve the mechanical properties ofpolymeric materials.
7.4 References1. A.B. Morgan and J.D. Harris, Polymer, 2003, 44, 2313–2320.2. E.P. Giannelis, Adv. Mater., 1996, 8(1), 29.3. J.W. Gilman, T. Kashiwagi, M. Nyden, E.T.J. Brown, C.L. Jackson,
S.M. Lomakin, E. P. Giannelis and E. Manias, “Flammability studies ofpolymer layered silicate nanocomposites: polyolefin, epoxy, and vinyl esterresins”, in Chemistry and Technology of Polymer Additives, S. Al-Malaika,A. Golovoy and C.A. Wilkie (eds.), Blackwell Pub., Oxford, UK, 1999,pp. 249–265.
4. J.W. Gilman, C.L. Jackson, A.B. Morgan, R. Harris, E. Manias, E.P.Giannelis, M. Wuthenow, D. Hilton and S.H. Phillips, Chem. Mater., 2000,12, 1866–1873.
5. A.Tkáï, I. ‡pilda, J. Polym. Sci. Polym. Chem. Ed., 1981, 19, 1495–1508.6. N.K. Jha, A.C. Misra and P. Bajaj, J. Macromol. Sci.-Rev., Macromol.
Chem. Phys., 1984, C24.1, 69–116.

114
CHAPTER 8
Effect of the ProcessingConditions on the FireRetardant andThermomechanical Propertiesof PP–Clay NanocompositesABDEL BENDAOUDI,1 SOPHIE DUQUESNE,1
CHARAFEDDINE JAMA,1 MICHEL LE BRAS,1 RENÉDELOBEL,1 PHILIPPE RECOURT,2 JEAN-MICHELGLOAGUEN,3 JEAN-MARC LEFEBVRE3 ANDAHMED ADDAD3
1Laboratoire des Procédés d’Elaboration de Revêtements Fonctionnels, EcoleNationale Supérieure de Chimie de Lille, BP 108, F-59652 Villeneuve d’Ascq,France ([email protected])2Processus et Bilans des Domaines Sédimentaires, Université des Sciences etTechnologies de Lille, F-59655 Villeneuve d’Ascq Cedex3Laboratoire de Structure et Propriétés de l’Etat Solide, UMR 8008,Université des Sciences et Technologies de Lille, F-59655 Villeneuve d’AscqCedex
8.1 IntroductionNanocomposite polymers, and in particular polymer/clay systems, have beenof interest for around 15 years but were first referenced as early as 1950.1 Thisinterest is linked with the research carried out by Toyota,2 which demonstratedthe superior performance that can be achieved using a nano-dispersion of thefiller (nanocomposite) when compared to a micro-dispersion (conventionalcomposites). The barrier properties to gas diffusion (in particular to oxygen andcarbon dioxide) of nanocomposite led to the development of some applicationsin the food packaging industries. The improvement in mechanical properties for

115Effect of Processing Conditions on PP–Clay Nanocomposites
low loading systems may find advantages in the automotive industry. Anotherproperty that can be improved using these materials is their flame retardantproperties.3–5 These enhanced properties are closely linked to the degree ofdispersion of the nano-filler.
Several methods exist to obtain a good dispersion of the clay layers in thepolymer matrix.6 In -situ polymerization leads generally to a well exfoliatedstructure. However, this method is difficult to adapt in an industrial scale toall the families of polymers. It is also possible to process nanocomposite usinga solution method. This method consists first in a exfoliation of the clay ina solvent and then the polymer is solubilised. After extraction of the solvent, ananocomposite is obtained. This method presents the inconvenient to usesolvent, which is usually an environmental and safety problem. Finally, a meltprocessing method can also be employed to prepare nanocomposite. The disper-sion of the clay is obtained in the melted polymer using the shear developedin the process (such as, for example, mixing or extrusion). The direct meltblending process is most attractive because of its low cost, high productivity andcompatibility with current polymer processing techniques. In this method, theprocessing parameters (temperature, rotor or screw speed (rotor speed), mixingduration, presence of oxidative atmosphere etc.) as well as the chemical natureof the clay and the intercalating agent are key parameters.7
The effect of the type of the clay,8–10 of the clay loading11,12 and of the interca-lating agent13–17 (also called surfactant, or compatibilizer) of the clay have beenwidely investigated. It is generally accepted that modification of the clay byorganophilic compounds is needed to provide a good dispersion or an exfolia-tion of the clay platelets into the polymer matrix. In polypropylene (PP) matrix,exfoliation is more difficult due to the non-polar chemical structure of thepolymer. In general, PP/clay nanocomposites form an exfoliated structure onlywhen a compatibilizer such as maleic anhydride functionalised polypropylene(PP-g-MA) is added. Recently, a novel approach to make exfoliated PP/claynanocomposites without adding PP-g-MA has been developed, applying a largeelectric field to the exfoliated structures.18–20
The aim of this study is to investigate the effect of processing parameterson the fire retardant performance and on the thermal and thermomechanicalproperties of PP/clay systems. To optimize those properties, different materialshave been prepared using different processing conditions defined by an experi-mental design. The nanocomposites were characterized using X-ray diffractionanalyses and transmission electronic microscopy (TEM). The properties of thematerials have been finally correlated with the processing conditions.
8.2 Experimental8.2.1 Materials
Raw materials were PP [polypropylene supplied by Atofina – PPH7060MFI = 12 g/10 min] PP-g-MA (maleic anhydride grafted polypropylenesupplied by Crompton − Polybond 320–2% MA, MFI = 110 g/10 min) and
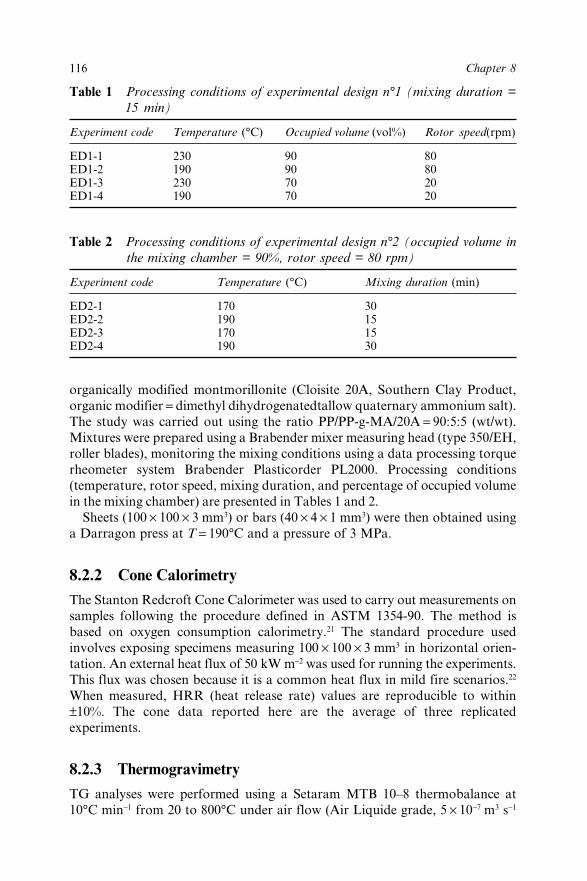
116 Chapter 8
organically modified montmorillonite (Cloisite 20A, Southern Clay Product,organic modifier = dimethyl dihydrogenatedtallow quaternary ammonium salt).The study was carried out using the ratio PP/PP-g-MA/20A = 90:5:5 (wt/wt).Mixtures were prepared using a Brabender mixer measuring head (type 350/EH,roller blades), monitoring the mixing conditions using a data processing torquerheometer system Brabender Plasticorder PL2000. Processing conditions(temperature, rotor speed, mixing duration, and percentage of occupied volumein the mixing chamber) are presented in Tables 1 and 2.
Sheets (100 × 100 × 3 mm3) or bars (40 × 4 × 1 mm3) were then obtained usinga Darragon press at T = 190°C and a pressure of 3 MPa.
8.2.2 Cone Calorimetry
The Stanton Redcroft Cone Calorimeter was used to carry out measurements onsamples following the procedure defined in ASTM 1354-90. The method isbased on oxygen consumption calorimetry.21 The standard procedure usedinvolves exposing specimens measuring 100 × 100 × 3 mm3 in horizontal orien-tation. An external heat flux of 50 kW m−2 was used for running the experiments.This flux was chosen because it is a common heat flux in mild fire scenarios.22
When measured, HRR (heat release rate) values are reproducible to within±10%. The cone data reported here are the average of three replicatedexperiments.
8.2.3 Thermogravimetry
TG analyses were performed using a Setaram MTB 10–8 thermobalance at10°C min−1 from 20 to 800°C under air flow (Air Liquide grade, 5 × 10⁻⁷ m3 s−1
Table 1 Processing conditions of experimental design n°1 (mixing duration =15 min)
Experiment code Temperature (°C) Occupied volume (vol%) Rotor speed(rpm)
ED1-1 230 90 80ED1-2 190 90 80ED1-3 230 70 20ED1-4 190 70 20
Table 2 Processing conditions of experimental design n°2 (occupied volume inthe mixing chamber = 90%, rotor speed = 80 rpm)
Experiment code Temperature (°C) Mixing duration (min)
ED2-1 170 30ED2-2 190 15ED2-3 170 15ED2-4 190 30

117Effect of Processing Conditions on PP–Clay Nanocomposites
measured in standard conditions). Samples (powder, about 10 mg) were placedin vitreous silica pans. The precision of temperature measurements was ±1.5°C.
8.2.4 Dynamic Mechanical Analysis
Dynamic mechanical properties were studied on compression-molded bars(40 × 4 × 1 mm3) with a Metravib dynamic mechanical analyzer in the tensilemode. Samples were tested from −40 to 140°C at a heating rate of 3°C min−1 anda frequency of 1 Hz.
8.2.5 Characterization of Nanocomposites
The degree of the nano-dispersion, intercalation and/or exfoliation, of theblended PP/PP-g-MA/20A was investigated by X-ray diffraction measurementsand TEM.
X-Ray scattering measurements were performed with a Philipps PW 1729diffractometer with CuKa radiation (l = 1.5418 Å), a step size of 0.02° 2qand count time of 1 s. The d-spacing experimental standard uncertainty was±0.2 nm. Cloisite 20A was analyzed as received. The polymer nanocompositeswere melt-pressed before analysis into 1.6 mm sheets.
Transmission electron microscopy (TEM) samples of PP-clay nanocom-posites were prepared with cryoultramicrotome (LEICA UltracutE FC4)at −100°C and cut into 50 nm thick sections with a 35° diamont knife. Thesections were transferred onto Cu grids of 200 mesh. TEM images were obtainedat 200 kV with a Jeol 200 CX electron microscope at magnifications of 20,000and 150,000.
8.2.6 Experimental Design
Two experimental designs based on a Hadamard matrix (two or three factors,at two levels) were employed to obtain the correlation between the processingparameters and the fire retardant performance, using the Nemrodw software.
8.3 Results and Discussion8.3.1 Fire Retardant Performance of PP NanocompositesThe fire retardant performance of materials set up according to experimentaldesign n°1 are reported in Figure 1. The cone calorimeter, simulating the condi-tions of a fire, is the most adapted tool to evaluate the fire retardant propertiesof nanocomposite. Indeed, other tests such as LOI or UL94 are less sensitive tothe improvement of the fire retardancy of polymer when clay is added. Forexample, LOI values of PP nanocomposites have been reported between 18.6and 19.2 vol% in comparison with 17.8 vol% for virgin PP.23 Considering thislow variation, it is very difficult to obtain a good discrimination between thematerials.
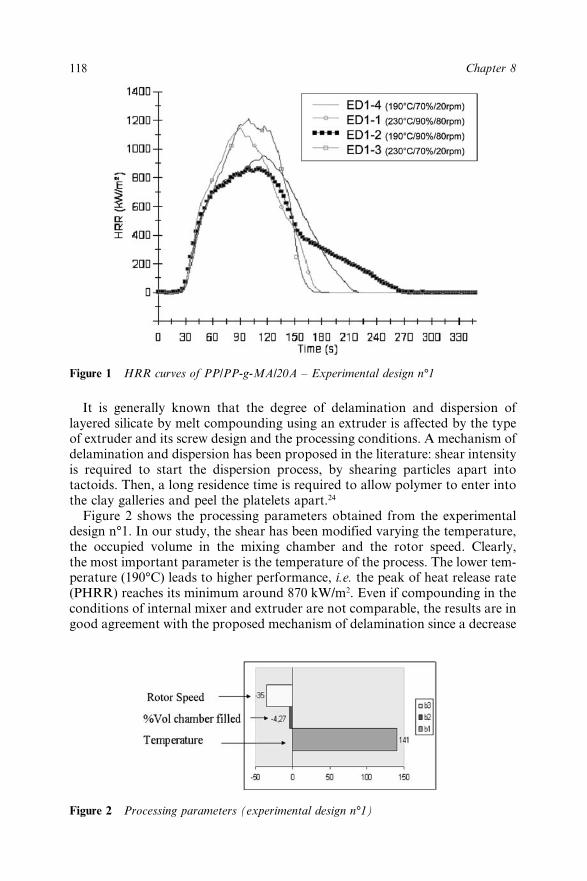
118 Chapter 8
It is generally known that the degree of delamination and dispersion oflayered silicate by melt compounding using an extruder is affected by the typeof extruder and its screw design and the processing conditions. A mechanism ofdelamination and dispersion has been proposed in the literature: shear intensityis required to start the dispersion process, by shearing particles apart intotactoids. Then, a long residence time is required to allow polymer to enter intothe clay galleries and peel the platelets apart.24
Figure 2 shows the processing parameters obtained from the experimentaldesign n°1. In our study, the shear has been modified varying the temperature,the occupied volume in the mixing chamber and the rotor speed. Clearly,the most important parameter is the temperature of the process. The lower tem-perature (190°C) leads to higher performance, i.e. the peak of heat release rate(PHRR) reaches its minimum around 870 kW/m2. Even if compounding in theconditions of internal mixer and extruder are not comparable, the results are ingood agreement with the proposed mechanism of delamination since a decrease
Figure 1 HRR curves of PP/PP-g-MA/20A – Experimental design n°1
Figure 2 Processing parameters (experimental design n°1)
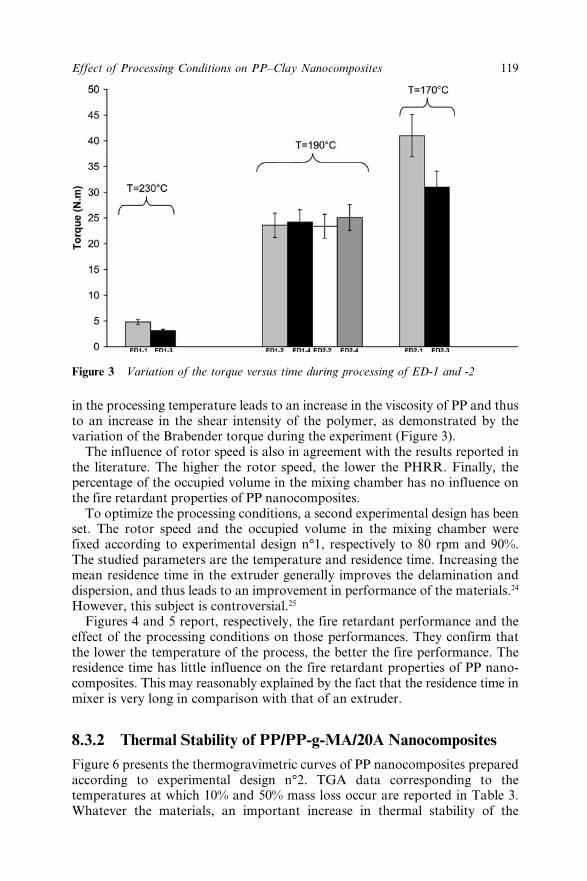
119Effect of Processing Conditions on PP–Clay Nanocomposites
in the processing temperature leads to an increase in the viscosity of PP and thusto an increase in the shear intensity of the polymer, as demonstrated by thevariation of the Brabender torque during the experiment (Figure 3).
The influence of rotor speed is also in agreement with the results reported inthe literature. The higher the rotor speed, the lower the PHRR. Finally, thepercentage of the occupied volume in the mixing chamber has no influence onthe fire retardant properties of PP nanocomposites.
To optimize the processing conditions, a second experimental design has beenset. The rotor speed and the occupied volume in the mixing chamber werefixed according to experimental design n°1, respectively to 80 rpm and 90%.The studied parameters are the temperature and residence time. Increasing themean residence time in the extruder generally improves the delamination anddispersion, and thus leads to an improvement in performance of the materials.24
However, this subject is controversial.25
Figures 4 and 5 report, respectively, the fire retardant performance and theeffect of the processing conditions on those performances. They confirm thatthe lower the temperature of the process, the better the fire performance. Theresidence time has little influence on the fire retardant properties of PP nano-composites. This may reasonably explained by the fact that the residence time inmixer is very long in comparison with that of an extruder.
8.3.2 Thermal Stability of PP/PP-g-MA/20A NanocompositesFigure 6 presents the thermogravimetric curves of PP nanocomposites preparedaccording to experimental design n°2. TGA data corresponding to thetemperatures at which 10% and 50% mass loss occur are reported in Table 3.Whatever the materials, an important increase in thermal stability of the
Figure 3 Variation of the torque versus time during processing of ED-1 and -2

120 Chapter 8
Figure 4 HRR curves of PP/PP-g-MA/20A – Experimental design n°2
Figure 5 Processing parameters (experimental design n°2)
Figure 6 TG curves of PP/PP-g-MA/20A – experimental design n°2
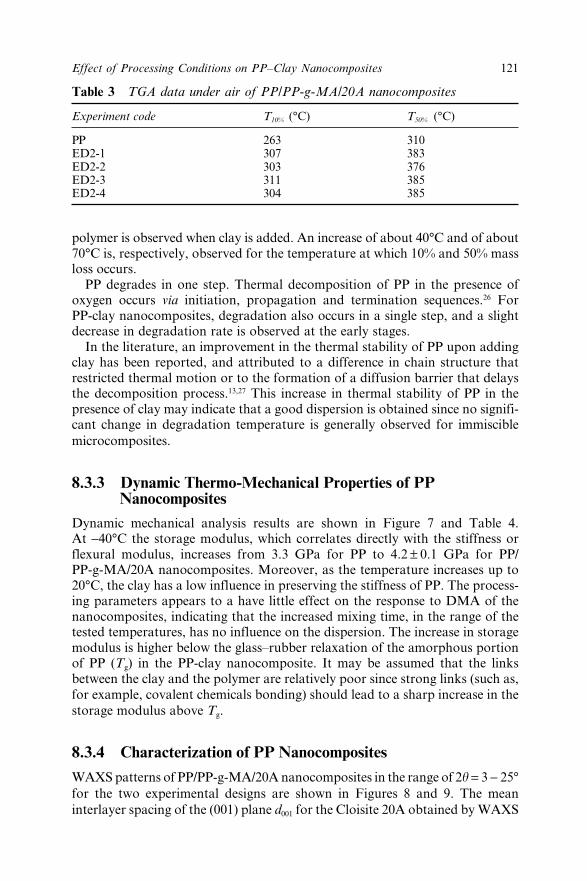
121Effect of Processing Conditions on PP–Clay Nanocomposites
polymer is observed when clay is added. An increase of about 40°C and of about70°C is, respectively, observed for the temperature at which 10% and 50% massloss occurs.
PP degrades in one step. Thermal decomposition of PP in the presence ofoxygen occurs via initiation, propagation and termination sequences.26 ForPP-clay nanocomposites, degradation also occurs in a single step, and a slightdecrease in degradation rate is observed at the early stages.
In the literature, an improvement in the thermal stability of PP upon addingclay has been reported, and attributed to a difference in chain structure thatrestricted thermal motion or to the formation of a diffusion barrier that delaysthe decomposition process.13,27 This increase in thermal stability of PP in thepresence of clay may indicate that a good dispersion is obtained since no signifi-cant change in degradation temperature is generally observed for immisciblemicrocomposites.
8.3.3 Dynamic Thermo-Mechanical Properties of PPNanocomposites
Dynamic mechanical analysis results are shown in Figure 7 and Table 4.At −40°C the storage modulus, which correlates directly with the stiffness orflexural modulus, increases from 3.3 GPa for PP to 4.2 ± 0.1 GPa for PP/PP-g-MA/20A nanocomposites. Moreover, as the temperature increases up to20°C, the clay has a low influence in preserving the stiffness of PP. The process-ing parameters appears to a have little effect on the response to DMA of thenanocomposites, indicating that the increased mixing time, in the range of thetested temperatures, has no influence on the dispersion. The increase in storagemodulus is higher below the glass–rubber relaxation of the amorphous portionof PP (Tg) in the PP-clay nanocomposite. It may be assumed that the linksbetween the clay and the polymer are relatively poor since strong links (such as,for example, covalent chemicals bonding) should lead to a sharp increase in thestorage modulus above Tg.
8.3.4 Characterization of PP Nanocomposites
WAXS patterns of PP/PP-g-MA/20A nanocomposites in the range of 2h = 3 − 25°for the two experimental designs are shown in Figures 8 and 9. The meaninterlayer spacing of the (001) plane d001 for the Cloisite 20A obtained by WAXS
Table 3 TGA data under air of PP/PP-g-MA/20A nanocomposites
Experiment code T10% (°C) T50% (°C)
PP 263 310ED2-1 307 383ED2-2 303 376ED2-3 311 385ED2-4 304 385
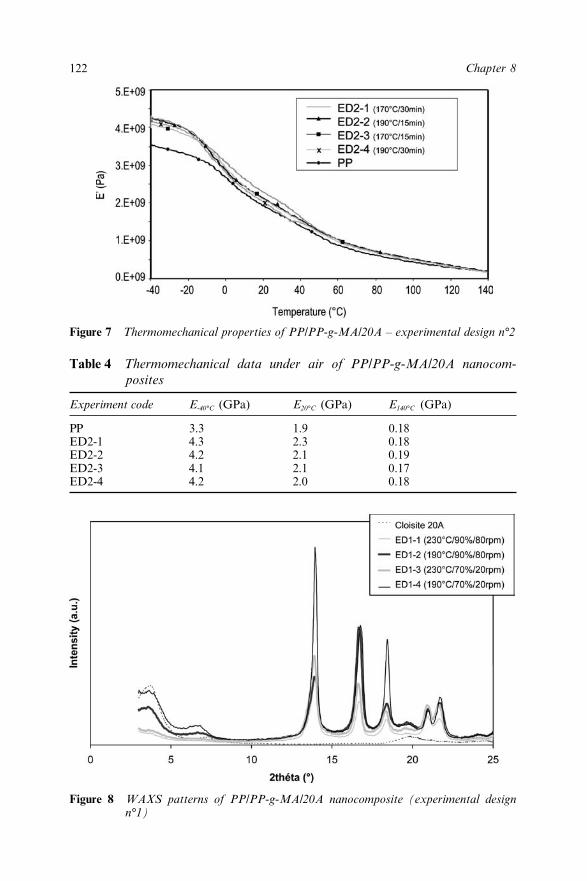
122 Chapter 8
Table 4 Thermomechanical data under air of PP/PP-g-MA/20A nanocom-posites
Experiment code E-40°C (GPa) E20°C (GPa) E140°C (GPa)
PP 3.3 1.9 0.18ED2-1 4.3 2.3 0.18ED2-2 4.2 2.1 0.19ED2-3 4.1 2.1 0.17ED2-4 4.2 2.0 0.18
Figure 7 Thermomechanical properties of PP/PP-g-MA/20A – experimental design n°2
Figure 8 WAXS patterns of PP/PP-g-MA/20A nanocomposite (experimental designn°1)
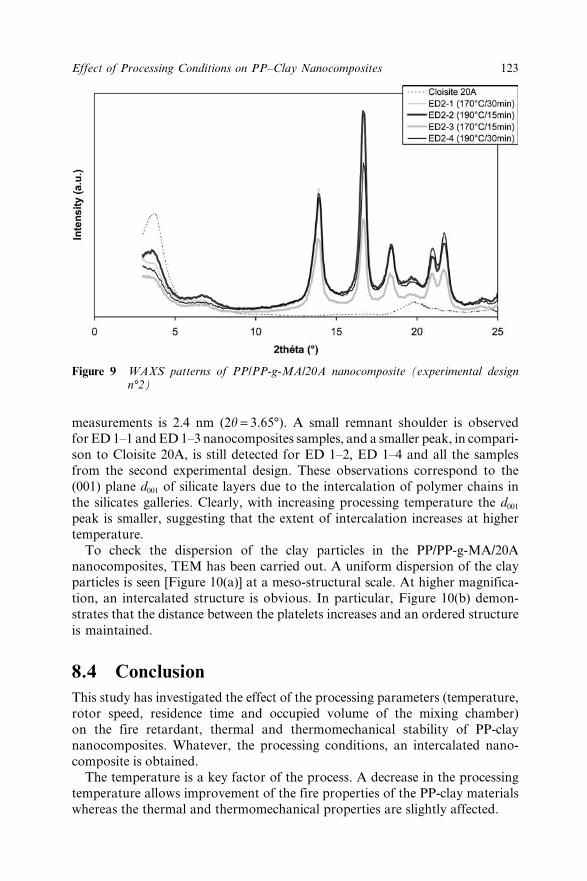
123Effect of Processing Conditions on PP–Clay Nanocomposites
Figure 9 WAXS patterns of PP/PP-g-MA/20A nanocomposite (experimental designn°2)
measurements is 2.4 nm (2h = 3.65°). A small remnant shoulder is observedfor ED 1–1 and ED 1–3 nanocomposites samples, and a smaller peak, in compari-son to Cloisite 20A, is still detected for ED 1–2, ED 1–4 and all the samplesfrom the second experimental design. These observations correspond to the(001) plane d001 of silicate layers due to the intercalation of polymer chains inthe silicates galleries. Clearly, with increasing processing temperature the d001
peak is smaller, suggesting that the extent of intercalation increases at highertemperature.
To check the dispersion of the clay particles in the PP/PP-g-MA/20Ananocomposites, TEM has been carried out. A uniform dispersion of the clayparticles is seen [Figure 10(a)] at a meso-structural scale. At higher magnifica-tion, an intercalated structure is obvious. In particular, Figure 10(b) demon-strates that the distance between the platelets increases and an ordered structureis maintained.
8.4 ConclusionThis study has investigated the effect of the processing parameters (temperature,rotor speed, residence time and occupied volume of the mixing chamber)on the fire retardant, thermal and thermomechanical stability of PP-claynanocomposites. Whatever, the processing conditions, an intercalated nano-composite is obtained.
The temperature is a key factor of the process. A decrease in the processingtemperature allows improvement of the fire properties of the PP-clay materialswhereas the thermal and thermomechanical properties are slightly affected.

124 Chapter 8
8.5 References1. L.W. Carter, J.G. Hendricks and D.S. Bolley, US Patent 2531396, 1950.2. Y. Fukushima, A. Okada, M. Kawasumi, T. Kurauchi and O. Kamigaito,
Clay Mineral, 1988, 23, 27–34.3. J.W. Gilman, A. Morgan, E.P. Giannelis, M. Wuthenov and E. Manias,
11th Conference on Recent Advances in Flame Retardancy of PolymericMaterials, Stamford, USA, 2000.
4. E.P. Giannelis, Adv. Mater., 1996, 8(1), 29–35.5. Gy. Marosi, P. Anna, A. Marton, Sz. Matko, A. Szep, S. Keszei,
B. Csontos and B. Marosfoi, 12th International Conference on Additives,San Francisco, April 2003.
6. M. Alexandre and P. Dubois, Mater. Sci. Eng., 2000, R28(1–2), 1–63.7. H.R. Dennis, D.L. Hunter, D. Chang, S. Kim, J.L. White, J.W. Cho and
D.R. Paul, ANTEC 2000, Orlando, Florida, 8–9 May 2000.8. C.A. Wilkie, in Proceed. 9th European Meeting on Fire Retardancy and
Protection of Materials, M. Le Bras et al., (ed.) USTL Pub., 17–19th
September 2003, Lille, France, p. 49.
Figure 10 TEM image of PP/PP-g-MA/20A nanocomposite
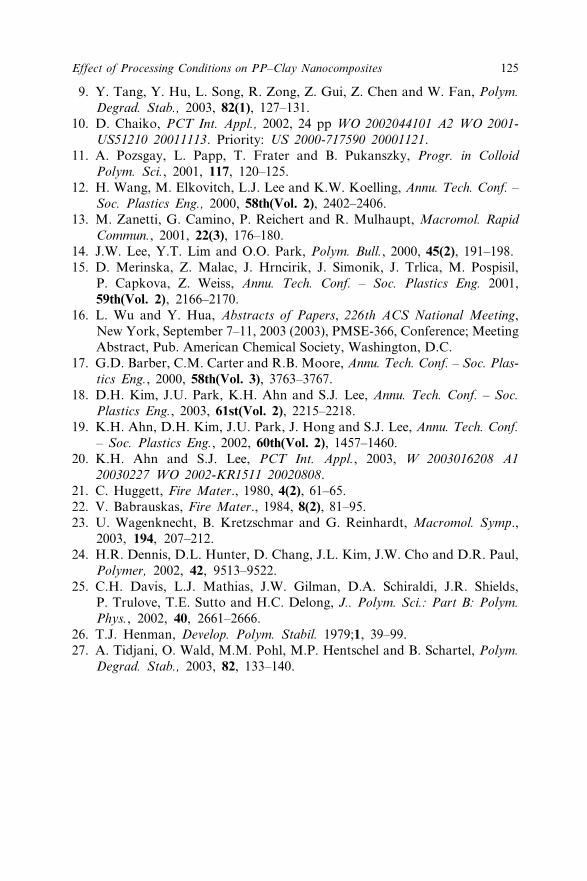
125Effect of Processing Conditions on PP–Clay Nanocomposites
9. Y. Tang, Y. Hu, L. Song, R. Zong, Z. Gui, Z. Chen and W. Fan, Polym.Degrad. Stab., 2003, 82(1), 127–131.
10. D. Chaiko, PCT Int. Appl., 2002, 24 pp WO 2002044101 A2 WO 2001-US51210 20011113. Priority: US 2000-717590 20001121.
11. A. Pozsgay, L. Papp, T. Frater and B. Pukanszky, Progr. in ColloidPolym. Sci., 2001, 117, 120–125.
12. H. Wang, M. Elkovitch, L.J. Lee and K.W. Koelling, Annu. Tech. Conf. –Soc. Plastics Eng., 2000, 58th(Vol. 2), 2402–2406.
13. M. Zanetti, G. Camino, P. Reichert and R. Mulhaupt, Macromol. RapidCommun., 2001, 22(3), 176–180.
14. J.W. Lee, Y.T. Lim and O.O. Park, Polym. Bull., 2000, 45(2), 191–198.15. D. Merinska, Z. Malac, J. Hrncirik, J. Simonik, J. Trlica, M. Pospisil,
P. Capkova, Z. Weiss, Annu. Tech. Conf. – Soc. Plastics Eng. 2001,59th(Vol. 2), 2166–2170.
16. L. Wu and Y. Hua, Abstracts of Papers, 226th ACS National Meeting,New York, September 7–11, 2003 (2003), PMSE-366, Conference; MeetingAbstract, Pub. American Chemical Society, Washington, D.C.
17. G.D. Barber, C.M. Carter and R.B. Moore, Annu. Tech. Conf. – Soc. Plas-tics Eng., 2000, 58th(Vol. 3), 3763–3767.
18. D.H. Kim, J.U. Park, K.H. Ahn and S.J. Lee, Annu. Tech. Conf. – Soc.Plastics Eng., 2003, 61st(Vol. 2), 2215–2218.
19. K.H. Ahn, D.H. Kim, J.U. Park, J. Hong and S.J. Lee, Annu. Tech. Conf.– Soc. Plastics Eng., 2002, 60th(Vol. 2), 1457–1460.
20. K.H. Ahn and S.J. Lee, PCT Int. Appl., 2003, W 2003016208 A120030227 WO 2002-KR1511 20020808.
21. C. Huggett, Fire Mater., 1980, 4(2), 61–65.22. V. Babrauskas, Fire Mater., 1984, 8(2), 81–95.23. U. Wagenknecht, B. Kretzschmar and G. Reinhardt, Macromol. Symp.,
2003, 194, 207–212.24. H.R. Dennis, D.L. Hunter, D. Chang, J.L. Kim, J.W. Cho and D.R. Paul,
Polymer, 2002, 42, 9513–9522.25. C.H. Davis, L.J. Mathias, J.W. Gilman, D.A. Schiraldi, J.R. Shields,
P. Trulove, T.E. Sutto and H.C. Delong, J.. Polym. Sci.: Part B: Polym.Phys., 2002, 40, 2661–2666.
26. T.J. Henman, Develop. Polym. Stabil. 1979;1, 39–99.27. A. Tidjani, O. Wald, M.M. Pohl, M.P. Hentschel and B. Schartel, Polym.
Degrad. Stab., 2003, 82, 133–140.

126
CHAPTER 9
Fire Retardancy of Polystyrene–Hectorite NanocompositesDONGYAN WANG, BOK NAM JANG, SHENGPEI SU,JINGUO ZHANG, XIAOXIA ZHENG, GRACECHIGWADA, DAVID D. JIANG ANDCHARLES A. WILKIE
Department of Chemistry, Marquette University, PO Box 1881, Milwaukee,WI 53201, U.S.A. ([email protected])
9.1 IntroductionPolymer nanocomposites have become an area of extensive research in recentyears. The properties of polymer nanocomposite are expected to be improvedsignificantly in the presence of layered silicate materials.1–6 Amongst theselayered silicate materials, montmorillonite is the most popular one studied,but some attention has also been paid to magadiite,7–12 bentonite13–16 andhectorite.17–22
While montmorillonite is an aluminosilicate, magadiite and hectoritecontain only silicates. The chemical formula for hectorite is Na0.3(Mg,Li)3
Si4O10(OH)2; a specimen of hectorite, fresh from the mine, has a soft, greasy tex-ture; it is one of the more expensive clays, due to its unique thixotropic proper-ties. The major uses of hectorite are in cosmetics and in chemical and industrialmaterial production.
Polyolefin microcomposites and layered silicate nanocomposites have beenprepared by Dubois et al.17 via in situ polymerization, using both montmori-llonite and hectorite that had been treated with trimethylaluminum-depletedmethylaluminoxane. The encapsulated filler particle within the (co)polyolefinicmatrix formed polymers ranging from thermoplastics to elastomers. Theobtained “homogeneous” (nano)composites exhibit improved mechanical prop-erties, as compared to more conventional melt blends for the same filler content.Sandi18 has synthesized a series of polymer–clay nanocomposites based onsynthetic lithium hectorite and different mass ratios of poly(ethylene oxide)and tested these as candidates for polymeric electrolytes in lithium ion cells.

127Fire Retardancy of Polystyrene–Hectorite Nanocomposites
Transparent films with excellent mechanical strength were obtained with a con-ductivity that is comparable to more traditional polymer electrolytes made withadded lithium salts.
Coumarin dye molecules were first intercalated into the gallery of hectorite;extensive shaking and sonication of this water suspension leads to exfoliation,which is confirmed by both atomic force microscopy (AFM) and transmissionelectron microscopy (TEM).19 The resulting nanocomposite films were transpar-ent and displayed fluorescence centered at around 470 nm.
Polystyrene–clay and poly(methyl methacrylate)–clay nanocomposites20
have been prepared using cetyltrimethylammonium-modified hectorite bysolution blending in toluene. Wide-angle X-ray diffraction (WAXD) as well as2D 1H–29Si and 1H–1H correlated solid-state NMR confirmed the dispersion ofthe intercalated clay stacks in the polymer matrix.
Multinuclear solid-state NMR (two-dimensional 1H–29Si heteronuclear corre-lation (HETCOR) NMR with spin diffusion and refocused 29Si detection forenhanced sensitivity) revealed that during the intercalation of poly(styrene-ethylene oxide) block copolymers (PS-b-PEO) into hectorite, the PS block is notintercalated but the PEO segment is intercalated.21 In PS-rich samples, a smallamount of PEO is intercalated and a significant fraction of PEO is not interca-lated. Intercalated PEO exhibits reduced mobility, most prominently for thePEO nearest to the silicate surface. In situ small-angle X-ray scattering studieswere conducted to monitor the structural changes of polymer nanocompositesupon heating.22
These silicates usually have excess negative charge, which is balanced by theexchangeable cations in the gallery space. Like montmorillonite clay, the cationexchangeability offers the possibility for the modification of pristine hectorite byorganic cations, which can increase the organophilic character of the galleryspace so that it is compatible with an organic polymer. Because of the outstand-ing performance of montmorillonite clay in the enhancement of barrier proper-ties and in fire retardancy, there is interest in examining hectorite, and otherclays, to determine how different clays behave with respect to nanocompositeformation and in fire performance.
In this chapter, pristine hectorite was modified with two different quaternaryammonium salts, one of which is known to give intercalated and the otherto give exfoliated nanocomposites with montmorillonite, and polystyrene nano-composites were prepared by bulk polymerization.
9.2 Experimental9.2.1 Materials
Dimethylhexadecylamine (≥98%) was acquired from Fluka. Most of the otherchemicals used in this study, including vinylbenzyl chloride (97%), monomericstyrene, benzoyl peroxide (BPO) 97% and tetrahydrofuran (THF) (99+%), werepurchased from the Aldrich Chemical Company. The polymerization inhibitorwas removed from the monomer by passing it through an inhibitor-remover

128 Chapter 9
column, also acquired from Aldrich. The quaternary ammonium salt knownas 10A was kindly provided by Akzo-Nobel, while the salt known as VB wassynthesized in this laboratory following a previously published procedure.23
Distilled water was used throughout as needed. Hectorite slurries were kindlyprovided by Elementis Specialties, Inc.; the iron contents of the clays and the lotnumbers by which they are reported herein are: 66A, 0.053%; 66B, 0.53%; and66G, 2.57%.
9.2.2 Organic Modification of Hectorite
The method used for the organic-modification of hectorite was quite similar tothat used to modify montmorillonite clay, as reported previously.24 The cationicexchange reaction occurs between pristine hectorite and a quaternary ammo-nium salt, in this case styryldimethylhexadecylammonium chloride (VB16,denoted VB) and dimethylbenzylhydrogenated tallow chloride (10A) wereutilized. Hydrogenated tallow contains ~65% C18, ~30% C16 and ~5% C14. A10% mole excess of the quaternary ammonium salt (based on the CEC of thehectorite) was added to the hectorite slurry for the cationic exchange reaction.After overnight stirring, the reaction was stopped, then the organically-modifiedhectorite was dried in a vacuum oven at room temperature.
9.2.3 Preparation of Nanocomposites
A bulk polymerization technique was utilized in the preparation of the poly-styrene (PS) hectorite nanocomposite. This procedure, which has been used formontmorillonite, has been previously described.24
9.2.4 Instrumentation
X-Ray diffraction (XRD) patterns were obtained using a Rigaku Geiger Flex,2-circle powder diffractometer equipped with Cu Ka generator (l = 1.5404 Å).Generator tension was 50 kV and generator current was 20 mA.
Thermogravimetric analysis (TGA) was performed on a TA Instruments,model SDT 2960 Simultaneous DTA-TGA unit under a 40 mL min−1 flowingnitrogen atmosphere at a scan rate of 10°C min−1 from room temperature to700°C; temperatures are reproducible to ±3°C, and the fraction of nonvolatilematerials is reproducible to ±3%.
Cone calorimetry was performed on an Atlas CONE2 according to ASTM E1354-92 at an incident flux of 35 kW m−2 using a cone shaped heater. Exhaustflow was set at 24 L s−1 and the spark was continuous until the sample ignited.Cone samples were prepared by compression molding the sample (about 30 g)into square plaques. Typical results from Cone calorimetry are reproducible towithin about ±10%. These uncertainties are based on many runs in whichthousands of samples have been combusted.25

129Fire Retardancy of Polystyrene–Hectorite Nanocomposites
9.3 Results and Discussions9.3.1 X-ray Diffraction
XRD can provide information about the d-spacing of hectorite according to theBragg equation. The d-spacing of pristine hectorite is 1.1 nm (2h = 7.9°); afterorganic-modification with the 10A salt, the d-spacing increased to 2.0 nm(2h = 4.4°), indicating that ion-exchange occurred. After bulk polymerizationof styrene with the clay, the XRD trace shows a sharp, strong peak at about3.5 nm (2h = 2.5°), clearly indicating the formation of an intercalated nano-composite; XRD traces for the PS-hectorite 10A nanocomposites are shown inFigure 1.
For the VB system, the d-spacing after ion exchange is also at 2.0 nm(2h = 4.4°). Peaks in the XRD traces (Figure 2) are much weaker for the VBsystem than for the 10A system. This may be attributable to either a greaterextent of exfoliation or disorder of the clay and an immiscible system. This lastpossibility is rejected because VB invariably gives better exfoliation than does anon-functionalized organic-modification such as 10A.23
Identical results were obtained for all of the hectorites examined in this study.There is little doubt, based on the XRD results, that these are intercalated andexfoliated nanocomposites.
9.3.2 Transmission Electron Microscopy
The XRD results very strongly suggest that good nanodispersion has beenachieved for all of these nanocomposites, but the only proof of this assertion lies
Figure 1 XRD traces for PS-hectorite 10A systems
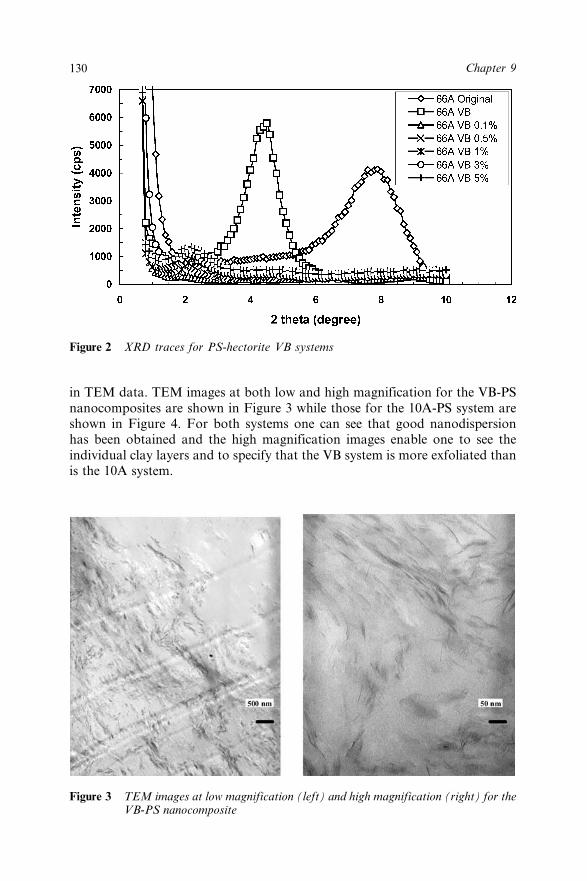
130 Chapter 9
in TEM data. TEM images at both low and high magnification for the VB-PSnanocomposites are shown in Figure 3 while those for the 10A-PS system areshown in Figure 4. For both systems one can see that good nanodispersionhas been obtained and the high magnification images enable one to see theindividual clay layers and to specify that the VB system is more exfoliated thanis the 10A system.
Figure 2 XRD traces for PS-hectorite VB systems
Figure 3 TEM images at low magnification (left) and high magnification (right) for theVB-PS nanocomposite

131Fire Retardancy of Polystyrene–Hectorite Nanocomposites
9.3.3 Thermogravimetric AnalysisParameters extracted from the TGA include the temperature at which 10% ofthe mass has been lost, T0.1, a measure of the onset of degradation, the tempera-ture at which 50% of the mass is lost, T0.5, the mid-point of the degradation, andthe fraction of material that is not volatile at 600°C (denoted as char). Withmontmorillonite clays we found previously that the onset temperature, as well asthe mid-point temperature, of iron-containing clay increases by about 50°Ccompared to virgin polymer.26 Results for the hectorite clay systems (Table 1)show comparable results for both temperatures; a representative set of TGAcurves for one of these systems is shown in Figure 5.
There appears to be some difference between lower amounts of clay and theresults at 3 or 5%, especially for the mid-point of the degradation, with largerincreases in temperature at these clay levels. With the montmorillonite, if onecompared iron-containing with iron-free clays, there was a significant tempera-ture difference between the two clays at low amounts of clay, but this differencebecame smaller as the amount of clay increased and became negligible at 3 or5% clay. With hectorite, there is no difference that can be attributed to the pres-ence or absence of iron. The tentative conclusion is that hectorite and montmo-rillonite exhibit similar effects according to TGA analysis, but the amount ofiron is important for montmorillonite but not for hectorite.
9.3.4 Cone Calorimetry
Cone calorimetry enables the evaluation of the fire parameters for a system; thedata that may be obtained includes the heat release rate curve, the total heat
Figure 4 TEM images at low (left) and high magnification (right) for the 10A-PSnanocomposite

132 Chapter 9
released, mass loss rate, time to ignition and smoke evolution, known as thespecific extinction area. For montmorillonite-polystyrene nanocomposites, thetime to ignition is decreased, the total heat released is unchanged but the peakheat release rate, PHRR, is significantly decreased, typically by 50–60%, themass loss rate is also reduced and there is little change in smoke evolution. In astudy of iron-containing versus iron-free polystyrene-montmorillonite nanocom-posites, we found a significant difference in the PHRR for iron-containing claysat low amounts of clay, but this difference vanishes as the amount of clayincreases.26 The commonly accepted mechanism by which nanocomposite for-mation reduces the PHRR is through barrier formation, which can act both asan insulator and a barrier to mass transport.27 Based upon these observations onthe effect of iron, it was proposed that some radical trapping may occur and thatthis is an effective mechanism at low clay content but, at high clay content, thebarrier effect becomes dominant.
Table 1 TGA parameters for hectorite-PS nanocomposites
Sample T0.1 (°C) T0.5 (°C) Char (wt%)
PS 351 404 066A-10A-PS, 0.1% 382 425 066A-10A-PS, 0.5% 399 436 066A-10A-PS, 1% 392 435 066A-10A-PS, 3% 390 444 266A-10A-PS, 5% 389 446 3
66A-VB-PS, 0.1% 387 428 066A-VB-PS, 0.5% 391 427 066A-VB-PS, 1% 399 436 066A-VB-PS, 3% 389 428 166A-VB-PS, 5% 414 457 5
66B-10A-PS, 0.1% 365 417 066B-10A-PS, 0.5% 380 426 066B-10A-PS, 1% 404 437 066B-10A-PS, 3% 389 443 366B-10A-PS, 5% 399 448 3
66B-VB-PS, 0.1% 337 402 066B-VB-PS, 0.5% 356 410 066B-VB-PS, 1% 364 422 266B-VB-PS, 3% 404 445 266B-VB-PS, 5% 408 452 5
66G-10A-PS, 0.1% 382 424 066G-10A-PS, 0.5% 403 436 066G-10A-PS, 1% 400 440 166G-10A-PS, 3% 400 444 3
66G-VB-PS, 0.1% 383 421 066G-VB-PS, 0.5% 394 421 066G-VB-PS, 1% 393 425 066G-VB-PS, 3% 400 445 2

133Fire Retardancy of Polystyrene–Hectorite Nanocomposites
For hectorite-polystyrene nanocomposites the results are quite different; thecone calorimetric results are shown in Table 2, while Figure 6 shows a represen-tative plot of the heat release rate for one of the polystyrene-hectorite nano-composites. There is essentially no reduction in PHRR when the clay content is1% or less and in some cases there is no effect at 3% clay, an amount at whichmontmorillonite is very effective. In most cases, at 5% clay one sees a reason-able reduction in PHRR. The other parameters recorded in Table 2 are typicalvalues and confirm the PHRR observation. For instance, when there is noreduction in PHRR, there is also no change in mass loss rate.
One can examine the data as a function of morphology, the 10A series versusthe VB series, or as a function of iron content. From the XRD traces, thosenanocomposites made with the 10A salt show a peak and are presumed to beintercalated while those made with VB16 show no peak and thus are assumed tobe exfoliated; the TEM data confirms these suggestions. For the very low ironcontent clay, 66A, the one discontinuity appears at 3% clay where the interca-lated material, 10A, gives a reduction while the exfoliated VB system gives noreduction.
For the intermediate iron content clay, 66B, a similar trend is seen in whichthe intercalated system gives a slight reduction at low amounts of clay and thereis a major difference at 3% clay. This trend is not continued at higher amountsof iron, 66G; here there is no reduction for the intercalated system but a betterreduction for the exfoliated system. These discrepancies cannot be attributed tochanges in the dispersion of the clay within the polymer matrix and must be dueto something else.
Figure 5 TGA curves for 66B-VB-PS nanocomposites

134 Chapter 9
When the data are examined from the point of view of the iron content, it ispossible to suggest that, as the iron content increases, the PHRR also increases.This is not in accord with work with montmorillonite, in which there is an ironeffect at low amounts of clay but when the amount of clay is 3% or larger, thePHRR is unaffected by the iron content.
One can summarize the cone calorimetry results for various clay-polystyrenenanocomposites as follows: montmorillonite gives a 50–60% reduction inPHRR at 3% clay;23 while magadiite12 and fluorohectorite27 give no reductionand hectorite gives a reduction of up to 50%, but only at 5% clay; the reductionwith hectorite at 3% clay is lower than is seen for montmorillonite at thisclay level. These variations require an explanation. TEM information isavailable for all systems and there is excellent dispersion for montmorillonite,
Table 2 Cone calorimetric data for the hectorite-polystyrene nanocomposites
PHRR THR WLR, SEAav,Sample Ti, (s) (kW m−2) (mJ m−2) (g s−1 m−2) (g s−1 m−2)
Polystyrene 59 1200 89 31.7 95266A-10A-PS, 0.1% 58 1149(4) 94 27.8 113866A-10A-PS, 0.5% 60 1223(0) 98 29.8 111766A-10A-PS, 1% 62 1440(0) 120 29.8 134266A-10A-PS, 3% 51 634 (31) 91 20.8 128566A-10A-PS, 5% 59 771 (36) 94 20.1 1322
66A-VB-PS, 0.1% 54 1505 (0) 112 29.2 132566A-VB-PS, 0.5% 56 1350 (0) 107 27.9 132166A-VB-PS, 1% 59 1240 (0) 104 28.0 122666A-VB-PS, 3% 54 1147 (4) 97 25.9 134066A-VB-PS, 5% 53 888 (26) 100 21.1 1394
66B-10A-PS, 0.1% 56 1027 (14) 66 31.9 77666B-10A-PS, 0.5% 50 1093 (9) 76 32.8 95066B-10A-PS, 1% 40 972 (19) 75 30.3 93666B-10A-PS, 3% 32 679 (43) 64 22.9 102566B-10A-PS, 5% 44 598 (50) 62 22.2 1104
66B-VB-PS, 0.1% 58 1361 (0) 92 31.0 109266B-VB-PS, 0.5% 50 1329 (0) 85 31.0 115166B-VB-PS, 1% 56 1337 (0) 99 34.0 113466B-VB-PS, 3% 47 1237 (0) 94 29.0 121466B-VB-PS, 5% 41 547 (54) 59 21.8 1157
66G-10A-PS, 0.1% 58 1587(0) 126 29.7 131966G-10A-PS, 0.5% 55 1481 (0) 132 26.7 141966G-10A-PS, 1% 48 1338 (0) 123 24.0 149666G-10A-PS, 3% 51 1242 (0) 120 24.1 1458
66G-VB-PS, 0.1% 54 1015 (15) 57 32.9 77666G-VB-PS, 0.5% 43 926 (23) 62 31.2 82566G-VB-PS, 1% 50 947 (21) 65 31.9 80266G-VB-PS, 3% 41 894 (26) 66 30.7 849
Glossary: ti: time to ignition; THR: total heat released; WLR: mass loss rate; SEAav:Average specific extinction area.
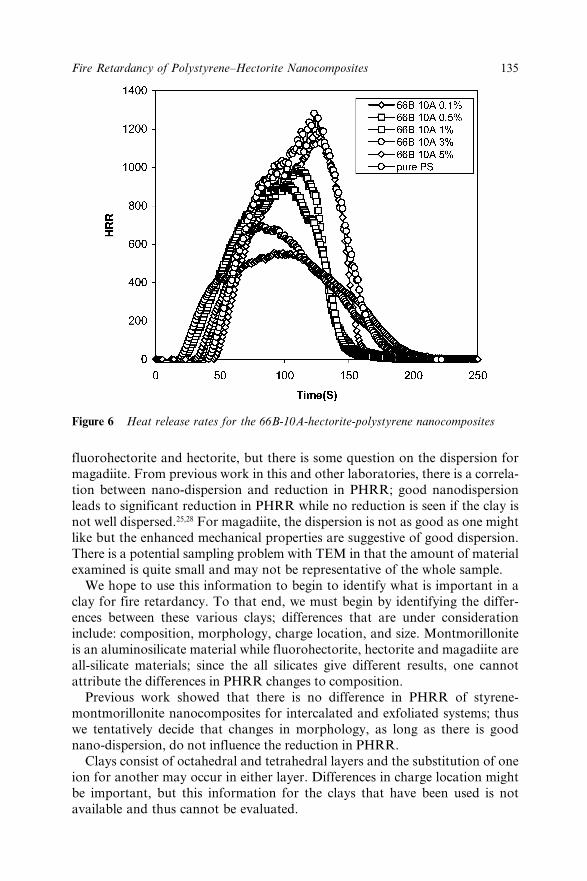
135Fire Retardancy of Polystyrene–Hectorite Nanocomposites
fluorohectorite and hectorite, but there is some question on the dispersion formagadiite. From previous work in this and other laboratories, there is a correla-tion between nano-dispersion and reduction in PHRR; good nanodispersionleads to significant reduction in PHRR while no reduction is seen if the clay isnot well dispersed.25,28 For magadiite, the dispersion is not as good as one mightlike but the enhanced mechanical properties are suggestive of good dispersion.There is a potential sampling problem with TEM in that the amount of materialexamined is quite small and may not be representative of the whole sample.
We hope to use this information to begin to identify what is important in aclay for fire retardancy. To that end, we must begin by identifying the differ-ences between these various clays; differences that are under considerationinclude: composition, morphology, charge location, and size. Montmorilloniteis an aluminosilicate material while fluorohectorite, hectorite and magadiite areall-silicate materials; since the all silicates give different results, one cannotattribute the differences in PHRR changes to composition.
Previous work showed that there is no difference in PHRR of styrene-montmorillonite nanocomposites for intercalated and exfoliated systems; thuswe tentatively decide that changes in morphology, as long as there is goodnano-dispersion, do not influence the reduction in PHRR.
Clays consist of octahedral and tetrahedral layers and the substitution of oneion for another may occur in either layer. Differences in charge location mightbe important, but this information for the clays that have been used is notavailable and thus cannot be evaluated.
Figure 6 Heat release rates for the 66B-10A-hectorite-polystyrene nanocomposites
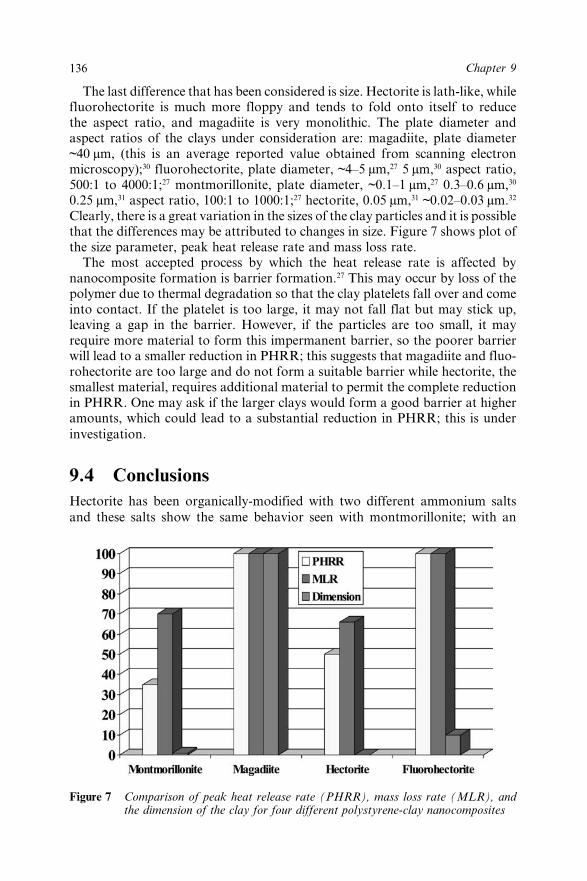
136 Chapter 9
The last difference that has been considered is size. Hectorite is lath-like, whilefluorohectorite is much more floppy and tends to fold onto itself to reducethe aspect ratio, and magadiite is very monolithic. The plate diameter andaspect ratios of the clays under consideration are: magadiite, plate diameter~40 µm, (this is an average reported value obtained from scanning electronmicroscopy);30 fluorohectorite, plate diameter, ~4–5 µm,27 5 µm,30 aspect ratio,500:1 to 4000:1;27 montmorillonite, plate diameter, ~0.1–1 µm,27 0.3–0.6 µm,30
0.25 µm,31 aspect ratio, 100:1 to 1000:1;27 hectorite, 0.05 µm,31 ~0.02–0.03 µm.32
Clearly, there is a great variation in the sizes of the clay particles and it is possiblethat the differences may be attributed to changes in size. Figure 7 shows plot ofthe size parameter, peak heat release rate and mass loss rate.
The most accepted process by which the heat release rate is affected bynanocomposite formation is barrier formation.27 This may occur by loss of thepolymer due to thermal degradation so that the clay platelets fall over and comeinto contact. If the platelet is too large, it may not fall flat but may stick up,leaving a gap in the barrier. However, if the particles are too small, it mayrequire more material to form this impermanent barrier, so the poorer barrierwill lead to a smaller reduction in PHRR; this suggests that magadiite and fluo-rohectorite are too large and do not form a suitable barrier while hectorite, thesmallest material, requires additional material to permit the complete reductionin PHRR. One may ask if the larger clays would form a good barrier at higheramounts, which could lead to a substantial reduction in PHRR; this is underinvestigation.
9.4 ConclusionsHectorite has been organically-modified with two different ammonium saltsand these salts show the same behavior seen with montmorillonite; with an
Figure 7 Comparison of peak heat release rate (PHRR), mass loss rate (MLR), andthe dimension of the clay for four different polystyrene-clay nanocomposites

137Fire Retardancy of Polystyrene–Hectorite Nanocomposites
ammonium salt that contains a styryl unit, exfoliation is observed. When thispolymerizable unit is absent, the result is intercalation. Hectorite appears tooffer similar thermal properties to montmorillonite but at higher amounts ofclay. The significant differences between various clays have been tentativelyattributed to differences in size. This is only a tentative conclusion and furtherwork is underway to further elucidate the reason for the differences. Based onthis and other work from this laboratory and others, it seems that nanocompositeformation alone will never lead to fire retardancy. Instead, it is felt that nano-composite formation may be one part of a combination of materials that can beused to achieve fire retardation. The role of the clay is likely to change the heatrelease rate curve but, more importantly, it will help achieve excellent mechani-cal properties that may be compromised by the addition of other components ofthe fire retardancy package. The choice of the clay will probably be made on thebasis of enhanced mechanical properties rather than because of some inherentfire retardant properties. Further work is underway to evaluate additional claysand combinations of clays with conventional fire retardants.
9.5 AcknowledgementThis work was performed under the sponsorship of the US Department ofCommence, National Institute of Standards and Technology, Grant Number70NANB6D0119.
9.6 References1. M. Alexandre and P. Dubois, Mater. Sci. Eng., 2000, R28, 1.2. E.P. Giannelis, R. Krishnamoorti and E. Manias, Adv. Polym. Sci., 1999,
138, 107.3. E.P. Giannelis, Adv. Mater., 1996, 8, 29.4. R.A. Vaia, K.D. Jandt, E.J. Kramer and E.P. Giannelis, Chem. Mater.,
1996, 8, 2628.5. D.A. Brune and J. Bicerano, Polymer, 2002, 42, 369.6. R.K. Bharadwaj, Macromolecules, 2001, 34, 9189.7. G. Lagaly, K. Beneke and A.Weiss, Am. Mineral., 1975, 60, 642.8. K. Beneke and G. Lagaly, Am. Mineral., 1977, 62, 763.9. K. Beneke and G. Lagaly, Am. Mineral., 1983, 68, 818.
10. Y. Sugahara, K. Sugimoto, T. Yanagisawa, Y. Nomizu, K. Kuroda andD. Kato, Yogyo Kyokai Shi, 1987, 95, 117.
11. Z. Wang, T. Lan and T.J. Pinnavaia, Chem. Mater., 1996, 8, 2200.12. D. Wang, D.D. Jiang, J. Pabst, Z. Han, J. Wang, and C.A. Wilkie, Polym.
Eng. Sci., 2004, 44, 1122.13. D. Garcia-Lopez, O. Picazo, J.C. Merino and J.M. Pastor, Eur. Polym.
J., 2003, 39, 945.14. C. Decker, K. Zahouily, L. Keller, S. Benfarhi, T. Bendaikha and
J. Baron, J. Mater. Sci., 2002, 37, 4831.

138 Chapter 9
15. X. Tong, H. Zhao, T. Tang, Z. Feng and B. Huang, J Polym. Sci.: Part A:Polym. Chem., 2002, 40, 1706.
16. Z. Shen, G.P. Simon and Y-B. Cheng, Polymer, 2002, 43, 4251.17. P. Dubois, M. Alexandre, and R. Jerome, Macromolecular Symposia
(Eurofillers’01 Conference, 2001), 2003, 194, 13.18. G. Sandi, K.A. Carrado, H. Joachin, W. Lu and J. Prakash, J. Power
Sources, 2003, 119–121, 492.19. D.W. Kim, A. Blumstein, J. Kumar and S.K. Tripathy, Polym. Mater.
Sci. Eng., 2001, 84,182.20. S-S. Hou and K.Schmidt-Rohr, Chem. Mater., 2003, 15, 1938.21. S-S. Hou, T.J. Bonagamba, F.L. Beyer, P.H. Madison and K. Schmidt-
Rohr, Macromolecules, 2003, 36, 2769.22. G. Sandi, H. Joachin, R. Kizilel, S. Seifert and K.A. Carrado, Chem.
Mater., 2003, 15, 838.23. J. Zhu, A.B. Morgan, F.J. Lamelas and C.A. Wilkie, Chem. Mater., 2001,
13, 3774.24. D. Wang, J. Zhu, Q. Yao and C.A. Wilkie, Chem. Mater., 2002, 14, 3837.25. J.W. Gilman, T. Kashiwagi, M. Nyden, J.E.T. Brown, C.L. Jackson
and S. Lomakin, in Chemistry and Technology of Polymer Additives, S.Al-Maliaka, A. Golovoy and C.A. Wilkie (eds.), Blackwell Scientific,London, 1998, pp. 249–65.
26. J. Zhu, F.M. Uhl, A.B. Morgan and C.A. Wilkie, Chem. Mater., 2001, 13,4649.
27. J.W. Gilman, C.L. Jackson, A.B. Morgan, R. Harris, Jr., E. Manias, E.P.Giannelis, M. Wuthenow, D. Hilton and S.H. Phillips, Chem. Mater.,2000, 12, 1866.
28. D. Wang, D.D. Jiang, J. Pabst and C.A. Wilkie, 2004, 10, 44.29. S. Su, D.D. Jiang and C.A. Wilkie, J. Vinyl Add. Technol., in press.30. J.S. Dailey and T.J. Pinnavaia, Chem. Mater., 1992, 4, 855.
H.O. Pastore, M. Munsignatti and A.J.S. Mascarenhas, Clay Clay Miner.,2000, 48, 224. K. Isoda, K. Kuroda and M. Ogawa, Chem. Mater., 2000,12, 1702. K. Kikuta, K. Ohta and K. Takagi, Chem. Mater., 2002, 14,3123.
31. J. Ren, B.F. Casanueva, C.A. Mitchell and R. Krishnamoorti, Macromol-ecules, 2003, 36, 4188.
32. S.-S. Hou and K. Schmidt-Rohr, Chem. Mater., 2003, 15, 1938.33. T. Kasawa, T. Murakami, N. Kohyama and T. Watanabe, Am. Mineral.,
2001, 86, 105.

139
CHAPTER 10
Pyrolysis and Flammability ofPolyurethane–Organophilic ClayNanocompositeGENNADY E. ZAIKOV,1 SERGEI M. LOMAKIN1 ANDROMAN A. SHEPTALIN2
1Institute of Biochemical Physics of Russian Academy of Sciences, 4 KosyginStreet, Moscow, 119991, Russia ([email protected])2D.I. Mendeleyev Russian Chemical-Technological University, Moscow,Russia
10.1 IntroductionPolymer layered silicate (clay) nanocomposites are materials with uniqueproperties when compared with conventional filled polymers. Polymer nano-composites, especially polymer-layered silicates, represent a new alternative toconventionally filled polymers.
New, more effective, and environmentally friendly flame resistance polymersare needed. Recent data on the combustion of polymer nanocomposites indicatethat they could be employed for this purpose.1
There are several proposed mechanisms as to how the layered silicate affects theflame retardant properties of polymers.1 The first is an increased char layer thatforms when nanocomposites are exposed to flame. This layer is thought to inhibitoxygen transport to the flame front, as well as gaseous-fuel transport from thepolymer and, therefore, reduces the heat release rate of the burning surface. Thismay interrupt the burning cycle as radical species are needed to break polymerchains into fuel-fragments. The disordered nanocomposites also inhibit oxygenand combustible “fuel” species transfer by increasing the path length of thesespecies to the flame front. There is also a high possibility of alumina-silicatesolid-phase catalysis of polymer decomposition, which can dramatically changethe overall scheme of thermal degradation process kinetics.
Polyurethane foam (PU) is a unique and most useful commercial polymericmaterial. In the present study, a polyurethane–organophilic montmorillonite
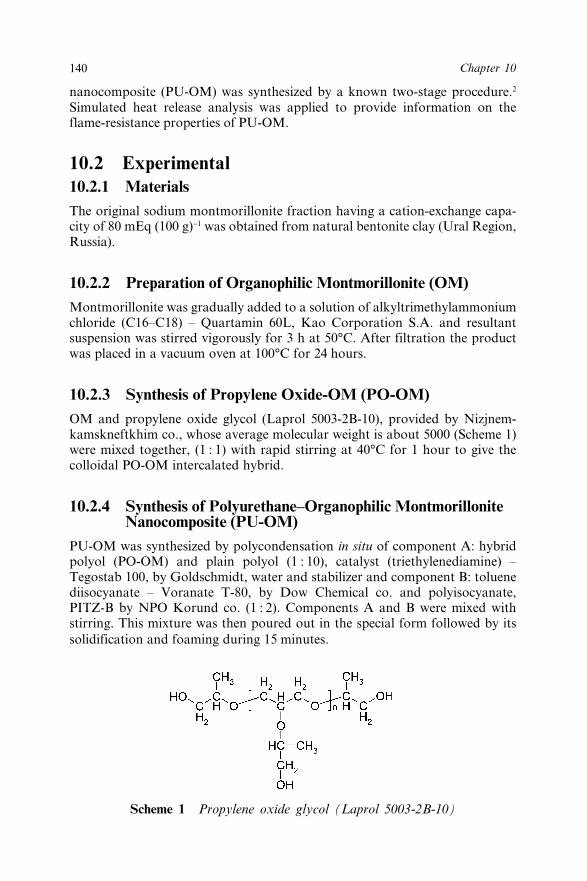
140 Chapter 10
nanocomposite (PU-OM) was synthesized by a known two-stage procedure.2
Simulated heat release analysis was applied to provide information on theflame-resistance properties of PU-OM.
10.2 Experimental10.2.1 MaterialsThe original sodium montmorillonite fraction having a cation-exchange capa-city of 80 mEq (100 g)−1 was obtained from natural bentonite clay (Ural Region,Russia).
10.2.2 Preparation of Organophilic Montmorillonite (OM)Montmorillonite was gradually added to a solution of alkyltrimethylammoniumchloride (C16–C18) – Quartamin 60L, Kao Corporation S.A. and resultantsuspension was stirred vigorously for 3 h at 50°C. After filtration the productwas placed in a vacuum oven at 100°C for 24 hours.
10.2.3 Synthesis of Propylene Oxide-OM (PO-OM)OM and propylene oxide glycol (Laprol 5003-2B-10), provided by Nizjnem-kamskneftkhim co., whose average molecular weight is about 5000 (Scheme 1)were mixed together, (1 : 1) with rapid stirring at 40°C for 1 hour to give thecolloidal PO-OM intercalated hybrid.
10.2.4 Synthesis of Polyurethane–Organophilic MontmorilloniteNanocomposite (PU-OM)
PU-OM was synthesized by polycondensation in situ of component A: hybridpolyol (PO-OM) and plain polyol (1 : 10), catalyst (triethylenediamine) –Tegostab 100, by Goldschmidt, water and stabilizer and component B: toluenediisocyanate – Voranate T-80, by Dow Chemical co. and polyisocyanate,PITZ-B by NPO Korund co. (1 : 2). Components A and B were mixed withstirring. This mixture was then poured out in the special form followed by itssolidification and foaming during 15 minutes.
Scheme 1 Propylene oxide glycol (Laprol 5003-2B-10)

141Pyrolysis and Flammability
10.2.5 XRD Characterization
X-Ray diffraction (XRD) analysis of OM, PO-OM and PU-OM was performedon a Philips diffractometer using CuKa radiation, (l = 0.1540562 nm). Themicrostructure of PU-OM nanocomposite was characterized using XRD. TheXRD patterns of OM and PU-OM, which reveal the intercalated structure ofOM and delaminated structure of PU-OM nanocomposite, are shown inFigure 1. The interlayer (basal) spacing (001) for the OM is 3.5 nm.
10.2.6 Pyrolysis
Extensive pyrolysis of PU and PU-OM/nanocomposite samples over a oneminute period was carried out in a laboratory model pyrolizer in an airatmosphere at 250 and 500°C. The oven temperature was monitored with athermocouple and a stability of ±5°C was attainable. Pyrolysis products weredissolved in hexane at 0°C.
10.2.7 Gas Chromatography/Mass Spectrometry (GC-MS)Analysis
GC-MS analysis of samples was performed using a “Varian 3300” gas chroma-tograph connected to a mass spectrometer detector (ion trap), “FinniganMAT ITD 800”. A DB-5 fused capillary column (0.32 mm × 30 m) temperatureprogrammed from 50 to 270°C at 10°C min−1 was used. Mass spectra detection
Figure 1 XRD patterns of OM and PU-OM delaminated nanocomposite: a – OM,b – PU-OM
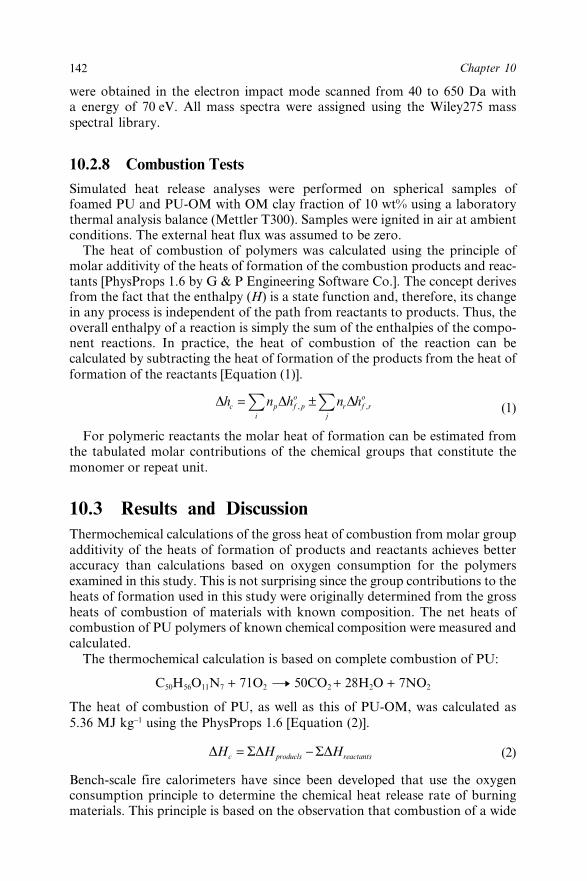
142 Chapter 10
were obtained in the electron impact mode scanned from 40 to 650 Da witha energy of 70 eV. All mass spectra were assigned using the Wiley275 massspectral library.
10.2.8 Combustion TestsSimulated heat release analyses were performed on spherical samples offoamed PU and PU-OM with OM clay fraction of 10 wt% using a laboratorythermal analysis balance (Mettler T300). Samples were ignited in air at ambientconditions. The external heat flux was assumed to be zero.
The heat of combustion of polymers was calculated using the principle ofmolar additivity of the heats of formation of the combustion products and reac-tants [PhysProps 1.6 by G & P Engineering Software Co.]. The concept derivesfrom the fact that the enthalpy (H) is a state function and, therefore, its changein any process is independent of the path from reactants to products. Thus, theoverall enthalpy of a reaction is simply the sum of the enthalpies of the compo-nent reactions. In practice, the heat of combustion of the reaction can becalculated by subtracting the heat of formation of the products from the heat offormation of the reactants [Equation (1)].
D D Dh n h n hc pi
f po
rj
f ro= ±∑ ∑, , (1)
For polymeric reactants the molar heat of formation can be estimated fromthe tabulated molar contributions of the chemical groups that constitute themonomer or repeat unit.
10.3 Results and DiscussionThermochemical calculations of the gross heat of combustion from molar groupadditivity of the heats of formation of products and reactants achieves betteraccuracy than calculations based on oxygen consumption for the polymersexamined in this study. This is not surprising since the group contributions to theheats of formation used in this study were originally determined from the grossheats of combustion of materials with known composition. The net heats ofcombustion of PU polymers of known chemical composition were measured andcalculated.
The thermochemical calculation is based on complete combustion of PU:
C50H56O11N7 + 71O2 { 50CO2 + 28H2O + 7NO2
The heat of combustion of PU, as well as this of PU-OM, was calculated as5.36 MJ kg−1 using the PhysProps 1.6 [Equation (2)].
D SD SDH H Hc producls reac ts= − tan (2)
Bench-scale fire calorimeters have since been developed that use the oxygenconsumption principle to determine the chemical heat release rate of burningmaterials. This principle is based on the observation that combustion of a wide

143Pyrolysis and Flammability
range of organic compounds and common polymers produces 13.1 ± 0.7 kJ ofheat per gram of diatomic oxygen consumed, independent of the chemicalcomposition of the organic material. The gases evolved during polymer decom-position are usually unknown and do not burn to completion in real fires.Oxygen consumption is a means of measuring heat release without detailedknowledge of the fuel species. Oxygen consumption calorimetry measures theheat released by the burning of volatile polymer decomposition products, the netheat of complete combustion of which can be written as in Equation (3),
DD D
hh h
c vo c p
oco
,, ,=
±
±
m
m
m
1(3)
where Dh°c,v, Dh°c,p, Dh°c,m are the heats of complete combustion for the volatiles,polymer and char, respectively, and m is the char fraction. The heat of com-bustion of the volatile fraction can differ significantly from that of the polymerand the char, so polymer heats of combustion should not be used to calculateflaming combustion efficiency of materials.
The experimentally observed minimum irradiance level, below which nosustained burning occurred, was approximately 20 kW m−2.3 The critical irradi-ance level derived from the experimental correlation was 12.6 kW m−2. Thedifference between the minimum and critical irradiance for this type of materialhas been explained by Janssens.4 At low irradiance levels, fuel volatiles areexhausted before the lower flammability limit is reached in the gas phase. Athigher irradiance levels, the minimum mass flux of volatiles to create flam-mable mixture is generated before fuel exhaustion. The ignition times for thepolyurethane foam were short (2–6 s). In Cone calorimeter tests the heat of com-bustion can be obtained as the ratio of heat release rate and mass loss rate,both measured in the Cone calorimeter. Our approach was based on simulatedheat release analysis, which operates with experimental mass loss data and thecalculated heat of combustion.
An empirical correlation is needed to relate bench-scale data to full-scaleresults. It is normally dealt with by normalizing the results by the exposedsurface area of the specimen. We have chosen the normalizing surface area as1 cm3 [Equation (4)],
. ( ) .q t qfull bench scale- -scale S(t)= q × (4)
where .qfull-scale is the total rate of heat release at any time t; . qqbench-scale is the bench-
scale heat release rate; S(t) is the area of the full-scale specimen that is at anytime ignited, covered with flames, but not yet burned out.
Figures 2 and 3 compare the results obtained for PU bench-scale combustiontests. The spherical samples of PU were ignited and mass loss data weremeasured during flaming out.
Similar results were obtained for PU-OM nanocomposite. The maximummass loss rate at 1 cm2 surface area of sample was obtained via approximatingthe maximum loss rate (PU and PU-OM) vs. time to an exponential equation(Figures 4 and 5).
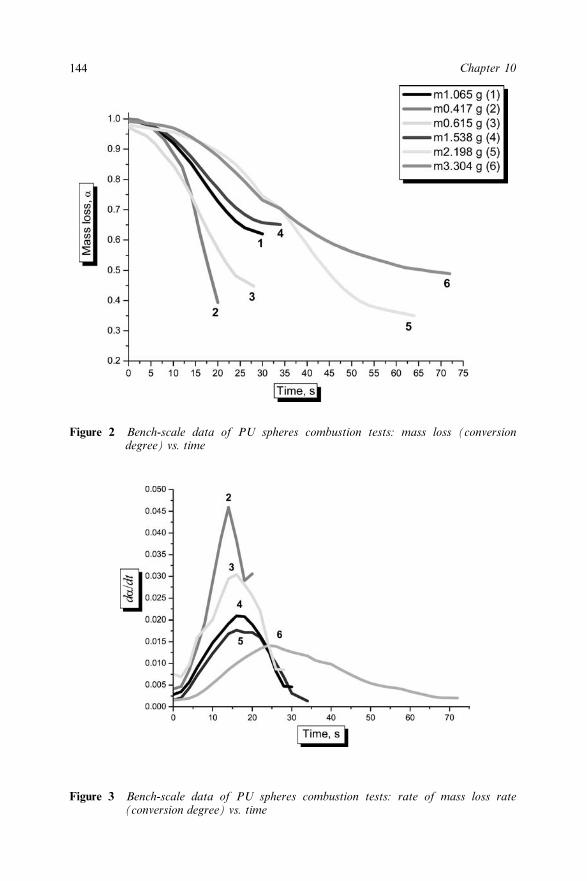
144 Chapter 10
Figure 2 Bench-scale data of PU spheres combustion tests: mass loss (conversiondegree) vs. time
Figure 3 Bench-scale data of PU spheres combustion tests: rate of mass loss rate(conversion degree) vs. time

145Pyrolysis and Flammability
The maximum heat release rates were estimated using Equation (5),
q mbench scale bench scale- -q q= . ×DHcombustion (5)
where .mqbench-scale is the bench-scale mass loss rate and DHcombustion is the effective heat
of combustion (kJ kg−1). Effective heats of combustion for PU and PU-OMnanocomposite were calculated using the PhysProps 1.6 software. Figure 6presents the maximum heat of release of PU and PU-OM nanocomposite. These
Figure 4 Approximation of maximum loss rate (PU) vs. time to an exponential equationy = a + bexp(−x/c)
Figure 5 Approximation of maximum loss rate (PU – OM nanocomposite, 10%) vs. timeto an exponential equation y = a + bexp(−x/c)

146 Chapter 10
data indicate about 40% relative improvement of PU-OM (10%) (nanocomposite)over the native PU maximum heat of release rate.
During the combustion test of the nanocomposite specimen, a carbon layerformed on its surface from the start, grew over time and resisted the heat.Formation of a carbonized layer on the surface of the polymer is a feature ofall nanocomposites studied so far: the pattern illustrated decomposition, whichcan dramatically change the overall scheme of thermal degradation processkinetics by way of solid-phase catalysis or by shifting the reaction mechanismfrom radical random-scission degradation to aromatization followed bycarbonization.
10.4 References1. J.W. Gilman, C.L. Jackson, A.B. Morgan and R. Harris Jr., Chem. Mater.,
2000, 12, 1866–1873.2. Y. Hu, L Song, J. Xu, L. Yang, Z.Chen and W. Fan, Colloid Polym. Sci.,
2001, 279, 819.3. O. Grexa, M. Janssens, “Wood & fire safety”, in Proceed. of 3rd Interna-
tional Scientific Conference, Ed. By A. Osvald, CSc., Nikara Publ.,Krupina, Slovak Republic, 1996, pp. 139.
4. M. Janssen, “Improved method of analysis for the LIFT apparatus – Part 1:ignition”, in Proceed. 2nd Fire & Materials Conference, Arlington, VA,September 23–24, 1993, Interscience Communication, London, pp. 37.
Figure 6 Maximum heat of release of PU and PU-OM nanocomposite
147
CHAPTER 11
Thermal Degradation Behaviourof Flame-Retardant UnsaturatedPolyester Resins IncorporatingFunctionalised NanoclaysBALJINDER K. KANDOLA, SHONALI NAZARE ANDA. RICHARD HORROCKS
Centre for Materials Research and Innovation, Bolton Institute, Deane Road,Bolton, BL3 5AB, UK ([email protected])
11.1 IntroductionRecent interest in the reported char-promoting behaviour of functionaliseddispersed nanoclays at levels of 2–5%, to yield nanocomposite structures havingimproved fire properties, has prompted investigation of their potential as fireretardants.1–4 The nanocomposite flame retardant mechanism is believed to bea consequence of high-performance carbonaceous-silicate char build-up onthe surface during burning.1 This insulates the underlying material and slowsthe mass loss rate of decomposition products. Unfortunately, however, thesenanocomposites on their own are not sufficient to reduce flammability of lowchar-forming polymers like polyesters to a significant and specified level. How-ever, when used with conventional flame retardants, their action may be syner-gistic in a way that less flame retardant is required as compared to the situationwhere nanoclays are not used. The other advantage is that nanoclays maintainand sometimes increase matrix mechanical properties while it is well knownthat any conventional additive in a polymer often reduces its mechanicalperformance.1–3,5
We have explored the effect of incorporating different types of organicallymodified clays in polyester resin with and without flame retardants (FR), such asammonium polyphosphate, melamine phosphate with and without dipentaery-thritol and alumina trihydrate. For polyester resins significant flame retardancyis observed only at FR concentrations greater than 20% (w/w).6,7 In the present
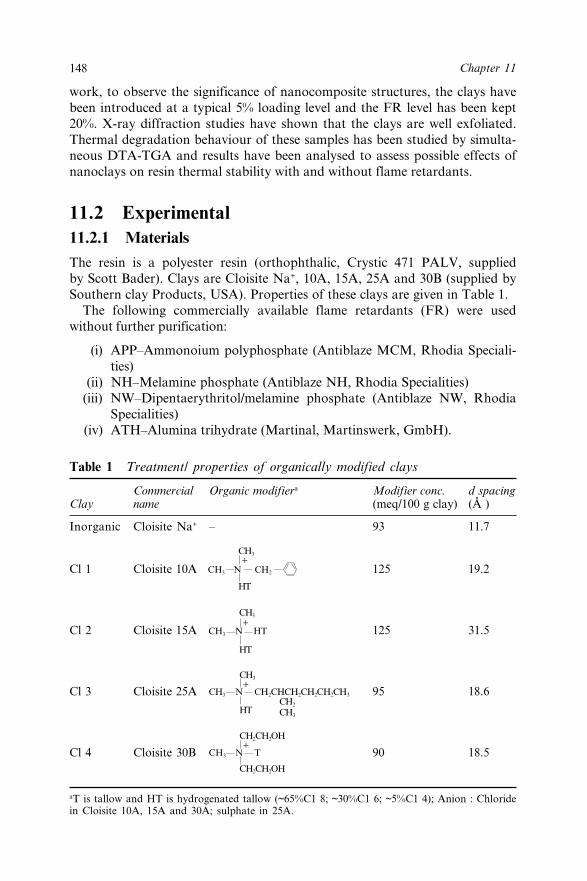
148 Chapter 11
work, to observe the significance of nanocomposite structures, the clays havebeen introduced at a typical 5% loading level and the FR level has been kept20%. X-ray diffraction studies have shown that the clays are well exfoliated.Thermal degradation behaviour of these samples has been studied by simulta-neous DTA-TGA and results have been analysed to assess possible effects ofnanoclays on resin thermal stability with and without flame retardants.
11.2 Experimental11.2.1 Materials
The resin is a polyester resin (orthophthalic, Crystic 471 PALV, suppliedby Scott Bader). Clays are Cloisite Na+, 10A, 15A, 25A and 30B (supplied bySouthern clay Products, USA). Properties of these clays are given in Table 1.
The following commercially available flame retardants (FR) were usedwithout further purification:
(i) APP–Ammonoium polyphosphate (Antiblaze MCM, Rhodia Speciali-ties)
(ii) NH–Melamine phosphate (Antiblaze NH, Rhodia Specialities)(iii) NW–Dipentaerythritol/melamine phosphate (Antiblaze NW, Rhodia
Specialities)(iv) ATH–Alumina trihydrate (Martinal, Martinswerk, GmbH).
Table 1 Treatment/ properties of organically modified clays
Commercial Organic modifiera Modifier conc. d spacingClay name (meq/100 g clay) (Å )
Inorganic Cloisite Na+ – 93 11.7
Cl 1 Cloisite 10A 125 19.2
Cl 2 Cloisite 15A 125 31.5
Cl 3 Cloisite 25A 95 18.6
Cl 4 Cloisite 30B 90 18.5
aT is tallow and HT is hydrogenated tallow (~65%C1 8; ~30%C1 6; ~5%C1 4); Anion : Chloridein Cloisite 10A, 15A and 30A; sulphate in 25A.
CH3+
CH3 N CH2
HT
CH3
+CH3 N HT
HT
CH3+
CH3 N CH2CHCH2CH2CH2CH3
HTCH2
CH3
CH2CH2OH+
CH3 N T
CH2CH2OH

149Thermal Degradation Polyester Resins Incorporating Functionalised Nanoclays
11.2.2 Preparation of Polyester–Clay Nanocomposites
Polyester–clay nanocomposites incorporating flame retardants have beenprepared by in situ intercalative polymerisation; 5% (w/w) clay was graduallyadded to the resin polyester resin, while stirring with a mechanical mixer underhigh shear (900 rpm). The mixing was carried out for 60 min at room tempera-ture. For samples incorporating flame retardants, 20% (with respect to resin-clay mixture) of the respective flame retardant was added to the mixture of resinand clay after 20 min of mixing. The percentages of various components in theformulations are given in Table 2. Small amounts of samples were taken fromthe mixture for simultaneous DTA-TGA analysis before the catalyst was addedand laminates were cast and cured at room temperature for further flammabilitytesting (to be discussed in further publications).
The nanocomposite structures were characterised by X-ray diffraction, XRD,in the laboratories of the National Institute of Standards and Testing (NIST),USA.
11.2.3 Equipment
Simultaneous DTA-TGA analysis was performed using SDT 2960 TA instru-ments under flowing air (100 ml min−1) and at a heating rate of 10 K min−1 on25 mg sample masses.
11.3 Results and DiscussionThe nanocomposite formation has been studied by X-ray diffraction measure-ments. In the diffraction curves for pure clays, a prominent peak in each curvecorresponding to basal spacing of respective clays occur at d-spacings as shownin Table 1. This reflection is missing in the scattering curves of all the polyester-clay nanocomposites, irrespective of the presence of flame retardant, confirmingthe presence of nanocomposite structures. While detailed XRD analysis will bepresented in a separate publication, here representative diffraction curves forclays Cloisite Na+ and 25A, polyester resin with APP and resin-Cloisite 25Awith and without APP are given in Figure 1. Cloisite 25A shows a peak at 2h of4.8° [Figure 1(a)], representing a d-spacing of 18.6 Å (Table 1), which is missingin Res/Cl 3 and Res/Cl 3/APP formulations in Figure 1(b).
Table 2 Weight percentages of various components in the formulations
Sample Resin FR Clay
Res – Resin 100 – –Res/Cl – Resin + Clay 95 – 5Res/FR – Resin + FR 83 17 –Res/Cl/FR – Resin + Clay + FR 79 17 4

150 Chapter 11
Figure 1 XRD data for (a) Cloisite Na+, 25A (Cl 3) clays and (b) polyester resin withAPP, resin-Cl 3 nanocomposite with and without APP
11.3.1 Thermal Degradation of Clays
DTA and DTG peak maxima for all organically modified clays used in thiswork are given in Figure 2 and Table 3. Although Na-montmorillonite was notdispersed in polyester resin, its thermal analytical behaviour is discussed herefor comparison with other organically modified clays. Na-montmorilloniteshows very little weight loss [Figure 2(a)] and high residues at 800°C. In themain the DTA response is featureless [Figure 2(b)] showing inertness ofinorganic clay, however there are two very broad and small endotherms withmaxima at 78 and 663°C. All organically modified clays, however, show twostages of weight loss, the first represented by double peaked (in the temperature

151Thermal Degradation Polyester Resins Incorporating Functionalised Nanoclays
range of 235–293 and 307–348°C) and the second by single peaked DTGmaxima (575–605°C) shown in Table 3. The first stages are most probably dueto decomposition of the respective organic components of the clays and thesecond single one due to dehydroxylation of the clay layers.8 Residues at 800°Cin Table 3 represent residual silica contents. These two stages of weight loss arealso supported by DTA curves, where all organically modified clays showexotherms. The first exotherm is double peaked with the first maxima in the
Figure 2 TGA (a) and DTA (b) responses for all clays in air

152 Chapter 11
Table 3 Analysis of DTA responses (peak temp °C), DTG maxima (°C) and %mass residue of unsaturated polyester resin formulations under flowingair
% Mass residue
Samples DTA peaks(°C) DTG peaks(°C) 600°C 800°C
ClaysNa+ 78 En(b); 663 En(b) 76, 665 91 88Cl 1 347 Ex; 633 Ex (s,b) 235, 348; 597 68 62Cl 2 264 (s), 354 Ex(d); 545 Ex (s,b) 260, 307; 575 63 56Cl 3 258 (s), 351 Ex (d); 626 Ex (s,b) 293, 341; 603 73 66Cl 4 270 (s), 345 Ex (d); 630 Ex (s,b) 263, 335; 605 77 67Resin 131 Ex(s,b); 313 (s), 365 Ex (d); 201, 360, 554 1.1 1
552 ExResin /claysRes/Cl 1 163 En (s); 307 Ex; 338 En; 161, 338, 567 4 4
532 ExRes/Cl 2 158 En (s), 310 Ex; 338 En; 156, 337, 533 4 4
524 ExRes/Cl 3 159 En (s); 302 Ex; 340 En; 157, 338, 531 6 5
519 ExRes/Cl 4 154 En; 292 Ex; 333 En; 147, 330, 533 6 5
528 ExFlame retardantsAPP 96 En (s); 173 En (s); 330 En; 331, 655 62 8
669 ExNH 267 En; 302 En; 386 En; 267, 305, 383, 41 18
Exo baseline deviation – 472, 573, 740529, 756 (b)
NW 118 En (s); 221 En; 241 120, 238, 341, 32 1En: 328 Ex; 393 En; 492 Ex; 389, 653665 Ex
ATH 93 En (s); 242 (s), 308 En (d); 237, 302, 520 66 65520 En (s,b)
Resin/FRs and/orclaysRes/APP 320 En, 346 Ex (s), 382 Ex; 317, 372, 699 30 3
696ExRes/Cl 3/APP 146 En (s); 290 Ex; 313 En; 155, 312, 745 23 15
351, 455, 530 Ex(t); 712 Ex(b)Res/NH 266 En; 297 Ex; 313 En; 323 69, 306, 800 16 7
Ex; 528 Ex; 795 Ex; 846 ExRes/Cl 3/NH 174 En; 257 En; 312 En, 169, 310, 610 16 9
323 Ex; 588 ExRes/NW 204 En; 250 En; 312 En; 331 135, 311, 537, 16 7
Ex; 530 Ex; 815 Ex 801Res Cl 3/NW 155 En; 251 En; 306 En; 329 151, 310, 613 15 7
Ex; 458, 588 Ex (d)Res/ATH 164 En; 243 En; 330 En; 66, 160, 326, 12 12
382 Ex (s); 518 Ex 348, 518Res/Cl 3/ATH 150 En (s); 247 En; 288 Ex; 146, 150, 324, 15 15
326 En; 377 (s); 389(s); 490 Ex 350, 374, 504
En = endotherm; Ex = exotherm; b = broad; d = double peaked; s = small.
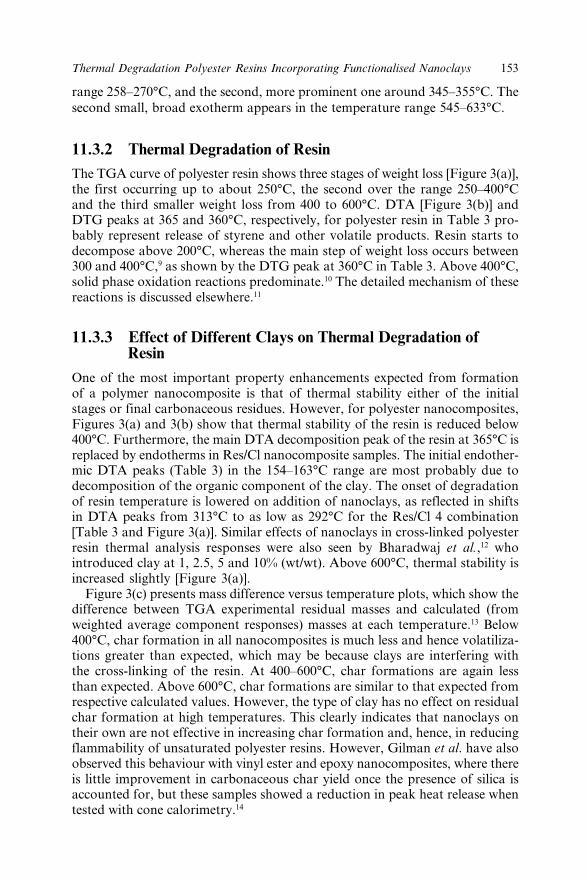
153Thermal Degradation Polyester Resins Incorporating Functionalised Nanoclays
range 258–270°C, and the second, more prominent one around 345–355°C. Thesecond small, broad exotherm appears in the temperature range 545–633°C.
11.3.2 Thermal Degradation of ResinThe TGA curve of polyester resin shows three stages of weight loss [Figure 3(a)],the first occurring up to about 250°C, the second over the range 250–400°Cand the third smaller weight loss from 400 to 600°C. DTA [Figure 3(b)] andDTG peaks at 365 and 360°C, respectively, for polyester resin in Table 3 pro-bably represent release of styrene and other volatile products. Resin starts todecompose above 200°C, whereas the main step of weight loss occurs between300 and 400°C,9 as shown by the DTG peak at 360°C in Table 3. Above 400°C,solid phase oxidation reactions predominate.10 The detailed mechanism of thesereactions is discussed elsewhere.11
11.3.3 Effect of Different Clays on Thermal Degradation ofResin
One of the most important property enhancements expected from formationof a polymer nanocomposite is that of thermal stability either of the initialstages or final carbonaceous residues. However, for polyester nanocomposites,Figures 3(a) and 3(b) show that thermal stability of the resin is reduced below400°C. Furthermore, the main DTA decomposition peak of the resin at 365°C isreplaced by endotherms in Res/Cl nanocomposite samples. The initial endother-mic DTA peaks (Table 3) in the 154–163°C range are most probably due todecomposition of the organic component of the clay. The onset of degradationof resin temperature is lowered on addition of nanoclays, as reflected in shiftsin DTA peaks from 313°C to as low as 292°C for the Res/Cl 4 combination[Table 3 and Figure 3(a)]. Similar effects of nanoclays in cross-linked polyesterresin thermal analysis responses were also seen by Bharadwaj et al.,12 whointroduced clay at 1, 2.5, 5 and 10% (wt/wt). Above 600°C, thermal stability isincreased slightly [Figure 3(a)].
Figure 3(c) presents mass difference versus temperature plots, which show thedifference between TGA experimental residual masses and calculated (fromweighted average component responses) masses at each temperature.13 Below400°C, char formation in all nanocomposites is much less and hence volatiliza-tions greater than expected, which may be because clays are interfering withthe cross-linking of the resin. At 400–600°C, char formations are again lessthan expected. Above 600°C, char formations are similar to that expected fromrespective calculated values. However, the type of clay has no effect on residualchar formation at high temperatures. This clearly indicates that nanoclays ontheir own are not effective in increasing char formation and, hence, in reducingflammability of unsaturated polyester resins. However, Gilman et al. have alsoobserved this behaviour with vinyl ester and epoxy nanocomposites, where thereis little improvement in carbonaceous char yield once the presence of silica isaccounted for, but these samples showed a reduction in peak heat release whentested with cone calorimetry.14
154 Chapter 11
Figure 3 TGA (a) and DTA (b) responses in air; percentage residual mass differences(actual − calculated) as function of temperature (c) for different resin – claynanocomposites

155Thermal Degradation Polyester Resins Incorporating Functionalised Nanoclays
11.3.4 Effect of Flame Retardants on Thermal Degradation ofPolyester Resin
TGA curves of resin with all flame retardants are given in Figure 4(a); DTAand DTG peaks are given in Table 3. All flame retardants affect the thermaldegradation mechanism of the resin. Thermal degradation mechanisms of
Figure 4 TGA responses in air (a) and percentage residual mass differences (actual−calculated) as a function of temperature (b) for resin with different flameretardants

156 Chapter 11
ammonium polyphosphate, melamine phosphate with and without dipentaery-thritol have been discussed in previous communications,15 where all of themshow endothermic decomposition peaks. APP starts decomposing just aftermelting at 210°C, releasing ammonia and phosphoric acid, and then poly-merises to polyphosphoric acid, which at higher temperatures decomposes toP2O5. These reactions are represented by an endothermic peak at 330°C andexothermic peak at 669°C, respectively (Table 3). Melamine phosphate decom-poses over the temperature range 250–380°C, forming melamine pyrophosphateand polyphosphate at about 280 and 310°C,15 decomposing further in thetemperature range 330–410°C, releasing melamine, ammonia and water,16
as shown by endothermic peaks at 267, 302 and 386°C. In Antiblaze NW,dipentaeythritol melts at about 125°C and reacts with melamine phosphate,forming polyol phosphate. Antiblaze NW also shows a series of endothermicpeaks at 118, 221, 241, 393°C, followed by exothermic peaks at 492 and 665°C.ATH decomposes at 180–340°C with a series of endothermic peaks at 93°C,double peaked at 242 (small) and 308°C (main peak), followed by small, broadpeak at 520°C (Table 3), due to release of water and subsequent decomposition.
All of these flame retardants are, therefore, decomposing in the temperaturerange 200–300°C, and so offer the chance of interacting with the cross-linkingpolyester resin. This is seen by changes in weight loss in this temperaturerange by TGA curves in Figure 4(a) and DTA peaks in Table 3. Ammoniumpolyphosphate enhances the thermal stability of resin, whereas, melamine phos-phate with and without dipentaerythritol and alumina trihydrate, decreases itsthermal stability, showing more weight loss in this temperature range. However,above 400°C, all flame retardants enhance residual levels and hence thermalstability. APP is seen to be the most effective char promoter up to 700°C, afterwhich the char oxidises. Alumina trihydrate shows superior behaviour abovethis latter temperature and even at 800°C 12% char is left behind (Table 3),which is expected to be residual alumina. When the char difference betweenactual and calculated values are plotted in Figure 4(b), all the observationsdiscussed above are clearly seen, except that APP does not produce more thanexpected char formation below 400°C, as previously observed in Figure 4(a).ATH also produces more than expected char above 400°C, showing that this isnot acting just like a filler, but as a reactive flame retardant.
11.3.5 Effect of Clays on Thermal Degradation ofFlame Retarded Resin
Although all the resin clay nanocomposites were studied with different flameretardants present, only the results of Cloisite 25A (Cl 3) are presented here.Figure 5(a) shows that clay is effective with the resin-APP mixture in changingthermal degradation, making it less stable than the Res/Cl mixture at lowertemperatures and producing more char above 500°C, as seen from Table 3 andin the absence of nanoclay in Figure 4(a). Clay addition has less effect on resincontaining melamine phosphate with and without dipentaerythtritol, as can beseen by comparing Figures 4(a) and 5(a), whereas, with alumina trihydrate,
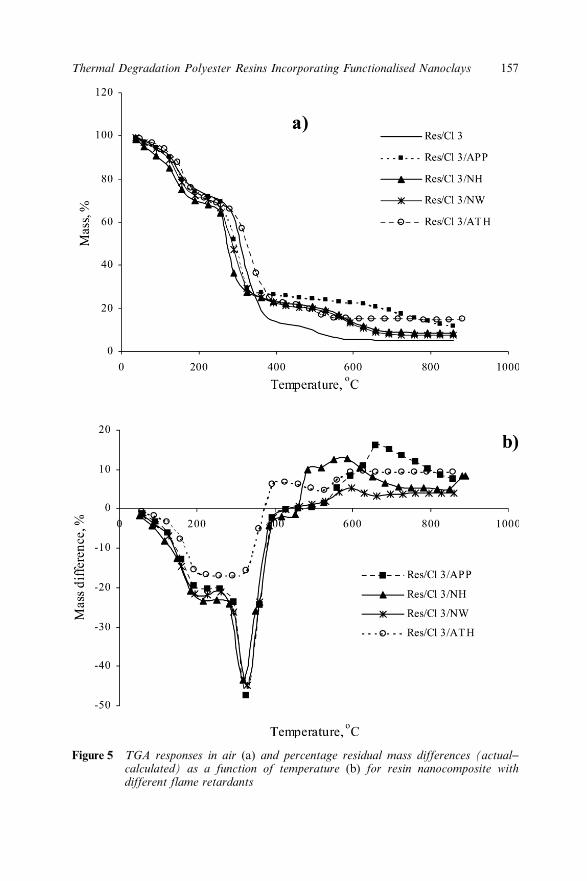
157Thermal Degradation Polyester Resins Incorporating Functionalised Nanoclays
Figure 5 TGA responses in air (a) and percentage residual mass differences (actual−calculated) as a function of temperature (b) for resin nanocomposite withdifferent flame retardants

158 Chapter 11
char formation is increased above 600°C. This effect can also be seen inFigure 5(b), where differential curves are very similar in the range 100–400°C.Clearly, clay with ammonium polyphosphate is the most effective of the samplesstudied to enhance char formation, yielding above 10% at 700°C. However,this enhanced char is less than that seen for APP alone in Figure 4(b). Thisis in contrast to what is expected from such structures for other polymer –nanocomposites.2
Figure 6 shows the effect of clay on the Res/FR systems by subtractingRes/FR char difference values [Figure 4(b)] from Res/Cl 3/FR [Figure 5(b)]. Itcan be seen that clay reduces char formation tendency of Res/APP system up to700°C and then it is increased up to 5%. In the presence of melamine phosphateclay further increases char at 450–700°C. However, when both melamine phos-phate and dipentaerythritol are present, char formation tendency is reduced.Clay addition enhances the charring tendency of resin in the presence of ATH inthe temperature range 200–400°C and above 600°C.
Most work in the area of polymer nanocomposite flame retardancy has beenin thermoplastics, where it is proposed that a reduction in heat release (flam-mability) and, hence, an increase in thermal stability is due to formation of aprotective surface barrier/insulation layer consisting of accumulated silicaplatelets with a small amount of carbonaceous char.17,18 The accumulation orprecipitation of silicate layers on the surface is due to gradual degradation andgasification of the polymer. However, according to Lewin19 the layered silicatesare dispersed and not dissolved in the polymer and should not precipitateas a consequence of the progressive gasification of the polymer. Lewin haspostulated that this migration is driven by the lower surface free energy ofthe montmorillonite and by convection forces, arising from the temperature
Figure 6 Effect of Cloisite 25 A clay: percentage residual mass differences between Res/Cl 3/FR [Figure5(b)] and Res/FR samples [Figure 4(b)]

159Thermal Degradation Polyester Resins Incorporating Functionalised Nanoclays
gradients, perhaps aided by movement of gas bubbles present during melting ofthe thermoplastic polymers. Alternative or even additional mechanisms includetheir presence as dispersed barriers to diffusion of molten polymer and decom-posing products including release of combustible gases as well as diffusion ofair and heat by convection. Each of these permeabilities contributes to the FReffectivity of the charred surface.19 Clearly, such complex mechanisms couldinteract, positively or negatively, with flame retardants also present and theevidence above suggests that both possibilities exist with the polyester resinused.
11.4 ConclusionsIn unsaturated polyester resin nanocomposites, nanoclays reduce thermal stabil-ity and char formation tendency of the resin up to 600°C and after that there isno observed change. Different condensed phase active flame retardants increasechar formation of the resin above 400°C. When nanoclays are added, char for-mation is not greatly affected and in fact for APP-containing resins it is reduced.Clearly, for unsaturated polyester resin some char consolidating agent/group isrequired and work is ongoing in this area in our laboratories.
However, thermal analysis techniques are not representative of the real firesituation. Consequently, the effect of these nanoclays on resin fire performancewith and without flame retardants in cone calorimetry is presented in a separatepublication,20 where their mechanical properties are also evaluated.
11.5 AcknowledgementsThe authors acknowledge the financial support from the Engineering and Physi-cal Science Research Council during this work. They also thank the NationalInstitute of Standards and Technology (NIST), USA and in particular Dr JeffreyW. Gilman for technical and financial support.
11.6 References1. J.W. Gilman, and T. Kashiwagi, in Polymer–clay Nanocomposites, T.J.
Pinnavaia and G.W. Beall (eds.), John Wiley & Sons Ltd, New York, 2000,Chapter 10.
2. B.K. Kandola, in Fire Retardant Materials, A.R. Horrocks and D. Price(eds.), Woodhead Publishing, Cambridge, U.K., 2001, Chapter 6.
3. J. Lee, T. Takekoshi and E.P. Giannelis, Mater. Res., Soc., Symp. Proc.,1997, 457, 513–518.
4. E.P. Giannelis, Adv. Mater., 1996, 8(1), 29.5. Y. Kojima, A. Usuki, M. Kawasumi, A. Okada, Y. Fakushima, T.
Kurauchi and O. Kamigaito, J. Mater. Res., 1993, 8, 1185–1189.6. F. Le Lay and J. Gutierrez, Polym. Degrad. Stab., 1999, 54, 397–401.7. A. Hernangil, M. Rodriguez, L.M. Leon, J. Ballestero and J.R. Alonso,
J. Fire Sci., 1999, 17, 281–306.

160 Chapter 11
8. K.P. Pramoda, T. Liu, Z. Liu, C. He and H.-J. Sue, Polym. Degrad. Stab.,2003, 81, 47–56.
9. S.V. Levchik, in Fundamentals, International Plastics Flammability Hand-book, 3rd Edn, M. Le Bras, S. Bourbigot and J. Troitzsch (eds.), HanserPub., Munich, 2004, pp. 83–98.
10. G.S. Learmonth and A. Nesbit, Br. Polym. J., 1972, 4, 317–325.11. B.K. Kandola, A.R. Horrocks, P. Myler and D. Blair, in Fire and Poly-
mers, G.L. Nelson and C.A. Wilkie (eds.), ACS Symp. Ser., 2001, Volume797, 344–360.
12. R.K. Bharadwaj, A.R. Mehrabi, C. Hamilton, C. Trujillo, M. Murga,R. Fan, A. Chavira and A.K. Thompson, Polymer, 2002, 43, 3699–3705.
13. B.K. Kandola, S. Horrocks and A.R. Horrocks, Thermochim. Acta, 1997,294, 113–125.
14. J.W. Gilman, T. Kashiwagi, M. Nyden, J.E.T. Brown, C.L. Jackson,S. Lomakin, E.P. Giannelis and E. Manias, in Chemistry and Technologyof Polymer Additives, S. Al-Malaika, A. Golovoy and C.A. Wilkie (eds.),Blackwell Science, Oxford, UK, 1999, Chapter 14.
15. B.K. Kandola and A.R. Horrocks, Polym. Degrad. Stab. 1996, 54,289–303.
16. G. Camino, M.P. Luda and L. Costa, in Recent Advances in FlameRetardancy of Polymeric Materials, M. Lewin (ed.), (Proceedings of the1993 Conference), BCC Company, Stamford, CT, 1993, Volume IV. p. 12.
17. J.W. Gilman, Appl. Clay Sci., 1999, 15, 31–49.18. A.B. Morgan, R.H. Jr. Harris, T. Kashiwagi, L.R. Chyall and J.W.
Gilman, Fire Mater., 2002, 26, 247–253.19. M. Lewin, Fire Mater., 2003, 27, 1–7.20. B.K. Kandola, S. Nazare and A.R. Horrocks, presented at 228th ACS
National Meeting, Philadelphia, PA, USA, August 22–26, 2004.

161
CHAPTER 12
Comparative Study of Nano-effect on Fire Retardancy ofPolymer–Graphite OxideNanocompositesJIANQI WANG AND ZHIDONG HAN
National Laboratory of Flame Retardant Materials, School of MaterialsScience & Engineering, Beijing Institute of Technology, 100081 Beijing,China ([email protected])
12.1 IntroductionNanocomposite technology originated in the 1980s at Toyota’s central R & DLaboratories in Japan.1 Research focused on nylon nanocomposites and manypatents on related products were published. Updated development work suggeststhat nanocomposites are a unique class of materials having significant improve-ments in important properties like modulus, flexural strength and heat distortiontemperature.
The ability of nanoclay incorporation to reduce the flammability of poly-meric materials was first reported by Gilman et al.2 Particularly, heat releaserate, obtained from cone calorimetry experiments, was found to be decreasedsubstantially by nanoclay incorporation at loadings as low as 2–5 wt%.
Cone calorimetry has become the most important methodology in flam-mability tests, and is very often used in polymer-layered silicate (PLS) nano-composites and recently carbon nanotube composites.3 However, the limitingoxygen index (LOI), a different fire model, capable of evaluating the fireextinction, is popularly adopted because of its precision and its excellentreproducibility.
Graphite oxide (GO) samples were first prepared by the Hummers method in1958.4 GOs have been prepared and characterized GO5,6 and polymer/graphiteoxide intercalated and exfoliated nanocomposite have been obtained7–11 withthe help of the polar nature of GO attached with various functional groups, e.g.
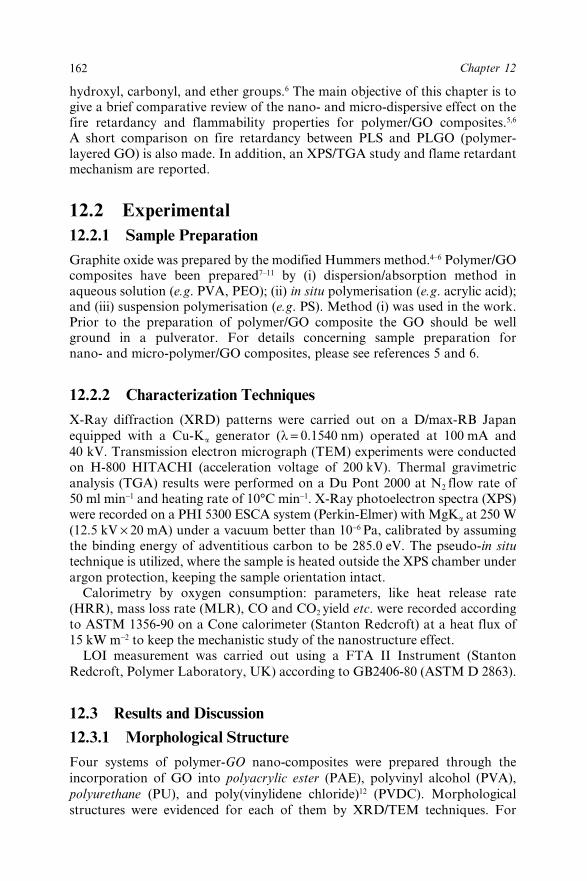
162 Chapter 12
hydroxyl, carbonyl, and ether groups.6 The main objective of this chapter is togive a brief comparative review of the nano- and micro-dispersive effect on thefire retardancy and flammability properties for polymer/GO composites.5,6
A short comparison on fire retardancy between PLS and PLGO (polymer-layered GO) is also made. In addition, an XPS/TGA study and flame retardantmechanism are reported.
12.2 Experimental12.2.1 Sample PreparationGraphite oxide was prepared by the modified Hummers method.4–6 Polymer/GOcomposites have been prepared7–11 by (i) dispersion/absorption method inaqueous solution (e.g. PVA, PEO); (ii) in situ polymerisation (e.g. acrylic acid);and (iii) suspension polymerisation (e.g. PS). Method (i) was used in the work.Prior to the preparation of polymer/GO composite the GO should be wellground in a pulverator. For details concerning sample preparation fornano- and micro-polymer/GO composites, please see references 5 and 6.
12.2.2 Characterization Techniques
X-Ray diffraction (XRD) patterns were carried out on a D/max-RB Japanequipped with a Cu-Ka generator (l = 0.1540 nm) operated at 100 mA and40 kV. Transmission electron micrograph (TEM) experiments were conductedon H-800 HITACHI (acceleration voltage of 200 kV). Thermal gravimetricanalysis (TGA) results were performed on a Du Pont 2000 at N2 flow rate of50 ml min−1 and heating rate of 10°C min−1. X-Ray photoelectron spectra (XPS)were recorded on a PHI 5300 ESCA system (Perkin-Elmer) with MgKa at 250 W(12.5 kV × 20 mA) under a vacuum better than 10−6 Pa, calibrated by assumingthe binding energy of adventitious carbon to be 285.0 eV. The pseudo-in situtechnique is utilized, where the sample is heated outside the XPS chamber underargon protection, keeping the sample orientation intact.
Calorimetry by oxygen consumption: parameters, like heat release rate(HRR), mass loss rate (MLR), CO and CO2 yield etc. were recorded accordingto ASTM 1356-90 on a Cone calorimeter (Stanton Redcroft) at a heat flux of15 kW m−2 to keep the mechanistic study of the nanostructure effect.
LOI measurement was carried out using a FTA II Instrument (StantonRedcroft, Polymer Laboratory, UK) according to GB2406-80 (ASTM D 2863).
12.3 Results and Discussion
12.3.1 Morphological Structure
Four systems of polymer-GO nano-composites were prepared through theincorporation of GO into polyacrylic ester (PAE), polyvinyl alcohol (PVA),polyurethane (PU), and poly(vinylidene chloride)12 (PVDC). Morphologicalstructures were evidenced for each of them by XRD/TEM techniques. For

163Comparative Study Polymer–Graphite Oxide Nanocomposites
brevity, only the XRD/TEM of PAE, nano-PAE/GO and PVDC, nano-PVDC/GO are presented (Figures 1 to 4).
XRD analysis reveals the disappearance of the layered spacing of GOs(d = 0.81 nm at 2h = 10.9°) in both PAE/GO(5%) and PVDC/GO(5%) nano-composites (Figures 1 and 2). TEM images (Figures 3 and 4) confirm theexfoliated structure of the nanocomposites. PAE-10, -15, and -20 nano-composites were prepared similarly as nano-PAE-5. Distinct peaks show up inXRD spectra, which verify the formation of nanostructures when adding acertain amount of GO.12
12.3.2 Fire Retardancy
LOI measurement – To evaluate the self-extinguishing power, the LOI fornano- and micro-PAE/GO composites was measured as a function of GO level
Figure 2 XRD patterns of PVDC, GO and nano-PVDC/GO(5%) nanocomposite
Figure 1 XRD spectra of PAE, GO and nano-PAE/GO(5%) nanocomposite

164 Chapter 12
Figure 3 TEM images of nano-PAE/GO(5%) nanocomposite
Figure 4 TEM image of nano-PVDC/GO(5%) nanocomposite
(Tables 1 and 2). Compared to micro-composite, the LOI of PAE/GO nano-composites jumps from 18.8 to 24.6% (Tables 1 and 2). We will focus oursubsequent discussion on this aspect.
The separation of ~6.0 unit induced here by nano-effect demonstrates a biggap when compared to the polymer–silicate nanocomposites. LOIs of tradi-tional polymer–silicate nanocomposites usually remain unchanged compared tovirgin polymers.12 Our laboratory found that neither polymer layered silicate(e.g. MMT) nanocomposites nor nano-particulates (e.g. TiO2)13 have a reallystrong dependence of LOI on the level of nano-filler.
The difference in LOI between nano- and micro-composites, i.e. (LOI)nano –(LOI)micro, (Figure 5) as a function of GO %, can reasonably be attributable to

165Comparative Study Polymer–Graphite Oxide Nanocomposites
Table 1 LOI for nano-PAE/GO composites as function of the GO level
Sample GO (%) LOI (%) Da D (GO%)b
PAE 0 18.8 0 0Nano-PAE-2 2 22.2 3.4 1.7Nano-PAE-5 5 23.3 4.5 0.9Nano-PAE-10 10 24.5 5.7 0.6Nano-PAE-15 15 24.6 5.8 0.4Nano-PAE-20 20 24.6 5.8 0.3
aLOI increment for nano-PAE/GO relative to PAE; bD divided by GO (%).
Table 2 LOIs for micro-PAE/GO composites as function of GO level
Sample GO (%) LOI (%) Da D (GO%)b
PAE 0 18.8 0 0Micro-PAE-2 2 19.0 0.2 0.10Micro-PAE-5 5 19.3 0.5 0.10Micro-PAE-10 10 19.6 0.8 0.08Micro-PAE-15 15 19.8 1.0 0.07Micro-PAE-20 20 20.0 1.2 0.06
aLOI increment for nano-PAE/GO relative to PAE; bD divided by GO (%).
the nano-effect. All GO-containing systems exhibit similar behaviour, except forPVDC/GO.
The nano-effect has also been verified by the horizontal burning rate (HBR)test (not shown here, for details see reference 12). It again shows that one can notnecessarily predict the coherence among a variety of fire models that impact
Figure 5 [(LOI)nano – (LOI)micro] vs. GO level for systems of PAE/GO, PU/GO, PVA/GO, PVDC/GO

166 Chapter 12
on the fire retardance of materials. Nevertheless, each fire model gives someinformation as well as a significance of their own.
Cone calorimetry – Calorimetry data for PAE/GO (5% mass fraction), as anexample, are given in Figure 6 and Table 3.
Cone data (p-HRR, TTI, TSR and p-CO yield) shown in Figure 6 andTable 3 reveal that PAE/GO nano-composites have significantly better flamma-bility properties than PAE/GO micro-composites and than the virgin PAE.
Regarding the influence of the nano-effect on the burning behaviour, conedata at higher heat fluxes (25 and 35 kW m−2) were also recoded.14 Thenano-effect of PVDC/GO(5%) based on cone experiments is shown in Table 4.
Figure 6 Cone data of PAE/GO(5%) systems (15 kW m−2): (a) Heat release rate; (b)smoke production rate; (c) mass loss rate; (d) efficient heat of combustion; (e)CO yield; (f) CO2 yield (external heat flux 15 kW m−2)

167Comparative Study Polymer–Graphite Oxide Nanocomposites
12.3.3 Mechanistic Study (TGA/XPS)
XPS coupled with TGA has proved to be an instructive combination when study-ing the fire retardant mechanistic events in the condensed phase.15 The speci-mens were prepared as thin films. The ‘pseudo-in situ’ protocol used in this workdenotes that only one specimen at a fixed orientation was employed for absoluteintensity (cps eV, counts per second eV) measurement from room temperature upto 500°C. Two systems (PAE/GO and PVDC/GO) were used here as models fordiscussion.
PAE-GO: TGA and XPS data are given in the Figures 7 and 8, and Table 5,respectively. They show that GO decomposes in three steps: the 1st step between
Table 3 Cone data for systems of PAE/GO(5%) (15 kW m−2)
Parametera PAE Micro-PAE/GO Nano-PAE/GO
p-HRR (kW m−2) 377 252 (−33.0%) 178 (−52.8%)TTI (s) 109 181 (+66%) 293 (+168.8%)TSR (m2 m−2) 323.9 186.8 (−42.3%) 119.5 (−63.0%)p-CO yield (kg kg−1) 0.15 0.12 (−20.0%) 0.05 (−66.7%)
ap-HRR: peak-heat release rate; TTI: time to ignition; TSR: total smoke release.
Table 4 Nano-effect for systems of PVDC/GO (5%): cone data (15kW kW m−2)
Parametera Micro-PAE/GO Nano-PAE/GO
p-HRR (kW m−2) 42.6 16.6TTI (s) 176 235TSR (m2 m−2) 54.9 16.6p-CO yield (kg kg−1) 0.44 0.0
ap-HRR: peak-heat release rate; TTI: time to ignition; TSR: total smoke release.
Figure 7 TG curves of GO, PAE and nano-PAE/GO(5%) and nano-PAE/GO(10%)composites

168 Chapter 12
20 and 130°C corresponding to the evolution of adsorbed H2O, the 2nd stepbetween 130 and 300°C corresponding to the loss of CO2, CO, H2O, and the 3rd
step between 300 and 500°C corresponding to the loss of CO2 and smallmolecules.16 Consequently, the greater the level of GO incorporated, the earlierdegradation of PAE started, resulting in the following points: (i) the onsettemperatures (T5 and T10) decrease by 23 and 25°C for nano-PAE/GO(5%), and89 and 38°C for nano-PAE/GO(10%) with respect to PAE, respectively, due tothe early decomposition of GO; (ii) the degraded rate (Rmax) for nano-PAE/GO(10%) is about thrice that of PAE; (iii) the char yield at 500°C jumps from1.8% (PAE) to 15.5% [nano-PAE/GO(10%)].
Figure 9 provides the relative intensity in C1s spectra vs. temperature for bothPAE and nano-PAE/GO. Previously,17–23 we showed that these curves can berationalized in terms of the relative extent of cross-linking as a function oftemperature. The PAE curve indicates that cross-linking commences upon heat-ing at 380°C. This change is reasonably consistent with TGA data. The curveof nano-PAE/GO(5%) composite always lies above the curve of PAE below400°C, suggesting a higher extent of cross-linking for nano-PAE/GO, whichis due to interactions between PAE and GO. Above 400°C the curve of thenanocomposite falls, probably because of the dominant oxygen at the surface(Figure 10).
Figure 8 DTG curves of GO, PAE and nano-PAE/GO(5%) and nano-PAE/GO(10%)composites
Table 5 TGA data for nano-PAE/GO composites
GO T5 T10
PeakResidue at
Sample (%) (°C) (°C) Tmax (°C) Rmax (% °C−1) 500 °C (%)
GO – 123 155 182 0.51 58.9PAE 0 341 372 407 3.46 1.8nano-PAE-5 5 318 347 385 2.18 9.0nano-PAE-10 10 252 334 392 1.05 15.5

169Comparative Study Polymer–Graphite Oxide Nanocomposites
The two curves in Figure 10 separate at about 380°C. The increase of oxygencontent suggests the existence of GO at the surface, probably throughtwo mechanisms: (i) decomposition of the polymer upon heating and/or (ii)migration of GO from bulk towards the surface in the polymer melt.
In other words, the mechanism for nano-PAE/GO in the condensed phase ismore like that for nano-PS/MMT,20 and nano-PMMA/MMT.21 At the sametime, the ratios of C:O are nearly constant before 380°C, and then graduallyseparates (Figure 11).
PVDC-GO – PVDC and PVDC/GO are halogen-containing systems, anothermodel of interest. PVDC is a well-known char-forming polymer. All TGA dataare listed in Figures 12 and 13 and Table 6 for comparison.
Some features can be drawn from Tables 5 (PAE/GO) and 6 (PVDC/GO):
(1) Lesser influence of GO on mass loss rate (Rmax) and residual yield in nano-PVDC/GO(5%) than in nano-PAE/GO(5%), i.e. the nano-effect in PVDC/GO does function but is weaker than that in PAE/GO. The effectivenessmay be offset by the voluminous char residue in PVDC/GO.
Figure 9 Relative intensity (%) in C1s spectra for PAE and nano-PAE/GO(5%)vs.temperature (PAE: open circles; nano-PAE/GO: filled circles)
Figure 10 Relative intensity (%) in O1s spectra for PAE and nano-PAE/GO(5%)vs.temperature (PAE: open circles; nano-PAE/GO: filled circles)

170 Chapter 12
Figure 11 C:O ratio for PAE and nano-PAE/GO(5%) vs. temperature (PAE: opencircles; nano-PAE/GO: filled circles)
Figure 12 TG curves of GO, PVDC and PVDC/GO(5%) nanocomposite
Table 6 TGA data for nano-PVDC/GO composites
PeakResidue at
Sample T5 T10 Tmax (°C) Rmax (% °C−1) 500 °C (%)
GO 123 155 182 0.51 58.9PVDC 211 232 272 0.75 31.4Nano-PVDC-GO-5 210 222 244 0.85 32.6
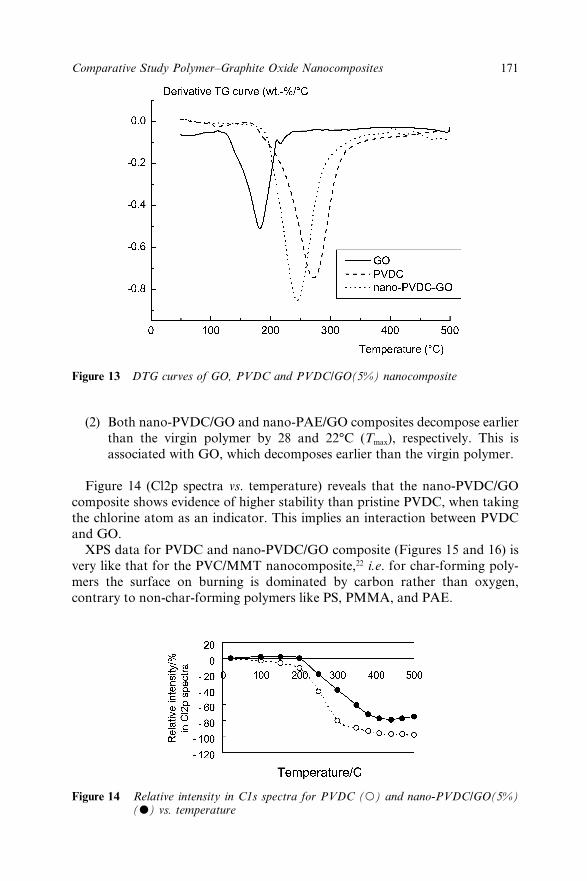
171Comparative Study Polymer–Graphite Oxide Nanocomposites
Figure 13 DTG curves of GO, PVDC and PVDC/GO(5%) nanocomposite
(2) Both nano-PVDC/GO and nano-PAE/GO composites decompose earlierthan the virgin polymer by 28 and 22°C (Tmax), respectively. This isassociated with GO, which decomposes earlier than the virgin polymer.
Figure 14 (Cl2p spectra vs. temperature) reveals that the nano-PVDC/GOcomposite shows evidence of higher stability than pristine PVDC, when takingthe chlorine atom as an indicator. This implies an interaction between PVDCand GO.
XPS data for PVDC and nano-PVDC/GO composite (Figures 15 and 16) isvery like that for the PVC/MMT nanocomposite,22 i.e. for char-forming poly-mers the surface on burning is dominated by carbon rather than oxygen,contrary to non-char-forming polymers like PS, PMMA, and PAE.
Figure 14 Relative intensity in C1s spectra for PVDC (�) and nano-PVDC/GO(5%)(�) vs. temperature

172 Chapter 12
As in PVC/MMT, ionic species can be monitored for nano-PVDC/GO onheating (Figure 17). GO indeed accelerates the shift in charring of polymerPVDC to lower binding energies. For example, the emergence of ionic species(say, <199.0 eV) occurs at ca. 400°C for nano-state, very much earlier (or lower)than that of PVDC, which can hardly approach the value within this tempera-ture range. The degradation of nano-PVDC/GO develops through two steps, i.e.the initial loss of HCl to form allylic species and the degradation of those allylic
Figure 15 Relative intensity in O1s spectra for PVDC (�) and nano-PVDC/GO(5%)(�) vs. temperature.
Figure 17 Binding energy (eV) in Cl2p spectra for systems of PVDC (�) and nano-PVDC/GO(5%) (�) vs temperature (without charging subtraction)
Figure 16 Relative intensity in Cl2p spectra for PVDC (�) and nano-PVDC/GO(5%)(�) vs. temperature
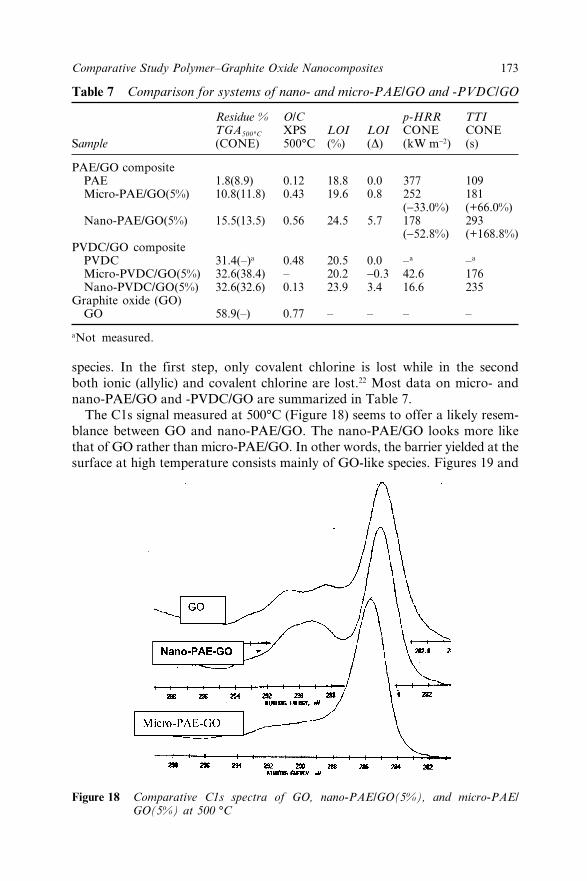
173Comparative Study Polymer–Graphite Oxide Nanocomposites
species. In the first step, only covalent chlorine is lost while in the secondboth ionic (allylic) and covalent chlorine are lost.22 Most data on micro- andnano-PAE/GO and -PVDC/GO are summarized in Table 7.
The C1s signal measured at 500°C (Figure 18) seems to offer a likely resem-blance between GO and nano-PAE/GO. The nano-PAE/GO looks more likethat of GO rather than micro-PAE/GO. In other words, the barrier yielded at thesurface at high temperature consists mainly of GO-like species. Figures 19 and
Table 7 Comparison for systems of nano- and micro-PAE/GO and -PVDC/GO
Residue % O/C p-HRR TTITGA500°C XPS LOI LOI CONE CONE
Sample (CONE) 500°C (%) (D) (kW m−2) (s)
PAE/GO compositePAE 1.8(8.9) 0.12 18.8 0.0 377 109Micro-PAE/GO(5%) 10.8(11.8) 0.43 19.6 0.8 252 181
(−33.0%) (+66.0%)Nano-PAE/GO(5%) 15.5(13.5) 0.56 24.5 5.7 178 293
(−52.8%) (+168.8%)PVDC/GO composite
PVDC 31.4(–)a 0.48 20.5 0.0 –a –a
Micro-PVDC/GO(5%) 32.6(38.4) – 20.2 −0.3 42.6 176Nano-PVDC/GO(5%) 32.6(32.6) 0.13 23.9 3.4 16.6 235
Graphite oxide (GO)GO 58.9(–) 0.77 – – – –
aNot measured.
Figure 18 Comparative C1s spectra of GO, nano-PAE/GO(5%), and micro-PAE/GO(5%) at 500 °C

174 Chapter 12
20 offer further critical proof that the nano-effect exerts a critical function informing graphitic structures (~284.3 eV) whatever the PAE or PVDC. Conse-quently, one may obtain a toughened barrier dominated with a GO-like struc-ture via covalent bonding between the polymeric matrix and functional groupsattached to GO.
12.4 ConclusionsThe use of graphite oxide (GO) as a nanofiller incorporated into polymers(PAE, PVA, PU and PVDC) enables the making of nanocomposites. The find-ing is that the nano-effect, as revealed by LOI measurement, works pretty wellin composites including PAE-, PVA-, PU- and PVDC-/GO. These excellent fireproperties are also confirmed by cone calorimetry.
Notably, the systems of nano-polymer/GO composites give promising resultsbased on LOI and cone data in contrast to polymer-layered silicate (e.g. MMT)nanocomposites and nano-particulates (e.g. TiO2).
The survival and renascence of graphite-like (sp2) structure (~284.3 eV inXPS) initiated by GO at 500°C offers a critical proof that a toughened barrier is
Figure 19 Binding energy (eV) in C1s spectra for systems of PAE (�) and nano-PAE/GO(5%) (�) vs. temperature
Figure 20 Binding energy (eV) in C1s spectra for systems of PVDC (�) and nano-PVDC/GO(5%) (�) vs. temperature (without charging substraction)
175Comparative Study Polymer–Graphite Oxide Nanocomposites
formed, dominated by a GO-like structure via covalent bonding between thepolymeric matrix and functional groups attached to the surface of GO.
The nano-effect seems to be partially offset by halogen, which usually playsits role in the gas phase. This may be due to the counter-balanced or compen-sated influence of the voluminous char residue of PVDC/GO (32.6 wt% at500°C) vs. PAE/GO (9.0 wt% at 500°C).
Our study offers further critical proof, i.e. the nano-effect exerts a criticalfunction in forming graphitic structure (~284.3 eV ) at high temperature, what-ever PAE or PVDC is concerned. A toughened barrier dominated by a GO-likestructure via covalent bonding between the polymeric matrix and functionalgroups attached to GO is, presumably, formed on the surface.
12.5 References
1. Y. Kojima, A. Usuki, M. Kawasumi, A. Okada, Y. Fukushima,T. Kurauchi and O. Kamigaito, J. Mater. Res., 1993, 8, 1185.
2. J.W. Gilman, T. Kashiwagi, E.P. Giannelis, E. Manias, S. Lomakin, J.D.Lichtenhan and P. Jones, in Fire Retardancy of Polymers: The Use ofIntumescence, M. Le Bras, G. Camino, S. Bourbigot and R. Delobel (eds.),The Royal, Society of Chemistry, Cambridge, 1998; J.W. Gilman, Appl.Clay Sci., 1999, 15, 31–49.
3. T. Kashiwagi, E. Grulke, J. Hilding, R. Harris, W. Awad and J. Douglas,Macromol. Rapid Commun., 2002, 23, 761–765.
4. W.S. Hummers, Jr and R.E. Offeman, J. Am. Chem. Soc., 1958, 80, 1339.5. Z. Han and J. Wang, Chin. J. Inorg. Chem., 2003, 19(5), 459–461.6. Z. Han and J. Wang, Chin. J. Inorg. Chem., 2003, 19(12), 1366–1370.7. Y. Matsuo, K. Tahara and Y. Sugie, Carbon, 1996, 34, 672.8. Y. Matsuo, K. Tahara and Y. Sugie, Carbon, 1997, 35, 113.9. Y. Matsuo, K. Hatase and Y. Sugie, Chem. Mater., 1998, 10, 2266–2269.
10. K.E. Strawhecker and E. Manias, Chem. Mater., 2000, 12, 2943.11. J. Xu, Y. Hu, L. Song, Q. Wang, W. Fan and Z. Chen, Carbon, 2002, 40,
445–467.12. Z. Han, Doctorial Thesis, A Comparative Study on Flame Retardant
Properties of Polymer/Graphite Oxide Nano-systems, Beijing Institute ofTechnology, 2003.
13. X. Mo, Doctorial Thesis, Study on Nano-effect in Intumescent FlameRetardant Coatings, Beijing Institute of Technology, 2003.
14. Z. Han and J. Wang, The 2nd International Symposium on EngineeringPlastics (EP’2004), Lanzhou, Gansu province, China, August 15–20,2004.
15. J. Wang, in Fire Retardancy of Polymers, The Use of Intumescence, Ed. byM. Le Bras, G. Camino, S. Bourbigot and R. Delobel, The Royal Societyof Chemistry, Cambridge, 1998, pp. 154–172.
16. J. Wang and Z. Han, 228th ACS meeting 2004, Philadelphia, 22–26August 2004.

176 Chapter 12
17. J. Hao, S. Wu, C.A. Wilkie and J. Wang, Polym. Degrad. Stab., 1999, 66,81–86.
18. J. Hao, C.A. Wilkie and J. Wang, Polym. Degrad. Stab., 1999, 71,305–315.
19. J. Wang, J. Du, H. Yao and C.A. Wilkie, Polym. Degrad. Stab., 2001, 74,321–326.
20. J. Wang, J. Du, J. Zhu and C.A. Wilkie, Polym. Degrad. Stab., 2002, 77,249–52.
21. J. Du, J. Zhu, C.A. Wilkie and J. Wang, Polym. Degrad. Stab., 2002, 77,377–381.
22. J. Du, D. Wang, C.A. Wilkie and J. Wang, Polym. Degrad. Stab., 2003,79, 319–324.
23. J. Du, J. Wang, S. Su and C.A. Wilkie, Polym. Degrad. Stab., 2004, 83,29–34.
177
CHAPTER 13
Styrene–Acrylonitrile CopolymerMontmorillonite Nanocomposite:Processing, Characterization andFlammabilityJEFFREY W. GILMAN,1 SERGE BOURBIGOT,2
SÉVERINE BELLAYER,1 HOLLY STRETZ3 ANDDONALD R. PAUL3
1Fire Science Division, BFRL, National Institute of Standards andTechnology, Gaithersburg, MD-20899, U.S.A.2PERF, UPRES EA 1040, École Nationale Supérieure de Chimie de Lille(ENSCL), F-59650 Villeneuve d’Ascq, France (Guest Researcher at FireScience Division, BFRL, NIST, Gaithersburg, MD-20899, U.S.A.3The University of Texas, Austin, TX-78712, U.S.A.
13.1 IntroductionInterest in polymer clay nanocomposites has increased significantly in recentyears. Property improvements include better mechanical properties, betterbarrier properties, lower water absorption and reduced flammability.1–6 Toachieve these properties, mica-type layered silicates, such as montmorillonite(MMT), are generally dispersed at the nanoscale in the polymer to yield theso-called “nanocomposite”.
The pioneering work of Gilman et al. demonstrated that the presence of mont-morillonite clay produces a substantial improvement in fire performance inpolymeric matrices such as polystyrene and polyamides.5–7 The purpose of thiswork is to investigate the melt-processing of styrene-acrylonitrile copolymer(SAN) with MMT clays and the influence of the clay on mechanical propertiesand on fire performance of SAN. Our work is included in a larger project aimedat understanding the flame retardancy of ABS. Computer housings are typicallymade from acrylonitrile-butadiene-styrene (ABS) polymer and related blends,

178 Chapter 13
and these polymers must meet safety standards. The SAN polymer discussedhere is a model system for the study of ABS/clay systems, since the multi-phaseABS consists of an SAN matrix embedded with rubber particles. Our concernhere is to simplify the system to study the nanodispersion of the clay in SAN. Inaddition, we will discuss in future publications how the clay dispersion andorganoclay compatibilizer affect flammability in SAN and ABS.
The first part of this chapter is devoted to the characterization by X-raydiffraction (XRD), transmission electronic microscopy (TEM) and solid-statenuclear magnetic resonance (NMR) of the nanocomposites. These characteriza-tion methods are complementary, but it should be pointed out that solid stateNMR characterization has not been previously reported for SAN/MMT, andthat the advantage of NMR characterization of nanocomposites is that thesample size probed is much larger (and therefore more representative of a bulkdispersion) than either XRD or TEM. Together, these methods will providean overview of the dispersion of the clay in SAN. Then, tensile properties andflammability performance evaluated by mass loss calorimetry will be examinedand discussed.
13.2 Experimentala
13.2.1 Preparation of Nanocomposites
MMT originated from Southern Clay Products, Inc (Gonzales, TX, USA).The starting material, sodium-MMT, was commercially modified using methyl,tallow, bis-2-hydroxyethyl, quaternary ammonium chloride (Cloisite 30B).SAN copolymer, containing 25 mass% acrylonitrile (SAN-25) and formulatedfor computer housing, was supplied by Dow Chemical.
Polymer melt-direct intercalation is an approach to making polymer layeredsilicate nanocomposites by using conventional polymer extrusion. The opti-mized processing temperature for best dispersion was determined to be 220°C.8
SAN-25 was melt-mixed with the clay using a co-rotating twin-screw extruder(Haake, screw L/D =10, diameter = 35 mm) at 280 rpm. These conditionson this extruder produce fully exfoliated nylon-6/montmorillonite nanocom-posites.9 The clay loadings (Cloisite 30B) were 2.2, 4.2, 6.2 and 7.9 wt% truesilicates. The true silicate concentration is determined by heating the dry,post-extrusion pellets in a muffle furnace to 900°C for 45 min, and correcting forstructural rearrangement by dividing the ash percentage by 0.935 (the silicate
a This work was carried out by the National Institute of Standards and Technology (NIST),an agency of the U.S. government and by statute is not subject to copyright in the UnitedStates. Certain commercial equipment, instruments, materials or companies are identified inthis paper in order to adequately specify the experimental procedure. This in no way impliesendorsement or recommendation by NIST. The policy of NIST is to use metric units of mea-surement in all its publications, and to provide statements of uncertainty for all originalmeasurements. In this document, however, data from organizations outside NIST are shown,which may include measurements in non-metric units or measurements without uncertaintystatements.

179Styrene–Acrylonitrile Copolymer Montmorillonite Nanocomposite
rearrangement results in 6.5% loss of structural water). Organoclay content canthen be calculated from the true silicate content as reported here by using:
organoclayMMT
LoI(%)
.= ×
−
0 935
1 100
where LoI is the loss on ignition for the dry organoclay (30% for Cloisite 30B),and MMT is the true silicate mass percentage.
13.2.2 NMR Spectroscopy
Measurements were conducted using a Bruker Avance 300 spectrometer (BrukerBioSpin Corp., Billerica, MA) operating at 7.05 T. Proton spectra at 300 MHzwere obtained using a 5 mm low proton-background CRAMPS10 (combinedrotation and magic-angle spinning) probe (Doty Scientific of Columbia, SC).
Even though we recognized the strong effect of oxygen (it will be commentedin the following),11 proton longitudinal relaxation times (T1
H) of oxygen-containing samples were obtained using the inversion–recovery sequence withdirect proton observation12 in a ZrO2 rotor. For purposes of time efficiency, onlythe delay time, tnull, was determined. The latter is the delay time where, afterinversion, magnetization passes through zero on its way back to the Boltzmannequilibrium level. From tnull, a lower limit for T1
H was calculated via the rela-tionship T1
H = tnull /ln2. This relationship assumes full initial inversion of themagnetization and single-exponential recovery. The paramagnetic contributionto T1
H originating from the MMT clay (paramagnetic Fe3+ is embedded in thealuminosilicate layers of the MMT) normally produces a slightly acceleratedearly decay relative to the typically exponential behavior seen at longer times;hence, this relationship systematically yields a lower limit to the T1
H than woulddescribe this longer time behavior. In any case, all samples had equilibratedwith O2 and had aged for at least one month. Standard uncertainties for tnull
measurements are ±2.5% of the given value.
13.2.3 Transmission Electron Microscopy
All samples were ultra-microtomed with a diamond knife on a Leica UltracutUCT microtome to give sections with a nominal thickness of 70 nm. Thesections were transferred from water (room temperature) to Cu grids of 400mesh. Bright-field TEM images of nanocomposites were obtained at 120 kVunder low-dose conditions with a Philips 400T electron microscope, usingKodak SO-163 film. Low-magnification images were taken 22,000×. High-magnification images were taken at 100,000×. The materials were sampled bytaking several images of various magnifications over 2–3 sections per grid toensure that analysis was based on a representative region of the sample.

180 Chapter 13
13.2.4 Tensile PropertiesInjection molding of tensile test bars (ASTM D638) was performed on anArburg Allrounder 305-210-700 injection molding machine. Test specimenswere molded at a barrel temperature of 260°C, and a mold temperature of 80°C.Mechanical testing was performed on an Instron model 1137 at a strain rate of0.51 cm min−1, and moduli data were evaluated using an extensometer with a2.5 cm gauge length. Standard deviations for 5 or more test bars were under10% of the mean for moduli. Standard deviations on the tensile strength at breakand strain at break increased with clay percentage up to a maximum of 15% ofthe mean.
13.2.5 Cone Calorimetry by Mass Loss CalorimeterFTT (Fire Testing Technology) mass loss calorimeter was used to carry outmeasurements on samples following the procedure defined in ASTM E 906. Theequipment is identical to that used in oxygen consumption cone calorimetry(ASTM E-1354-90), except that a thermopile in the chimney is used to obtainheat release rate (HRR) rather than employing the oxygen consumption prin-ciple. Mass loss readings are performed simultaneously by ASTM E-1354, andserve as a benchmark of the heat release rate values obtained in this manner.ASTM E 906 is a screening method, and results in an internally representativeset of data. For comparison, fully scaleable peak heat release rates from ASTME-1354 for non-FR ABS grades range from 80013 to 1000 kW m−² 14 at an exter-nal heat flux of 35 kW m−2. The procedure involved exposing specimens mea-suring 100 × 100 × 3 mm in horizontal orientation. An external heat flux of35 kW m−² was used for running the experiments. This flux corresponds tocommon heat flux in mild fire scenario.15,16 The MLC calorimeter was used todetermine heat release rate (HRR). When measured at 35 kW m−², HRR isreproducible to within ±10%. The cone data reported here the average of threereplicated experiments.
13.3 Results and Discussion13.3.1 Characterization by XRD and TEMTEM images of SAN-25 MMT nanocomposites containing 2.2, 4.2, 6.2 and7.9 wt% of true silicate are shown at low magnification (Figures 1a to 4a) and athigher magnification (Figure 1b to 4b).
At low magnification, the images reveal that clay is well and evenly dispersedin all nanocomposites. At higher magnification, all samples exhibit dispersionof multi-layer stacks (tactoids) of individual MMT layers that range from 2 to10 layers in size. Some individual MMT layers can be also distinguished.
The samples are not all similar; the nanostructure of nanocomposite (sizeof the tactoids) appears qualitatively to depend on the loading in organo-clayalthough a quantitative analysis of the distribution has not yet been attempted.We can observe that, as the clay loading is increased, larger tactoids seem tobecome more prevalent. This trend has been suggested in the literature,17 i.e.
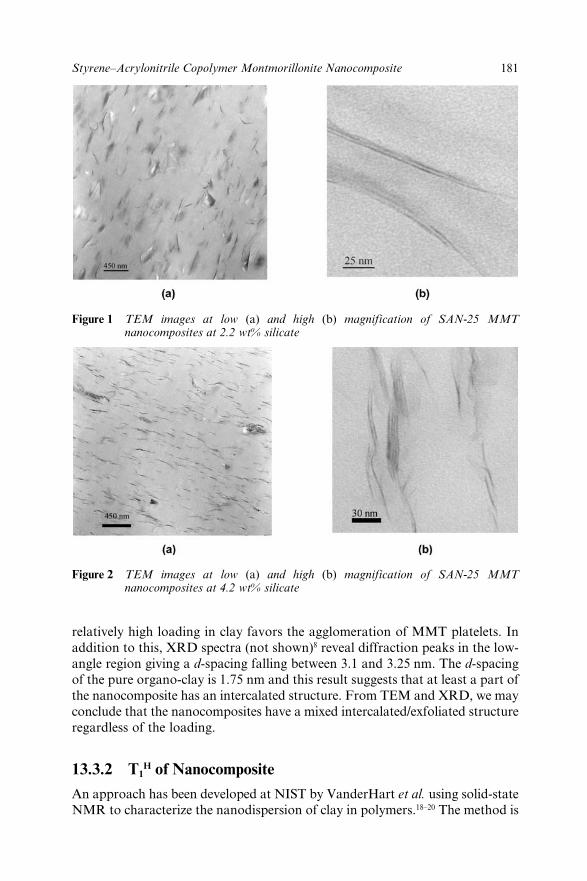
181Styrene–Acrylonitrile Copolymer Montmorillonite Nanocomposite
relatively high loading in clay favors the agglomeration of MMT platelets. Inaddition to this, XRD spectra (not shown)8 reveal diffraction peaks in the low-angle region giving a d-spacing falling between 3.1 and 3.25 nm. The d-spacingof the pure organo-clay is 1.75 nm and this result suggests that at least a part ofthe nanocomposite has an intercalated structure. From TEM and XRD, we mayconclude that the nanocomposites have a mixed intercalated/exfoliated structureregardless of the loading.
13.3.2 T1H of Nanocomposite
An approach has been developed at NIST by VanderHart et al. using solid-stateNMR to characterize the nanodispersion of clay in polymers.18–20 The method is
Figure 1 TEM images at low (a) and high (b) magnification of SAN-25 MMTnanocomposites at 2.2 wt% silicate
Figure 2 TEM images at low (a) and high (b) magnification of SAN-25 MMTnanocomposites at 4.2 wt% silicate

182 Chapter 13
based on T1H measurement. It utilizes two effects: (1) the paramagnetic charac-
ter of this MMT, which directly reduces the T1H of nearby protons, and (2) spin
diffusion, whereby this locally enhanced relaxation propagates to more distantprotons. As reported,11,21,22 the adsorption of paramagnetic oxygen on aromaticpolymers causes a major shortening of T1
H. This was shown previously for poly-styrene but we suspect the same effect for SAN polymer because of the presenceof phenyl ring in the repeat unit of this polymer. The amount of adsorbedoxygen is a function of the chemical nature of the polymer, its molecular pack-ing, molecular motion and temperature. Thus, in addition to the sensitivity ofT1
H to clay dispersion, any other changes that might affect oxygen solubility ordynamics could also influence T1
H. The purpose here is to use the shorteningof T1
H measured in SAN-25/MMT nanocomposites to get an estimation of the
Figure 4 TEM images at low (a) and high (b) magnification of SAN-25 MMTnanocomposites at 7.9 wt% silicate
Figure 3 TEM images at low (a) and high (b) magnification of SAN-25 MMTnanocomposites at 6.2 wt% silicate

183Styrene–Acrylonitrile Copolymer Montmorillonite Nanocomposite
nanodispersion of the clay in the polymer. In a future paper,23 we will discussthe effect of oxygen and propose a quantitative approach for determining thenanodispersion using solid-state NMR.
Table 1 shows T1H data, obtained from tnull, for our oxygen containing
SAN-25/MMT nanocomposites. T1Hs of samples are shortened by the para-
magnetic character of the clay.All T1
H data of SAN-25/MMT nanocomposites fall between 1.14 and 0.54 s(T1
H of the pure SAN-25 is 1.77 s). T1H decreases with increasing MMT concen-
tration for all nanocomposites, and depends on both the MMT concentrationand the quality of the dispersion. It decreases noticeably for each sample com-pared to the pure SAN-25 and, as expected, the higher the MMT concentration,the shorter T1
H is. By analogy with our previous work with nylon-6/claynanocomposites20 and PS/MMT nanocomposites,11 the T1
Hs of our samples sug-gest a modestly good dispersion of the clay. Here, a good correlation is foundbetween T1
Hs, and XRD and TEM conclusions. However, such a result shouldbe considered only if secondary issues such as the presence of residual monomerdo not modify the solubility of oxygen. Indeed, effects like residual monomer,large amounts of organo-modifier, or even small amounts, could potentiallylead to an inappropriate conclusion about the dispersion of the clay if one doesnot properly take account of such phenomena. Nevertheless, we checked theBloch spectra (not shown), and no degradation of SAN-25 or of the organo-modifier of the clay could be detected, i.e. there was no NMR evidence ofadditional mobile species present in our samples.
13.3.3 Tensile Properties
Figure 5 shows the tensile properties of SAN-25/MMT nanocomposites.Young’s modulus clearly increases as a function of the MMT concentration but,
Table 1 NMR, XRD and TEM characterization of oxygenated SAN-25/MMTnanocomposites
OrganoMMT True silicate T1H
Polymer/MMT concentration concentration (tnull/ln2)nanocomposite (wt%) (wt%) (s) XRD/TEM conclusions
SAN-25 0 0 1.77 –SAN-25/3 3.0 2.2 1.14 Well and evenly dispersed,
exfoliated/intercalated withsmall tactoids (2–3 layers)
SAN-25/6 5.6 4.2 0.84 Well and evenly dispersed,exfoliated/intercalated withsmall tactoids (3–5 layers)
SAN-25/8 8.3 6.2 0.63 Well and evenly dispersed,exfoliated/intercalated withsmall tactoids (3–8 layers)
SAN-25/11 10.6 7.9 0.54 Well and evenly dispersed,exfoliated/intercalated withsmall tactoids (3–10 layers)

184 Chapter 13
concurrently, tensile strength and strain at break decrease. Young’s modulus ofSAN-25/MMT nanocomposites is substantially superior to that of neat SAN-25due to the reinforcement by the clay platelets. The modulus exhibits a linearbehavior versus the MMT content in the polymer. Surprisingly, tensile strengthdrops with higher clay loading. Most literature reports show an increase instrength at yield with clay loading,14 but the SAN/MMT samples broke in abrittle manner before yield, and comparison to a ductile matrix is then not validin terms of the strain regime. Both tensile strength and strain at break show alinear decrease at low clay loadings, suggesting the presence of small agglomer-ates in the polymer, as reported elsewhere.17 This dependence appears to plateauat higher loadings, but the standard deviation also increases with loading,making the trend difficult to evaluate. The nature of the variation of tensilestrength with loading for nanocomposites with a brittle matrix (i.e. SAN) is notcompletely understood. All nanocomposites exhibit an intercalated structurewith some exfoliation and tactoids of small size. We also observed a lineardependence of the tensile modulus properties versus clay content for the range ofloading tested. We have, therefore, a “filler effect” increasing the stiffness butdecreasing the tensile strength of the nanocomposites.
13.3.4 Flammability PropertiesPeak of heat release rate (PHRR) of polystyrene is reduced upon addition ofclay;24,25 however, to our knowledge, no published data are available formelt-processed SAN nanocomposites. Figure 6 shows significant reductionsin PHRR in SAN-25 as a function of clay content. This reduction is stronglyenhanced at higher clay loading. As an example, PHRR is decreased by 36%
Figure 5 Young’s modulus, tensile strength and strain at break vs. MMT concentrationof SAN-25/MMT nanocomposites

185Styrene–Acrylonitrile Copolymer Montmorillonite Nanocomposite
at 4.6 wt% in MMT concentration. The suggested mechanism by which claynanocomposites function involves the formation of a surface layer that serves asa potential barrier to both mass and energy transport.24 The higher the initialconcentration of clay, the thicker (and more insulating) is the ceramic-likelayer that forms at the decomposing surface of the burning sample, with dueconsideration for homogeneity and integrity of the forming layer.
13.4 ConclusionThis work has characterized the dispersion of montmorillonite clay in SAN-25and evaluated the mechanical properties and the reaction to fire of SAN-25/MMT nanocomposites. The nanodispersion has been characterized by XRD,TEM, and solid-state NMR. SAN-25/MMT nanocomposites reveal an interme-diate morphology, i.e. an intercalated structure with some exfoliation and withthe presence of small tactoids whatever the loading in MMT is. The presence ofclay in SAN-25 leads to a “filler effect” that increases the stiffness but decreasesthe tensile strength of the nanocomposites. It also leads to a significant decreaseof peak of heat release rate (up to 36%) as measured by mass loss calorimetry.
13.5 References1. M. Alexandre and P. Dubois, Mat. Sci. Eng., R. 2000, 28(1–2), 1–63.2. Y. Kojima, A. Usuki, M. Kawasumi, A. Okada, Y. Fukushima,
T. Kurauchi and O. Kamigaito, J. Mater. Res., 1993, 8(5), 1185–1189.
Figure 6 Peak of heat release rate (PHRR) vs. MMT concentration of SAN-25/MMTnanocomposites
186 Chapter 13
3. A. Okada, Y. Fukushima, M. Kawasumi, S. Inagaki, A. Usuki,S. Sugiyama, T. Kurauchi and O. Kamigaito, US Patent 4,739,007, 1988.
4. P.B. Messersmith and E.P. Giannelis,. J. Polym. Sci. A., Polym. Chem.,1995, 33(7), 1047–1057.
5. J.W. Gilman, T. Kashiwagi and J.D. Lichtenhan, SAMPE J., 1997, 33,40–46.
6. J.W. Gilman, Appl. Clay Sci., 1999, 15(1–2), 31–49.7. J.W. Gilman, T. Kashiwagi, E.P. Giannelis, E. Manias, S. Lomakin, J.D.
Lichtenhan and P. Jones, in Fire Retardancy of Polymers – The Use ofIntumescence, M. Le Bras, G. Camino, S. Bourbigot, and R. Delobel(eds.), The Royal Society of Chemistry, Cambridge, 1998, pp. 223–235.
8. H. Stretz, Preliminary Proposal 2002, University of Texas, Austin.9. T.Fornes, P.J. Yoon, H. Keskkula and D.R. Paul, Polymer, 2001, 42,
9929–9940.10. L.M. Ryan, R.E. Taylor, A.J. Paff and B.C. Gerstein, J. Chem. Phys.,
1980, 72, 508–515.11. S. Bourbigot, D.L. VanderHart, J.W. Gilman, W.H. Awad, R.D. Davis,
A.B. Morgan and C.A. Wilkie, J. Polym. Sci. B, Polym. Phys., in press.12. T.C. Farrar and E.D. Becker, in Pulse and Fourier Transform NMR,
Academic Press, New York, 1971, pp. 20f.13. A. Grand, in Heat Release Calorimetry Evaluation of Fire Retardant
Polymer Systems, 42nd Intl. SAMPE Proceedings, 1997, Volume 5.14. M.J. Scudmore, P.J. Briggs and F.H. Prager, Fire Mater., 1991, 15,
65–84.15. V. Babrauskas, Development of Cone Calorimeter – A bench scale rate of
heat release based on oxygen consumption, NBS-IR 82-2611, US Nat. Bur.Stand., Gaithersburg, 1982.
16. V. Babrauskas, Fire Mater., 1984, 8(2), 81.17. J.-H. Chang, Y.U. An and G.S. Sur, J Polym. Sci, Part B: Polym. Phys.,
2003, 41, 94.18. D.L. VanderHart, A. Asano and J.W. Gilman, Macromolecules, 2001, 34,
3819–3822.19. D.L. VanderHart, A. Asano and J.W. Gilman, Chem. Mater., 2001, 13,
3781–3795.20. D.L. VanderHart, A. Asano and J.W. Gilman, Chem. Mater., 2001, 13,
3796–3809.21. D.Capitani, C. de Rosa, A. Ferrando, A. Grassi and A.L. Segre, Macro-
molecules, 1992, 25, 3874–3880.22. D. Capitani, A.L. Segre and J.S. Blicharski, Macromolecules, 1995, 28,
1121–1128.23. S. Bourbigot, D.L. VanderHart, J.W. Gilman, S. Bellayer, H. Stretz and
D.R. Paul, manuscript in preparation.24. J. Zhu, A.B. Morgan, F.J. Lamelas and C.A. Wilkie, Chem. Mater., 2001,
13, 3774–3780.25. J. Zhu, F.M. Uhl, A.B. Morgan and C.A., Wilkie, Chem. Mater., 2001,
13, 4649–4654.
Micro-Sized Fire Retarding Mineral Fillers
189
CHAPTER 14
Polyhedral OligomericSilsesquioxanes: Application toFlame Retardant TextilesSERGE BOURBIGOT,1 MICHEL LE BRAS,1 XAVIERFLAMBARD,2 MARYLINE ROCHERY,2 ERIC DEVAUX2
AND JOSEPH D. LICHTENHAN3
1Laboratoire des Procédés d’Élaboration des Revêtements Fonctionnels,UPRES EA 1040, École Nationale Supérieure de Chimie de Lille, Universitédes Sciences et Technologies de Lille, BP 108, F-59652 Villeneuve d’AscqCedex, France ([email protected])2Laboratoire de Génie et Matériaux Textiles (GEMTEX), UPRES EA2461,École Nationale Supérieure des Arts et Industries Textiles (ENSAIT), F-59056Roubaix Cedex 01, France3Hybrid Plastics, 18237 Mount Baldy Circle, Fountain Valley, CA - 92708,U.S.A.
14.1 IntroductionPolymeric hybrid materials have attracted great interest recently due to theiradvantageous performance relative to nonhybrid counterparts.1 Chemicalapproaches to nanocomposite plastics have their origins in the mid-1970s withthe use of sol-gel technology to form homogeneous dispersions of inorganicdomains throughout a polymeric matrix.2,3 In such systems the inorganic phasemay or may not be chemically attached to the organic phase.
This first generation approach has gained some commercial value in coatingapplications where its complex processing and limited material strength aremost amenable. Starting in the early 1980s the field saw the emergence ofsecond generation nanocomposite technology with the resurgence in the use ofminerals and clay fillers that have been treated with various surfactants tomodify their surface (or interfacial) properties.
The technical goal for second generation nanocomposites continues to be thehomogeneous dispersion (via exfoliation or intercalation) of these organically

190 Chapter 14
modified fillers into common polymer systems. The second generation approachhas received considerable interest because the improvements include the uniquecombination of several properties such as better mechanical properties, betterbarrier properties, lower water absorption and reduced flammability.4–7 How-ever, it has suffered from technical drawbacks stemming from limited compat-ibility between the filler and matrix as well as complex processing requirements.A third generation nanocomposite technology was developed based on low den-sity, nanostructured, silicon-based chemical feedstocks. This technology utilizesnanostructured chemicals as monomers that can be easily incorporated intoall known polymeric materials in a rationally controlled manner (e.g. atactic,isotactic, syndiotactic) using standard polymerization or processing techniques.
The third generation approach is broadly applicable to all classes ofpolymers, and these nanocomposites can even be further reinforced withcommon fillers (e.g. organoclays, carbon, glass, fibers). The key technologicaldevelopment behind this nanocomposite technology was the development ofnanostructured chemical feedstocks based on POSS.8–12 The structure of poly-hedral oligomeric silsesquioxanes (or POSS) was first reported in 1946,13 butit is only recently that POSS-based hybrid polymers have received increasingattention because of the unique structure of the POSS macromer, which is awell-defined cluster with an inorganic silica-like core (Si8O12) surrounded byeight organic corner groups (Figure 1). The nanoscopic size of POSS enablesPOSS segments to effectively reinforce polymer chains segments and controlchain motion at the molecular level through maximizing the surface areaand chemical interactions of the nanoreinforcement with the polymer. POSS isthus a candidate to design polymer nanocomposites.14–16 POSS reinforcementof polymer chains on a molecular level is analogous to the macroscopicreinforcement that fibers provide in composite structures.
Figure 1 Anatomy of POSS (from reference 17)

191Polyhedral Oligomeric Silsesquioxanes
Increased environmental awareness and fire safety concerns have pushedthe plastic industry to look for environmentally friendly alternatives. Replacingtraditional halogenated fire retardants with non-halogenated alternativesis a pressing concern and also, important for the image of the company(“eco-label”18). One of the approaches currently pursued is the use of inorganicfiller (aluminum trihydrate, magnesium hydroxide, phosphate, etc.) or theconcept of intumescence.
These approaches have led to some success but higher inorganic loadings candeteriorate the mechanical properties, and the increased viscosity makesprocessing difficult. The use of POSS could be tailored to be compatible with thepolymeric matrix, and higher loading could be obtained while maintaining thephysical characteristics. Lichtenhan et al.11 have shown the efficiency of usingPOSS in commodity and engineering polymers. As an example, peak of heatrelease rate (external heat flux = 35 kW m−²) of polyether block amides polymer(PEBAX) is decreased by 77 when using POSS compared to virgin polymer(Figure 2).19 The suggested mechanism is char formation at the surface ofthe material which can act as an insulative barrier.20 The organic groups onPOSS cages undergo homolytic Si–C bond cleavage at ~300–350°C in air. Thisprocess is immediately followed by fusion of POSS-cages to form a thermallyinsulating and oxidatively stable silicon-oxycarbide “blackglass” surface char(“Si-O-C ceramified char”).21
Nanocomposite textiles have not attracted much attention. Previous work22
has demonstrated the feasibility of making polyamide-6/clay hybrid yarns,and has shown a significant enhancement of the flammability properties ofthese yarns as knitted fabrics. In this chapter, our approach is to use POSS as apotential flame retardant for textiles.
Figure 2 Rate of heat release (RHR) curves vs. time of PEBAX blended with POSS at35 kW m−² (from reference 19)

192 Chapter 14
Figure 4 Poly(vinylsilsesquioxane)(FQ-POSS)
The feasibility of making polypropylene (PP)-POSS filaments or yarns viaa melt-spinning process is investigated, and, then, a thermoplastic polyurethane(TPU)–nanocomposite is examined as coating for fabrics. Two kinds ofPOSS are used. POSS is incorporated in PP via melt-processing and PU-POSSnanocomposites are made by organic synthesis. The flammability of thePP/POSS knitted fabric and polyester coated by TPU-POSS is examined anddiscussed using the cone calorimeter as fire model.
14.2 Experimental14.2.1 Raw MaterialsRaw materials used for the preparation of PP-POSS were PP supplied byAtoFina as pellets [PPH 7060, MFI = 12 g (10 min)−1], and dodecaphenyl-POSS(DP-POSS) (Figure 3) and poly(vinylsilsesquioxane) (FQ-POSS) (Figure 4) weresupplied by Hybrid Plastics. They were used as received.
Figure 3 Dodecaphenyl-POSS (DP-POSS)

193Polyhedral Oligomeric Silsesquioxanes
The ingredients of the synthesis of the polyurethane coating are Poly (oxyte-tramethylene glycol) (POTM) (M
—n– = 2000 g mol−1 = 2000 g mol−1) isophorone
diisocyanate (IPDI) and butanediol (BD) supplied by Aldrich.
14.2.2 Processing of Nanocomposite TextilesPP-POSS. PP was melt-mixed with the clay using a counter-rotating twin-screwextruder (Haake). The rotational speed was 300 rpm in order to have a highshear stress and the temperature was 190°C. The extrudate was then pelletized.
14.2.2.1 PP-POSS Multifilament Yarns
Multifilament yarns were made via a melt spinning process using a BusschaertSpinboy 1 melt spinning machine. The spinning apparatus consists of asingle-screw extrusion system with five heating zones. The extrusion device isfed with the solid polymeric pellets, and the heating of the screw is regulated at200°C. The spinning die includes eighty holes with a trilobal shape, and isheated at 210°C. A volumetric pump ensures the injection of molten polymertowards the die with a flow of 100 cm3 min−1. The molten filaments are aircooled, and then drawn by means of two heated rolls, before being wound. Thefirst roll has a surface speed of 200 rpm and is heated at 80°C, whereas thesecond turns at 550 rpm and is heated at 100°C. The final winding speed isthe same that the second drawing roll. The yarns obtained consist of 80 trilobalcontinuous filaments.
14.2.2.2 Knitted Fabric of PP-POSS Multifilament Yarns
PP and PP-POSS multifilament yarns have been knitted on an automatic recti-linear machine gauge 7. The texture used is a woven rib. The two samples havea surface weight equaling 1020 g m−2 and the thickness is about 2.5 mm.
14.2.2.3 Synthesis of Polyurethane Nanocomposite
The thermoplastic polyurethane (TPU) coating was synthesized in two stages.The first stage was the synthesis of the prepolymer. POTM macrodiol reactswith IPDI for 24 h at 100°C. Using butanediol as chain extender added tothe prepolymer, the mixture was then stirred for 2 min at room temperature togive a TPU polymer. The filler was added at 10 wt% during the second stepof the synthesis of TPU. The mixture was then stirred at 500 rpm to makenanostructured material.
14.2.2.4 Polyester Fabric Coated with PolyurethaneNanocomposite
Polyester fabric was coated by TPU-nanocomposite using a coating table KControl Coater (Erichsen). The coating paste was spread with a threaded rod.

194 Chapter 14
Coating thickness increases with the threading size of the rod. We used a rodwith a medium threading to obtain a coating theoretical thickness of 36 µm. Thecoated fabric was then placed in a drying oven at 80°C for 4 hours.
14.2.3 Solid state NMR29Si NMR measurements were performed on a Bruker ASX400 at 79.49 MHz(9.4 T) with magic-angle spinning (MAS) and cross polarization (CP) using a4 mm probe. A repetition time of 5 s was used for all samples. The referenceused was tetramethylsilane (TMS), and the spinning speed was 15000 Hz.Before starting a new experiment, the chemical shift reference was alwaysverified to be within ±0.2 ppm.
14.2.4 Thermogravimetric Analysis
Thermogravimetric analysis (TGA) was carried out using a TA Instruments(TGA 2950) at 10°C min−1 from 25 to 1000°C in air flow (60 cm3 min−1).Samples of 10 mg each were placed in open platinum pans. Typically, threereplicates were run for each sample, and the mean was reported. Both the onset(5 mass fraction loss) and peak mass loss rate have an uncertainty of 1.2°C (2s).
The curves of weight difference, D(T), between the experimental and theoreti-cal TG curves are computed as follows:
MPoly(T): TG curve of pure PP or TPU, MPOSS(T): TG curve of FQ-POSS orDP-POSS,
Mexp(T): TG curve of the blend Polymer/POSS,Msim(T): simulated TG curve computed by linear combination between the
TG curves of polymer and POSS: Msim(T) = xMPoly(T) + yMPOSS(T), x + y = 1 andx, y are the mass percentage of polymer and POSS in the blend,D(T): curve of weight difference: D(T) = Mexp(T) − Msim(T). The D(T) curves
allow the observation of an eventual increase or decrease in the thermal stabilityof the polymer.
14.2.5 Cone Calorimetry by Oxygen Consumption
A FFT (Fire Testing Technology) cone calorimeter was employed to carry outmeasurements on samples. Samples were mounted between two cut steel sheetsplaced on the usual holder of the cone calorimeter. The surface exposed to theexternal heat flux was 9 × 9 cm². Our method does not correspond to any stan-dard. An external heat flux of 35 kW m−2 was used in running the experiments;this flux corresponds to the common heat flux in mild fire scenario.23,24 The conecalorimeter was used to determine heat release rate (HRR). When measured at35 kW m−2, HRR is reproducible to within ±10%. The results presented in thefollowing are averages. Cone data reported in this chapter are the average ofthree replicated experiments.

195Polyhedral Oligomeric Silsesquioxanes
14.3 Results and Discussion14.3.1 PP-POSS Multifilament Yarns
Multifilament yarns have been made via a melt spinning process after extrudingvirgin PP and PP/FQ-POSS, and they have knitted to obtain fabrics (Figure 5).
No significant difference is observed between the two fabrics with and withoutPOSS except that the touch of PP/FQ-POSS is softer.
CP-MAS NMR29 Si spectra of neat FQ-POSS and of PP/FQ-POSS multifila-ment yarns are compared on Figure 6. They show only one band at about−80 ppm assigned to R-SiO3 groups (R is an organic group).25,26 This isconsistent with the chemical structure of FQ-POSS (Figure 1). In addition,
Figure 5 PP (a) and PP/FQ-POSS (b) multifilament yarns knitted as fabric
Figure 6 CP-MAS NMR29 Si of FQ-POSS and PP/FQ-POSS multifilament yarns

196 Chapter 14
FQ-POSS and PP/FQ-POSS multifilament yarns exhibit similar spectra,suggesting that no degradation and/or modification of FQ-POSS occurs duringextrusion and melt spinning.
The fire behaviour of a material depends on processes occurring in bothcondensed and gas phase and on the processes of heat and mass transfer.These processes strongly depend on the degradation reactions occurring in thecondensed phase. Moreover, it has been reported21 that the mechanism of actionof POSS takes place in the condensed phase to form an insulative charringbarrier. Thus it is particularly interesting to study the thermal degradation ofPP/FQ-POSS before investigating the flammability of the fabrics.
The TG curve of FQ-POSS (Figure 7) reveals a slight degradation (3 wt%of weight loss) starting at 350°C and a main step of degradation occurringat 800°C. The final residue at 1000°C, 5 wt%. FQ-POSS, is thus thermally stablein the processing conditions and this may explain why no degradation isdetected by 29Si NMR.
PP and PP/FQ-POSS start to degrade 250°C but the degradation rate ofPP/FQ-POSS is slower (Figure 7). The residue of PP is close to zero (0.2 wt%)at 500°C. PP/FQ-POSS exhibits a transient residue from 450 to 800°C corre-sponding to the stabilization by FQ-POSS. The final residue is 3 wt%.
To investigate the eventual interactions between PP and FQ-POSS duringdegradation, the curve of weight difference was plotted in Figure 8, which showsthat interactions occur from 200 up to 320°C between PP and FQ-POSS. PPis stabilized in this temperature range. After 450°C, a slight destabilization ofPP/FQ-POSS is observed.
Reaction to fire of PP and PP/FQ-POSS knitted fabrics is evaluated usingcone calorimetry by oxygen consumption. The rate of heat release (RHR) curvesof the two fabrics at an external heat flux of 35 kW m−2 are shown Figure 9.
Figure 7 TG curves of PP and PP/FQ-POSS multifilament yarns (10 °C min−1
air flow)

197Polyhedral Oligomeric Silsesquioxanes
The time to ignition of virgin PP occurs at 21 s and is much shorter than thatof PP/FQ-POSS. The better thermal stability of the system PP/FQ-POSS canexplain this result. However, the peaks of the maximum of RHR of the twofabrics are similar, showing that the flammability properties of PP are notimproved using FQ-POSS. The RHR curve of PP/FQ-POSS is only translatedcompared to PP because of the stabilization of PP by FQ-POSS. Total heatevolved (THE) is also not modified (about 200 kJ) whatever the fabrics, suggest-ing that FQ-POSS does not act as a flame retardant but only as heat stabilizer(decrease of the ignitability).
14.3.2 TPU-POSS Coating
TG curves of the coatings (TPU, TPU/DP-POSS and TPU/FQ-POSS) areshown in Figure 10. The main degradation of the three TPUs starts at the same
Figure 8 Curve of mass difference of PP/FQ-POSS (10 °C min−1 air flow)
Figure 9 Rate of heat release (RHR) curves of PP and PP/FQ-POSS knitted fabrics at35 kW m−2

198 Chapter 14
temperature (220°C), but the degradation rate of TPUs containing POSS isfaster than pure TPU until 400°C. A stabilization zone between 400 and 550°Cis then observed. The final residues of TPU, TPU/DP-POSS and TPU/FQ-POSSat 900°C are 0, 5 and 3 wt% respectively.
Interactions between TPU and TPU-POSS during degradation are shown onthe curve of weight difference on Figure 11. The two polymers TPU/DP-POSSand TPU/FQ-POSS are strongly destabilized from 200 and until 400°C. Thiseffect is higher in the case of TPU/DP-POSS (−25% compared to −17%). Above400°C, TPU/DP-POSS is still slightly destabilized, but TPU/FQ-POSS is stabi-lized by FQ-POSS between 400 and 550°C followed by a slight destabilizationup to 1000°C.
Figure 10 TG curves of TPU, TPU/DP-POSS and TPU/FQ-POSS coatings (10 °Cmin−1 air flow)
Figure 11 Curve of mass difference of TPU/DP-POSS and TPU/FQ-POSS (10 °Cmin−1 air flow)

199Polyhedral Oligomeric Silsesquioxanes
RHR curves of TPU containing POSS coating on woven polyester (PET)fabric show a significant reduction in flammability (in terms of peak of RHR)with regard to virgin TPU (Figure 12). The two POSSs reveal different behav-iors in TPU. The time to ignition of TPU/DP-POSS (7 s) is shorter than neatTPU (10 s) while that of TPU/FQ-POSS is longer (22 s). The RHR peaks ofTPU/DP-POSS and TPU/FQ-POSS are decreased by 31% and by 50% respec-tively. During combustion, a char layer is formed at the surface of the materials.With TPU/FQ-POSS, the char is more uniform and only small cracks areobserved at the surface (cracks can be seen with TPU/DP-POSS, which canexplain its “hill and valley” curve). This char is more resistant and can smotherthe flame. It is also noteworthy that THEs of TPU/POSS’s (60 kJ for TPU/DP-POSS and 40 kJ for TPU/FQ-POSS) are significantly lower than that of neatTPU (70 kJ), showing that DP-POSS and FQ-POSS act as real flame retardants(reaction to fire decreasing RHR and THE).
14.4 ConclusionThis work has investigated the use of POSS as flame retardant in textiles incor-porated in yarns and in coating. PP containing POSS as multifilament yarnsreveals that POSS permits the stabilization of PP; however, the flammability isnot enhanced in terms of RHR, and only the time to ignition is much longer. Itoffers, therefore, the opportunity to make relatively heat resistance fabrics withlow ignition. Concurrently, TPU-POSS coatings have been synthesized and theaction of POSS as flame retardant has been demonstrated. In addition, the use ofFQ-POSS permits both the increase of time of ignition and the decrease of peakof RHR. These results thus offer a promising route for flame retarding textileusing POSS.
Figure 12 Rate of heat release (RHR) curves of TPU, TPU/DP-POSS andTPU/FQ-POSS as coating of woven PET fabrics at an external heat fluxof 35 kW m−2

200 Chapter 14
14.5 AcknowledgementsThe authors are indebted to Mr. Dubusse from CREPIM for skilful experimen-tal assistance in cone calorimetery. NMR experiments were made at thecommon research centre of the University of Lille and Mr. Bertrand Revel isacknowledged for helpful discussion and experimental assistance.
This work was partially supported by the European project FLAMERET(“New Surface Modified Flame Retarded Polymeric Systems to ImproveSafety in Transportation and Other Areas” registered under the number No.G5RD-CT-1999-00120).
14.6 References1. Q. Liu, J.J. Schwab, J.D. Lichtenhan, D. Mason and A. Lee, Polym.
Mater. Sci. Eng., 2002, 87, 97.2. J.E. Mark, C.Y.C. Lee and P.A. Bianconi, in Hybrid Organic–Inorganic
Composites, American Chemical Society, Washington, DC, 1995.3. Y. Chujo, Solid State Mater. Sci., 1996, 1, 806.4. Y. Kojima, A. Usuki, M. Kawasumi, A. Okada, Y. Fukushima, T.
Kurauchi and O. Kamigaito, J. Mater. Res., 1993, 8(5), 1185.5. P.B. Messersmith and E.P. Giannelis, Chem. Mater., 1994, 6, 1719–1725.6. P.B. Messersmith and E.P. Giannelis, J. Polym. Sci. A., Polym. Chem.,
1995, 33(7), 1047.7. J.W. Gilman, T. Kashiwagi and J.D. Lichtenhan, SAMPE J., 1997, 33,
40.8. J.D. Lichtenhan, N.Q. Vu, Jason A.Carter, J.W. Gilman and F.J. Feher,
Macromolecules, 1993, 26(8), 2141.9. J.D. Lichtenhan, Y.A. Otonari and M.J. Carr, Macromolecules, 1995, 28,
8435.10. T.S. Haddad and J.D. Lichtenhan, Macromolecules, 1996, 29, 7302.11. J.D. Lichtenhan, J.W. Gilman and F.J. Feher, US Patent 6,362,279, 1996,
assigned to University of California.12. J. Choi, J. Harcup, A.F. Yee, Q. Zhu and R.M. Laine, J. Am. Chem. Soc.,
2001, 123, 11420.13. D.W. Scott, J. Am. Chem. Soc., 1946, 68, 356.14. L. Zheng, R.M. Kasi, R.J. Farris and E.B. Coughlin, J. Polym. Sci., Part
A: Polym. Chem., 2002, 40, 885.15. L. Zheng, R.J. Farris and E.B. Coughlin, Macromolecules, 2001, 34,
8034.16. H. Xu, S.W. Kuo, J.S. Lee and F.C. Chang, Macromolecules, 2002, 35,
8788.17. http://www.hybridplastics.com18. http://www.firesafetyinfo.org/Environment/eco-shemes.htm19. J.D. Lichtenhan and J.W. Gilman, US Patent 6,362,279, 2002, assigned to
US Air Force.
201Polyhedral Oligomeric Silsesquioxanes
20. R.A. Mantz, P.F. Jones, K.P. Chaffee, J.D. Lichtenhan, J.W. Gilman,I.M.K. Ismail and M.J. Burmeister, Chem. Mater., 1996, 8, 1250.
21. S.K. Gupta, J.J. Schwab, A. Lee, B.X. Fu, and B.S. Hsiao, in AffordableMaterials Technology – Plateform to Global Value and Performance, B.M.Rasmussen, L.A. Pilato and H.S. Kliger (eds.), SAMPE pub., Long Beach,CA, 2002, 47(2), p. 1517.
22. S. Bourbigot, E. Devaux and X. Flambard, Polym. Degrad. Stab., 2002,75(2), 397.
23. V. Babrauskas, Development of Cone Calorimeter – A bench scale rate ofheat release based on oxygen consumption, NBS-IR 82-2611, US Nat. Bur.Stand., Gaithersburg, 1982.
24. V. Babrauskas, Fire Mater., 1984, 8(2), 81.25. E. Lippmaa, M. Maegi, A. Samoson, G. Engelhardt and A. R. Grimmer,
J. Am. Chem. Soc., 1980, 102(15), 4889.26. E.T. Lippmaa, M. A. Alla, T.J. Pehk and G. Engelhardt, J. Am. Chem.
Soc., 1978, 100(6), 1929.
202
CHAPTER 15
Octaisobutyl POSSThermal DegradationALBERTO FINA,1 DANIELA TABUANI,1
ALBERTO FRACHE,2 ENRICO BOCCALERI2 ANDGIOVANNI CAMINO1
1Centro di Cultura per l’Ingegneria delle Materie Plastiche – Politecnico diTorino, V.le T. Michel, 5 - 15100 Alessandria – and INSTM member([email protected])2Università del Piemonte Orientale – Dip. Scienze e Tecn. Avanzate,P.za Ambrosoli, 5 - 15100 Alessandria – and INSTM member
15.1 IntroductionSilsesquioxanes are a family of compounds with general formula (RSiO1,5 )n
where R is hydrogen or an organic group, such as alkyl, aryl or any of theirderivatives. Different structures are possible for these compounds,1–3 dependingon the position of R group, which can be bonded to a single silicon atom orbetween two silicon atoms to afford bridged polysilsesquioxanes.4
Silsesquioxanes can have various geometrical structure orders, includingrandom structures, ladder structures and cage structures, better known asPolyhedral Oligomeric SilSesquioxanes (POSS). POSS are usually producedby hydrolytic condensation of trifunctional monomers RSiX3, where X is a highlyreactive substituent, such as Cl or alkoxy.3,5 The first step is the hydrolysis ofthe monosilane to give the corresponding trisilanol. The second step is the conden-sation of the trisilanol to yield different silsesquioxane species. Many factorsinfluence the hydrolytic condensation, and thus determine the silsesquioxane cagestructures, such as the nature of R and X groups, the solvent, the concentration ofmonosilane RSiX3, temperature, pH and reaction time.6
Even though oligomeric silsesquioxanes were first synthesized in 19467
and some research groups have worked on the subject since the 1960s,8–12 recentyears have seen a great research interest in POSS thanks to their organic-inorganic hybrid structure that gives remarkable properties in numerous appli-cations, both as nanofiller for polymer-based nanocomposites and hybrids andas neat POSS.
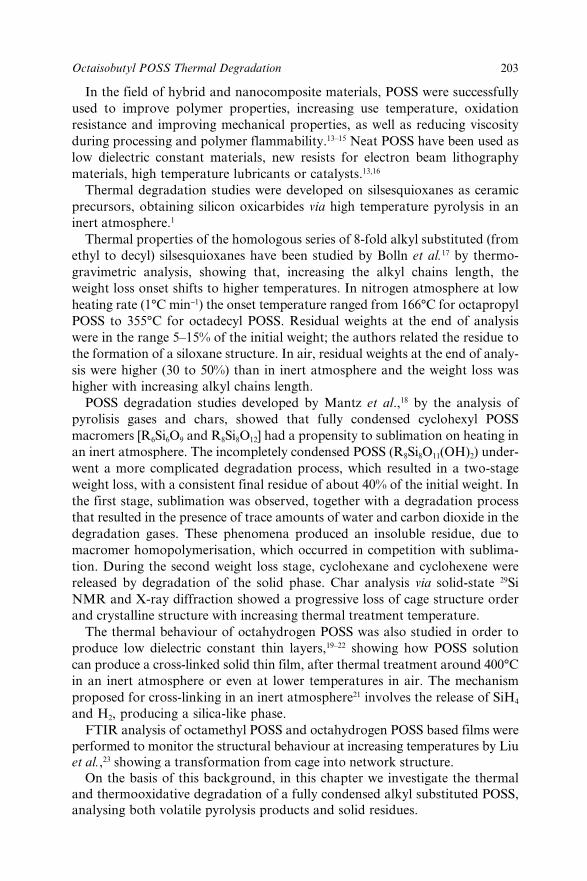
203Octaisobutyl POSS Thermal Degradation
In the field of hybrid and nanocomposite materials, POSS were successfullyused to improve polymer properties, increasing use temperature, oxidationresistance and improving mechanical properties, as well as reducing viscosityduring processing and polymer flammability.13–15 Neat POSS have been used aslow dielectric constant materials, new resists for electron beam lithographymaterials, high temperature lubricants or catalysts.13,16
Thermal degradation studies were developed on silsesquioxanes as ceramicprecursors, obtaining silicon oxicarbides via high temperature pyrolysis in aninert atmosphere.1
Thermal properties of the homologous series of 8-fold alkyl substituted (fromethyl to decyl) silsesquioxanes have been studied by Bolln et al.17 by thermo-gravimetric analysis, showing that, increasing the alkyl chains length, theweight loss onset shifts to higher temperatures. In nitrogen atmosphere at lowheating rate (1°C min−1) the onset temperature ranged from 166°C for octapropylPOSS to 355°C for octadecyl POSS. Residual weights at the end of analysiswere in the range 5–15% of the initial weight; the authors related the residue tothe formation of a siloxane structure. In air, residual weights at the end of analy-sis were higher (30 to 50%) than in inert atmosphere and the weight loss washigher with increasing alkyl chains length.
POSS degradation studies developed by Mantz et al.,18 by the analysis ofpyrolisis gases and chars, showed that fully condensed cyclohexyl POSSmacromers [R6Si6O9 and R8Si8O12] had a propensity to sublimation on heating inan inert atmosphere. The incompletely condensed POSS (R8Si8O11(OH)2) under-went a more complicated degradation process, which resulted in a two-stageweight loss, with a consistent final residue of about 40% of the initial weight. Inthe first stage, sublimation was observed, together with a degradation processthat resulted in the presence of trace amounts of water and carbon dioxide in thedegradation gases. These phenomena produced an insoluble residue, due tomacromer homopolymerisation, which occurred in competition with sublima-tion. During the second weight loss stage, cyclohexane and cyclohexene werereleased by degradation of the solid phase. Char analysis via solid-state 29SiNMR and X-ray diffraction showed a progressive loss of cage structure orderand crystalline structure with increasing thermal treatment temperature.
The thermal behaviour of octahydrogen POSS was also studied in order toproduce low dielectric constant thin layers,19–22 showing how POSS solutioncan produce a cross-linked solid thin film, after thermal treatment around 400°Cin an inert atmosphere or even at lower temperatures in air. The mechanismproposed for cross-linking in an inert atmosphere21 involves the release of SiH4
and H2, producing a silica-like phase.FTIR analysis of octamethyl POSS and octahydrogen POSS based films were
performed to monitor the structural behaviour at increasing temperatures by Liuet al.,23 showing a transformation from cage into network structure.
On the basis of this background, in this chapter we investigate the thermaland thermooxidative degradation of a fully condensed alkyl substituted POSS,analysing both volatile pyrolysis products and solid residues.

204 Chapter 15
15.2 ExperimentalOctaisobutyl POSS (Figure 1), in the following also named oib-POSS, wasobtained as a fine powder from Hybrid Plastics Company and used as received.
Thermogravimetry (TGA) was performed on a TA Q 500 instrument, inplatinum pans, with gas fluxes of 60 ml min−1 for sample gas (nitrogen or air)and 40 ml min−1 for balance protection gas (nitrogen). Analyses were carried outunder isothermal conditions or at a fixed heating rate, between 50 and 800°C,with 10 mg samples (except where specified otherwise).
Differential scanning calorimetry (DSC) analyses were run using a TA Q1000instrument; measurements were carried out in closed (but not hermetic) alu-minium pans, under a nitrogen flow (50 ml min−1). Heating rate was 10°C min−1,with 2 mg samples.
Gas chromatography (GC) was performed on a Perkin-Elmer AutosystemXL, coupled with a Perkin-Elmer Turbomass Gold mass spectrometer (MS).A medium polarity silica capillary column was used, 30 m long and 0.25 mmdiameter (VARIAN CP Sil 8 CB). Analysis conditions were set as follows:injector temperature 280°C, split flow 10 ml min−1, 14 psi pressure controlledcolumn fluxed with helium. oib-POSS was injected as a 3 × 10⁻⁴ M solution inchloroform (99% purity, Carlo Erba reagents) and a 7 min solvent delay timewas set on the MS. The oven temperature for GC analysis was equilibratedat 50°C, held isothermal for 1 min, then raised with an heating ramp of10°C min−1 to 300°C and held isothermally at the final temperature untilanalysis end.
Flash pyrolyses under inert conditions (He) were performed at 600 and 900°Cin a SGE Pyrojector Mk2 pyroliser, assembled on the GC injector (Py GC-MS).Pyrolyses in air were performed in a quartz tube, heated in an oven purged withair flowing at 50 ml min−1.
X-Ray powder diffraction (WAXD) patterns were obtained on a ARLXTRA48 diffractometer using Cu Ka radiation (l = 1.54062 Å).
Figure 1 Octaisobutyl POSS

205Octaisobutyl POSS Thermal Degradation
FTIR spectra (resolution 4 cm−1) were recorded at room temperature onsamples diluted in KBr pellets using a Bruker Equinox 55 spectrometer. Ramanspectra (resolution 4 cm−1) of powder samples were recorded on a RFS 100Bruker FT Raman spectrometer using a 1064 nm wavelength excitation laser.
15.3 Results and Discussion15.3.1 Thermal Degradation in Inert Conditions
DSC of oib-POSS shows on heating a sharp endothermic peak at 266°C andtwo other smaller endothermic peaks, at ca. 50°C. (Figure 2). The strongestpeak at 266°C is attributed to the oib-POSS cage structure melting transition,as confirmed by visual observation of a sample heated in an oven.
Multiple melting transitions were previously observed by Abad et al. onglycidyleptaisobutyl POSS,24,25 in which two melting peaks were found at 112and 133°C. The authors attributed this thermal behaviour to different crystallineorganization in crystal core or boundaries.
For oib-POSS discussed here, let us suppose a different explanation for thetemperature difference between the two endothermic signals (ca. 50 and 266°C),one that is probably related to a crystalline organization of the oib-POSSorganic fraction, which will be the subject of further studies.
Thermogravimetric curves obtained in nitrogen at 1, 10 and 100°C min−1
are shown in Figure 3. The weight loss takes place in two steps. The major one(80–90% weight loss) occurs with maximum weight loss rate at Tmax = 237, 265,
Figure 2 Oib-POSS DSC analysis

206 Chapter 15
301°C depending on heating rate (1, 10, 100°C min−1, respectively). The second,minor, weight loss occurs over a broader range of temperatures (Tmax = 280 and320°C on heating at 1 and 10°C min−1, respectively) and is overlapped by themajor volatilisation process on heating at 100°C min−1. This second weight lossis probably related to degradation of a more stable phase formed during theprevious heating throughout the first step. A negligible residue is left above500°C.
Comparison of the TGA curves at 10°C min−1 of Figure 3 with the DSCcurve of Figure 2 suggests that, on heating, oib-POSS mainly evaporates uponmelting.
To confirm this interpretation, pyrolysis gas chromatograpy mass spec-trometry (Py GC-MS) was carried out to analyse the volatilisation productsevolved on heating oib-POSS.
The elution of a single peak at 34 min in GC-MS evidences oib-POSS purity(Figure 4). In the mass spectrum of oib-POSS (Figure 5) the molecular ion signal(m/z 874) is very low while electron impact gives rise to a series of fragmentsoriginating from oib-POSS by successive elimination of an isobutyl group as2-methylpropene (m/z 56 in Figure 5), which leaves a series of POSS of generalformula: (iBu)8 − nHnPOSS in which n = 1–7 (Scheme 1).
The most stable of these fragments is the hepta isobutyl POSS ion[(iBu)7H1POSS], producing the highest intensity peak at 816 m/z, followed bythe signal at 422 m/z, corresponding to hydrogen POSS [H8POSS], in whichno organic groups are left on the molecule. Other macromer ion peaks having
Figure 3 TGA plots for oib-POSS in N2 at different heating rates

207Octaisobutyl POSS Thermal Degradation
lower intensity correspond in the order, To hexa, penta, tetra, tri, di andmonoisobutyl POSS (m/z 760, 704, 648, 591, 535 and 479 respectively).
Py GC-MS of oib-POSS at 600°C mainly leads to POSS evaporation, asshown in Figure 6 by the major elution peak (almost identical to that ofFigure 4), whose mass spectrum is very close to that of volatilising oib-POSSreported in Figure 5 (see Figure 7 below).
The most evident degradation product of flash pyrolysis at 600°C is eluted at32.6 min in GC (Figure 6). It can be identified using the mass spectrum reportedin Figure 8 below; the molecular ion peak at 843 m/z indicates elimination ofethane (30 a.m.u., Scheme 2) from oib-POSS (874 a.m.u.) (see Scheme 2).
Figure 4 Chromatogram for oib-POSS in CHCl3 solution
Scheme 1 Elimination of 2-methylpropene from the POSS cage
Figure 5 Mass spectrum for oib-POSS in CHCl3 solution

208 Chapter 15
Figure 6 Oib-POSS flash pyrolysis chromatogram at 600 °C in helium
Figure 8 Mass spectrum of 600 °C pyrolysis product eluted at 32.6 min in Figure 6
Figure 7 Mass spectrum of 600 °C pyrolysis product eluted at 34.5 min in Figure 6

209Octaisobutyl POSS Thermal Degradation
Electron impact fragmentation of the resulting heptaisobutylvynilPOSS occurswith successive elimination of 2-methylpropene (56 a.m.u.) as in Scheme 1,giving rise to the corresponding peaks at m/z 786, 730, 674, 617, 561, 505 and449. A few other minor degradation products have been characterised, found bothat shorter and longer elution times than original oib-POSS (Figure 6).
On the basis of these results, the octa-isobutyl POSS is essentially thermallystable when rapidly heated to 600°C, with minor partial thermolysis of organicisobutyl substituents.
On increasing the flash pyrolysis temperature to 900°C, completely differentvolatile products are obtained. The oib-POSS elution peak at 34 min disappearsin the Py GC-MS chromatogram and low molecular weight compounds areformed (Figure 9), which have been identified, from their mass spectra, asunsatured organic molecules (Table 1). The first chromatogram peak around1.5 min in Figure 9 is due to several unseparated light organic products not yetidentified. Thus, at 900°C, degradation of the isobutyl groups overwhelmsevaporation of oib-POSS, probably leaving silica as a residue.
The formation, at 900°C, of volatile compounds, which are so different fromthe isobutyl substituents of the oib-POSS, shows that a complex degradationprocess takes place at 900°C, involving molecular fragmentations and rear-rangements of the substituents themselves, possibly catalysed by the silica-likestructure of the degrading POSS.
Scheme 2 Elimination of a molecule of ethane from the oib-POSS cage after pyrolysisat 600 °C
Figure 9 Oib-POSS flash pyrolysis chromatogram at 900 °C in helium

210 Chapter 15
15.3.2 Thermal Degradation in Oxidative Conditions
The behaviour in air is very different from that observed in an inert atmosphere,as oxygen plays an active role in the degradation process. Indeed, a majorweight loss step followed by a second broader and much smaller step is observedin air as in nitrogen. However, although the maximum rate of the majorweight loss occurs at temperatures similar to those of the correspondingthermogravimetries performed in nitrogen (Figures 10 and 3), the residual
Table 1 Volatile products of oib-POSS pyrolysis at 900 °C
Elution peak Elution time (min) Product Structure
1 4.0 1,5-Hexadiyne
2 5.8 Cycloheptatriene
3 8.3 Cyclooctatetraene
4 11.4 Indene
5 14.0 Azulene
Figure 10 TGA curves of oib-POSS in air; influence of the heating rates

211Octaisobutyl POSS Thermal Degradation
weight at 800°C in air is no longer negligible, but a significant amount ofthermally stable residue is usually found. Furthermore, the residue amountdepends on the heating rate: experiments run at at 1, 10, 100°C min−1 heatingrates gave 46, 26 and 20 wt% of residue respectively.
The second minor step of weight loss is more evident in air on heating at10°C min−1, whereas in nitrogen its evidence decreases with increasing heatingrate. Comparing the behaviour in air and in nitrogen (Figures 3 and 10) suggeststhat, under air, two concurrent phenomena are in competition: in fact, evapora-tion upon melting (typically found in inert atmosphere) is counterbalanced bythe oxidation of oib-POSS.
Experiments at a fixed heating rate and different sample weights show anincrease in the amount of residue at 800°C with an increase in sample weight(Figure 11). Differences in the amount of residual sample depending on theinitial mass of oib-POSS can be explained by the formation of a glassy surfacelayer due to thermal oxidation of oib-POSS, which is protective towardmass and heat transfer, hindering volatilisation of the underlying material; aconsiderable amount of sample is thus available for oxidation to stable residue.
As the sample is in powder form, an increase in sample weight does notchange significantly the exposed surface when placed in the TGA pan;conversely, the thickness of the powder lying in the sample cup changes. Onthis basis, it is reasonably clear that the weight of the sample protected ishigher for larger samples, thus justifying the residual fraction increase shownin Figure 11.
Figure 11 Oib-POSS thermogravimetry; influence of sample weight
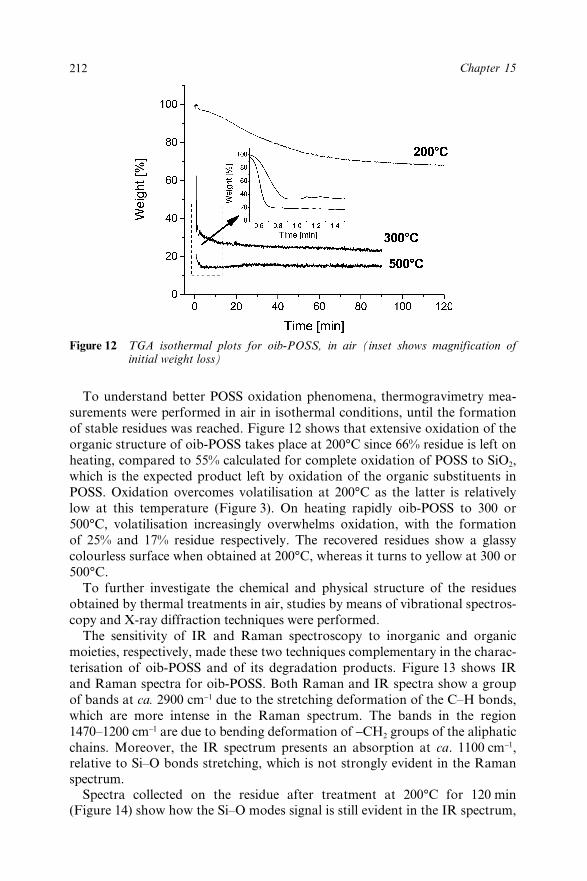
212 Chapter 15
To understand better POSS oxidation phenomena, thermogravimetry mea-surements were performed in air in isothermal conditions, until the formationof stable residues was reached. Figure 12 shows that extensive oxidation of theorganic structure of oib-POSS takes place at 200°C since 66% residue is left onheating, compared to 55% calculated for complete oxidation of POSS to SiO2,which is the expected product left by oxidation of the organic substituents inPOSS. Oxidation overcomes volatilisation at 200°C as the latter is relativelylow at this temperature (Figure 3). On heating rapidly oib-POSS to 300 or500°C, volatilisation increasingly overwhelms oxidation, with the formationof 25% and 17% residue respectively. The recovered residues show a glassycolourless surface when obtained at 200°C, whereas it turns to yellow at 300 or500°C.
To further investigate the chemical and physical structure of the residuesobtained by thermal treatments in air, studies by means of vibrational spectros-copy and X-ray diffraction techniques were performed.
The sensitivity of IR and Raman spectroscopy to inorganic and organicmoieties, respectively, made these two techniques complementary in the charac-terisation of oib-POSS and of its degradation products. Figure 13 shows IRand Raman spectra for oib-POSS. Both Raman and IR spectra show a groupof bands at ca. 2900 cm−1 due to the stretching deformation of the C–H bonds,which are more intense in the Raman spectrum. The bands in the region1470–1200 cm−1 are due to bending deformation of −CH2 groups of the aliphaticchains. Moreover, the IR spectrum presents an absorption at ca. 1100 cm−1,relative to Si–O bonds stretching, which is not strongly evident in the Ramanspectrum.
Spectra collected on the residue after treatment at 200°C for 120 min(Figure 14) show how the Si–O modes signal is still evident in the IR spectrum,
Figure 12 TGA isothermal plots for oib-POSS, in air (inset shows magnification ofinitial weight loss)

213Octaisobutyl POSS Thermal Degradation
whereas the C–H bond signals are less intense than in the neat POSS but are stillpresent, as is well shown by the Raman spectrum.
In the IR spectrum of Figure 14 a broad band centred at 3436 cm−1 is alsoobserved, due to hydroxyl groups H-bonded to water molecules that areadsorbed on the surface, and an absorption at 1637 cm−1, related to bending ofwater molecules. The presence of hydroxyl groups is probably due to partialcage fragmentation, as confirmed by WAXD analysis (see below).
Figure 13 IR and Raman spectra for neat oib-POSS
Figure 14 IR and Raman spectra for isobutyl POSS after treatment at 200 °C for120 min
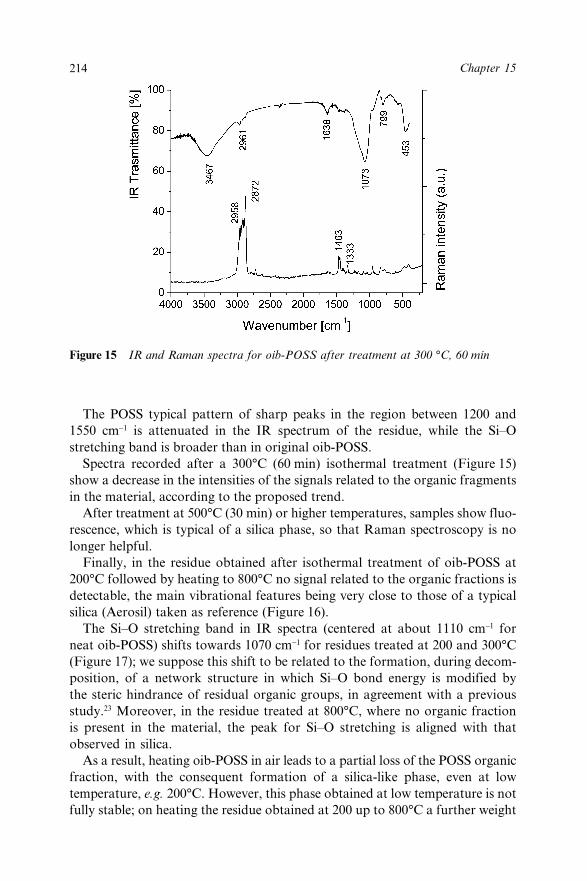
214 Chapter 15
The POSS typical pattern of sharp peaks in the region between 1200 and1550 cm−1 is attenuated in the IR spectrum of the residue, while the Si–Ostretching band is broader than in original oib-POSS.
Spectra recorded after a 300°C (60 min) isothermal treatment (Figure 15)show a decrease in the intensities of the signals related to the organic fragmentsin the material, according to the proposed trend.
After treatment at 500°C (30 min) or higher temperatures, samples show fluo-rescence, which is typical of a silica phase, so that Raman spectroscopy is nolonger helpful.
Finally, in the residue obtained after isothermal treatment of oib-POSS at200°C followed by heating to 800°C no signal related to the organic fractions isdetectable, the main vibrational features being very close to those of a typicalsilica (Aerosil) taken as reference (Figure 16).
The Si–O stretching band in IR spectra (centered at about 1110 cm−1 forneat oib-POSS) shifts towards 1070 cm−1 for residues treated at 200 and 300°C(Figure 17); we suppose this shift to be related to the formation, during decom-position, of a network structure in which Si–O bond energy is modified bythe steric hindrance of residual organic groups, in agreement with a previousstudy.23 Moreover, in the residue treated at 800°C, where no organic fractionis present in the material, the peak for Si–O stretching is aligned with thatobserved in silica.
As a result, heating oib-POSS in air leads to a partial loss of the POSS organicfraction, with the consequent formation of a silica-like phase, even at lowtemperature, e.g. 200°C. However, this phase obtained at low temperature is notfully stable; on heating the residue obtained at 200 up to 800°C a further weight
Figure 15 IR and Raman spectra for oib-POSS after treatment at 300 °C, 60 min

215Octaisobutyl POSS Thermal Degradation
loss occurs, confirming that an organic fraction is still present at the end of thefirst treatment (Figure 18).
Structural insights can be highlighted using X ray powder diffraction on theresidues treated at different temperatures. The WAXD pattern for oib-POSS pre-sents several sharp diffraction peaks due to product crystallinity; in particular,2h peaks at 8.0° and 8.8° are the most intense (Figure 19).
X-ray analysis on the residues from thermal treatments in air points out theformation of an amorphous phase. In particular, a very broad band between 15°
Figure 16 IR spectra for POSS after different thermal treatments in air
Figure 17 IR signals for Si–O bonds (Dashed line at 1070 cm−1 highlights signal fornetwork structure Si–O bonds, in comparison to signal for unstretched Si–Obonds at 1110 cm−1)
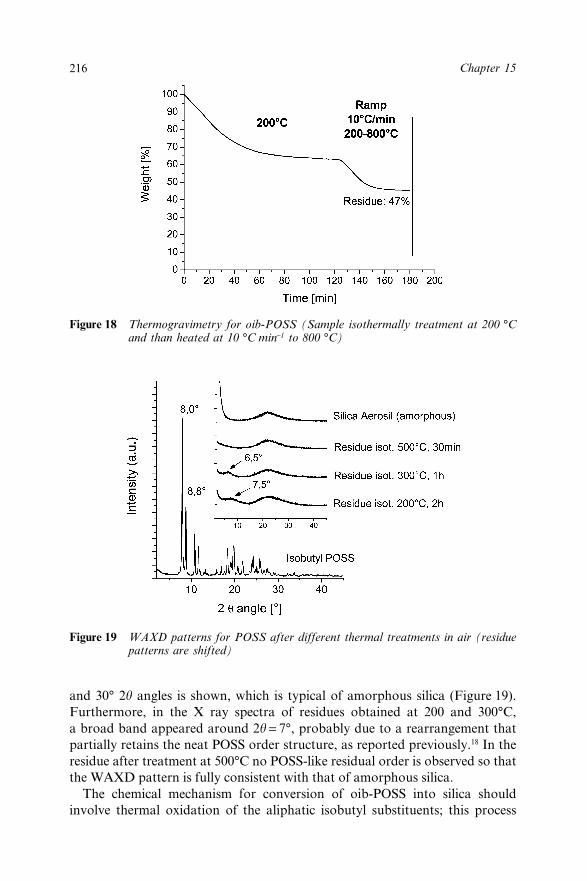
216 Chapter 15
and 30° 2h angles is shown, which is typical of amorphous silica (Figure 19).Furthermore, in the X ray spectra of residues obtained at 200 and 300°C,a broad band appeared around 2h = 7°, probably due to a rearrangement thatpartially retains the neat POSS order structure, as reported previously.18 In theresidue after treatment at 500°C no POSS-like residual order is observed so thatthe WAXD pattern is fully consistent with that of amorphous silica.
The chemical mechanism for conversion of oib-POSS into silica shouldinvolve thermal oxidation of the aliphatic isobutyl substituents; this process
Figure 18 Thermogravimetry for oib-POSS (Sample isothermally treatment at 200 °Cand than heated at 10 °C min−1 to 800 °C)
Figure 19 WAXD patterns for POSS after different thermal treatments in air (residuepatterns are shifted)

217Octaisobutyl POSS Thermal Degradation
proceeds in organic structures through peroxidation, propagated by radicalscreated in the thermoxidative process, which occurs with higher probability onthe tertiary carbon atom (Scheme 3).
Scheme 3 Peroxidation of the tertiary carbon atom of oib-POSS
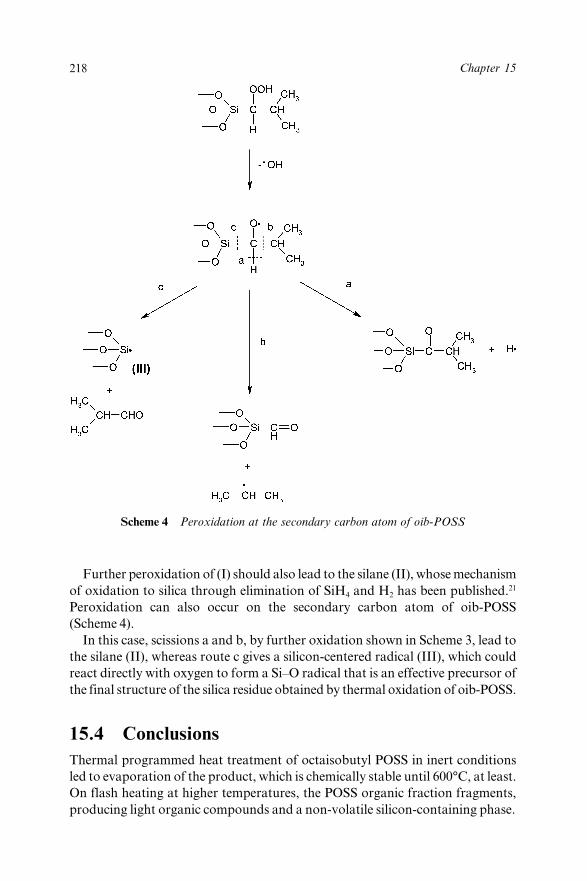
218 Chapter 15
Further peroxidation of (I) should also lead to the silane (II), whose mechanismof oxidation to silica through elimination of SiH4 and H2 has been published.21
Peroxidation can also occur on the secondary carbon atom of oib-POSS(Scheme 4).
In this case, scissions a and b, by further oxidation shown in Scheme 3, lead tothe silane (II), whereas route c gives a silicon-centered radical (III), which couldreact directly with oxygen to form a Si–O radical that is an effective precursor ofthe final structure of the silica residue obtained by thermal oxidation of oib-POSS.
15.4 ConclusionsThermal programmed heat treatment of octaisobutyl POSS in inert conditionsled to evaporation of the product, which is chemically stable until 600°C, at least.On flash heating at higher temperatures, the POSS organic fraction fragments,producing light organic compounds and a non-volatile silicon-containing phase.
Scheme 4 Peroxidation at the secondary carbon atom of oib-POSS

219Octaisobutyl POSS Thermal Degradation
In air, the degradation process is more complex; evaporation competes withan oxidation phenomenon that produced a silica-like thermally stable phase.
The structure of residual solid phase after thermoxidative treatments showsthe coexistence of an inorganic siliceous part and a POSS-like organomodifiedphase. The amount of organic content in the residue depends on the thermaltreatment conditions; the organic amount decreases with increasing treatmenttemperature, giving a silica-consistent structure for POSS treated in air upto 800°C.
The formation of such a ceramic phase can prefigure the use of POSS inpolymeric materials fire retardancy.15 In fact, during the burning process in thepresence of oxygen, ceramisation could occur on the superficial layer thanksto the (RSiO1,5)n composition. The formation of this layer seems to produce aphysical protection against combustion, by hampering diffusion of oxygen,evacuation of volatile and combustible products, and also limiting heat transfer,in analogy with the layered silicates mechanism.26
15.5 AcknowledgementsThis project was carried out in the framework of an Italian interuniversityresearch program (COFIN 2002) funded by the Ministery of Education,University and Research (MIUR).
15.6 References1. R.H. Baney, M. Itoh, A. Sakakibara and T. Suzuki, Chem. Rev., 1995, 95,
1409.2. P.G. Harrison, J. Organomet. Chem., 1997, 542, 141.3. G. Li, L. Wang, H. Ni and C.U. Pittman Jr., J. Inorg. Organomet. Polym.,
2001, 11, 123.4. K.J. Shea and D.A. Loy, Chem. Mater., 2001, 13, 33065. S. Lücke and K. Stoppek-Langner, Appl. Surf. Sci., 1999, 144–145, 713.6. P.P. Pescarmona and T. Maschmeyer, Aust. J. Chem., 2001, 54, 583.7. D.W. Scott, J. Am. Chem. Soc., 1946, 68, 356.8. X. Brown, J. Am. Chem. Soc., 1960, 82, 6194.9. F.J. Feher, D.A. Newman and J.F. Walzer, J. Am. Chem. Soc., 1989, 111,
1741.10. R.L. Blanski, K.J. Weller and J.W. Ziller, Organometallics, 1991, 10,
2526.11. F.J. Feher and T.A. Budzichowski, Polyhedron, 1995, 14, 3239.12. P.A. Agaskar, Inorg. Chem., 1990, 29, 1603.13. Proceedings of “POSS Nanotechnology Conference”, Huntington Beach,
CA, September 2002.14. S. Lu and I. Hamerton, Prog.-Polym. Sci., 2002, 27, 1661.15. J.D. Lichtenhan and J.W. Gilman, US Patent 6,362,279., 2002.16. H.C.L. Abbenhuis, Chem. Eur. J., 2000, 6, 25.

220 Chapter 15
17. C. Bolln, A. Tsuchida, H. Frey and R. Mülhaupt, Chem. Mater., 1997, 9,1475.
18. R.A. Mantz, P.F. Jones, K.P. Chaffee, J.D. Lichtenhan and J.W. Gilman,Chem. Mater., 1996, 8, 1250.
19. M.J. Loboda and G.A. Toksey, Solid State Technol., 1998, 41, 99.20. H.C. Liou and J. Pretzer, Thin Solid Films, 1998, 335, 186.21. Y.K. Siew, G. Sarkar, X. Hu, J. Hui, A. See and C.T. Chua, J.
Electrochem. Soc., 2000, 147, 335.22. C.C. Yang and W.C. Chen, J. Mater. Chem., 2002, 12(4), 1138.23. W.C. Liu, C.C. Yang, W.C. Chen, B.T. Dai and M.S. Tsai, J. Non-Cryst.
Solids, 2002, 311, 233.24. C. Ramirez, M.J. Abad, L. Barral, J. Cano, F.J. Diez, J. Lopez,
R. Montes and J. Polo, J. Therm Anal. Calorim., 2003, 72, 421.25. M.J. Abad, L. Barral, D.P. Fasce and R.J.J. Williams, Macromolecules,
2003, 36, 3128.26. M. Zanetti, T. Kashiwagi, L. Falqui and G. Camino, Chem. Mater., 2002,
14, 881.
Mineral Fillers in Synergistic Systems

223
CHAPTER 16
Interactions between Nanoclaysand Flame Retardant Additivesin Polyamide 6 and Polyamide6.6 FilmsA. RICHARD HORROCKS, BALJINDER K. KANDOLAAND SUZANNE A. PADBURY
Centre for Materials Research and Innovation, Bolton Institute, Bolton, BL35AB, UK ([email protected])
16.1 IntroductionWe recently briefly reviewed the research published since 2000 regardingthe consequences of introducing functionalised nanoclays into synthetic fibre-forming polymers such as polyamide 6, and 6.6 fibres.1 This same reviewpresents evidence, based on recent heat release studies of polyamide 6 compos-ites of varying thickness at high heat fluxes such as 50 kW m−2,2 that the abilityof any nanodispersed clay particles present at 2 wt% will be marginal, and athigher concentrations of 5 wt% will produce less than a 10% reduction in peakheat release rate, PHRR. The only published work to date on the effect ofnanoclays in polyamide 6 fibres is that by Bourbigot et al.3,4 which showsa 33% reduction in PHRR when exposed to a heat flux of 35 kW m−2. We haveexplained this larger effect at the lower heat flux as a consequence of the compe-tition between nanoclay particle aggregation to form a surface barrier andvolatilisation in a thermally thin condition, favouring the former, whereas athigher heat fluxes the latter is favoured.1
When condensed phase, sometimes intumescent, phosphorus-containing flameretardants are added to polyamide 6, and 6.6 polymers, the flame retardantproperty versus concentration relationship is not linear, and usually “S”-shapedas reviewed by Levchik, and Weil.5 As indicated by ourselves,1 significantflame retardancy is observed only at FR concentrations for ammoniumpolyphosphate, and similar species greater than 15 wt% in fibre-forming

224 Chapter 16
polymers such as polypropylene and polyamide 6. Usually, levels > 20%are required in bulk polyamide formulations to achieve V0 ratings in the UL94test, and this is considered to correspond to an LOI > 25 or so. For potentialfibre end-uses, such high levels are inappropriate because of the deleterious effectson desirable textile properties such as strength, lustre, and dyeability. Ideally,flame retardant levels < 10 wt% are more acceptable for fibre applications.
Recent research on a number of different polymeric substrates has led severalworkers to believe,6 including ourselves, that the introduction of nanoclays,while enhancing char levels will only provide realistic fire resistant solutions ifincorporated in polymers with other compatible and, hopefully, synergistic FRcomponents.
While previous results have presented greater experimental detail,7 thischapter concentrates on those nanoclay-flame retardant combinations thatdemonstrate at least additive, and at best synergistic, behaviour for severalphosphorus-containing flame retardants in the presence of commercially avail-able nanocomposite polyamides 6, and 6.6 cast into films. These are consideredas possible models for fibres, and other thermally thin polymeric materials, andthe results are interpreted in terms of our previously generated model.1 Theprime flame retardant parameter described here is the limiting oxygen index.
16.2 Experimental16.2.1 MaterialsA range of phosphorus-containing flame retardants was selected (Table 1).Proban CC polymer was prepared by introducing a commercial sample of theTHPC-urea [tetrakis(hydroxymethyl)phosphonium chloride urea] condensatesolution into a desiccator containing 0.91 g ml−1 ammonia solution. Once thesolution had solidified it was then washed, and dried, prior to grinding to a finepowder. The ground polyphosphine-ammonia condensate was then oxidized in a7 vol% hydrogen peroxide solution until the exothermic reaction had finished.Further washing, and drying was carried out, and the oxidised, stable ProbanCC polymer was then reground to a finer powder that was then ready to use.
Polyamides 6 and 6.6, both with and without nanooclay (unspecified typepresent at a nominal 2 wt% level), were supplied as pellets by RTP Company(UK) Plastics Ltd.
Table 1 Flame retardants
FR Manufacturer Constitution
Antiblaze MCM Rhodia Ammonium polyphosphateAntiblaze NH Rhodia Melamine phosphateAntiblaze CU Rhodia Cyclic organophosphonateProban CC polymer Rhodia Poly (phosphine oxide)Antiblaze MCM/pentaerythritol Rhodia APP/PERMPC 1000 Rhodia APP/PER/melamineNH 1197 Great Lakes Pentaerythritol phosphateNH 1511 Great Lakes PER phosphate/melamine

225Interactions in Polyamide 6 and Polyamide 6.6 Films
16.2.2 Film Preparation
Each polymer dope was made by dissolving a given weight of polymer chips(standard, or comprising a nanoclay, in this instance) in a calculated volume of90% formic acid. For each polymer/additive solution, a total solid content of33% w/v was maintained, irrespective of FR additive incorporated, as experi-mental work indicated this to be the most suitable viscosity to work with. Withineach solution was a selected mass ratio of components–polymer, nanoclayif present, and FR such that approximate FR contents were 11, 15, 20, 23 or27 wt%.
The film casting technique involved spreading the polymer dope on to aglass plate using a K-bar (selected on the basis of obtaining a film thicknessof ca. 50 µm), and then leaving the film to stand in a fume cupboard for ca. 24hours for the formic acid to fully evaporate off. The films were then peeled awayfrom the glass plate. No attempt was made to analyse the size or distribution ofthe dispersed flame retardants, and it was evident that, except for films contain-ing the liquid flame retardant, Antiblaze CU, all cast films had varying degreesof opacity compared with the translucent FR-free films. In fact, films containingAPP were chalky in appearance, indicating their extremely heterogeneouscharacter.
Phosphorus analysis was carried out on randomly selected films to ensurecomplete retention of the additive within the generated film. Thickness testing ofeach cast film was carried out, verifying overall uniformity of each cast film.Film thicknesses were typically in the range 40–50 µm.
16.2.3 Flammability Measurement
Limiting oxygen index measurements were carried out on a Stanton RedcroftFTA instrument for film samples according to ASTM D2863-77 (revised 1990).Since the area densities of cast films were 40–50 g m−2, LOI measurements wereundertaken on double-layered samples to give an area density of 80–100 g m−2,which is similar to that of a lightweight textile fabric.
16.2.4 Thermal Analysis
Differential thermal analytical studies of 5 mg samples were undertaken induplicate in a TA Instruments SDT 2960 under flowing nitrogen (100 ml min−1)at a heating rate of 10 K min−1.
16.3 Results and Discussion16.3.1 Thermal Analytical Behaviour: Nanocomposite Character
The normal ways of ascertaining nanocomposite character in polymers are byuse of transmission electron microscopy or X-ray diffraction.8,9 However, thepresence of a dispersed nanoclay in polyamide 6 favours the formation of the

226 Chapter 16
lower melting c-form (melting point about 212°C) in unorientated samples.10,11
While evidence of a similar favourable form in polyamide 6.6 has not beendemonstrated, Figures 1 and 2 show DTA responses for both polyamide 6.6 and
Figure 2 DTA endotherms for polyamide or nylon 6 in combination in the presence andabsence of the nanoclay, and with the exclusion of FR additive
Figure 1 DTA curves for the polyamide or nylon 6.6 polymer, with and without theinclusion of the nanoclay, and in the absence of FR additive

227Interactions in Polyamide 6 and Polyamide 6.6 Films
6 polymer samples, respectively, in the absence and presence of nanoclay for thecommercial polymers selected in this work.
Figure 1 shows that the bimodal structure of the fusion endotherm for the purepolyamide 6.6 film, presumably the a-form, changes to a single peak when thenanoclay is present. The change in shape is indicative of a modification tothe polycrystalline structure, and that this could be associated with the effectof the nanodispersed particles influencing the ordering of polyamide chains.Figure 3 typifies the effect of the addition of flame retardant, which for increas-ing concentrations of APP restore the bimodal character. Table 2 lists the fusionminima temperature for normal and nanocomposite polyamide 6.6 films, withand without flame retardants. Evidently, the positions of the single or majorbimodal minima are similar for both unretarded films, and the addition of anyof the flame retardants reduces minima temperatures slightly. However, increas-ing FR concentration has little further effect. That each of the flame retardantshas a lowest endotherm, which may be lower than (e.g. 191°C for APP/PER asa consequence of PER melting) or greater than the polymer melting point (e.g.the volatilisation endotherm for Antiblaze CU at about 272°C or decompositionof APP at about 311°C), and that these appear to have little effect on polyamide6.6 melting points, indicates that they are indeed micro-dispersed within films.
In Figure 2 the presence of nanoclay in polyamide 6 films not only causesa similar shift from a bimodal endotherm to a single minimum, but the tempera-ture of the latter is less than that of the higher melting bimodal minimum. Table3 shows this shift from 217.4 to 215.3°C to be indicative of the favouring of thec-crystalline form, suggestive of a nanocomposite structure.10,11 The addition of
Figure 3 Resultant DTA endotherms for polyamide 6.6 films with the inclusion of bothnanoclay and APP at 15–27% FR additive concentration levels
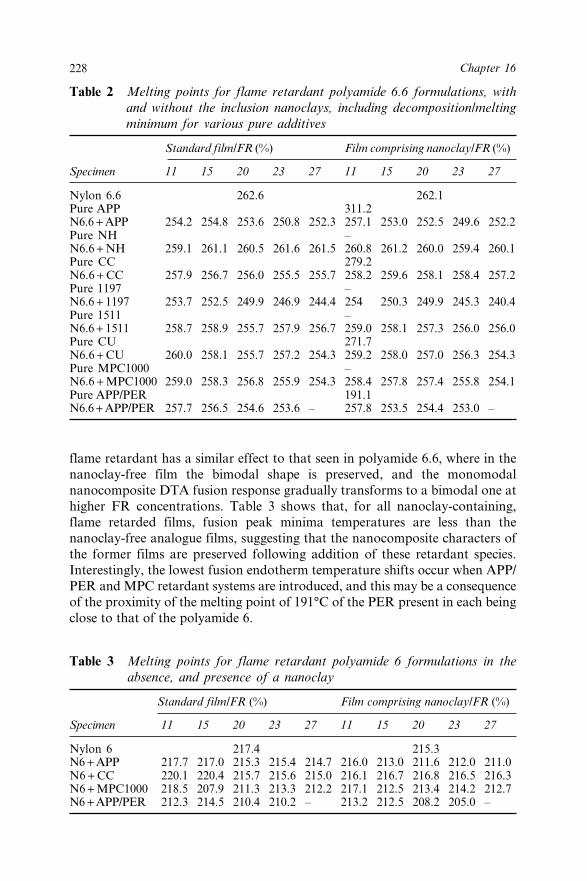
228 Chapter 16
flame retardant has a similar effect to that seen in polyamide 6.6, where in thenanoclay-free film the bimodal shape is preserved, and the monomodalnanocomposite DTA fusion response gradually transforms to a bimodal one athigher FR concentrations. Table 3 shows that, for all nanoclay-containing,flame retarded films, fusion peak minima temperatures are less than thenanoclay-free analogue films, suggesting that the nanocomposite characters ofthe former films are preserved following addition of these retardant species.Interestingly, the lowest fusion endotherm temperature shifts occur when APP/PER and MPC retardant systems are introduced, and this may be a consequenceof the proximity of the melting point of 191°C of the PER present in each beingclose to that of the polyamide 6.
Table 2 Melting points for flame retardant polyamide 6.6 formulations, withand without the inclusion nanoclays, including decomposition/meltingminimum for various pure additives
Standard film/FR (%) Film comprising nanoclay/FR (%)
Specimen 11 15 20 23 27 11 15 20 23 27
Nylon 6.6 262.6 262.1Pure APP 311.2N6.6 + APP 254.2 254.8 253.6 250.8 252.3 257.1 253.0 252.5 249.6 252.2Pure NH –N6.6 + NH 259.1 261.1 260.5 261.6 261.5 260.8 261.2 260.0 259.4 260.1Pure CC 279.2N6.6 + CC 257.9 256.7 256.0 255.5 255.7 258.2 259.6 258.1 258.4 257.2Pure 1197 –N6.6 + 1197 253.7 252.5 249.9 246.9 244.4 254 250.3 249.9 245.3 240.4Pure 1511 –N6.6 + 1511 258.7 258.9 255.7 257.9 256.7 259.0 258.1 257.3 256.0 256.0Pure CU 271.7N6.6 + CU 260.0 258.1 255.7 257.2 254.3 259.2 258.0 257.0 256.3 254.3Pure MPC1000 –N6.6 + MPC1000 259.0 258.3 256.8 255.9 254.3 258.4 257.8 257.4 255.8 254.1Pure APP/PER 191.1N6.6 + APP/PER 257.7 256.5 254.6 253.6 – 257.8 253.5 254.4 253.0 –
Table 3 Melting points for flame retardant polyamide 6 formulations in theabsence, and presence of a nanoclay
Standard film/FR (%) Film comprising nanoclay/FR (%)
Specimen 11 15 20 23 27 11 15 20 23 27
Nylon 6 217.4 215.3N6 + APP 217.7 217.0 215.3 215.4 214.7 216.0 213.0 211.6 212.0 211.0N6 + CC 220.1 220.4 215.7 215.6 215.0 216.1 216.7 216.8 216.5 216.3N6 + MPC1000 218.5 207.9 211.3 213.3 212.2 217.1 212.5 213.4 214.2 212.7N6 + APP/PER 212.3 214.5 210.4 210.2 – 213.2 212.5 208.2 205.0 –

229Interactions in Polyamide 6 and Polyamide 6.6 Films
16.3.2 Limiting Oxygen Index Measurements
16.3.2.1 Polyamide 6.6
To determine whether particular flame retardants acted positively or negativelyin the presence of the nanoclay present, LOI results obtained for all the gener-ated films were initially represented as the difference between respective filmvalues, with and without the presence of a nanoclay, i.e. DLOI = LOI(nanoclay + FR)
− LOI(FR). Tables 4 and 5 contain the individual sets of LOI data for these tworespective flame retardant groups. These difference curves are illustrated inFigure 4, and suggest that the incorporation of a nanoclay, in conjunctionwith the FR additive, does not necessarily increase the LOI of the film samplecontaining FR only. Certain FR additives, in particular Antiblaze CU andmelamine phosphate NH, behave in a negative manner. The remainder of thefilms examined indicate a positive effect at FR levels < 20%. Above this concen-tration level, however, DLOI values exhibit an overall decline.
LOI versus FR concentration data from Table 4 for the positive DLOI-generating polyamide 6.6/FR and polyamide 6.6/FR/nanoclay systems areillustrated in Figure 5. Trends for each formulation show general increases inLOI with FR concentration with APP, Proban CC, and MPC1000 retardants inthe absence of nanoclays as “S”-shaped trends with significant LOI increases
Table 4 Positive DLOI flame retardant data for polyamide 6.6 films
Additive &actual level
Standard films Nano films
(wt%) %P LOI% DLOI/P LOI% DLOI/P
No additive – 21.0 – 21.8 –11% APP 3.2 21.4 0.13 22.2 0.1315% APP 4.8 21.4 0.08 23.0 0.2520% APP 6.4 21.4 0.06 23.8 0.3123% APP 7.0 23.4 0.34 25.0 0.4627% APP 8.2 24.6 0.44 25.8 0.49
11% CC 1.8 21.6 0.33 22.2 0.2215% CC 2.4 22.4 0.58 23.4 0.6720% CC 3.2 22.8 0.56 24.2 0.7523% CC 3.7 23.6 0.70 24.6 0.7627% CC 4.3 24.4 0.79 24.6 0.65
11% MPC1000 2.0 21.8 0.40 21.8 015% MPC1000 2.7 21.8 0.30 22.6 0.3020% MPC1000 3.6 23.8 0.78 24.2 0.6723% MPC1000 4.1 24.2 0.78 24.6 0.6827% MPC1000 4.9 25.4 0.90 24.6 0.57
11% APP/PER 2.2 21.8 0.36 22.2 0.1815% APP/PER 3.0 22.6 0.53 22.6 0.2720% APP/PER 4.0 23.0 0.50 23.0 0.3023% APP/PER 4.6 24.2 0.70 23.4 0.35
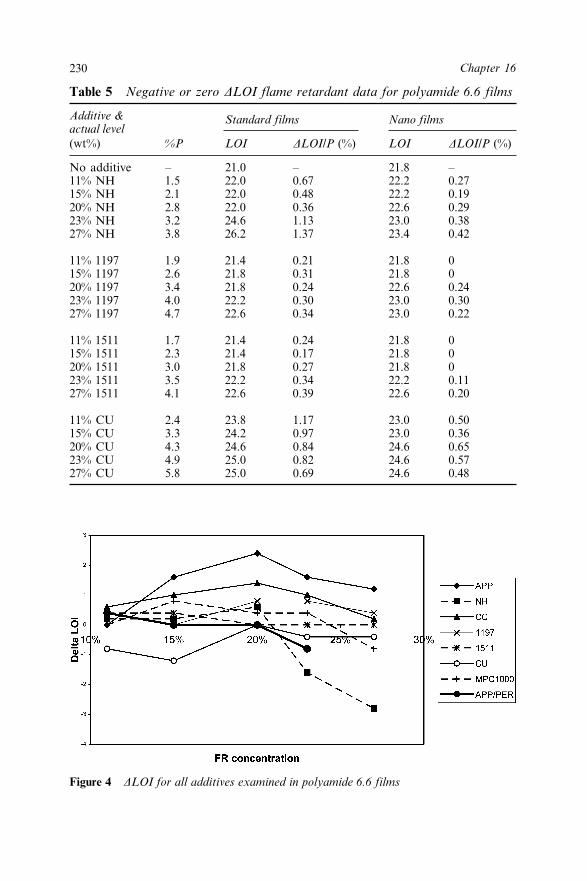
230 Chapter 16
Table 5 Negative or zero DLOI flame retardant data for polyamide 6.6 films
Additive &actual level
Standard films Nano films
(wt%) %P LOI DLOI/P (%) LOI DLOI/P (%)
No additive – 21.0 – 21.8 –11% NH 1.5 22.0 0.67 22.2 0.2715% NH 2.1 22.0 0.48 22.2 0.1920% NH 2.8 22.0 0.36 22.6 0.2923% NH 3.2 24.6 1.13 23.0 0.3827% NH 3.8 26.2 1.37 23.4 0.42
11% 1197 1.9 21.4 0.21 21.8 015% 1197 2.6 21.8 0.31 21.8 020% 1197 3.4 21.8 0.24 22.6 0.2423% 1197 4.0 22.2 0.30 23.0 0.3027% 1197 4.7 22.6 0.34 23.0 0.22
11% 1511 1.7 21.4 0.24 21.8 015% 1511 2.3 21.4 0.17 21.8 020% 1511 3.0 21.8 0.27 21.8 023% 1511 3.5 22.2 0.34 22.2 0.1127% 1511 4.1 22.6 0.39 22.6 0.20
11% CU 2.4 23.8 1.17 23.0 0.5015% CU 3.3 24.2 0.97 23.0 0.3620% CU 4.3 24.6 0.84 24.6 0.6523% CU 4.9 25.0 0.82 24.6 0.5727% CU 5.8 25.0 0.69 24.6 0.48
Figure 4 DLOI for all additives examined in polyamide 6.6 films

231Interactions in Polyamide 6 and Polyamide 6.6 Films
occurring only above 15 wt% presence. The presence of the nanoclay smootheseach of these trend shapes into a more uniform trend, and effectively shifts eachto the left-hand side, demonstrating the origin of the positive DLOI trends inFigure 4.
Of specific interest is the behaviour of APP, which exhibits the lowest LOI atlow concentration in the absence of nanoclay and yet yields the highest LOIs at20% FR and above in the presence of nanoclay, as indicated also in Figure 4.The intumescent APP-containing MPC1000 films generally shows superiorvalues in the absence of the nanoclay but, in contrast, exhibit the minimalincrease when the nanoclay is present. However, all of the effective systems thatinclude the nanoclay demonstrate possible synergistic behaviour, showing thatlower FR addition levels produce higher LOI in comparison to the films withoutthe clay.
While the melamine phosphate Antiblaze NH initially shows a good LOIincrease with concentration, the inclusion of the nanoclay suggests that itspresence is minor. However, during film casting, this sample produced a slightlygrainy, surface-textured opaque film, suggesting that the nanoclay had aggre-gated, possibly because of the relative acidity (pH ~3.2) of this FR, whichcould have interacted with the positively charged, functionalised component ofthe nanophase. NH1197 and NH1511 additives, both possessing a pH of 4.5,produced clearer, translucent films, and still only achieve minimal activitywhen incorporated with the nanoclay. Interestingly, Antiblaze CU, althoughdemonstrating much higher LOIs, behaves in a similar manner to NH1197, andNH1511.
Further reason for the positive nanoclay-FR activities of APP-containing andProban CC films could be a consequence of their being highly activated at themelting temperature of polyamide 6.6 (~265°C). For example, APP starts to
Figure 5 LOI for FR/polyamide 6.6 and FR nanocomposite polyamide 6.6 films for FRsshowing positive behaviour in the presence of nanoclay

232 Chapter 16
decompose at 251°C12 with release of ammonia, water, and free P-OH acidicgroups.13 Melamine phosphate (Antiblaze NH) also starts to decompose at256°C, but yields predominantly melamine pyrophosphate initially.14 BothNH1511 and NH1197 pentaerythritol phosphate derivatives are far more stablewith respective onsets of degradation at 280°C, and 288°C. Interestingly,Antiblaze CU is a liquid, and starts to lose mass at only 197°C,13 althoughwhether this involves major chemical decomposition is not known.
With regard to APP/PER polyamide 6.6 films, the results in Table 5 showthat the presence of PER (as a char source, not as a specific flame retardant)increases the overall LOIs obtained but a negligible effect of nanoclay isevident, as discussed previously.7
Comparison of DLOI/P of each FR additive examined, both with andwithout the presence of the nanoclay, enables the effect of nanoclay on the poten-tial effectiveness of a given phosphorus-containing FR to be assessed. Forexample, DLOI/Ps for nanoclay-containing APP and Proban CC formulations(Table 4) are greater than those not containing nanoclay, showing that thepresence of the latter has effectively increased the respective FR efficiency. ForMPC1000 and APP/PER, this increase with respect to phosphorus is not seenbecause the effect of nanoclay presence is only marginal up to 20% FR content,and DLOI values relate to slightly different respective zero% FR polymervalues.DLOI/P results presented in Table 5 show that the presence of the nanoclay
significantly reduces, and even negates completely, the effect of the FR present.To determine the overall synergistic effectivity of each FR additive investigatedthe method of Lewin15 has been employed in that DLOI(FR + synergist)/DLOI(FR)
values were calculated for each FR in the presence of the nanoclay (i.e. thesynergist) and expressed per unit% of FR. Figure 6 shows plots of effectivity
Figure 6 Synergistic effectivity of nanoclay presence for all FR systems in polyamide 6.6films

233Interactions in Polyamide 6 and Polyamide 6.6 Films
represented as the increase in LOI for 1% of the FR element, and only thosesystems having effectivity values greater than unity are synergistic.
In conclusion, therefore, it is apparent from the results shown here that onlyAPP and Proban CC demonstrate synergistic behaviour, while MPC1000 andAPP/PER, previously categorised as effective systems in Figure 4, impartincreased FR activity via the additive effect of nanoclay, and the respective FR.
16.3.2.2 Polyamide 6
Based on the above results, films were cast that contained only APP, ProbanCC, MPC1000, and APP/PER as flame retardants. The LOIs obtained for thepolyamide 6 films generated with and without the presence of the nanoclayversus concentration are shown in Table 6, and these results have been analysedin detail elsewhere.7 When the results are plotted as DLOI = LOI(nanoclay + FR) −LOI(FR) versus FR concentration in Figure 7, it would appear that the presenceof nanoclay acts in an antagonistic manner. However, the presence of nanoclayhas depressed the LOI of polyamide 6 film alone from 22.6 to 18.8, and so theeffect of added flame retardant should be referred to this reduced value. Thismay be undertaken by comparing the increase in LOI per unit phosphorus,DLOI/P in the absence, and presence of nanoclay as listed in Table 6.
Table 6 LOI and DLOI flame retardant data for polyamide 6 films
Standard films Nano films
Additive %P LOI DLOI/P (%) LOI DLOI/P (%)
No additive – 22.6 – 18.8 –
11% APP 3.2 23.4 0.25 20.6 0.5615% APP 4.8 23.4 0.17 22.4 0.7520% APP 6.4 24.2 0.25 24.8 0.9423% APP 7.0 26.0 0.49 26.4 1.0227% APP 8.2 26.0 0.41 26.8 0.98
11% CC 1.8 23.4 0.44 21.4 1.4415% CC 2.4 24.2 0.67 21.8 1.2520% CC 3.2 25.0 0.75 22.2 1.0123% CC 3.7 25.0 0.65 23.4 1.2427% CC 4.3 25.0 0.28 23.8 1.16
11% MPC1000 2.0 23.8 0.60 21.0 1.1015% MPC1000 2.7 23.8 0.44 21.8 1.1120% MPC1000 3.6 25.4 0.78 22.2 0.9423% MPC1000 4.1 25.4 0.68 23.4 1.1227% MPC1000 4.9 25.8 0.65 25.4 1.35
11% APP/PER 2.2 23.8 0.55 21.0 1.0015% APP/PER 3.0 24.2 0.53 21.8 1.0020% APP/PER 4.0 24.6 0.50 22.6 0.9523% APP/PER 4.6 24.6 0.43 23.8 1.09

234 Chapter 16
These results show that DLOI/Ps are significantly greater for nanoclay-containing, flame retarded polyamide 6 films, as noted in Table 4 for polyamide6.6 films. The lowering of the LOI of polyamide 6 to 18.8 prevents synergisticeffectivity values being calculated as for polyamide 6. However, the potentiallypositive interaction between nanoclay and the selected FRs in polyamide 6, bydefining the ratio R = [DLOI/P]nanoclay /DLOI/P for each flame retardant and byplotting R versus FR%, is shown in Figure 8.
These trends show clearly that the presence of nanoclay increases the FRefficiency by at least an average factor of 2, thereby indicating a positivenanoclay–FR interaction for each of these retardants. The effect of the nanoclay
Figure 7 DLOI for FR additives in polyamide 6 films
Figure 8 Ratio, R, of increase in LOI per unit phosphorus in nanoclay-containingpolyamide 6 film compared to the standard film

235Interactions in Polyamide 6 and Polyamide 6.6 Films
alone on the burning behaviour of unretarded polyamide 6 films has beenexplained previously in terms of a change in the rheology of the melting film,and hence the value of the LOI measurement obtained.7
16.4 A Simple Model for Nanoclay–Fr InterationIn our previous publication1 we suggested a simple way of quantitatively model-ling the char-enhancing or “bridging” effect that the presence of nanodispersedfunctionalised clays may exert when present with microdispersed flame retar-dant particles. This original model involved calculating the mean distancebetween flame retardant particles having a certain size and dispersed in apolymer matrix, which for simplicity may be considered to be homogeneous byapplying the simple concept of “mean free path” as an average distance, l,between dispersed species having a “collision diameter” or average diameter, s.In a gas, it is assumed that individual gas molecules may be free to move asshown in Figure 9(a); in the situation of particles suspended in a polymer, wherethey are fixed, the “movement” is that of the reaction zone that spreads out froma given particle when heated above its reaction temperature. This is shown sche-matically in Figure 9(b). This may, for our purposes, also be influenced by thecollisional frequency of reactive species in the molten polymer. Thus, the spreadof this reaction zone in a polymer volume V may have a mean radius or “reac-tion length” before “colliding” or interacting with a second particle that maybe defined for a single microdispersed flame retardant as follows shown inEquation (1).16
l = V/(√2πNs2 ) (1)
for N dispersed spherical particles. If the retardant is present at a volumefraction vfa, where vfa = (mfa /ra )/ (mfa /ra + mfp /rp ) and mfa, and mfp, and ra, and rp
are respective additive and polymer mass fractions, and densities, then:
Figure 9 Schematic representation of (a) mean free path of a gas molecule, and (b) of arandomly expanding reaction zone around a flame retardant particle

236 Chapter 16
N Vv= ( fa ) /[ ( / ) ]43
2 3π s (2)
Combining Equations (1), and (2) yields:
l = s/(√2.6vfa) = s/(8.5vfa ) (3)
Thus for a given concentration, and hence volume fraction of flame retardantin a given volume V of polymer, as particle diameter increases so the mean“reaction zone” separation increases; conversely, as the diameter decreases soseparation reduces.
The above model may be illustrated for a typical APP particle like AntiblazeMCM (Table 1) with reported density r = 1.90 g cm−3 and sA = 25 µm,17 dis-persed in a polyamide 6 or 6.6 matrix with r = 1.14 g cm−3. If APP particles maybe assumed to promote char at a lower temperature than the nanoclay particle,then we may apply Equation (3) for the range of APP concentrations used inTable 2. Table 7 lists these results. Similarly, assuming an average diameter fora nanoclay particle, sB = 100 nm, and generic clay density of 2 g cm−3 (reference1) then the average reaction distance between any two nanoclay particles at0.5–5.0 wt% (or pph) may also be calculated using Equation (3). The results arealso listed in Table 7 which shows that for 2 wt% nanoclay l = 0.95 µm.
Our previous paper1 also showed that the presence of nanoclay causedthe shifts of LOI versus FR concentration plots in Figure 5, may be quantifiedas reductions in FR concentrations in Table 8 at LOIs of 23 and 24, which areseen to be about the inflexion points in each respective “S-shaped” curve. Thus,
Table 7 Average interparticle distance, l µm, for Antiblaze MCM ammoniumpolyphosphate (s = 25 µm, and r = 1.90 g cm−3), and a nanoclay(s = 100 nm and r = 2 g cm−3) dispersed in polyamide 6 or 6.6(r = 1.14 g cm−3)
Additive, Mass Volumepph fraction fraction l (mm)
APP11 0.11 0.07 4215 0.15 0.10 3020 0.2 0.13 2223 0.23 0.16 1927 0.27 0.19 1628.5 0.285 0.20 15
Nanoclay0.5 0.005 0.0031 3.821 0.01 0.0062 1.902 0.02 0.0124 0.955 0.05 0.0315 0.37
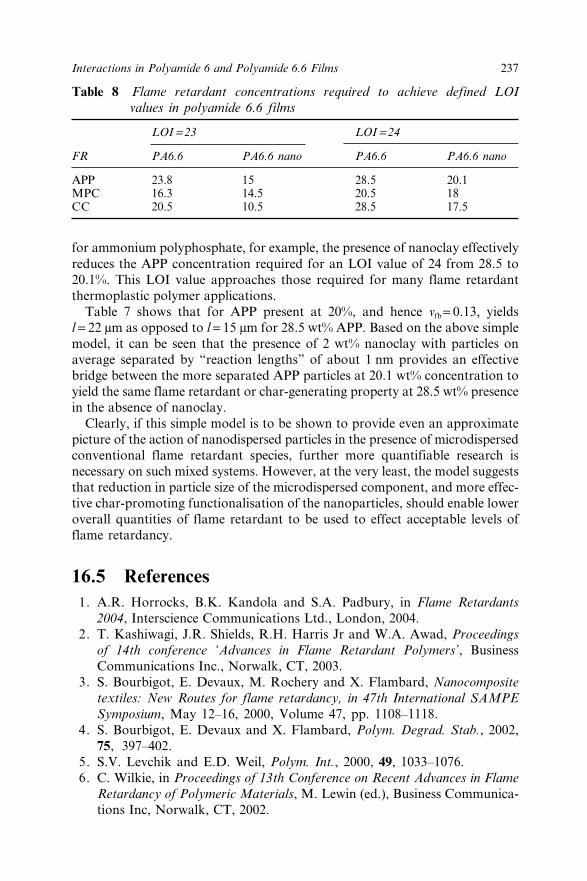
237Interactions in Polyamide 6 and Polyamide 6.6 Films
for ammonium polyphosphate, for example, the presence of nanoclay effectivelyreduces the APP concentration required for an LOI value of 24 from 28.5 to20.1%. This LOI value approaches those required for many flame retardantthermoplastic polymer applications.
Table 7 shows that for APP present at 20%, and hence vfb = 0.13, yieldsl = 22 µm as opposed to l = 15 µm for 28.5 wt% APP. Based on the above simplemodel, it can be seen that the presence of 2 wt% nanoclay with particles onaverage separated by “reaction lengths” of about 1 nm provides an effectivebridge between the more separated APP particles at 20.1 wt% concentration toyield the same flame retardant or char-generating property at 28.5 wt% presencein the absence of nanoclay.
Clearly, if this simple model is to be shown to provide even an approximatepicture of the action of nanodispersed particles in the presence of microdispersedconventional flame retardant species, further more quantifiable research isnecessary on such mixed systems. However, at the very least, the model suggeststhat reduction in particle size of the microdispersed component, and more effec-tive char-promoting functionalisation of the nanoparticles, should enable loweroverall quantities of flame retardant to be used to effect acceptable levels offlame retardancy.
16.5 References1. A.R. Horrocks, B.K. Kandola and S.A. Padbury, in Flame Retardants
2004, Interscience Communications Ltd., London, 2004.2. T. Kashiwagi, J.R. Shields, R.H. Harris Jr and W.A. Awad, Proceedings
of 14th conference ‘Advances in Flame Retardant Polymers’, BusinessCommunications Inc., Norwalk, CT, 2003.
3. S. Bourbigot, E. Devaux, M. Rochery and X. Flambard, Nanocompositetextiles: New Routes for flame retardancy, in 47th International SAMPESymposium, May 12–16, 2000, Volume 47, pp. 1108–1118.
4. S. Bourbigot, E. Devaux and X. Flambard, Polym. Degrad. Stab., 2002,75, 397–402.
5. S.V. Levchik and E.D. Weil, Polym. Int., 2000, 49, 1033–1076.6. C. Wilkie, in Proceedings of 13th Conference on Recent Advances in Flame
Retardancy of Polymeric Materials, M. Lewin (ed.), Business Communica-tions Inc, Norwalk, CT, 2002.
Table 8 Flame retardant concentrations required to achieve defined LOIvalues in polyamide 6.6 films
LOI = 23 LOI = 24
FR PA6.6 PA6.6 nano PA6.6 PA6.6 nano
APP 23.8 15 28.5 20.1MPC 16.3 14.5 20.5 18CC 20.5 10.5 28.5 17.5

238 Chapter 16
7. S.A. Padbury, A.R. Horrocks and B.K. Kandola, in Proceedings of 14thConference ‘Advances in Flame Retardant Polymers, M. Lewin (ed.),Business Communications Inc., Norwalk, CT, 2003.
8. J.W. Gilman, Appl. Clay Sci., 1997, 15(1–2), 31–49.9. J.W. Gilman and T. Kashiwagi, in Polymer–clay Nanocomposites, T.J.
Pinnavaia, and G.W. Beall (eds.), John Wiley and Sons, New York, 2000.pp. 193–206.
10. S. Bourbigot, E. Devaux, M. Rochery and X. Flambard, in Nanocompositetextiles: New Routes for flame retardancy, proceedings 47th InternationalSAMPE Symposium, May 12–16, 2000, Volume 47, pp. 1108–1118.
11. T.X. Liu, Z.H. Liu, K.X. Ma, L. Shen, K.Y. Zeng and C.B. He, Compos.Sci. Technol., 2003, 63, 331–337.
12. A.R. Horrocks, M.Y. Wang, M.E. Hall, F. Sunmomu and J.S. Pearson,Polym. Int., 2000, 49, 1079–1091.
13. G. Camino, L. Costa and L. Trossatelli, Polym. Degrad, Stab., 1985, 12,203–211.
14. L. Costa, G. Camino and M.P. Luda, Proc. Am. Chem. Soc., 1990,p. 211.
15. M Lewin and E.D. Weil, in Fire Retardant Materials, A.R. Horrocks andD. Price (eds.), Woodhead Publishing, Cambridge, UK, 2001, p. 39.
16. S. Glasstone, in Textbook of Physical Chemistry, Macmillan, London,1960, pp. 274–277.
17. Anon, Antiblaze MCM (formerly Amgard MCM) Data Sheets, RhodiaConsumer Specialities (formerly Albright and Wilson Ltd), Oldbury, UK,1989.

239
CHAPTER 17
Use of Clay–NanocompositeMatrixes in Fire RetardantPolyolefin-Based IntumescentSystemsSOPHIE DUQUESNE, SERGE BOURBIGOT, MICHEL LEBRAS, CHARAFEDDINE JAMA AND RENÉ DELOBEL
Laboratoire des Procédés d’Elaboration de Revêtements Fonctionnels, EcoleNationale Supérieure de Chimie de Lille, BP 108, F-59652 Villeneuve d’Ascq,France ([email protected])
17.1 IntroductionPolymer–clay nanocomposites are hybrid organic polymer/inorganic layeredmaterials with unique properties when compared to conventional filled poly-mers. The fire retardant performance of clay nanocomposite polymers, with lowclay mass fraction, show excellent improvement.1–2 The mode of action is gener-ally attributed to a “barrier effect” created by the dispersion of clay layers in thedegraded matrix, which leads to a decrease in the feeding rate of the combustionproducts to the flame and, as a consequence, to a decrease in the rate of heatrelease.3 Such a mechanism is similar to the mode of action of intumescent sys-tems. Intumescent materials form, when heated, a foamed cellular charred layeron their surface, which limits the fuel transfer to the flame and the heat transferto the polymer.4–5 Hence, intumescent systems also act via a barrier mechanism.The association of the two concepts, consequently, appears interesting.
Generally, intumescent formulations contain three active ingredients: an acidsource, a carbonization agent and a blowing agent.6 The carbonization agentscommonly used in intumescent formulations are polyhydric compounds suchas pentaerythritol or sorbitol.7–8 The use of such polyols involves problems suchas migration, reactivity during processing, compatibility, etc. Therefore, newsolutions are needed to avoid these problems.9 Previous studies10–12 demonstratedthe efficiency of char-forming polymers (polyamide or polyurethane) as
240 Chapter 17
carbonization agents in intumescent formulations. Recent works of ourlaboratory,13–14 have demonstrated that the use of nanocomposite polyamide ascarbonization agent enables the improvement of fire performance of intumes-cent systems in a copolymer ethylene vinyl acetate (EVA). The clay allowed thethermal stabilization of a phosphorocarbonaceous structure in the intumescentchar, which increased the efficiency of the shield, and, in addition, the formationof a ceramic that can act as a protective barrier.
The aim of this study is to investigate the effect of nanocomposite polymers onthe fire retardant performance of polyolefin-based intumescent systems. In a firstpart, the influence of the use of nanocomposite polymer as matrix, as carboniza-tion agent or as both on the fire retardancy, was investigated in intumescentEVA. Then, the fire retardant performance of intumescent polypropylene(PP) using polyamide-6 (PA-6) as carbonization agent was compared to thoseof nanocomposite intumescent polypropylene using a polyamide-6 claynanocomposite hybrid (PA-6-nano).
17.2 Experimental17.2.1 Materials17.2.1.1 EVA NanocompositeRaw materials were EVA with 19 wt% vinyl acetate [Exxon’s EscoreneUL00119, MFI = 0.65 g/10 min] and Cloisite 30B for which the negativecharges of its layers are compensated with methyl tallow bis(2-hydroxyethyl)-ammonium ions (Southern Clay Products Inc). The study has been carried out atconstant EVA/30B ratio 95:5 wt/wt hereinafter called EVAnano. The materialswere obtained by mixing the filler with the melted EVA in a Brabender Labora-tory Mixer measuring head (type 350/EH, roller blades, checking the mixingconditions using the data processing torque rheometer system BrabenderPlasticorder PL2000) at constant shear rate (50 rpm) and at constant tempera-ture (160°C). The morphology of the materials has been previously investi-gated.15 EVA copolymer appears to easily form a nanocomposite with Cloisite30B even if the totally exfoliated structure is not been achieved but a mixedexfoliated/intercalated structure obtained.
17.2.1.2 PP Nanocomposite
Raw materials were PP [polypropylene supplied by Atofina – PPH7060MFI = 12 g/10 min], PP-g-MA [maleic anhydride grafted polypropylenesupplied by Crompton – Polybond 3200–2% MA, MFI = 110 g/10 min] andorganically modified montmorillonite (Cloisite 20A, Southern Clay Product,organic modifier = dimethyl dihydrogenatedtallow quaternary ammonium).The study was carried out using the ratio PP/PP-g-MA/20A = 90:5:5 (wt/wt)hereinafter called PPnano. Mixtures were prepared using a Brabender mixermeasuring head (described above) at constant shear rate (50 rpm) and constanttemperature (190°C). Using those parameters, an intercalated nanocomposite isobtained.16
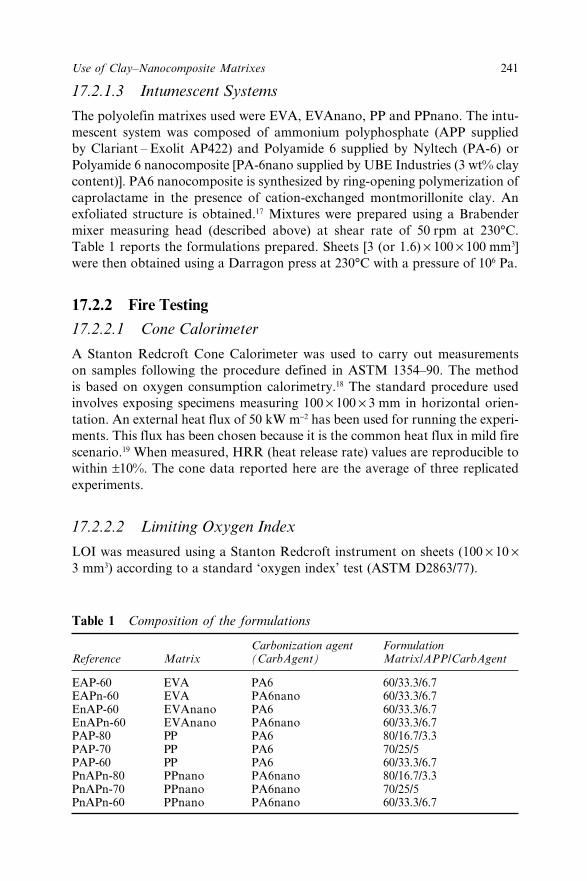
241Use of Clay–Nanocomposite Matrixes
17.2.1.3 Intumescent Systems
The polyolefin matrixes used were EVA, EVAnano, PP and PPnano. The intu-mescent system was composed of ammonium polyphosphate (APP suppliedby Clariant – Exolit AP422) and Polyamide 6 supplied by Nyltech (PA-6) orPolyamide 6 nanocomposite [PA-6nano supplied by UBE Industries (3 wt% claycontent)]. PA6 nanocomposite is synthesized by ring-opening polymerization ofcaprolactame in the presence of cation-exchanged montmorillonite clay. Anexfoliated structure is obtained.17 Mixtures were prepared using a Brabendermixer measuring head (described above) at shear rate of 50 rpm at 230°C.Table 1 reports the formulations prepared. Sheets [3 (or 1.6) × 100 × 100 mm3]were then obtained using a Darragon press at 230°C with a pressure of 106 Pa.
17.2.2 Fire Testing
17.2.2.1 Cone Calorimeter
A Stanton Redcroft Cone Calorimeter was used to carry out measurementson samples following the procedure defined in ASTM 1354–90. The methodis based on oxygen consumption calorimetry.18 The standard procedure usedinvolves exposing specimens measuring 100 × 100 × 3 mm in horizontal orien-tation. An external heat flux of 50 kW m−2 has been used for running the experi-ments. This flux has been chosen because it is the common heat flux in mild firescenario.19 When measured, HRR (heat release rate) values are reproducible towithin ±10%. The cone data reported here are the average of three replicatedexperiments.
17.2.2.2 Limiting Oxygen Index
LOI was measured using a Stanton Redcroft instrument on sheets (100 × 10 ×3 mm3) according to a standard ‘oxygen index’ test (ASTM D2863/77).
Table 1 Composition of the formulations
Carbonization agent FormulationReference Matrix (CarbAgent) Matrix/APP/CarbAgent
EAP-60 EVA PA6 60/33.3/6.7EAPn-60 EVA PA6nano 60/33.3/6.7EnAP-60 EVAnano PA6 60/33.3/6.7EnAPn-60 EVAnano PA6nano 60/33.3/6.7PAP-80 PP PA6 80/16.7/3.3PAP-70 PP PA6 70/25/5PAP-60 PP PA6 60/33.3/6.7PnAPn-80 PPnano PA6nano 80/16.7/3.3PnAPn-70 PPnano PA6nano 70/25/5PnAPn-60 PPnano PA6nano 60/33.3/6.7

242 Chapter 17
17.2.2.3 UL-94
UL-94 tests were carried out on 100 × 13 × 1.6 mm3 specimens according to theAmerican National Standard UL-94 (Test for flammability of plastics materialsfor part in devices and appliance, Underwriter laboratories, Northbook, ANSI/ASTM D-635/77).
17.3 Results and Discussion17.3.1 Fire Retardant Performance of EVA Based SystemsTable 2 reports the LOI and UL-94 rating of the four systems studied. Interest-ingly, whatever the compound, V0 rating is achieved. Moreover, the LOIincreases by 4 points when EVAnano is used as a matrix.
Figure 1 presents the heat release rate (HRR) curves versus time of the intu-mescent EVA-based formulations. Whatever the formulation, the curves presenttwo peaks and a fire retardant system is obtained [PHRR (peak of heat releaserate) = 1600 kW m−2 for neat EVA15]. The first peak corresponds to the formationof the protective layer, i.e. to the development of the intumescence, whereas thesecond one corresponds to its destruction or failure. When the protective layer
Table 2 LOI and UL-94 rating of intumescent EVA nanocomposites includingpolymer as carbonization agent
Formulation LOI (vol%) UL 94 rating
EAP-60 30 V0EnAP-60 34 V0EAPn-60 29 V0EnAPn-60 33 V0
Figure 1 Heat rate release vs. time for intumescent EVA-based formulations
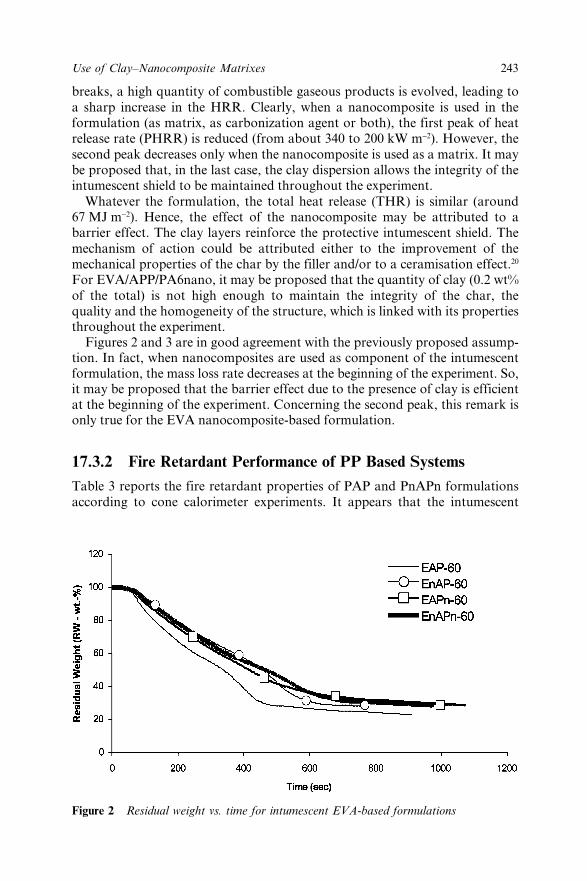
243Use of Clay–Nanocomposite Matrixes
breaks, a high quantity of combustible gaseous products is evolved, leading toa sharp increase in the HRR. Clearly, when a nanocomposite is used in theformulation (as matrix, as carbonization agent or both), the first peak of heatrelease rate (PHRR) is reduced (from about 340 to 200 kW m−2). However, thesecond peak decreases only when the nanocomposite is used as a matrix. It maybe proposed that, in the last case, the clay dispersion allows the integrity of theintumescent shield to be maintained throughout the experiment.
Whatever the formulation, the total heat release (THR) is similar (around67 MJ m−2). Hence, the effect of the nanocomposite may be attributed to abarrier effect. The clay layers reinforce the protective intumescent shield. Themechanism of action could be attributed either to the improvement of themechanical properties of the char by the filler and/or to a ceramisation effect.20
For EVA/APP/PA6nano, it may be proposed that the quantity of clay (0.2 wt%of the total) is not high enough to maintain the integrity of the char, thequality and the homogeneity of the structure, which is linked with its propertiesthroughout the experiment.
Figures 2 and 3 are in good agreement with the previously proposed assump-tion. In fact, when nanocomposites are used as component of the intumescentformulation, the mass loss rate decreases at the beginning of the experiment. So,it may be proposed that the barrier effect due to the presence of clay is efficientat the beginning of the experiment. Concerning the second peak, this remark isonly true for the EVA nanocomposite-based formulation.
17.3.2 Fire Retardant Performance of PP Based SystemsTable 3 reports the fire retardant properties of PAP and PnAPn formulationsaccording to cone calorimeter experiments. It appears that the intumescent
Figure 2 Residual weight vs. time for intumescent EVA-based formulations
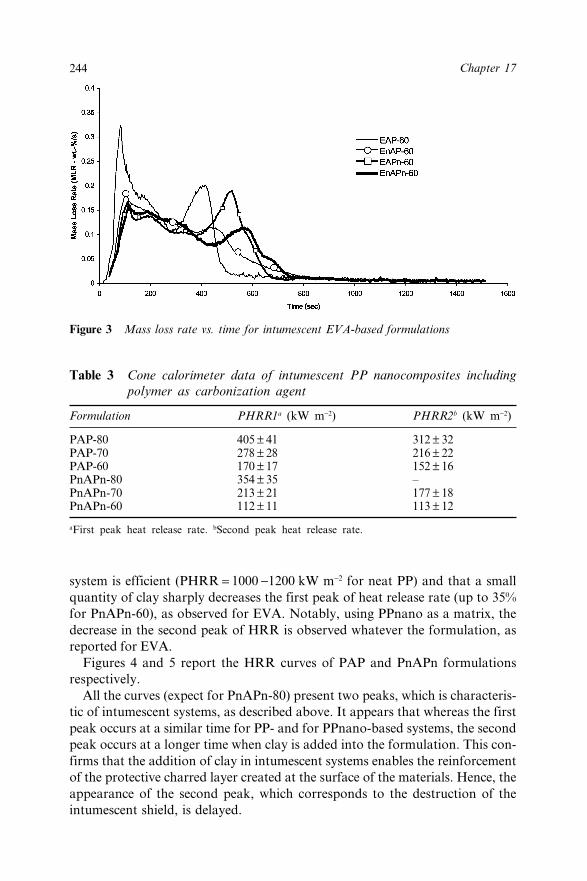
244 Chapter 17
system is efficient (PHRR = 1000 −1200 kW m−2 for neat PP) and that a smallquantity of clay sharply decreases the first peak of heat release rate (up to 35%for PnAPn-60), as observed for EVA. Notably, using PPnano as a matrix, thedecrease in the second peak of HRR is observed whatever the formulation, asreported for EVA.
Figures 4 and 5 report the HRR curves of PAP and PnAPn formulationsrespectively.
All the curves (expect for PnAPn-80) present two peaks, which is characteris-tic of intumescent systems, as described above. It appears that whereas the firstpeak occurs at a similar time for PP- and for PPnano-based systems, the secondpeak occurs at a longer time when clay is added into the formulation. This con-firms that the addition of clay in intumescent systems enables the reinforcementof the protective charred layer created at the surface of the materials. Hence, theappearance of the second peak, which corresponds to the destruction of theintumescent shield, is delayed.
Figure 3 Mass loss rate vs. time for intumescent EVA-based formulations
Table 3 Cone calorimeter data of intumescent PP nanocomposites includingpolymer as carbonization agent
Formulation PHRR1a (kW m−2) PHRR2b (kW m−2)
PAP-80 405 ± 41 312 ± 32PAP-70 278 ± 28 216 ± 22PAP-60 170 ± 17 152 ± 16PnAPn-80 354 ± 35 –PnAPn-70 213 ± 21 177 ± 18PnAPn-60 112 ± 11 113 ± 12
aFirst peak heat release rate. bSecond peak heat release rate.

245Use of Clay–Nanocomposite Matrixes
Figure 4 Heat rate release vs. time for intumescent PP-based formulations
Figure 5 Heat rate release vs. time for intumescent nanocomposite PP-basedformulations

246 Chapter 17
17.4 ConclusionThis work demonstrates that the addition of clay in intumescent formulationsimproves the fire performance of polyolefin-based systems. Better improvementis achieved when clay is incorporated into the matrix to make a nanocomposite.This may be partially explained by the clay content, which is higher when ananocomposite is used as matrix. However, it may be highlighted that even if asmall quantity of clay (0.2 wt% of the total) is used the first peak of heat releaseis significantly reduced, which is particularly important since in a scenario offire the beginning of the fire development is very important. It is assumed thatthe addition of clay reinforces the protective charred layer developed at thesurface of the material.
17.5 AcknowledgementThe authors thank Nicolas Belverge for his helpful technical assistance.
17.6 References1. J.W. Gilman, T. Kashiwagi, S. Lomakin, J.D. Lichtenhen and P Jones, in
Fire Retardancy of Polymers: The Use of Intumescence, M. Le Bras, G.Camino, S. Bourbigot and R. Delobel (eds.) The Royal Chemical Society,Cambridge, UK, 1998, PP. 266–279.
2. C.A. Wilkie, in Recent Advances in FR of Polymeric Materials, M. Lewin(ed.) Business Communications Co Inc. Pub., Norwall, USA, 2002,Volume 13, pp. 155–159.
3. J.W. Gilman, C.L. Jackson, A.B. Morgan, R. Harris Jr., E. Manias, E.P.Giannelis, M. Wuthenow, D. Hilton and S.H. Phillips, Chem. Mater.,2000, 12(7), 1866–1873.
4. H.L. Vandersall, J. Fire Flammability, 1971, 2, 97–140.5. S. Bourbigot, M. Le Bras, R. Delobel, R. Decressain and J.-P. Amoureux,
J. Chem. Soc., Faraday Trans., 1996, 92(1), 149–158.6. M. Le Bras and S. Bourbigot, in reference 1, pp. 64–75.7. M. Le Bras, S. Bourbigot, C. Delporte, C. Siat and Y. Le Tallec, Fire
Mater., 1996, 20, 191–203.8. M. Le Bras, S. Bourbigot, Y. Le Tallec and J. Laureyns, Polym. Degrad.
Stab., 1997, 56, 11–21.9. M. Le Bras and S. Bourbigot, in Polypropylene: an A-Z Reference,
J. Karger-Kocsis (ed.), Chapman & Hall, London, 1998, p. 357.10. S. Bourbigot, M. Le Bras and C. Siat, in Recent Advances in FR of
Polymeric Materials, M. Lewin (ed.), Business Communications Co Inc.Pub., Norwall, USA, 1998, Volume 8, 146–160.
11. M. Le Bras, S. Bourbigot, C. Siat and R. Delobel, in reference 1, pp. 266–279.
12. M. Bugajny, M. Le Bras, S. Bourbigot and R. Delobel, Polym. Degrad.Stab., 1999, 64(1), 157–163.

247Use of Clay–Nanocomposite Matrixes
13. S. Bourbigot, M. Le Bras, F. Dabrowski, J. Gilman and T. Kashiwagi,Fire Mater., 2000, 24, 201–208.
14. F. Dabrowski, M. Le Bras, L. Cartier and S. Bourbigot, J. Fire Sci., 2001,19, 219–241.
15. S. Duquesne, C. Jama, M. Le Bras, R. Delobel, P. Recourt and J.-M.Gloaguen, Composites Sci. Technol., 2003, 63(8), 1141–1148.
16. A. Bendaoudi, S. Duquesne, C. Jama, M. Le Bras, R. Delobel, P. Recourt,J.-M. Gloaguen, J.-M. Lefebvre and A. Addad, this book, Chapter 8.
17. A. Usuki, Y. Kojima, M. Kawasumi, A. Okada, Y. Fukushima, T.Kurauchi and O. Kamigaito, J. Mater. Res., 1993, 8(5), 1179–1184.
18. C. Huggett, Fire Mater., 1980, 4(2), 61–65.19. V. Babrauskas, Fire Mater., 1984, 8(2), 81–95.20. S. Duquesne, J. Lefebvre, S. Bourbigot, M. Le Bras, R. Delobel,
P. Recourt, Oral communication, ACS 228th Fall meeting, 22–26 August2004, Philadelphia, PA, USA, Abstr. Paper PMSE 247, ACS (Pub.)Washington, 2004.
248
CHAPTER 18
Effect of Hydroxides on FireRetardance Mechanism ofIntumescent EVA compositionGIOVANNI CAMINO,1 ALESSANDRO RIVA, D. VIZZINI,1
ANDRÉA CASTROVINCI,2 PASCAL AMIGOUËT3 ANDPHILIPPE BRAS PEREIRA3
1Centro di Cultura per l’Ingegneria delle Materie Plastiche, V. T. Michel 5,15100 Alessandria, Italy ([email protected])2Politecnico di Torino, Sede di Alessandria, V. T. Michel 5, 15100Alessandria, Italy3NEXANS-NRC, 170, Avenue Jean Jaurès, 69353 Lyon Cedex 7, France
18.1 IntroductionPolyethylenic polymers and co-polymers are widely used in many fields, par-ticularly in electrical engineering. Due to their chemical composition thesepolymers are easily flammable and this is why the flame retardancy of thesematerials is a deeply studied matter. The main approach used to date to impartflame retardant properties to this class of polymeric materials has been theincorporation of additives, specifically halogen compounds. The combustionproducts coming from these materials have, however, many negative character-istics (corrosiveness, toxicity, etc.) that have pushed the industry and legislationto promote some new approaches to flame retardance.1–3
One of these developing approaches is that of intumescence. The intumes-cence mechanism consists in creating on the polymer surface a multicellularthermally stable expanded shield, able to reduce both the heat flux from theflame to the polymer matrix, responsible for the fuel production, and the transferof the fuel to the flame, thus limiting the spread of fire.4,5
Generally, intumescent formulations consist of three basic components:an acid source (phosphates, borates etc.), a carbonising compound (polyols,polyamides, polyurethanes etc.) and a blowing agent (melamine and melaminecompounds etc.). On heating, the acid source gives a mineral acid that takes
249Effect of Hydroxides on Fire Retardance Mechanism
part in the dehydration of the carbonising compound that forms a cellular struc-ture when the blowing agent decomposes.4–7 In the absence of the blowing agent,the gases evolved during carbonisation (e.g. water) perform the blowing action.
The association of a polyamide (e.g. PA6) or other char-forming polymersand APP as flame retardants for EVA and other thermoplastic polymershas already been reported.8–12 Here we have studied the effect of combiningthe intumescent system APP-PA11 with magnesium hydroxide and aluminiumhydroxide, which are widely used fire retardants in electrical cables sheetingmaterials, to explore possible synergies between the two fire retardants approa-ches that act with complementary physical actions. Indeed, the intumescentsystem provides a barrier to gas and heat transfer between flame and burningpolymer whereas MH and ATH act by cooling the surface of the polymerthrough endothermal dehydration and water evaporation and by cooling theflame through dilution with water vapour.
18.2 Experimental18.2.1 Materials
The following products where used: ethylene – vinyl acetate 28% copolymer(EVATANE 28-03, ATOFINA, EVA), Polyamide 11 (Rilsan ATOCHEM,PA11), magnesium hydroxide (Magnifin H10, Martinswerk, MH), ammoniumpolyphosphate (Exolit AP 422, Clariant, APP) and aluminium hydroxide (ApyralMD40, Nabeltec, ATH).
APP and hydroxides mixtures were prepared by grinding in a mortar. Thepolymers were mixed with inorganic components using a Brabender MixerPLE, with roller blades and a 55 or 370 cm3 mixing chamber for ATH andMH respectively, with a rotation speed of 60 rpm, mixing for 5–8 min at 180–190°C. Also, a Leistritz ZSE27 co-rotating twin screw extruder was used withthe following temperature profile: 100/170/170/170/175/175/180/180/180. Thescrew rotation speed was set to 100 rpm, and the resulting throughput was9.6 kg h−1. The composition of the mixtures is reported in Table 1. Sample testswere prepared at 190°C by compression moulding using a Scamia type PC4hydraulic press at 200 bar.
18.2.2 Combined Thermogravimetry–Infrared–Evolved GasAnalysis (TGA-FTIR-EGA)
TGA-FTIR-EGA analyses were performed on heating from 50 to 800°C20 mg samples at 20°C min−1 (if not otherwise specified in figures legend) undera nitrogen flow (30 ml min−1) using a Perkin-Elmer Pyris 1 TGA coupled by aPerkin-Elmer TG-IR interfaced with a Perkin-Elmer Spectrum GX InfraredSpectrometer equipped with IR gas cell (TGA-FTIR). The TGA-FTIR transferline was heated at 220°C, while the IR gas cell was heated at 230°C to avoidcondensation of degradation products inside the transfer line and the gas
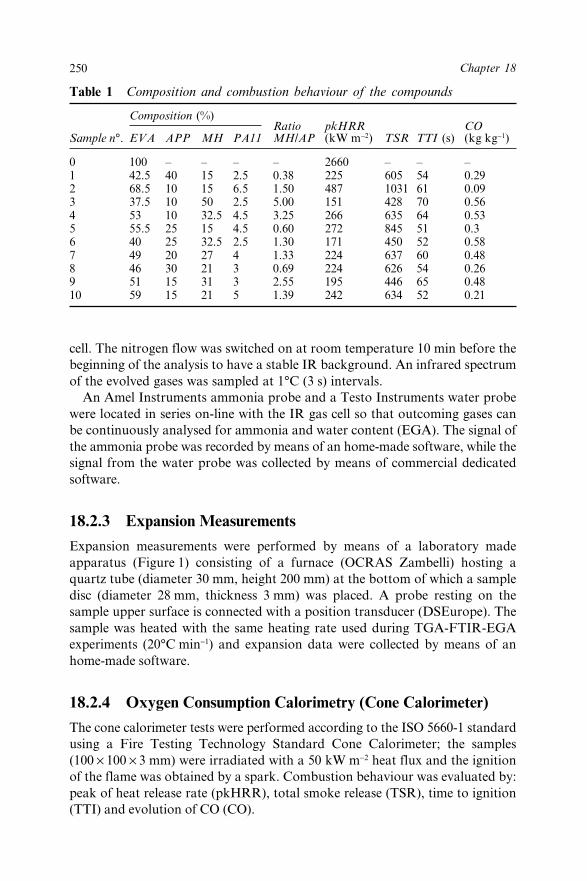
250 Chapter 18
cell. The nitrogen flow was switched on at room temperature 10 min before thebeginning of the analysis to have a stable IR background. An infrared spectrumof the evolved gases was sampled at 1°C (3 s) intervals.
An Amel Instruments ammonia probe and a Testo Instruments water probewere located in series on-line with the IR gas cell so that outcoming gases canbe continuously analysed for ammonia and water content (EGA). The signal ofthe ammonia probe was recorded by means of an home-made software, while thesignal from the water probe was collected by means of commercial dedicatedsoftware.
18.2.3 Expansion Measurements
Expansion measurements were performed by means of a laboratory madeapparatus (Figure 1) consisting of a furnace (OCRAS Zambelli) hosting aquartz tube (diameter 30 mm, height 200 mm) at the bottom of which a sampledisc (diameter 28 mm, thickness 3 mm) was placed. A probe resting on thesample upper surface is connected with a position transducer (DSEurope). Thesample was heated with the same heating rate used during TGA-FTIR-EGAexperiments (20°C min−1) and expansion data were collected by means of anhome-made software.
18.2.4 Oxygen Consumption Calorimetry (Cone Calorimeter)
The cone calorimeter tests were performed according to the ISO 5660-1 standardusing a Fire Testing Technology Standard Cone Calorimeter; the samples(100 × 100 × 3 mm) were irradiated with a 50 kW m−2 heat flux and the ignitionof the flame was obtained by a spark. Combustion behaviour was evaluated by:peak of heat release rate (pkHRR), total smoke release (TSR), time to ignition(TTI) and evolution of CO (CO).
Table 1 Composition and combustion behaviour of the compounds
Composition (%)Ratio pkHRR CO
Sample n°. EVA APP MH PA11 MH/AP (kW m−2) TSR TTI (s) (kg kg−1)
0 100 – – – – 2660 – – –1 42.5 40 15 2.5 0.38 225 605 54 0.292 68.5 10 15 6.5 1.50 487 1031 61 0.093 37.5 10 50 2.5 5.00 151 428 70 0.564 53 10 32.5 4.5 3.25 266 635 64 0.535 55.5 25 15 4.5 0.60 272 845 51 0.36 40 25 32.5 2.5 1.30 171 450 52 0.587 49 20 27 4 1.33 224 637 60 0.488 46 30 21 3 0.69 224 626 54 0.269 51 15 31 3 2.55 195 446 65 0.4810 59 15 21 5 1.39 242 634 52 0.21

251Effect of Hydroxides on Fire Retardance Mechanism
18.3 Results and Discussion18.3.1 Flammability Behaviour
Cone calorimeter tests were performed on a number of EVA/APP/MH/PA11mixtures selected for a statistical approach to fire retardancy formulations(Table 1). Figure 2 shows the results obtained from the best performing sample(n 3), while the results for all the samples are summarised in Table 1.
Figure 1 Apparatus for expansion measurements
Figure 2 Cone calorimeter test results for sample no 3 (APP:10%, MH:50%, PA11:2.5%,EVA:37,5%). Weight loss (solid line), Mass loss rate (+) and heat release rate(�) curves
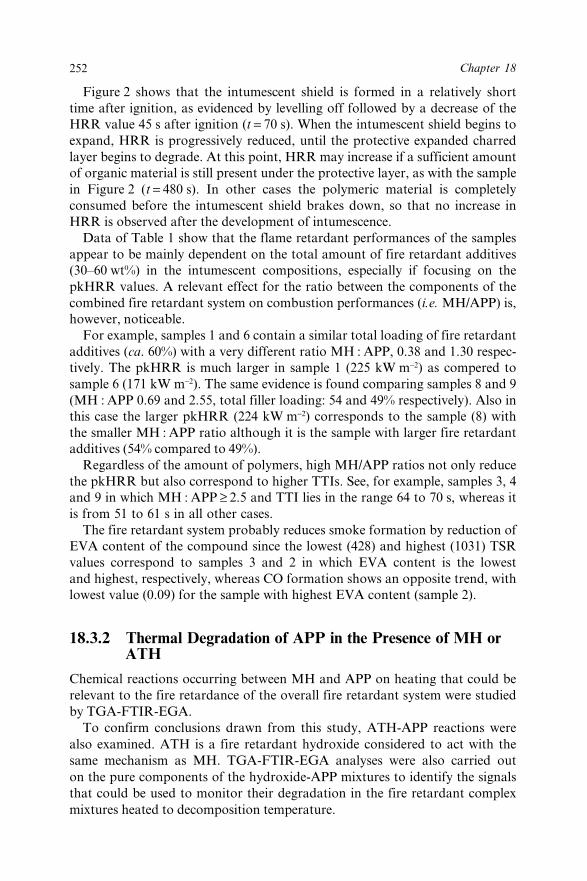
252 Chapter 18
Figure 2 shows that the intumescent shield is formed in a relatively shorttime after ignition, as evidenced by levelling off followed by a decrease of theHRR value 45 s after ignition (t = 70 s). When the intumescent shield begins toexpand, HRR is progressively reduced, until the protective expanded charredlayer begins to degrade. At this point, HRR may increase if a sufficient amountof organic material is still present under the protective layer, as with the samplein Figure 2 (t = 480 s). In other cases the polymeric material is completelyconsumed before the intumescent shield brakes down, so that no increase inHRR is observed after the development of intumescence.
Data of Table 1 show that the flame retardant performances of the samplesappear to be mainly dependent on the total amount of fire retardant additives(30–60 wt%) in the intumescent compositions, especially if focusing on thepkHRR values. A relevant effect for the ratio between the components of thecombined fire retardant system on combustion performances (i.e. MH/APP) is,however, noticeable.
For example, samples 1 and 6 contain a similar total loading of fire retardantadditives (ca. 60%) with a very different ratio MH : APP, 0.38 and 1.30 respec-tively. The pkHRR is much larger in sample 1 (225 kW m−2) as compered tosample 6 (171 kW m−2). The same evidence is found comparing samples 8 and 9(MH : APP 0.69 and 2.55, total filler loading: 54 and 49% respectively). Also inthis case the larger pkHRR (224 kW m−2) corresponds to the sample (8) withthe smaller MH : APP ratio although it is the sample with larger fire retardantadditives (54% compared to 49%).
Regardless of the amount of polymers, high MH/APP ratios not only reducethe pkHRR but also correspond to higher TTIs. See, for example, samples 3, 4and 9 in which MH : APP ≥ 2.5 and TTI lies in the range 64 to 70 s, whereas itis from 51 to 61 s in all other cases.
The fire retardant system probably reduces smoke formation by reduction ofEVA content of the compound since the lowest (428) and highest (1031) TSRvalues correspond to samples 3 and 2 in which EVA content is the lowestand highest, respectively, whereas CO formation shows an opposite trend, withlowest value (0.09) for the sample with highest EVA content (sample 2).
18.3.2 Thermal Degradation of APP in the Presence of MH orATH
Chemical reactions occurring between MH and APP on heating that could berelevant to the fire retardance of the overall fire retardant system were studiedby TGA-FTIR-EGA.
To confirm conclusions drawn from this study, ATH-APP reactions werealso examined. ATH is a fire retardant hydroxide considered to act with thesame mechanism as MH. TGA-FTIR-EGA analyses were also carried outon the pure components of the hydroxide-APP mixtures to identify the signalsthat could be used to monitor their degradation in the fire retardant complexmixtures heated to decomposition temperature.

253Effect of Hydroxides on Fire Retardance Mechanism
18.3.2.1 ATH and MH
TGA curves of ATH (Figure 3) and MH (Figure 4) heated to 800°C show onemain weight loss step with a weight loss rate maximum at about 330 and 430°C,respectively, which is due to water release, indicated by the signal from thewater probe and responsible for the FR mechanism of inorganic hydroxides.13
18.3.2.2 APP
In agreement with published data,6 TGA-FTIR-EGA analysis carried out onpure APP (Figure 5) shows elimination of ammonia and water between 300 and450°C (maximum rate of weight loss at 380°C) with transformation of linearAPP into cross-linked ultraphosphate (Scheme 1, reactions 1.1 and 1.2) which
Figure 3 TGA-coupled with water probe of pure ATH. TG (solid line), derivative TG(DTG, �) and rate of water evolution (+) curves

254 Chapter 18
undergoes fragmentation to volatile P2O5-like moieties above 550°C. Ammoniaevolution from APP is related to acidic site formation involved in the intumes-cence phenomenon, as already reported.14 Since MH and ATH are bases, MHbeing the strongest, there is an interest in analysing the interaction between thesecomponents and APP, to investigate whether it could modify the FR behaviourof the intumescent mixture.
18.3.2.3 APP–MH Mixtures
In the upper part of Figure 6 the TG and DTG of a 50 wt%. APP/MH mixtureare reported, together with the corresponding calculated curves obtained from
Figure 4 TGA-coupled with water probe of pure MH. TG (solid line), derivative TG(DTG, �) and rate of water evolution (+) curves

255Effect of Hydroxides on Fire Retardance Mechanism
the analysis carried out on pure MH and APP heated separately. Whereasammonia from APP and water from MH are expected to evolve in the samerange of temperature (300–500°C) with a maximum rate at 396°C, Figure 6shows that, instead, three steps of weight loss take place, with maximum rates at346, 431 and 455°C.
The lower part of Figure 6 gives the water and ammonia evolution curves,showing that the first experimental weight loss step (DTG, Tmax 346°C) is due toammonia and water evolution, while the two overlapping weight loss steps(DTG, Tmax 431 and 455°C) involve water evolution.
Evolution of ammonia at a lower temperature than expected (341°C, Figure 6,instead of 410°C Figure 5) is due to the basicity of MH, which shifts the
Figure 5 TGA-coupled with water and ammonia probes of pure APP. TG (solid line) andDTG (�), rate of water (+) and ammonia (�) evolution curves

256 Chapter 18
ammonia evolution equilibrium (Scheme 1, reaction 1.1) to a temperature lowerthan that at which ammonia overcomes electrostatic attraction by the proton ofpolyphosphoric acid in pure APP. Indeed, the chemical reaction of MH hydroxylgroups with protons of polyphosphoric acid frees ammonia from the ammoniumsalt with formation of magnesium phosphate bonds (Scheme 2, reaction 2.1). In
Scheme 1 Reactions occurring during thermal degradation of APP
Figure 6 Calculated and experimental TGA curves for a 50 wt% mixture of APPand MH. TG (solid line: experimental; dotted line: calculated) and DTG (n,experimental – solid line; �, calculated) curves. Lower part water (+) andammonia (�) evolution curves
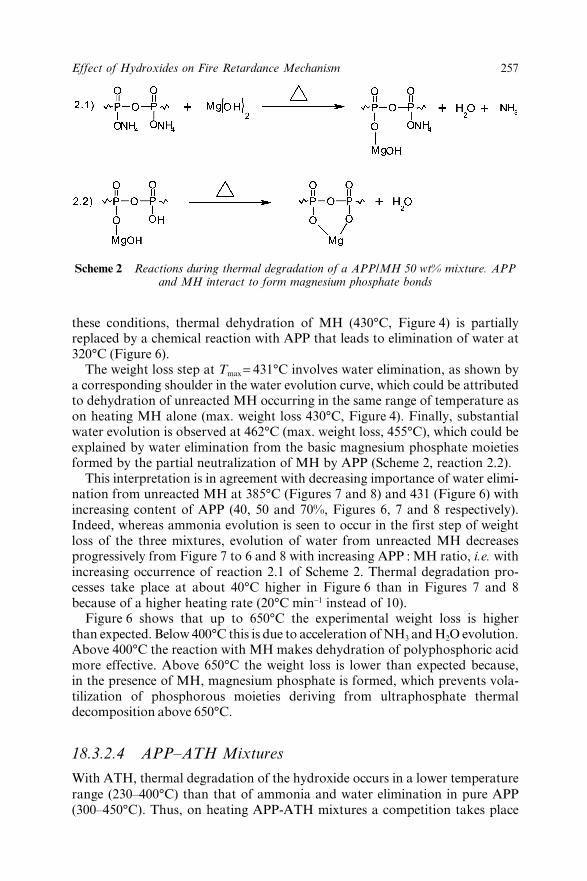
257Effect of Hydroxides on Fire Retardance Mechanism
these conditions, thermal dehydration of MH (430°C, Figure 4) is partiallyreplaced by a chemical reaction with APP that leads to elimination of water at320°C (Figure 6).
The weight loss step at Tmax = 431°C involves water elimination, as shown bya corresponding shoulder in the water evolution curve, which could be attributedto dehydration of unreacted MH occurring in the same range of temperature ason heating MH alone (max. weight loss 430°C, Figure 4). Finally, substantialwater evolution is observed at 462°C (max. weight loss, 455°C), which could beexplained by water elimination from the basic magnesium phosphate moietiesformed by the partial neutralization of MH by APP (Scheme 2, reaction 2.2).
This interpretation is in agreement with decreasing importance of water elimi-nation from unreacted MH at 385°C (Figures 7 and 8) and 431 (Figure 6) withincreasing content of APP (40, 50 and 70%, Figures 6, 7 and 8 respectively).Indeed, whereas ammonia evolution is seen to occur in the first step of weightloss of the three mixtures, evolution of water from unreacted MH decreasesprogressively from Figure 7 to 6 and 8 with increasing APP : MH ratio, i.e. withincreasing occurrence of reaction 2.1 of Scheme 2. Thermal degradation pro-cesses take place at about 40°C higher in Figure 6 than in Figures 7 and 8because of a higher heating rate (20°C min−1 instead of 10).
Figure 6 shows that up to 650°C the experimental weight loss is higherthan expected. Below 400°C this is due to acceleration of NH3 and H2O evolution.Above 400°C the reaction with MH makes dehydration of polyphosphoric acidmore effective. Above 650°C the weight loss is lower than expected because,in the presence of MH, magnesium phosphate is formed, which prevents vola-tilization of phosphorous moieties deriving from ultraphosphate thermaldecomposition above 650°C.
18.3.2.4 APP–ATH Mixtures
With ATH, thermal degradation of the hydroxide occurs in a lower temperaturerange (230–400°C) than that of ammonia and water elimination in pure APP(300–450°C). Thus, on heating APP-ATH mixtures a competition takes place
Scheme 2 Reactions during thermal degradation of a APP/MH 50 wt% mixture. APPand MH interact to form magnesium phosphate bonds
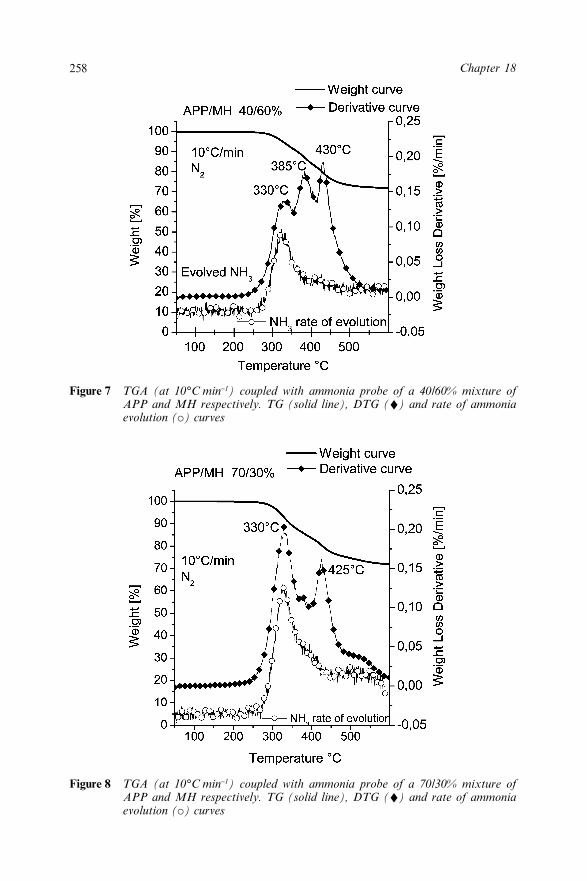
258 Chapter 18
Figure 7 TGA (at 10°C min−1) coupled with ammonia probe of a 40/60% mixture ofAPP and MH respectively. TG (solid line), DTG (n) and rate of ammoniaevolution (�) curves
Figure 8 TGA (at 10°C min−1) coupled with ammonia probe of a 70/30% mixture ofAPP and MH respectively. TG (solid line), DTG (n) and rate of ammoniaevolution (�) curves

259Effect of Hydroxides on Fire Retardance Mechanism
between thermal and chemical degradation of ATH, which in the case of MH isshifted towards the chemical process owing to the higher temperature of MHthermal degradation compared to ATH.
As a consequence, acceleration of ammonia evolution from APP is less effec-tive with ATH because dehydration to Al2O3 leads to loss of ATH basic pro-perties on heating. Indeed, Tmax for ammonia evolution from APP decreaseswhen a high APP : ATH ratio (>1) shifts the competition in favour of chemicalreaction between APP and ATH in comparison to ATH thermal dehydration, asshown, for example, in Figure 9 for a 70 : 30 APP : ATH mixture (Tmax 400°C)compared to pure APP (Tmax 450°C). Similarly, water evolution, which occurswith Tmax at 336°C in ATH (Figure 10), is not affected in the presence of50% APP whereas it takes place in two steps with Tmax 315 and 490°C when APPis increased to 70%. In the stage at lower temperature, water is eliminatedby chemical reaction between APP and ATH at temperatures similar to thoseobserved in APP-MH mixtures. Dehydration at high temperature involvesthermal degradation of the basic aluminium polyphosphate, which occurswith a mechanism similar to that of MH (Scheme 2, reaction 2.2), occurring,however, at a higher temperature.
18.3.3 Expansion Behaviour of Intumescent MixturesContaining MH
Typical expansion behaviour taking place on heating the intumescent materialsis shown for sample 10 in Figure 11, in which TGA-FTIR-EGA data arecompared to the expansion behaviour of the sample, so that it is possible tounderstand which is the role of each component of the mixture (EVA, MH, APP,
Figure 9 Ammonia evolution curves for ATH/APP mixtures obtained by grinding the twocompounds. Pure APP (solid line) and 70% APP + 30% ATH (�)

260 Chapter 18
PA11) in imparting the intumescent behaviour. Figure 11a shows the TG andDTG curves, Figure 11b shows the evolving gas (EG) profiles (acetic acid,ammonia and water), while in Figure 11c the expansion behaviour of the sampleis reported.
On comparison of EG with expansion curves it can be seen that the sampleexpands in two steps. The first begins when ammonia is being released fromAPP by reaction with MH (Tmax 337°C, Figure 11b), while reaction of APP withPA11 gives rise to the char.15 The second blowing effect takes place when aceticacid is eliminated from EVA (Tmax 394°C). In the same temperature range wateralso evolves (Tmax 370°C), which contributes to expanding the char. However,instead of the three evolution steps expected from reaction between MH andAPP (Figures 6–8), water evolves in a single step with a maximum rateat 370°C. Suppression of water evolution at high temperature (430–455°C,Figures 6–8) may be due to reaction of basic magnesium phosphate withevolving acetic acid (Scheme 3). This suppresses reaction 2.2 of Scheme 2.Water evolved at low temperature by the reaction between APP and MH (Tmax
300–330°C, Figures 6–8), which is shown to occur by ammonia evolution at337°C in Figure 11b, might be consumed by the hydrolysis reaction with PA11of Scheme 4. Indeed, evolution of ammonia with a maximum rate at 510°Cin Figure 11b could be explained by pyrolysis of amine groups, reacting fromhydrolysis, which are included in the blowing charred structure.
The second ammonia evolution was not observed when PA6 was usedinstead of PA11 in a previous work,16 thus confirming the suggested reactionmechanism. Indeed, PA6 would give depolymerisation to caprolactam whichcompetes favourably with the hydrolysis of Scheme 4. The final expansion of
Figure 10 Water evolution curves for ATH/APP mixtures obtained by grinding the twocompounds in a mortar. Pure ATH (solid line), 50% ATH + 50% APP (�)and 30% ATH + 70% APP (c)

261Effect of Hydroxides on Fire Retardance Mechanism
the original samples on charring is about 140% and is not affected by thethermal decomposition of the polyene resulting from deacetylation of EVA(Tmax 510°C).
Mixing of magnesium phosphate, resulting from the APP/MH reaction, withthe carbonised residue from degradation of PA11 seems to give strength to the
Scheme 3 Reaction occuring between acetic acid and the basic magnesium phosphate
Figure 11 TGA-FTIR-EGA-expansion measurements for sample no. 10 (EVA 59%,APP 15%, MH 21%, PA11 5%); (a) TG (solid line) and DTG (n) curves;(b) ammonia (�), water (+) and acetic acid (solid line) evolution curves; (c)relative expansion of the sample

262 Chapter 18
charred material, which does not collapse on EVA volatilisation. The expansionbehaviour of the intumescent composition is mainly related to MH amount,as the expansion can be reduced to 100% or less if more than 30% of inorganichydroxide is added, independently of the content of APP.
18.4 ConclusionsThis study has shown that the interaction between the fire retardant additivesAPP and two basic metal hydroxides (ATH and MH) in their mixtures changestheir degradation process, which is related to the basic strength of the hydoxide.MH, which is the strongest base, shifts ammonia from APP to a lower tempera-ture than that of thermal evolution from pure APP and undergoes chemicaldehydration by reaction with acidic OH groups of the resulting polyphosphoricacid (PPA). A basic magnesium phosphate-polyphosphate is formed that trans-forms into magnesium phosphate at high temperature with further elimination ofwater. Unreacted MH, which depends on APP to MH ratio, dehydrates as whenheated alone.
In the case of ATH, chemical dehydration by reaction with APP unfavour-ably competes with thermal dehydration as compared to MH, because ATHeliminates water at a temperature much lower than MH, giving Al2O3, whichdoes not react with APP. ATH reacts with APP when APP is in large excess.
Combination of the intumescent additive APP-PA11 with MH in the EVAmatrix, gives, on heating evolution of NH3 at a lower temperature than fromAPP heated alone owing to the APP–MH interaction discussed above. The PPAthus made available reacts with PA11, giving the char that is blown by theevolving NH3. This early charring and blowing actions promoted by MHmay explain the improvement of fire retardant performance of the intumescentsystem with larger MH : APP ratios, which enhance the rate of NH3 evolutionand PPA formation by right shifting the equilibrium of reaction 1.1.
Further blowing is due to evolution of water from thermal dehydrationof unreacted MH, combined with evolution of acetic acid from thermaldeacetylation of EVA, which together may add further protection to the polymermatrix.
Formation of magnesium phosphate-polyphosphate may increase the fireretardant efficiency of the intumescent shield by also acting as a refractive
Scheme 4 Reaction of PA11 with H2O

263Effect of Hydroxides on Fire Retardance Mechanism
layer on the polymer surface, reducing heat transfer from the flame to thepolymer and also re-irradiating the heat coming from the environment. Further-more, magnesium phosphate mixed with the organic blown char could increaseits mechanical strength to withstand air drafts in a fire, thus preserving itsprotective action.
18.5 References1. G.L. Nelson, in Fire retardancy of Polymeric Materials, A.F. Grand and
C.A. Wilkie (eds.), Marcel Dekker Inc., New York, 2000, pp. 1–24.2. T.J. O’Niel, Proceedings of the 10th International Flame Retardants
2002 Conference, S.J. Grayson ed., Interscience Communications, London,February 2002, pp. 33–43.
3. J.H. Troitzsch, Proceed. 10th Int. Flame Retardants 2002 Conf., S.J.Grayson ed., Interscience Communications, London UK (February 2002),pp. 249–257.
4. M. Lewin, in Fire retardancy of polymers: the use of intumescence, M. LeBras, G. Camino, S. Bourbigot and R. Delobel (eds.), The Royal Society ofChemistry, Cambridge, UK, 1998, pp. 3–32.
5. M. Le Bras and S. Bourbigot, in Fire retardancy of polymers: the use ofintumescence, M. Le Bras, G. Camino, S. Bourbigot and R. Delobel (eds.),RSC, Cambridge, UK, 1998, pp. 64–75.
6. G. Camino and M.P. Luda, in Fire retardancy of polymers: the use of intu-mescence, M. Le Bras, G. Camino, S. Bourbigot and R. Delobel (eds.),RSC, Cambridge, UK, 1998, pp. 48–63.
7. G. Camino and R. Delobel, in Fire retardancy of Polymeric Materials,A.F. Grand and C.A. Wilkie (eds.), Marcel Dekker Inc., New York, 2000,pp. 217–243.
8. G. Camino and S. Lomakin, in Fire retardant materials, A.R. Horrocks andD. Price (eds.), Woodhead Publ. Ltd., Cambridge, UK, 2001, pp. 318–336.
9. M. Le Bras and S. Bourbigot, in Fire and Polymers : materials andsolutions for hazard prevention, G.L. Nelson and C.A. Wilkie (eds.),Washington DC, 2001, pp. 136–149.
10. X. Almeras, F. Dabrowski, M. Le Bras, F. Poutch, S. Bourbigot, G.Marosi and P. Anna, Polym. Degrad. Stab. 2002, 77, 305–313.
11. M. Le Bras, S. Bourbigot and B. Revel, J. Mater. Sci., 1999, 34,5777–5782.
12. M. Bugajny, M. Le Bras, A. Noel and S. Bourbigot, J. Fire Sci., 1999, 17,494.
13. W.E. Horn, in Fire retardancy of polymeric materials, A.F. Grand andC.A. Wilkie (eds.), Marcel Dekker Inc., New York, 2000, pp. 285–352.
14. S.V. Levchik, G. Camino and L. Costa, Fire Mater., 1995, 19, 1–10.15. S.V. Levchik, L. Costa and G. Camino, Polym. Degrad. Stab., 1992, 36,
31–41.16. A. Riva, G. Camino, L. Fompiere and P. Amigouet, Polym. Degrad.
Stab., 2003, 82, 341–346.
264
CHATPER 19
Barrier Effects for the FireRetardancy of PolymersBERNHARD SCHARTEL, MATTHIAS BARTHOLMAIAND ULRIKE BRAUN
Federal Institute for Materials Research and Testing (BAM), Unter denEichen 87, 12205 Berlin, Germany ([email protected])
19.1 IntroductionA clear change has been noticed in the way ecological and fire risks arebalanced in the field of fire retardancy due to the current demands of consumerprotection. A major trend is the reduction and substitution of all environmen-tally problematic compounds. One general approach to fulfilling this demand isto restrict the fire protection of products in key positions. This approach could betransferred to polymeric materials, concentrating fire retardancy at the interfacebetween pyrolysis zone and gas phase. Obviously, such a surface fire retardancyis different to common fire retardancy of polymers based on homogeneouslydistributed fire retardant additives. Furthermore, it enables a decreased amountof fire retardants, which may reveal economical advantages as well.
The idea can be divided in two concepts: advanced surfaces and smartsurfaces. The first term pools all fire retardant coatings. Of course, some fireretardant paints and coatings have been used successfully for decades already,for instance to protect steel and wood,1,2 for which an incorporation of fire retar-dants had never been possible. However, fire retardant coatings recently havebeen discussed increasingly with respect to the protection of all kinds of poly-meric materials and with respect to the use of new coating techniques such asintumescent gelcoats3 and plasma polymerisation.4,5 The second group, smartsurfaces, pools the systems for which the protection layer is built up in the caseof fire. This group includes char forming and intumescent materials, but alsosystems that yield inorganic residues. Indeed, all these three kinds of materialsare addressed in this chapter, which aims to illuminate the cause-and-effectchain of such smart materials, especially the role of barrier properties. Thechapter addresses the success and the problems of the concept as a valuable

265Barrier Effects for the Fire Retardancy of Polymers
contribution to optimised materials development. Different examples arediscussed, such as char-forming PA-66/red phosphorus compounds, the actionof magnesia residue in HIPS, layered-silicate polymer nanocomposites andintumescent paints for steel constructions.
19.2 ExperimentalThe materials investigated were 25 wt% glass fibre reinforced polyamide 66(PA-66/G5) materials without and with red phosphorus (Pr), Ultramid® (BASFAG, Germany). High impact polystyrene (HIPS) and HIPS containing 15 wt%magnesium hydroxide (Mg(OH)2) were investigated. All systems were providedby BASF AG (Germany). They were compounded via extrusion and plates(10 × 10 cm2, 2.8 mm thick) were prepared via injection moulding for the conecalorimeter investigations. Compounding and the injection moulding wereperformed in the technical scale laboratory at BASF AG in order to complywith industrial preparation standards. Polymer-layered silicate nanocompositeswere prepared using polypropylene graft maleic anhydride (PP-g-MA) with amass fraction of 0.6 wt% maleic anhydride (Aldrich Chemical Company, USA)and 5 wt% modified montmorillonite Cloisite® 20A (C20A) (Southern ClayProducts, USA), which is based on dimethyl dehydrogenated tallow ammoniumchloride as the organic modifier. The nanocomposites were compounded using adouble screw extruder (ZSK 25, Werner and Pfeiderer, Germany) under vacuumwith a rotational speed of 400 min−1, with a throughput of 10 kg h−1 and with atemperature profile along the extruder of between 448 and 462 K from the feederto the nozzle. Cone calorimeter plates (10 × 10 cm2, 5 mm thick) were preparedby injection moulding with a temperature profile of between 428 and 448 K andan injection pressure of 900 bar. An intumescent coating was sprayed on squaresteel plates (100 × 100 mm2 and 5 mm thick) of Euronorm S235JR. Layers of0.3, 0.6, 1.0 and 1.5 mm were applied. A water-based product was used, whichhas been commercialised to increase the fire resistance of steel structures inbuildings. The key components are polyacrylates as binding agents, polyhydricalcohols as carbonising substances, melamine as a foam-producing compound,ammonium polyphosphate as a dehydrating agent and an inorganic filler.Uncoated steel plates were investigated as a control.
The fire behaviour under forced flaming conditions was characterized using acone calorimeter (Fire Testing Technology, UK) in accordance with ISO 5660,applying different external heat fluxes between 30 and 90 kW m−2. The poly-meric materials were measured in the horizontal position using the retainerframe. Data was evaluated using the decreased surface area of the sample(88.36 cm2). The fire risks, heat release rate (HRR) and total heat release (THR)were monitored as well as the mass loss as a function of time. The residues werecharacterized with X-ray photoelectron spectroscopy (XPS) using a SAGE 100(SPECS, Germany). Mg Ka radiation was used at an X-ray power of 250 W(12.5 kV). The flammability of the polymeric materials was characterized usingthe limiting oxygen index (LOI) according to ISO 4589. The coated steel plateswere bedded on a thin layer of ceramic fibre, embedded in a 50 mm thick

266 Chapter 19
vermiculite block 15 × 15 cm2 in size, and investigated under the cone heaterof the cone calorimeter. The temperature on the back of the steel plates wasmeasured using thermocouples.
19.3 Results and Discussion19.3.1 Role of Barrier Effects and Residue in Char Forming
Systems
The fact that increasing char formation improves fire properties has beennoted for decades.6 In the following the role of barrier effects and of thermallystable residue is evaluated in detail for char-forming polymers by comparingPA-66/G5 and PA-66/G5/Pr. The thermal and thermo-oxidative decompositionof PA-66/G5 and PA-66/G5/Pr were investigated with thermogravimetrycoupled with an evolved gas analysis. The results have been described in detailpreviously.7,8 For both materials the polymer scission shows simultaneous forma-tion of carbon dioxide, cyclopentanone, ammonia, methane and amines. Basedon these reported results, a radical decomposition process and an amide hydroly-sis are proposed as the main decomposition pathways. The radical decompositionprocess is not significantly influenced whereas the amide hydrolysis starts atlower temperatures for PA-66/G5/Pr than for PA-66/G5. Therefore, the decom-position temperature range was broadened. The lower onset temperature ofdecomposition indicates a catalysed amide hydrolysis.
The proposed decomposition pathways are summarized in Schemes 1 and 2for PA-66/G5 and PA-66/G5/Pr, respectively. The evolution of cyclopentanone
Scheme 1 Amide hydrolysis decomposition pathway of PA-66/G5 in inert atmosphere.(Monoamine species: 2-methylpiperidine, hexamethylenimine,
1-methylcyclopentylamine, etc.)

267Barrier Effects for the Fire Retardancy of Polymers
indicates alkaline-catalysed scission of the polymer. It must be considered that,in the presence of water and a basic media, red phosphorus can be oxidizedto phosphorus oxide species. In a fire scenario, the interaction of PA-66, H2O,OH− and red phosphorus results in a char-forming process. Based on results ofthermal analysis it is presumed that the char is generated on carbon of the aminespecies.
A comprehensive fire behaviour characterization of PA-66/G5 and PA-66/G5/Pr has been given in recent literature.7–9 The materials showed decreasedflame zones and formed black residues. Pr triggers a condensed phase fireretardancy mechanism in PA-66. Indeed, 6–8 wt% Pr in glass fibre filled PA-66samples were reported to be an outstanding combination that fulfilled UL 94V-0 classification.10 XPS investigation on the residue of PA-66/G5/Pr revealedcarbon (identified peak for the binding energy C1s), nitrogen (N1s), phosphorus(P2s and P2p) and oxygen (O1s) besides the elements of the inorganic filler(Si2s, Si2p, Ca2p, a.o.). Evaluating the binding energy peak C1s at between 282and 293 eV revealed carbon–carbon bonds typical for char structures, and alsocarbon–nitrogen and carbon–oxygen bonds. Based on the structure of the P2p(132–138 eV) and O1s (530–537 eV) peak, phosphorus–oxygen bonds wereinferred. The less intensive peak of N1s (397–405 eV) exhibits small amountsof Monoamine salt species. Therefore the XPS data supported the charring ofthe polymer and phosphorus remaining in the condensed phase, mainly asphosphorus–oxides. The heat release and mass loss corresponded with respect totheir rates and total values for PA-66/G5 and PA-66/G5/Pr. The effective heat ofcombustion was not changed by Pr, establishing the absence of important gasphase mechanisms.8 The time to ignition was not improved. After ignition thestrong initial increase of HRR was rather abruptly stopped for PA-66/G5/Pr
when an effective residue layer was formed yielding a smaller peak of HRR.
Scheme 2 Amide hydrolysis decomposition pathway of PA-66/G5/Pr in inertatmosphere. (Monoamine species: 2-methylpiperidine, hexamethylenimine,
1-methylcyclopentylamine, etc.)

268 Chapter 19
The further burning behaviour was different for samples with and without Pr.Samples with Pr were characterized by lower heat release rates (visually distin-guished by a smaller flame zone), and longer burning times. Furthermore, thetotal mass loss was decreased for the increasing charring of red phosphoruscontaining samples and resulted in decreased total heat release.
Investigation of the fire behaviour for different external heat fluxes revealeda deeper understanding of the mechanisms. The residue due to the non-glassmaterial increased from 5% up to 25% of the initial mass for decreasing externalheat fluxes from 75 to 30 kW m−2. Consequently, THR was strongly reduced forlow external heat fluxes, whereas the effect vanished for higher external heatfluxes (Figure 1). Especially for low external heat fluxes, the amount was clearlygreater than the effect given by replacing a combustible polymer with Pr. PA-66was clearly transformed into a char-forming material. The peak of HRR ofPA-66/G5 showed the polymer-typical strong increase with increasing externalheat fluxes, whereas the samples with red phosphorus were less dependent onexternal heat flux (Figure 1). The barrier effect became active with progressiveformation of a char at the surface, and depended on both the amount of char andits barrier properties rather than on the external energy impact.9 Therefore, thefire retardancy effects showed self-enhancing characteristics through decreasedthermal feedback from the flame zone on pyrolysis. What is more, with increas-ing external heat flux fire retardancy increased in terms of maximum heatrelease rate, but fire retardancy decreased in terms of total heat release at thesame time (Figure 1). The char acted via two mechanisms: First, the barrierlayer restricted the heat and mass transfer between the flame and the pyrolysiszone. Second, the thermally stable char was equivalent to reduced total fuelsupport of the flame zone. The barrier effect and the reduction of combustiblevolatiles were clearly identified as two separate fire retardancy mechanisms.
Figure 1 Peak of HRR and THR vs. external heat flux for PA-66/G5 and PA-66/G5/Pr

269Barrier Effects for the Fire Retardancy of Polymers
The materials’ surface was identified as a promising key position for fireretardancy.
19.3.2 The Effect of Inorganic Residue in Contrast to Char
In contrast to the induced char formation of the polymer in cases where Pr isadded to PA-66/G5 materials, adding inorganic inert fillers resulted in a lesspronounced effect with respect to thermal decomposition and THR. Obviously,there is an difference between inorganic residue and char, which is discussed inthe following. Indeed, adding 15 wt% Mg(OH)2 in HIPS, for instance, resultedin a 15% reduction of the total heat release under forced flaming conditions(Figure 2) due to the ordinary replacement of combustible material.
The weight and XPS data showed that the residue was just MgO with someMg(CO3) caused by impurities, as has been reported before.11 No trace of carbonwas found to remain as char in the condensed phase. Furthermore, THRremained nearly unchanged for different external heat fluxes, since the totalamount of released fuel remained unchanged even for very different burningtimes. However, Mg(OH)2 influences burning behaviour by means of severaleffects.11 Obviously, the endothermic reaction to MgO associated with the for-mation and release of H2O is an efficient heat-sink mechanism. Furthermore,the released H2O acts as a very effective cooling agent. Additionally, the MgOresidue works as a barrier at the surface, suppressing the fuel support rate. Thiseffect was clearly indicated by the changed HRR curve versus time for HIPS/Mg(OH)2 in comparison to HIPS (Figure 2). After a similar time to ignitionand a similar initial increase of HRR, the peak of heat release was significantly
Figure 2 HRR and THR vs. time for HIPS and HIPS/Mg(OH)2 with different platethickness (external heat flux = 50 kW m−2)

270 Chapter 19
reduced for HIPS/Mg(OH)2. The MgO residue layer acted as an efficient bar-rier, resulting in a continuous HRR decrease when the barrier layer increased.This description is supported convincingly when samples with different thick-nesses are compared. The thicker HIPS/Mg(OH)2 samples showed the sameinitial increase, peak of HRR and subsequent decrease, which was merelyelongated in terms of time (Figure 2). It became obvious that the main charac-teristics were dominated by barrier formation. The fire retardancy effect becamestrongly dependent on the formation of the barrier layer and on the barrierproperties. Since both the MgO residue and the layered silicate residue ofthe example discussed below were very stable against heat treatment, the peakof HRR became nearly independent of the external heat flux (Figure 3).Consequently, the peak of HRR was strongly decreased for higher external heatfluxes as compared to the polymer.
In the last ten years, layered-silicate polymer nanocomposites have beenheavily promoted as suitable materials to exploit barrier effects for fireretardancy.12–14 Indeed, their performance was impressive in respect to peak ofHRR (Figure 3). The performance of 5 wt% C20A, which forms good nanocom-posites in PP-g-MA,15 was up to the performance of 15 wt% Mg(OH)2 in HIPS.The effect was reached even though no charring of the polymer was observed forthe system of PP-g-MA/C20A either and although C20A did not provide theadditional heat-sink mechanisms of Mg(OH)2. It was pointed out that a distribu-tion on the nanoscale enabled the exploration of the impressive aspect ratioof the silicate plates, forming an effective barrier layer. The increasing reduc-tion of the peak of HRR for higher external heat fluxes yielded significantlydecreased fire growth rates under forced flaming conditions.
Such performance is evaluated in modern test procedures, including thosefor building (SBI) and transportation (cone calorimeter test for applicationsin railway vehicles and aircrafts). However, analogous to the results reported
Figure 3 Peak of vs. external heat flux for HIPS, HIPS/Mg(OH)2, PP-g-MA andPP-g-MA/C20A

271Barrier Effects for the Fire Retardancy of Polymers
for PA-66/G5/Pr and HIPS/Mg(OH)2, the time to ignition was not improved.Furthermore, for lower external heat flux the reduction became smaller, so thatthe fire retardancy effect vanished (Figure 3). Unfortunately, flammability testssuch as LOI and UL 94 are connected with the performance for external heatfluxes towards zero and are the main criteria for polymeric materials. There-fore, PP-g-MA/C20A and HIPS/Mg(OH)2 were to some extent not up to thedemands of fire retarded polymer materials as opposed to the PA-66/G5/Pr
example. Table 1 shows the LOI for the systems described and demonstratesthe problem. Only the char-forming system PA-66/G5/Pr showed a relevantimprovement of LOI in comparison to the corresponding polymer, whereasthe nanocomposite did not show even a significant change. A moderateimprovement was found for the HIPS/Mg(OH)2 system, caused probably by theadditional mechanisms beyond the barrier formation.
19.3.3 The role of Insulation Properties in Contrast to MassTransfer Barrier
It is reasonable to assume that any surface layer works in principle as a barrierfor heat transport and mass transport. Effectiveness in both respects dependson the specific properties of the layer. In practice the two effects often cannotbe distinguished. Conversely, reduced fuel support in the flame zone due toa mass-barrier will result in a consequently decreased thermal feedback. Athermal barrier, however, will result in a reduced decomposition rate and there-fore in reduced fuel support. Indeed, the implication of a mass-barrier and aheat-barrier, respectively, may be the same in terms of fire behaviour. Further-more, to some extent the interdependence of both effects becomes self-enhancingwith respect to fire retardancy.
The charring system discussed, PA-66/G5/Pr, showed a significant insulationcontribution, resulting in reduced effective pyrolysis temperatures, whereas thecharacteristics of the residue-forming HIPS/Mg(OH)2 and PP-g-MA/C20A maybe dominated by mass-barrier effects. In contrast to this, intumescent systemswere developed to optimise heat-barrier properties. Intumescent systems aresmart systems that build up a multicellular char structure under heat treatment.Figure 4 shows a typical sequence of photographs taken during the intumescenceof a fire protection layer on a steel plate under the cone heater. The thickness ofthe layer increased twenty, indeed up to one hundred, times. Only coactionsof different decomposition processes–such as char formation, the release of non-flammable gases and heat-sink mechanisms–result in an effective intumescence.These have been described in detail in a previous paper on the investigated
Table 1 LOI for the investigated materials
LOI (%) LOI (%) LOI (%)
PA-66/G5 22.4 ± 0.5 HIPS 17.2 ± 0.5 PP-g-MA 19.2 ± 0.5PA-66/G5/Pr 26.0 ± 0.5 HIPS/Mg(OH)2 19.5 ± 0.5 PP-g-MA/C20A 19.3 ± 0.5

272 Chapter 19
material based on a thermogravimetric study.16 Notably, the temperatureranges of intumescence under the cone heater and thermogravimetric resultscorresponded to each other when it was taken into account that a constantexternal heat flux was applied under the cone heater, whereas a constant heatingrate was used for thermogravimetry.
The heat-insulating effects of the intumescent systems are illustrated in com-parison to the temperature development of uncoated steel plates in Figure 5.Furthermore, the influences of varying the coating thickness and the externalheat fluxes were investigated and are also summarized in Figure 5. The initialtemperature increase was very similar for both the coated and the uncoated steel
Figure 4 Photographs taken during the intumescence of the 1.5 mm thick layer coated ona steel plate at an external heat flux of 60 kW m−2

273Barrier Effects for the Fire Retardancy of Polymers
plates. Multicellular char formation occurred at between 450 and 570 K andresulted in a significant slow-down of the temperature increase. The results werediscussed recently, whereby the thermal conductivity was determined by meansof numerical simulation.17 The layer acted as a heat-barrier, resulting in anefficient thermal insulation. Hence, the steel temperature was dependent on thetime, the layer thickness and the applied heat flux.
Decomposition onset temperatures of 750 K were reported for the multicellu-lar char.16 Depending on the external heat flux, corresponding temperatureswere reached, especially at the top of the layer. This decomposition starting atthe surface is clearly apparent in Figure 4, for instance. After the black char wasdecomposed, the white inorganic component of the material became visible.Different temperature curves were observed for longer times depending on theexternal heat flux, char decomposition depth and the remaining intact multicel-lular char (Figure 5). For smaller external heat fluxes and for larger initial layerthicknesses the insulation properties remained sufficient and the temperature ofthe steel plate was nearly constant, so that even for times over 30 min the steeltemperature was below 600 K. Hence, the insulation properties of the intumes-cent coating built up a temperature difference larger than 150 K, and even up to400 K, compared to those of uncoated steel plates. For higher external heatfluxes and thinner initial thicknesses, the insulation properties decreased signifi-cantly during the experiment. With polymeric materials, intumescence reducedthe energy supporting the pyrolysis zone. Consequently, the flame spread canbe significantly reduced, or self-extinguishing behaviour may be reached evenwhen the effective temperature is reduced below the decomposition temperature.
19.4 ConclusionFour different materials were investigated that exhibit smart surfaces in termsof fire retardancy. The two mechanisms for char-forming materials–barrier
Figure 5 Temperature at the back of uncoated and coated steel plates plotted against timefor different coating thicknesses (d) and external heat fluxes
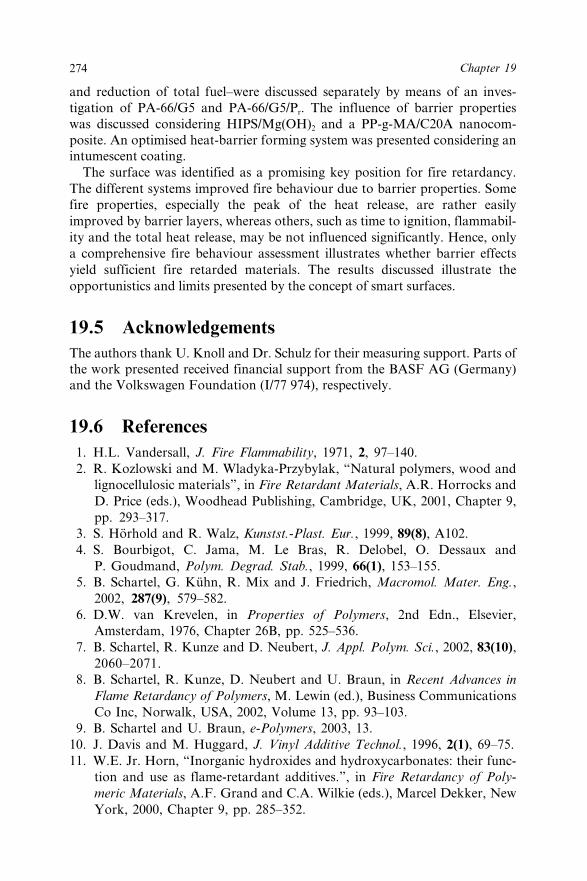
274 Chapter 19
and reduction of total fuel–were discussed separately by means of an inves-tigation of PA-66/G5 and PA-66/G5/Pr. The influence of barrier propertieswas discussed considering HIPS/Mg(OH)2 and a PP-g-MA/C20A nanocom-posite. An optimised heat-barrier forming system was presented considering anintumescent coating.
The surface was identified as a promising key position for fire retardancy.The different systems improved fire behaviour due to barrier properties. Somefire properties, especially the peak of the heat release, are rather easilyimproved by barrier layers, whereas others, such as time to ignition, flammabil-ity and the total heat release, may be not influenced significantly. Hence, onlya comprehensive fire behaviour assessment illustrates whether barrier effectsyield sufficient fire retarded materials. The results discussed illustrate theopportunistics and limits presented by the concept of smart surfaces.
19.5 AcknowledgementsThe authors thank U. Knoll and Dr. Schulz for their measuring support. Parts ofthe work presented received financial support from the BASF AG (Germany)and the Volkswagen Foundation (I/77 974), respectively.
19.6 References1. H.L. Vandersall, J. Fire Flammability, 1971, 2, 97–140.2. R. Kozlowski and M. Wladyka-Przybylak, “Natural polymers, wood and
lignocellulosic materials”, in Fire Retardant Materials, A.R. Horrocks andD. Price (eds.), Woodhead Publishing, Cambridge, UK, 2001, Chapter 9,pp. 293–317.
3. S. Hörhold and R. Walz, Kunstst.-Plast. Eur., 1999, 89(8), A102.4. S. Bourbigot, C. Jama, M. Le Bras, R. Delobel, O. Dessaux and
P. Goudmand, Polym. Degrad. Stab., 1999, 66(1), 153–155.5. B. Schartel, G. Kühn, R. Mix and J. Friedrich, Macromol. Mater. Eng.,
2002, 287(9), 579–582.6. D.W. van Krevelen, in Properties of Polymers, 2nd Edn., Elsevier,
Amsterdam, 1976, Chapter 26B, pp. 525–536.7. B. Schartel, R. Kunze and D. Neubert, J. Appl. Polym. Sci., 2002, 83(10),
2060–2071.8. B. Schartel, R. Kunze, D. Neubert and U. Braun, in Recent Advances in
Flame Retardancy of Polymers, M. Lewin (ed.), Business CommunicationsCo Inc, Norwalk, USA, 2002, Volume 13, pp. 93–103.
9. B. Schartel and U. Braun, e-Polymers, 2003, 13.10. J. Davis and M. Huggard, J. Vinyl Additive Technol., 1996, 2(1), 69–75.11. W.E. Jr. Horn, “Inorganic hydroxides and hydroxycarbonates: their func-
tion and use as flame-retardant additives.”, in Fire Retardancy of Poly-meric Materials, A.F. Grand and C.A. Wilkie (eds.), Marcel Dekker, NewYork, 2000, Chapter 9, pp. 285–352.

275Barrier Effects for the Fire Retardancy of Polymers
12. M. Zanetti, T. Kashiwagi, L. Falqui and G. Camino, Chem. Mater., 2002,14(2), 881–887.
13. J.W. Gilman, T. Kashiwagi, E.P. Giannelis, E. Manias, S. Lomakin,J.D. Lichtenham and P. Jones, “Nanocomposites: radiative gasificationand vinyl polymer flammability”, in Fire Retardancy of Polymers: The useof Intumescence, M. Le Bras, G. Camino, S. Bourbigot and R. Delobel(eds.), Royal Society of Chemistry, Cambridge, 1998, pp. 203–221.
14. J.W. Gilman and T. Kashiwagi, “Polymer-layered silicate nanocompositeswith conventional flame retardants.”, in Polymer-Clay Nanocomposites,T.J. Pinnavaia and G.W. Beall (eds.), John Wiley & Sons, Chichester,2000, Chapter 10, pp. 193–206.
15. A. Tidjani, O. Wald, M.-M. Pohl, M.P. Hentschel and B. Schartel, Polym.Degrad. Stab., 2003, 82(1), 133–140.
16. R. Kunze, B. Schartel, M. Bartholmai, D. Neubert and R. Schriever,J. Therm. Anal. Calorim., 2002, 70(3), 897–909.
17. M. Bartholmai, R. Schriever and B. Schartel, Fire Mater., 2003, 27(4),151–162.

276
CHAPTER 20
Plasma Assisted Process forFire Properties Improvementof Polyamide and ClayNanocomposite ReinforcedPolyamide: A Scale-up StudyANGÉLIQUE QUÉDÉ,1 BRIGITTE MUTEL,1
PHILIPPE SUPIOT,1 ODILE DESSAUX,1 CHARAFEDDINEJAMA,2 MICHEL LE BRAS2 AND RENÉ DELOBEL2
1Laboratoire de Génie des Procédés d’Interactions FluidesRéactifs - Matériaux, Université des Sciences et Technologies de Lille,F-59655 Villeneuve d’Ascq Cedex, France ([email protected])2PERF, Ecole Nationale Supérieure de Chimie de Lille, U.S.T.L., F-59652Villeneuve d’Ascq Cedex, France ([email protected])
20.1 IntroductionPolymers are used in many fields, but they generally require a modificationbefore use. One of their inconveniences is their high inflammability. Firerisks can be reduced in several ways. The incorporation of flame retardantadditives to the polymer1 is a quite simple and cheap technique, but suchadditives (commonly hydroxides, halogenated or phosphated components),which have rather high loading rates (50–70 wt%), can reduce the mechanicalproperties of the polymer and lead to ecological problems.2,3 Another way is achemical modification of the macromolecule.4 In this case, the thermal andmechanical properties of the polymer are preserved (the modified part of themacromolecule is lower than 10%) or enhanced. But, this rather expensivetechnique is not much used. Either physical5 or chemical6 surface modificationprocesses seem attractive as they allow one to concentrate fireproof properties atthe polymer surface, where the inflammability occurs, and do not modify thebulk properties of the material. However, literature data about these processes

277A Scale-up Study
are rather poor. Polysiloxane-based films have good thermal stability andinteresting flame retardant properties.7 In previous work,8–10 we gave evidencethat it was possible to improve polyamide-6 (PA-6) and polyamide-6 claynanocomposite (n-PA-6) flame retardancy thanks to the deposition of such filmselaborated from cold remote nitrogen plasma (CRNP) assisted polymerizationof 1,1,3,3-tetramethyldisiloxane (TMDS) pre-mixed with oxygen. Results werepromising and the coating seems to be an efficient fire retardant for polyamidesubstrates.
The present work compares properties of samples treated in the same experi-mental conditions, either with the previous reactor8–10 or with a larger oneallowing the coating of standard size samples for limiting oxygen index tests andcone calorimeter measurements. The chemical composition of the films, theirmorphologies, their specific gravities and their growing rates are alsocompared. The influence of sample size on the evaluation of fire retardantproperties is also presented.
20.2 Experimental20.2.1 Reactor
The experimental set-up is schematically shown Figure 1. A nitrogen flow(purity: 99.995%) was excited in an electrodeless discharge by a microwave
Figure 1 Experimental set-up. Differences between S and L reactors are specified in grey

278 Chapter 20
generator. The discharge was produced in a fused silica tube and the gas wasevacuated by continuous pumping. Excited species were led to the reactorchamber where the CRNP appears like a yellow afterglow. The CRNP is free ofcharged particles (and so substrate damage is avoided) and is characterized by astrong thermodynamic non-equilibrium. The monomer (TMDS – purity 97%,supplied from Aldrich Chemical Co), pre-mixed with oxygen (purity ≥99.5%)was injected (at a distance dis from the sample) in the reaction chamber, througha coaxial injector. Only two elements (grey in Figure 1) make the differencebetween the two set-up used in this work: the Pyrex reactor size and the primarypump. For the small one (denoted by S-reactor), the Pyrex reactor was 150 mmhigh and the pump flow rate was 58 × 103 Nml min−1. For the large one (denotedby L-reactor), the Pyrex reactor was constituted by the previous one added witha second part 250 mm high and the pump flow rate was 2 × 10⁶ Nml min−1. Thedeposition process was carried out in two steps with the same experimentalparameters as the ones used in previous work.8–10 At first, samples were treatedfor 5 min by the CRNP (N2 flow rate (Q): 1800 Nml min−1, transmitted micro-wave power (P): 560 W) to increase adhesion quality of the polymer.
Secondly, the deposition step (TMDS injection, duration denoted by t)was performed without air exposure. The polymerization process leads to apreviously studied white glow.11,12 (QN2 = 1800 Nml min−1, QO2 = 50 Nml min−1,QTMDS = 5 Nml min−1, P = 560 W). The injector and substrate (dis) were 100 mmapart in the S-reactor. In the L-reactor, the influence of this parameter is studied(section 20.3.1) to obtain a radial thickness homogeneity of the deposited film atleast as good as that obtained in the small reactor. Samples were coated succes-sively on each face with an open air exposure between the two steps for fireproofevaluation.
20.2.2 Characterization Techniques
Chemical characterization of the films was performed by FTIR spectrometry(Perkin-Elmer). Their morphologies were observed by scanning electronmicroscopy (Leo 982 Zeiss microscope) operating under 10−4 Pa (voltage 1 kV).For both studies, films were deposited on silicon 100.
The deposition rate determined in Å s−1 at a position x mm from the reactorcenter is denoted by Vx. It was evaluated from surface profilometry (Alphasteppiezoelectric stylus, accuracy: ±10−2 mm) on a coating performed on a glossyaluminum disk sample (diameter: 54 mm). The deposition rate determined inmg m−2 s at a position x mm from the reactor center is denoted by Vpx. It wasevaluated from the mass deposited on a Si square sample (10 × 10 mm2), thecenter of which was x mm from the reactor center. The mass was measured byweighing (accuracy: ±0.05 mg). The radial homogeneity of the coating wasestimated from Hpx = Vpx/Vp0.
Adhesion quality was estimated by the cross-hatch cutter test: the depositedfilm was cut to the substrate as a cross-hatch pattern. The adhesion quality wasquoted from the percentage of squares remaining stuck after the action of anormalized adhesive tape.

279A Scale-up Study
Fire properties of samples were evaluated from limiting oxygen index (LOI)tests and cone calorimeter (CC) measurements. LOI tests were performed usinga Stranton Redcroft Instrument according to the ASTM D 2863/77 norm.13
This test allows to determine the minimal oxygen rate, in an oxygen–nitrogenmixture, assuring the combustion of a sample vertically settled (standard size :100 × 10 × 3 mm3). CC measurements were obtained with a Stranton Redcroftcone calorimeter according to the ASTM E 1354-90a norm.14 Samples wereexposed to a 35 kW/m2 external heat flux, which represents the heat flux foundin the vicinity of solid-fuel ignition source (standard size: 100 × 100 × 3 mm3).Conventional data can then be obtained, such as rate of heat release (RHR),ignition time (IT), total heat evolved (THE), volume of smoke production(VSP), CO and CO2 rates of combustion gases and residual weights (RW).
20.2.3 Samples
Polyamide-6 and Polyamide-6 clay nanocomposite (clay mass fraction: 2wt%)were supplied by UBE as pellets. Sheets (100 × 100 × 3 mm3) are obtained usinga Darragon press at 255°C with a pressure of 106 Pa. LOI tests were performedwith small samples (50 × 10 × 3 mm) denoted LOI-S and with normalizedsamples (100 × 10 × 3 mm3) denoted LOI-N. CC studies were performed withsmall samples (20 × 20 × 3 mm3) denoted CC-S and with normalized samples(100 × 100 × 3 mm3) denoted CC-N. Coated PA-6 and n-PA-6 samples wererespectively denoted by c-PA-6 and c.n-PA-6.
20.3 Results20.3.1 Influence of dis on Both Deposition Rate and Radial
Thickness Homogeneity of Films Deposited in theL-reactor
As we aimed to deposit a film with a thickness that is as homogeneous aspossible on (100 × 100 mm2) samples, the influence of this parameter versus dis
was studied. Results are shown in Table 1. Taking into account accuracy values,
Table 1 Influence of the distance between the injector and the substrate (dis) onthe deposition rates and on the radial thickness homogeneity of thefilm deposited in the L-reactor
dis (mm) Vp0 ± 1.1 (mg m−2 s−1) Vp44 ± 1.1 (mg m−2 s−1) Hp44 ± DHp44
295 8.9 3.3 0.37 ± 0.17300 8.9 6.7 0.75 ± 0.24305 7.8 3.3 0.42 ± 0.20320 8.9 4.4 0.49 ± 0.18350 7.8 4.4 0.56 ± 0.22380 4.4 3.3 0.75 ± 0.44

280 Chapter 20
Hp44 is approximately constant whatever dis. Except for dis = 380 mm, thedeposition rate at the center of the sample (Vp0) is also independant of dis. Nota-bly Vp0 is always larger than Vp44. At the sample edge, the deposition rate (Vp44) ismaximum for dis = 300 mm. This value was selected for the work reported here.
20.3.2 Comparison of Deposition Rate, Radial Homogeneity andSpecific Gravity of the Films Obtained with the TwoReactors
Results are shown in Table 2. Taking into account Hpx accuracy values, theradial homogeneity of the deposited film seems to be better in the L-reactor.Besides, the deposition rate is strongly decreased (within a factor of 9). Thisfactor is of the same order as the ratio between the crossing surface of reactionzone and substrate holder plan (Figure 1). In a first approximation, this can beexplained supposing that all polymerization products are located inside thisreaction zone. But, to confirm this hypothesis it would be necessary to take intoaccount the kinetics of the mixture. According to accuracy, it appears that thefilm specific gravity is not dependant on the reactor size; it is approximatelyequal to 1.9 ± 0.3 g cm−3.
20.3.3 FTIR Study: Comparison of the Chemical Structure ofFilms Obtained with the Two Reactors
Figure 2 shows FTIR spectra of 1 mm thick films elaborated in the two reactors.Whatever the reactor size, the main groups are Si(CH3)x and Si–O–Si.Asymmetric and symmetric n(CH3) bands are at 2960 and 2910 cm−1 respec-tively,15 the d(CH3) ones appear respectively at 1410 and 1250 cm−1.16,17 r(CH3)and n(Si–C) bands are in the range 900–700 cm−1 16–19. The asymmetric n(Si–O–Si) band, located towards 1200–1000 cm−1 17,20 is the strongest. This chemicalgroup is provided by the monomer; the deposited film has a polysiloxane-likestructure. The n(OH) band located between 3600 and 3000 cm−1 is also present.The only difference between the two films spectra is the relative decrease of OHand CH3 bands when the reactor size increases.
20.3.4 SEM Study: Comparison of the Morphology of FilmsObtained with the Two Reactors
Figure 3 shows SEM pictures of films elaborated in the two reactors. The 1 mmthick film elaborated in the L-reactor is uniform, smooth and without any defect(Figure 3a) while it shows a fine texture when it is elaborated in the S-reactor(Figure 3b). For the thicker film (≈ 4.5 mm), grains appear. Their size, about0.1–0.3 mm for film elaborated in the L-reactor (Figure 3c–d), is about 1.2 mmfor the one elaborated in the S-reactor (Figure 3e–f). Moreover, in this last case,a linear arrangement of these grains appears (Figure 3e–f). The film texture,finer with the L-reactor than with the S-reactor, may be correlated with the low-est deposition rate obtained when the reactor size increases.
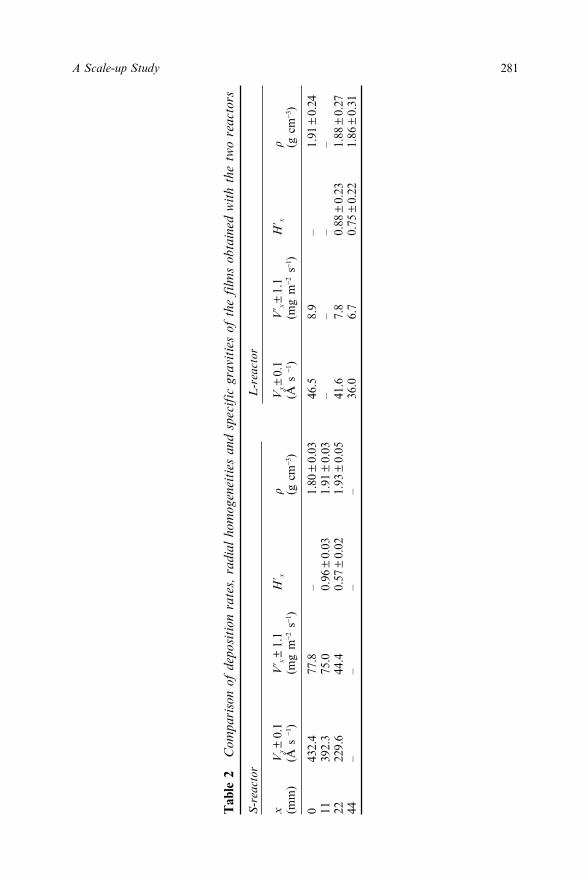
281A Scale-up Study
Tab
le 2
Com
pari
son
of d
epos
itio
n ra
tes,
rad
ial
hom
ogen
eiti
es a
nd s
peci
fic
grav
itie
s of
the
film
s ob
tain
ed w
ith
the
two
reac
tors
S-r
eact
orL
-rea
ctor
xV
x±
0.1
Vp x
±1.
1Hp x
rV
x±
0.1
Vp x
±1.
1Hp x
r(m
m)
(Å s
−1)
(mg
m−2
s−1
)(g
cm
−3)
(Å s
−1)
(mg
m−2
s−1
)(g
cm
−3)
043
2.4
77.8
–1.
80±
0.03
46.5
8.9
–1.
91±
0.24
1139
2.3
75.0
0.96
±0.
031.
91±
0.03
––
––
2222
9.6
44.4
0.57
±0.
021.
93±
0.05
41.6
7.8
0.88
±0.
231.
88±
0.27
44–
––
–36
.06.
70.
75±
0.22
1.86
±0.
31
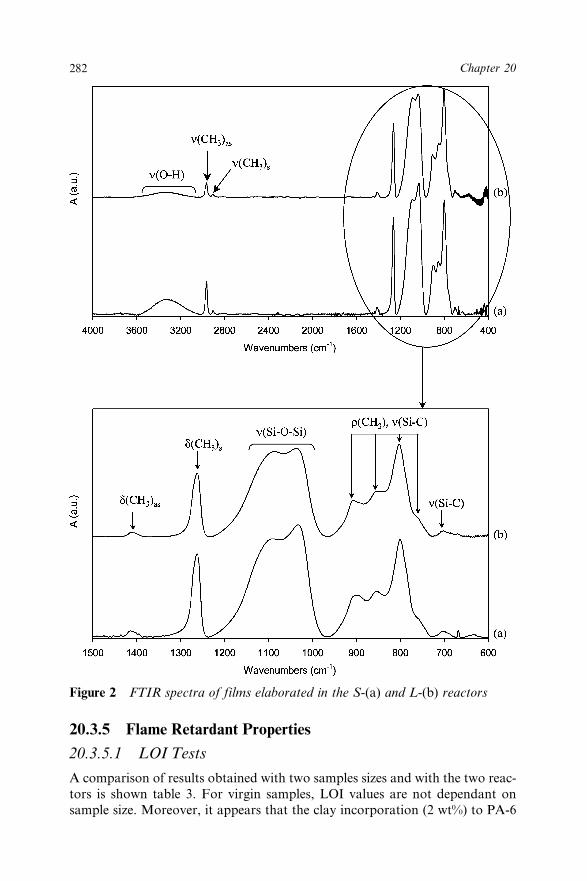
282 Chapter 20
Figure 2 FTIR spectra of films elaborated in the S-(a) and L-(b) reactors
20.3.5 Flame Retardant Properties
20.3.5.1 LOI Tests
A comparison of results obtained with two samples sizes and with the two reac-tors is shown table 3. For virgin samples, LOI values are not dependant onsample size. Moreover, it appears that the clay incorporation (2 wt%) to PA-6

283A Scale-up Study
does not improve the LOI, which remains equal to 21 ± 1%. For coated samples,the film thickness at the sample edge (where ignition occurs during the test) wasdifferent. For the S-reactor, it was evaluated from V22 (Table 2) by supposingthat the deposition rate was similar both for aluminum and polymer substrates.
Figure 3 SEM pictures of films elaborated in the two reactorsFilm thickness = 1 mm, × 2000: (a) L-reactor, (b) S-reactorFilm thickness = 4.5 mm, L-reactor: (c) ×2000, (d) ×10000Film thickness = 4.5 mm, S-reactor: (e) ×2000, (f) ×10000

284 Chapter 20
For the L-reactor, it was calculated from V44 (Table 2). For sample coated in theS-reactor, LOI is slightly improved when a film (28 mm thick) is deposited onPA-6 (LOI increases from 21 to 25%), but when it is deposited on n-PA-6, astrong improvement can be observed as LOI increases from 22 to 46%. Theseresults can be explained by a better adhesion quality of the film deposited onn-PA-6 than on PA-6: after the cross-hatch cutter test, 84% of squares remain onc-n-PA, while only 60% remain on c-PA.
For the L-reactor, the influence of the film thickness at the edge of the samplewas studied first. Results are shown table 4. Whatever the films thickness,ranging from 0.6 to 18.1 mm, LOI test results are not improved, neither by thecoating nor by the clay addition to PA-6: PA-6, c-PA-6 and n-PA-6 have thesame LOI (21 ± 1%). But the LOI of the c.n-PA-6 is strongly improved: itsharply increases as soon as a 0.6 mm thick film is deposited. A maximum valueequal to 48% is obtained for 1.5 mm, then it decreases and remains quite stable(42%) for thickness ranging from 3 to 18 mm.
So, whatever the reactor size and film thickness, the combined clay additionand film deposition on PA-6 leads to a strong increase of LOI. This increaseseems to be independent of film thickness (Table 3) and it is worth noting that athin coating is sufficient. The effect of using either a clay addition or a coating isvery slight or not noticeable.
FTIR spectra of LOI-S and LOI-L test residues were also recorded. c-PA-6has a polysiloxane structure similar to the one of the deposited film, while thec.n-PA-6 residue is mainly silica-like. These results give evidence that, for PA-6,the use of both a nano-composite additive and a coating leads to a componentthat improved thermal stability.
Table 3 LOI (vol%) vs. sample and reactor sizes
LOI-S LOI-N Nature of LOI test residues
PA6 21 ± 1 21 ± 1 –n-PA6 22 ± 1 22 ± 1 –Reactor S-reactor L-reactorc-PA6 25 ± 1 22 ± 1 Polysiloxanec.n-PA6 46 ± 1 48 ± 1 Silica-likeFilm thickness (mm) 28 1.5
Table 4 LOI (vol%; ±1%) vs. thickness of a film deposited at the edge ofPA-6 and n-PA-6 samples (LOI-N) in the L-reactor
Film thickness at the edge ofthe sample (µm) 0 0.6 1.1 1.5 2.1 3.2 5.3 9.6 18.1LOI-N PA-6 21 22 22 22 22 22 22 22 22
n-PA-6 22 45 47 48 47 43 43 42 42

285A Scale-up Study
20.3.5.2 Cone calorimeter measurements:
CC measurements performed on small samples (S-samples), virgin or coatedin the S-reactor are shown table 5. Film thickness at the sample edge, calculatedfrom V11 (Table 2), was 47 mm. Taking into account the accuracy of measure-ment, the coating deposited on PA-6 does not improve results.
Likewise, no significant modification of IT, THE and RW parameters can benoticed between the four samples. Besides, a noticeable decrease (44 relative%)of the RHR peak can be observed after clay incorporation to PA-6; this decreaseis reinforced (59%) after deposition of a film on the n-PA-6. To validate thesepromising results, a more complete study was performed on normalized sizesamples (N-samples) and with the L-reactor (summarized in table 6). For PA-6(Table 6, column a), IT, RHR peak and RW results are in good agreement withliterature data, respectively equal to 60 ± 3 s,[20] 1150 ± 115 kW/m2 20 or1010 ± 101 kW/m2 21,22 and 1 ± 0.5%.20 The RHR peak obtained in this work,larger than the one obtained in other work, leads to a higher THE (1346 ± 70 kJinstead of 1000 ± 100 kJ 20). For n-PA-6 (Table 6, column c), RHR peak andRW are also in good agreement with literature data, respectively equal to686 ± 69 kW/m2 and 3 ± 0.5%.21,22 Other parameters were not compared as nodata were found. For coated samples, the film thickness at the edge was 1.5 mm(this value being chosen from LOI results (Section 20.3.5.1)). The coating depos-ited on PA-6 (Table 6, column b) does not allow a reduction of RHR or CO2
peaks, but it leads to a decrease of THE (38%), CO (50%) and VSP (43%)peaks and of total quantities of CO (45%), of CO2 (36%) and of VSP (41%).Combustion is not delayed, but is accelerated within ~100 s (Figure 4). Thiscould be due to delamination of the coating under heating promoting fasterdegradation and/or to the presence of new chemical functions grafted at thePA-6 surface after the pre-treatment. These functions can lead to the formationof non-inflammable products, explaining the decrease of THE and of gaseousemissions. Clay incorporation to PA-6 (Table 6, column c) leads to a decrease ofall peaks. (RHR: 34%; CO: 63%; CO2: 39%; VSP: 32%) and of total quantitiesof energy (29%), of CO (24%) and of CO2 (36%). The n-PA-6 combustion isdelayed for 50 s in comparison to that of PA-6 (Figure 4), is slightly slowed andleads to a RW of 4% (1% for PA-6).
These results show that, thanks to clay incorporation, a protective coating isformed at the polymer surface during the combustion, reducing mass and heattransfers between the flame and the polymer. c.n-PA-6 (Table 6, column d) leads
Table 5 Cone calorimeter measurements performed on virgin or coated in theS-reactor S-samples
S-samples PA-6 c-PA6 n-PA6 c.n-PA6
IT (s) 81 ± 18 71 ± 16 75 ± 6 83 ± 8RHR (kW m−2) 1972 ± 80 1784 ± 199 1102 ± 112 807 ± 95THE (kJ) 32 ± 2 32 ± 2 35 ± 1 29 ± 2RW (%) 0.9 ± 0.2 1.2 ± 0.1 1.4 ± 0.2 1.3 ± 0.1

286 Chapter 20
Tab
le 6
Con
e ca
lori
met
ers
mea
sure
men
ts f
or v
irgi
n an
d co
ated
PA
-6 a
nd n
-PA
-6 s
ampl
es.
Infl
uenc
e of
film
thi
ckne
ss a
ndof
sam
ples
siz
e. S
ampl
es w
ere
coat
ed i
n th
e L
-rea
ctor
. E
ach
resu
lt i
s th
e av
erag
e va
lue
of t
hree
mea
sure
men
ts
Sam
ple
size
Sta
ndar
d (1
00 ×
100
× 3
mm
3 )S
mal
l (20
× 2
0 ×
3 m
m3 )
Film
thi
ckne
ss1.
510
10
Sam
ples
PA
-6c-
P.A
-6n-
PA
-6c.
n-P
A-6
c.n-
PA
-6n-
PA
-6c.
n-P
A-6
Igni
tion
tim
e (s
)66
±3
67±
1198
±2
96±
211
0±
275
±6
107
±12
RH
R p
eak
(kW
m−2
)10
53±
3096
7±
7069
9±
3462
3±
1053
4±
2811
02±
112
712
±11
2T
HE
(kJ
)13
46±
7082
9±
3994
9±
4590
0±
2385
8±
1035
±1
37±
2C
O p
eak
(ppm
)25
3±
112
7±
1594
±5
82±
571
±9
7.0
±1.
3–
Tot
al C
O e
mis
sion
(ppm
s)
1456
4±
370
7961
±93
911
011
±13
9810
944
±88
010
924
±67
715
7±
39–
CO
2 pe
ak (
vol%
)2.
46±
0.07
2.29
±0.
291.
50±
0.10
1.20
±0.
101.
1±
0.1
0.08
4±
0.00
20.
056
±0.
007
Tot
al C
O2
(vol
% s
)30
4.8
±4.
119
5.3
±15
.019
4.8
±7.
117
0.9
±4.
317
7.9
±6.
25.
85±
0.21
3.85
±0.
39V
SP
pea
k (1
03 m
3 s
−1)
4.4
±0.
42.
5±
0.1
3.0
±0.
22.
7±
0.5
2.6
±0.
40.
50±
0.03
0.28
±0.
03T
otal
VS
P e
mis
sion
(m
3 )0.
228
±0.
017
0.13
4±
0.01
30.
312
±0.
034
0.30
4±
0.01
30.
441
±0.
470.
022
±0.
001
0.01
4±
0.00
2R
esid
ual
wei
ght
(%)
1.0
±0.
21.
9±
0.2
4.0
±0.
34.
2±
0.2
3.7
±0.
31.
4±
0.2
2.4
±0.
3C
olum
n nu
mbe
ra
bc
de
fg

287A Scale-up Study
to very good flame retardant properties. In comparison to PA-6, the ignitiontime is increased by ≈ 30 s. RHR, CO, CO2 and VSP peaks are decreased(41, 68, 51 and 39 respectively) as well as total CO2 and CO quantities (44 and25%). The combustion is delayed for 50 s and slowed and the corresponding RWis 4%.
From this study, it seems that results obtained in the S-reactor are in goodagreement with those obtained with the L-reactor, but a comparison is difficultas the sample thickness was different. Thus, the film thickness influence on CCmeasurements was firstly studied. Results obtained for c.n-PA-6 (N-samples) inthe L-reactor with a 10 mm thick film are compared with the 1.5 mm thick one(Table 6, b and c, d and e columns). It appears that the CC results are improvedwhen the coating thickness increases : IT increases (12%) and the RHR peakdecreases (14%) as well as THE (5%). Then, the influence of the sample size wasstudied from a comparison of results obtained with S- and N-n-PA-6 samples,either virgin or coated with a 10 mm thick coating elaborated in the L-reactor.Except for VSP results, evolutions of CC parameters are similar for the two setsof samples, but the effect is stronger for S-samples (Table 6, c and e, f and gcolumns).
To determine the nature of the layer formed during the combustion, residueswere collected before ignition (≈ 105 s), after ignition (≈ 114 s), at RHR peak(≈ 204 s), and at the end of the cone calorimeter measurements (≈ 400 s)performed with c.n-PA-6 sample, and analyzed by FTIR. Figure 5 shows thatthe formed layer is mainly silica-like.
20.4 ConclusionsThis study aimed to improve the fire retardant properties of PA-6 and to vali-date the process by performing fire tests in standard conditions. The techniqueused involves both incorporation of clay nano-composite (2 wt%) in the PA-6
Figure 4 Evolution of the residual weight during the combustion of virgin and coated (inthe L-reactor) PA-6 and n-PA-6
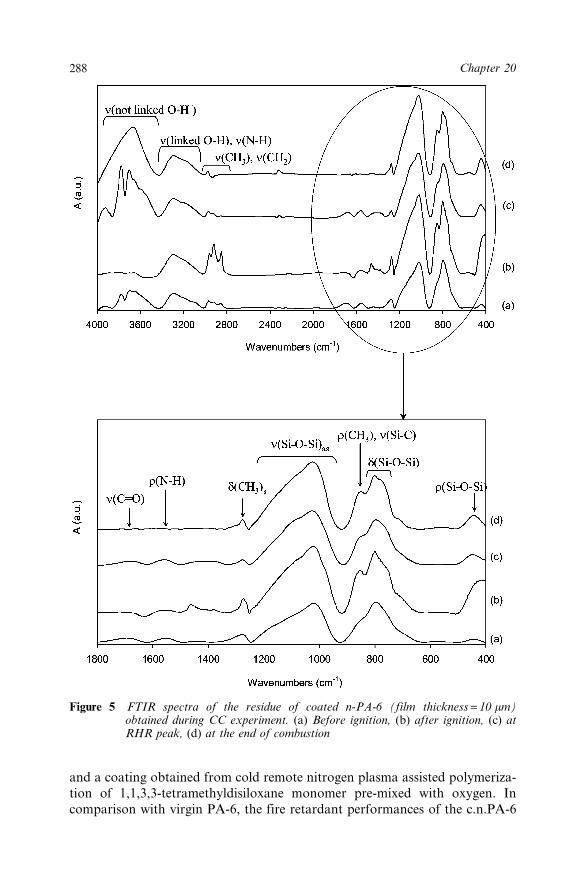
288 Chapter 20
and a coating obtained from cold remote nitrogen plasma assisted polymeriza-tion of 1,1,3,3-tetramethyldisiloxane monomer pre-mixed with oxygen. Incomparison with virgin PA-6, the fire retardant performances of the c.n.PA-6
Figure 5 FTIR spectra of the residue of coated n-PA-6 (film thickness = 10 mm)obtained during CC experiment. (a) Before ignition, (b) after ignition, (c) atRHR peak, (d) at the end of combustion
289A Scale-up Study
performed in standard conditions are characterized by an increase of LOI(130%) and a decrease of both the RHR peak (41%) and the THE (33%). Duringcombustion, the nanocomposite structure of the polymer leads to the formationof a surface protective layer, the action of which is reinforced by the coating.This carbonaceous and silica-like layer acts as a barrier, limiting mass and heattransfers between the flame and the polymer and slows down toxic gases emis-sion produced by polymer combustion. The advantage of our process, incomparison with other techniques used for PA-6, is a resulting simultaneousimprovement of the three main parameters (LOI, RHR, THE). For comparisonwith literature, some other processes results can be considered. The incorpora-tion of ethylene acetate vinyl (EVA 10.3%) and ammonium polyphosphate(APP 28%) to PA-620 leads to an increase of LOI (39%) and to a decrease ofRHR peak (55%), but the THE is not modified. A coating obtained from plasmaassisted polymerization of hexamethyldisiloxane23 leads to a decrease of RHRpeak (30%), but the THE is not modified. LOI tests were not performed.
The influence of sample size on cone calorimeter studies performed on virginand coated n-PA-6 shows that the use of small samples instead of standard sizeones leads to a correct prediction of the evolution of cone calorimeter para-meters, but with an enhanced effect. The coating efficiency increases withits thickness. The use of two set-ups also shows that the radial homogeneity ofthe thickness film is preserved when the reactor size increases, but the growthrate is decreased, leading to a smoother structure. The chemical nature of thedeposited film, mainly polysiloxane-like, and its specific density (≈ 1.9 mg/cm3)are similar whatever the reactor size.
From this work24 it may be concluded that a polysiloxane-like coating depos-ited on n-PA-6 is an efficient way to improve PA-6 fire retardancy. However, themechanism occurring between the nanocomposite and the coating has to bespecified.
20.5 AcknowledgmentsThe authors thank C. Boyaval from the Institut d’Electronique et deMicroélectronique du Nord (Villeneuve d’Ascq, France) for his technicalassistance in Scanning Electron Microscopy.
20.6 References1. M. Lewin, in Fire Retardancy of Polymers – The Use of Intumescence,
M. Le Bras, G. Camino, S. Bourbigot and R. Delobel (eds.), The RoyalSociety of Chemistry, Cambridge, U.K., 1998, p. 3.
2. L.W.D. Weber and H. Greim, J. Toxicol Environ. Health, 1997, 50(3),195–215.
3. G. Camino, M.P. Luda, and L. Costa, In Chemical Industry andEnvironment, Volume. I, General Analysis-Risk Analysis, J. Casal (eds.),1993, p. 221.
4. S.Y. Lu and I. Hamerton, Prog. Polym. Sci., 2002, 27(8), 1661–1712.

290 Chapter 20
5. A.I. Balabanovich, G.F. Levchik, S.V. Levchik and W. Schnabel, FireMater., 2001, 25, 179–184.
6. T. Jana, B.C. Roy and S. Maiti, Polym. Degrad. Stab., 2000, 69, 79–82.7. G. Camino, S.M. Lomakin and M. Lazzari, Polymer, 2001, 42(6),
2395–2402.8. C. Jama, A. Quédé, P. Goudmand, O. Dessaux, M. Le Bras, R. Delobel,
S. Bourbigot, J.W. Gilman and T. Kashiwagi, in Fire and Polymers,Materials and Solutions for Hazard Prevention, G.L. Nelson and C.A.Wilkie (eds.), American Chemical Society Publication, ACS SymposiumSeries 797, Washington, DC, 2001, Chapter 16, p. 200.
9. C. Jama, A. Quédé, H. Sadiki, O. Dessaux, P. Goudmand, R. Delobel andM. Le Bras, in Recent Advances in Flame Retardancy of PolymericMaterials, M. Lewin (ed.), Business Communications Co. Inc., Norwalk,USA, 2001, Volume 12, p. 127.
10. A. Quédé, C. Jama, P. Supiot, M. Le Bras, R. Delobel, O. Dessaux andP. Goudmand, Surf. Coat. Technol., 2002, 151–152, 424–428.
11. P. Supiot, F. Callebert, O. Dessaux and P. Goudmand, Plasma Chem.Plasma Proc., 1993, 13, 539–554.
12. F. Callebert, P. Supiot, P. Goudmand and O. Dessaux, 11th InternationalSymposium on Plasma Chemistry, D.E. Harry (ed.), LoughboroughUniversity Pub., UK, 1993, p. 1493.
13. “Standard test method for measuring the minimum oxygen concentrationto support candle-like combustion of plastics (Oxygen Index)”, ASTM D2863/77, Philadelphia, 1977.
14. “Standard test method for heat and visible smoke release for materials andproducts using an oxygen depletion calorimeter”, ASTM E 1354–90a,Philadelphia, 1990.
15. L.L. Tedder, G. Lu and J.E. Crowel, J. Appl. Phys., 1991, 69, 7073.16. D.R. Anderson (ed.), in Analysis of silicones, chapter 10: Infrared, Raman
and Ultraviolet spectroscopy. eds. Wiley John and Sons, New- York, 1974.247.
17. C. Rau and W. Kulisch, Thin Solid Films, 1997, 249, 28.18. F. Callebert, P. Supiot, K. Asfardjani, O. Dessaux, P. Goudmand,
P. Dhamelincourt and J. Laureyns, J. Appl. Polym. Sci., 1994, 52,1595–1606.
19. P.G. Pai, S.S. Chao, Y. Takagi, G. Lucovsky, J. Vac. Sci. Technol., 1986,A4, 689.
20. C. Siat, Thesis n° 2000ART00403, Lens, France, 2000.21. J.W. Gilman, Appl. Clay Sci., 1999, 15, 31–49.22. J.W. Gilman, C.L. Jackson, A.B. Morgan, R. Harris, E. Manias,
E.P. Giannelis, M. Wuthernow, D. Hilton and S.H. Philips, Chem. Mater.,2000, 12, 1866–1873.
23. B. Schartel, G. Kühn, R. Mix, J. Friedrich, Macromol. Mater. Eng., 2002,287, 579–582.
24. A. Quédé, Thesis n°3301, Lille, France 2003.

291
CHAPTER 21
Fire Retardant Polypropylene /Flax Blends: Use of HydroxidesMAGALI FOIS,1 MICHEL GRISEL,1 MICHEL LE BRAS,2
SOPHIE DUQUESNE2 AND FRANCK POUTCH3
1URCOM, EA 3221, Université du Havre, 25 rue P. Lebon, BP 540, F-76058Le Havre,France.([email protected])2PERF, ENSCLille/USTL, UPRES EA 1040, BP108, F-59652 Villeneuved’Ascq Cedex, France3CREPIM, Bruay-la-Bussière, France
21.1 IntroductionOver the last few years, several studies have investigated the exploitationof cellulosic fibres as load bearing constituents in composite materials thatare easily moulded for automotive applications. The use of these materialsin composites has increased due to their unlimited availability, their relativecheapness compared to conventional materials such as glass and aramid fibers,their low abrasion, their multi-functionality, their ability to recycle, and becausethey compete well in terms of strength per weight of material.1 Many varietiesof plant fibres exist, such as “hairs” (cotton, kapok), fibre-sheafs of dicoltylicplants or vessel-sheafs of monocotylic plants (flax, hemp, jute and ramie), andhard fibres (sisal, henequen and coir).2
The flax plant (Linum usitatissimum) is a member of the family Linaceae thatis important for the production of low-density fibre. The seed of the flax plant isknown as linseed, and from it are obtained the linseed oil for commerce, alkydresins for paints, printing inks and some varnishes. Different varieties of theplant, which are mainly grown in The Netherlands, Belgium and France forlinseed and for fibres, are well known (reference 3 and references therein). In thisstudy plant grown for fibre in Normandy (France) was used, the weight ratio ofcellulose in flax being about 71%.
Plant derivatives have been previously investigated as flame-retardantsadditives (FR) for isotactic polypropylene (PP). To this end they can be usedalone (lignin,4 flax fibres in 12.5 and a 40 wt% amounts5,6) as char formers

292 Chapter 21
or in synergy with conventional FR additives [lignin in association with trigly-cidylisocyanurate, monoammonium phosphate and melamine,7,8 flax fibres(fibber in this text) in association with ammonium polyphosphate (APP) orexpandable graphite8]. These previous results seem quite successful and leadone to assume that ecological friendly fire retardancy is a technologicalbreakthrough for PP/flax composites.9 Moreover, in a recent paper, we showedthat flax fibres act as synergist agent in a conventional PP-based intumescentformulation.6
Hornsby and Rothon discussed the economic importance of mineral fire retar-dants fillers such as aluminium and/or magnesium hydroxides in Chapter 2. It isnow known that efficiency of these additives is related to multiple activities:
• Dilution of the polymer in the condensed phase;• decrease of the amount of available fuel, thus increasing the amount of
thermal energy needed to raise the temperature of the composition to thepyrolysis level, due to the high heat capacity of the fillers;
• increase of the enthalpy of decomposition• emission of water vapour, involving a dilution of gaseous phase by water
vapour• decrease of amount of fuel and oxygen in the flame;• possible endothermic interactions between the water and decomposition
products in the flame (reactions (1) and (2)):
2Al(OH)3 → Al2O3 + 3H2O DH = 298 kJ mol−1 (1)Mg(OH)2 → MgO + H2O DH = 380 kJ mol−1 (2)
• a decrease of feedback energy to the pyrolysing polymer;• finally, an insulative effect of the oxides remaining in the char and the
eventual charring of the materials.10–16
The use of these flame-retardants acting through physical effects requirerelatively large amounts of additives: 50–65 wt% in the case of aluminiumhydroxide [ATH; Al(OH)3] or magnesium hydroxide [MH; Mg(OH)2]. If inthese composites the impact and tensile strengths are reduced, their stiffness canbe improved (increase of the flexural modulus from 700–1500 up to 2000–5000MPa for, respectively, standard PP grades to mineral filled systems17). Stiffnessof PP/flax composites is high too (flexural modulus close to 3500 MPa with a 30wt% fibres level) and addition of natural flax fibres to a standard PP increasesthe tensile strength from ca. 700 to ca. 1500 MPa.18 So, it may be presumedthat PP/flax/hydroxide composites show high stiffness with preserved tensileperformances and then may be suitable polymeric material for transportation.
The present chapter presents preliminary results concerning fire, thermal andmechanical performances of typical PP/flax fibres/ATH and PP/flax fibres/MHcomposites. The discussion will be carried out considering oxygen consumptioncalorimetry (cone calorimeter), thermogravimetry and conventional tensile andflexural tests.
293Fire Retardant Polypropylene /Flax Blends
21.2 Experimental21.2.1 Materials
Raw materials were PP [Finapro grade, as pellets supplied by Fina (France);MFI: 12 g (10 min)−1 (230°C/2.16 kg)]; ATH and MH were commercial gradeadditives (supplied, respectively, by Alcan and Dead Sea Bromine).
Flax “Fibres” are short (mean length about 20 mm), non-textile residue fromflax tow obtained from natural tangling after harvesting and natural weatheringretting [Fibber, technilin grade supplied by La Centrale Linière Cauchoise(France), generally used in paper or composites manufacturing].
Polymer and additives mixtures (Table 1) were mixed in a Brabender Labora-tory Mixer with roller blades monitored by a Brabender Plasticorder PL 3200data processing torque rheometer system operating at 180°C and 20 rpm. Thepolymer was first introduced in the heating chamber and, after 3 min, the addi-tives were introduced into the chamber and mixed for 6 min, the total mixingtime being 9 min. The obtained mixture was then pressed in a Daragon press at185°C and 70 bar on a 10 × 10 cm2 plateau to obtain 3 mm thick sheets, fromwhich all tested specimens were produced.
21.2.2 Fire Testings
Samples (100 × 100 × 3 mm3) were exposed, in a Stanton Redcroft Cone Calo-rimeter, to a heat flux of 50 kW m−2. This external flux has been chosen becauseit corresponds to the heat evolved during a well-developed fire.19 Three testswere carried out on each material. Mean values were extracted from these teststo limit measurements uncertainties.
UL-94 testing was carried out on 127 × 12.7 × 3 mm3 sheets according toUL-94 testing.20
21.2.3 Thermogravimetric Analyses
TG analyses were performed using a Setaram Setsys 12 thermo balance at a5°C min−1 heating rate from 25 to 800°C under airflow. Samples (about 20 mg)were placed in a platinum pan. The precision of temperature measurements was±1.5°C.
Table 1 Composite composition
PP (wt%) Fibber (wt%) Additives (wt%)
PP 100PP/Fibre 60 40PP/Fibre/ATH 40 26.5 33.5PP/Fibre/MH 40 26.5 33.5
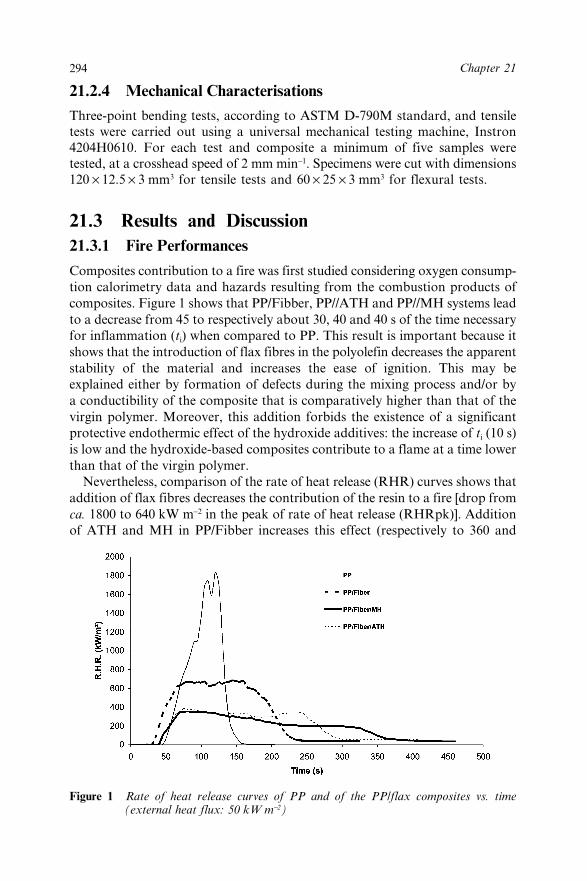
294 Chapter 21
21.2.4 Mechanical Characterisations
Three-point bending tests, according to ASTM D-790M standard, and tensiletests were carried out using a universal mechanical testing machine, Instron4204H0610. For each test and composite a minimum of five samples weretested, at a crosshead speed of 2 mm min−1. Specimens were cut with dimensions120 × 12.5 × 3 mm3 for tensile tests and 60 × 25 × 3 mm3 for flexural tests.
21.3 Results and Discussion21.3.1 Fire Performances
Composites contribution to a fire was first studied considering oxygen consump-tion calorimetry data and hazards resulting from the combustion products ofcomposites. Figure 1 shows that PP/Fibber, PP//ATH and PP//MH systems leadto a decrease from 45 to respectively about 30, 40 and 40 s of the time necessaryfor inflammation (ti) when compared to PP. This result is important because itshows that the introduction of flax fibres in the polyolefin decreases the apparentstability of the material and increases the ease of ignition. This may beexplained either by formation of defects during the mixing process and/or bya conductibility of the composite that is comparatively higher than that of thevirgin polymer. Moreover, this addition forbids the existence of a significantprotective endothermic effect of the hydroxide additives: the increase of ti (10 s)is low and the hydroxide-based composites contribute to a flame at a time lowerthan that of the virgin polymer.
Nevertheless, comparison of the rate of heat release (RHR) curves shows thataddition of flax fibres decreases the contribution of the resin to a fire [drop fromca. 1800 to 640 kW m−2 in the peak of rate of heat release (RHRpk)]. Additionof ATH and MH in PP/Fibber increases this effect (respectively to 360 and
Figure 1 Rate of heat release curves of PP and of the PP/flax composites vs. time(external heat flux: 50 kW m−2)

295Fire Retardant Polypropylene /Flax Blends
365 kW m−2 RHRpk values). The decrease of the RHR peak values may beexplained by the formation of a protective coating, which may restrict the diffu-sion of heat to the underlying resin and/or the diffusion of fuels (products of thedegradation of the polymer) to the flame.
TG curves under 50 kW m−2 irradiance (Figure 2) show that addition offlax fibber leads to a decrease of weight loss versus time after a 40 wt% loss.Optical observations (Figure 3a) show a protective surface charring of the mate-rial that decreases the weight loss rate. After flame extinguishing (i.e. 200 s)the residue weight, lower than 5 wt%, corresponds to the formation of a lightash-like material (Figure 3b).
The behaviours of PP//ATH and PP//MH are quite similar: at ca. 70 s,charred ceramics form. Both are thermally stable at, respectively, around 250and 325 s. It appears that the oxides resulting from the degradation of the
Figure 2 Weight loss curves of PP and of the PP/flax composites vs. time (external heatflux: 50 kW m−2)
Figure 3 Optical observation of the PP/Fibber after a 40 wt% 100 s; (a) and a 97 wt%loss 300 s, (b) under an external heat flux: 50 kW m−2
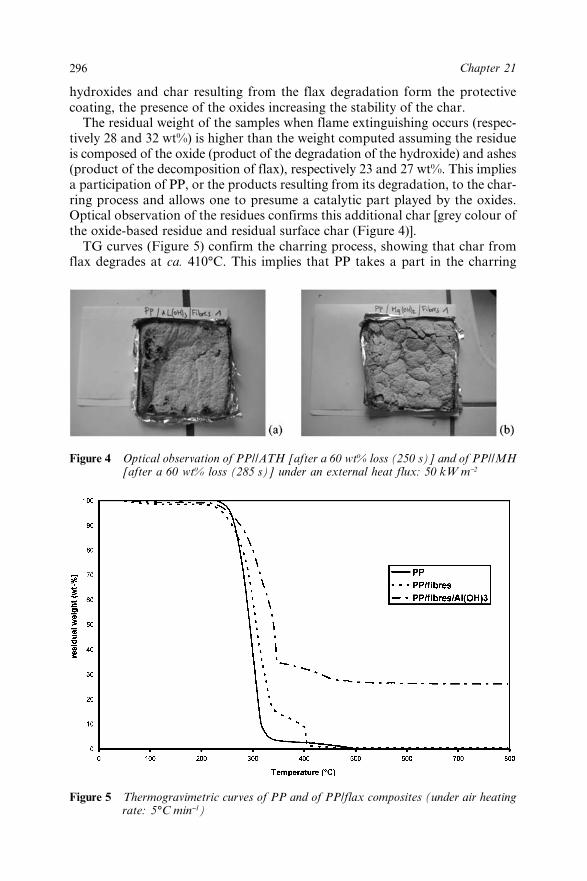
296 Chapter 21
hydroxides and char resulting from the flax degradation form the protectivecoating, the presence of the oxides increasing the stability of the char.
The residual weight of the samples when flame extinguishing occurs (respec-tively 28 and 32 wt%) is higher than the weight computed assuming the residueis composed of the oxide (product of the degradation of the hydroxide) and ashes(product of the decomposition of flax), respectively 23 and 27 wt%. This impliesa participation of PP, or the products resulting from its degradation, to the char-ring process and allows one to presume a catalytic part played by the oxides.Optical observation of the residues confirms this additional char [grey colour ofthe oxide-based residue and residual surface char (Figure 4)].
TG curves (Figure 5) confirm the charring process, showing that char fromflax degrades at ca. 410°C. This implies that PP takes a part in the charring
Figure 4 Optical observation of PP//ATH [after a 60 wt% loss (250 s)] and of PP//MH[after a 60 wt% loss (285 s)] under an external heat flux: 50 kW m−2
Figure 5 Thermogravimetric curves of PP and of PP/flax composites (under air heatingrate: 5°C min−1)

297Fire Retardant Polypropylene /Flax Blends
process of PP/Fibber and that the resulting char is comparatively thermallystable. Moreover, the residual weight of PP//ATH at 800°C (28 wt% including18 wt% of Al2O3) confirms the formation of a comparatively stable char duringthe thermo-oxidative degradation of the composite.
The total heat release curves (Figure 6) show that this char degrades slowlyafter the flame extinguishing. It may take a part in post glowing and carbonoxides evolving during this step. Nevertheless, Table 2 shows that additionof flax to PP leads to an appreciable decrease of the amounts of CO andCO2 evolved and that addition of hydroxides plays only an additional part inreducing the CO evolution.
Figures 7 and 8 show the precise effect of each filler. Addition of flax leads toa decrease of the CO and CO2 evolution peaks that are related to the correspond-ing decrease of the RHRpk values, explained by the formation of the charredsurface coating. An eventual additional catalytic effect from ATH and MHmay be presumed, which should increase the selectivity for the formation ofpolyaromatic species in the condensed phase to the detriment of CO formation.
No classification in class 94 V using the vertical flame test method is observedwith the composite materials. This is explained by the fall of burning surface
Table 2 Total carbon oxides evolution (external heat flux: 50 kW m−2)
PP PP/Fiber PP/Fiber/ATH PP/Fiber/MH
CO (g) 0.011 0.007 0.007 0.006CO2 (g) 0.48 0.40 0.33 0.33
Figure 6 Total heat release curves of PP and of PP/flax composites vs. time (externalheat flux: 50 kW m−2)
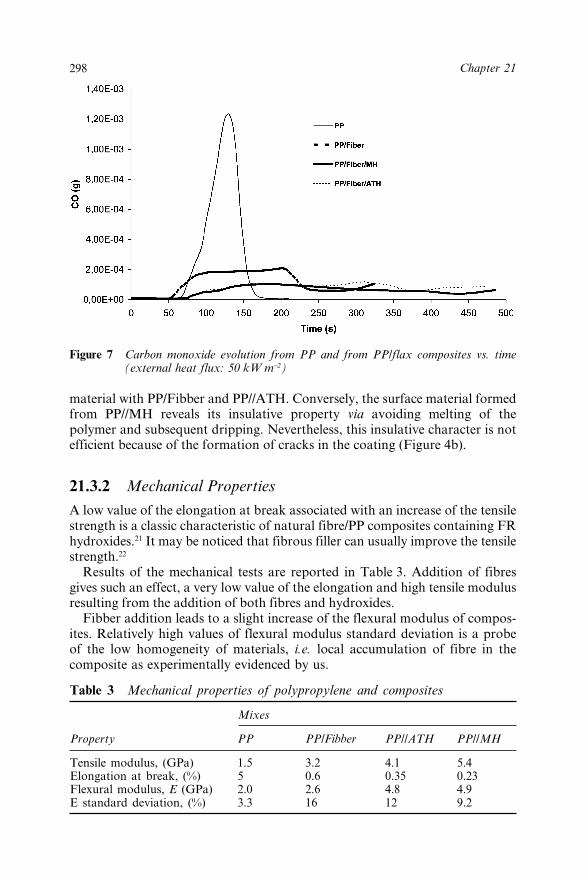
298 Chapter 21
material with PP/Fibber and PP//ATH. Conversely, the surface material formedfrom PP//MH reveals its insulative property via avoiding melting of thepolymer and subsequent dripping. Nevertheless, this insulative character is notefficient because of the formation of cracks in the coating (Figure 4b).
21.3.2 Mechanical Properties
A low value of the elongation at break associated with an increase of the tensilestrength is a classic characteristic of natural fibre/PP composites containing FRhydroxides.21 It may be noticed that fibrous filler can usually improve the tensilestrength.22
Results of the mechanical tests are reported in Table 3. Addition of fibresgives such an effect, a very low value of the elongation and high tensile modulusresulting from the addition of both fibres and hydroxides.
Fibber addition leads to a slight increase of the flexural modulus of compos-ites. Relatively high values of flexural modulus standard deviation is a probeof the low homogeneity of materials, i.e. local accumulation of fibre in thecomposite as experimentally evidenced by us.
Figure 7 Carbon monoxide evolution from PP and from PP/flax composites vs. time(external heat flux: 50 kW m−2)
Table 3 Mechanical properties of polypropylene and composites
Mixes
Property PP PP/Fibber PP//ATH PP//MH
Tensile modulus, (GPa) 1.5 3.2 4.1 5.4Elongation at break, (%) 5 0.6 0.35 0.23Flexural modulus, E (GPa) 2.0 2.6 4.8 4.9E standard deviation, (%) 3.3 16 12 9.2

299Fire Retardant Polypropylene /Flax Blends
Addition of hydroxides in the PP/Flax composite increases significantlythe flexural modulus and decreases its standard deviation. So, a best dispersionof the fillers may be presumed, which may decrease the number of stress-concentration points through the composites.
Mechanical properties of these materials are significantly influenced bythe interfacial interactions, which depend on the size of the interface and thestrength of the interaction.23 As a consequence, optimized mechanical propertiesshould be obtained via the optimization of particle sizes18 the use of couplingagents24 or chemical treatments (such as maleic anhydride or vinyl trimethoxy-silane treatments,18 which may affect the hydrophilic nature the fibres25) of thenatural filler.
21.4 ConclusionThe effects of hydroxides flame retardant fillers on the flammability andmechanical properties of flax-filled polypropylene composites were compared.33.5 wt% of aluminum or magnesium hydroxide can effectively reduce theflammability of the composites. Moreover, these hydroxides have been provedto be reinforcing fillers for polypropylene on the basis of increases in the tensileand flexural strength.
21.5 References1. D. Robson, J. Hague, G. Newman, G Jeronomidis and M. Ansell, in Survey
of Natural Materials for Use in Structural Composites as Reinforcement and
Figure 8 Carbon dioxide evolution from PP and from the PP/flax composites vs. time(External heat flux: 50 kW m−2)

300 Chapter 21
Matrices, D. Robson et al. (eds.), Woodland Pub. Ltd., Abingdon, UK,1996.
2. S.J. Eichhorn, C.A. Baillie, N. Zafeiropoulos, L.Y. Mwaicambo,M.P. Ansell, A. Dufresne, K.M. Entwistle, P.J. Herrada-Franco,G.C. Escamilla, L. Groom, M. Hughes, C. Hill, T.G. Rials andP.M. Wild, J. Mater. Sci., 2001, 36, 2107–2131.
3. J.E.G. Van Dam, G.E.T. Van Vilsteren, F.H.A. Zomers, W.B. Shannon andI.T. Hamilton, in Increased Application of Domestically Produced Plantfibres in Textiles, Pulp, and Paper Production, and Composite Materials,European Commission Directorate-General XII, Sci. Res. Development,EUR 16101, EN 1994, 58–78.
4. A. De Chirico, M. Armanini, P. Chini, G. Cioccolo, F. Provasoli andG. Audisio, Polym. Degrad. Stab., 2003, 79, 139–145.
5. M. Helwig and D. Paukszta, Mol. Cryst. Liq. Cryst., 2000, 354, 961–968.6. M. Le Bras, S. Duquesne, M. Fois, M. Grisel and F. Poutch, Polym.
Degrad. Stab., 2005, in press.7. G. Audisio, A. De Chirico, B. Focher and G. Gallina, in Fourth European
Workshop on Lignocellulosics and Pulp, Extended Abstracts, Stresa (Italy),8–11 September 1996, p. 528.
8. G. Gallina, E. Bravin, C. Badalucco, G. Audisio, M. Armanini, A. DeChirico and F. Provasoli, Fire Mater., 1998, 22, 15–18.
9. B. Schartel, U. Braun, U. Schwarz, S. Reinemann, Polymer, 2003, 44,6241–6250.
10. P. R. Hornsby, Fire Mater., 1994, 18, 269.11. P. R. Hornsby and C. L. Watson, Polym. Degrad. Stab., 1990, 30, 73.12. F. Molesky, in Recent Advances in Flame Retardancy of Polymeric Materi-
als, Volume 1, M. Lewin and G. Kirshenbaum (eds.), BCC Inc. Pub.,Norwalk, USA, 1990, p. 92.
13. J. Levesque, in reference 12, p. 102.14. O. Kalisky, R. J. Mureinik, A. Weismann and E. Reznik, in Recent
Advances in Flame Retardancy of Polymeric Materials, Volume 4,M. Lewin and G. Kirshenbaum (eds.), BCC Inc. Pub., Norwalk, USA,1993, p. 140.
15. S. Bourbigot, M. LeBras, R. Leeuwendal, K.K. Shen and D. Schubert,Polym. Degrad. Stab., 1999, 64, 419–425.
16. S. Bourbigot and M. Le Bras, in “Flame retardant plastics (Chapter 5)”Plastics Flammability Handbook – Principles, Regulations, Testing, andApproval, J. Troitzsch (eds.), Hanser Pub., Munich, 2004, pp. 145–148.
17. K. Bernreitner and H. Hammerschmid, in Polypropylene: An A-ZReference, J. Karger-Kocsis (ed.), Kluwer Publishers, Dordrecht, 1999,pp. 148–158.
18. G. Cantero, A. Arbelaiz, R. Llano-Ponte and I. Mondragon, Comput Sci.Technol., 2003, 63, 1247–1254.
19. V. Babraukas, Fire Mater., 1984, 8(2), 81.20. “Tests for flammability of plastics materials for part devices and appli-
ances”, Underwriters Laboratories, Northbrook, ANSI//ASTM D-635/77(1977).

301Fire Retardant Polypropylene /Flax Blends
21. M. Sain, S.H. Park, F. Suhara and S. Law, Polym. Degrad. Stab., 2004,83, 363–367.
22. Y.W. Leong, M.B. Abu Bakar, Z.A.M. Ishak and B. Pukansky, J. Appl.Polym. Sci., 2004, 91, 3315–3326.
23. M. Bugjany, M. Fois and M. Grisel, unpublished results (Privatecommunication, 2003).
24. Z. Demjen, B. Pukansky and J. Nagy, J. Compos. A, 1998, 29, 323.25. Y.S Thio, A.S. Argon, R.E. Cohen and M. Weinberg, Polymer, 2002, 43,
3661.26. B.V. Kokta, R.G. Raj and C.Daneault, Polym.-Plast. Technol. Eng.,
1989, 28, 247–259.

302
CHAPTER 22
Intumescence in Ethylene-vinylAcetate Copolymer Filled withMagnesium Hydroxide andOrganoclaysLAURENT FERRY, PIERRE GAUDON, ERIC LEROYAND JOSÉ-MARIE LOPEZ CUESTA
Ecole des Mines d’Alès, Centre des Matériaux de Grande Diffusion, 6, avenuede Clavières 30319 Alès Cedex, France ([email protected])
22.1 IntroductionEthylene vinyl acetate (EVA) copolymers are commonly used in the cable indus-try due to their flexibility and processing characteristics. In these applications,fire retardancy (FR) can be achieved using hydrated mineral fillers such asalumina trihydrate (ATH) or magnesium hydroxide (MH). However, high fillercontents are required to obtain satisfying fire properties.1,2 This high mineralloading decreases the mechanical performance of the materials. Therefore, toobtain a set of competitive properties, it becomes interesting to enhance the effi-ciency of the hydrated minerals by partially substituting them with synergisticadditives, allowing a reduction of the global filler content.
During the last decade, several works have shown that the fire behaviour ofEVA can be improved by associating hydrated fillers with other mineral fillers.Beside the classical endothermic and dilution effects of hydrated fillers, authorshave tried to develop other interesting effects such as the constitution of protec-tive layers or the promotion of charring. Shen3 highlighted a synergism betweenATH and zinc borate for a total filler loading higher than 70%. He obtained alimiting oxygen index (LOI) higher than 50%. Bourbigot et al. underlined thatsynergism can also exist between MH and zinc borate. This association leads toan increase in LOI, zinc borate promoting a protective vitreous layer duringcombustion.4 To enhance the efficiency of MH, Cross et al. found that zincstannate or zinc hydroxystannate can be applied as a coating on the filler
303Intumescence In Ethylene-vinyl Acetate Copolymer Filled
surface.5 This treatment permits a decrease of the effective particle size inthe matrix, leading to an improvement of fire properties as well as mechanicalproperties.
In a previous paper, we mentioned that a synergism can also be observedwhen EVA is flame retarded by MH combined with talc.6 Due to its lamellarstructure, talc plays a positive role in the constitution of a mineral barrier. Morerecently, great interest has been found in the use of nanofillers. Camino et al.used fluorohectorite and montmorillonite as FR in EVA.7 They showed that thesilicates accelerate deacetylation of the polymer but slow down the thermaldegradation of the deacetylated polymer due to the formation of a barrier atthe surface of the materials. Beyer reported that modified nanoclays combinedwith ATH allow an improvement of the fire behaviour by charring effect.8 Charformation reduces the amount of fuel available for combustion and, therefore,the amount of heat released. Apart from nanoclays, char promotion can also beachieved by other mineral fillers exhibiting a high specific surface area. Severalpapers of Gilman and Kashiwagi highlighted that silica or silica gel promoteschar, which reduces the peak of heat release rate.9,10
In the present chapter, EVA has been flame retarded using MH in associationwith montmorillonite and silica or talc. The strategy consists in combining theeffects of water release, barrier formation and char promotion of these differentfillers.
22.2. Experimental22.2.1 Materials
The EVA used was thermoplastic-elastomeric grade ELVAX® 260 (Du Pont),with a melt flow index of 6 g (10 min)−1 and a vinyl acetate content of 28 wt%.The organoclay used in EVA was Cloisite 15A (Southern Clays), which isa natural montmorillonite (MMT) modified with dimethyldihydrogenatedtallow ammonium salt. A non-modified MMT, Cloisite Na+, was also used, asa reference, for structural characterisation. The magnesium hydroxide (MH)was Magnifin® H10 (median particle size: d50 = 0.85 µm and BET surface area:SBET = 10 m2 g−1) provided by Martinswerk. The silica was an amorphous preci-pitated silica Tixosil® 73 (d50 = 6 µm, SBET = 79 m2 g−1) provided by Rhodia. Thetalc was a non-commercial product (d50 = 0.5 µm, SBET = 34 m2 g−1). Concerningthese two high specific surface area fillers, one has to keep in mind that silicais composed of micronic particles that are nanoporous and talc consists ofsubmicronic platelets.
22.2.2 Processing
Processing was performed by mixing the fillers with the molten EVA pellets in aHaake internal mixer at 170°C at 60 rpm for 10 min. Sheets of 4 mm thicknesswere then compression moulded at 140°C under a pressure of 100 bar for 5 min.

304 Chapter 22
These were cut to the requisite size, depending on the experiment to beperformed. In all cases, the total filler content was 60 wt%, but the variousrelative proportions of organoclay, talc and silica were varied (see Table 1below for the various formulations studied).
22.2.3 Experimental Techniques
X-ray diffraction (XRD) analysis was performed using a Philips PW 1710diffractometer with a monochromatized Cu Ka radiation (l = 0.154 nm). Thescattering angle (2h) domain studied ranged from 3° to 63°, with a rotationstep scanning of 0.05° with a count time of 1.2 s. For the pure MMT (referenceMMT Cloisite Na+ and Cloisite 15A) measurements were carried out on pow-ders, whereas for EVA composites, measurements were done on compressionmoulded sheets.
Thermo-oxidative degradation of the various polymer/filler materials wasstudied using standard techniques of thermogravimetric analysis (TGA) anddifferential thermal analysis (DTA), Setaram TGDTA92, at a temperaturescanning rate of 5°C min−1 from room temperature to 700°C under air flow. Atypical sample mass for those experiments was 30 mg.
“Epiradiateur test” (AFNOR NF P 92-505) was carried out on sheets(70 × 70 × 4 mm3) to determine the flammability and the self-extinguishabilityof the various formulations. In this test, a radiator (500 W) is placed at 30 mmover the upper face of a sheet of plastic. When the sample starts burning, thetime to (first) ignition (TTI) is noted. Afterwards, the radiator is removed andreplaced as soon as extinction occurs. Application of this device is repeated bysteps until successive extinctions for 5 min, the number of steps (N), the meaninflammation period (IP) are noted. For each filled composition, not less thanfour specimens were tested.
The limiting oxygen index (LOI) was been measured using a Stanton Redcroftinstrument on barrels (80 × 10 × 4 mm3) according to ISO 4589 specifications.
The cone calorimeter, manufactured by Fire Testing Technology (FTT),is a standard apparatus used for fire retardancy tests (ISO 5660), but abrief description follows. The polymer sample (100 × 100 × 4 mm3) is placedhorizontally on a balance and irradiated from above by a truncated conical
Table 1 Epiradiateur test characteristics and LOI values of the various formu-lations
Formulations TTI (s) IP (s) N LOI (vol%)
EVA 60 MH 116 9.0 15 49EVA-57MH-3MMT 123 8.6 42EVA-55MH-5MMT 133 7.0 19 39EVA-50MH-10MMT 139 7.8 17 34EVA-50MH-5MMT-5Si 122 7.4 18 38EVA-45MH-7.5MMT-7.5Si 117 7.1 14 35EVA-50MH-5MMT-5T 138 6.9 17 39

305Intumescence In Ethylene-vinyl Acetate Copolymer Filled
heater supplying a heat flux of 50 kW m−2. Combustion is initiated by sparkemission in the proximity of the upper sample surface. Smoke and gas emissionscan be monitored from an evacuation pipe connected to the cone apex. In thistechnique, measured data provide detailed information about sample ignition,heat release rate (HRR), smoke release rate (SRS) and weight loss. Amongother things, the following characteristic parameters may be obtained: time toignition, TTI (s): determined visually and taken to be the period required for theentire surface of the sample to burn with a sustained luminous flame, and peakof heat release rate, (Peak HRR) (kW m−2), taken as the peak value of the heatrelease rate vs. time curve, and considered to be the variable that best expressesthe maximum intensity of a fire, indicating the rate and extent of fire spread.
22.3 Results and DiscussionIn the following, the composition EVA-60MH has been considered as reference.The other FR systems consist of a partial substitution of MH by other mineralfillers, i.e. MMT, silica and talc.
22.3.1 Structural Characterization
Figure 1 shows a comparison between natural montmorillonite (Closite Na+)and organically modified montmorillonite XRD patterns. Natural montmoril-lonite exhibits a peak at 2h = 7.5°, corresponding to a 12 Å interlayer spacing.The curve of modified MMT shows two new peaks at 2h = 4.5 and 10°. Thesepeaks correspond to an interlayer spacing of 19 Å (with n = 1 and n = 2 inBragg’s law). Therefore, we can conclude that the chemical modification leads
Figure 1 XRD patterns, (D) natural montmorillonite, (b) Cloisite 15A (MMT), (—)EVA-55MH-5 MMT

306 Chapter 22
to an intercalated structure. However, the 12 Å peak is still observed, probablycaused by a certain amount of not-exchanged MMT. When modified MMT isintroduced in EVA in association with MH (EVA-55MH-5MMT), we noted thatthe XRD pattern remains quasi-unchanged in the small-angle region. Threepeaks are observed at 20, 13 and 10 Å, the latter being an harmonic of the firstpeak.
These results seems to indicate that processing with an internal mixer did notinduce exfoliation of a significative part of the phyllosilicate; nevertheless it ispossible that a partial exfoliation occurred. Some TEM observation should beperformed in the future to clarify this point.
22.3.2 Thermal Analysis
Figures 2 and 3 show, respectively, the mass loss and heat flow curves obtainedfor the different samples tested. The thermo-oxydative degradation mechanismof pure EVA copolymers has been described in literature11 and consists oftwo clearly identified steps: first a deacetylation reaction occurs (first mass lossbetween 300 and 400°C on Figure 2), with production of acetic acid (a non-combustible gas) and leading to acetylene-ethylene copolymers, with a signifi-cant amount of crosslinking.11 These chains are then degraded in a second step(second mass loss between 400 and 450°C on Figure 2), leading to a decrease ofmolecular masses and to the production of combustible gases and a smallamount of char that is finally degraded at higher temperatures [final massloss above 450°C on Figure 2]. Figure 3 shows that these two degradation stepsare accompanied by exothermic peaks, the second peak corresponding to theproduction of combustible gases, showing a shoulder around 480°C, which canbe partially attributed to char decomposition.
When EVA is filled with MH, the deacetylation reaction is shifted to highertemperatures (Figure 2) due to the endothermic decomposition of MH. Thesecond step of the decomposition is also modified. Effectively, Figure 3 clearly
Figure 2 Some representative TGA curves; (—) pure EVA, (—) EVA-60MH, (�)EVA-55MH-5MMT, (a) EVA-50MH-5MMT-5Si, (�) EVA-45MH-5MMT-5T
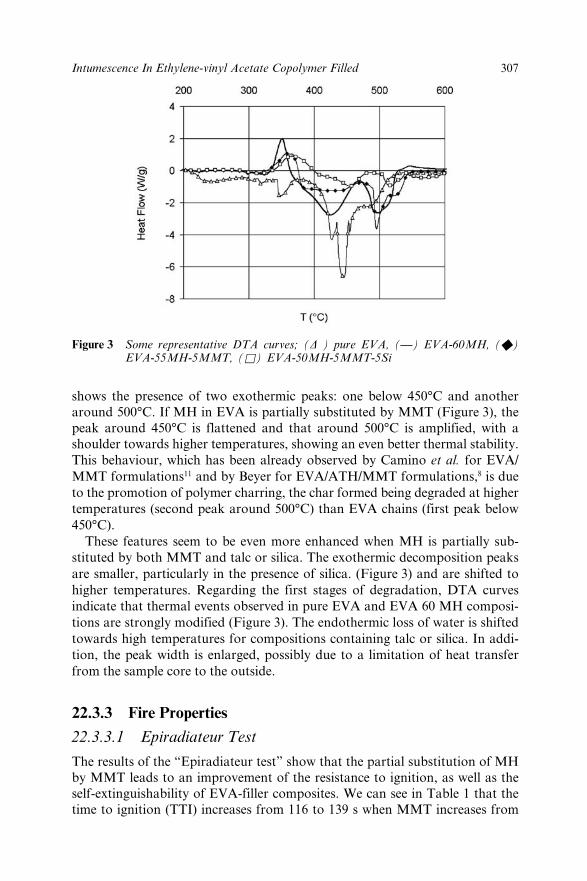
307Intumescence In Ethylene-vinyl Acetate Copolymer Filled
shows the presence of two exothermic peaks: one below 450°C and anotheraround 500°C. If MH in EVA is partially substituted by MMT (Figure 3), thepeak around 450°C is flattened and that around 500°C is amplified, with ashoulder towards higher temperatures, showing an even better thermal stability.This behaviour, which has been already observed by Camino et al. for EVA/MMT formulations11 and by Beyer for EVA/ATH/MMT formulations,8 is dueto the promotion of polymer charring, the char formed being degraded at highertemperatures (second peak around 500°C) than EVA chains (first peak below450°C).
These features seem to be even more enhanced when MH is partially sub-stituted by both MMT and talc or silica. The exothermic decomposition peaksare smaller, particularly in the presence of silica. (Figure 3) and are shifted tohigher temperatures. Regarding the first stages of degradation, DTA curvesindicate that thermal events observed in pure EVA and EVA 60 MH composi-tions are strongly modified (Figure 3). The endothermic loss of water is shiftedtowards high temperatures for compositions containing talc or silica. In addi-tion, the peak width is enlarged, possibly due to a limitation of heat transferfrom the sample core to the outside.
22.3.3 Fire Properties
22.3.3.1 Epiradiateur Test
The results of the “Epiradiateur test” show that the partial substitution of MHby MMT leads to an improvement of the resistance to ignition, as well as theself-extinguishability of EVA-filler composites. We can see in Table 1 that thetime to ignition (TTI) increases from 116 to 139 s when MMT increases from
Figure 3 Some representative DTA curves; (D ) pure EVA, (—) EVA-60MH, (�)EVA-55MH-5MMT, (a) EVA-50MH-5MMT-5Si

308 Chapter 22
0 to 10 wt%. Besides, we note that self-extinguishability seems to exhibit anoptimum for intermediary MMT content since the mean inflammation period(IP) is lower for 5 wt% of MMT than for 3 or 10%. This assumption is corrobo-rated by the number of inflammations (N) which shows the highest value for theEVA-55MH-5MMT composition.
When MH is partially substituted by both MMT and silica, we remarkedthat, on the one hand, the resistance to ignition is better than that of the referencesystem but lower than that of EVA-MH-MMT compositions; on the other hand,we can notice that the self-extinguishability remains almost the same, whereasthe number of inflammations tends to decrease. This result means that, in thepresence of silica, the material is hard to re-ignite. This can be correlated to thethermal analysis results, showing the formation of a more stable char for thiscomposition (second exothermal peak around 520°C on Figure 3).
When MH is partially substituted by both MMT and talc, we clearly see thatresistance to ignition as well as self-extinguishability are improved since time toignition is as high as 138 s whereas the mean inflammation period is as low as6.9 s. This FR system gives the best compromise between both flammability andauto-extinction properties.
22.3.3.2 LOI Test
Table 1 indicates that the presence of MMT strongly affects the LOI of filledEVA composites. LOI decreases from 49 to 34 when MMT content goes from 0to 10 wt%. No dripping was observed. The flame spreads very rapidly to thebottom of the sample, reaching the critical line located 50 mm below the top ofsample which stops the test. We have estimated the flame spread rate by measur-ing the burned length during LOI test. Figure 4 shows that the spread rate isinversely proportional to MMT content at a given oxygen index. One canobserve that the flame spread is slower for a lower oxygen index. For these
Figure 4 Flame spread rate as a function of oxygen index, (b) 10wt% MMT, (�) 5wt% MMT, (g) 3 wt% MMT

309Intumescence In Ethylene-vinyl Acetate Copolymer Filled
systems, we remarked that the limiting oxygen index corresponds to the oxygenindex where the flame spread rate becomes lower than ca. 6 mm min−1. At theend of the test, we observed that the samples are still cohesive. They are charredat the surface but remain undegraded in the bulk, showing that the flame spreadis only superficial. We assigned these observations to a wick effect induced bythe presence of MMT. Due to their lamellar structure, organoclays ensure ahigh connexity between mineral fillers, which is likely to promote heat (and thusflame) propagation.
Partial substitution of MH by both MMT and silica, on the one hand, andboth MMT and talc, on the other hand, leads to similar behaviours duringthe LOI test. The values obtained (Table 1) shows that this property seems tobe governed either by the MH content or by the MMT content, the former tend-ing to increase LOI, while the latter causing a decrease due to the wick effectpreviously mentioned.
22.3.3.3 Cone Calorimeter
The results of the cone calorimeter study are presented in Table 2, the mosttypical HRR vs. time curves being shown on Figure 5. Notably, the presence
Figure 5 Some representative HRR vs. time curves; (D) pure EVA, (—) EVA-60MH, (�)EVA-55MH-5MMT, (a)EVA-45MH-7.5MMT-7.5Si, (p)-EVA-45MH-5MMT-5T
Table 2 Results of cone calorimeter tests for the various formulations
Formulations TTI (s) HRR max (kW m−2)
EVA 35 657EVA-60MH 72 370EVA-57MH-3MMT 90 230EVA-55MH-5MMT 97 220EVA-50MH-10MMT 98 333EVA-50MH-5MMT-5Si 79 190EVA-45MH-7.5MMT-7.5Si 82 228EVA-50MH-5MMT-5T 8288 204

310 Chapter 22
of organoclays highly modifies the combustion behaviour of the filled EVA.Regarding the peak of HRR, which is a key parameter, we can observe that, asfor self extinguishability, there seems to be an optimum reduction for 5% ofMMT content, the peak value being higher for a 10% content.
As previously described for systems with ATH as hydrated filler,8,12 a rigidresidue is obtained after burning for all specimens. This residue, which lookslike a foam, is mainly inorganic but contains about 12% of char (this carboncontent was estimated by measuring the weight loss after 3 hours at 1050°C).This result confirms the charring effect of MMT observed in thermal analysisexperiments.
One interesting point is the foam-like structure of the residue. Effectively, thesample thickness increases from 4 mm, at the beginning of the test, to more than10 mm for the final residues (Figure 6). The creation of an expanded foam canbe assimilated to a kind of intumescence. During cone calorimeter experiments,we observed that the expansion (which finally leads to such residues) startsbefore the ignition of the sample. As opposed to samples filled with MH only,the samples containing organoclays do not show any bubble bursting at theirradiated surface during the pre-ignition period, whereas, at the same time, thesample thickness grows. This suggests that the bubbles resulting from the degra-dation of MH (water), MMT organic part and EVA (acetic acid), are trappedinside the sample, which starts to foam. Effectively, when a cone calorimeterexperiment is stopped just after ignition, one can observe that the whole samplehas been converted into a foam, the upper part being charred and brittle, and thelower part remaining still flexible like undegraded filled polymer (Figure 7).
When a complete experiment is performed, the foamed structure createdbefore ignition then slows down both heat transfer and diffusion of fuel andoxygen, thus promoting charring, and finally, a cohesive foam is obtained atthe end of combustion (containing char and minerals). The complex mechanismleading to the formation of the foam during the ignition period involvesprobably many phenomena influenced by the presence of MMT, such as bubble
Figure 6 Residues of cone calorimeter tests (a) EVA-55MH-5MMT and (b) EVA-50MH-5MMT-5T
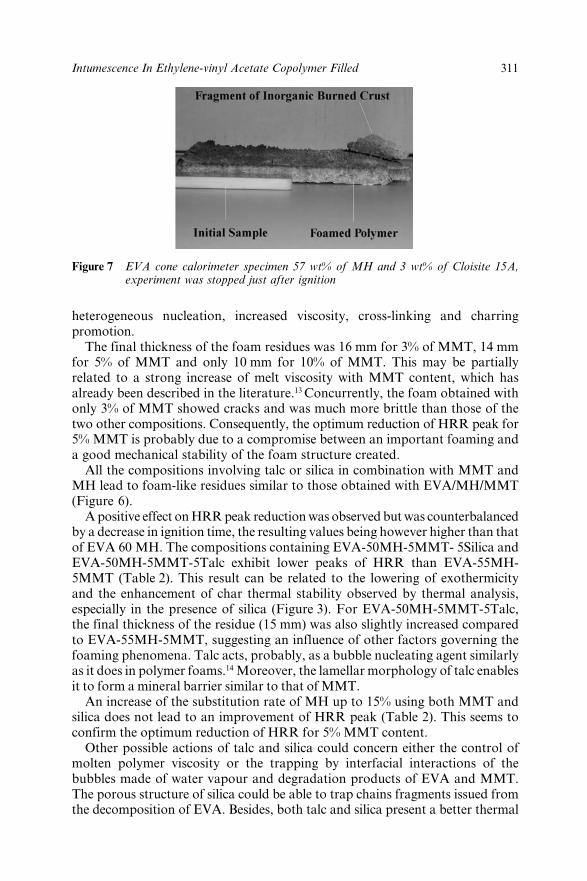
311Intumescence In Ethylene-vinyl Acetate Copolymer Filled
heterogeneous nucleation, increased viscosity, cross-linking and charringpromotion.
The final thickness of the foam residues was 16 mm for 3% of MMT, 14 mmfor 5% of MMT and only 10 mm for 10% of MMT. This may be partiallyrelated to a strong increase of melt viscosity with MMT content, which hasalready been described in the literature.13 Concurrently, the foam obtained withonly 3% of MMT showed cracks and was much more brittle than those of thetwo other compositions. Consequently, the optimum reduction of HRR peak for5% MMT is probably due to a compromise between an important foaming anda good mechanical stability of the foam structure created.
All the compositions involving talc or silica in combination with MMT andMH lead to foam-like residues similar to those obtained with EVA/MH/MMT(Figure 6).
A positive effect on HRR peak reduction was observed but was counterbalancedby a decrease in ignition time, the resulting values being however higher than thatof EVA 60 MH. The compositions containing EVA-50MH-5MMT- 5Silica andEVA-50MH-5MMT-5Talc exhibit lower peaks of HRR than EVA-55MH-5MMT (Table 2). This result can be related to the lowering of exothermicityand the enhancement of char thermal stability observed by thermal analysis,especially in the presence of silica (Figure 3). For EVA-50MH-5MMT-5Talc,the final thickness of the residue (15 mm) was also slightly increased comparedto EVA-55MH-5MMT, suggesting an influence of other factors governing thefoaming phenomena. Talc acts, probably, as a bubble nucleating agent similarlyas it does in polymer foams.14 Moreover, the lamellar morphology of talc enablesit to form a mineral barrier similar to that of MMT.
An increase of the substitution rate of MH up to 15% using both MMT andsilica does not lead to an improvement of HRR peak (Table 2). This seems toconfirm the optimum reduction of HRR for 5% MMT content.
Other possible actions of talc and silica could concern either the control ofmolten polymer viscosity or the trapping by interfacial interactions of thebubbles made of water vapour and degradation products of EVA and MMT.The porous structure of silica could be able to trap chains fragments issued fromthe decomposition of EVA. Besides, both talc and silica present a better thermal
Figure 7 EVA cone calorimeter specimen 57 wt% of MH and 3 wt% of Cloisite 15A,experiment was stopped just after ignition

312 Chapter 22
stability than MMT (which loses around 30% of its initial weight at 700°C dueto the decomposition of alkylammonium modifiers). Consequently, compared toMMT, these two high specific surface area fillers may have a more active effecton charring processes at high temperature, that is to say, in the last stages ofEVA degradation.
22.4 ConclusionsThe incorporation of organoclays in partial substitution of magnesium hydrox-ide leads to efficient flame retardant systems in EVA. The action of organoclayscan be reinforced by a combination with delaminated talcs or silica. This leadsto shifts of thermal analysis curves. Improvements of self-extinguishability andpeaks of HRR are conditioned by the type of composition elaborated. The mainmechanism of action of these fire retarded compositions is connected to aphenomenon of intumescence leading to the formation of a foam-like structureduring the pre-ignition period. This foamed structure then burns slowly due toboth limited heat transfer and limited diffusion of fuel and oxygen.
22.5 References1. F. Montezin, J.M. Lopez-Cuesta, A. Crespy and P. Georlette, Fire Mater.,
1997, 21, 245.2. R.N. Rothon, in Particulate-Filled Polymer Composites, 1st Edn, Longman
Scientific, Harlow, UK, 1995.3. K. Shen, Plastic Composites, 1988, Nov.–Dec., 26.4. S. Bourbigot, M. Le Bras, R. Leeuwendal, K.K. Shen and D. Schubert,
Polym. Degrad. Stab., 1999, 64, 419.5. M.S. Cross, P.A. Cusack and P.R. Hornsby, Polym. Degrad. Stab., 2003,
79, 309.6. A. Durin-France, L. Ferry, J.M. Lopez-Cuesta and A. Crespy, Polym.
Inter., 2000, 49, 1101.7. M. Zanetti, G. Camino, R. Thomann and R. Mülhaupt, Polymer, 2001,
42, 4501.8. G. Beyer, Fire Mater., 2001, 25, 193.9. T. Kashiwagi, A.B. Morgan, J.M. Antonucci, M.R. VanLandingham,
R.H. Harris,W.H. Awad and J.R. Shields, J. Appl. Polym. Sci., 2003,89(8), 2072.
10. J.W. Gilman, S.J. Richie, T. Kashiwagi and S. Lomakin, Fire Mater.,1997, 21, 23.
11. G. Camino, R. Sgobbi, A. Zaopo, S. Colombier and C. Scelza, Fire Mater.,2000, 24, 85.
12. S.C. Brown, M.L. David, K.A. Evans and J.P. Garcia, WO 00/66657,2000, assigned to Alcan International Ltd.
13. B. Hoffmann, C. Dietricha, R. Thomann, C. Friedrich and R. MülhauptMacromol. Rapid Commun., 2000, 21, 57.
14. C.B. Park, L.K. Cheung and S.-W. Song, Cellular Polym., 1998, 17(4),221.
313
CHAPTER 23
Spent Oil Refinery Catalyst:A Synergistic Agent inIntumescent Formulations forPolyethylenic MaterialsLUCIANA R. DE MOURA ESTEVÃO,1 REGINA SANDRAV. NASCIMENTO,1 MICHEL LE BRAS2 ANDRENÉ DELOBEL3
1Instituto de Química – DQO, Universidade Federal do Rio de Janeiro, CTBloco A, 6° andar, Cidade Universitária, Ilha do Fundão, Rio de Janeiro,RJ, CEP 21941-590, Brazil ([email protected])2PERF, ENSCL, BP 108, F-59652 Villeneuve d’Ascq Cedex, France3CREPIM, Parc de la Porte du Nord, F-65700, Bruay la Buissière, France
23.1 IntroductionIn recent years, concern has been widely expressed about the toxicity of the ver-satile and highly efficient halogenated flame retardants.1 The modern concept offlame retardancy implies that flame retardants should effectively reduce theprobability of fire development and also its consequences, both on humans andon structures.2 Following this concept, halogen-based flame retardants becomesomewhat unsatisfactory since, on burning, they give rise to dense smoke and toacidic corrosive fumes. In the quest for halogen-free flame retardants muchresearch is being centred on intumescent additives. These systems have providedefficient means for enhancing fire safety performance while presenting anenvironmentally friendlier approach than the traditional halogen systems. Theintumescence process results from a combination of charring and foaming of thesurface of the burning polymer, forming a shield that protects the underlyingmaterial from the action of the heat flux or flame.3
However, regardless the efficiency of flame-retarded systems, the additionalcost of the end products still limits them largely to institutional sales.4 Thischapter reviews the role played by spent petroleum refining catalyst from the

314 Chapter 23
fluid-bed catalytic cracking (FCC) unit in classical ammonium polyphosphate(APP) and pentaerythritol (PER) intumescent formulations. This zeolite-basedwaste material is discharged from the cracking units in large quantities, givingrise to a number of environmental hazards. Thus, its reutilization in intumescentformulations not only contributes in lowering environmental hazard due towaste discharge, but may also provide a way to produce materials that meetflame-retardancy standards at lower cost, allowing them to find their way intovarious residential and commercial markets.
The basic concepts of intumescence are first briefly reviewed, followed by anoutline of the characteristics of the FCC catalyst. Once both intumescence andthe spent catalyst have been presented, the synergistic action of the catalyst inthe intumescent formulations can then be fully discussed. In this section, theeffect of catalyst loading, particle size, and its components on flame retardancyis evaluated by traditional fire tests, such as the limiting oxygen index (LOI) andcone calorimetry. The final section covers the participation of the spent catalystin the formation of the intumescent shield, as observed by heating microscopyand by scanning electron microscopy (SEM) of burnt surfaces.
23.2 Protection Via IntumescenceIntumescent systems interrupt the self-sustained combustion of a polymer matrixat its earliest stage, that is, the thermal degradation accompanied by the evolu-tion of gaseous fuels.3 On heating, these systems swell to form foamed cellularcharred layers on the surface of the burning material. This layer acts as a physi-cal barrier to heat and mass transfer, protecting the underlying material fromthe heat flux and limiting the diffusion of both the combustible gases generatedby pyrolysis that feed the flame and of the oxygen that sustains the burningprocess5–8 (Figure 1). Hence, intumescent systems interfere with the action of allthe necessary components for the fire triangle, namely heat, oxygen, and fuel.
Figure 1 Schematic action of an intumescent polymeric formulation (adapted fromreference 9)
315Spent Oil Refinery Catalyst
23.2.1 Intumescent Formulations
An intumescent formulation generally contains three active components:3,10
• An acid source (precursor of acid species), such as ammonium phosphate,ammonium polyphosphate (APP), diammonium diphosphate or diammon-ium pentaborate.
• A carbonific compound, usually polyhydroxy compounds such as pentaery-thritol (PER), xylitol, mannitol, sorbitol and polymers that naturallycarbonise under heat or fire (polyamides, polycarbonates and polyure-thane).
• A spumific (or blowing) compound that releases large quantities ofnon-combustible gases such as NH3 and CO2. Salts of phosphoric acid,melamine and guanidine have been used for this purpose.
Intumescent formulations should contain components that fulfil all threefunctions. There are compounds that may function in more than one way, viz.ammonium polyphosphate (APP), which acts both as an acid source and as ablowing agent by producing the corresponding acid and by releasing NH3 onheating.
The first stage of the accepted mechanism of intumescence involves thedecomposition of the acid source to give a mineral acid. The mineral acid thenreacts with the carbonific agent to form a carbonaceous layer (char). In the finalstep, the spumific compound decomposes, generating gaseous products, whichcause the char to swell, forming a foam-like insulating layer. Continued heatingcauses the decomposition of the intumescent material and loss of the foamedcharacter.3,11
23.3 Synergistic AgentsThe incorporation of active components into an additive system may lead to anadditional effect,12 an antagonistic effect13 or a synergistic effect.12–15 The use ofsynergistic agents has deserved increasing attention in flame retardancy. Theseagents produce more efficient systems while also making it possible to reduce theamount of flame retardants necessary to deliver efficient flame retardancyperformance within the stringent regulations imposed.16 Clays and zeolites13,14
have been used as synergistic agents in intumescent ammonium polyphosphate(APP) and pentaerythritol (PER) formulations, and we now approach the use ofspent oil refinery cracking catalyst for the same purpose.17,18
23.4 Oil Cracking CatalystAfter use, large amounts of waste catalyst are discharged from the reactors,giving rise to a number of environmental hazards. The worldwide annualdemand for fluid bed catalytic cracking (FCC) catalyst in oil refineries is around

316 Chapter 23
300000 tons19 and, while many forms of reutilization of the material havebeen suggested, only its use in the cement industry has gained any wide rangeindustrial status.20
23.4.1 The FCC Process and Catalyst – Basic Concepts
The FCC process aims at the conversion of heavy fractions from oil distillation(gas oils and resid fuels) into lighter fractions with greater economic value suchas gasoline, diesel fuel and light gases, by the joint action of heat and a zeolite-based catalyst.21,22 During the cracking process the catalyst is continuouslybeing deactivated, and, to maintain catalytic activity and selectivity, part of thecatalyst inventory is periodically discharged and new catalyst is introduced intothe process. The removed catalyst is known as spent catalyst, exhaust catalyst orequilibrium catalyst.
The FCC catalyst is typically composed of a zeolite [a crystalline alumino-silicate with general formula Mx/n(AlO2)x(SiO2)y·wH2O, were y/x ≥ 1 and Mrepresents a cation with formal charge n]23 embedded in a silica-alumina matrix.The matrix consists mainly of a binder, such as silica hydrosols or aluminagels, an active matrix component, usually alumina, and a filler, typically kaolinclays.22,24–25 Zeolite Y was first used as the active component in the crackingcatalyst in the early 1960s. Shortly after, ultrastable Y zeolites (USY) andrare earth exchanged zeolites (REY and REUSY) were introduced into thecatalysts,26 both possessing greater thermal/hydrothermal stability and aciditythan the Y type zeolite originally used.27,28
23.4.2 Chemical Composition and Physical Properties of theSpent FCC Catalyst
Throughout the following sections E.Cat. has been used to designate Exhaust orEquilibrium Catalyst, representing the spent FCC catalyst withdrawn from theFCC unit without further treatment. Due to its relatively large particles, E.Cat.was milled and wet sifted and the catalyst obtained will be represented by MEC.The numbers following MEC refer to the fraction being studied. The materialthat stayed on a given sieve is the oversize of the sieve, and is represented by theplus (+) sign. Analogously, the passing material is the undersize and representedby the minus (−) sign.29 The morphology of E.Cat. and its −635# fraction isshown in Figure 2.
The chemical composition of E.Cat. and its fractions, obtained usingX-ray fluorescence, are shown in Table 1, while the average particle size, zeolitecontent and textural properties of the materials are presented in Table 2. Anincrease in zeolite content was observed in all MEC fractions, indicating apartial dissolution of the amorphous components.
For simplicity, whenever the sieve size is not specified, MEC will refer to theundersize of the 635 mesh sieve (MEC = MEC − 635#).

317Spent Oil Refinery Catalyst
23.5 Effect of the Catalyst on Fire Performance ofIntumescent Formulations: Are the Additives inSynergy?
All intumescent systems studied were based on ammonium polyphosphate (APP,supplied by Clariant under the trade name Exolit 422) and pentaerythritol(PER, from Acros and Sigma Aldrich). The mixture, having an APP:PERweight ratio of 3, was added to the polymeric matrix to account for 30 wt% ofthe final mass. The materials studied were either processed in laboratory mixers(Brabender or Haake 90 at 160 and 150°C, respectively) or in a double screwextruder (Brabender) with temperatures varying from 120 to 160°C. Polyethyl-ene copolymers and terpolymers were used as matrices.
Table 1 Chemical composition of E.Cat and its fractions obtained by millingand sifting
MEC
Component E.Cat. +150# +270# +400# +635# −635# Units
Aluminium oxide 31.9 31.1 31.0 31.4 30.8 31.5 %Silicon oxide 66.2 67.1 67.3 66.9 67.4 66.7 %Nickel < 100 < 100 < 100 < 100 < 100 < 100 mg kg−1
Iron(III) oxide 0.37 0.47 0.37 0.40 0.38 0.37 %Vanadium < 100 < 100 < 100 < 100 < 100 < 100 mg kg−1
Titanium(IV) oxide 0.92 0.90 0.89 0.91 0.91 0.88 %Antimony < 100 < 100 < 100 < 100 < 100 < 100 mg kg−1
Lanthanum(III) oxide 0.36 0.35 0.35 0.34 0.35 0.38 %Cerium(III) oxide 0.03 0.02 0.02 0.01 0.01 0.03 %Praseodymium(III) oxide 0.03 0.03 0.02 0.03 0.03 0.04 %Neodymium(III) oxide 0.10 0.09 0.09 0.09 0.09 0.10 %Sodium oxide 0.38 0.32 0.31 0.28 0.44 0.37 %Phosphorous(V) oxide 0.09 0.08 0.08 0.09 0.08 0.09 %Bismuth(III) oxide 96 104 102 107 115 96 mg kg−1
Molar SARa 3.52 3.67 3.69 3.62 3.73 3.60
aSAR = molar silica:alumina ratio.
Table 2 Physical properties and zeolite content of E.Cat and its fractions
Average particle Zeolite contentTextural properties
Fraction size (mm) (wt%) SABET (m2 g−1)a MiPA (m2 g−1)b
E. Cat. 75.5 35.6 210.93 157.19MEC +150# 125.3 37.6 237.22 176.78MEC +270# 77.8 39.7 232.18 177.65MEC +400# 50.8 39.6 231.86 170.42MEC +635# 33.0 38.9 220.08 161.50MEC −635# 8.77 37.6 224.58 166.19
aSurface area obtained by the BET method. bMicropore area.

318 Chapter 23
23.5.1 Effect of Catalyst Loading
The addition of various amounts of MEC to the polymer containing the intumes-cent formulation has shown that the catalyst increases the flame retardancyperformance of these systems. However, no effect is observed when the catalystis added to the pure polymer, indicating that the intumescent additives and thecatalyst are in synergy. The LOIs shown in Table 3 illustrate well the phenom-enon in an ethylene-butyl acrylate copolymer matrix. Maximum values areachieved with 5 wt% of MEC in this matrix, but even smaller amounts, like1.3%, already increase the APP/PER oxygen index by 7 units, corresponding toa 33% gain. Thus, the addition of MEC has taken the intumescent APP/PERmaterials from “slow-burning” to “self-extinguishing”30 composites.
Other polyethylene matrices gave similar results, although the optimumMEC content varied from 2.5 to 5% depending on the matrix.31,32 Maximumvalues for the rate of heat release (RHR) from the systems, measured by conecalorimetry, confirm the observations made based on the LOI results. MECaddition to the APP/PER formulations significantly lowers RHR of the intumes-cent materials. In Figure 3, the maximum RHR of the APP/PER formulationswithout MEC is ca. 75% higher than for the intumescent system containing5 wt% of the waste material. MEC incorporation into other polyethylenicmatrices supports the proposition that a synergistic effect occurs between MECand the APP/PER intumescent additives.
Figure 2 Scanning electron microscopy images of (a) E.Cat and (b) MEC−635#
Table 3 Influence of MEC addition on the LOI (accurate to ± 1 unit) of thepure ethylene (70 wt%)-butyl acrylate (30 wt%) copolymer, PEBA,and of the copolymer containing the intumescent mixture
LOI (vol%)
MEC content (wt%) added to 0 1.3 2.5 5.0 10.0
Pure polymer 18 18 18 18 19Polymer + intucescent APP/PER mixture 21 28 30 31 29

319Spent Oil Refinery Catalyst
23.5.2 Effect of the Catalyst’s Particle Size
The thermal properties of many systems can be influenced by the particle sizeof the additives. Differences in particle size can determine the extent of fireretardancy performance of Al(OH)3 and Mg(OH)2 filled systems.33
Hence, it is not surprising that the extent of the synergy observed between theintumescent additives and the spent catalyst should depend on the averageparticle size of the catalyst samples. The effect is clearly illustrated in Figure 4.The higher LOI are attained with the finest fractions and decrease with increas-ing particle size. This tendency could possibly be attributed to the generation ofhigher tension points in the char by particles of greater dimensions, leading toa decrease in the shield’s strength.34 The limiting oxygen index of the E.Cat.system shows good accordance with the average particle size trend observed.
23.5.3 Effect of the Catalyst’s Components on Flame Retardancy
Having established that the spent catalyst greatly enhances the fire performanceof APP/PER intumescent formulations, each of one of the catalyst’s componentswas studied individually to determine which of them contribute to the finalsynergistic effect. Fire testing revealed that zeolites, whatever the type, are thecomponents that exhibit the highest synergy with the intumescent additives. TheLOIs shown in Table 4 illustrate the effect of the various components on fireperformance of the intumescent mixtures. Comparison between the zeolites has
Figure 3 Effect of MEC addition to PEBAMA [terpolymer of ethylene (91.5 wt%)-butyl acrylate (5 wt%)-maleic anhydride (3.5 wt%)] formulations on the rateof heat release

320 Chapter 23
shown that the nature of the counter-ion (NaY and REY) and the strength of theacid site (NaY and USY) do not significantly affect the fire performance of thematerials. Maximum LOIs are achieved with smaller amounts of zeolite thanwith MEC, but the ultimate values attained are equivalent in both materials.Kaolin also increases flame retardancy performance of the APP/PER systems,though to a lesser extent than zeolites or MEC. Silica and alumina presented nosynergistic effect detectable by the method.
The results seem to indicate that the increased efficiency of the APP/PERsystems occurs by means of aluminosilicate species. The use of silica and alu-mina separately did not enhance the fire properties of APP/PER formulations,while the benefits of kaolin, zeolites and spent catalyst are obvious.
Figure 4 Effect of particle size on LOI values of intumescent formulations in a PEBA[ethylene (70 wt%)-butyl acrylate (30 wt%)] matrix. (LOI accurate to ± 1unit)
Table 4 Influence of spent catalyst and its components on LOI of intumescentformulations in PEBA matrix (LOI accurate to ± 1 unit)
LOI (vol%)
Zeolites
Filler content (wt%) MEC (−635#) Kaolin Alumina Silica NaY USY REY
0 21 21 21 21 21 21 211.3 28 22 21 21 31 31 312.5 30 23 21 22 32 31 315.0 31 26 22 22 31 31 32

321Spent Oil Refinery Catalyst
23.5.4 Spent Catalyst and the Intumescent Layer
The material resulting from the degradation of the intumescent additives is het-erogeneous, composed of gaseous products trapped in a phosphocarbonaceouscellular material, also known as the condensed phase. The condensed phase is amixture of solid and liquid phases.3 The nature and proportion of these phasesdictates the dynamic properties of the insulating layer and hence the fire perfor-mance of the material. Thus, an active participation of the catalyst in thegeneration of the intumescent shield may lead to modified dynamic propertiesand account for the increased fire performance of the systems. Heating micros-copy and scanning electron microscopy (SEM) coupled with an X-ray energydispersive system (EDS) both made clear that the catalyst effectively takes partin the protective layer and increases the thermal stability of the charred surfacestructure.
Heating microscopy has recently been proposed by our group as a useful toolfor monitoring the intumescence phenomenon continuously in situ.17,35–38 Thedegree of intumescence can be estimated by evaluating the sample’s projectedarea at different temperatures throughout the experiment. The procedureinvolves heating 3 mm sided cubic samples from 30 to 700°C, under static airatmosphere, with a 10.5 A electric current during an average interval of 30 min.The projected areas are quantified by means of an image analysing software.Selected images, obtained at 30, 100, 350 and 700ºC of the PEBAMA terpoly-mer formulations are presented in Figure 5. A quantitative analysis of theintumescent behaviour of the systems was carried out in which the sample’sprojected area was recorded and divided by the initial area, thus reducing theerrors due deviations in the specimen’s dimensions. The intumescence processcan be easily followed by the association of Figures 5 and 6.
Figure 5 Heating microscopy images of the PEBAMA systems17

322 Chapter 23
During heating, pure polymer becomes completely transparent at around100°C, where the melting process also becomes evident. No significant intu-mescence is observed for the pure polymer and the polymer containing MEC.
The intumescent process, as expected, became evident only by the addition ofAPP/PER to the mixture. The sample containing only APP/PER sufferedgreater swelling than that to which the catalyst had been added. However, thepresence of the catalyst helped maintain the specimens’ structure at tempera-tures up to 700°C, when the system containing only APP/PER had alreadycollapsed. Noteably the final value of the area ratio for polymer + APP/PER +MEC (5%) system at 700°C involved a large standard deviation. Many of thesamples tested presented an area ratio of practically zero, while a few appearedto partially maintain the structure. However, by keeping the temperatureat 700°C the residue gradually disappeared, indicating that its lack of totaldegradation was time-dependent. This was not the case for the APP/PER +catalyst system, where the residue at 700°C was maintained for even at longertimes.
The participation of the catalyst in the intumescent shield formed wasobserved by scanning electron microscopy (SEM) coupled with an X-ray energydispersive system (EDS). The surfaces of the intumescent samples were burnt byapplying a 4 cm flame for 25 s on a 20 × 4 mm area and the resulting surfacesare presented in Figures 7 and 8. Vast regions of the burnt surface of the samplecontaining only APP/PER have the aspect shown in Figure 7a. On the sample’s
Figure 6 Ratio between the sample’s projected area at a determined temperature and itsinitial projected area, determined by heating microscopy followed by imageanalysis. Values are the average of 5 measurements, error bars omitted forclarity17

323Spent Oil Refinery Catalyst
surface are small rods and particles that an EDS analysis revealed to containphosphorous, carbon and oxygen (Figure 7a, point “1”). Similar results wereobtained by analysing the matrix (point “2”, Figure 7b).
The foamed structure that characterises an intumescent shield could only bedetected in a few isolated areas, such as the one shown in Figure 7b, beside aregion of high phosphate concentration. The low abundance of these foamedregions indicates that the intumescent shield lacked adequate dynamical/mechanical properties for its maintenance after continued flame application andcooling.
Contrasting with these observations, the APP/PER system to which MEC hadbeen added kept its intumescent shield almost unimpaired during burning andcooling, except for the few cracks shown in Figure 8. An EDS analysis of point“1” in Figure 8a revealed the presence of Si and Al, indicating that MECparticles take part in the intumescent shield. A crack in the shield, caused by
Figure 7 (a) and (b) Burnt surface of a PEBAMA + APP/PER sample. EDS analysis ofpoints 1 (a) and 2 (b) revealed the elements P, O and C
Figure 8 (a) and (b) Burnt surface of a PEBAMA + APP/PER + MEC (5%) sample.EDS analysis of point 1 (a) revealed the elements Si, Al, P, O and C

324 Chapter 23
sample manipulation, revealed the porous foam-like structure responsible forlimiting heat and mass transfer (Figure 8b).
Thus, the increased flame retardancy of the APP/PER + MEC systems canpossibly be attributed to the higher thermal stability of the protective shieldformed during heat exposure of the material.
23.6 ConclusionWaste FCC catalyst strongly enhances the fire retardant properties of intumes-cent APP/PER formulations. However, the incorporation of the catalyst topolyethylenic matrices without the intumescent formulations does not modify itsfire performance. This way, the waste material appears to be a powerful syner-gistic agent in APP/PER intumescent formulations. Fire performance increaseswith the catalyst content up to an optimum value that depends on the nature ofthe matrix (2.5 to 5.0 wt%). Moreover, the efficiency of the catalyst is stronglydependent on its particle size.
From the major catalyst components only the zeolite and kaolin enhance fireperformance of the intumescent systems. Silica and alumina individually donot show synergistic effects with APP/PER, indicating that aluminosilicates areresponsible for the enhanced effect.
The association of heating microscopy with image analysis makes it ispossible to conclude that the use of the FCC waste catalyst contributes to themaintenance of the charred surface structure at temperatures higher than wouldbe observed in APP/PER systems that do not make use of this component.SEM-EDS results made clear that the catalyst takes part in the protectiveintumescent shield formed. The presence of the catalyst possibly results in themodification of the dynamic-mechanical properties of the shield, accounting forits increased resistance.
23.7 AcknowledgementsThe authors gratefully acknowledge CAPES and PRONEX for financial sup-port, CETEM/Brazil for the SEM analysis, CENPES/Petrobras for the charac-terisation of the waste catalyst and F. Pouch, L. Pankewitch, N. Debusse andO. Dobosz (CREPIM) for technical assistance in fire testing.
23.8 References1. M.S. Cross, P.A Cusack and P.R. Hornsby, Polym. Degrad. Stab., 2003,
79, 309.2. G. Camino in Fire Retardancy of Polymers: The Use of Intumescence,
M. Le Bras, G. Camino, S. Bourbigot and R. Delobel (eds.), The RoyalSociety of Chemistry, Cambridge, UK, 1998, p. v.
3. M. Le Bras and S. Bourbigot, in reference 1, p. 64.4. M.S. Reisch, Chem. Eng. News, 1997, Feb. 24, 19.

325Spent Oil Refinery Catalyst
5. G. Berttelli, G. Camino, E. Marchetti, L. Costa, E. Casorati andR. Locatelli, Polym. Degrad. Stab., 1989, 25, 277.
6. S. Bourbigot, M. Le Bras, P. Breant, J.M. Tremillon and R. Delobel, FireMater., 1996, 20, 145.
7. S.-Y. Lu and I. Hamerton, Prog. Polym. Sci., 2002, 27, 1661.8. M. Le Bras, S. Bourbigot, E. Felix, F. Pouille, C. Siat and M. Traisnel,
Polymer, 2000, 41, 5283.9. X. Almeras, F. Dabrowski, M. Le Bras, R. Delobel, S. Bourbigot,
G. Marosi and P. Anna, Polym. Degrad. Stab., 2002, 77, 315.10. M. Elomaa, L. Sarvaranta, E. Mokkola, R. Kallonen, A. Zitting, C.A.P.
Zevenhoven and M. Hupa, Crit. Rev. Biochem. Mol. Biol., 1997, 27, 137.11. D.B. Dahm, Prog. Org. Coatings, 1996, 29, 61.12. M. Le Bras, S. Bourbigot, Y. Le Tallec and J. Laureyns, Polym. Deg.
Stab., 1997, 56, 11.13. M. Le Bras and S. Bourbigot, Fire Mater., 1996, 20, 39.14. S. Bourbigot, M. Le Bras, R. Delobel, P. Bréant and J.M. Tremillon,
Polym Degrad Stab., 1996, 54, 275.15. S. Bourbigot, M. Le Bras, P. Breant, J.M. Tremillon and R. Delobel, Fire
Mater, 1996, 20, 145.16. J. Murphy, Reinforced Plastics, 2001, 45, 42.17. L.R.M. Estevão and R.S.V. Nascimento, Polym. Degrad. Stab., 2002, 75,
517.18. L.R.M. Estevão, M. Le Bras, R. Delobel and R.S.V. Nascimento, J. Fire
Sci., 2004, 22(3), 211–227.19. F.C. Barbosa and M.G. Tavares, Petrobras Mag., 1999, 27, 17.20. R.T. Oliveira, FCC em Revista, 1997, 10, 2.21. R.A. Meyers, Handbook of Petroleum Refining Process, Mc Graw Hill
Book Company, New York, 1986.22. P.G. Smirniotis and L. Davydov, Catal. Rev. – Sci. Eng., 1999, 41, 43.23. J. L.F. Monteiro, 2° Curso Iberoamericano sobre Peneiras Moleculares,
São Carlos, Brazil, 1995, 1.24. W.C. Cheng, G. Kim, A.W. Peters, X. Zhao and K. Rajagopalan, Catal.
Rev. – Sci. Eng., 1998, 40, 39.25. E.F. Sousa-Aguiar, “O papel das zeólitas am catalisadores de craquea-
mento. Relatório” CENPES/PETROBRAS, 199x, 1.26. R.H. Harding, A.W. Peters and J.R.D. Nee, Appl. Catal. A: General,
2001, 221, 389.27. P.B. Venuto, Microporous Mater., 1994, 2, 297.28. G.L. Baugis, H.F. Brito, W. Oliveira, F.R. Castro and E.F. Sousa-Aguiar,
Microporous and Mesoporous Mater., 2001, 49, 179.29. J.H. Perry, Chemical Engineers’ Handbook, McGraw-Hill Book Company,
New York, 1950.30. G. Camino and L. Costa, Polym. Degrad. Stab., 1988, 20, 271.31. L.R.M. Estevão, M. Le Bras, R. Delobel and R.S.V. Nascimento, Eur.
Polym J., 2004, 40(7), 1503–1513.

326 Chapter 23
32. L.R.M. Estevão, Doctoral Thesis, DQO – Instituto de Química, UFRJ,Rio de Janeiro, Brazil, 2002.
33. R.N. Rothon, in Particulate-Filled Polymer Composites, R.N. Rothon(ed.), Longman Scientific & Technical, Bath, UK, 1995, 207.
34. M. Le Bras, Thèse de Doctorat ès Sciences Physiques, Lille, France, 1997.35. R.S.V. Nascimento, C.R. Perruso and P.R. Hornsby, Extended Abstracts
from Eurofillers 97, Manchester, 1997, 457.36. R.S.V. Nascimento, A.N. Pereira and C.R. Perruso, Proceedings from VI
Simposio Latinoamericano de Polimeros, Viña del Mar, Chile, 1998, 126.37. L.R.M. Estevao, M. Le Bras, L.C.S. Mendonça-Hagler and R.S.V.
Nascimento, Proceedings of the 17th World Petroleum Congress, Rio deJaneiro, Brazil, 2002, 152.
38. L.R.M. Estevão, M. Le Bras, R. Delobel and R.S.V. Nascimento, Pro-ceedings of the 9th European Meeting on Fire Retardancy and Protection ofMaterials – FRPM’03, M. Le Bras et al. (eds.), USTL Pub., Lille, France,2003, p. 37.

327
CHAPTER 24
Zinc Borates as Synergists forFlame Retarded PolymersSERGE BOURBIGOT, MICHEL LE BRAS ANDSOPHIE DUQUESNE
Laboratoire des Procédés d’Élaboration des Revêtements Fonctionnels,UPRES EA 1040, École Nationale Supérieure de Chimie de Lille (ENSCL),Université des Sciences et Technologies de Lille, BP 108, 59652 Villeneuved’Ascq Cedex, France ([email protected])
24.1 IntroductionPrevious studies have demonstrated that there are major advantages (smokesuppressant, afterglow suppressant, corrosion inhibitor, anti-tracking agentand synergistic agent) of combining zinc borates, in particular in halogen-freesystems, with other flame retardants in several kinds of polymers (EVA, PVC,polyamides, etc.).1–5 This chapter surveys the use of zinc borates as synergist inhalogen-free flame retarded (FR) polymers.
Several crystalline structures of zinc borates are known but a few find indus-trial use in significant tonnage. Zinc borates can be divided into two categories,hydrated and anhydrous.6 So-called hydrated borates, which account for mostknown boron-containing minerals and synthetic borates consumed by industry,have structures containing B–OH groups (hydroxyl-hydrated borates) and may,also, contain interstitial water. Here, we only evaluate the performance ofdifferent synthetically made zinc borates commercialized under the brandname Firebrake®:7 FBZB (2ZnO⋅3B2O3⋅3⋅5H2O), FB415 (4ZnO⋅B2O3⋅H2O)and FB500 (2ZnO⋅3B2O3). Notably the chemical formula and the structure ofFB290 have been recently revisited by Schubert et al.8 and his investigationled to a revision of the chemical formula as 2ZnO⋅3B2O3⋅3H2O. Each of thesecompounds can be prepared selectively by reactions of zinc oxide with boricacid in water. The specific product is then obtained by adjusting the ratioB2O3/ZnO and temperature.
The thermal behavior of those zinc borates is also important to processpolymers containing them. Dehydration of FBZB commences upon heating
328 Chapter 24
above 290°C and complete dehydration requires 445 J g−1. The dehydrationonset temperature of FB415 is much higher than that of FB290 since it is415°C. This property allows for processing in engineering thermoplastics andother relatively high temperature systems. The dehydration sequence of FB290involves the loss of three molar equivalent of water through condensation ofB–OH groups and yields FB500, a substantially amorphous material ofcomposition 2ZnO⋅3B2O3. The selection of zinc borate depends, therefore, on theprocessing temperature of the polymer but its chemical composition might playa role in the FR mechanisms. As far as we know, no paper describes andcompares the effect of the chemical composition of zinc borates as synergist in aFR polymer. Here, it is also one of our goals to point out this aspect.
Zinc borate itself is not really a flame retardant. An example is an ethylene-vinyl acetate copolymer [EVA containing 19% vinyl acetate (VA) and hereaftercalled EVA19] filled by 50 wt% zinc borate (FBZB and FB500). LOI values(Limiting Oxygen Index: Standard Test Method for Measuring the MinimumOxygen Concentration to Support Candle-like Combustion of Plastics measuredaccording to the standard ASTM D2863/77) of such formulations are as low as21 wt% (samples drip and burn) and no classification is achieved at the UL-94test [UL-94 test: the test was carried out on sheets (3 mm thick) according toASTM D-635-77 standard]. Rate of heat release (RHR) curves (samplesexposed to an external heat flux of 50 kW m−2 according to ASTM 1356-90standard) of EVA19-FBZB and EVA19-FB500 are similar, suggesting thatthere is no effect of the chemical composition of zinc borate (Figure 1). Never-theless, zinc borate plays here the role of flame retardant since the RHR peakof virgin EVA in the same conditions is about 1700 kW m−2. This effect maybe assigned to a “filler effect” (dilution of fuel, i.e., of polymer) and to theformation of low viscosity vitreous protective coating due the decomposition ofzinc borate.4,5 It also explains the poor performance obtained at LOI and UL-94tests because of the dripping of the samples when heated.
This short discussion shows the versatility of zinc borates and its potentialas synergists in flame retarded polymers. Here, we will then focus on theperformance of zinc borate as synergist and on the influence of the chemicalcomposition of the three zinc borates mentioned above on the flammabilityproperties of different thermoplastics [polypropylene (PP) and EVA] filled bymetal hydroxides and by intumescent systems.
24.2 Zinc Borates In Eva-Metal Hydroxides SystemsSectors of industry, notably those concerned with aerospace, microelectronics,cable and wire manufacture, are particularly interested in alternative halogen-free fire retardants such as aluminium or magnesium hydroxides [Al(OH)3 orMg(OH)2], hereafter called ATH and MH.10 These latter achieve their effectsby decomposing endothermally with the release of water close to the tempera-tures at which polymers themselves decompose, and by forming a protectiveceramic-like structure.3,5

329Zinc Borates as Synergists for Flame Retarded Polymers
Zinc borates act as synergists when substituting partially metal hydroxidesin thermoplastics. A typical example is given on Figure 2 for an EVA (EVAcontaining 24% VA and hereafter called EVA24) filled by 60 wt% of differentratios of MH/Zinc borate. LOI versus the substitution amount of MH in zincborates reveal a synergistic effect for the two zinc borates (FBZB and FB415).Maximum LOI is reached at 3 wt% for FBZB (LOI = 41 vol%, i.e. 20% ofrelative increase) and at 5 wt% (LOI = 44 vol%, i.e. 10% of relative increase) forFB415. The difference between the two zinc borates is that the LOI maximumlies at different substitution level (3 wt% compared to 5 wt%) and that therelative increase of the performance of the formulation containing FB415 istwice as high as that of the formulation containing FBZB. Conversely, LOIs ofthe formulation containing FB415 decrease slower than those containing FBZBat high substitution level (> 7 wt%). These trends due to the two different zincborates are not clear to us at this time and work is in progress to explain them.Comparison of the median particle size of the two zinc borates reveals that itis of 5 µm for FB415 and of 9 µm for FBZB. This suggests that this parametermight act upon the performance, modifying the viscosity of the polymer. As LOIis a vertical test, the protective material drips down when the viscosity becomestoo low. It was previously reported by Carpentier et al.4 who demonstrated thedirect influence of the rheological behavior on LOI values and who explainedthe decrease of LOI when substituting MH by zinc borate at too high level.
Figure 1 RHR (external heat flux = 50 kW m−2) versus time of the formulationsEVA19-zinc borate (total loading 50 wt% remains constant, compounded in aroller mixer at 160°C at 50 rpm)9

330 Chapter 24
The second explanation is the high dehydration temperature of FB415 (415°C)compared to that of FBZB (290°C). Hydrolysis of polymeric chains might takeplace at relatively low temperature with FBZB and, so, the viscosity would fall.
Cone calorimetry by oxygen consumption permits evaluation of materials indifferent fire scenarii conditions. It is then a tool of choice to investigate theeffect of zinc borates in metal hydroxides filled polymers. RHR curves (samplesexposed to an external heat flux of 50 kW m−2 according to ASTM 1356-90standard) of different EVA19-based formulations show that the peak of RHR intime and in intensity (RHR peak = 185 kW m−2 at 80 s) is not modified uponincorporating zinc borates (Figure 3). Time to ignition is also unchanged. Theeffect of zinc borates is revealed at longer times, when the second peak of RHRappears. Except for FBZB, the second RHR peak is slightly decreased and isspread out over time for formulations containing zinc borates compared to thatwithout. Notably FBZB-XF has the same chemical composition as FBZB buthas a smaller particle size (median particle size is of 2 µm compared to 9 µm).RHR values of the formulation containing FBZB-XF are significantly lowerthan that containing FBZB and the same as that containing FB415 after thefirst RHR peak. This result suggests that the particle size of zinc borates playsa significant role in the flammability properties of the EVA/ATH systems. Itmakes sense, because the mechanism of action of ATH is to form a protectivealumina ceramic and zinc borate reinforces its efficiency by acting as a binder
Figure 2 LOI vs. the substitution amount of MH in zinc borate in the formulationEVA24-MH/zinc borate (total loading 60 wt% remains constant, compoundedin a roller mixer at 160°C and 50 rpm)11

331Zinc Borates as Synergists for Flame Retarded Polymers
(formation of B2O3/ZnO glass),3,5 filling up pores of the ceramic. If we assumethat the dispersion would be better using finer particles, then the B2O3/ZnO glasscoming from the degradation of zinc borate would be homogenously dispersedin the polymeric matrix and would interact better with the alumina ceramic.However, there is no observed effect of the chemical composition of zinc borateon flammability properties. It seems, therefore, that temperature of dehydrationof zinc borate does not influence flammability of the systems. According to ourprevious discussion, we can say that the viscosity of the melt FR polymer is thekey factor to pass a vertical test.
To complete these results, a comparison of EVA24-based formulationscontaining 60 wt% fillers (combination MH with zinc borate) is shown onFigure 4. The figure shows that the incorporation of zinc borates (7 wt% sub-stitution) reduces RHR values when added in EVA24-MH systems. It was notobserved in the previous case because the ratio ATH/zinc borate was notadjusted to get the lowest RHR (as an example, the ratio ATH/zinc borate = 2provides the best performance in EVA19-ATH/FBZB-XF formulations).3,9
The chemical composition of zinc borate does not also play a role in the flam-mability properties (in terms of RHR) in the EVA24-MH/zinc borate systems,as observed above. Nevertheless, different ratios of substitution should beevaluated to draw a final conclusion.
Figure 3 RHR (external heat flux = 50 kW m−2) vs. time of the formulations EVA19-ATH/zinc borate (total loading 65 wt% remains constant, formulations con-tains 35 wt% EVA19, 43.3 wt% ATH and 21.7 wt% zinc borate, compoundedin a roller mixer at 160°C and 50 rpm)9
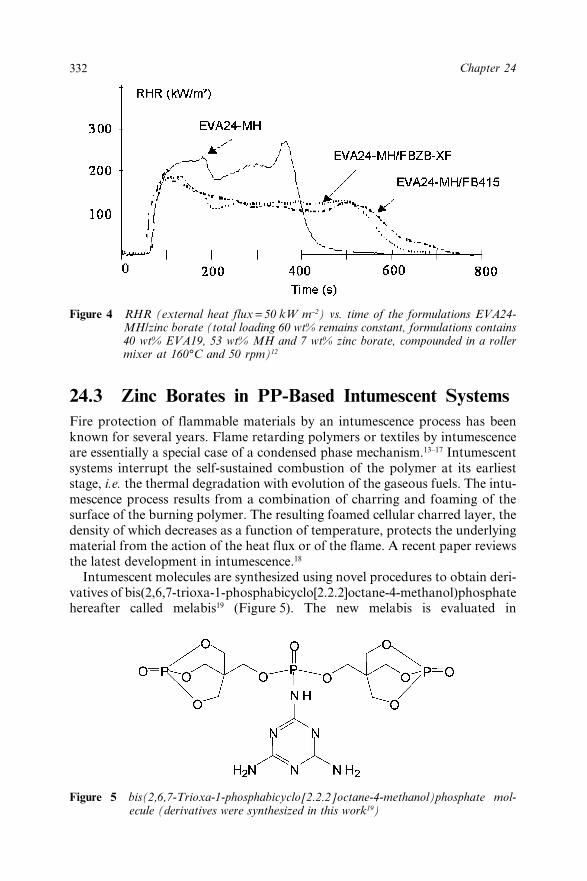
332 Chapter 24
24.3 Zinc Borates in PP-Based Intumescent SystemsFire protection of flammable materials by an intumescence process has beenknown for several years. Flame retarding polymers or textiles by intumescenceare essentially a special case of a condensed phase mechanism.13–17 Intumescentsystems interrupt the self-sustained combustion of the polymer at its earlieststage, i.e. the thermal degradation with evolution of the gaseous fuels. The intu-mescence process results from a combination of charring and foaming of thesurface of the burning polymer. The resulting foamed cellular charred layer, thedensity of which decreases as a function of temperature, protects the underlyingmaterial from the action of the heat flux or of the flame. A recent paper reviewsthe latest development in intumescence.18
Intumescent molecules are synthesized using novel procedures to obtain deri-vatives of bis(2,6,7-trioxa-1-phosphabicyclo[2.2.2]octane-4-methanol)phosphatehereafter called melabis19 (Figure 5). The new melabis is evaluated in
Figure 4 RHR (external heat flux = 50 kW m−2) vs. time of the formulations EVA24-MH/zinc borate (total loading 60 wt% remains constant, formulations contains40 wt% EVA19, 53 wt% MH and 7 wt% zinc borate, compounded in a rollermixer at 160°C and 50 rpm)12
Figure 5 bis(2,6,7-Trioxa-1-phosphabicyclo[2.2.2]octane-4-methanol)phosphate mol-ecule (derivatives were synthesized in this work19)

333Zinc Borates as Synergists for Flame Retarded Polymers
polypropylene (PP) filled at 30 wt%. The LOI is 31 vol% and jumps to 34 vol%upon adding 1 wt% melamine at 30 wt% total loading. All those formulationsare V-0 rated at the UL-94 test [UL-94 test: carried out on sheets (3 mm thick)according to ASTM D-635-77 standard].
Previous papers reported that zeolites,20 TiO2,21 talc,22 or MnO2,
23 could beused as synergists in intumescents. No work has been published on the potentialuse of zinc borates as synergistic agents in intumescent systems and it is thepurpose of this section to investigate its efficiency in PP-melabis formulations. Alarge synergistic effect is observed on substituting a small amount of melabis byzinc borate (Figure 6). The LOI jumps from 30 vol% for the formulation withoutzinc borate to 35.5 vol% at 1 wt% substitution in FBZB, to 38 vol% at 1 wt%substitution in FB415, and to 39 vol% at 2 wt% substitution in FB500. Thissuggests that the chemical composition may play a role in the synergistic actionof zinc borate in intumescence. Further work is in progress to understand theinteraction of zinc borate with intumescent formulation. Preliminary resultsshow that boronphosphate is formed by reaction of phosphate with boronoxides.24 This permits the stabilization of phosphate at high temperature, andthen to keep the integrity of the intumescent structure.
Cone calorimetry at an external heat flux of 50 kW m−2 of PP-melabis systemscontaining FB500 (2 wt% substitution) reveals that RHR curves (not shown)are similar to those of the system without FB500. The development of anintumescent structure is always observed and the peak of RHR is as low as
Figure 6 LOI vs. the substitution in zinc borate in the formulation PP-melabis/zinc borate(total loading 30 wt% remains constant, compounded in a roller mixer at 200°Cand 50 rpm)25

334 Chapter 24
150 kW m−2. Notably, the residue of the system without zinc borate is notexpanded. Only agglomerates of black char particles are observed (Figure 7).With FB500, the expanded shape is kept and the inside structure looks like afoamed cake (Figure 7). Even if the influence of zinc borate is not detectable onRHR curves, visual observation of the residues confirms that adding zinc borateto the intumescent permits the maintaince of the foamed expanded character ofthe intumescent structure.
24.4 ConclusionsZinc borate is an efficient synergistic agent in different combinations of flameretarded polymeric materials. Two concepts were evaluated: intumescenceand ceramic formation. In these two cases the LOI increases dramatically at1–3 wt% substitution in zinc borate, V-0 classification is achieved, and RHRmay be decreased.
The chemical composition of zinc borates may also play a part in the flam-mability properties of the materials. According to the presented results, we canpropose some rules to design a flame retarded polymer containing zinc borate assynergist:
• Low particle size to achieve good dispersion.• Between 1 and 5 wt% substitution of the main flame retardant by zinc
borate to get the highest LOI.• High dehydration/decomposition temperature to get the best efficiency and
to pass vertical tests.
24.5 References1. K.K. Shen, Plastics Compounding, 1988, Nov./Dec.2. K.K. Shen and D.F. Ferm, in Proceedings of Recent Advances in Flame Retardancy
of Polymeric Materials, M. Lewin (ed.), BCC Pub., Stamford, USA, 1997, Volume 8.
Figure 7 Cone calorimeter residues of formulations PP-melabis and PP-melabis/zincborate (total loading 30 wt% remains constant, 1 and 2 wt% zinc borate substi-tution compounded in a roller mixer at 200°C and 50 rpm)25

335Zinc Borates as Synergists for Flame Retarded Polymers
3. S. Bourbigot, M. Le Bras, R. Leeuwendal, K.K. Shen and D.M. Schubert, Polym.Deg. Stab., 1999, 64, 419.
4. F. Carpentier, S. Bourbigot, M. Le Bras and R. Delobel, Polym. Int., 2000, 49,1216.
5. S. Bourbigot, F. Carpentier and M. Le Bras, ACS Symposium Series N° 797,C.A. Wilkie and G.L. Nelson (eds.), American Chemical Society Pub., WashingtonDC, 2001, Chapter 14, pp. 173–185.
6. “Boric oxide, boric acid and borates”, in Ulmann’s Encyclopediaa of IndustrialChemistry, VCH, Munich, Germany, 1972, Volume A4, pp. 263–280.
7. http://www.boraxfr.com8. D.M. Schubert, F. Alam, M. Z. Visi and C.B. Knobler, Chem. Mater., 2003, 15,
866.9. F. Carpentier and S. Duquesne, unpublished results.
10. P.R. Hornsby and C.L. Watson, Plastic Rubber Process Applicat., 2003, 6, 169.11. F. Carpentier, PhD Thesis, University of Lille, France 2000.12. M. Le Bras, S. Bourbigot, F. Carpentier, R. Leeuwendal and D.M. Schubert,
Gummi Fasern Kunststoffe, 1998, 92, 972.13. G. Camino, L. Costa and L. Trossarelli, Polym. Degrad. Stab., 1985, 12, 213.14. R. Delobel, M. Le Bras, N. Ouassou and F. Alistiqsa, J. Fire Sci., 1990, 8(2), 85.15. S. Bourbigot, M. Le Bras and R. Delobel, J. Fire Sci., 1995, 13(1–2), 3.16. A.R. Horrocks, Polym. Deg. Stab., 1996, 54, 143.17. S. Zhang and A.R. Horrocks, J. Appl. Polym. Sci., 2003, 90(12), 3165.18. S. Bourbigot, M. Le Bras, S. Duquesne and M. Rochery, Macromol. Eng. Mater.,
2004, 289, 499.19. E. Chemin, Master Thesis, CNAM, Paris, France, 2001.20. S. Bourbigot, M. Le Bras, J.M. Trémillon, P. Bréant and R. Delobel, Fire Mater,
1996, 20, 145.21. D. Scharf, R. Nalepa and T. Wusu, Fire Safety J., 1992, 19(1), 103.22. S.V. Levchik, G.F. Levchik, G. Camino and L. Costa, J. Fire Sci., 1995, 13, 43.23. G.F. Levchik, S.V. Levchik, P.D. Sachok, A.F. Selevich, A.S. Lyakhov and
A.I. Lesnikovich, Thermochim. Acta, 1995, 257(1–2), 117.24. M. Jimenez, S. Duquesne and S. Bourbigot, unpublished results.25. S. Bourbigot, E. Chemin and M. Le Bras, Pli Soleau N° 38234 (5th March 1999).

336
CHAPTER 25
Fire Retardancy of EngineeringPolymer CompositesPÉTER ANNA,1 SZABOLCS MATKÓ,1
GYÖRGY MAROSI,1 GÁBOR NAGY,2 XAVIER ALMÉRAS3
AND MICHEL LE BRAS3
1Organic Chemical Technology Department, Budapest University ofTechnology and Economics, Müegyetem rkp.3, Budapest, H-1111, Hungary([email protected])2Polinvent Kft., Ady Endre út 59, H-1221 Budapest, Hungary3Perf, Upres Ea 1040, Ensc-lille,Ustl, F-59650 Villeneuve d’Ascq Cédex, France
25.1 IntroductionPolypropylene (PP) in reinforced and flame retarded form is considered as anengineering thermoplastic material appropriate to use, for example, in transpor-tation industry. It can be flame retarded with an ammonium polyphosphate(APP)–polyol intumescent flame retardant additive system efficiently;1 however,these systems have some limitations, such as limit of processing temperature,sensitivity to humidity,2 limited elongation.3 To eliminate these limitationsvarious trials were made to substitute the charring polyol compound withblocked derivatives of polyol,4 or derivatives of N-containing heterocycliccompounds.2 Recently, some heteroatom-containing oligomer5 and polymer,actually polycaproamide (PA 6)6,7 was suggested as charring component. PA 6fulfils the charring function, but does not satisfy the melt rheological andmechanical requirements. This chapter demonstrates, through flammability,mechanical and rheological measurements, that the mentioned requirementscan be influenced favourably further by incorporation of two-dimensionalfillers, such as talc and layered silicate, and ethylene vinylacetate copolymer inan appropriate sequence.
A special inorganic–organic polymer hybrid resin, known as ”3P resin”,prepared basically from polyisocyanate and polysilicic acid8 is already acommercial product. It has versatile applications, such as renovation ofpipelines, especially underground sewers made of concrete or reinforced
337Fire Retardancy of Engineering Polymer Composites
concrete,9 making impermeable the substruction of engineering constructiveworks lying under ground10 and special binding materials under wet condi-tions.11 Its favourable characteristics are good adhesion, weather resistance,flame-resistancy, and low cost. Some engineering applications were limited bylow flexural modulus and low strength, which could be improved by use of fiberreinforcement.12 The incorporation of reinforcing fibres, however, reduces theflame retardancy. The influence of a surface-treated aluminium trihydrate onthe flame ratardancy and the mechanical properties of this engineeringthermosetting polymer was also studied to extend its application field to thetransportation industry.
25.2 Experimental25.2.1 Components of Polypropylene CompoundsPolypropylene (PP) homopolymer, Tipplen H 535 (TVK, Hungary); Talc (T)FINTALC M 15 (Suomen Takki, Finnland), average particle diameter:15 µm, specific surface area: 7.2 m2 g−1; specific gravity: 2.7 g cm−3; Ethylenevinylacetate copolymer (EVA), IBUCELL K 100 (H.B. Fuller) vinyl acetatecontent 28%; Maleic anhydride grafted PP wax (PP-gMA), Licomont AR 504(Clariant); Polybutene intercalated nanoclay (Nano.clay) was prepared bydispersing organophilic montmorillonite, Bentone SD-1 (Rheox Inc.), in toluene(10 g for 400 ml) at room temperature during a steady mixing, followed byaddition of 5 g of polybutene (Hyvis 2000, Britsh Petrol) to the nano-clay disper-sion and, finally, after 3 hours, removing the solvent by vacuum distillation.13
25.2.2 Components of 3P CompositesMethylene-diphenyl-diisocyanate oligomer mixture, MDI L 30 E1 BorsodchemRt. Hungary); Na-water glass, Betol (Kemikal Építòanyagipari Vállalat,Hungary); Aluminium trihydrate (ATH), Alolt 8 (Ajka Timföld, Hungary);Basalt fibre (TOPLAN Tapolcai Bazaltgyapot Kft. Hungary); Aminosilanecoupling agent, Silan GF 91 (Wacker-Chemie Hungary Kft.).
Surface treatment of ATH was performed as follows: a solution containing20% amino silane coupling agent was prepared by use of ethanol solution con-taining 10% water. This solution was used for intensive wetting the ATH in aquantity that contained 1% coupling agent related to the ATH. After wetting,the system was agitated for a further 10 min, and then the solution wasevaporated at 105°C.
25.2.3 Compounding of Thermoplastic CompositesCompounds were prepared by homogenising the components for 10 min in themixing chamber 350 of a Brabender Plasti-Corder PL2000 with a rotor speed of50 rpm at 235°C. Sheets (100 × 100 × 3 mm3) were obtained by compressionmolding in a Collin P200E press at 170°C for PE and at 190°C for PP (pressure3 MPa).
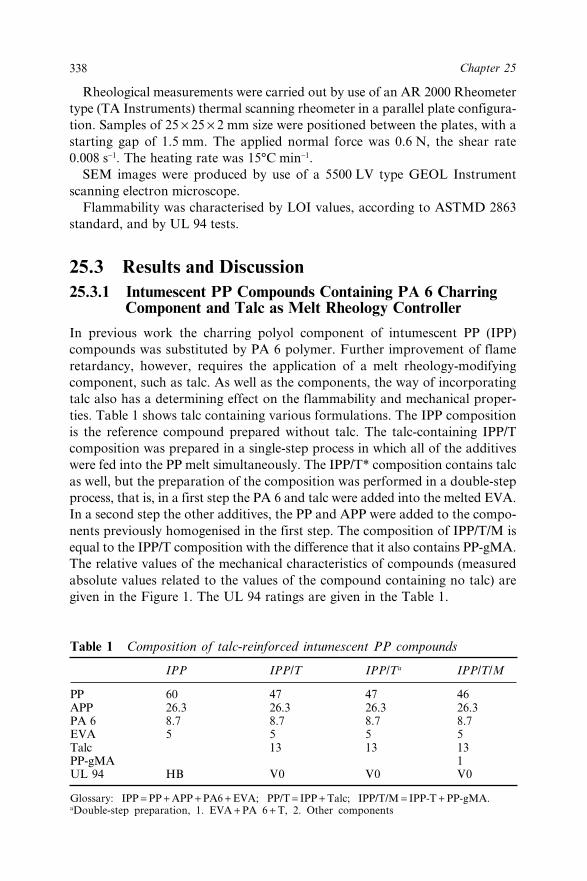
338 Chapter 25
Rheological measurements were carried out by use of an AR 2000 Rheometertype (TA Instruments) thermal scanning rheometer in a parallel plate configura-tion. Samples of 25 × 25 × 2 mm size were positioned between the plates, with astarting gap of 1.5 mm. The applied normal force was 0.6 N, the shear rate0.008 s−1. The heating rate was 15°C min−1.
SEM images were produced by use of a 5500 LV type GEOL Instrumentscanning electron microscope.
Flammability was characterised by LOI values, according to ASTMD 2863standard, and by UL 94 tests.
25.3 Results and Discussion25.3.1 Intumescent PP Compounds Containing PA 6 Charring
Component and Talc as Melt Rheology Controller
In previous work the charring polyol component of intumescent PP (IPP)compounds was substituted by PA 6 polymer. Further improvement of flameretardancy, however, requires the application of a melt rheology-modifyingcomponent, such as talc. As well as the components, the way of incorporatingtalc also has a determining effect on the flammability and mechanical proper-ties. Table 1 shows talc containing various formulations. The IPP compositionis the reference compound prepared without talc. The talc-containing IPP/Tcomposition was prepared in a single-step process in which all of the additiveswere fed into the PP melt simultaneously. The IPP/T* composition contains talcas well, but the preparation of the composition was performed in a double-stepprocess, that is, in a first step the PA 6 and talc were added into the melted EVA.In a second step the other additives, the PP and APP were added to the compo-nents previously homogenised in the first step. The composition of IPP/T/M isequal to the IPP/T composition with the difference that it also contains PP-gMA.The relative values of the mechanical characteristics of compounds (measuredabsolute values related to the values of the compound containing no talc) aregiven in the Figure 1. The UL 94 ratings are given in the Table 1.
Table 1 Composition of talc-reinforced intumescent PP compounds
IPP IPP/T IPP/Ta IPP/T/M
PP 60 47 47 46APP 26.3 26.3 26.3 26.3PA 6 8.7 8.7 8.7 8.7EVA 5 5 5 5Talc 13 13 13PP-gMA 1UL 94 HB V0 V0 V0
Glossary: IPP = PP + APP + PA6 + EVA; PP/T = IPP + Talc; IPP/T/M = IPP-T + PP-gMA.aDouble-step preparation, 1. EVA + PA 6 + T, 2. Other components

339Fire Retardancy of Engineering Polymer Composites
The IPP compound containing no talc shows moderate flame-retardantcharacter with 28% LOI value and a UL 94 rating of HB qualification. Thecompound has a high susceptibility for melt dripping. Incorporation of talc inthe composition by the single-step method, in composition IPP/T, improves theflame retardancy, but the mechanical properties, mainly the elongation atbreak, fall considerably. Preparing the compound by the double-step method,in composition IPP/T*, the flammability is not influenced, the elongation atbreak increases and the strength improves, achieving a higher value than thecompound without talc.
Figure 2 compares the apparent viscosity of the compounds, which means themelt viscosity at lower temperature, and the visco-elastic behaviour of the charat high temperature, as reported earlier.14
The viscosity of the melted compounds in the temperature range 180–270°C isstrongly increased by the incorporation of the talc independently of the mode ofcompounding. This viscosity increase effect reduces the dripping susceptibilityof the compounds during the ignition process. The presence of talc also increasesthe visco-elastic modulus of charred foam formed in the burning phase, improv-ing the durability of the burning surface. Both effects manifest improved flameretardancy.
The improvement of mechanical properties of the compound prepared by thedouble-step process compared to the single-step one can be explained by differ-ent phase structures. It is more advantageous if a phase consisting of EVA, talcand PA 6 is dispersed in the PP + APP phase (double-step process) than thecompounds prepared by the single-step mode, in which there is poor directinteraction between PP and talc.
The IPP/T/M compound containing talc and an adhesion promoter showssimultaneous improvement of flame-retardancy and mechanical properties. The
Figure 1 Mechanical and flammability characteristics of intumescent PP compoundsprepared with different compounding technologies

340 Chapter 25
favourable effect of talc on the flame-retardancy can be explained as discussedabove. The improvement of the mechanical properties is a consequence of theimproved interaction between the components, especially between the talc andPP matrix, as demonstrated in Figure 3.
The broken surface of the compound prepared without adhesion promoter(3/A in Figure 3) contains talc in the form of discrete particles, and holesremained in the place of the removed talc particles. In the presence of theadditive (3/B in Figure 3), however, nearly perfect embedding of talc can beobserved.
Figure 2 Apparent viscosity of various IPP compounds measured by thermal scanningrheometer
Figure 3 SEM image of talc-reinforced intumescent PP compound prepared without andwith interfacial additive

341Fire Retardancy of Engineering Polymer Composites
25.3.2 Intumescent PP Compounds Containing PA 6Charring Component and Nano-Clay as MeltRheology Controller
The influence of polymer intercalated nano-clay on the flammability character-istics of IPP was studied by comparing the characteristics of compositions givenin Table 2. The composition of IPP is the same as given in Table 1. IPP + Nconsists of intumescent components and 2% polymer-intercalated nano-clayprepared by the single-step compounding mode, while the IPP + N* compositionwas prepared by the double-step mode. The LOI, relative strength andelongation are given in Figure 4. The UL 94 rating is given in Table 2.
Incorporation of the nano-clay in the IPP compound by the single modeincreases the LOI from 28 to 32, but this is not enough to improve the UL 94rating. Incorporation of nano-clay into the compound influences the relativestrength to a negligible degree but the relative elongation is considerablyaltered. The elongation increase effect can be attributed to the elastomer contentof the intercalated nano-clay.
Table 2 Nano-clay containing intumescent PP composites
IPP IPP+N IPP+N*a
PP 60 58 58APP 26.25 26.25 26.25PA 6 8.75 8.75 8.75EVA24 5 5 5Nano-clay 2 2UL 94 HB HB V0
Glossary: IPP = PP + APP + PA 6; IPP-N = IPP + Nano clay. a(Double-step preparation, 1.EVA + PA 6 + Nano clay, 2. Other components)
Figure 4 Mechanical and flammability characteristics of nano-clay containing intumes-cent PP composites prepared by single- and double-step compounding

342 Chapter 25
Incorporation of the nano-clay by the double-step mode hardly affects themechanical properties and the LOI, but a change can be observed in the UL 94rating, as the compound achieves the V0 grade. This unexpected phenomenoncan be explained on the basis of the rheological test of the compounds given inFigure 5.
Incorporation of the nano-clay by the double-step mode increases the meltviscosity of the compound in the temperature range 190–270°C considerably,reducing the melt dripping of the compound. This melt viscosity increase effectseems to be enough to improve the UL 94 rating. As the amount of appliednano-clay is small, the mechanical properties do not deteriorate, and theapplication of an adhesion promoter (PP-gMA) is not necessary.
One can conclude that good intumescent PP compounds can be formed fromPP-PA 6 components if rheology controlling additives and double-stepcompounding technology are applied.
25.3.3 Flame Retarded and Basalt Fibre ReinforcedThermosetting Polymer (3P) Composites
Isocyanate-silicic acid based 3P resin is a fireproof material but the incorpora-tion of reinforcing, such as basalt fibers, reduces the flame retardancy of thecomposite. The basalt fiber used in the experiments was a short fibre, preparedwith the so-called Junkers technology (Figure 6). The melted basalt rock flowson the rapidly rotating spinning head, which spreads the thin, melt trips in thecooling air, where they solidify to short fibres.
The form of the primary fibres can be seen in Figure 7/A, and aftersome refining treatment in Figure 7/B. The refined fibre15 was used for theexperiments.
Figure 5 Apparent viscosity of intumescent PP compounds containing nano-clayincorporated by single- and double-step modes
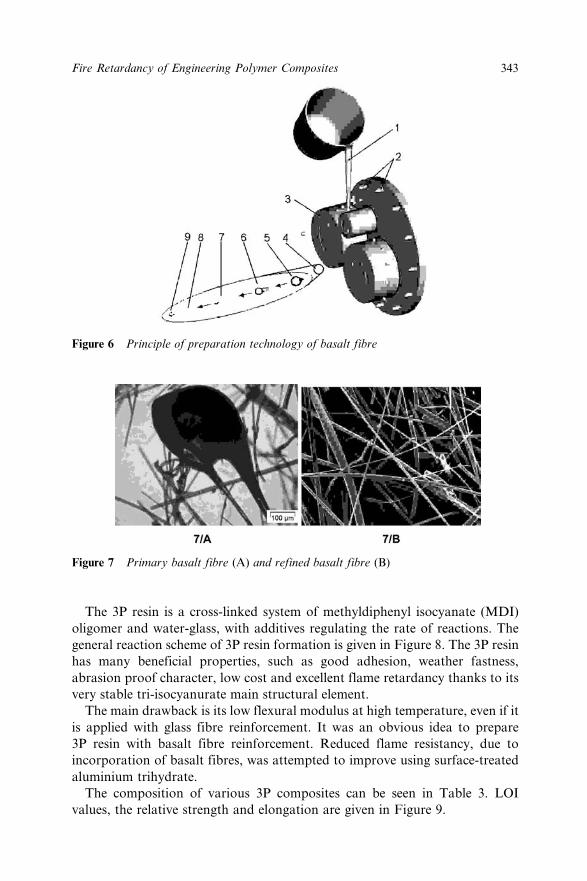
343Fire Retardancy of Engineering Polymer Composites
The 3P resin is a cross-linked system of methyldiphenyl isocyanate (MDI)oligomer and water-glass, with additives regulating the rate of reactions. Thegeneral reaction scheme of 3P resin formation is given in Figure 8. The 3P resinhas many beneficial properties, such as good adhesion, weather fastness,abrasion proof character, low cost and excellent flame retardancy thanks to itsvery stable tri-isocyanurate main structural element.
The main drawback is its low flexural modulus at high temperature, even if itis applied with glass fibre reinforcement. It was an obvious idea to prepare3P resin with basalt fibre reinforcement. Reduced flame resistancy, due toincorporation of basalt fibres, was attempted to improve using surface-treatedaluminium trihydrate.
The composition of various 3P composites can be seen in Table 3. LOIvalues, the relative strength and elongation are given in Figure 9.
Figure 6 Principle of preparation technology of basalt fibre
Figure 7 Primary basalt fibre (A) and refined basalt fibre (B)
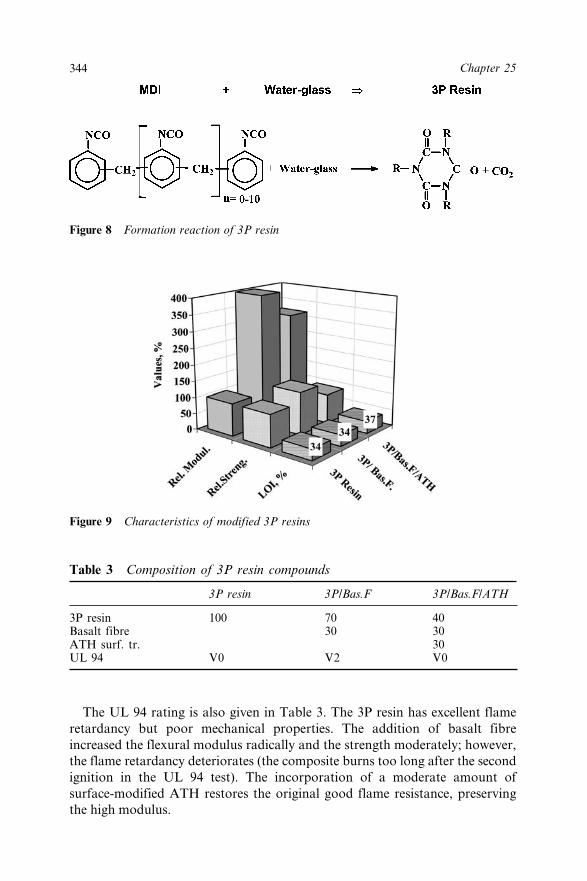
344 Chapter 25
The UL 94 rating is also given in Table 3. The 3P resin has excellent flameretardancy but poor mechanical properties. The addition of basalt fibreincreased the flexural modulus radically and the strength moderately; however,the flame retardancy deteriorates (the composite burns too long after the secondignition in the UL 94 test). The incorporation of a moderate amount ofsurface-modified ATH restores the original good flame resistance, preservingthe high modulus.
Figure 9 Characteristics of modified 3P resins
Table 3 Composition of 3P resin compounds
3P resin 3P/Bas.F 3P/Bas.F/ATH
3P resin 100 70 40Basalt fibre 30 30ATH surf. tr. 30UL 94 V0 V2 V0
Figure 8 Formation reaction of 3P resin

345Fire Retardancy of Engineering Polymer Composites
The appropriate combination of the known components of compositematerials and efficient FR additives may result in contemporary new compositeformulations meeting the requirements of the strict environment regulation,finding application as flame and sound protection covers in publictransportation vehicles.
25.4 ConclusionThe influence of a micro- and a nano-sized fillers on the flammability andmechanical properties of polypropylene based thermoplastic and isocyanate-silicic acid based (3P) thermosetting polymer systems have been investigated.Intumescent flame retardant polypropylene compound can be preparedusing ammonium polyphosphate as acid source, polyamide as char-formingcomponent, ethylene vinylacetate copolymer and talc or thermoplastic polymerintercalated nano-clay as rheology controlling additive; however, the mechani-cal properties for some applications are not satisfactory in all respect. The appli-cation of a double-step compounding technology, that is, the homogenisationfirst of the ethylene vinylacetate, polyamide and the rheology modifying addi-tives, followed by the dispersing of these blends is polypropylene-ammoniumpolyphosphate system, resulted in improved flame-retardancy and mechanicalproperties. Application of maleic anhydride grafted polypropylene wax in atalc-containing system brought improvement by the single-step compoundingtechnology. The isocyanate-silicic acid system is a fireproof resin; however, theincorporated basalt fibrous reinforcing filler reduces the flame retardancy.Incorporation of an aminosilane surface treated aluminium trihydrate togetherwith basalt fibre guarantees the flame retardancy and the improvement ofmechanical properties simultaneously.
25.5 AcknowledgementThis work has been financially supported by the Ministry of Education Hungarythrough projects Széchenyi OM-00169/2001, 3A/0036/2002 and by the Hungar-ian Research Fund through project OTKA T026182. The scholarship fromIKMA foundation is also acknowledged.
This work was also partially supported by the European project FLAMERET(“New Surface Modified Flame Retarded Polymeric Systems to Improve Safetyin Transportation and Other Areas” registered under No. G5RD-CT-1999-00120).
25.6 References1. G. Camino, L. Costa, L. Trossarelli and G. Landoni, Polym. Degrad.
Stab., 1984, 8, 13.2. I. Kouji and T. Ryoji, “Flame-retardant thermoplastic composition”, JP
154302.93; EP 0 627 460 A1, 1994.
346 Chapter 25
3. Gy. Bertalan, Gy. Marosi, P. Anna, L. Vigh, K. Szentirmai and G. Budai,“Flame-retardant, self-extinguishing polyolefine composition”, Hung. Pat.209 135, 1993.
4. M. Sicken and W. Wanczke, “Fire retardant polymer compositions withincreased stability”, EP 0 584 567 A3 (02.03.1994).
5. P. Anna, Gy. Bertalan, Gy. Marosi, M. Márton and E. Zimonyi, “Flameretardant additive for polymer compounds with improved hydro-thermalstability”, German Patent Application, R4700/2003.
6. M. Le Bras and S. Bourbigot, in “Fire and Polymers, Materials andSolution for Hazard Prevention”, G.L. Nelson and C.A. Wilkie (eds.), ASCSymp. Ser. 797, Washington DC, 2001, pp. 136–149.
7. X. Almeras, M. Le Bras, P. Hornsby, S. Bourbigot, Gy. Marosi, S. Keszeiand F. Poutch, Polym. Degrad. Stab., 2003, 82, 325–331.
8. G. Nagy, “Materials composites and foams made from polysilicic acid andpolyisocyanate, and process for producing them”, WO 9221713.
9. G. Nagy, Procedure for the repair and/or renovation of pipelines, espe-cially underground and sewers made of concrete or reinforced concrete,Aus. Pat. 2311900.
10. G. Nagy, “Process for making impermeable the engineering constructiveworks laid under the ground by filling up method”, Hung. Pat. 71910.
11. G. Nagy, “Polysilicic acid/polyisocyanate basic material materials,binding materials and foams and process for preparing them”, US Pat.5622999.
12. G. Nagy, “Structure for introducing a system of light fibres”, Pol. Pat. 329435.
13. A. Usuki, M. Kato, A. Okada and T. Kurauchi, J. Appl. Polym. Sci.,1997, 63, 137–139.
14. P. Anna, Gy. Marosi, I. Csontos, S. Bourbigot, M. Le Bras andR. Delobel, Polym. Degrad. Stab., 2001, 74, 423–426.
15. Sz. Matkó, P. Anna, Gy. Marosi, A. Szép, S. Keszei, T. Czigány andK. Pölöskei, Macromol. Symp., 2003, 202, 255–267.

347
CHAPTER 26
Flame Retardant MechanismsFacilitating Safety inTransportationGYÖRGY MAROSI,1 SÁNDOR KESZEI,1 ANDREAMÁRTON,1 ANDREA SZÉP,1 MICHEL LE BRAS,2
RENÉ DELOBEL2 AND PETER HORNSBY3
1Budapest University of Technology and Economics, Department of OrganicChemical Technology H-1111 Budapest, Mûegyetem rkp. 3, Hungary([email protected])2PERF, Ecole Nationale Superieure de Chimie Lille, USTL, F-59652Villeneuve d’Ascq Cédex, France3Brunel University Kingston Lane, Uxbridge, Middlesex, UB8 3PHUnited Kingdom
26.1 IntroductionPolymeric materials used in the field of transportation have increased by 120%during the last 20 years. The stock of buses and coaches in Europe is almost thedouble (∼600,000) their number of the 1970s. This increase, however, has notbeen accompanied with a consideration of fire safety issues, because severeprice-competition does not allow assigning additional budget for fire safety.Directive 95/28/EC of the European Parliament (24 October 1995) determinedthe requirement for the “Burning behavior of materials used in the interiorconstruction of certain categories of motor vehicle” limiting the “HorizontalBurning Rate” to 60 mm min−1, which is a very weak category and only slightlybetter than the 102 mm min−1 limit in the USA. The relevant standards are givenin Table 1. The low level of fire safety requirements play a determining role inthe increasing number of fatalities accompanying a fire.
Table 2 shows that in 2000 20% of all fires were vehicle fires in the USA,while more than 10% of fire death and property losses were in connection withvehicles. The increase compared to 1995 is also considerable.
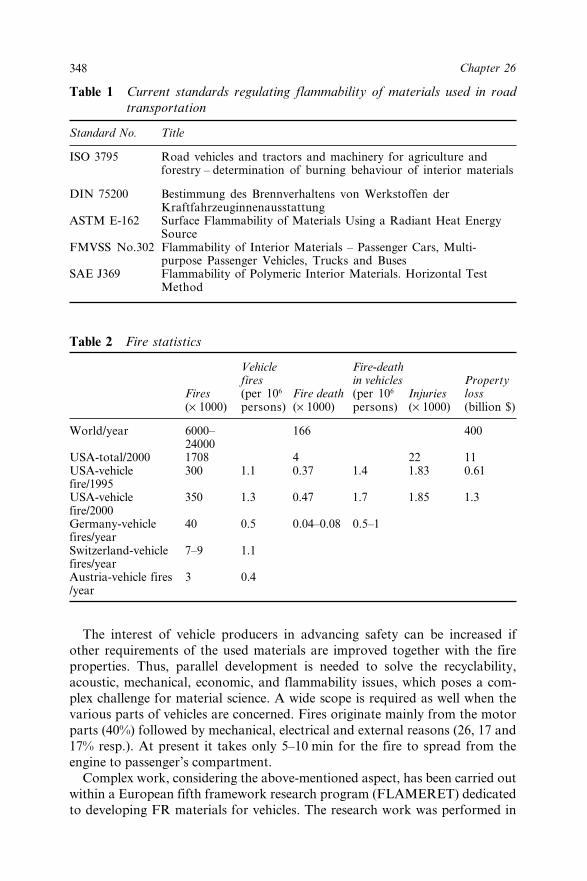
348 Chapter 26
The interest of vehicle producers in advancing safety can be increased ifother requirements of the used materials are improved together with the fireproperties. Thus, parallel development is needed to solve the recyclability,acoustic, mechanical, economic, and flammability issues, which poses a com-plex challenge for material science. A wide scope is required as well when thevarious parts of vehicles are concerned. Fires originate mainly from the motorparts (40%) followed by mechanical, electrical and external reasons (26, 17 and17% resp.). At present it takes only 5–10 min for the fire to spread from theengine to passenger’s compartment.
Complex work, considering the above-mentioned aspect, has been carried outwithin a European fifth framework research program (FLAMERET) dedicatedto developing FR materials for vehicles. The research work was performed in
Table 1 Current standards regulating flammability of materials used in roadtransportation
Standard No. Title
ISO 3795 Road vehicles and tractors and machinery for agriculture andforestry – determination of burning behaviour of interior materials
DIN 75200 Bestimmung des Brennverhaltens von Werkstoffen derKraftfahrzeuginnenausstattung
ASTM E-162 Surface Flammability of Materials Using a Radiant Heat EnergySource
FMVSS No.302 Flammability of Interior Materials – Passenger Cars, Multi-purpose Passenger Vehicles, Trucks and Buses
SAE J369 Flammability of Polymeric Interior Materials. Horizontal TestMethod
Table 2 Fire statistics
Vehicle Fire-deathfires in vehicles Property
Fires (per 106 Fire death (per 106 Injuries loss(× 1000) persons) (× 1000) persons) (× 1000) (billion $)
World/year 6000– 166 40024000
USA-total/2000 1708 4 22 11USA-vehicle 300 1.1 0.37 1.4 1.83 0.61fire/1995USA-vehicle 350 1.3 0.47 1.7 1.85 1.3fire/2000Germany-vehicle 40 0.5 0.04–0.08 0.5–1fires/yearSwitzerland-vehicle 7–9 1.1 fires/yearAustria-vehicle fires 3 0.4 /year

349Flame Retardant Mechanisms Facilitating Safety in Transportation
cooperation of the author’s institutes, their industrial partners (MAL aluminumtrihydroxide producing comp., PEMÜ plastic processing comp., RATI caraccessories producing comp., RÁBA–Mór vehicle seat producing comp. inHungary and Clariant in Germany), textile institutes (GEMTEX-France, Natu-ral Fiber Institute of Poland), a quality control institute (EMI, Hungary) anduser companies (IRISBUS and NABI bus producers in Hungary, BombardierTransportation). The project focused on surface/interface modification consider-ing an early patent of BUTE,1 which applied the Buzágh–Ostwald principle2
for the first time to polymer systems. (According to this principle the interphasesin heterogeneous disperse systems should allow a continuous, harmonic transi-tion between the phases.) However, in flame retarded (FR) polymers the phasestructure to be modified and its temperature dependence is quite complex. Addi-tionally to the modification of the interfaces around the dispersed particles, thesurface (to be contacted with the fire), and in some cases sandwich layers, hasto be altered as well. The aims are also more complex, including stabilization(fire, hydrolytic, or photooxidative), controlling the rheology, the charring,promoting the accumulation of FR additives on the surface at high temperature,formation of barrier layer and preserving the mechanical properties by reactivecoupling of phases.
The polymers used in vehicles inside should not contain halogen, thus thephosphorus compounds and metal hydroxides are preferred as flame retardants.The formation of intumescent flame retardant systems combining acid sourceand charring components is one promising route.3 Various such systems havebeen proposed but their positive effect is mostly accompanied with certain dis-advantages, such as stability or processability problems.4 Nanocomposite-typethermoplastic polymers belong to the most thoroughly studied materials inrecent years. Mechanical properties and flame retardancy were improved due tointroduction of nanoparticles at low concentration.5 However, despite theirpromising effect in reducing the rate of heat release in most polymer systems,clay nanoparticles alone do not act as real fire retardant additives.5,6 Moresignificant advancement is expected when nanoparticles are combined withother flame retardant additives. Migration of the particles to the surfacefollowed by formation of a protective layer is the potential mechanism thatexplains how the nanoparticles could contribute to the effect of other flameretardants.7–9 Depending on the composition the combined systems show eithera synergistic effect or less advantageous characteristics.5,10 In intumescentsystems, for example, the introduction of nanoparticles may cause a positive ornegative change, depending on the composition, compounding technology andtype of testing method. Understanding the reason behind these differences maycontribute to knowledge about the mechanism of fire retardancy.
In this chapter materials developed for forming internal panels and noiseinsulating sheets for vehicles are discussed. These contain intumescent flameretardant (IFR) systems interacting with montmorillonite-type clay nanopa-rticles and BaSO4 combined with metal hydroxides or IFR respectively. Basedon structure–property relationship of nanocomposites two methods are proposedfor promoting the formation of a protective layer on the surface. Further results
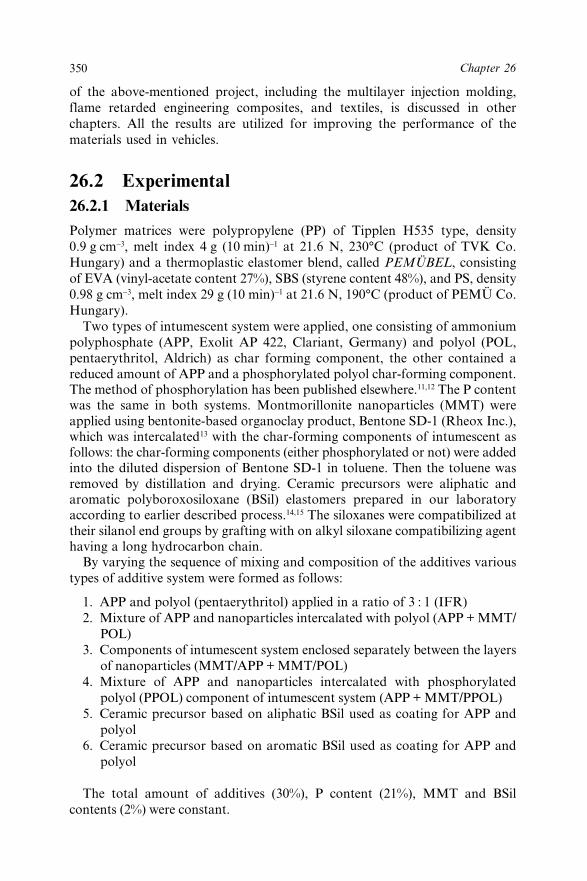
350 Chapter 26
of the above-mentioned project, including the multilayer injection molding,flame retarded engineering composites, and textiles, is discussed in otherchapters. All the results are utilized for improving the performance of thematerials used in vehicles.
26.2 Experimental26.2.1 Materials
Polymer matrices were polypropylene (PP) of Tipplen H535 type, density0.9 g cm−3, melt index 4 g (10 min)−1 at 21.6 N, 230°C (product of TVK Co.Hungary) and a thermoplastic elastomer blend, called PEMÜBEL, consistingof EVA (vinyl-acetate content 27%), SBS (styrene content 48%), and PS, density0.98 g cm−3, melt index 29 g (10 min)−1 at 21.6 N, 190°C (product of PEMÜ Co.Hungary).
Two types of intumescent system were applied, one consisting of ammoniumpolyphosphate (APP, Exolit AP 422, Clariant, Germany) and polyol (POL,pentaerythritol, Aldrich) as char forming component, the other contained areduced amount of APP and a phosphorylated polyol char-forming component.The method of phosphorylation has been published elsewhere.11,12 The P contentwas the same in both systems. Montmorillonite nanoparticles (MMT) wereapplied using bentonite-based organoclay product, Bentone SD-1 (Rheox Inc.),which was intercalated13 with the char-forming components of intumescent asfollows: the char-forming components (either phosphorylated or not) were addedinto the diluted dispersion of Bentone SD-1 in toluene. Then the toluene wasremoved by distillation and drying. Ceramic precursors were aliphatic andaromatic polyboroxosiloxane (BSil) elastomers prepared in our laboratoryaccording to earlier described process.14,15 The siloxanes were compatibilized attheir silanol end groups by grafting with on alkyl siloxane compatibilizing agenthaving a long hydrocarbon chain.
By varying the sequence of mixing and composition of the additives varioustypes of additive system were formed as follows:
1. APP and polyol (pentaerythritol) applied in a ratio of 3 : 1 (IFR)2. Mixture of APP and nanoparticles intercalated with polyol (APP + MMT/
POL)3. Components of intumescent system enclosed separately between the layers
of nanoparticles (MMT/APP + MMT/POL)4. Mixture of APP and nanoparticles intercalated with phosphorylated
polyol (PPOL) component of intumescent system (APP + MMT/PPOL)5. Ceramic precursor based on aliphatic BSil used as coating for APP and
polyol6. Ceramic precursor based on aromatic BSil used as coating for APP and
polyol
The total amount of additives (30%), P content (21%), MMT and BSilcontents (2%) were constant.
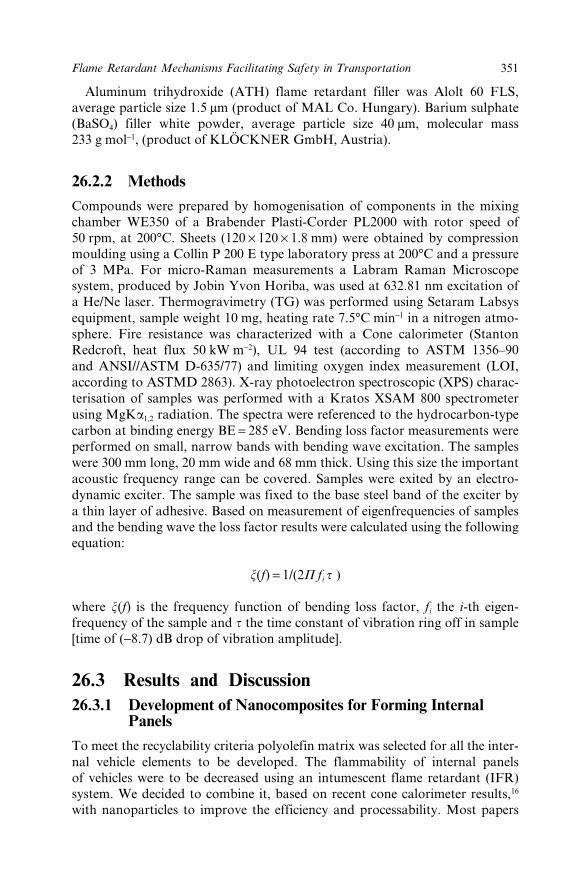
351Flame Retardant Mechanisms Facilitating Safety in Transportation
Aluminum trihydroxide (ATH) flame retardant filler was Alolt 60 FLS,average particle size 1.5 µm (product of MAL Co. Hungary). Barium sulphate(BaSO4) filler white powder, average particle size 40 µm, molecular mass233 g mol−1, (product of KLÖCKNER GmbH, Austria).
26.2.2 Methods
Compounds were prepared by homogenisation of components in the mixingchamber WE350 of a Brabender Plasti-Corder PL2000 with rotor speed of50 rpm, at 200°C. Sheets (120 × 120 × 1.8 mm) were obtained by compressionmoulding using a Collin P 200 E type laboratory press at 200°C and a pressureof 3 MPa. For micro-Raman measurements a Labram Raman Microscopesystem, produced by Jobin Yvon Horiba, was used at 632.81 nm excitation ofa He/Ne laser. Thermogravimetry (TG) was performed using Setaram Labsysequipment, sample weight 10 mg, heating rate 7.5°C min−1 in a nitrogen atmo-sphere. Fire resistance was characterized with a Cone calorimeter (StantonRedcroft, heat flux 50 kW m−2), UL 94 test (according to ASTM 1356–90and ANSI//ASTM D-635/77) and limiting oxygen index measurement (LOI,according to ASTMD 2863). X-ray photoelectron spectroscopic (XPS) charac-terisation of samples was performed with a Kratos XSAM 800 spectrometerusing MgKa1,2 radiation. The spectra were referenced to the hydrocarbon-typecarbon at binding energy BE = 285 eV. Bending loss factor measurements wereperformed on small, narrow bands with bending wave excitation. The sampleswere 300 mm long, 20 mm wide and 68 mm thick. Using this size the importantacoustic frequency range can be covered. Samples were exited by an electro-dynamic exciter. The sample was fixed to the base steel band of the exciter bya thin layer of adhesive. Based on measurement of eigenfrequencies of samplesand the bending wave the loss factor results were calculated using the followingequation:
j(f) = 1/(2P fi t )
where j(f) is the frequency function of bending loss factor, fi the i-th eigen-frequency of the sample and t the time constant of vibration ring off in sample[time of (−8.7) dB drop of vibration amplitude].
26.3 Results and Discussion26.3.1 Development of Nanocomposites for Forming Internal
Panels
To meet the recyclability criteria polyolefin matrix was selected for all the inter-nal vehicle elements to be developed. The flammability of internal panelsof vehicles were to be decreased using an intumescent flame retardant (IFR)system. We decided to combine it, based on recent cone calorimeter results,16
with nanoparticles to improve the efficiency and processability. Most papers

352 Chapter 26
published on the reduction of heat release rate (RHR) explain this effect with theformation of a protecting layer of nanoparticles on the surface. The drivingforce for the migration of nanoparticles to the surface is, however, not clarifiedyet. To get a better insight into this mechanism, before applying nanocom-posites in the vehicles, a series of model systems of different structure wereformed (as given in the Experimental part).
Differences in the level of homogeneity of the samples may affect the compa-rison. A Raman microscope was used to check the homogeneity of dispersion ofnanoparticles and other components in the system. Raman spectra of pure andorganophilic MMT are given in Figure 1. As the strongest peak of organophilicMMT overlap with peaks of PP the characteristic bands at wavenumbers 700,1600 and 3600 could be used for identification. The structure was not exfoliated,but the dispersion was equally homogeneous for all samples.
Screening of the flame retardant effect of systems with similar compositionbut with a wide variety of structures was made using LOI and UL94 tests. Theresults are given in Figure 2.
Based on the results one can conclude that the combination of nanoparticleswith an intumescent flame retardant system affects the performance significantly.Separate modification of the acid source (APP) and the charring component(POL) with nanoparticles leads to a decline of flame retardant characteristics.In this system the nanoparticles probably separate the components, therebyhindering the charring process. The same nanoparticles, however, may causeconsiderable improvement, especially when the nanoparticles are intercalatedwith P-containing polyol (which is in fact a complete intumescent system). Two
Figure 1 Raman spectra of pure and organophilic montmorillonite compared with PP

353Flame Retardant Mechanisms Facilitating Safety in Transportation
types of boroxosiloxanes (BSil) proved to be effective synergists as well. Theresults suggest new mechanisms for improving fire retardancy.
26.3.2 New Mechanisms for Delivering FR Components to theSurface
1. Comparing the TG curves of nanoparticles intercalated with phosphory-lated and non-phosphorylated polyol in Figure 3, shows much earlierdecomposition in the former case. This means that with phosphorylatedpolyol the action of flame retardant starts with gas formation betweenlayers of MMT, thereby separating the layers, and the formed gas bubblestend to move out from the bulk, driving the nanoparticles to the surface.The polymer matrix is protected this way in a very early phase. The inter-calated system, due to similarities with the mechanism of expandablegraphite, can be called an expandable nanocomposite (ENC). This mech-anism seems to result in the best flame retardant efficiency among thecompared nanocomposites.
2. There are other two samples in Figure 2 that reached the V0 level. Thesecontain BSil additive that is, according to recent papers, a ceramic precur-sor, forming a durable protective (barrier) layer on the surface of flame-damaged material.17 It was pointed out earlier that such additives forman interlayer around APP particles and promote, in the case of fire, itsmigration to the surface. This migration may occur, however, even atlower temperature if the adhesion energy between the interlayer andpolyolefin matrix is lower than the cohesion energy (Wa<Wc) causingphase separation. In contrast a compatible interlayer (when Wa>Wc)
Figure 2 Comparison of flame retardancy of various model systems (compositions ofsamples are given in the Experimental part)

354 Chapter 26
promotes the homogeneity, but presents no driving force for migration athigh temperature. The solution was the grafting of a surfactant typemolecule into the interlayer (as described in the Experimental part), whichacts as a compatibilizing segment under common processing circum-stances but decomposes at the temperature of fire, initiating the accumu-lation of FR additives on the surface. Such an interlayer is defined asan ‘adaptive interphase’ (AIP) that is able to react to the change of itsenvironment.
Investigation of the three V0 samples in a cone calorimeter gave a chance tocompare the two ways for formation of barrier layers. The cone calorimeterplots are given in Figure 4, where the unmodified intumescent system is depictedas reference.
Nanoparticles and both types of the BSil caused a considerable decrease anddelay in RHR peaks compared to the simple APP-polyol system. Interestingly,to see the ignition range of the curve of nanocomposite sample (APP + MMT/PPOL) starts with needle-like peak, after which the RHR value becomes zero foralmost a one minute period. This supports the above-described mechanismabout the formation of a barrier layer at the beginning of fire action. Comparingthe three samples the run of the RHR curve of nanocomposite sample is similarto aliphatic BSil, while the aromatic ceramic precursor gives somewhat betterresults. The aromatic and aliphatic ceramic precursors differ due to the higherthermal and mechanical stability of the surface layer formed in the presence ofthe aromatic one.
The surface composition of the FR polymers in the presence of MMT andaromatic BSil was detected by XPS (Figure 5).
Figure 3 Weight loss–temperature plots of nanoparticles intercalated with polyol andwith phosphorylated polyol

355Flame Retardant Mechanisms Facilitating Safety in Transportation
The data show that the P concentration on the surface of the BSil-containingIFR system at 25°C is about the detectable limit, but the amount of Si atoms isconsiderably higher, suggesting undesirable migration at low temperature.Compatibilized interlayer (mBSil) and phosphorylated polyol intercalated
Figure 4 RHR curves of IFR-PP systems containing nanoparticles intercalated withphosphorylated polyol and ceramic precursors (BSil) compared to unmodifiedIFR-PP
Figure 5 Concentration of silicon and phosphorus atoms on the surface of various flameretarded samples at ambient and elevated temperatures, determined by XPSanalysis (compositions of samples are given in the Experimental part)
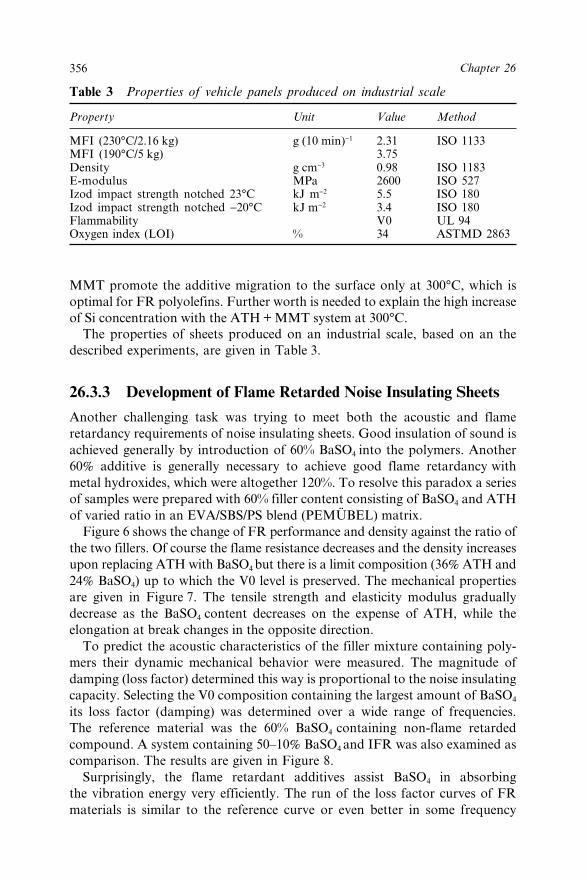
356 Chapter 26
MMT promote the additive migration to the surface only at 300°C, which isoptimal for FR polyolefins. Further worth is needed to explain the high increaseof Si concentration with the ATH + MMT system at 300°C.
The properties of sheets produced on an industrial scale, based on an thedescribed experiments, are given in Table 3.
26.3.3 Development of Flame Retarded Noise Insulating Sheets
Another challenging task was trying to meet both the acoustic and flameretardancy requirements of noise insulating sheets. Good insulation of sound isachieved generally by introduction of 60% BaSO4 into the polymers. Another60% additive is generally necessary to achieve good flame retardancy withmetal hydroxides, which were altogether 120%. To resolve this paradox a seriesof samples were prepared with 60% filler content consisting of BaSO4 and ATHof varied ratio in an EVA/SBS/PS blend (PEMÜBEL) matrix.
Figure 6 shows the change of FR performance and density against the ratio ofthe two fillers. Of course the flame resistance decreases and the density increasesupon replacing ATH with BaSO4 but there is a limit composition (36% ATH and24% BaSO4) up to which the V0 level is preserved. The mechanical propertiesare given in Figure 7. The tensile strength and elasticity modulus graduallydecrease as the BaSO4 content decreases on the expense of ATH, while theelongation at break changes in the opposite direction.
To predict the acoustic characteristics of the filler mixture containing poly-mers their dynamic mechanical behavior were measured. The magnitude ofdamping (loss factor) determined this way is proportional to the noise insulatingcapacity. Selecting the V0 composition containing the largest amount of BaSO4
its loss factor (damping) was determined over a wide range of frequencies.The reference material was the 60% BaSO4 containing non-flame retardedcompound. A system containing 50–10% BaSO4 and IFR was also examined ascomparison. The results are given in Figure 8.
Surprisingly, the flame retardant additives assist BaSO4 in absorbingthe vibration energy very efficiently. The run of the loss factor curves of FRmaterials is similar to the reference curve or even better in some frequency
Table 3 Properties of vehicle panels produced on industrial scale
Property Unit Value Method
MFI (230°C/2.16 kg) g (10 min)−1 2.31 ISO 1133MFI (190°C/5 kg) 3.75Density g cm−3 0.98 ISO 1183E-modulus MPa 2600 ISO 527Izod impact strength notched 23°C kJ m−2 5.5 ISO 180Izod impact strength notched −20°C kJ m−2 3.4 ISO 180Flammability V0 UL 94Oxygen index (LOI) % 34 ASTMD 2863
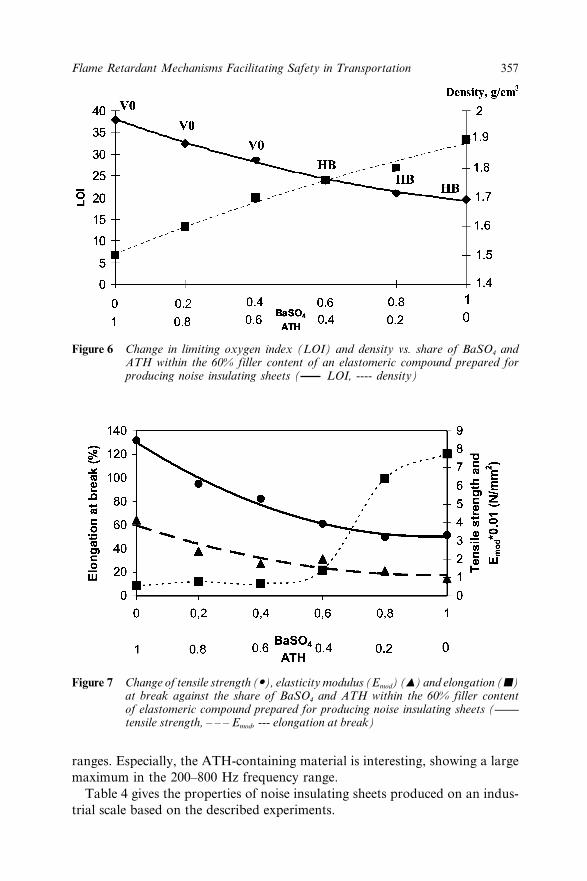
357Flame Retardant Mechanisms Facilitating Safety in Transportation
ranges. Especially, the ATH-containing material is interesting, showing a largemaximum in the 200–800 Hz frequency range.
Table 4 gives the properties of noise insulating sheets produced on an indus-trial scale based on the described experiments.
Figure 6 Change in limiting oxygen index (LOI) and density vs. share of BaSO4 andATH within the 60% filler content of an elastomeric compound prepared forproducing noise insulating sheets ( LOI, ---- density)
Figure 7 Change of tensile strength (�), elasticity modulus (Emod) (+) and elongation (�)at break against the share of BaSO4 and ATH within the 60% filler contentof elastomeric compound prepared for producing noise insulating sheets (——tensile strength, – – – Emod, --- elongation at break)

358 Chapter 26
26.4 ConclusionsMaterials to be used in the vehicle industry should meet a complex set ofrequirements. Combined additive systems are used for this purpose. The efficiencyof combined flame retardant/filler systems depends on the components, com-position and structure. To produce internal panels on an industrial scale, intu-mescent flame retardants were combined with montmorillonite clay mineral.Considerable improvement was found when P and polyol (for example phosphory-lated polyol) were intercalated together between the nanolayers of the clay, whileisolation of the components of an intumescent additive system from each otherby nanolayers resulted in decreased performance. Intercalated intumescentadditives initiate an early formation of gases between the nanolayers, separatingand driving them to the surface. Consequently, there is no need for exfoliationat the temperature of processing in the case of flame retarded nanocomposites –a quick flame initiated exfoliation can be efficient. The protective effect achievedthis way is comparable with the effect of compatibilized boroxosiloxane ceramicprecursors, which tend to accumulate on the surface upon heat treatment.
Figure 8 Frequency function of loss factor of elastomeric compound (PEMUBEL, see inExperimental part) containing different filler mixtures (60% total amount)
Table 4 Properties of noise insulating sheets produced on an industrial scale
Property Unit Value Method
Oxygen index (LOI) % 30 ASTMD 2863Flammability V0 UL 94Horizontal burning rate mm min−1 0 ISO 3795Density g cm−3 1.52 ISO 1183Tensile strength N mm−2 8.48 ASTM 638Elongation at break % 8.53 ASTM 638Tensile modulus N mm−2 413 ISO 527

359Flame Retardant Mechanisms Facilitating Safety in Transportation
Aromatic boroxosiloxane elastomer proved to be a better ceramic precursor thanthe aliphatic one.
To develop noise insulating sheets of high flame retardancy level, BaSO4
filler was combined with metal hydroxide and an intumescent-type fire retardantin an elastomeric matrix. Both combinations resulted in a good balanceof acoustic and stability characteristics because, according to the dynamicmechanical analysis, the flame retardant additives participate in the dampingprocess.
26.5 AcknowledgementThis work has been financially supported by the Ministry of Education Hungarythrough projects Széchényi OM-00169/2001, 3A/0036/2002 and by the Hungar-ian Research Fund through project OTKA T026182. The scholarship from theIKMA foundation is also acknowledged.
26.6 References1. Gy. Bertalan, I. Rusznák, L. Trezl, A. Huszar and G. Szekely, Hungarian
Pat. 167063 (1975); US Pat. 4116897 (1978); German Pat. 2453491(1986).
2. A. Buzágh, Kolloid Z., 1952, 125, 14–21.3. R. Delobel, M. Le Bras, N. Ouassou and F. Alistiqsa, J. Fire Sci., 1990,
8(2), 85.4. Gy. Marosi, I. Ravadits, Gy. Bertalan, P. Anna, M.A. Maatoug, A. Tóth
and M.D. Tran, in Fire Retardancy of Polymers: The Use of Intumescence,M. Le Bras, G. Camino, S. Bourbigot and R. Delobel (eds.), The RoyalSociety of Chemistry, Cambridge, UK, 1998, pp. 325.
5. C.A. Wilkie, “Fire retardancy in polymer-clay nanocomposites”, in RecentAdvances in Flame Retardancy of Polymeric Materials, XIII, M. Lewin(ed.), BCC Publ., Norwalk, USA, 2002.
6. J. Zhu, F. Uhl and C.A. Wilkie, in Fire and Polymers; Materials andSolutions for Hazard Prevention, ACS Symp. Ser. 797. G.L. Nelson andC.A. Wilkie (eds.), ACS, Washington DC, USA, 2001, 24–33.
7. J.W. Gilman, T. Kashiwagi and J.D. Lichtenhan, SAMPE J., 1997, 33(4),40.
8. J.W. Gilman, T. Kashiwagi, S. Lomakin, J.D. Lichtenhan, P. Jones, E.P.Giannelis and E. Manias, in Fire Retardancy of Polymers: The Use of Intu-mescence, M. Le Bras, G. Camino, S. Bourbigot and R. Delobel (eds.),The Royal Chemical Society Pub., Cambridge, UK, 1998, pp. 203–221.
9. J.W. Gilman, A. Morgan, E.P. Giannelis, M. Wuthenov and E. Manias,“Flammability and thermal stability studies of polymer layered-silicatenanocomposites II”, Conference on Recent Advances in Flame Retardancyof Polymeric Materials, M. Lewin (ed.), BCC, Stamford, USA, 2000.

360 Chapter 26
10. M. Le Bras and S. Bourbigot, in Fire and Polymers; Materials andSolutions for Hazard Prevention, ACS Symp. Ser. 797, G.L. Nelson andC.A. Wilkie (eds.), ACS, Washington DC, 2001, pp. 136–149,.
11. Gy. Marosi, A. Toldy, Gy. Parlagh, Z. Nagy, K. Ludányi, P. Anna andGy. Keglevich, Heteroatom Chem., 2002, 13(2), 126–130.
12. J.E. Telschow, Phosphorus, Sulfur and Silicon, 1999, 144–146, 33–36.13. Gy. Marosi, P. Anna, A. Márton, Gy. Bertalan, A. Bóta, A. Tóth, M.
Mohai and I. Rácz, Polym. Adv. Technol., 2002, 13, 1–9.14. Gy. Bertalan, Gy. Marosi, P. Anna and L. Víg, “Process for production of
flame retardant polyolefin compounds”, Hungarian patent 209 135/93(1993).
15. Gy. Marosi, P. Anna, I. Csontos, I. Ravadits and A. Márton, Macromol.Symp., 2001, 176, 198.
16. S. Bourbigot, M. Le Bras, F. Dabrowski, J.W. Gilman and T. Kashiwagi,Fire Mater., 2000, 24(4), 201–208
17. Gy. Marosi, A. Márton, P. Anna, Gy. Bertalan, B. Marosfõi and A. Szép,Polym. Degrad. Stab., 2002, 77, 259–265.

Effect of the Addition of MineralFillers and Additives on the Toxicity of
Fire Effluents from Polymers

363
CHAPTER 27
Comparison of the DegradationProducts of Polyurethane andPolyurethane–OrganophilicClay Nanocomposite–AToxicological ApproachGENNADY E. ZAIKOV,1 SERGEI M. LOMAKIN1 ANDROMAN A. SHEPTALIN2
1Institute of Biochemical Physics of Russian Academy of Sciences,4 Kosygin Street, Moscow, 119991, Russia, ([email protected])2D.I. Mendeleyev Russian Chemical-Technological University, Moscow,Russia
In Chapter 10 we showed that addition of a low level of organic clay in polyure-thane (PU)- based nanocomposite reduces both the mass loss rate under anexternal heat flux and the flammability of PU. This chapter will evaluate theeffect of this addition on the evolution of the gaseous products of the degradationof PU and more precisely that of toxical agents from smoke.
27.1 Ecological Issue of Isocyanates and Pyrolysis ofPolyurethane Nanocomposite
Amines and isocyanates are used in the production of polyurethane. Exposure toisocyanates is associated with respiratory disorders and may occur during theproduction or processing of PU. During thermal degradation of PU, amines andaminoisocyanates are formed in addition to isocyanates. Some isocyanates andseveral aromatic amines are sensitizers and listed as carcinogens. Isocyanatesare a group of reactive compounds that are widely used in industry, mainly inthe production of polyurethane. The industrial introduction of PU started in themiddle of the 20th century and, subsequently, reports on isocyanate-induced

364 Chapter 27
occupational diseases started to appear.1,2 Today, many people are still affectedby isocyanate exposure, despite legislation and safety precautions.3,4
The most common isocyanates are the aromatic difunctional isocyanatestoluene diisocyanate (TDI) and methylenediphenyl diisocyanate (MDI) togetherwith polymeric MDI (pMDI), which is a mixture of MDI oligomer analogs.They account for more than 90% of the total world production.5 The major useof TDI is for the production of flexible PU foam, elastomers and coatings, whilepMDI is used for the production of rigid PU foam and as binder resin for recon-stituted wood products or foundry cores. MDI is mainly used for the manufac-turing of PUR elastomers. The more expensive aliphatic diisocyanates aremainly employed for the production of color-stable PU for coatings andelastomers.
To reduce exposure levels for isocyanates with high vapor pressure, suchas hexamethylene diisocyanate (HDI), they are often used as prepolymers oradducts such as biuret, allofanat and isocyanurate adducts.
27.2 Occupational ExposureOccupational exposure to isocyanates occurs mainly during the production orprocessing of PU. Numerous isocyanates are commercially available and tech-nical grade qualities, which contain complex mixtures of isocyanate isomersand analogous, are often used in the production of PU. The different compoundsreleased when processing PU (e.g. thermal degradation) are even more com-plex, and many unknown isocyanates and other compounds, such as amines andaminoisocyanates, are formed (Scheme 1).
During the production of PU-foam, volatile isocyanates may be emittedto the atmosphere and the exothermic reaction will increase the emission.Exposure to TDI is mainly described during the manufacturing of flexiblePU-foam.6,7 Exposure to MDI during production of rigid PUR foam has also
Scheme 1
365A Toxicological Approach
been described Kaaria et al.7 Due to the low volatility of MDI, the airconcentrations when compared with TDI are much lower, during production offlexible foam. However, when isocyanates with low vapor pressure, such asMDI or prepolymerised HDI, are used, e.g. in spraying applications, highconcentrations of isocyanates can be found in the working atmosphere.8,9
The urethane bonding in a PU polymer will start to dissociate at temperaturesabove 150–200°C.10 During thermal degradation of PU, exposure to diisocya-nates may occur in both the gas phase and the particle phase.11 Exposure to ther-mal degradation products of PUR has been reported during work operationssuch as processing of PU-coated metal sheets in car repair shops12 and flamelamination of PU with textiles.6
27.3 Health EffectsExposure to isocyanates is irritating to the respiratory tract and some symptomsfrom occupationally exposed workers are cough, rhinitis and chest tightness.4
Exposure to isocyanates is the most common cause of occupational asthma.13
Even if the risk of developing asthma is greater at high exposure to isocyanates,asthma can occur at relatively low concentrations.14
Methyl isocyanate (MIC) has been reported to be irritating on the respiratorytract as well as to the skin and eyes. MIC has been shown to be a reproductivetoxicant, neurotoxicant and to give rise to systemic effects.15 Most studies havebeen performed on the victims of the tragic disaster in Bhopal in India. Informa-tion regarding occupational exposure to MIC is insufficient. TDI and MDI aresuspected carcinogens based on animal studies, but only TDI is classified asa possible carcinogen to humans. Aliphatic amines, such as hexamethylenediamine (HDA) are classified as moderately toxic.16
27.3.1 GC-MS Pyrolysis
The additional aim of this study was to investigate the formation of thesuspected carcinogen toluenediamine (TDA), toluene diisocyanate (TDI)and toluene isocyanate (TI) as a degradation product of PU and PU-OMnanocomposite.
Figures 1 and 2 show GC-MS analyses PU at 250 and 500oC in air. Peakswere assigned to the products of degradation by comparison of the massspectrum with data from the Wiley275 spectral databases (Table 1). No detect-able amounts of TDA and TDI could be found in extracts of both polyurethanecompositions (PU and PU-OM 10% nanocomposite). By contrast, two isomersof toluene isocyanate TI: 1-isocyanato-2-methylbenzene (TI2), 1-isocyanato-4-methylbenzene (TI4) were found in extracts from both polyurethane composi-tions pyrolysis at 500oC.
Figure 3 shows mass spectra of TI2 (a) and TI4 (b). These findings confirmthat the formation of TI2 and TI4 in, and GC-MS analysis of, polyurethanesamples is 40% higher for PU pyrolysis than for PU-OM 10% (Table 1).
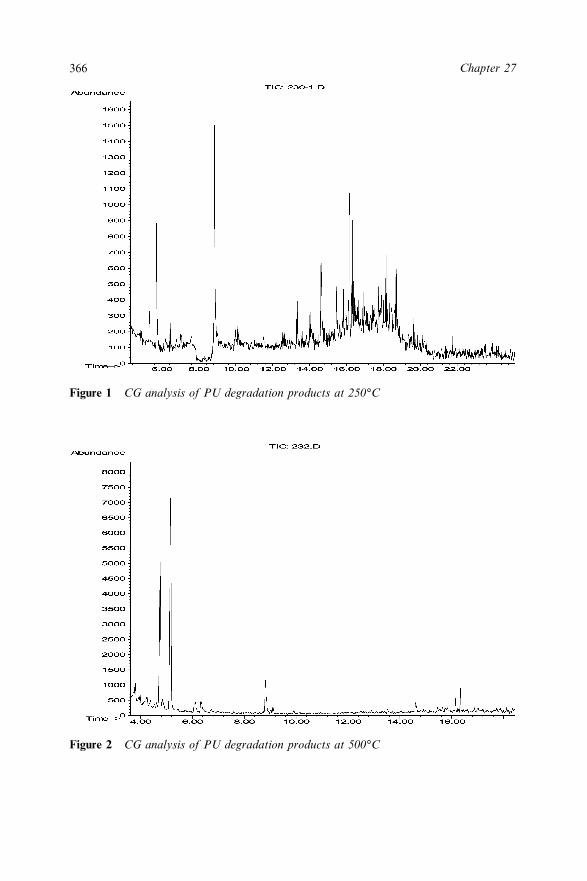
366 Chapter 27
Figure 2 CG analysis of PU degradation products at 500°C
Figure 1 CG analysis of PU degradation products at 250°C
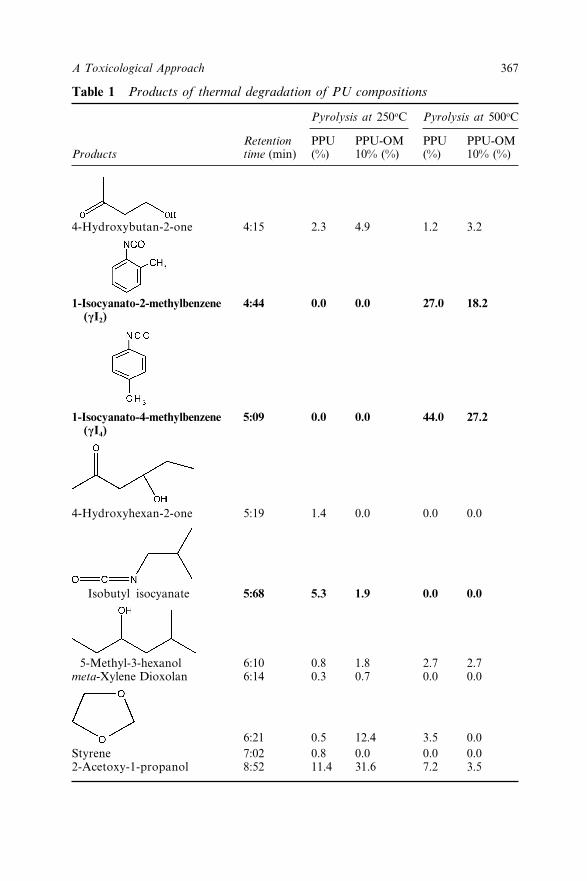
367A Toxicological Approach
Table 1 Products of thermal degradation of PU compositions
Pyrolysis at 250oC Pyrolysis at 500oC
Retention PPU PPU-OM PPU PPU-OMProducts time (min) (%) 10% (%) (%) 10% (%)
4-Hydroxybutan-2-one 4:15 2.3 4.9 1.2 3.2
1-Isocyanato-2-methylbenzene 4:44 0.0 0.0 27.0 18.2(cI2)
1-Isocyanato-4-methylbenzene 5:09 0.0 0.0 44.0 27.2(cI4)
4-Hydroxyhexan-2-one 5:19 1.4 0.0 0.0 0.0
Isobutyl isocyanate 5:68 5.3 1.9 0.0 0.0
5-Methyl-3-hexanol 6:10 0.8 1.8 2.7 2.7meta-Xylene Dioxolan 6:14 0.3 0.7 0.0 0.0
6:21 0.5 12.4 3.5 0.0Styrene 7:02 0.8 0.0 0.0 0.02-Acetoxy-1-propanol 8:52 11.4 31.6 7.2 3.5

368 Chapter 27
Table 1 Continued
Pyrolysis at 250oC Pyrolysis at 500oC
Retention PPU PPU-OM PPU PPU-OMProducts time (min) (%) 10% (%) (%) 10% (%)
2-Methyl-3-oxo-propionamide 9:06 0.0 0.0 1.4 1.7Ethyl, methyl-benzene 9:56 1.6 0.0 0.6 1.7Indene 11:28 1.1 0.0 0.0 0.0Hexane-1-propoxy 12:37 1.2 1.2 0.0 0.02-Phenylbutadiene 14:00 2.5 0.0 0.0 0.0Benzene, cyclopropyledene
methyl 14:06 2.2 0.0 0.0 0.0Naphthalene 14:37 9.1 4.3 1.7 5.3
15:28 1.7 1.2 0.6 2.6Aliphatics 15:32 0.7 0.0 0.4 1.07-Octen-2-one 15:50 0.9 1.7 0.0 0.7Naphthalene-1-methyl 16:07 4.7 0.9 0.0 1.0Naphthalene-2-methyl 16:10 6.4 3.5 1.4 1.1Aliphatics 16:16 1.8 0.6 0.7 3.2Naphthalene-methyl, ethyl 16:22 5.6 4.9 2.1 1.0Aliphatics 16:26 3.0 2.4 0.3 3.3
16:31 2.4 1.0 0.0 4.0
trans-Pinane 17:01 0.9 0.0 0.0 0.0Biphenyl 17:46 2.6 2.0 0.0 0.2
Decahydro-2- 18:09 3.3 1.9 0.4 0.6methylnaphthalene 18:21 3.3 3.0 0.0 1.0
Aliphatics 18:42 2.6 1.4 0.0 1.719:40 2.0 0.0 0.0 0.0
Non-identified products 17.6 16.7 5.5 15.1
Total S (prod.) 100.0 100.0 100.0 100.0

369A Toxicological Approach
Figure 3 Mass spectra of TI2 (a) and TI4 (b)
All degradation products could be attributed to 7 specific groups and 1unidentified group (Figure 4):
Group 1 4-Hydroxybutan-2-one, 4-hydroxyhexan-2-one, 5-methyl-3-hexanol,2-acetoxy-1-propanol, hexane-1-propoxy, 7-octen-2-one, dioxolan.
Group 2 Aliphatics.Group 3 1-Isocyanato-2-methylbenzene (TI2), 1-isocyanato-4-methylbenzene
(TI4).Group 4 Isobutyl isocyanate, 2-methyl-3-oxo-propionamide.Group 5 meta-Xylene, styrene, ethyl, methyl-benzene, 2-phenyl butadiene,
benzene, cyclopropyledene methyl.Group 6 Indene, biphenyl, naphthalene, naphthalene-1-methyl, naphthalene-
2-methyl, naphthalene-methyl, ethyl.Group 7 trans-Pinane, decahydro-2-methylnaphthalene.Group 8 Non-identified products.

370 Chapter 27
Figure 4 PU and PU-OM degradation products
27.4 ConclusionAnalysis of the degradation products indicates that depolycondensation andreactions involving the urethane functional group are not as favorable forPU-OM nanocomposite as for plain PU, since there is a reorientation in themechanism of thermal degradation. The nano-structure of PU-OM interfereswith formation of the toxic toluene isocyanates TI2 and TI4.
27.5 References1. S. Fuchs and P. Valade, Arch. Maladies Prof., 1951, 12, 191–196.2. A. Swensson, C.E. Holmquist and K.D. Lundgren., Brit. J. Ind. Med.,
1955, 12, 50.

371A Toxicological Approach
3. S.M. Tarlo, G.M. Liss, C. Dias and D.E. Banks, Am. J. Ind. Med., 1997,32, 517–521.
4. M.G. Ott, J.E. Klees and S.L. Poche, Occup. Environ. Med., 2000, 57,43–52.
5. H. Ulrich, in Chemistry and Technology of Isocyanates, John Wiley &Sons Ltd, Chichester, U.K., 1996, p. 344.
6. H. Tinnerberg, M. Spanne, M. Dalene and G. Skarping, Analyst, 1996,121, 1101–1106.
7. K. Kaaria, A. Hirvonen, H. Norppa, P. Piirila, H. Vainio andC. Rosenberg, Analyst, 2001, 126, 1025–1031.
8. J. Crespo and J. Galan, Ann. Occup. Hyg., 1999, 43(6), 415–419.9. E. England, R. Key-Schwartz, J. Lesage, G. Carlton, R. Streicher and
R. Song, Appl. Occup. Env. Hyg., 2000, 15(6), 472–478.10. D.C. Gupta, D.V. Wast, M.A. Tapaswi and B.N. Nigade, Macromol.
Rep., 1994, A31, 613–625.11. R.P. Streicher, E.R. Kennedy and C.D. Loiberau, Analyst, 1994, 119,
89–97.12. G. Skarping, M. Dalene and L. Mathiasson, J. Chromatogr., 1988, 435,
453–468.13. K.D. Rosenman, M.J. Reilly and D.J. Kalinowski, J. Occup. Environ.
Med., 1997, 39(5), 415.14. S.K. Meredith, J. Bugler and R.L. Clark, J. Occup. Environ. Med., 2000,
57, 830–836.15. D.R. Varma and I. Guest, J. Toxicol. Environ. Health., 1993, 40, 513.16. O.L. Dashiell and G.L. Kennedy, J. Appl. Toxical., 1984, 4, 320–325.

372
CHAPTER 28
Mechanisms of Smoke and COSuppression from EVACompositesT. RICHARD HULL, CLAIRE L.WILLS, TANYAARTINGSTALL, DENNIS PRICE AND G. JOHN MILNES
Fire Materials Laboratory, Bolton Institute, BL3 5AB, U.K.([email protected])
28.1 IntroductionModern performance-based building and transport codes require evidence thatdesigners have allowed sufficient time for escape in the event of an emergency.Underestimating the hazard could endanger life, while overestimation wouldconstrain design options and escalate costs. Thus, as part of a design analysis, itis important to accurately predict the production and distribution of fire effluentsresulting from the combustion of construction products and contents for differentbuilding layouts and the effects these may have on the occupants. In response tothese needs, international standard criteria have recently been agreed for theassessment and measurement of smoke toxicity (ISO 13344, Estimation of lethaltoxic potency of fire effluents) and how the presence of toxic fire products mayimpact life safety (ISO 13571 Life threat from fires – Guidance on the estima-tion of time available for escape using fire data). These will oblige designers topredict the fire toxicity associated with their buildings. The focus of this projectis to develop a practical engineering tool capable of bridging the gap betweenthis guidance and building design.
Smoke and toxic gas inhalation is the cause of most fire fatalities,1 and themajority of these deaths2 are attributed to CO poisoning. Most UK fire fatalitiesresult from inhalation of toxic gas and smoke, and the number of casualtiesovercome by gas or smoke has doubled from around 3000 to 6000 per year overthe last decade. In addition, while CO inhalation may be the actual cause of

373Mechanisms of Smoke and CO Suppression from EVA Composites
death, the presence of smoke and irritant gases within escape routes is anunquantified causative factor. Recent events, such as the Mont Blanc tunnel andPaddington rail disasters, clearly illustrate the effects of low ventilation on thenumber of toxic gas fatalities. This work sets out to understand the production oftoxic gases in fires, so that this knowledge may be applied to prediction of thehazards associated with unwanted fire.
Fire gas toxicity is dependent both on material composition, and on fire con-ditions. Combustion toxicity is generally underestimated in small-scale tests,2
because it is highly dependent on the fire conditions. The production of CO, themain killer, which is more prevalent in full-scale fires, has been shown to behighly dependant both on type of fire3 and on the mode of action of flame retar-dants present.4 The formation of CO in fires occurs at low temperatures in theearly stages of fire development. As the fire develops, the higher temperaturefavours the formation of CO2, but within any enclosure the fire spreads rapidly,until it is limited by the availability of oxygen. The intense heat drives thereaction on, despite the oxygen depletion, resulting in incomplete combustion.The gaseous products may contain CO2, CO and a number of toxic and irritantspecies such as HCN and acrolein. These stages of flaming combustion havebeen characterised into fire types,5 each typified by its own toxic product yield.Fully developed fires with low ventilation are the most difficult to replicate on asmall scale, and are the most lethal, with CO2/CO ratios as low as 5 or 10.
Extensive research, reviewed by Pitts,6 on prediction of carbon monoxideevolution from flames of simple hydrocarbons, has shown the importance of theequivalence ratio w (Table 1).
In a fully developed fire, with low ventilation, w can be as large as 5. Formany hydrocarbon polymers, CO yield increases rapidly with increase in walmost independent of polymer. In addition, a close correlation between COformation and HCN formation has been established in full-scale fire studies,7 asthe formation of both species appears to be favourable under the same poorlyventilated fire conditions. Few reliable measurements of the yields of toxic firegas species from solid materials have been undertaken, because of the expense oflarge scale tests, and the lack of suitability of most small-scale tests to replicatethe conditions occurring in real fires. Four standard tests exist for small-scalemeasurement of fire gas toxicity, the DIN 53436, the FM Fire PropagationApparatus (ASTM E2058), the French NF-X test and the NBS smoke chamber
Table 1
w =actual fuel air ratio
stoichiometric fuel air ratio
/
/
with : Typical CO yield (g g−1)
w < 1 Fuel lean flames 0.01w = 1 Stoichiometric flames 0.05w > 1 Fuel rich flames 0.2

374 Chapter 28
and finally the Purser furnace (BS 7990 and ISO draft CD 19700). Only thePurser furnace can force a steady state under the most toxic oxygen-depletedconditions. It does so by feeding the sample and air into a tube furnace at fixedrates, so that the flame front is held stationary relative to the furnace. Thismakes it the only small-scale apparatus capable of giving reliable data on theproduct yields over the full range of fire conditions.
Ethylene-vinyl acetate copolymer (EVA) is widely used as a zero-halogenspecification electric cable material. It is highly elastomeric, and tolerates highfiller loadings while retaining its flexible properties. EVA decomposes by a two-step mechanism, with the loss of acetic acid during the first step (300–350°C),resulting in the formation of unsaturated polyenes.8 The second decompositionstep involves random chain scission of the remaining material, forming unsatur-ated vapour species (~430°C), such as butene and ethylene.9 Deacetylationproceeds through b-elimination of the vinyl acetate groups present in the EVAmolecules, with up to 100% conversion into polyethylene macromolecules,containing polyene sequences having up to four conjugated double bonds.10
During thermal degradation the polymer cross-links rapidly, and appears to beautocatalytic. These cross-linking reactions lead to the formation of a protectivelayer that limits the access of oxygen to the remaining material, and impedesthe flow of fuel to the gas phase. In earlier work on EVA8 a protective layersurrounded the residue formed by loss of acetic acid. When this layer was physi-cally broken, rapid decomposition occurred in a tube furnace in air at 400°C,when left unbroken decomposition was much slower.
EVA is frequently used in combination with metal hydroxide flameretardants, such as aluminium hydroxide (generally referred to as ATH) ormagnesium hydroxide (MH), which release water endothermically:11
180–200°C2Al(OH) (s) Al O (s) + 3H O(g)3 2 3 2 → DH = 1.3 kJ g−1
and
300–350°CMg(OH) (s) MgO(s) + H O(g)2 2 → DH = 1.45 kJ g−1
Zinc borate (ZB) has been extensively used as a synergist12–16 with metalhydroxides in EVA formulations. It is thought that the zinc borate with ATH athigh temperatures creates a fused ceramic-like residue; this, combined withdegraded polymeric material, leads to a more protective surface layer duringcombustion.
180–200°C 260–270°C2H3BO3 2HBO2 + H2O B2O3 + H2O
As a synergist it is suggested17,18 that zinc borate slows down the degradationof the polymeric material. It is reported to be very effective with oxygen-containing polymers. Shen14 studied the pyrolysis of EVA/ATH at 500°C, andfound that ATH catalysed the combustion of EVA, while replacement of ATH

375Mechanisms of Smoke and CO Suppression from EVA Composites
with equal portions of ATH and ZB increased the char yield and changed thecombustion mode from glowing to smouldering. The char yield in both caseswas significantly reduced at 550°C, which is closer to the conditions of the cur-rent work. However, the exothermicity of the oxidative pyrolysis of EVA/ATH/ZB over the range 362–562°C measured using differential scanning calorimetrywas significantly less than for EVA/ATH, also indicating solid-phase oxidation.
Magnesium tetraborate (MB) also decomposes to yield water:
MgB4O7·9H2O MgB4O7 + 9H2O
There are two possible reactions of the magnesium borate under fire condition,like ATH it could release water causing endothermic loss and dilution of the fuelpresent in the gas phase, and boric acid may be generated, which should aidchar formation.
Zinc hydroxystannate (ZHS) has been used with ATH and MH to give betterphysical and flame retardant properties, and reduced smoke and toxic gas emis-sions at lower filler loadings. ZHS will act as a char promoter, complementingthe water release and endothermic effect of ATH/MH. At 180°C ZHS loses 3moles of water endothermically:
180°CZnSn(OH)6 ZnSnO3 + 3H2O
ZHS is reported to promote a thermally stable cross-linked char instead ofvolatile and flammable products.19 This char in turn restricts the supply of fuelto the flame and also reduces smoke and toxic emissions both for halogen andhalogen-free systems.
Nanocomposites are particle-filled polymers for which at least one dimensionof the dispersed particles is in the nanometre range. Polymer–clay nano-composites have demonstrated flame retardant properties, such as reduction ofpeak heat release rate, formation of protective char, and decrease in the massloss rate during combustion.20–22 In decomposition and flaming combustion,these essentially ceramic clay layers should reinforce the protective layerformed by the charring polyene. In EVA-clay nanocomposites, acceleration ofEVA deacetylation has been observed, and attributed to the strongly acidic siteson the clay exerting a catalytic effect on the b-elimination. This is followed byslower thermal degradation and protection against thermo-oxidation anddelayed weight loss in air.23 This slowing down of the volatilisation of thedeacetylated polymer in nitrogen may be due to the labyrinth effect of thesilicate layers in the polymer matrix. Despite the apparently disruptive influ-ence of water evolution on the formation of a barrier layer, the fire retardancy ofEVA/ATH nanocomposite clay material has been the subject of a patent.24
The aim of this work is to understand the formation of carbon monoxide andsmoke of ethylene-vinyl acetate copolymer (EVA) materials containing fireretardants, in order to predict the fire toxicity, particularly of fully developedfires.

376 Chapter 28
28.2 Experimental28.2.1 Materials
This study correlates the results obtained from EVA materials from 3 differentsources:
EVA1 Scapa Polymerics’ commercially optimised formulationcontaining 27% vinyl acetate
EVA2 Escorene UL 00328 EVA with 28% vinyl acetate(Exxon Mobil Corp.)
EVA3 Escorene Ultra FL00328 (Exxon Chemicals, with vinylacetate content of 27%)
EVA1/ATH1 70% ATH1 (Baco SF11E, Alcan Chemicals Europe)EVA2/ATH2 37.5% ATH2 [of median particle size (d 50) 1.3–2.3 µm]EVA3/ATH3 60% ATH3 (Superfine SF4 Alcan Chemicals Europe)EVA1/ATH1/ZHS1 65% ATH1, 5% ZHS1 (Storflam ZHS, Joseph Storey &
Co Ltd)EVA3/ATH3/ZHS2 57% ATH3, 3% ZHS2 (Flamtard H, Alcan Chemicals
Europe)EVA3/ATH-ZHS 58% ATH coated with 2% ZHS (International Tin
Research Institute25)EVA1/ATH1/ZB 65% ATH1, 5% ZB (Storflam ZB, Joseph Storey & Co
Ltd)EVA1/ATH1/MB 65% ATH1, 5% MB (Storflam MGB, Joseph Storey &
Co Ltd)EVA2/ATH2/Nano 36.4% ATH and 3% organoclay (of median particle size
(d 50) 25 µm),EVA2/Nano 4.8% organoclay (of median particle size (d 50) 25 µm)EVA3/MH 60% MH (Magnifin H5, Martinswerk)EVA3/MH/ZHS2 57% MH, 3% ZHS2 (Flamtard H, Alcan Chemicals
Europe)EVA3/MH-ZHS2 58% MH coated with 2% ZHS (International Tin
Research Institute25)
Materials containing EVA1 were prepared using a Banbury internal mixerand were all kindly supplied by Scapa Polymerics Ltd. The materials containingEVA2 were kindly supplied by Dr G Beyer, Kabelwerk Eupen AG. The materi-als containing EVA3 were kindly supplied by the International Tin ResearchInstitute. All materials were granulated into pieces 2–8 mm long, except theEVA samples which were used as 5 mm diameter pellets.
28.2.2 Burning Behaviour
The cone calorimeter (ISO 5660) is a standard test method for studying theflammability of plastics. A Fire Testing Technology cone calorimeter was usedpredominantly in this study. The tube furnace method for assessing combustion

377Mechanisms of Smoke and CO Suppression from EVA Composites
toxicity (BS7990) – the Purser furnace26 is a tube furnace with a moving sampleand controlled temperature and air flow rate (Figure 1). The technique wasdeveloped to enable the study of smoke and toxic combustion product evolutionfrom polymers under the different stages and types of fire. The technique pro-vides for steady combustion conditions to be established, since the fuel feed rate,air flow rates, and hence the rate of burning are constant. The Purser furnacecontrols the rate of burning through the sample feed rate. Once steady stateconditions have been established, the statistical fluctuations of burning aresignificantly reduced.
The apparatus was designed to compare the fire toxicity of different fireconditions. This was achieved, for a fixed fuel feed rate, by altering the ratioof primary to secondary air, while keeping the total air flow into the mixingchamber constant.
Fuel in this work refers to the copolymer and not the inorganic additives. Toestimate the fuel component of the effluent gases, the diluted fire gases from themixing chamber were passed through a secondary oxidiser containing quartzwool at 900°C. This converts all the fuel carbon into CO2, giving a measure ofthe fuel component of the effluent gases.
Thermogravimetric analysis (TGA) was used to study the decomposition ofthe EVA and EVA/nanocomposite samples isothermally in air and dynamicallyin air (oxidative decomposition) and under nitrogen (non-oxidative decomposi-tion). A Mettler M3 TGA with a Mettler TG50 Thermobalance and a MettlerTC10A Processor was the instrument used for all TGA in this study. Approxi-mately 5 mg of sample was used for each determination and a heating rate of10°C min−1 was used throughout. Differential scanning calorimetry (DSC) wascarried out using a heating rate of 15°C min−1 under flowing nitrogen using aPolymer Laboratories DSC, and run from 20–700°C using copper pans.
28.3 Results28.3.1 Correlation of Physical Fire Models
Carbon monoxide/carbon dioxide yield ratios from both cone tests and BS7990tube furnace experiments are presented in Figure 2.
Figure 1 Purser furnace

378 Chapter 28
Cone data were measured using a heat flux of 50 kW m−2 for the samplescontaining EVA3, and 75 kW m−2 for the samples containing EVA1. In the tubefurnace, the fire condition is precisely known, and may be considered uniformacross the area of flaming. In the cone, the outer areas are clearly well-ventilated, while the centre of the sample will be oxygen deficient.
The rapid quenching of the fire gases in the duct will prevent the formation ofa hot layer for oxidation to go to completion. To estimate the average fire con-dition in the cone, the CO2/CO ratio has been plotted for each sample (normallythis is greater than 100 for fully developed flaming at relatively high ventila-tion, and less than 10 for fully developed flaming at relatively low ventilationand 100–200 for a developing fire27) (Figure 3). Insertion of the cone databetween w = 0.7 and w = 1.0 has been based on the best fit with the tube furnacedata. This shows that, for most of the samples, the fire condition in the cone liesbetween w = 0.7, well-ventilated, and w = 1.0, fully developed, high ventilation.
Figure 2 Comparison between raw data for evolved gases amounts from both cone testsand BS7990 tube furnace

379Mechanisms of Smoke and CO Suppression from EVA Composites
The carbon monoxide yields shown in Figure 4 for the three samples of EVAshow significant differences under conditions of reduced ventilation. This data isplotted alongside cone data, with a slight difference in the definition of the yield.
Figure 3 Carbon dioxide/carbon monoxide yield ratios for filled and unfilled EVAmaterials
Figure 4 Carbon monoxide yield for all materials in grams per gram of polymer, or gramper gram of mass lost for cone data (note the reversal of the fire condition axisfor clarity of view)

380 Chapter 28
The tube furnace CO yields are grams CO per gram of polymer, where the coneyields are grams CO per gram of mass lost. With pure EVA there is no signifi-cant difference between the two definitions, but with ATH-containing samplesalmost half the mass loss will result from the loss of water from ATH. Thus theCO yield data from the cone would be about half the value expressed as g/gpolymer. Thermal analysis of EVA1 shows a greater char yield at 500°C thanwas found for EVA2 or EVA3. Since there was no significant residual mass forany of the EVA samples, it is assumed that a greater proportion of the EVA1remains as carbon (soot) particles, reducing the CO yield. All the EVA/ATHmaterials show higher CO yields than their base polymers under conditionsof low ventilation, though with sample EVA3/ATH3 it proved impossible toimpose steady state burning conditions under low ventilation. In this case themajority of the CO was evolved in the later 7 min of a 23 min run. This appearsto be caused by incandescent afterglow, which forces the residual carbon to be atleast partially oxidised. The samples containing ATH and ZHS showed somelevelling out of the still evident afterglow phenomena, but there was little evi-dence to suggest that the observed reduction in CO yield under high ventilationwas replicated under conditions of low ventilation.
The sample containing EVA1/ATH1/ZB showed the most surprising behavi-our. Under conditions of low ventilation a very low CO yield was observed, anda significant amount of partially burnt carbon was detected by the secondaryoxidiser. Conversely, the cone calorimeter showed the same EVA1/ATH1/ZBsample to give the highest yield of CO of any of the whole range of filledsamples. The incomplete combustion resulting in higher CO yields in the coneprobably results from quenching of the fire gases, rather than throughoxygen depletion. Incandescence and afterglow are phenomena that occur inreal fires, which would be expected to give significantly higher yields of CO forEVA/ATH samples that did not contain ~5% zinc borate. Rapid quenchingof fire gases, coupled with the fact that only a single area is burnt, means thatsuppression of afterglow does not affect the CO yield in the cone calorimeter.
Several processes are occurring to the filled copolymer during the passage ofthe sample through the furnace, which are similar to the processes occurringduring flame spread in a fully developed fire. These are illustrated in Figure 5.
Under fuel-rich conditions, the increase in CO yield for EVA/ATH, EVA/ATH/ZHS, and EVA/ATH/MB appears to result from solid-phase oxidation ofthe trapped organic material, while the low CO yield for EVA/ATH/ZB suggeststhat pyrolysis of the residual organic material occurred in preference to oxida-tion. This may be attributed to the formation of a zinc borate-alumina adductthat did not promote the oxidation reactions. The specific nature of this inter-action is suggested by the failure of either the sample containing magnesiumborate or zinc hydroxystannate to show a similar effect. When ATH and ZBwere ground together in various ratios and studied by TGA, a slight differencewas observed between the proportional sum of the individual thermograms andthat of the mixtures showing the water loss of both substances merging to give asingle slightly sharper peak. DSC analysis of the water loss process showedan increase in endothermicity of around 15% for the ATH/ZB in a 9:1 ratio.

381Mechanisms of Smoke and CO Suppression from EVA Composites
Figure 6 shows the TG curves of each component in the EVA/ATH/ZB formula-tion as a percentage of the total original mass. These components are addedtogether to give a calculated curve, which is compared to the actual residualmass of the composite. The TG of the EVA1/ATH1/ZB, Figure 6, also showed
Figure 5 Simultaneous processes occurring during steady state combustion of EVA/ATHin the Purser furnace
Figure 6 TGA of EVA1/ATH1/ZB in air showing char enhancement by zinc borate

382 Chapter 28
a significant increase in the char yield, from 450–600°C, showing the poisoningeffect of ZB on alumina towards char oxidation.
The EVA magnesium hydroxide material showed a modest reduction in COyield compared with ATH, as did the MH ZHS containing samples. The advan-tages of coating ATH and MH with ZHS were not apparent when comparedwith slightly higher loadings of ZHS used with uncoated filler.
For EVA2/nano under intermediate ventilation conditions, there is justenough oxygen (w = 0.7 to 1.0), provided it can get access to the unburnt parts ofthe polymer; the EVA-clay shows higher yields of CO but, under fuel-rich condi-tions, the EVA-clay shows a similar yield (of around 0.15 g g−1) of CO to EVA,and both the EVA/ATH and EVA/ATH/clay samples show a significantlyhigher yield of CO (of around 0.20 g g−1). At w = 1, for the EVA-clay, the varia-tion of CO concentration during the experiment showed a large initial peak ofCO (of three times the steady state value) before the steady state was reached. Incontrast, the EVA sample showed a smaller initial peak, which was about twiceits (much lower) steady state value. Samples containing ATH again showed theapparently catalytic effect of alumina in increasing CO yields at low ventilation,as reported in earlier work on EVA.28
28.3.2 Smoke
The yields of all products of incomplete combustion are generally believed toincrease with decrease in ventilation. Moreover, a number of flame retardantadditives show smoke and CO suppression under well ventilated conditions.However, it is not clear the extent to which these additives perform, and whethergood CO suppression coincides with good smoke suppression. The smoke yieldfrom the tube furnace, calculated from the optical density, and the smoke datafrom the cone for comparison taken from Cross et al.,29 are both expressed asaverage specific extinction area (SEA in m2 kg−1) and shown in Figure 7. Thedata differ slightly in the definition of the mass from which the smoke came, forthe tube furnace work the kg−1 refers to kg of polymer, in the cone it is per kg ofmass lost. This is only noticeable when comparing materials containing metalhydrate fillers, which lose some mass as water, which would not cause smoke.
The results show similar trends for smoke production for both the cone and thetube furnace. MH acts as a smoke suppressant under well-ventilated conditions,and is moderately effective under fuel-rich conditions. The enhanced smoke pro-duction for ATH containing materials, particularly at higher fuel to air ratios,suggests that pyrolysis of aromatics must compete with catalytic conversion offuel carbon into CO or CO2.
28.4 ConclusionsThis work shows that the tube furnace method provides an important source ofdata on the fire toxicity of fire retarded polymer samples. It shows the inade-quacy of cone data in assessing CO yields and smoke production in developedfires.

383Mechanisms of Smoke and CO Suppression from EVA Composites
Figure 7 Smoke production in tube furnace SEA (expressed per g polymer) and from thecone (average SEA expressed per g mass lost)
The mechanisms of CO production vary with fire condition. Under poorlyventilated conditions with high concentrations of ATH, higher toxicity mayoccur. The synergy of zinc borate as an afterglow suppressant when used withaluminium hydroxide seems to depend on an interaction of the decompositionproducts of the two materials that poisons the catalytic activity.
Magnesium hydroxide shows a greater tendency to suppress smoke and asmaller tendency to lower CO yields under poorly ventilated conditions. Thisneeds further investigation, and may result from more efficient catalysis,leading to less smoke and CO, or a subtly different type of behaviour.
Clay, which forms a protective layer, seems to have a negligible effect on theyield of carbon monoxide, both under fuel-lean and fuel-rich conditions. Theinfluence of the residual alumina from ATH, in catalysing the conversion ofmore organic material into CO, also appears to be unaffected by the presence ofthe clay material. The increased yield of CO under stoichiometric conditions(when w = 1) probably arises from a reduction in access of oxygen caused by thepresence of a protective layer.

384 Chapter 28
28.5 AcknowledgementsThe authors thank Dr Gunter Beyer of Kabelwerk, Eupen, Dr Peter Salthouse ofScapa Polymerics, and Drs Paul Cusack and Matthew Cross of ITRI for provid-ing the samples used in this work. One of us (CLW) thanks the Engineering andPhysical Science Research Council (EPSRC) for financial support.
28.6 References1. “Fire Statistics United Kingdom 1997”, Home Office Statistical Bulletin,
1998, Issue 25/98, p. 13.2. M.M. Hirschler, Recent Advances in Flame Retardancy of Polymeric
Materials, M. Begin (ed.), BCC Inc, Ct., U.S.A., 1999.3. T.R. Hull, J.M. Carman and D.A. Purser, Polym. Inter., 2000, 49, 1259–
1265.4. T.R. Hull, R.E. Quinn, I.G. Areri and D.A. Purser, Polym. Degrad. Stab.,
2002, 77, 235–242.5. Toxicity testing of fire effluents – Part 1, ISO TR 9122-1 1989 (E).6. W.M. Pitts, Progress in Energy and Combustion Sci., 1995, 21, 197–237.7. D.A. Purser, Polym. Int., 2000, 49, 1232–1255.8. K. McGarry, Polym. Int., 2000, 49(10), 1193–1198.9. M.B. Maurin, L.W. Dittert and M.A. Hussain, Thermochim. Acta, 1991,
186, 97–102.10. J.T. Yeh, M.J. Yang and S.H. Hsieh, Polym. Degrad. Stab., 1998, 61,
465–472.11. R.N. Rothon, in Particulate-Filled Polymer Composites, Chapter 6: Effects
of particulate fillers on flame-retardant properties of composites, R.N.Rothon (ed.), Harlow, Longman, UK, 1995.
12. US Borax Technical Bulletin, HF596.13. M. Le Bras, N. Pecoul, S. Bourbigot and R. Delobel, in Extended
Abstracts of Eurofillers ’97, R.N. Rothon (ed.), British Plastics federationFilplas Committee & MOFFIS Committee Pub., London, 1997.
14. K. Shen, Plastics Compound., Nov./Dec. 1988.15. M. Le Bras, S. Bourbigot, F. Carpentier, R. Leeuwendal and D. Schubert,
GAK Gummi Fasern Kunstoffe, 1998, 12, 972–982.16. K. Shen and D.F. Ferm, in Proceedings of Recent Advances in Flame
Retardancy of Polymeric Materials, M. Lewin (ed.), B.C.C Pub., Stamford,U.S.A., 1997.
17. F. Carpentier, S. Bourbigot, M. Le Bras and R. Delobel, Polym. Int.,2000, 49, 1216.
18. A. Marchal, M. Le Bras, R. Delobel and J.-M. Leroy, Polym. Degrad.Stab., 1994, 44, 263–272.
19. M.S. Cross, P.A. Cusack and P.R. Hornsby, Polym. Degrad. Stab., 2003,79, 309–318.
20. J.W. Gilman, Appl. Clay Sci, 1999, 15, 31–49.21. G. Beyer, Fire Mater., 2001, 25, 193–197.

385Mechanisms of Smoke and CO Suppression from EVA Composites
22. G. Beyer, Polym. News, 2001, 26, 334–342.23. M. Zanetti, T. Kashiwagi, L. Falqui and G. Camino, Chem. Mater., 2002,
14(2), 881–887.24. “Flameproof Polymer Composition” World Intellectual Property
Organisation Patent: WO0068312A1 (2000).25. P.A. Cusack, B. Patel, M.S. Heer and R.G. Baggaley, European Patent
833,862 (1999).26. D.A. Purser, P.J. Fardell, J. Rowley, S. Vollam and B. Bridgeman, in
Proceedings of the 6th International Conference Flame Retardants ‘94,Interscience Communications, London, 26–27 Jan. 1994.
27. Toxicity testing of fire effluents Part I, Technical Report 9122-1, Interna-tional Standards Organisation, 1989 (E).
28. T.R. Hull, Polym. Degrad. Stab., 2002, 77(2), 235–242.29. M.S. Cross, P.A. Cusack and P.R. Hornsby, Polym. Degrad. Stab., 2003,
79, 309–318.

386
CHAPTER 29
Products of IncompleteCombustion from Fire Studies inthe Purser FurnaceCLAIRE L. WILLS,1 JUDAH AROTSKY,1 T. RICHARDHULL,2 DENNIS PRICE,2 DAVID A. PURSER3 ANDJENNY PURSER3
1Institute of Materials Research (Chemistry), University of Salford, Salford,M5 4WT, UK2Centre for Materials Research and Innovation, Bolton Institute, Deane Road,Bolton, BL3 5AB, UK ([email protected])3Fire and Risk Sciences, Building Research Establishment, Garston, Watford,WD25 9XX, UK
29.1 IntroductionEthylene-vinyl acetate copolymer (EVA) is widely used to obtain a zero-halogenspecification electric cable material. It is highly elastomeric, and tolerates highfiller loadings while retaining its flexible properties. Work has been carried outby Tin Technologies, UK to develop material suitable for a fire retarded sheathfor electric cables while maintaining zero halogen specification. EVA is fre-quently used in combination with metal hydroxide flame retardants, such asaluminium hydroxide (generally referred to as ATH) or magnesium hydroxide(MH), to overcome flammability problems by releasing water endothermically:1
2Al(OH)3 (S) → 180–200°C Al2O3 (s) + 3H2O (g) DH = 1.3 kJ g−1
and
Mg(OH)2 (S) → 300–350°C MgO (s) + H2O (g) DH = 1.45 kJ g−1
Zinc hydroxystannate (ZHS) has been investigated as a potential synergist.The mechanism of ZHS in halogen systems involves formation in the vapour
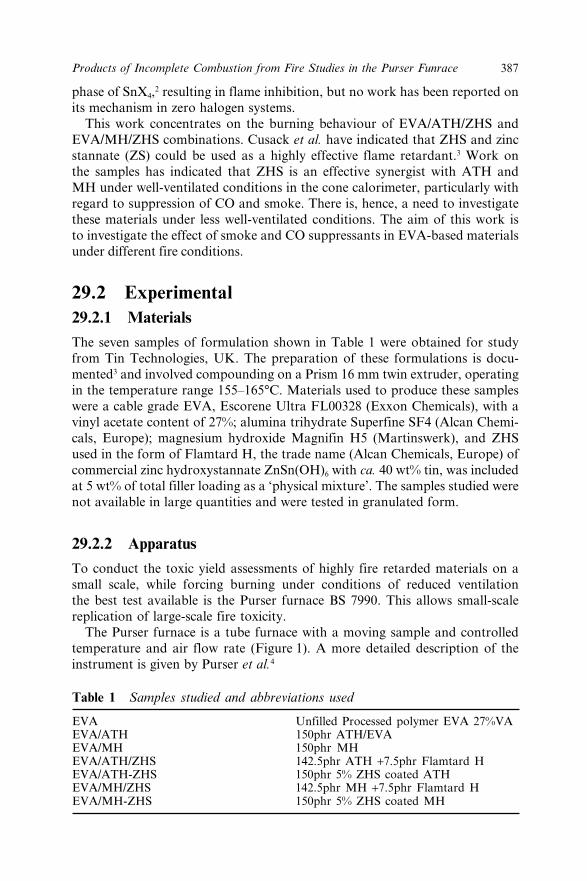
387Products of Incomplete Combustion from Fire Studies in the Purser Funrace
phase of SnX4,2 resulting in flame inhibition, but no work has been reported onits mechanism in zero halogen systems.
This work concentrates on the burning behaviour of EVA/ATH/ZHS andEVA/MH/ZHS combinations. Cusack et al. have indicated that ZHS and zincstannate (ZS) could be used as a highly effective flame retardant.3 Work onthe samples has indicated that ZHS is an effective synergist with ATH andMH under well-ventilated conditions in the cone calorimeter, particularly withregard to suppression of CO and smoke. There is, hence, a need to investigatethese materials under less well-ventilated conditions. The aim of this work isto investigate the effect of smoke and CO suppressants in EVA-based materialsunder different fire conditions.
29.2 Experimental29.2.1 Materials
The seven samples of formulation shown in Table 1 were obtained for studyfrom Tin Technologies, UK. The preparation of these formulations is docu-mented3 and involved compounding on a Prism 16 mm twin extruder, operatingin the temperature range 155–165°C. Materials used to produce these sampleswere a cable grade EVA, Escorene Ultra FL00328 (Exxon Chemicals), with avinyl acetate content of 27%; alumina trihydrate Superfine SF4 (Alcan Chemi-cals, Europe); magnesium hydroxide Magnifin H5 (Martinswerk), and ZHSused in the form of Flamtard H, the trade name (Alcan Chemicals, Europe) ofcommercial zinc hydroxystannate ZnSn(OH)6 with ca. 40 wt% tin, was includedat 5 wt% of total filler loading as a ‘physical mixture’. The samples studied werenot available in large quantities and were tested in granulated form.
29.2.2 Apparatus
To conduct the toxic yield assessments of highly fire retarded materials on asmall scale, while forcing burning under conditions of reduced ventilationthe best test available is the Purser furnace BS 7990. This allows small-scalereplication of large-scale fire toxicity.
The Purser furnace is a tube furnace with a moving sample and controlledtemperature and air flow rate (Figure 1). A more detailed description of theinstrument is given by Purser et al.4
Table 1 Samples studied and abbreviations used
EVA Unfilled Processed polymer EVA 27%VAEVA/ATH 150phr ATH/EVAEVA/MH 150phr MHEVA/ATH/ZHS 142.5phr ATH +7.5phr Flamtard HEVA/ATH-ZHS 150phr 5% ZHS coated ATHEVA/MH/ZHS 142.5phr MH +7.5phr Flamtard HEVA/MH-ZHS 150phr 5% ZHS coated MH

388 Chapter 29
Table 2 Primary air flow rates used to obtain different wconditions
Equivalence ratio, w at furnace Primary air flow used intemperature 750ºC this work (l min−1)
0.5 19.10.7 13.61.0 9.51.5 6.4
The technique was developed to enable the study of smoke and toxic combus-tion product evolution from polymers under the different stages and types of fire,e.g.
• Non-flaming (oxidative) decomposition• Developing fire (flaming)• Fully developed (flaming) with (i) relatively high ventilation or (ii) rela-
tively low ventilation
(taken from the ISO classification of fire stages in accordance with ISO/TR9122-1.)
In this work, the fire conditions are defined in terms of the equivalence ratio,w [Equation (1)].
w = actual fuel/air ratiostiochiometric fuel/air ratio (1)
The materials were tested at 750°C under four fire conditions of w = 0.5, 0.7,1.0 and 1.5 (Table 3). At w = 0.5 the conditions correlate with a developing fire,at w = 0.7 and 1.0, the conditions are those of a fully developed, high ventilationfire, and at w = 1.5 conditions of low ventilation are produced. The fire type andair flow rates used for the four conditions are shown in Table 2.
Figure 1 Purser furnace
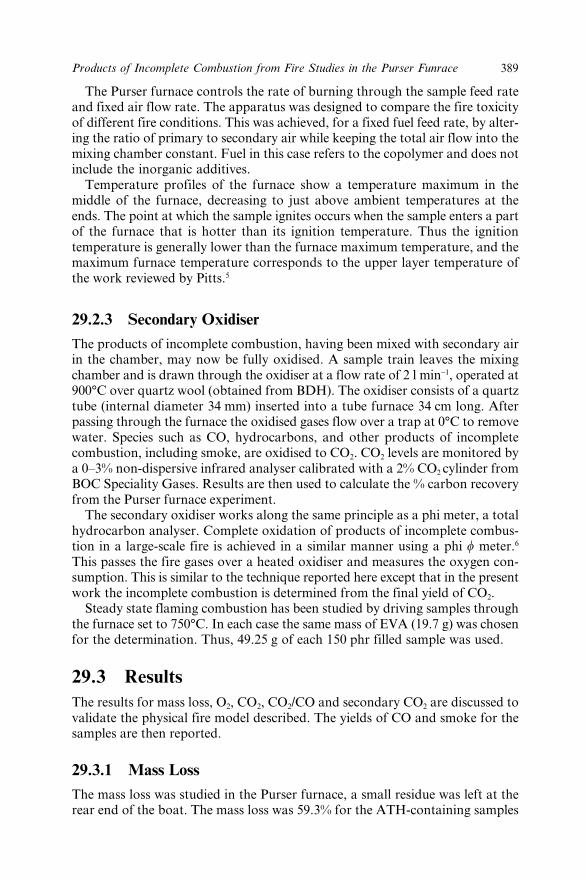
389Products of Incomplete Combustion from Fire Studies in the Purser Funrace
The Purser furnace controls the rate of burning through the sample feed rateand fixed air flow rate. The apparatus was designed to compare the fire toxicityof different fire conditions. This was achieved, for a fixed fuel feed rate, by alter-ing the ratio of primary to secondary air while keeping the total air flow into themixing chamber constant. Fuel in this case refers to the copolymer and does notinclude the inorganic additives.
Temperature profiles of the furnace show a temperature maximum in themiddle of the furnace, decreasing to just above ambient temperatures at theends. The point at which the sample ignites occurs when the sample enters a partof the furnace that is hotter than its ignition temperature. Thus the ignitiontemperature is generally lower than the furnace maximum temperature, and themaximum furnace temperature corresponds to the upper layer temperature ofthe work reviewed by Pitts.5
29.2.3 Secondary OxidiserThe products of incomplete combustion, having been mixed with secondary airin the chamber, may now be fully oxidised. A sample train leaves the mixingchamber and is drawn through the oxidiser at a flow rate of 2 l min−1, operated at900°C over quartz wool (obtained from BDH). The oxidiser consists of a quartztube (internal diameter 34 mm) inserted into a tube furnace 34 cm long. Afterpassing through the furnace the oxidised gases flow over a trap at 0°C to removewater. Species such as CO, hydrocarbons, and other products of incompletecombustion, including smoke, are oxidised to CO2. CO2 levels are monitored bya 0–3% non-dispersive infrared analyser calibrated with a 2% CO2 cylinder fromBOC Speciality Gases. Results are then used to calculate the % carbon recoveryfrom the Purser furnace experiment.
The secondary oxidiser works along the same principle as a phi meter, a totalhydrocarbon analyser. Complete oxidation of products of incomplete combus-tion in a large-scale fire is achieved in a similar manner using a phi w meter.6
This passes the fire gases over a heated oxidiser and measures the oxygen con-sumption. This is similar to the technique reported here except that in the presentwork the incomplete combustion is determined from the final yield of CO2.
Steady state flaming combustion has been studied by driving samples throughthe furnace set to 750°C. In each case the same mass of EVA (19.7 g) was chosenfor the determination. Thus, 49.25 g of each 150 phr filled sample was used.
29.3 ResultsThe results for mass loss, O2, CO2, CO2/CO and secondary CO2 are discussed tovalidate the physical fire model described. The yields of CO and smoke for thesamples are then reported.
29.3.1 Mass LossThe mass loss was studied in the Purser furnace, a small residue was left at therear end of the boat. The mass loss was 59.3% for the ATH-containing samples

390 Chapter 29
and 57.6% for the MH-containing samples. The theoretical mass loss for theATH-containing samples is 60.6% and for the MH-containing samples is58.2%. The slightly greater mass loss falls within the limits of experimentalerror, and does not indicate a change in the dehydration chemistry of ATH,MH or ZHS.
29.3.2 Effluent Oxygen
Figure 2 shows the variation of O2 concentration in the undiluted effluent. Thisshows that the oxygen concentration falls for all polymers from 7–11.5% atw = 0.5 to 0.7–3% at w = 1.5 (Figure 2). The point for EVA at w = 1.5 is notshown because a leak in the sample to the oxygen analyser prevented a validmeasurement. The low oxygen concentrations at w = 1.5 for the other samplesshow that the conditions allow for adequate mixing.
29.3.3 Carbon Dioxide
As shown in Figure 3, there is a general decrease in CO2 yield as the equivalenceratio increases, as expected. The size of the tube can account for lower valuesat w = 0.5 than expected, this has been documented in our previous work.7
Omissions in the results are due to instrument logging problems and lack offurther quantities of sample.
Figure 2 Effluent oxygen concentrations at various equivalence ratios (w )
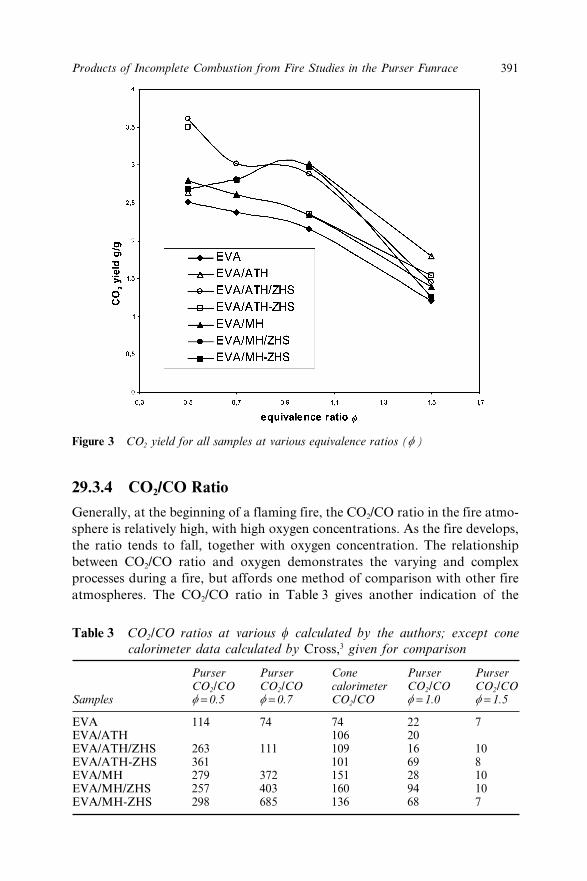
391Products of Incomplete Combustion from Fire Studies in the Purser Funrace
29.3.4 CO2/CO Ratio
Generally, at the beginning of a flaming fire, the CO2/CO ratio in the fire atmo-sphere is relatively high, with high oxygen concentrations. As the fire develops,the ratio tends to fall, together with oxygen concentration. The relationshipbetween CO2/CO ratio and oxygen demonstrates the varying and complexprocesses during a fire, but affords one method of comparison with other fireatmospheres. The CO2/CO ratio in Table 3 gives another indication of the
Figure 3 CO2 yield for all samples at various equivalence ratios (w )
Table 3 CO2/CO ratios at various w calculated by the authors; except conecalorimeter data calculated by Cross,3 given for comparison
Purser Purser Cone Purser PurserCO2/CO CO2/CO calorimeter CO2/CO CO2/CO
Samples w = 0.5 w = 0.7 CO2/CO w = 1.0 w = 1.5
EVA 114 74 74 22 7EVA/ATH 106 20EVA/ATH/ZHS 263 111 109 16 10EVA/ATH-ZHS 361 101 69 8EVA/MH 279 372 151 28 10EVA/MH/ZHS 257 403 160 94 10EVA/MH-ZHS 298 685 136 68 7
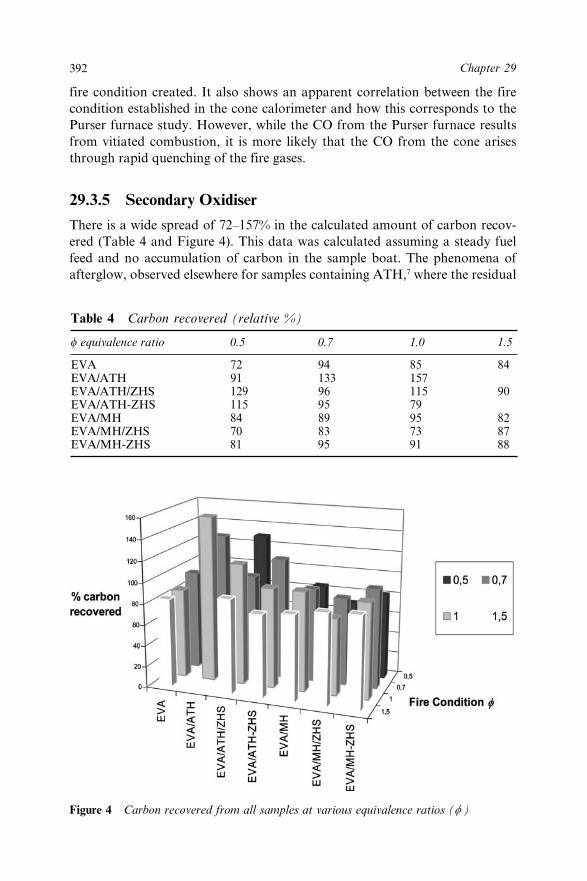
392 Chapter 29
Figure 4 Carbon recovered from all samples at various equivalence ratios (w )
fire condition created. It also shows an apparent correlation between the firecondition established in the cone calorimeter and how this corresponds to thePurser furnace study. However, while the CO from the Purser furnace resultsfrom vitiated combustion, it is more likely that the CO from the cone arisesthrough rapid quenching of the fire gases.
29.3.5 Secondary Oxidiser
There is a wide spread of 72–157% in the calculated amount of carbon recov-ered (Table 4 and Figure 4). This data was calculated assuming a steady fuelfeed and no accumulation of carbon in the sample boat. The phenomena ofafterglow, observed elsewhere for samples containing ATH,7 where the residual
Table 4 Carbon recovered (relative %)
w equivalence ratio 0.5 0.7 1.0 1.5
EVA 72 94 85 84EVA/ATH 91 133 157EVA/ATH/ZHS 129 96 115 90EVA/ATH-ZHS 115 95 79EVA/MH 84 89 95 82EVA/MH/ZHS 70 83 73 87EVA/MH-ZHS 81 95 91 88

393Products of Incomplete Combustion from Fire Studies in the Purser Funrace
alumina catalyses the decomposition of residual char trapped in the solidmatrix, may account for the higher values of carbon recovered, particularly forthe samples containing ATH. In these cases, after initial combustion, the residueis passed to a hotter part of the furnace where it is pyrolysed, combining withoxygen either in the tube or in the secondary oxidiser. Thus, during the apparentsteady state, there are in fact two processes occurring. Smaller errors may alsoarise from smoke particles deposited as soot (the mass of which was notrecorded), which is not all transferred to the secondary oxidiser. It could,however, be carbon evolved at an unsteady rate – a disproportionate amount ofcarbon may be lost outside the main steady state part of the burning process.
29.3.6 CO Yield
The results for the unfilled processed polymer show that the CO yield, measuredby an electrochemical cell, increases as ventilation conditions become morevitiated. Carbon monoxide formation is a consequence of incomplete com-bustion, which can arise from a shortage of oxygen or insufficient temperatureor time in the flame zone. Passing through the tube furnace at 750°C should besufficient to ensure near equilibrium product yields are reached and the high COyields at high w arose from insufficient oxygen (Figure 5).
The introduction of ATH with EVA leads to an increase in the level ofCO under all the ventilation conditions studied compared to that of the purepolymer. The incorporation of ZHS with EVA/ATH was seen to lower the COyields under all conditions except w = 1.0. The CO yield for the EVA with the
Figure 5 CO yield for ATH samples at various equivalence ratios (w )

394 Chapter 29
ATH coated with ZHS (EVA/ATH-ZHS) lowers the CO yield to that of the purepolymer. The coated ATH-ZHS appears advantageous in CO yield compared tothe ATH/ZHS sample especially at w = 1.0.
The effect of EVA with MH alone was to significantly reduce the CO yield athigh w compared to the corresponding EVA/ATH. In combination with ZHS, nofurther reduction was observed (Figure 6).
29.3.7 SmokeThe amount of smoke produced has been measured in terms of the opticaldensity in the dilution chamber, obtained via obscuration of a horizontal laserbeam through the mixing chamber. The optical system was calibrated with opti-cal density filters. The results are expressed in terms of specific extinction area(SEA) based on the optical density, volume flow rate and fuel feed rate of thepolymer (as distinct from the polymer plus filler). The smoke measurementsshow a general upward trend in results with decreasing ventilation ratio.
A plateau appears to be reached at w = 0.7, much lower than the plateau forCO at around w = 1.5 to 2 (Figure 7). The lower values at w = 0.5, especially forthe pure EVA, can be attributed to the wind effect. The MH formulations lowerthe smoke production in comparison to that of the pure polymer under all condi-tions except w = 1.5. The ATH samples all produced greater amounts of smokethan did the pure polymer. For the EVA/MH-ZHS sample there is a definiteincrease in smoke production as vitiated conditions prevail, although for theother samples this is not observed.
29.4 DiscussionThese results show that the parameters have been met to indicate that theappropriate fire conditions have been replicated. Specifically, oxygen
Figure 6 CO yield for MH samples at various equivalence ratios (w )
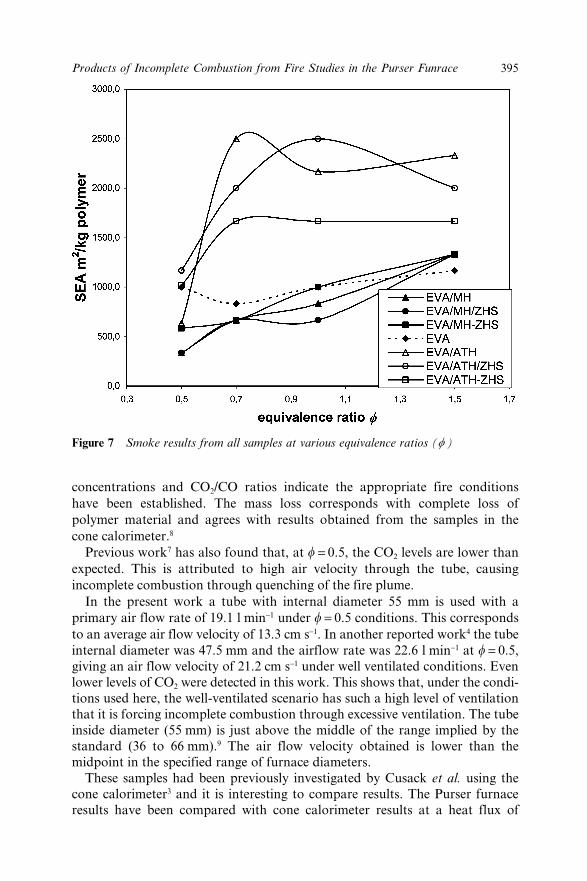
395Products of Incomplete Combustion from Fire Studies in the Purser Funrace
concentrations and CO2/CO ratios indicate the appropriate fire conditionshave been established. The mass loss corresponds with complete loss ofpolymer material and agrees with results obtained from the samples in thecone calorimeter.8
Previous work7 has also found that, at w = 0.5, the CO2 levels are lower thanexpected. This is attributed to high air velocity through the tube, causingincomplete combustion through quenching of the fire plume.
In the present work a tube with internal diameter 55 mm is used with aprimary air flow rate of 19.1 l min−1 under w = 0.5 conditions. This correspondsto an average air flow velocity of 13.3 cm s−1. In another reported work4 the tubeinternal diameter was 47.5 mm and the airflow rate was 22.6 l min−1 at w = 0.5,giving an air flow velocity of 21.2 cm s−1 under well ventilated conditions. Evenlower levels of CO2 were detected in this work. This shows that, under the condi-tions used here, the well-ventilated scenario has such a high level of ventilationthat it is forcing incomplete combustion through excessive ventilation. The tubeinside diameter (55 mm) is just above the middle of the range implied by thestandard (36 to 66 mm).9 The air flow velocity obtained is lower than themidpoint in the specified range of furnace diameters.
These samples had been previously investigated by Cusack et al. using thecone calorimeter3 and it is interesting to compare results. The Purser furnaceresults have been compared with cone calorimeter results at a heat flux of
Figure 7 Smoke results from all samples at various equivalence ratios (w )

396 Chapter 29
Figure 8 Comparison of smoke data from cone calorimeter and Purser furnace
50 kW m−2 operated under normal ventilated conditions. The average CO2 yieldfrom the cone calorimeter is 2.36 g g−1 of polymer which is very close to ourvalue of 2.38 g g−1 polymer found using the Purser furnace technique underw = 0.7 conditions (Figure 3). The theoretical yield of CO2 corresponding tocomplete oxidation of all carbon to CO2 is 2.84 g g−1 polymer. Interestingly, thedegree of completeness of combustion in the cone calorimeter (as measured byconversion into CO2) is 83.1% and 83.8% in the Purser furnace.
The results for smoke yields from the cone calorimeter obtained by Crosset al.3, 8 have been compared to those obtained in this work. However, the basisused in the cone calorimeter software for determining the SEA uses the mass lossrate to calculate the smoke yield per kg of sample, where the tube furnacemethod uses the fuel feed rate. These differ when studying hydrated metal oxidefillers in that some of the mass is lost as water (~20% for ATH and ~18% forMH), and therefore the SEA values will be proportionately lower. The conecalorimeter data showed that the EVA/ATH/ZHS combination resulted in lowersmoke levels, the opposite of those found in the Purser furnace, Figure 8. Thisillustrates a significant difference between these two physical fire models. It canbe concluded from this that prediction of smoke yield for a particular series ofmaterials will not be reliable if measurement is made under a single condition,because smoke yields are highly dependent on fire type.
For pure EVA in the cone calorimeter the average CO yield was 0.032 g g−1 ofpolymer. The w = 0.7 condition in the Purser furnace also produces 0.032 g g−1
of polymer (Figure 5). The CO yield under well ventilated burning is around0.005–0.01 g g−1 of polymer rising to 0.14–0.18 g g−1 of polymer for samplescontaining MH (Figure 6). For the samples containing ATH the CO yieldrises from 0.005–0.01 g g−1 of polymer under well ventilated conditions to

397Products of Incomplete Combustion from Fire Studies in the Purser Funrace
0.18–0.33 g g−1 of polymer under fuel-rich conditions (Figure 5). The high COyield observed for EVA/ATH alone is believed to arise from the freshly formedalumina catalysing afterglow of the polymer residue, resulting in incompleteoxidation.7 This effect is suppressed by the presence of ZHS, particularlyunder fuel-rich conditions, where the CO yield falls from 0.33 for EVA/ATH to0.18 g g−1 of polymer for EVA/ATH with ZHS.
The secondary oxidiser provides a useful means of identifying other types ofcombustion products. The error associated with the % carbon recovered from thedual reaction zones and the evenness of the steady state is less significant whencompared to the orders of magnitude change in the CO yield on moving fromwell to poorly ventilated conditions.
29.5 ConclusionsCusack et al. have indicated that ZHS and ZS could be used as a highly effectiveflame retardant.3 Other work on the samples has indicated that ZHS is aneffective synergist with ATH and MH under well-ventilated conditions in thecone calorimeter,3 particularly with regard to suppression of CO and smoke.This work, investigating these materials under less well-ventilated conditions,has not shown a clear advantage of EVA/ATH/ZHS or EVA/MH/ZHS in termsof CO yield.
Different physical fire models give different smoke and CO yields. Care mustbe taken to choose the appropriate model when using small-scale tests to predictthese yields. No clear advantage has been found in encapsulating ZHS, particu-larly in terms of smoke and toxicity, though there may, however, be advantagesin physical properties.
The MH additives lowered the smoke levels measured by the Purser furnacemore than the ATH additives did; however, at high w ratios these samples didnot exhibit superior smoke suppressant behaviour. The cone calorimeter ventila-tion conditions appear to correlate to a Purser w ratio of between 0.7 and 1.0.The Purser furnace used in this work, with a tube diameter at the higher end ofthe range specified in the tube furnace standard, BS 7990:2003, still showedsigns of quenching occurring at high ventilation.
29.6 AcknowledgementsThe authors thank Drs Paul Cusack and Matthew Cross of Tin Technology forsupplying the samples used in this study. One of us (CLW) thanks the Engineer-ing and Physical Science Research Council (EPSRC) for financial support.
References1. R.N. Rothon, in Particulate-Filled Polymer Composites, R.N. Rothon (ed.),
Longman, Harlow, U.K., 1995, Chapter 6.

398 Chapter 29
2. G.T. Linteris, V. Knyazev and V. Babushok (NIST), presented at the HalonTechnical Working Conference, 2001.
3. M.S. Cross, P.A. Cusack and P.R. Hornsby, Polym. Degrad. Stab., 2003,79, 309–318.
4. D.A. Purser, P.J. Fardell, J. Rowley, S. Vollam and B. Bridgeman, inProceedings of the 6th International Conference Flame Retardants ‘94’,InterScience Communications, London, Jan. 1994, pp. 26–27.
5. W.M. Pitts, Prog. Energy Combust. Sci., 1995, 21, 197–237.6. V. Babrauskas, W. Parker, G. Mullholland and W. Twilley, Rev. Sci.
Instrum., 1994, 65(7).7. T.R. Hull, R.E. Quinn, I.G. Areri and D.A. Purser, Polym. Degrad. Stab.,
2002, 77, 235–242.8. M. Cross, Personal communication of unpublished data, 2003.9. BS 7990, 2003, Tube furnace method for the determination of toxic products
in fire effluents.

399
CHAPTER 30
Improved and Cost-EfficientBrominated Fire RetardantSystems for Plastics andTextiles by Reducing orEliminating Antimony TrioxideRUDI BORMS,1 RONALD WILMER,1a MICHAEL PELED,2
NURIT KORNBERG,2 ROYI MAZOR,2
YOAV BAR YAAKOV,2 JACOB SCHEINERT2
AND PIERRE GEORLETTE2
1Eurobrom B.V., Verrijn Stuartlaan 1, 2288 EK Rijswijk, The Netherlands2DSBG, P.O. Box 180, 84101 Beer Sheva, Israel ([email protected])aCurrent address: NOVA Chemicals, Brede, The Netherlands 2288 EKRijswijk
30.1 IntroductionBrominated fire retardants (FRs) are well known for their superiority1 in firesafety and, in contrast to other FR types, they are not limited to specificmaterials. Among the synergistic agents, antimony trioxide, by far the mostefficient,2–4 further increases brominated FR effectiveness by enabling bromineto stay in the flame zone for longer periods.5 However, for special applications,the use of antimony trioxide may be accompanied by certain detrimentaleffects.6–9 Moreover, antimony trioxide prices have increased significantly since2002. To address these needs, recent developments of new fire retardant systemsare being offered to reduce or even eliminate the use of antimony trioxide. Thischapter reviews some particular applications.
30.2 Polypropylene (PP)The total worldwide consumption of PP was ca. 32 million mT (2002) with anestimated growth of 7.2% yr−1 during the following three years, but its flame

400 Chapter 30
retardant applications are proportionately much less important than for otherresins such as styrenics and engineering thermoplastics. High standards of flameretardancy required in the electronics and building industries with PP com-pounds are indeed difficult to achieve at reasonable cost and with satisfactoryproperties. The cause of this difficulty is its high crystallinity and flammability.
SaFRon-5371, a new aliphatic bromine flame retardant system that has beenintroduced recently by DSBG,10 can be formulated as an antimony trioxide freeoption for V-2 PP (homo- and block copolymers) and V-0 dripping homopoly-mer. This flame retardant system is recommended for indoor and outdoor appli-cations where long-term UV/light stabilities are required. It is also suggested foruse in the production of fibers for carpet applications where it is preferred toavoid use of antimony trioxide.
To obtain non-dripping UL 94 class V-0 PP, the high FR loading requiredresults in loss of mechanical and physical properties.11–13 The use of intumescentP/N technology limits thermal processing stability and is accompanied by theproduction of acidic species during processing often causing mold plate out,blooming and poor recycling due to water absorption.11
Most flame retarded PP compounds produced today are flame retarded bybrominated FRs, in particular decabromodiphenyl oxide in combination withantimony trioxide.14 The disadvantages of antimony trioxide based systems arean increase in smoke density15 and loss in impact properties of the base resin.This is particularly true with PP block copolymers that require higher loadingsof flame retardants compared with homopolymer systems.14 Several publica-tions describe ways to reduce antimony trioxide content in flame retarded PPcompounds,16,17 but even with the addition of 20 wt% talc, complete eliminationof antimony trioxide is not achieved.
To address these limitations, DSBG has developed a hybrid filler type flameretardant system designed to produce UL 94 non-dripping class V-0 PP blockcopolymers without use of antimony trioxide. Typical properties of this newFR system, designated SaFRon-5202, are given in Table 1. This FR is surfacetreated to ensure its good dispersion during the processing steps. Unlike intumes-cent FR systems, it has very good thermal stability, allowing high processingtemperatures during compounding and molding.
Table 1 Properties of SaFRon-5202
Appearance White to off-white micronised powder
Active FR content (%) 98.6Melting start, °C >300Specific gravity, g cm−3 2.58
Thermogravimetric Analysis(TGA–10°C min−1 in air)Weight loss (%) Temperature (°C)2 3555 37610 395

401Improved and Cost-Efficient Brominated Fire Retardant Systems
The main advantages offered by SafRon-5202 in PP applications are UVstability, low smoke generation, good impact properties and cost efficiency.Table 2 gives comparative formulations and properties for SaFRon-5202 versusthe classical decabromodiphenyl oxide/antimony trioxide system.
30.3 High Impact Polystyrene (HIPS)Flame retarded grades of HIPS are widely used for the production of housings ofelectric and electronic equipments (television, PC monitors, audio and video).Decabromodiphenyl oxide, by far the most popular FR for TV housing applica-tions, is cost efficient but has poor UV stability and is not melt blendable duringinjection molding. It is thus not suitable for the production of large size TVhousings with light grey colour recently introduced in the market.
For this case, tris(tribromophenyl) cyanurate (FR-245 DSBG), a joint devel-opment between the Japanese Company Dai-Ichi Kogyo Seiyaku (DKS) andDSBG, offers an optimal balance of properties: high melt flow during injectionmolding, excellent light stability, good impact properties and high heat distor-tion temperature (HDT). Its main properties and chemical structure are given inFigure 1.
The combination of 67% aromatic bromine and a cyanurate segmentprovides good flame retardant efficiency and UV/light stability. Use of FR-245also enhances flow during injection molding as it melts during the process. Inaddition to its good thermal stability, FR-245 is designed and developed to beenvironmentally friendly.
Table 2 Non-dripping V-0 PP block copolymer flame retarded by SaFRon-5202
SaFRon-5202 Decabromo DPOFR type Ref. no FR (Sb2O3 free) (FR-1210 DSBG)
Composition (wt%)PP Capilene SL50 100 46 61.5Flame retardant – 54 27Antimony trioxide – – 11.5
PropertiesFlame retardancy
UL 94 (1.6 mm) class NR V-0 V-0MFI (230°C–2.16 kg), g (10 min)−1 9 8 9
Tensile propertiesStrength at yield (MPa) 25 20 20Elongation at break (%) 74 55 45Modulus (MPa) 1200 2800 1600Notched IZOD, J m−1 120 73 47HDT (1820 kPa), °C 50 57 55NBS smoke density 100 400 >900(ASTM E662-flaming mode)
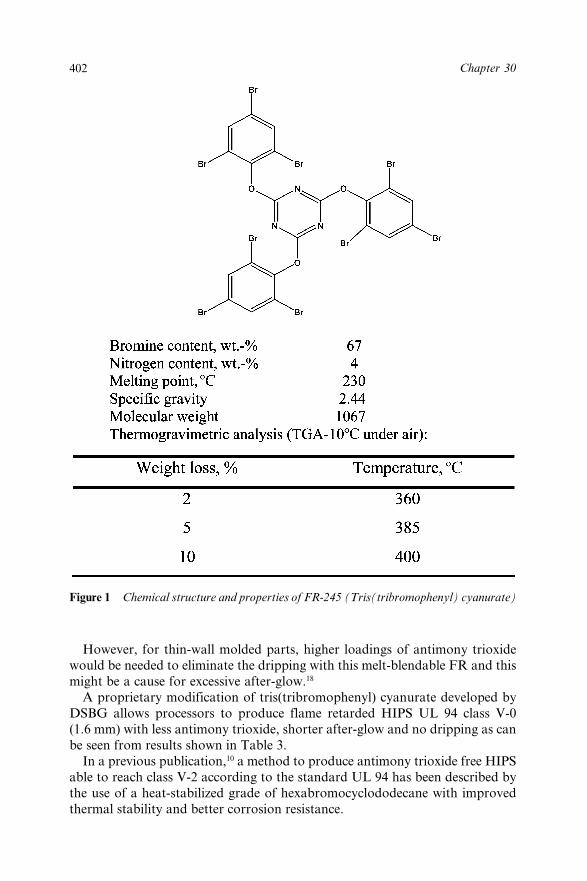
402 Chapter 30
However, for thin-wall molded parts, higher loadings of antimony trioxidewould be needed to eliminate the dripping with this melt-blendable FR and thismight be a cause for excessive after-glow.18
A proprietary modification of tris(tribromophenyl) cyanurate developed byDSBG allows processors to produce flame retarded HIPS UL 94 class V-0(1.6 mm) with less antimony trioxide, shorter after-glow and no dripping as canbe seen from results shown in Table 3.
In a previous publication,10 a method to produce antimony trioxide free HIPSable to reach class V-2 according to the standard UL 94 has been described bythe use of a heat-stabilized grade of hexabromocyclododecane with improvedthermal stability and better corrosion resistance.
Figure 1 Chemical structure and properties of FR-245 (Tris(tribromophenyl) cyanurate)

403Improved and Cost-Efficient Brominated Fire Retardant Systems
30.4 Styrenic CopolymersTribromophenol end-capped brominated epoxies have been designed to ensureoptimal properties in styrenic copolymers (ABS and HIPS) and their alloys.F-3020 (properties in Figure 2) is a melt blendable flame retardant combininggood IZOD notched impact properties with UV and light stability.
It is suitable for UL-94 V-0 ratings. A particular advantage of F-3020is freedom from metal adhesion problems during lengthy injection moldingoperations.
However, ABS formulations containing tribromophenol end-capped bromi-nated epoxies have very low Gardner impact properties. DSBG is presently
Table 3 Properties of HIPS flame retarded by tris(tribromophenyl) cyanurate
tris(Tribromophenyl) Modified tris(tribromophenyl)cyanurate cyanurate
Type (FR-245-DSBG) (Proprietary DSBG)
Composition (wt%)
HIPS (Styron 472 – Dow) 79.9 79.9 81.6Flame retardant 16.4 17.4 15.9Antimony trioxide 3.7 2.7 2.5
Bromine content (%) 11 11.5 10.5
Flame retardancy(UL 94–1.6 mm)
Total flaming time (s) 10 9 25Total after-glow (s) 34 0 0Non flaming dripping 1 0 0
Class V-0 V-0 V-0
Figure 2 Chemical structure and properties of F-3020. tribromophenol end-cappedbrominated epoxy

404 Chapter 30
developing proprietary modified grades of tribromophenol end-capped bromi-nated epoxies that have enhanced fire retardant properties, providing class V-0with less antimony trioxide. This reduction is accompanied by a significantimprovement in Gardner impact properties (Table 4).
30.5 PolyamideData in a recent paper,19 show that brominated flame retardants are superior tohalogen-free systems for engineering resins in combining the highest standardsof fire-safety (V-0) with demanding thermomechanical performance.
Moreover, according to incineration studies conducted by the GSF –Research Center for Environment and Health and the Technishe University ofMunich, the toxicity of the combustion products from an engineering resin fireretarded by a brominated fire retardant is several times lower than for a resinfire retarded by a halogen-free system based on phosphinic acid salt and thanbeech wood used as a reference.20 Non-FR engineering resins also emit highlytoxic smoke during incineration.
Brominated trimethylphenyl indan (see properties in Figure 3), is aproprietary flame retardant, designated FR-1808, offered by DSBG and isparticularly suitable for use with polyamide 6 and 6,6 with or without fiber
Table 4 Properties of ABS flame retarded by tribromophenol end-cappedbrominated epoxies
Tribromophenol Modifiedend-capped BEO tribromophenol
Type (F-3020-DSBG) end-capped BEO
Composition (wt%)
ABS medium impact 75.9 79.6Flame retardant 17.8 16.2Antimony trioxide 6.0 3.9UV absorber 0.3 0.3
Bromine content (%) 10 9
Properties
Flame retardancyUL-94, class (1.6 mm) V-0 V-0
MFI (220°C-10 kg), g (10 min)−1 28 25Tensile
Maximum strength (MPa) 41 42Elongation at break (%) 3.5 4Modulus (MPa) 2300 2600IZOD notched impact (J m −1) 92 105Gardner impact (kg cm) 16 85HDT (1.81 MPa annealed) (°C) 91 90UV stability, Delta E 8 7(Xenotest 300h-ASTM D4459-93)

405Improved and Cost-Efficient Brominated Fire Retardant Systems
reinforcement. FR-1808 exhibits inherent advantages over other halogenatedFR additives currently used for the same applications, as a result of its chemicalstructure, high bromine content and good thermal stability. In addition, theprocessability of polymers containing FR-1808 is very good.
The use of FR-1808 is advantageous when the following properties arerequired: cost/effective flame retardancy, good temperature stability, easyprocessability and high melt flow properties (for production of parts with thinwalls and/or large dimensions with short injection molding cycles and highprecision), and good impact properties and electrical properties
For special applications in nylon, the market is looking for cost efficientantimony trioxide free FR systems in order to get better electrical propertiessuch as a high tracking index while maintaining the highest level of fire safety.SaFRon-5201 is a proprietary fire retardant sytem using the FR efficiency ofbrominated trimethylphenyl indane to address this need. Typical propertiesof this FR system, designated SaFRon-5201, are given in Table 5. This FR is
Figure 3 Chemical structure and properties of FR-1808, brominated trimethylphenylindan
Table 5 Properties of SaFRon-5201
Appearance White to off-white powder
Active FR content (%) 98.9Melting start (°C) 240Specific gravity (g cm−3) 2.5Thermogravimetric analysis (TGA – 10°C min−1 in air)Weight loss (%) Temperature (°C)2 3015 33310 350

406 Chapter 30
surface treated to ensure its good dispersion during the processing steps andgood compatibility with the resin.
The main advantages offered by SaFRon-5201 in glass reinforced polyamideapplications are high fire retardancy and tracking index, good thermome-chanical properties and cost efficiency. Table 6 gives comparative formulationsand properties for SaFRon-5201 versus the reference based on brominatedtriphenyl indane/antimony trioxide system.
30.6 Polycarbonate (PC) and its Alloys with ABSPC-ABS alloys flame retarded by phosphate esters are often used in the produc-tion of halogen-free housings of E & E equipments. In this case a fire retardantof choice is resorcinol diphosphate (RDP).
Halogen-free PC ABS are not easy to compound as the fire retardant system isin a liquid state. Moreover, their heat distortion temperatures (HDT) are ratherlow versus the non-flame-retarded alloys.
DSBG found that modified grades of high molecular weight brominatedepoxy enable production of fire retarded PC ABS alloys with the followingadvantages: class V-0 achievable without antimony trioxide, HDT very close tothat of the non fire retarded alloys and high IZOD impact.
Table 6 Glass-reinforced polyamide 6,6 flame retarded by SaFRon-5201
BrominatedRef. SaFRon-5201 trimethylphenyl indane
FR type no FR (Sb2O3 free) (FR-1808 DSBG)
Composition (wt%)Polyamide 85 48.5 60.9Glass fiber 15 15 15Flame retardant – 36.5 16.5Antimony trioxide – – 7.6
PropertiesFlame retardancy:
UL 94 (0.8 mm) class NR V-0 V-0Limited oxygen index (LOI) (%) 22 57 51
Spiral flow (inch at 310°C) 43 39 58Tensile properties
Strength at break (MPa) 115 125 117Elongation at break (%) 2.1 2.4 2.4Modulus (MPa) 6600 6400 7300
Flexural propertiesStrength (MPa) 195 197 182Modulus (MPa) 5300 8200 6100
Notched IZOD (J m−1) 37 53 37Unnotched IZOD (J m−1) 302 350 320HDT (1820 kPa) (°C) 242 236 240Comparative tracking index (CTI) (V) 575 350 275
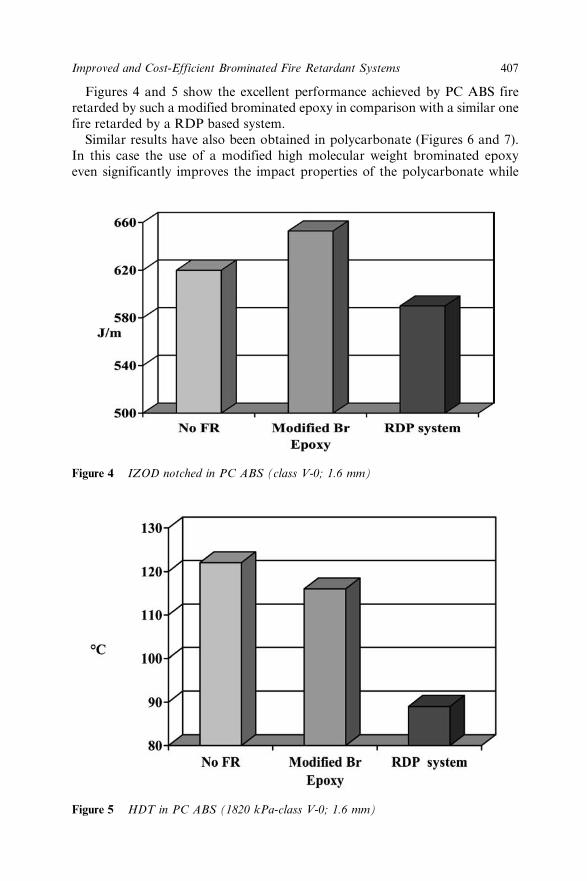
407Improved and Cost-Efficient Brominated Fire Retardant Systems
Figures 4 and 5 show the excellent performance achieved by PC ABS fireretarded by such a modified brominated epoxy in comparison with a similar onefire retarded by a RDP based system.
Similar results have also been obtained in polycarbonate (Figures 6 and 7).In this case the use of a modified high molecular weight brominated epoxyeven significantly improves the impact properties of the polycarbonate while
Figure 5 HDT in PC ABS (1820 kPa-class V-0; 1.6 mm)
Figure 4 IZOD notched in PC ABS (class V-0; 1.6 mm)

408 Chapter 30
maintaining the HDT. Interestingly, a similar decabromodiphenyl oxide(Decabromo DPO) based system causes a severe drop in impact.
30.7 Textile Back-CoatingBack-coating by brominated fire retardant systems is the major method forcontrolling efficiently the flammability of textile products.21 This technique isused for applications such as upholstery, wall coverings and seats for theautomotive industry.
Figure 7 HDT in PC ABS (1820 kPa-class V-0; 1.6 mm)
Figure 6 IZOD notched in PC (V-0; 1.6 mm)

409Improved and Cost-Efficient Brominated Fire Retardant Systems
Antimony trioxide is used as a synergist, but problems, including price vola-tility, pigmentation and stiffening, have led to a search for antimony trioxidefree systems. The SaFRon-5700 series are now being tested successfully in anti-mony trioxide free back-coating systems for application on cotton. Properties ofthe SaFRon-5700 series are given in Table 7.
Cotton fabric treated by FR latices containing 40% of these fire retardantswith a pick-up of 50 g m−2 pass the severe standard BS-5852/1-2 (cigarette andmatch). The handle of the treated fabrics is very soft and treatment by theSaFRon-5700 series is semi-clear.
30.8 ConclusionAntimony trioxide is considered as the most efficient synergist for brominatedfire retardants. Its use has been driven by its effectiveness in reducing theamount of bromine-containing compound needed to meet a high level of fire-safety. But, for some applications, antimony trioxide has several drawbacks andthere is a need to limit or avoid its use.
Some factors limiting its use in fire retardant systems are a significant priceincrease during 2002, a high density, melt flow reduction and detrimental effecton impact and electrical properties, loss of transparency, smoke density and af-ter-glow and, finally, good handling.
This chapter has introduced recent developments of fire-retardant systemsenabling elimination or a sharp reduction in the use of antimony trioxide. Appli-cation areas are in styrenics and their alloys, polypropylene, engineeringthermoplastics and textiles.
30.9 AknowledgementThe authors thank Drs Joe Simons, A. Staimetz, M. Manor and M. Ben Simonfor their contributions, which rendered this publication possible.
30.10 References1. R. C. Kidder, J. H. Troitzsch, E. Naumann and H. J. Roux, from Course
Work Materials in New Developments and Future Trends in Europe andthe United States for Fire Retardant Polymer Products, (1989).
Table 7 Properties of SaFRon-5700 series
Appearance White powder
Bromine content (%) 67Melting start (°C) 100Specific gravity (g cm−3) 2.3–2.4
(TGA – 10°C min−1 in air)Weight loss (%) Temperature (°C)2 2945 31610 324
410 Chapter 30
2. E. D. Weil in: A. F. Grand & C. A. Wilkie (Eds)., Fire Retardancy of Poly-meric Materials, Marcel Dekker Publisher, New-York, 2000, pp. 120–122.
3. A. R. Horrocks in: A. R. Horrocks and D. Price (Eds)., Fire retardantmaterials, Woodhead Publishing limited, Cambridge England, 2001,pp. 148–149.
4. H. Zweifel in: Plastics Additives Handbook, Hanser 5th Edition, 2000,pp. 682–684.
5. J. W. Hastie in: High Temperature Vapors, Academic Press, Inc.,New York, 1975, p. 353.
6. Wern-Shiarng Jou et al. in: The influence of red phosphorus upon the flameproperties and dielectric properties of glass fiber reinforced nylon-66,SPE-ANTEC, 1520 (2001), Society of Plastics Engineers, Brookfield, CT,USA.
7. P. S. Murfitt et al. in: Some alternative Synergists for Halogen-Containingflame retardants polymers, Flame Retardants 92, The Plastics and RubberInstitute, Elsevier Applied Science 1992, pp. 176–186.
8. R. Schmidt, R. Herbit, M. Amberg in: Smoke Gets in Your Eyes,Conference Proceedings ANTEC 98, Society of Plastic Engineers, CD Rom.
9. C. Wild: Spin Finishes for Polypropylene Staple Fibres used in the SpunlaceProcess, Proceedings of the Polypropylene in Textiles World Congress;Huddersfield 5–6th July 2000, Nonwoven.co.uk, Eathorpe, Warwickshire,UK.
10. T. Geran, I. Finberg, G. Reznick, S. Hini, D. Plewinsky and Y. BarYaakov: Development for fire retarded plastics with reduced or nopresence of antimony trioxide, the 14th annual BCC Conference onFlame retardancy, June 2–4, 2003, Business Communications Company,Inc., Norwalk, Connecticut, USA.
11. J. F. Day in: Improved non-halogen fire retardant technology forpolyolefins, Proceedings of the Fire Retardant Chemicals Association(March 12–15, 2000), pp129–137, Fire Retardant Chemicals Association,Lancaster, Pennsylvania, USA.
12. M. J. Keough in: Past, Present and Future Developments in FlameRetarded Polyolefins, Proceedings of Business Communications Co., Inc.Second Symposium, Stamford CT, (May 1991), Business CommunicationsCompany, Inc., Norwalk, Connecticut, USA.
13. M. Tono and M. Ogasa in: Fire-resistant Polyolefin Resin Compositionscontaining Ammonium Polyphosphate and Metal Oxides, Japanese patent7330968 (1994).
14. S. Munro and R. Farner in: High performance N-P Flame retardants forPP, Proceedings of Maack Polypropylene 2001, (11th–13th September2001), Maack Business Services, CH-8804 AU, Switzerland.
15. Baljinder K. Kandola and A. Richard Horrocks in: A. R. Horrocks andD. Price (Eds)., Fire retardant materials, Woodhead Publishing Limited,Cambridge England, 2001 p. 198.
16. R. L. Markezich and R. F. Mundhenke in: Review of synergist used withhalogen flame retardants, Proceedings of the Fire Retardant Chemicals
411Improved and Cost-Efficient Brominated Fire Retardant Systems
Association, October 26–29, 1997, pp. 1–11, Fire Retardant ChemicalsAssociation, Lancaster, Pennsylvania, USA.
17. D. M. Schubert in: The use of borates as fire retardant synergists intalc-filled polypropylene, Proceedings of the Fire Retardant ChemicalsAssociation, March 22–25, 1998, pp 185–194, Fire Retardant ChemicalsAssociation, Lancaster, Pennsylvania, USA.
18. R. C. Nametz in: Bromine compounds for flame retarding polymer com-positions, Proceedings of the Fire Retardant Chemicals Association,March 28–30, 1984, pp 55–131, Fire Retardant Chemicals Association,Lancaster, Pennsylvania, USA.
19. M. Wagner in: Modern Plastics International February 2003, pp 70–71.20. N. Milanov, K. Doods, K. W. Schramm, G. Matuschek, D. Lenoir and
A. Kettrup in: Comparison between halogenated and phosphorus-containing flam retardants in polybutyleneterephthalate: toxicological andecotoxicological evaluation of the combustion products, OrganohalogenCompounds, Vol. 55 (2002).
21. L. Costa, P. Georlette and J. Simons, in: Arthur F. Grand and CharlesA. Wilkie (Eds)., Fire Retardancy of Polymeric Materials, Marcel Dekker,New-York, 2000, pp. 279–280.
412
Subject Index
Acrylonitrile – butadiene – styrenecopolymer
FR formulations, 24the use of tribromophenol
end-capped brominated epoxy,403
Adaptive interphase concept, 354Alkali silicates
fire retardants, 68intumescence, 71, 72protective effect, 77synthesis, 70swelling, 68, 87thermal degradation, 84
Aluminium hydroxide (see aluminatrihydrate)
Alumina trihydratecommercial grades, 20endothermal decomposition, 23, 372,
386fire retardant filler, 4, 252in intumescent EVA, 302surface modification, 337synergy with basalt fibres, 342synergy with zinc borates, 327
AminosilaneATH surface treatment, 345
Ammonium polyphosphatein intumescent, 241, 248mixtures with hydroxides, 254–257thermal degradation, 253
Antimony oxidedetrimental effects, 399reduction of its content, 399synergist, 28
Barium sulphateassociation with ATH, for
mechanical properties, 357filler in intumescent PP, 349
Barrier effect, 264Basalt fibres
Reinforcement of thermosettingpolymers, 342
Basic magnesium carbonatesuse in fire retardant additives, 21
Bentonite, 126Boehmite, 21
ATH degradation intermediate, 23Brominated fire retardants, 399
Calcium carbonateFR additive, 28
Calcium sulphate dihydrate, (gypsum),21
Carbon dioxide/carbon monoxideyields ratios, 377, 391, 388
Carbon monoxide suppression, 372Carbon nanotubes
fire retardant additives, 5, 91Charring, 62Clayorganic modifiers, 148thermal degradation, 150Coumarin intercalation, 114
DPDPOsynergist, 28
“Epiradiateur test”, 304Engineering polymer composite, 336Equivalence ratio, 374, 388, 390EVA
EVA nanocomposites, 240, 303fire retardancy using Alkali silicates,
69FR formulations, 373intumescent, 248, 302
413Subject Index
smoke and CO suppressionmechanism in, 372, 393
steady state combustion, 387thermal degradation, 390
Expandable nanocomposite, 353
FCC catalystsSynergistic agent in intumescent
material, 313Fillers
coating effect, 27dilution of combustible polymer, 24economical data, 14, 110endothermal decomposition, 23fire retardancy mechanisms, 23fire retardant additives, 19, 22incandescence, 27microsized, 4, 25particles size effect, 319release of water or inert gases, 25synergists for, 28, 30thermal effect, 23
Fire models, 376Fire retardancy
history, itesting, 3, 22, 82, 142
Fire retardantsclasses, ismall amounts, 54
Flame type, 373Flash pyrolysis, 204, 206Fluorohectorite, 11
Gaseous productsanalysis, 102, 106, 249toxicity, 372tests, 376
Glass fibre reinforcement, 265Graphite
degradation, 10in nanocomposites structures,
fire retardancy, 12in polypropylene nanocomposite, for
modelling thermal
Hazard estimating, 372Hectorite
in PP FR nanocomposites, 95, 126HIPS
the use of tris(tribromophenyl)cyanurate, 401
the use of tribromophenolend-capped brominated epoxy,403
Hydroxidesfire retardant additives, mechanism,
4, 42, 292modification of mechanical
properties, 100, 292synergy with flax fibres, 291synergy in intumescent EVA, 248,
252synergy with zinc borates, 328
Intumescence, 239insulation effect, 271, 292fire retardancy via, 315, 336, 347XPS, 351zinc borates, synergists in, 332
Isocyanateevolution from thermal degradation
of PU, 363toxicity, 363
Layered double hydroxides (LDHs)anion exchange, 44chemical composition and structure,
0043uses, 43
LDHs – polymer compositesflame resistance, 50LDHs – epoxy nanocomposite, 45,
49, 50LDHs – polyimide nanocomposites,
47LDHs – LPDE nanocomposites, 49LDHs – PVC nanocomposites, 50mechanical properties, 46smoke suppression, 50synthesis, 44
Magadiite (layered silicate), 11, 126Magnesium hydroxide
commercial grades origin, 20endothermic decomposition, 374, 382fire retardant filler, 4, 23, 100, 252,
264inorganic residue effect, 269in intumescent EVA, 302in poly(propylene) formulations,
thermal stability, 105

414 Subject Index
smoke reduction , 25, 382, 395synergy with zinc borates, 375
Magnesium tetraborateboric acid generation, 375thermal degradation, 375
Materials for vehicles, 347Mechanical properties
coupling agents, 35fatty acids for, 35of intumescent PP, 339, 341surface modification of fillers for, 34
Melabis,intumescent additive, 333synergy with zinc borates, 333
Melamineassociation with hydroxides, 5elimination of the after-glow effect,
33Metal oxides
synergists, 31Mica
in PP composites, 98Montmorillonite
fire retardant additive, 5in clay – polymer nanocomposites,
8–13, 86
Nanoclay-FR interaction,in intumescent systems, 239, 341modelling, 235
Nanocompositeschar promoting effect, 147clay loading effect, 115clay size effect, 135definition, 3dispersion of the clay layers, 115enhanced properties, 10fire retardance, 10, 101, 131, 147,
163, 196, 229–233history, 6, 161inorganic residue effect, 269insolation properties, 271iron content effect, 135melting point, 225morphology, 9NMR characterization, 179, 181, 196preparation, 8, 9textile, 193, 223thermal stability, 119, 131, 196, 306
transmission electron microscopy(TEM) characterization, 103, 129,162,180
types, 8, 114X-ray diffraction (XRD)
characterization, 103, 129, 141,162, 180, 305
Nanodimensional materialspresentation, 6, 81
Nanosilica in polymer nanocompositesfire retarded PMMA/silica
nanocomposites, 82Novolac resin
association with hydroxides, 5, 30Nuclear magnetic resonance
Morphology identification ofnanocomposites, 9
Organoclaysmodifications, 9
PANsynergist, 29
PCdegradation steps, 61fire retardancy, 57
Pentaerythritolcarbonization agent in intumescent,
313Plant derivativesFR additives, 291Plasma process
cold remote nitrogen plasma CRNP,278
polymer surface modification andcoating, 276
Polyamide-6charring agent in intumescent
material, 336FR formulations, 22nanoclays and FR additives in, 223,
229, 241plasma coating, 277pro-degradative action of hydrated
fillers, 25rheology, 31synergy in, 233the use of brominated
trimethylphenyl indan, 404the use of tribromophenol
end-capped brominated epoxy,404

415Subject Index
Polyamide-6.6char formation, 265, 268pro-degradative action of hydrated
fillers, 25Polybutylene terephthalate
FR formulations, 24Polycarbonate
the use of brominated additives, 411Polyester resins
effect of fire retardants, 155effect of clays on the fire retarded
resin, 156thickening, 34thermal degradation, 153
Polyethylenethe use of hydroxides, 5
Polyhedral oligomeric silsequioxanes(see POSS)
Polymer – clay nanocompositesexfoliated PA-6 / clay, 86PS / MMT, 93
Polymer – graphite oxidenanocomposites
history, 161morphology, 163synthesis, 162thermal stability, 169XPS, 168
poly(methylmetacrylate)ATH blending, 26
Poly(phenyleneoxide)FR formulations, 23
Polypropylenechar formation from PP/MH
composites, 110economical data, 396flax fibres composite, 291mechanical properties, 121multifilament yarns, 193nanocomposite, 114, 241thermal stability of nanocomposites,
114the use of hydroxides, 5, 23, 101the use of MWNT, 91the use of POSS, 173the use of SaFron-5202, 399
Polystyrenepolystyrene / MMT nanocomposite,
90polystyrene hectorite nanocomposite,
126, 131
Polyurethane effect of clay on reduction of toxic
products evolution, 365nanocomposite surface charring, 142polyurethane foam/organophilic
montmorillonite nanocomposite,139
Porous silica / support, 58POSS
fire retardant additives, 7isobutyl POSS thermal degradation,
205, 210in nanocomposite structures, 203presentation, 7, 202, 189WAXD, 217
PPFBS,additive in PC, 58
PPhadditive in PET, 59additive in PBT, 59
Processingalternative processing strategies, 35co-injection moulding, 35effect of processing conditions, 114multi-component polymer
processing, 35rheology of polymers, 31use of magnesium stearate, 32
PTFMSadditive in PC, 56, 58
PU nanocompositecoating, 193synthesis, 193
PURSER furnace, 376, 387Red phosphorus
synergist, 27, 265SAN-cloisite nanocomposites, 178
flammability, 184tensile properties, 184
Saponitein clay – polymer nanocomposites,
42Secondary oxidiser, 389Silanes
synergists, 30Silica
synergist in nanocomposites, 307Silicates surface migration, 158Silicone polymers
synergists, 28

416 Subject Index
Simulated heat release, 142Smoke suppression
hydroxides effects, 26mechanism, 372
Smoke test, 376, 387Spent oil refinery catalysts
synergists in intumescent, 313Tactoids, 8Talc
in intumescent PP-basedformulations, 338
synergist, 308
Unsaturated polyester/functionalizednanoclays
effect of different clays, 153
synthesis, 148thermo-oxidative degradation, 155
ZeoliteSynergists, 314
Zinc boratesfire retardant, 328
smoke suppressants, 327structures, 327synergist agents, 27, 29, 327, 332, 374
Zinc oxide, 58Zinc hydroxystannate
coatings, 30reduction of smoke and of toxic
gases emission, 375synergist, 30, 387