M. Jodi Rell - ct
21
Transcript of M. Jodi Rell - ct


M. Jodi Rell Governor
Office of Policy and Management
Robert L. Genuario, Secretary
Intergovernmental Policy Division
W. David LeVasseur, Undersecretary
Municipal Finance Services Unit
Robert S. Dakers, Director Jean M. Gula
William W. Plummer Vernieke L. Roper Lori A. Stevenson
Ilka Torres
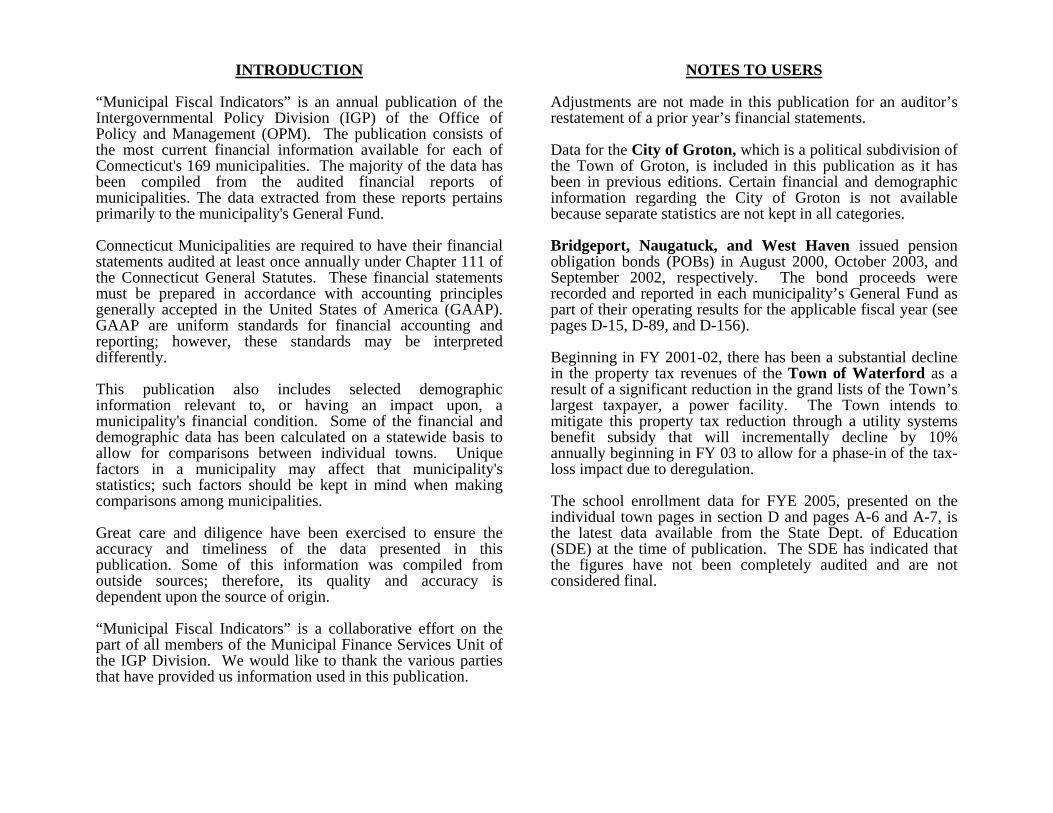
INTRODUCTION “Municipal Fiscal Indicators” is an annual publication of the Intergovernmental Policy Division (IGP) of the Office of Policy and Management (OPM). The publication consists of the most current financial information available for each of Connecticut's 169 municipalities. The majority of the data has been compiled from the audited financial reports of municipalities. The data extracted from these reports pertains primarily to the municipality's General Fund. Connecticut Municipalities are required to have their financial statements audited at least once annually under Chapter 111 of the Connecticut General Statutes. These financial statements must be prepared in accordance with accounting principles generally accepted in the United States of America (GAAP). GAAP are uniform standards for financial accounting and reporting; however, these standards may be interpreted differently. This publication also includes selected demographic information relevant to, or having an impact upon, a municipality's financial condition. Some of the financial and demographic data has been calculated on a statewide basis to allow for comparisons between individual towns. Unique factors in a municipality may affect that municipality's statistics; such factors should be kept in mind when making comparisons among municipalities. Great care and diligence have been exercised to ensure the accuracy and timeliness of the data presented in this publication. Some of this information was compiled from outside sources; therefore, its quality and accuracy is dependent upon the source of origin. “Municipal Fiscal Indicators” is a collaborative effort on the part of all members of the Municipal Finance Services Unit of the IGP Division. We would like to thank the various parties that have provided us information used in this publication.
NOTES TO USERS
Adjustments are not made in this publication for an auditor’s restatement of a prior year’s financial statements. Data for the City of Groton, which is a political subdivision of the Town of Groton, is included in this publication as it has been in previous editions. Certain financial and demographic information regarding the City of Groton is not available because separate statistics are not kept in all categories. Bridgeport, Naugatuck, and West Haven issued pension obligation bonds (POBs) in August 2000, October 2003, and September 2002, respectively. The bond proceeds were recorded and reported in each municipality’s General Fund as part of their operating results for the applicable fiscal year (see pages D-15, D-89, and D-156). Beginning in FY 2001-02, there has been a substantial decline in the property tax revenues of the Town of Waterford as a result of a significant reduction in the grand lists of the Town’s largest taxpayer, a power facility. The Town intends to mitigate this property tax reduction through a utility systems benefit subsidy that will incrementally decline by 10% annually beginning in FY 03 to allow for a phase-in of the tax-loss impact due to deregulation. The school enrollment data for FYE 2005, presented on the individual town pages in section D and pages A-6 and A-7, is the latest data available from the State Dept. of Education (SDE) at the time of publication. The SDE has indicated that the figures have not been completely audited and are not considered final.

TABLE OF CONTENTS
Section A: General Information Page Section C: Statewide Rankings Page Glossary of Terms 1 Percent Change in Population, July 2001 vs. July 2005 1 Connecticut Totals 6 Population, July 1, 2005 2 Connecticut Averages 7 Population Density per Sq. Mile, July 1, 2005 3 Map of Connecticut 8 Per Capita Income as a % of State Avg., 1999 4 Area in Square Miles 9 Debt per Capita, FYE 2005 7 Bond Ratings as of October 2006 10 Median Household Income as a % of State Median, 1999 8 Form of Government 12 Unemployment Rates, Calendar Year 2005 11 Pensions, Type and Number, FYE 2005 13 TANF Recipients as a % of July 2005 Population 12 Net Pension Obligation, Defined Benefit Plans 15 Net Current Education Expenditures Per Pupil, FYE 2005 14 GASB Statement No. 45 Implementation Dates 31 Current Year Tax Collection Rates, FYE 2005 16 Current Year Adjusted Tax Levy Per Capita, FYE 2005 17 Section B: Current and Multi-Year Data Property Tax Revenue as a % of Total Revenue, FYE 2005 18 Population, July 1, 2005 1 Equalized Mill Rates, FYE 2005 19 Population Density, July 1, 2005 2 Equalized Net Grand List Per Capita, FYE 2005 20 Per Capita Income as a % of State Avg., 1999 3 Net Gain in Housing Permits, Calendar Year 2005 22 Median Household Income as a % of State Median, 1999 5 Moody's Bond Ratings, October, 2006 7 Section D: Individual Town Data Debt Per Capita, FYE 2005 9 Andover to Woodstock, Fiscal Years Ended 2001 – 2005 1 – 170 Ratio of Debt to Grand List 10 Net Current Educ. Expend. Per Pupil, FYE 2003 - 2005 11 Tax Collection Rates, FYE 2005 13 Unemployment Comparison, September 2005 and 2006 15 Mill Rates 16 Revaluation Dates 17 Net Grand List, 2003 and 2004 Grand List Years 19 Illustrative Data Chart or Map Grand List Components 21 Grand List Components, as a % of 10/1/04 Assessment 22 Equalized Net Grand List 25 Equalized Net Grand List, Grand List Years 2003 & 2004 26

SECTION A
GENERAL INFORMATION
A - 1
GLOSSARY OF TERMS
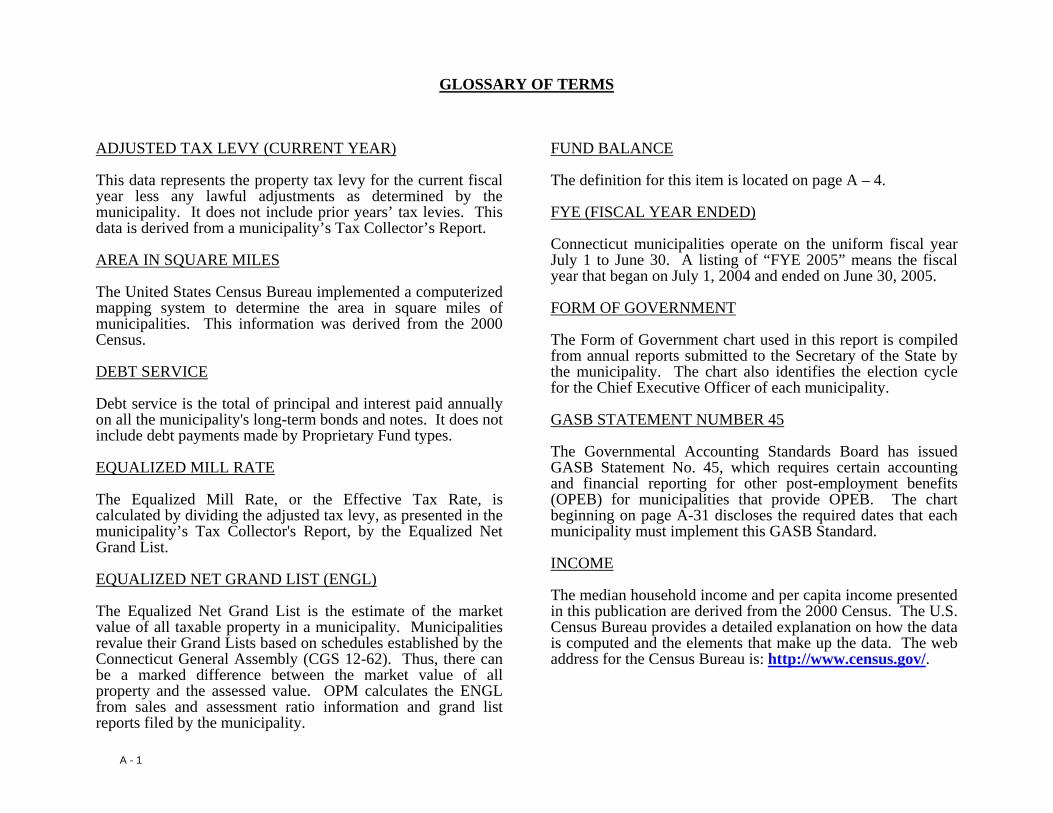
ADJUSTED TAX LEVY (CURRENT YEAR) This data represents the property tax levy for the current fiscal year less any lawful adjustments as determined by the municipality. It does not include prior years’ tax levies. This data is derived from a municipality’s Tax Collector’s Report. AREA IN SQUARE MILES The United States Census Bureau implemented a computerized mapping system to determine the area in square miles of municipalities. This information was derived from the 2000 Census. DEBT SERVICE Debt service is the total of principal and interest paid annually on all the municipality's long-term bonds and notes. It does not include debt payments made by Proprietary Fund types. EQUALIZED MILL RATE The Equalized Mill Rate, or the Effective Tax Rate, is calculated by dividing the adjusted tax levy, as presented in the municipality’s Tax Collector's Report, by the Equalized Net Grand List. EQUALIZED NET GRAND LIST (ENGL) The Equalized Net Grand List is the estimate of the market value of all taxable property in a municipality. Municipalities revalue their Grand Lists based on schedules established by the Connecticut General Assembly (CGS 12-62). Thus, there can be a marked difference between the market value of all property and the assessed value. OPM calculates the ENGL from sales and assessment ratio information and grand list reports filed by the municipality.
FUND BALANCE The definition for this item is located on page A – 4. FYE (FISCAL YEAR ENDED) Connecticut municipalities operate on the uniform fiscal year July 1 to June 30. A listing of “FYE 2005” means the fiscal year that began on July 1, 2004 and ended on June 30, 2005. FORM OF GOVERNMENT The Form of Government chart used in this report is compiled from annual reports submitted to the Secretary of the State by the municipality. The chart also identifies the election cycle for the Chief Executive Officer of each municipality. GASB STATEMENT NUMBER 45 The Governmental Accounting Standards Board has issued GASB Statement No. 45, which requires certain accounting and financial reporting for other post-employment benefits (OPEB) for municipalities that provide OPEB. The chart beginning on page A-31 discloses the required dates that each municipality must implement this GASB Standard. INCOME The median household income and per capita income presented in this publication are derived from the 2000 Census. The U.S. Census Bureau provides a detailed explanation on how the data is computed and the elements that make up the data. The web address for the Census Bureau is: http://www.census.gov/.

A - 2
LONG-TERM DEBT Long-Term Debt, as reported in this publication, includes long-term liabilities associated with governmental activities. Items included under the long-term debt category includes bonds and notes for which the municipality has pledged its full faith and credit, capital lease obligations, and the portion of Regional School District debt, if any, for which the town is responsible. MILL RATE The mill rate is the rate of taxation levied on property subject to taxation under Connecticut General Statutes. One mill is equal to 1/1000 of a dollar. For example, a tax rate of 20 mills is equivalent to $20.00 per $1,000 of assessed value. Generally, the mill rates of special taxing districts located within the municipalities are not included in this publication. MUNICIPAL BOND RATING A bond rating is an evaluation by credit-rating agencies of a municipality’s credit risk. Bonds covered by municipal bond insurance are usually assigned a AAA rating. A rating for municipalities with insured bonds only is not shown in this publication. A municipality's bonds may be rated by more than one rating agency. The three major rating agencies are Moody’s Investor Services, Standard and Poor’s Corporation, and Fitch Incorporated. Ratings as of October 2006 are presented on the chart on pages A-10 and A-11. The majority of CT municipalities have their bond issues rated by Moody's Investors Service. This rating is presented on the individual town page (Section D). NET CURRENT EXPENDITURES (EDUCATION) Net Current Expenditures (NCE) represent the combination of local, state and federal dollars spent on public elementary and secondary education. NCE excludes expenditures for: regular
education pupil transportation, debt service, land and capital costs, nonpublic expenditures, and expenditures supported by tuition revenue. This data is published annually by the CT Department of Education. NET GAIN IN HOUSING PERMITS The data presented on pages C-22 to C–24 represents increases in the authorized housing inventory, net of authorized demolitions. The data is derived from construction reports produced by the Dept. of Economic and Community Development (DECD) and refers to residential units only. For further information, see the DECD website at: http://www.ct.gov/ecd/site/default.asp. NET GRAND LIST The Net Grand List is the assessed value of all taxable property in a municipality net of exemptions allowed under state statutes as of October 1. PENSIONS See page A-5 for a description and definition of the pension terminology used in this publication. POPULATION The FYE 2001 through 2005 population figures used in this publication are as of July 1 following the end of each fiscal year. For instance, for the fiscal year ended June 30, 2005, the population figures are as of July 1, 2005. The July 1 figures are published annually by the Department of Public Health, as “Estimated Population in Connecticut as of July 1”. RATIO OF DEBT TO ENGL This ratio is calculated by dividing the long-term debt as of FYE 2005 by the October 1, 2003 equalized net grand list.
A - 3
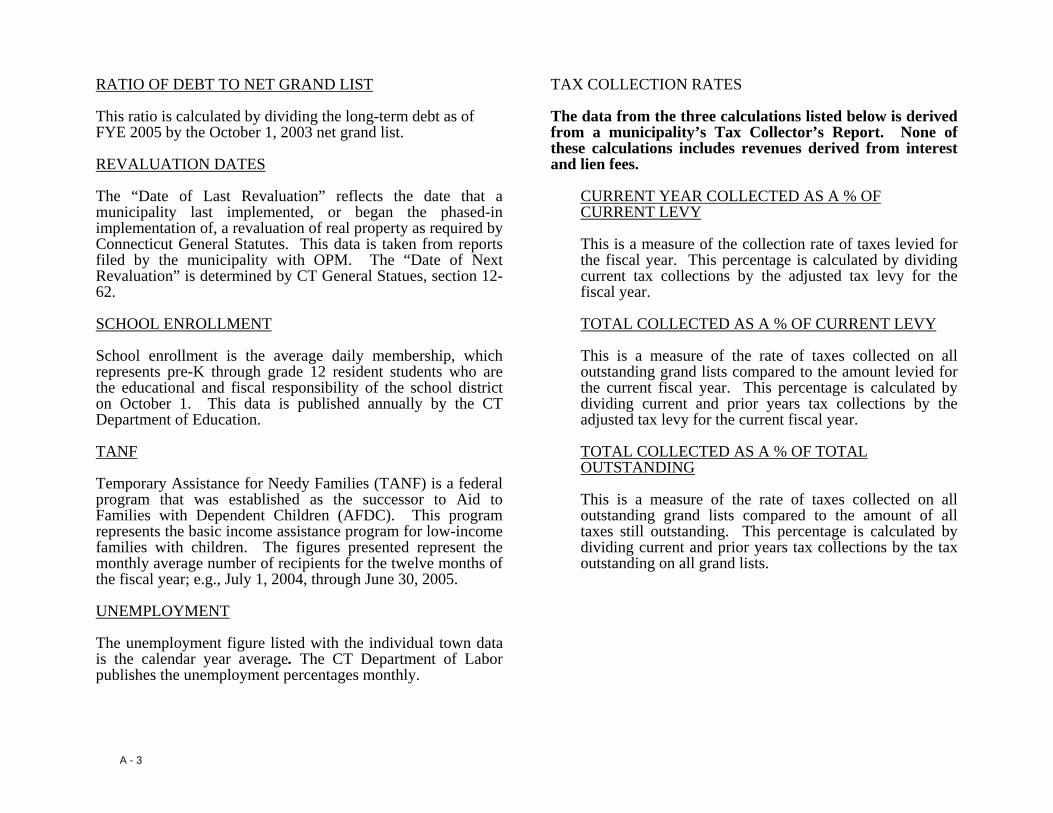
RATIO OF DEBT TO NET GRAND LIST This ratio is calculated by dividing the long-term debt as of FYE 2005 by the October 1, 2003 net grand list. REVALUATION DATES The “Date of Last Revaluation” reflects the date that a municipality last implemented, or began the phased-in implementation of, a revaluation of real property as required by Connecticut General Statutes. This data is taken from reports filed by the municipality with OPM. The “Date of Next Revaluation” is determined by CT General Statues, section 12-62. SCHOOL ENROLLMENT School enrollment is the average daily membership, which represents pre-K through grade 12 resident students who are the educational and fiscal responsibility of the school district on October 1. This data is published annually by the CT Department of Education. TANF Temporary Assistance for Needy Families (TANF) is a federal program that was established as the successor to Aid to Families with Dependent Children (AFDC). This program represents the basic income assistance program for low-income families with children. The figures presented represent the monthly average number of recipients for the twelve months of the fiscal year; e.g., July 1, 2004, through June 30, 2005. UNEMPLOYMENT The unemployment figure listed with the individual town data is the calendar year average. The CT Department of Labor publishes the unemployment percentages monthly.
TAX COLLECTION RATES The data from the three calculations listed below is derived from a municipality’s Tax Collector’s Report. None of these calculations includes revenues derived from interest and lien fees.
CURRENT YEAR COLLECTED AS A % OF CURRENT LEVY This is a measure of the collection rate of taxes levied for the fiscal year. This percentage is calculated by dividing current tax collections by the adjusted tax levy for the fiscal year.
TOTAL COLLECTED AS A % OF CURRENT LEVY This is a measure of the rate of taxes collected on all outstanding grand lists compared to the amount levied for the current fiscal year. This percentage is calculated by dividing current and prior years tax collections by the adjusted tax levy for the current fiscal year.
TOTAL COLLECTED AS A % OF TOTAL OUTSTANDING This is a measure of the rate of taxes collected on all outstanding grand lists compared to the amount of all taxes still outstanding. This percentage is calculated by dividing current and prior years tax collections by the tax outstanding on all grand lists.
A - 4
The data listed below is derived from the General Fund of the municipalities’ audited financial statements. EXPENDITURES
EDUCATION EXPENDITURES Education expenditures represent amounts expended from the General Fund for education, including payments made to regional school districts.
OPERATING EXPENDITURES Operating expenditures consist of total expenditures less education expenditures. TOTAL EXPENDITURES Total expenditures are all expenditures as reported in the General Fund.
FUND BALANCE
TOTAL FUND BALANCE Total fund balance is the excess of fund assets and resources over fund liabilities. The total fund balance of the General Fund, and its three separate components, (as defined below), are presented on each individual town page (Section D).
DESIGNATED FUND BALANCE The designated fund balance represents a portion of the fund balance that is intended for specific uses. RESERVED FUND BALANCE The reserved fund balance represents a portion of the fund balance that is legally segregated for a specific future use and is not available for appropriation.
UNDESIGNATED FUND BALANCE The undesignated fund balance represents a portion of the fund balance that is expendable and available.
NET CHANGE IN FUND BALANCE
This is the difference between revenues (including other financing sources) and expenditures (including other financing uses), net of any special and extraordinary items reported by a municipality for the fiscal year.
REVENUES
INTERGOVERNMENTAL REVENUES Intergovernmental revenues include all revenue received by a municipality from federal and state sources. PROPERTY TAX REVENUES Property tax revenues are the total revenues, including interest and lien fees, generated from real and personal property taxes. TOTAL REVENUES Total revenues are the revenues a municipality receives from all sources, as reported in the General Fund.
SOURCES AND USES (OTHER FINANCING)
OTHER FINANCING SOURCES (OFS)
An increase in the General Fund’s resources not classified as revenues. GAAP limits the use of this category to certain specified situations. A component of OFS is “transfers in”. Transfers In are interfund transactions received by the General Fund from other funds of the municipality.

A - 5
OTHER FINANCING USES (OFU) A decrease in the General Fund’s resources not classified as expenditures. GAAP limits the use of this category to certain specified situations. A component of OFU is “transfers out”. Transfers Out are interfund transactions received by other funds of the municipality from the General Fund. Further details on other financing sources and uses can be found in a municipality’s financial statements.
SPECIAL/EXTRAORDINARY ITEMS Special items are transactions or other events within the control of management that are either unusual in nature or infrequent in occurrence. Extraordinary items are transactions or other events that are both unusual in nature and infrequent in occurrence.
Special and extraordinary items are required under GAAP to be reported separately from other financing sources and uses and are reflected in this publication as a component of “net change in fund balance”.
PENSIONS
GAAP require the audited financial statements of municipalities to include certain information regarding pension plans that the municipality participates in or sponsors. Most Connecticut municipalities participate in one or more of three types of retirement plans. They are defined benefit, defined contribution and cost-sharing plans. The State of Connecticut administers a cost-sharing plan, the Municipal Employees Retirement Fund (MERF). The chart beginning on page A-13 lists the number and the type of plans in each municipality.
NET PENSION OBLIGATION (NPO) Many governmental employers sponsor or participate in defined benefit pension plans on behalf of their employees. In a defined benefit plan, participating employees are promised payments based on a predetermined benefit formula that takes into account an individual employee’s years of service and salary level. The estimated present value of the benefits promised to employees based on service already rendered is known as the actuarial accrued liability (AAL). This is an actuarial liability rather than an accounting liability, and is not reported on the financial statements of the municipality. GAAP requires employers to report a liability for accounting and financial reporting purposes in situations where they have failed to fully contribute the amount determined by the actuary as the annual required contribution (ARC) to the pension plan. The liability for the cumulative effect of current and past (since 1986) under-contributions to the ARC is referred to as the net pension obligation (a positive NPO). If the cumulative effect of current and past contributions result in over-contributions, it is referred to as a negative NPO. The chart beginning on page A-15 reflects the net pension obligation as reported in the notes to the financial statements of the municipality’s June 30, 2005 and 2004 audit reports for each defined benefit plan, except for cost-sharing plans and merit service plans (such as for volunteer firefighters) in which the municipality participates or sponsors. The net pension obligation amounts shown on this chart do not reflect the AAL or the unfunded actuarial accrued liability (actuarial accrued liability net of available pension assets). Unique factors, including funding practices regarding a municipality’s pension plan, may affect the NPO reported for a particular plan; such factors may only be apparent through a detailed review of the pension plan.


* General rating categories for the 154 municipalities rated by Moody's Investment Services as of October 2006.
B - 7
Moody's Bond Ratings *
Aaa Rating8%
Aa Rating32%
A Rating57%
Baa Rating3%

SECTION B
CURRENT AND MULTI-YEAR DATA

* The Grand List includes taxable and nontaxable property as of 10/1/2004.
B - 21
Grand List Components *
Residential69.1%
Comm'l/Indust'l/Pub Util15.8%
Motor Vehicle7.3%
Other1.8%
Personal6.1%
Residential Comm'l/Indust'l/Pub Util Motor Vehicle Personal Other$193,215,461,061 $4,896,175,302$17,182,647,854$20,320,452,246$44,086,031,661

B - 25
Equalized Net Grand List
$240
$260
$280
$300
$320
$340
$360
$380
$400
$420
$440
$460
$480
$500
$520
$540
$560
2005-06 2004-05 2003-04 2002-03 2001-02 2000-01 1999-00 1998-99 1997-98 1996-97
Statewide Ten Year Comparison
Equa
lized
Net
Gra
nd L
ist (
billi
ons)

SECTION C
STATEWIDE RANKINGS