M FUND, INC. - M Financial Groupdocs.mfin.com/mfunds/MFundAnnualReport.pdf · ·...
64
M FUND, INC. M International Equity Fund M Large Cap Growth Fund M Capital Appreciation Fund M Large Cap Value Fund Annual Report December 31, 2017
Transcript of M FUND, INC. - M Financial Groupdocs.mfin.com/mfunds/MFundAnnualReport.pdf · ·...

M FUND, INC.
M International Equity FundM Large Cap Growth Fund
M Capital Appreciation FundM Large Cap Value Fund
Annual ReportDecember 31, 2017


M Fund, Inc.PRESIDENT’S LETTER
Dear Contract Owners:
We are pleased to share the financial condition of M Fund, Inc. (the “Corporation”) as presented in the followingAnnual Report dated December 31, 2017. Total assets under management at year end 2017 were $746.3 million.
Sub-Advisers to the portfolios, under the direction of M Financial Investment Advisers, Inc., the investment adviserto the Corporation, have prepared the attached discussion of results for each portfolio of the Corporation for theyear ended December 31, 2017.
Sub-Advisers to the portfolios of the Corporation are: Northern Cross, LLC for the M International Equity Fund,DSM Capital Partners LLC for the M Large Cap Growth Fund, Frontier Capital Management Company, LLC forthe M Capital Appreciation Fund and AJO, LP for the M Large Cap Value Fund.
On behalf of the Corporation’s Board of Directors, M Financial Investment Advisers, Inc. and the Corporation’sparticipating insurance carriers, we thank you for your business and remain committed to providing opportunitiesthat add value to our investors in the upcoming year.
Sincerely,
BRIDGET MCNAMARA-FENESY
PresidentM Fund, Inc.
M INTERNATIONAL EQUITY FUND
Performance
For the twelve months ended December 31, 2017, the M International Equity Fund had a return of 24.05% (netof management fees) versus a total return (including reinvestment of dividends) of 27.19% for its benchmark, TheMSCI ACWI (All Country World Index) ex US Index1.
Market Environment/Conditions
Zero interest rates globally have led to extreme valuations almost across the board and lower prospective returnsthan in the past, but opportunities to earn attractive absolute and relative returns persist. Global growth appearsrobust, but we are late in an extended cycle in the U.S. and globally, and there are limited sustainable macroeconomicgrowth drivers. Government stimulus in China and the U.S. is extending the duration of the expansion and there areno clear economic catalysts to spark the next downturn. Rising rates and the risk of an oil price spike could be thespark that ignites the next recession, but we view macro drivers to be inherently unpredictable.
Interest rates globally are too low and are driving some behavior on the part of investors and companies. Weexpect global rates to rise with time, but probably not to levels that would historically have been considered normal.Valuation of most assets are expensive; as rates rise we would expect valuation multiples to start to compress.Forward investment returns globally are probably lower than they have been in the past. Volatility is unusuallydepressed both in terms of economic volatility and securities volatility; we would expect volatility to increase overtime.
Fund Review/Current Positioning
The Fund’s relative underperformance came mostly from an overweight position and poor stock selection inhealth care stocks (Teva, Shire) and an underweight position, as well as poor stock selection, in the Energy sector(Schlumberger). Consumer discretionary stocks (Las Vegas Sands and Wynn Resorts) were the largest contributorsto performance.
During 2017, Northern Cross identified a number of new companies that it thinks can deliver strong performanceover the long term. These new names included Israeli generic pharmaceutical company Teva, financial exchangeDeutsche Boerse, Mexican real estate company Fibra Uno, Austrian Bank BAWAG Group, UK medical devicescompany ConvaTec, Italian telecommunications company Telecom Italia and Japanese beverage company Sapporo.
To fund these positions we used a combination of full and partial exits from a few and profit taking. We exitedLloyds Bank, Roche, Freeport McMoRan, Erste Bank, Indivior, and British Land. Mostly we found incomingprospects to offer better risk/reward ratios. We took some profits from Alibaba, Novo Nordisk, Wynn Resorts, andUnibail to manage risk. Although several changes were made to position the Fund for strong performance, themajority of the Fund remains unchanged owing to Northern Cross’s long-term investment philosophy. Turnover forthe year was 10%, which is consistent with our long term range of 10% to 15% per year.
Although the world of investing has grown more competitive over the past three decades, the transparency theinternet brings has eroded some of the informational edge that Northern Cross once had a monopoly on, due to itson-the-ground diligence. Opportunities to beat the market over the long term still exist and Northern Cross remainsoptimistic about its ability to outperform its benchmark over the coming decades.
Northern Cross, LLCInvestment Sub-Adviser to the M International Equity Fund
2

Performance represented is net of management fees. The Fund returns listed include fund level fees andexpenses, reinvestment of dividends, and distributions. Returns do not reflect product level charges of the applicableseparate accounts and variable products, all of which vary to a considerable extent and are described in yourproduct prospectus. Policy level returns would be lower after all policy fees and expenses are deducted. Theforegoing reflects the thoughts and opinions of Northern Cross exclusively and is subject to change without notice.The information provided in this material should not be considered a recommendation to purchase or sell anyparticular security. It should not be assumed that any security transactions, holdings, or sectors discussed wereor will be profitable, or that the investment recommendations or decisions we make in the future will be profitableor will equal the investment performance discussed herein. Strategies discussed are subject to change at any timeby the investment manager in its discretion due to market conditions or opportunities. Market conditions mayimpact performance. The performance results presented were achieved in particular market conditions which maynot be repeated. Moreover, the current market volatility and uncertain regulatory environment may have a negativeimpact on future performance. Portfolio characteristics are as of December 31, 2017. Please note that all indicesare unmanaged and are not available for direct investment.
This commentary may include statements that constitute “forward looking statements” under the U.S. securitieslaws. Forward-looking statements include, among other things, projections, estimates, and information aboutpossible or future results related to the Fund, market or regulatory developments. The views expressed above arenot guarantees of future performance or economic results and involve certain risks, uncertainties and assumptionsthat could cause actual outcomes and results to differ materially from the views expressed herein. The viewsexpressed above are subject to change at any time based upon economic, market, or other conditions and thesubadvisory firm undertakes no obligation to update the views expressed herein. Any discussions of specificsecurities should not be considered a recommendation to buy or sell those securities. The views expressed above(including any forward-looking statement) may not be relied upon as investment advice or as an indication of theFund’s trading intent. Information about the Fund’s holdings, asset allocation or country diversification is historicaland is not an indication of future Fund composition, which may vary. Investors cannot invest directly in an Index.The performance of any index mentioned in this commentary has not been adjusted for ongoing management,distribution and operating expenses, and sales charges applicable to mutual fund investments. In addition, thereturns do not reflect additional fees charged by separate accounts or variable insurance contracts that an investorin the Fund may pay. If these additional fees were reflected, performance would have been lower.
3

4
COMPARISON OF CHANGE IN VALUE OF $10,000 INVESTMENT IN THE M INTERNATIONAL EQUITY FUND, MSCI AC WORLD ex USA AND
MSCI EAFE INDEX (Unaudited)
The M International Equity Fund’s total return is calculated net of Investment Advisory Fees and operatingexpenses. Performance figures represent past performance and are not indicative of future performance ofthe M International Equity Fund or Index. Share value will fluctuate so that an investor’s shares, whenredeemed, may be worth more or less than the original investment. Please note that all indices are unmanaged,do not incur expenses, and are not available for direct investment. Persons who invest in the M InternationalEquity Fund through a variable annuity or variable life insurance contract should note this graph does notreflect separate account expenses deducted by the insurance company.
* 12/31/07 to 12/31/17+ MSCI EAFE—Effective May 1, 2014, the Fund changed its benchmark index from the MSCI EAFE Index to
the MSCI AC World ex US Index. The MSCI AC World ex US Index is more representative of the Fund’sinvestment portfolio than its previous index.
12/3
1/14
6/30
/14
12/3
1/13
12/3
1/11
12/3
1/17
12/3
1/16
12/3
1/15
12/3
1/07
12/3
1/09
12/3
1/10
12/3
1/08
Average Annual Total Return for the period ended 12/31/17: 1 Year 5 Year 10 YearM International Equity Fund 24.05% 5.19% 0.57%MSCI AC WorId ex USA 27.19% 6.80% 1.84%
6/30
/15
6/30
/16
6/30
/17
6/30
/08
6/30
/09
6/30
/10
6/30
/11
6/30
/13
12/3
1/12
6/30
/12
2,000
0
6,000
10,000
14,000
18,000
$22,000
M International Equity Fund
MSCI AC WorId ex USA*+
10,585
12,000
MSCI ACWI (ALL COUNTRY WORLD INDEX) ex US INDEX
1 The MSCI ACWI (All Country World Index) ex US Index is a free float-adjusted market capitalization weighted indexthat is designed to measure the equity market performance of developed and emerging markets excluding the US.

M LARGE CAP GROWTH FUND
Performance
For the twelve months ended December 31, 2017, the M Large Cap Growth Fund had a return of 38.97% (netof management fees) versus a total return (including reinvestment of dividends) of 30.21% for its benchmark, theRussell 1000 Growth Index2.
Market Environment/Conditions
In early January 2017, DSM felt it was an opportune time to invest in its Large Cap Growth portfolio due to2016’s underperformance. In DSM’s opinion, 2016’s underperformance was brought about by one-time macrodriven factors that temporarily caused investors to ignore the strong earnings results of the companies in the portfolio.Today, even after 2017’s solid performance, DSM does not believe the portfolio fully reflects 2016’s and 2017’searnings growth or the estimated high-teens earnings growth expected going forward. In DSM’s view, there remainssignificant potential in the portfolio.
DSM has projected for many years that the current global economic cycle would prove to be longer than themajority of previous growth cycles. That view remains unchanged. However, based on President Trump’s tax cutsand deregulatory policies, as well as improving economic outlooks in Europe and Japan, DSM believes globalgrowth may well exceed 3%, rather than its prior view that growth would approximate 3%. DSM continues tobelieve that the current global economic cycle will be driven by low inflation and low, albeit rising, interest rates.DSM continues to believe that global equity markets will continue to generate a total return over the coming yearsin the 5% to 9% range, driven by steady global economic growth, reasonable valuations (given a low inflationworld), and robust global corporate earnings. That said, corporate tax cuts in the United States are quite substantialand may cause appreciation in US equity markets to reach or exceed the high end of DSM’s long-standing 5% to9% total return forecast over the next few years.
Additionally, recently passed US tax rate reductions and regulatory reforms may well cause S&P 500 earningsto exceed $150 and possibly approach $160 in 2018. A year from today, based on a trailing P/E of 20x (which isquite normal in a low inflation economy), and assuming global economic growth with moderate inflation remainsthe outlook at that time, the S&P 500 might exceed 3000 or possibly approach or exceed 3200, generating alow-to-mid-teens total return (including dividends) in 2018. Granted, although several well-publicized macro andgeopolitical risks remain of concern to investors, the positive scenario of moderate global inflation, low interestrates, an extended/accelerating global economic growth cycle, healthy global corporate earnings, normal globalmarket valuations given a low-inflation world and an improving and increasingly stable global financial system,continues to form the foundation of an upwardly driven global equity market.
Fund Review/Current Positioning
The Fund remains focused on unique businesses that have been identified and continuously subject to analysisby DSM’s investment team. Holdings remain characterized by very strong balance sheets and significant free cashflow. The majority of the Fund is invested in the Technology, Health Care and Consumer Discretionary sectors,with smaller weightings in the Financials, Consumer Staples and Industrials sectors.
For the year ended December 31, 2017, the Fund outperformed its benchmark, primarily as a result of stockselection and an over-weighted position in Technology. DSM’s stock selections and underweight in the ConsumerStaples sector also contributed. By security, the top five contributors to the Fund’s performance for the year includedTencent Holdings, Alibaba Group, Facebook, Adobe Systems, and Visa. The five positions that detracted from
5

performance the most were Ctrip.com, Automatic Data Processing, Shire, Dollar General, and AlexionPharmaceuticals.
DSM believes that the earnings results of the companies in the Fund were responsible for 2017’s performance.The strong earnings growth in 2017’s first three-quarters, which comfortably exceeded 30% on a weighted averagebasis, followed 2016 earnings growth that was in excess of 20%. Based on DSM’s calculations, the Fund is valuedat approximately 22.6x 2018 earnings. A P/E of 22.6x, in light of potential on-going earnings growth of mid-to-highteens, based on DSM’s estimates, appears to be attractively priced. The Fund’s performance in 2017 is seen byDSM as confirmation that earnings are one of the most important factors in investing.
DSM Capital Partners LLCInvestment Sub-Adviser to the M Large Cap Growth Fund
Performance represented is net of management fees. The Fund returns listed include fund level fees andexpenses, reinvestment of dividends, and distributions. Returns do not reflect product level charges of the applicableseparate accounts and variable products, all of which vary to a considerable extent and are described in yourproduct prospectus. Policy level returns would be lower after all policy fees and expenses are deducted. Theforegoing reflects the thoughts and opinions of DSM Capital Partners LLC exclusively and is subject to changewithout notice. The information provided in this material should not be considered a recommendation to purchaseor sell any particular security. It should not be assumed that any security transactions, holdings, or sectorsdiscussed were or will be profitable, or that the investment recommendations or decisions we make in the futurewill be profitable or will equal the investment performance discussed herein. Strategies discussed are subject tochange at any time by the investment manager in its discretion due to market conditions or opportunities. Marketconditions may impact performance. The performance results presented were achieved in particular marketconditions which may not be repeated. Moreover, the current market volatility and uncertain regulatory environmentmay have a negative impact on future performance. Portfolio characteristics are as of December 31, 2017. Pleasenote that all indices are unmanaged and are not available for direct investment.
This commentary may include statements that constitute “forward looking statements” under the U.S. securitieslaws. Forward-looking statements include, among other things, projections, estimates, and information aboutpossible or future results related to the Fund, market or regulatory developments. The views expressed above arenot guarantees of future performance or economic results and involve certain risks, uncertainties and assumptionsthat could cause actual outcomes and results to differ materially from the views expressed herein. The viewsexpressed above are subject to change at any time based upon economic, market, or other conditions and thesubadvisory firm undertakes no obligation to update the views expressed herein. Any discussions of specificsecurities should not be considered a recommendation to buy or sell those securities. The views expressed above(including any forward-looking statement) may not be relied upon as investment advice or as an indication of theFund’s trading intent. Information about the Fund’s holdings, asset allocation or country diversification is historicaland is not an indication of future Fund composition, which may vary. Investors cannot invest directly in an Index.The performance of any index mentioned in this commentary has not been adjusted for ongoing management,distribution and operating expenses, and sales charges applicable to mutual fund investments. In addition, thereturns do not reflect additional fees charged by separate accounts or variable insurance contracts that an investorin the Fund may pay. If these additional fees were reflected, performance would have been lower.
6

7
COMPARISON OF CHANGE IN VALUE OF $10,000 INVESTMENT IN THE M LARGE CAP GROWTH FUND AND THE RUSSELL 1000 GROWTH INDEX (Unaudited)
The M Large Cap Growth Fund’s total return is calculated net of Investment Advisory Fees and operatingexpenses. Performance figures represent past performance and are not indicative of future performance ofthe M Large Cap Growth Fund or Index. Share value will fluctuate so that an investor’s shares, whenredeemed, may be worth more or less than the original investment. Please note that all indices are unmanaged,do not incur expenses, and are not available for direct investment. Persons who invest in the M Large CapGrowth Fund through a variable annuity or variable life insurance contract should note this graph does notreflect separate account expenses deducted by the insurance company.
* 12/31/07 to 12/31/17
12/3
1/14
6/30
/14
12/3
1/13
12/3
1/11
12/3
1/17
12/3
1/16
12/3
1/15
12/3
1/07
12/3
1/09
12/3
1/10
12/3
1/08
6/30
/15
6/30
/16
6/30
/17
6/30
/08
6/30
/09
6/30
/10
6/30
/11
6/30
/13
12/3
1/12
6/30
/12
2,000
0
6,000
10,000
14,000
18,000
22,000
26,000
$30,000
M Large Cap Growth Fund
Russell 1000 Growth Index*25,937
22,402
Average Annual Total Return for the period ended 12/31/17: 1 Year 5 Year 10 YearM Large Cap Growth Fund 38.97% 17.02% 8.40%Russell 1000 Growth Index 30.21% 17.33% 10.00%
RUSSELL 1000 GROWTH INDEX
2 The Russell 1000 Growth Total Return Index includes dividends reinvested in the Russell 1000 Growth Index asreported by the Russell Company. The Russell 1000 Growth Index is a capitalization weighted index containingover 600 widely held securities with growth characteristics.

M CAPITAL APPRECIATION FUND
Performance
For the twelve months ended December 31, 2017, the M Capital Appreciation Fund had a return of 19.02%(net of management fees) versus a total return (including reinvestment of dividends) of 16.81% for its benchmark,the Russell 2500® Index3.
Market Environment/Conditions
If 2017 has taught us anything, it is to expect the unexpected. Political discord and nuclear brinkmanship wereunable to deter rising equity prices as hope for major regulatory reform drove solid gains. The current bull marketrecently surpassed the 1957 bull market in duration, and is now the second longest in recorded U.S. history. Themarket has shown few signs of slowing. In fact, the S&P 500® Index increased every month in 2017 for the firsttime ever.
For the year, growth stocks outperformed; the Russell 2500® Growth Index increased 24.5% versus 16.8% forthe core Russell 2500® Index. The relative outperformance of growth versus value is even more pronounced with agap of approximately 14%, the largest since 2007 and second only to the internet bubble of 1999. The Fund’sperformance for the year was between the two indices with an increase of 19%. Given the wide disparity ofperformance by style, the Fund has performed as expected for the year.
Corporate tax reform dominated headlines, and ultimately became the first major legislative victory for theTrump administration. While Frontier believes the immediate earnings impact of lower corporate tax rates has beenpriced into many stocks, we continue to look for secondary benefits to emerge through 2018. The introduction ofaccelerated depreciation for capital equipment purchases should prompt an increase in spending domestically. Inaddition, repatriation of funds held overseas could result in a wave of consolidation across a number of industries,most notably technology and health care. We view major stock buybacks from repatriated funds as less likely, butstill a possible benefit to equity holders. Alternatively, we could see U.S. corporations using lower tax rates as ameans to price their products more aggressively to compete effectively on a global basis. In short, U.S. corporationshave been given another tool to drive earnings growth, which is important because earnings growth drives equityprices.
The current investment landscape and economic profile appear healthy. The global economy is growing withlittle evidence of inflation. Although interest rates are beginning to tick up, Frontier believes they will remain athistoric lows, even if the Fed were to raise rates 75 basis points through the course of the year. Unemploymentclaims have returned to pre-recession levels, while capacity utilization remains low. Industrial orders in the U.S.remain strong with the most recent ISM® Manufacturing Index reporting the highest rating in 13 years. While weare almost nine years into an economic expansion, there is no near-term reason to believe that growth will slow. Wemay even be poised for an acceleration as a result of the tax reform and renewed interest in pushing forward a majorinfrastructure bill.
Fund Review/Current Positioning
The Fund outperformed its benchmark with positive sector allocation of 4.2%, offset slightly by negative stockselection of -0.6%. The overweight in Technology and Materials & Processing and underweight in Financials werethe largest benefits of positioning.
8

The Materials & Processing sector was the largest contributor to relative performance where the Fund exhibitedboth positive sector and stock selection. The Fund’s overweight (23% vs. 8%) proved beneficial as the stocks in theindex gained 22%, the third highest of all sectors. Stock selection in the Fund exceeded the index by 10%, up 32%.Allegheny Technologies, a specialty metals producer with meaningful exposure to the aerospace industry, was thetop performer in the sector, rising 52%.
The Fund also benefitted from positive sector and stock selection in Financial Services, yielding an averagereturn of 22% versus 11% for the index. The best contributing stock in the sector was Green Dot, a leading providerof prepaid debit cards.
Positive contributions were offset by a weakness in the Producer Durables sector, with a return of 4% versus 22%for the index. The largest detractor in this sector was Volaris (Controladora Vuela Compania de Aviacion), a lowcost airline operating out of Mexico.
Over the past ten years, Capital Appreciation has generated returns from a number of traditional growth areas:semiconductors, medical equipment, DNA sequencing and internet backbone services to name a few. However, justas important to the results have been the unconventional ideas that have surfaced through our process: impactresistant foam, surgical robots, pre-paid cards, and natural gas in Papua New Guinea. We are emboldened by thesefindings and have conviction we will continue to uncover unappreciated investment opportunities. Also, despitebeing purchased at a near-term peak in the equity markets, the 2007 portfolio of stocks contributed nearly equallyto those purchased over the subsequent nine years and had a similar distribution of positive and negative returns. Infact, the second best performing stock over the period (Illumina, +1,032%) was first purchased in 2007. Thisanalysis shows that our process works in good times and bad as long as we remain disciplined and patient.
Frontier Capital Management CompanyInvestment Sub-Adviser to the M Capital Appreciation Fund
Performance represented is net of management fees. The Fund returns listed include fund level fees andexpenses, reinvestment of dividends, and distributions. Returns do not reflect product level charges of the applicableseparate accounts and variable products, all of which vary to a considerable extent and are described in yourproduct prospectus. Policy level returns would be lower after all policy fees and expenses are deducted. Theforegoing reflects the thoughts and opinions of Frontier exclusively and is subject to change without notice. Theinformation provided in this material should not be considered a recommendation to purchase or sell any particularsecurity. It should not be assumed that any security transactions, holdings, or sectors discussed were or will beprofitable, or that the investment recommendations or decisions we make in the future will be profitable or willequal the investment performance discussed herein. Strategies discussed are subject to change at any time by theinvestment manager in its discretion due to market conditions or opportunities. Market conditions may impactperformance. The performance results presented were achieved in particular market conditions which may not berepeated. Moreover, the current market volatility and uncertain regulatory environment may have a negativeimpact on future performance. Portfolio characteristics are as of December 31, 2017. Please note that all indicesare unmanaged and are not available for direct investment.
This commentary may include statements that constitute “forward looking statements” under the U.S. securitieslaws. Forward-looking statements include, among other things, projections, estimates, and information aboutpossible or future results related to the Fund, market or regulatory developments. The views expressed above arenot guarantees of future performance or economic results and involve certain risks, uncertainties and assumptionsthat could cause actual outcomes and results to differ materially from the views expressed herein. The viewsexpressed above are subject to change at any time based upon economic, market, or other conditions and thesubadvisory firm undertakes no obligation to update the views expressed herein. Any discussions of specific
9
securities should not be considered a recommendation to buy or sell those securities. The views expressed above(including any forward-looking statement) may not be relied upon as investment advice or as an indication of theFund’s trading intent. Information about the Fund’s holdings, asset allocation or country diversification is historicaland is not an indication of future Fund composition, which may vary. Investors cannot invest directly in an Index.The performance of any index mentioned in this commentary has not been adjusted for ongoing management,distribution and operating expenses, and sales charges applicable to mutual fund investments. In addition, thereturns do not reflect additional fees charged by separate accounts or variable insurance contracts that an investorin the Fund may pay. If these additional fees were reflected, performance would have been lower.
10

11
COMPARISON OF CHANGE IN VALUE OF $10,000 INVESTMENT INTHE M CAPITAL APPRECIATION FUND AND RUSSELL 2500 STOCK INDEX (Unaudited)
The M Capital Appreciation Fund’s total return is calculated net of Investment Advisory Fees and operatingexpenses. Performance figures represent past performance and are not indicative of future performance ofthe M Capital Appreciation Fund or Index. Share value will fluctuate so that an investor’s shares, whenredeemed, may be worth more or less than the original investment. Please note that all indices are unmanaged,do not incur expenses, and are not available for direct investment. Persons who invest in the M CapitalAppreciation Fund through a variable annuity or variable life insurance contract should note this graph doesnot reflect separate account expenses deducted by the insurance company.
* 12/31/07 to 12/31/17
26,000
22,000
18,000
14,000
10,000
2,000
6,000
0
25,101
24,156
12/3
1/14
12/3
1/13
12/3
1/11
12/3
1/17
12/3
1/16
12/3
1/07
12/3
1/09
12/3
1/10
12/3
1/08
$30,000
Average Annual Total Return for the period ended 12/31/17: 1 Year 5 Year 10 YearM Capital Appreciation Fund 19.02% 16.07% 9.64%Russell 2500 Stock Index 16.81% 14.33% 9.22%
Russell 2500 Stock Index*
M CapitalAppreciation Fund
6/30
/16
6/30
/17
12/3
1/15
6/30
/15
6/30
/08
6/30
/09
6/30
/10
6/30
/11
6/30
/13
6/30
/14
12/3
1/12
6/30
/12
RUSSELL 2500 INDEX
3 The Russell 2500® Index measures the performance of the small to mid-cap segment of the U.S. equity universe,commonly referred to as “smid” cap. The Russell 2500® Index is a subset of the Russell 3000® Index. It includesapproximately 2500 of the smallest securities based on a combination of their market cap and current indexmembership.

M LARGE CAP VALUE FUND
Performance
For the twelve months ended December 31, 2017, the M Large Cap Value Fund had a return of 14.99% (net ofmanagement fees) versus a total return (including reinvestment of dividends) of 13.66% for its benchmark, theRussell 1000 Value Index4.
Market Environment/Conditions
Equity returns were spectacular across the board this year—the S&P 500 Index was up 21.8%; the MSCI AllWorld Country Index 24.0%; and the MSCI Emerging Markets Index shot up an astonishing 37.3%. And eventhough growth and large-cap stocks dominated the market, value and small-cap indexes still gained more than 10%.
Fund Review/Current Positioning
The Fund is fully invested in U.S. equities with no broad sector bets, and only modest industry-level and stockspecific bets. The goal is to outperform the benchmark, the Russell 1000 Value Index, with incremental gains acrossmany holdings. Using bottom-up, quantitatively-driven stock selection, AJO evaluates companies relative to theirindustry peers using four broad categories of measures: value, management, momentum, and sentiment. Valuemeans the somewhat traditional ratios of price to fundamental value; management means evidence that a company’sexecutive team has and will continue to emphasize earning power; momentum indicates when stocks might begin torise toward full valuation; and sentiment captures the buying and selling behavior of key investor segments invarious markets. When considering new investments, AJO, LP strongly focuses on minimizing transaction costs,which helps maximize profits for the Fund.
The Fund beat its benchmark this year by 1.33%. AJO describes the reasons behind positive relative returnsusing the framework of their investment process described above:
• AJO’s stock selection drove the Fund’s outperformance, dominating in the financials and consumer staplessectors.
• Despite inconsistent value trends throughout the year, AJO’s eclectic approach—incorporating measures ofmanagement, momentum, and sentiment—paid off.
• Management and momentum trends were reliable contributors to the year’s strong performance anddominated in the fourth quarter.
• The market’s preference for larger companies was a headwind through most of the year.
• While the Fund remained sector-neutral to its Russell 1000 Value benchmark, AJO can (and does) emphasizeindustries with the most attractive valuation (and avoid the contrary)—a result of its bottom-up stock picking.Industry bets were most effective within the industrials sectors (betting for transportation stocks and againstaerospace companies) and least effective within the health care sector (emphasizing pharmaceuticals andavoiding health care equipment companies).
• Successful stock picks include Owens Corning, Applied Materials, Verisign, Bank of America, and Walmart.
• The Fund was negatively impacted from holding Dean Foods, Rowan Companies, and Nabors Industries.
12
AJO strongly believes that superior results can be achieved through a consistent, systematic approach thatfocuses on low-priced companies with proven management, earnings power, and favorable sentiment.
AJO, LPInvestment Sub-Adviser to M Large Cap Value Fund
Performance represented is net of management fees. The Fund returns listed include fund level fees andexpenses, reinvestment of dividends, and distributions. Returns do not reflect product level charges of the applicableseparate accounts and variable products, all of which vary to a considerable extent and are described in yourproduct prospectus. Policy level returns would be lower after all policy fees and expenses are deducted. Theforegoing reflects the thoughts and opinions of AJO exclusively and is subject to change without notice. Theinformation provided in this material should not be considered a recommendation to purchase or sell any particularsecurity. It should not be assumed that any security transactions, holdings, or sectors discussed were or will beprofitable, or that the investment recommendations or decisions we make in the future will be profitable or willequal the investment performance discussed herein. Strategies discussed are subject to change at any time by theinvestment manager in its discretion due to market conditions or opportunities. Market conditions may impactperformance. The performance results presented were achieved in particular market conditions which may not berepeated. Moreover, the current market volatility and uncertain regulatory environment may have a negativeimpact on future performance. Portfolio characteristics are as of December 31, 2017. Please note that all indicesare unmanaged and are not available for direct investment.
This commentary may include statements that constitute “forward looking statements” under the U.S. securitieslaws. Forward-looking statements include, among other things, projections, estimates, and information aboutpossible or future results related to the Fund, market or regulatory developments. The views expressed above arenot guarantees of future performance or economic results and involve certain risks, uncertainties and assumptionsthat could cause actual outcomes and results to differ materially from the views expressed herein. The viewsexpressed above are subject to change at any time based upon economic, market, or other conditions and thesubadvisory firm undertakes no obligation to update the views expressed herein. Any discussions of specificsecurities should not be considered a recommendation to buy or sell those securities. The views expressed above(including any forward-looking statement) may not be relied upon as investment advice or as an indication of theFund’s trading intent. Information about the Fund’s holdings, asset allocation or country diversification is historicaland is not an indication of future Fund composition, which may vary. Investors cannot invest directly in an Index.The performance of any index mentioned in this commentary has not been adjusted for ongoing management,distribution and operating expenses, and sales charges applicable to mutual fund investments. In addition, thereturns do not reflect additional fees charged by separate accounts or variable insurance contracts that an investorin the Fund may pay. If these additional fees were reflected, performance would have been lower.
13

COMPARISON OF CHANGE IN VALUE OF $10,000 INVESTMENT INTHE M LARGE CAP VALUE FUND AND THE RUSSELL 1000 VALUE INDEX (Unaudited)
The M Large Cap Value Fund’s total return is calculated net of Investment Advisory Fees and operatingexpenses. Performance figures represent past performance and are not indicative of future performance ofthe M Large Cap Value Fund or Index. Share value will fluctuate so that an investor’s shares, when redeemed,may be worth more or less than the original investment. Please note that all indices are unmanaged, do notincur expenses, and are not available for direct investment. Persons who invest in the M Large Cap ValueFund through a variable annuity or variable life insurance contract should note this graph does not reflectseparate account expenses deducted by the insurance company.
* 12/31/07 to 12/31/17
$26,000
18,000
14,000
22,000
10,000
6,000
2,000
0
Average Annual Total Return for the period ended 12/31/17: 1 Year 5 Year 10 YearM Large Cap Value Fund 14.99% 13.02% 6.34%Russell 1000 Value Index 13.66% 14.04% 7.10%
6/30
/15
6/30
/16
6/30
/17
6/30
/08
6/30
/09
6/30
/10
12/3
1/11
6/30
/12
6/30
/13
6/30
/14
6/30
/11
12/3
1/14
12/3
1/13
12/3
1/12
12/3
1/10
12/3
1/07
12/3
1/17
12/3
1/16
12/3
1/15
12/3
1/08
12/3
1/09
19,856
18,491
Russell 1000 Value Index*
M Large Cap Value Fund
14
RUSSELL 1000 VALUE INDEX
4 The Russell 1000® Value Index is a market capitalization-weighted index that measures the performance of thoseRussell 1000 companies with lower price-to-book ratios and lower forecasted growth rates.

The accompanying notes are an integral part of these financial statements.
15
M International Equity FundSCHEDULE OF INVESTMENTS
December 31, 2017
COMMON STOCKS—93.4%Austria—0.6%
28,787 BAWAG Group AG#,* . . . . . . . . . . $ 1,535,651
Belgium—1.8% 38,996 Anheuser-Busch InBev SA/NV . . . 4,357,490
Brazil—0.3% 47,900 Ambev SA . . . . . . . . . . . . . . . . . . . . 307,290 47,833 Ambev SA, ADR . . . . . . . . . . . . . . 309,001
616,291
Canada—0.3% 46,732 Barrick Gold Corp. . . . . . . . . . . . . . 676,212
China—2.9% 41,094 Alibaba Group Holding, Ltd.,
SP ADR* . . . . . . . . . . . . . . . . . . . 7,085,838
Colombia—3.1% 68,338 Bancolombia SA, SP ADR . . . . . . . 2,710,285 456,995 Cementos Argos SA . . . . . . . . . . . . 1,764,010 114,805 Grupo Argos SA/Colombia . . . . . . . 803,209 75,611 Grupo Aval Acciones y Valores
SA ADR . . . . . . . . . . . . . . . . . . . . 642,694 120,323 Grupo de Inversiones
Suramericana SA . . . . . . . . . . . . . 1,624,766
7,544,964
Denmark—1.9% 86,255 Novo Nordisk A/S . . . . . . . . . . . . . . 4,650,071
France—17.0% 137,743 AXA SA . . . . . . . . . . . . . . . . . . . . . 4,087,974 40,112 Cie Generale d’Optique Essilor
International SA . . . . . . . . . . . . . . 5,532,354 35,257 Cie Generale des Etablissements
Michelin . . . . . . . . . . . . . . . . . . . . 5,057,334 696 Hermes International . . . . . . . . . . . 372,661 37,890 JCDecaux SA . . . . . . . . . . . . . . . . . 1,527,760 20,212 L’Oreal SA . . . . . . . . . . . . . . . . . . . . 4,485,288 34,765 Pernod-Ricard SA . . . . . . . . . . . . . . 5,503,999 52,139 Schneider Electric SA . . . . . . . . . . . 4,432,927 1,007 Unibail-Rodamco SE, REIT . . . . . . 253,732 16,353 Unibail-Rodamco SE, REIT—
(Netherlands) . . . . . . . . . . . . . . . . 4,120,439 226,320 Vivendi SA . . . . . . . . . . . . . . . . . . . 6,088,149
41,462,617
Germany—9.6% 19,786 Allianz SE, Registered . . . . . . . . . . $ 4,546,252 40,796 Bayer AG . . . . . . . . . . . . . . . . . . . . . 5,090,701 17,928 Deutsche Boerse AG . . . . . . . . . . . . 2,082,255 34,160 Fresenius SE & Co. KGaA . . . . . . . 2,667,014 21,829 Linde AG* . . . . . . . . . . . . . . . . . . . . 5,098,178 36,256 SAP AG . . . . . . . . . . . . . . . . . . . . . . 4,065,237
23,549,637
Israel—0.9% 111,815 Teva Pharmaceutical Industries,
Ltd., SP ADR† . . . . . . . . . . . . . . . 2,118,894
Italy—1.0% 2,218,512 Telecom Italia SpA* . . . . . . . . . . . . 1,917,885 674,702 Telecom Italia SpA-RSP . . . . . . . . . 482,486
2,400,371
Japan—9.9% 47,000 Dentsu, Inc. . . . . . . . . . . . . . . . . . . . 1,991,790 24,200 FANUC Corp. . . . . . . . . . . . . . . . . . 5,811,866 48,900 Hoya Corp. . . . . . . . . . . . . . . . . . . . 2,442,504 73,505 Japan Tobacco, Inc. . . . . . . . . . . . . . 2,368,730 90,900 Olympus Corp. . . . . . . . . . . . . . . . . 3,485,139 14,900 Sapporo Holdings, Ltd.† . . . . . . . . . 456,224 6,800 SMC Corp. . . . . . . . . . . . . . . . . . . . 2,799,059 107,100 Tokio Marine Holdings, Inc. . . . . . . 4,886,631
24,241,943
Jersey—2.0% 91,967 Shire Plc . . . . . . . . . . . . . . . . . . . . . 4,842,604
Macau—0.1% 56,800 MGM China Holdings, Ltd. . . . . . . 171,937
Mexico—1.0% 16,700 Becle SAB de CV* . . . . . . . . . . . . . 26,839 940,600 Fibra Uno Administracion SA
de CV, REIT . . . . . . . . . . . . . . . . . 1,391,585 58,643 Grupo Televisa SAB, ADR . . . . . . . 1,094,865
2,513,289
Netherlands—4.3% 27,854 ASML Holding NV . . . . . . . . . . . . . 4,851,001 54,646 Heineken NV . . . . . . . . . . . . . . . . . 5,699,736
10,550,737
Value Shares (Note 1)
Value Shares (Note 1)
The accompanying notes are an integral part of these financial statements.
16
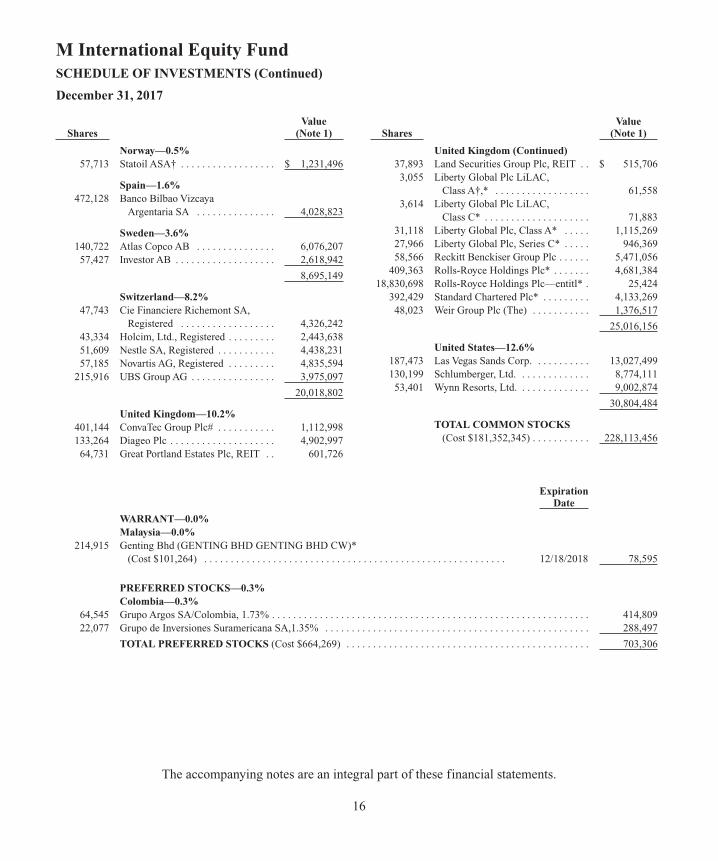
M International Equity FundSCHEDULE OF INVESTMENTS (Continued)
December 31, 2017
Norway—0.5% 57,713 Statoil ASA† . . . . . . . . . . . . . . . . . . $ 1,231,496
Spain—1.6% 472,128 Banco Bilbao Vizcaya
Argentaria SA . . . . . . . . . . . . . . . 4,028,823
Sweden—3.6% 140,722 Atlas Copco AB . . . . . . . . . . . . . . . 6,076,207 57,427 Investor AB . . . . . . . . . . . . . . . . . . . 2,618,942
8,695,149
Switzerland—8.2% 47,743 Cie Financiere Richemont SA,
Registered . . . . . . . . . . . . . . . . . . 4,326,242 43,334 Holcim, Ltd., Registered . . . . . . . . . 2,443,638 51,609 Nestle SA, Registered . . . . . . . . . . . 4,438,231 57,185 Novartis AG, Registered . . . . . . . . . 4,835,594 215,916 UBS Group AG . . . . . . . . . . . . . . . . 3,975,097
20,018,802
United Kingdom—10.2% 401,144 ConvaTec Group Plc# . . . . . . . . . . . 1,112,998 133,264 Diageo Plc . . . . . . . . . . . . . . . . . . . . 4,902,997 64,731 Great Portland Estates Plc, REIT . . 601,726
United Kingdom (Continued) 37,893 Land Securities Group Plc, REIT . . $ 515,706 3,055 Liberty Global Plc LiLAC,
Class A†,* . . . . . . . . . . . . . . . . . . 61,558 3,614 Liberty Global Plc LiLAC,
Class C* . . . . . . . . . . . . . . . . . . . . 71,883 31,118 Liberty Global Plc, Class A* . . . . . 1,115,269 27,966 Liberty Global Plc, Series C* . . . . . 946,369 58,566 Reckitt Benckiser Group Plc . . . . . . 5,471,056 409,363 Rolls-Royce Holdings Plc* . . . . . . . 4,681,384 18,830,698 Rolls-Royce Holdings Plc—entitl* . 25,424 392,429 Standard Chartered Plc* . . . . . . . . . 4,133,269 48,023 Weir Group Plc (The) . . . . . . . . . . . 1,376,517
25,016,156
United States—12.6% 187,473 Las Vegas Sands Corp. . . . . . . . . . . 13,027,499 130,199 Schlumberger, Ltd. . . . . . . . . . . . . . 8,774,111 53,401 Wynn Resorts, Ltd. . . . . . . . . . . . . . 9,002,874
30,804,484
TOTAL COMMON STOCKS (Cost $181,352,345) . . . . . . . . . . . 228,113,456
Value Shares (Note 1)
Value Shares (Note 1)
WARRANT—0.0%Malaysia—0.0%
214,915 Genting Bhd (GENTING BHD GENTING BHD CW)* (Cost $101,264) . . . . . . . . . . . . . . . . . . . . . . . . . . . . . . . . . . . . . . . . . . . . . . . . . . . . . . . . . 12/18/2018 78,595
PREFERRED STOCKS—0.3%Colombia—0.3%
64,545 Grupo Argos SA/Colombia, 1.73% . . . . . . . . . . . . . . . . . . . . . . . . . . . . . . . . . . . . . . . . . . . . . . . . . . . . . . . . . . . . 414,809 22,077 Grupo de Inversiones Suramericana SA,1.35% . . . . . . . . . . . . . . . . . . . . . . . . . . . . . . . . . . . . . . . . . . . . . . . . . . 288,497
TOTAL PREFERRED STOCKS (Cost $664,269) . . . . . . . . . . . . . . . . . . . . . . . . . . . . . . . . . . . . . . . . . . . . . . 703,306
Expiration Date

SHORT-TERM INVESTMENTS—7.0%$14,628,177 State Street Bank and Trust Co. (Euro Time Deposit) . . . . . . . . . . . . . . . . . . . . . . . . . . 0.120% 01/02/2018 $ 14,628,177
Shares
2,302,217 State Street Navigator Securities Lending Prime Portfolio (Money Market)†† . . . . . . 1.3471% 2,302,217
TOTAL SHORT-TERM INVESTMENTS (Cost $16,930,394) . . . . . . . . . . . . . . . . . . . . . . . . . . . . . . . . . . . . 16,930,394
TOTAL INVESTMENTS, AT VALUE—100.7%(Cost $199,048,272) . . . . . . . . . . . . . . . . . . . . . . . . . . . . . . . . . . . . . . . . . . . . . . . . . . . . . . . . . . . . . . . . . . . . . . 245,825,751
Liabilities in Excess of Other Assets—(0.7)% . . . . . . . . . . . . . . . . . . . . . . . . . . . . . . . . . . . . . . . . . . . . . . . . . . (1,658,804)
NET ASSETS—100.0% . . . . . . . . . . . . . . . . . . . . . . . . . . . . . . . . . . . . . . . . . . . . . . . . . . . . . . . . . . . . . . . . . . . $244,166,947
Notes to the Schedule of Investments:
ADR—American Depositary Receipt
Entitl—Entitled
REIT—Real Estate Investment Trust
RSP—Retirement Savings Plan
SP ADR—Sponsored American Depositary Receipt
* Non-income producing security
# Security exempt from registration under Rule 144A of the Securities Act of 1933. These securities may be resold in transactions exemptfrom registration, normally to qualified institutional buyers
† Denotes all or a portion of security on loan (Note 1)
†† Represents collateral received from securities lending transactions
Percentages indicated are based on net assets.
The accompanying notes are an integral part of these financial statements.
17
Par Value Amount Yield Maturity (Note 1)
M International Equity FundSCHEDULE OF INVESTMENTS (Continued)
December 31, 2017
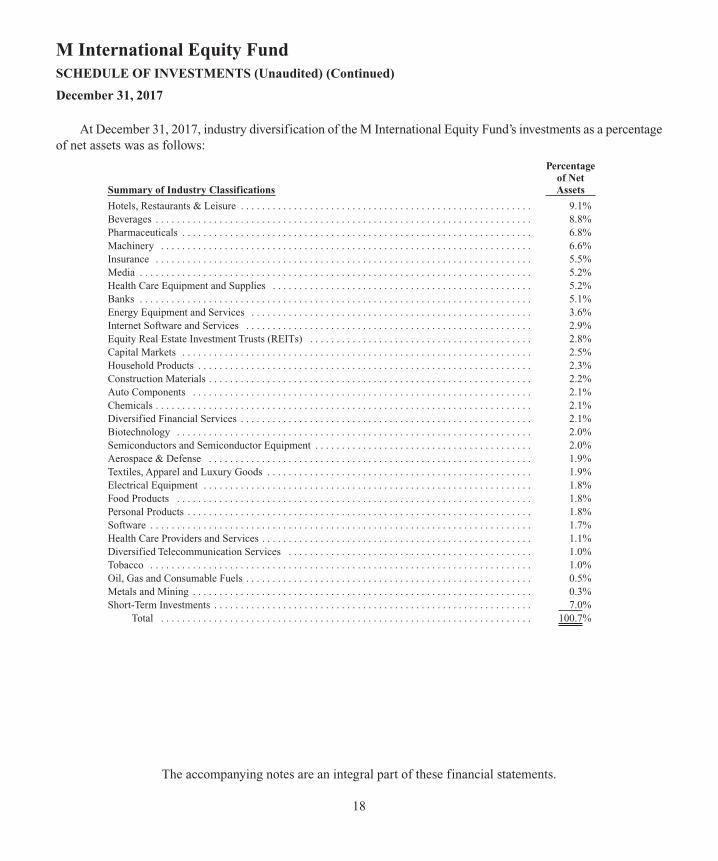
At December 31, 2017, industry diversification of the M International Equity Fund’s investments as a percentageof net assets was as follows:
Percentage of Net Summary of Industry Classifications Assets Hotels, Restaurants & Leisure . . . . . . . . . . . . . . . . . . . . . . . . . . . . . . . . . . . . . . . . . . . . . . . . . . . . . . . 9.1%Beverages . . . . . . . . . . . . . . . . . . . . . . . . . . . . . . . . . . . . . . . . . . . . . . . . . . . . . . . . . . . . . . . . . . . . . . . 8.8%Pharmaceuticals . . . . . . . . . . . . . . . . . . . . . . . . . . . . . . . . . . . . . . . . . . . . . . . . . . . . . . . . . . . . . . . . . . 6.8%Machinery . . . . . . . . . . . . . . . . . . . . . . . . . . . . . . . . . . . . . . . . . . . . . . . . . . . . . . . . . . . . . . . . . . . . . . 6.6%Insurance . . . . . . . . . . . . . . . . . . . . . . . . . . . . . . . . . . . . . . . . . . . . . . . . . . . . . . . . . . . . . . . . . . . . . . . 5.5%Media . . . . . . . . . . . . . . . . . . . . . . . . . . . . . . . . . . . . . . . . . . . . . . . . . . . . . . . . . . . . . . . . . . . . . . . . . . 5.2%Health Care Equipment and Supplies . . . . . . . . . . . . . . . . . . . . . . . . . . . . . . . . . . . . . . . . . . . . . . . . . 5.2%Banks . . . . . . . . . . . . . . . . . . . . . . . . . . . . . . . . . . . . . . . . . . . . . . . . . . . . . . . . . . . . . . . . . . . . . . . . . . 5.1%Energy Equipment and Services . . . . . . . . . . . . . . . . . . . . . . . . . . . . . . . . . . . . . . . . . . . . . . . . . . . . . 3.6%Internet Software and Services . . . . . . . . . . . . . . . . . . . . . . . . . . . . . . . . . . . . . . . . . . . . . . . . . . . . . . 2.9%Equity Real Estate Investment Trusts (REITs) . . . . . . . . . . . . . . . . . . . . . . . . . . . . . . . . . . . . . . . . . . 2.8%Capital Markets . . . . . . . . . . . . . . . . . . . . . . . . . . . . . . . . . . . . . . . . . . . . . . . . . . . . . . . . . . . . . . . . . . 2.5%Household Products . . . . . . . . . . . . . . . . . . . . . . . . . . . . . . . . . . . . . . . . . . . . . . . . . . . . . . . . . . . . . . . 2.3%Construction Materials . . . . . . . . . . . . . . . . . . . . . . . . . . . . . . . . . . . . . . . . . . . . . . . . . . . . . . . . . . . . . 2.2%Auto Components . . . . . . . . . . . . . . . . . . . . . . . . . . . . . . . . . . . . . . . . . . . . . . . . . . . . . . . . . . . . . . . . 2.1%Chemicals . . . . . . . . . . . . . . . . . . . . . . . . . . . . . . . . . . . . . . . . . . . . . . . . . . . . . . . . . . . . . . . . . . . . . . . 2.1%Diversified Financial Services . . . . . . . . . . . . . . . . . . . . . . . . . . . . . . . . . . . . . . . . . . . . . . . . . . . . . . . 2.1%Biotechnology . . . . . . . . . . . . . . . . . . . . . . . . . . . . . . . . . . . . . . . . . . . . . . . . . . . . . . . . . . . . . . . . . . . 2.0%Semiconductors and Semiconductor Equipment . . . . . . . . . . . . . . . . . . . . . . . . . . . . . . . . . . . . . . . . . 2.0%Aerospace & Defense . . . . . . . . . . . . . . . . . . . . . . . . . . . . . . . . . . . . . . . . . . . . . . . . . . . . . . . . . . . . . 1.9%Textiles, Apparel and Luxury Goods . . . . . . . . . . . . . . . . . . . . . . . . . . . . . . . . . . . . . . . . . . . . . . . . . . 1.9%Electrical Equipment . . . . . . . . . . . . . . . . . . . . . . . . . . . . . . . . . . . . . . . . . . . . . . . . . . . . . . . . . . . . . . 1.8%Food Products . . . . . . . . . . . . . . . . . . . . . . . . . . . . . . . . . . . . . . . . . . . . . . . . . . . . . . . . . . . . . . . . . . . 1.8%Personal Products . . . . . . . . . . . . . . . . . . . . . . . . . . . . . . . . . . . . . . . . . . . . . . . . . . . . . . . . . . . . . . . . . 1.8%Software . . . . . . . . . . . . . . . . . . . . . . . . . . . . . . . . . . . . . . . . . . . . . . . . . . . . . . . . . . . . . . . . . . . . . . . . 1.7%Health Care Providers and Services . . . . . . . . . . . . . . . . . . . . . . . . . . . . . . . . . . . . . . . . . . . . . . . . . . . 1.1%Diversified Telecommunication Services . . . . . . . . . . . . . . . . . . . . . . . . . . . . . . . . . . . . . . . . . . . . . . 1.0%Tobacco . . . . . . . . . . . . . . . . . . . . . . . . . . . . . . . . . . . . . . . . . . . . . . . . . . . . . . . . . . . . . . . . . . . . . . . . 1.0%Oil, Gas and Consumable Fuels . . . . . . . . . . . . . . . . . . . . . . . . . . . . . . . . . . . . . . . . . . . . . . . . . . . . . . 0.5%Metals and Mining . . . . . . . . . . . . . . . . . . . . . . . . . . . . . . . . . . . . . . . . . . . . . . . . . . . . . . . . . . . . . . . . 0.3%Short-Term Investments . . . . . . . . . . . . . . . . . . . . . . . . . . . . . . . . . . . . . . . . . . . . . . . . . . . . . . . . . . . . 7.0%
Total . . . . . . . . . . . . . . . . . . . . . . . . . . . . . . . . . . . . . . . . . . . . . . . . . . . . . . . . . . . . . . . . . . . . . . 100.7%
The accompanying notes are an integral part of these financial statements.
18
M International Equity FundSCHEDULE OF INVESTMENTS (Unaudited) (Continued)
December 31, 2017

The accompanying notes are an integral part of these financial statements.
19
M Large Cap Growth FundSCHEDULE OF INVESTMENTS
December 31, 2017
COMMON STOCKS—99.5%Banks—2.9%
96,800 Toronto-Dominion Bank (The) . . . . . . $ 5,670,544
Beverages—4.8% 145,200 Monster Beverage Corp.* . . . . . . . . . . 9,189,708
Biotechnology—6.4% 28,850 Alexion Pharmaceuticals, Inc.* . . . . . . 3,450,171 23,800 Regeneron Pharmaceuticals, Inc.* . . . . 8,947,848
12,398,019
Capital Markets—5.4% 202,400 Charles Schwab Corp. (The) . . . . . . . . 10,397,288
Health Care Equipment and Supplies—5.7%
109,950 Abbott Laboratories . . . . . . . . . . . . . . . 6,274,847 22,000 Becton, Dickinson & Co. . . . . . . . . . . . 4,709,320
10,984,167
Hotels, Restaurants & Leisure—10.5%
104,650 Norwegian Cruise Line Holdings, Ltd.* . . . . . . . . . . . . . . . . . 5,572,612
62,000 Royal Caribbean Cruises, Ltd. . . . . . . . 7,395,360 53,200 Starbucks Corp. . . . . . . . . . . . . . . . . . . 3,055,276 25,700 Wynn Resorts, Ltd. . . . . . . . . . . . . . . . 4,332,763
20,356,011
Internet and Catalog Retail—3.8% 4,210 Priceline.com, Inc.* . . . . . . . . . . . . . . . 7,315,885
Internet Software and Services—28.1%
84,700 Alibaba Group Holding, Ltd., SP ADR* . . . . . . . . . . . . . . . . . . . . . . 14,604,821
10,800 Alphabet, Inc., Class A* . . . . . . . . . . . 11,376,720 604 Alphabet, Inc., Class C* . . . . . . . . . . . 632,026 82,500 Facebook, Inc., Class A* . . . . . . . . . . . 14,557,950 254,500 Tencent Holdings, Ltd., ADR . . . . . . . . 13,213,640
54,385,157
IT Services—8.0% 62,000 PayPal Holdings, Inc.* . . . . . . . . . . . . . 4,564,440 96,000 Visa, Inc., Class A . . . . . . . . . . . . . . . . 10,945,920
15,510,360
Life Sciences Tools and Services—1.0%
10,200 Thermo Fisher Scientific, Inc. . . . . . . . $ 1,936,776
Multiline Retail—4.2% 75,500 Dollar Tree, Inc.* . . . . . . . . . . . . . . . . . 8,101,905
Pharmaceuticals—5.5% 147,700 Zoetis, Inc. . . . . . . . . . . . . . . . . . . . . . . 10,640,308
Road and Rail—3.6% 15,200 Canadian Pacific Railway, Ltd. . . . . . . 2,777,952 40,400 Kansas City Southern . . . . . . . . . . . . . . 4,250,888
7,028,840
Software—9.6% 53,150 Adobe Systems, Inc.* . . . . . . . . . . . . . 9,314,006 107,164 Microsoft Corp. . . . . . . . . . . . . . . . . . . 9,166,809
18,480,815
TOTAL COMMON STOCKS(Cost $127,610,074) . . . . . . . . . . . . . 192,395,783
Value Shares (Note 1)
Value Shares (Note 1)

SHORT-TERM INVESTMENTS—0.2%$318,055 State Street Bank and Trust Co. (Euro Time Deposit) . . . . . . . . . . . . . . . . . . . . . . . . . . . . 0.120% 01/02/2018 $ 318,055
TOTAL SHORT-TERM INVESTMENTS (Cost $318,055) . . . . . . . . . . . . . . . . . . . . . . . . . . . . . . . . . . . . . . . . . 318,055
TOTAL INVESTMENTS, AT VALUE—99.7%(Cost $127,928,129) . . . . . . . . . . . . . . . . . . . . . . . . . . . . . . . . . . . . . . . . . . . . . . . . . . . . . . . . . . . . . . . . . . . . . . . . 192,713,838
Other Assets in Excess of Liabilities—0.3% . . . . . . . . . . . . . . . . . . . . . . . . . . . . . . . . . . . . . . . . . . . . . . . . . . . . . 665,307
NET ASSETS—100.0% . . . . . . . . . . . . . . . . . . . . . . . . . . . . . . . . . . . . . . . . . . . . . . . . . . . . . . . . . . . . . . . . . . . . . . $193,379,145
Notes to the Schedule of Investments:
ADR—American Depositary Receipt
SP ADR—Sponsored American Depositary Receipt
* Non-income producing security
Percentages indicated are based on net assets.
The accompanying notes are an integral part of these financial statements.
20
Par ValueAmount Yield Maturity (Note 1)
M Large Cap Growth FundSCHEDULE OF INVESTMENTS (Continued)
December 31, 2017

At December 31, 2017, industry sector diversification of the M Large Cap Growth Fund’s investments as apercentage of net assets was as follows:
Percentage of Net Summary of Sector Classifications Assets Information Technology . . . . . . . . . . . . . . . . . . . . . . . . . . . . . . . . . . . . . . . . . . . . . . . . . . . . . . . . . . . . 45.7%Health Care . . . . . . . . . . . . . . . . . . . . . . . . . . . . . . . . . . . . . . . . . . . . . . . . . . . . . . . . . . . . . . . . . . . . . 18.6%Consumer Discretionary . . . . . . . . . . . . . . . . . . . . . . . . . . . . . . . . . . . . . . . . . . . . . . . . . . . . . . . . . . . 18.5%Financials . . . . . . . . . . . . . . . . . . . . . . . . . . . . . . . . . . . . . . . . . . . . . . . . . . . . . . . . . . . . . . . . . . . . . . . 8.3%Consumer Staples . . . . . . . . . . . . . . . . . . . . . . . . . . . . . . . . . . . . . . . . . . . . . . . . . . . . . . . . . . . . . . . . . 4.8%Industrials . . . . . . . . . . . . . . . . . . . . . . . . . . . . . . . . . . . . . . . . . . . . . . . . . . . . . . . . . . . . . . . . . . . . . . . 3.6%Short-Term Investments . . . . . . . . . . . . . . . . . . . . . . . . . . . . . . . . . . . . . . . . . . . . . . . . . . . . . . . . . . . . 0.2%
Total . . . . . . . . . . . . . . . . . . . . . . . . . . . . . . . . . . . . . . . . . . . . . . . . . . . . . . . . . . . . . . . . . . . . . . 99.7%
The accompanying notes are an integral part of these financial statements.
21
M Large Cap Growth FundSCHEDULE OF INVESTMENTS (Unaudited) (Continued)
December 31, 2017

The accompanying notes are an integral part of these financial statements.
22
M Capital Appreciation FundSCHEDULE OF INVESTMENTS
December 31, 2017
COMMON STOCKS—98.3%Aerospace & Defense—0.4%
8,102 Astronics Corp.* . . . . . . . . . . . . . . . $ 335,990 8,140 Cubic Corp. . . . . . . . . . . . . . . . . . . . 479,853
815,843
Airlines—6.1% 25,290 American Airlines Group, Inc. . . . . 1,315,839 235,369 Controladora Vuela Cia de
Aviacion SAB de CV, ADR†,* . . . 1,887,660 11,619 Hawaiian Holdings, Inc. . . . . . . . . . 463,017 67,607 JetBlue Airways Corp.* . . . . . . . . . 1,510,340 112,698 United Continental
Holdings, Inc.* . . . . . . . . . . . . . . . 7,595,845
12,772,701
Auto Components—0.8% 29,253 Dana Holding Corp. . . . . . . . . . . . . 936,389 40,115 Modine Manufacturing Co.* . . . . . . 810,323
1,746,712
Banks—3.1% 147,667 First BanCorp/Puerto Rico* . . . . . . 753,102 30,812 First Horizon National Corp. . . . . . 615,932 10,594 PacWest Bancorp . . . . . . . . . . . . . . 533,938 39,726 Popular, Inc. . . . . . . . . . . . . . . . . . . 1,409,876 14,070 Signature Bank/New York NY* . . . 1,931,248 20,984 Webster Financial Corp. . . . . . . . . . 1,178,461
6,422,557
Biotechnology—1.1% 1,432 Alkermes Plc* . . . . . . . . . . . . . . . . . 78,373 50,446 Myriad Genetics, Inc.* . . . . . . . . . . 1,732,568 30,710 Sangamo BioSciences, Inc.* . . . . . . 503,644
2,314,585
Building Products—1.8% 15,868 Armstrong World Industries, Inc.* . 960,807 35,968 Caesarstone Sdot-Yam, Ltd.* . . . . . 791,296 18,112 Trex Co., Inc.* . . . . . . . . . . . . . . . . 1,963,160
3,715,263
Capital Markets—3.0% 40,396 Artisan Partners Asset
Management, Inc. . . . . . . . . . . . . . 1,595,642 16,369 E*TRADE Financial Corp.* . . . . . . 811,411
Capital Markets (Continued) 42,167 Greenhill & Co., Inc.† . . . . . . . . . . . $ 822,257 22,588 LPL Financial Holdings, Inc. . . . . . 1,290,678 18,812 Raymond James Financial, Inc. . . . 1,679,912
6,199,900
Chemicals—5.1% 14,080 Albemarle Corp. . . . . . . . . . . . . . . . 1,800,691 29,896 FMC Corp. . . . . . . . . . . . . . . . . . . . 2,829,955 9,686 Innophos Holdings, Inc. . . . . . . . . . 452,627 67,400 Kraton Performance
Polymers, Inc.* . . . . . . . . . . . . . . . 3,246,658 35,705 Platform Specialty
Products Corp.* . . . . . . . . . . . . . . 354,194 95,515 Tronox, Ltd., Class A . . . . . . . . . . . 1,959,013
10,643,138
Commercial Services & Supplies—0.9%
69,719 Aqua Metals, Inc.†,* . . . . . . . . . . . . 148,502 49,198 Covanta Holding Corp.† . . . . . . . . . 831,446 39,535 Interface, Inc. . . . . . . . . . . . . . . . . . 994,305
1,974,253
Communications Equipment—0.3%
88,100 Infinera Corp.†,* . . . . . . . . . . . . . . . 557,673
Construction and Engineering—3.8%
20,329 Granite Construction, Inc. . . . . . . . . 1,289,468 34,272 KBR, Inc. . . . . . . . . . . . . . . . . . . . . 679,614 74,115 MasTec, Inc.* . . . . . . . . . . . . . . . . . 3,627,929 90,653 Tutor Perini Corp.* . . . . . . . . . . . . . 2,298,054
7,895,065
Construction Materials—2.4% 18,070 Eagle Materials, Inc. . . . . . . . . . . . . 2,047,331 151,610 Forterra, Inc.†,* . . . . . . . . . . . . . . . . 1,682,871 5,883 Martin Marietta Materials, Inc. . . . . 1,300,378
5,030,580
Consumer Finance—1.1% 29,368 Green Dot Corp., Class A* . . . . . . . 1,769,716 18,329 PRA Group, Inc.†,* . . . . . . . . . . . . 608,523
2,378,239
Value Shares (Note 1)
Value Shares (Note 1)

The accompanying notes are an integral part of these financial statements.
23
M Capital Appreciation FundSCHEDULE OF INVESTMENTS (Continued)
December 31, 2017
Containers and Packaging—2.4% 64,820 Berry Plastics Group, Inc.* . . . . . . . $ 3,802,990 79,794 Graphic Packaging Holding Co. . . . 1,232,817
5,035,807
Diversified Consumer Services—0.7%
130,858 Career Education Corp.* . . . . . . . . . 1,580,765
Diversified Financial Services—0.7%
55,226 Leucadia National Corp. . . . . . . . . . 1,462,937
Diversified Telecommunication Services—1.5%
68,536 Cogent Communications Group, Inc. . . . . . . . . . . . . . . . . . . 3,104,681
Electrical Equipment—0.6% 16,633 Encore Wire Corp. . . . . . . . . . . . . . 809,196 60,322 LSI Industries, Inc. . . . . . . . . . . . . . 415,015
1,224,211
Electronic Equipment, Instruments & Components—7.7%
33,671 Belden, Inc. . . . . . . . . . . . . . . . . . . . 2,598,391 27,704 Control4 Corp.* . . . . . . . . . . . . . . . 824,471 119,871 Flextronics International, Ltd.* . . . . 2,156,479 31,138 Itron, Inc.* . . . . . . . . . . . . . . . . . . . . 2,123,612 68,705 Jabil Circuit, Inc. . . . . . . . . . . . . . . . 1,803,506 22,284 Rogers Corp.* . . . . . . . . . . . . . . . . . 3,608,225 17,507 Universal Display Corp. . . . . . . . . . 3,022,584
16,137,268
Energy Equipment and Services—0.5%
10,336 Dril-Quip, Inc.* . . . . . . . . . . . . . . . . 493,027 16,732 TechnipFMC Plc . . . . . . . . . . . . . . . 523,879
1,016,906
Food Products—0.8% 100,962 Amplify Snack Brands, Inc.†,* . . . . 1,212,554 25,589 Darling Ingredients, Inc.* . . . . . . . . 463,928
1,676,482
Health Care Equipment and Supplies—6.8%
50,693 Cardiovascular Systems, Inc.* . . . . $ 1,200,917 15,066 Cooper Cos., Inc. (The) . . . . . . . . . . 3,282,580 28,219 Dexcom, Inc.†,* . . . . . . . . . . . . . . . 1,619,489 18,080 Edwards Lifesciences Corp.* . . . . . 2,037,797 67,923 Insulet Corp.* . . . . . . . . . . . . . . . . . 4,686,687 14,411 STERIS Plc . . . . . . . . . . . . . . . . . . . 1,260,530 30,242 Tandem Diabetes Care, Inc.†,* . . . . 71,371
14,159,371
Health Care Providers and Services—2.1%
61,562 Acadia Healthcare Co., Inc.†,* . . . . 2,008,768 117,894 Diplomat Pharmacy, Inc.* . . . . . . . . 2,366,133
4,374,901
Hotels, Restaurants & Leisure—0.5%
32,070 Planet Fitness, Inc., Class A* . . . . . 1,110,584
Household Durables—0.7% 30,185 Universal Electronics, Inc.* . . . . . . 1,426,241
Insurance—1.8% 22,994 Aspen Insurance Holdings, Ltd. . . . 933,557 7,686 Everest Re Group, Ltd. . . . . . . . . . . 1,700,604 16,777 W. R. Berkley Corp. . . . . . . . . . . . . 1,202,072
3,836,233
Internet Software and Services—3.1%
28,949 2u, Inc.* . . . . . . . . . . . . . . . . . . . . . 1,867,500 18,085 Akamai Technologies, Inc.* . . . . . . 1,176,248 28,152 Benefitfocus, Inc.†,* . . . . . . . . . . . . 760,104 167,356 Brightcove, Inc.* . . . . . . . . . . . . . . . 1,188,228 103,062 Gogo, Inc.†,* . . . . . . . . . . . . . . . . . . 1,162,539 18,685 Web.com Group, Inc.* . . . . . . . . . . 407,333
6,561,952
IT Services—1.5% 3,796 Alliance Data Systems Corp. . . . . . 962,210 9,873 Euronet Worldwide, Inc.* . . . . . . . . 831,998 14,075 Global Payments, Inc. . . . . . . . . . . . 1,410,878
3,205,086
Value Shares (Note 1)
Value Shares (Note 1)

The accompanying notes are an integral part of these financial statements.
24
M Capital Appreciation FundSCHEDULE OF INVESTMENTS (Continued)
December 31, 2017
Leisure Equipment and Products—0.6%
90,940 Vista Outdoor, Inc.* . . . . . . . . . . . . $ 1,324,996
Life Sciences Tools and Services—1.4%
6,839 Illumina, Inc.* . . . . . . . . . . . . . . . . . 1,494,253 93,662 Pacific Biosciences of
California, Inc.†,* . . . . . . . . . . . . 247,268 36,536 QIAGEN NV* . . . . . . . . . . . . . . . . . 1,130,058
2,871,579
Machinery—1.3% 85,502 Meritor, Inc.* . . . . . . . . . . . . . . . . . 2,005,877 5,293 WABCO Holdings, Inc.* . . . . . . . . 759,545
2,765,422
Marine—0.5% 14,852 Kirby Corp.* . . . . . . . . . . . . . . . . . . 992,114
Media—1.7% 354,214 Global Eagle
Entertainment, Inc.†,* . . . . . . . . . 811,150 48,120 Imax Corp.* . . . . . . . . . . . . . . . . . . 1,113,978 52,137 Lions Gate Entertainment Corp.,
Class B* . . . . . . . . . . . . . . . . . . . . 1,654,828
3,579,956
Metals and Mining—6.0% 30,586 Agnico-Eagle Mines, Ltd. . . . . . . . . 1,412,461 177,757 Allegheny Technologies, Inc.†,* . . . 4,291,054 9,744 Carpenter Technology Corp. . . . . . . 496,847 166,918 Coeur Mining, Inc.* . . . . . . . . . . . . 1,251,885 248,019 Ferroglobe Plc* . . . . . . . . . . . . . . . . 4,017,908 265,265 Ferroglobe Plc Beneficial
Interest Unit* . . . . . . . . . . . . . . . . — 13,891 Steel Dynamics, Inc. . . . . . . . . . . . . 599,119 20,317 Warrior Met Coal, Inc.† . . . . . . . . . 510,972
12,580,246
Oil, Gas and Consumable Fuels—2.9%
88,095 Carrizo Oil & Gas, Inc.†,* . . . . . . . 1,874,661 47,295 Euronav NV† . . . . . . . . . . . . . . . . . 437,479 82,907 GasLog, Ltd.† . . . . . . . . . . . . . . . . . 1,844,681 20,533 Golar LNG, Ltd.† . . . . . . . . . . . . . . 612,089 43,734 Navigator Holdings, Ltd.†,* . . . . . . 430,780
Oil, Gas and Consumable Fuels (Continued)
43,191 SM Energy Co. . . . . . . . . . . . . . . . . $ 953,657
6,153,347
Paper and Forest Products—0.3% 22,562 Louisiana-Pacific Corp.* . . . . . . . . 592,478
Road and Rail—0.6% 28,949 Knight-Swift Transportation
Holdings, Inc.† . . . . . . . . . . . . . . . 1,265,650
Semiconductors and Semiconductor Equipment—12.2%
8,047 Cavium, Inc.* . . . . . . . . . . . . . . . . . 674,580 40,474 Cree, Inc.* . . . . . . . . . . . . . . . . . . . . 1,503,204 95,597 Cypress Semiconductor Corp. . . . . 1,456,898 52,376 Integrated Device Technology, Inc.* 1,557,138 63,453 MACOM Technology Solutions
Holdings, Inc.†,* . . . . . . . . . . . . . 2,064,761 30,503 Maxim Integrated Products, Inc. . . . 1,594,697 29,263 Monolithic Power Systems, Inc. . . . 3,287,991 72,661 ON Semiconductor Corp.* . . . . . . . 1,521,521 48,459 Qorvo, Inc.* . . . . . . . . . . . . . . . . . . 3,227,369 421,375 QuickLogic Corp.†,* . . . . . . . . . . . 733,193 43,597 Semtech Corp.* . . . . . . . . . . . . . . . . 1,491,017 9,148 Silicon Laboratories, Inc.* . . . . . . . 807,768 29,270 Skyworks Solutions, Inc. . . . . . . . . . 2,779,187 103,727 Veeco Instruments, Inc.* . . . . . . . . . 1,540,346 54,554 Xperi Corp. . . . . . . . . . . . . . . . . . . . 1,331,118
25,570,788
Software—4.1% 21,650 Barracuda Networks, Inc.* . . . . . . . 595,375 5,433 Electronic Arts, Inc.* . . . . . . . . . . . 570,791 16,177 Ellie Mae, Inc.†,* . . . . . . . . . . . . . . 1,446,224 114,638 Nuance Communications, Inc.* . . . 1,874,331 15,945 Rapid7, Inc.* . . . . . . . . . . . . . . . . . . 297,534 4,050 Silver Spring Networks, Inc.* . . . . . 65,772 233,989 TiVo Corp. . . . . . . . . . . . . . . . . . . . . 3,650,228
8,500,255
Specialty Retail—1.0% 24,206 MarineMax, Inc.* . . . . . . . . . . . . . . 457,493 72,989 Tailored Brands, Inc. . . . . . . . . . . . . 1,593,350
2,050,843
Value Shares (Note 1)
Value Shares (Note 1)

The accompanying notes are an integral part of these financial statements.
25
M Capital Appreciation FundSCHEDULE OF INVESTMENTS (Continued)
December 31, 2017
Trading Companies and Distributors—3.2%
27,656 Beacon Roofing Supply, Inc.* . . . . $ 1,763,347 66,068 BMC Stock Holdings, Inc.* . . . . . . 1,671,520 26,869 DXP Enterprises, Inc.* . . . . . . . . . . 794,516 46,317 MRC Global, Inc.* . . . . . . . . . . . . . 783,684 9,482 Watsco, Inc. . . . . . . . . . . . . . . . . . . . 1,612,319
6,625,386
Transportation Infrastructure—1.2%
39,076 Macquarie Infrastructure Corp. . . . $ 2,508,679
TOTAL COMMON STOCKS(Cost $125,176,013) . . . . . . . . . . . 205,761,673
Value Shares (Note 1)
Value Shares (Note 1)
SHORT-TERM INVESTMENTS—11.6%$ 1,211,429 State Street Bank and Trust Co. (Euro Time Deposit) . . . . . . . . . . . . . . . . . . . . . . . . . . 0.120% 01/02/2018 1,211,429
Shares
23,114,401 State Street Navigator Securities Lending Prime Portfolio (Money Market)†† . . . . . . 1.3471% 23,114,401
TOTAL SHORT-TERM INVESTMENTS (Cost $24,325,830) . . . . . . . . . . . . . . . . . . . . . . . . . . . . . . . . . . . . 24,325,830
TOTAL INVESTMENTS, AT VALUE—109.9%(Cost $149,501,843) . . . . . . . . . . . . . . . . . . . . . . . . . . . . . . . . . . . . . . . . . . . . . . . . . . . . . . . . . . . . . . . . . . . . . . 230,087,503
Liabilities in Excess of Other Assets—(9.9)% . . . . . . . . . . . . . . . . . . . . . . . . . . . . . . . . . . . . . . . . . . . . . . . . . . (20,803,283)
NET ASSETS—100.0% . . . . . . . . . . . . . . . . . . . . . . . . . . . . . . . . . . . . . . . . . . . . . . . . . . . . . . . . . . . . . . . . . . . $209,284,220
Notes to the Schedule of Investments:
ADR—American Depositary Receipt
* Non-income producing security
† Denotes all or a portion of security on loan (Note 1)
†† Represents collateral received from securities lending transactions
Percentages indicated are based on net assets.
Par Amount Yield Maturity

At December 31, 2017, industry sector diversification of the M Capital Appreciation Fund’s investments as apercentage of net assets was as follows:
Percentage of Net Summary of Sector Classifications Assets Information Technology . . . . . . . . . . . . . . . . . . . . . . . . . . . . . . . . . . . . . . . . . . . . . . . . . . . . . . . . . . . . 28.9%Industrials . . . . . . . . . . . . . . . . . . . . . . . . . . . . . . . . . . . . . . . . . . . . . . . . . . . . . . . . . . . . . . . . . . . . . . . 20.4%Materials . . . . . . . . . . . . . . . . . . . . . . . . . . . . . . . . . . . . . . . . . . . . . . . . . . . . . . . . . . . . . . . . . . . . . . . 16.2%Health Care . . . . . . . . . . . . . . . . . . . . . . . . . . . . . . . . . . . . . . . . . . . . . . . . . . . . . . . . . . . . . . . . . . . . . 11.4%Financials . . . . . . . . . . . . . . . . . . . . . . . . . . . . . . . . . . . . . . . . . . . . . . . . . . . . . . . . . . . . . . . . . . . . . . . 9.7%Consumer Discretionary . . . . . . . . . . . . . . . . . . . . . . . . . . . . . . . . . . . . . . . . . . . . . . . . . . . . . . . . . . . 6.0%Energy . . . . . . . . . . . . . . . . . . . . . . . . . . . . . . . . . . . . . . . . . . . . . . . . . . . . . . . . . . . . . . . . . . . . . . . . . 3.4%Telecommunication Services . . . . . . . . . . . . . . . . . . . . . . . . . . . . . . . . . . . . . . . . . . . . . . . . . . . . . . . . 1.5%Consumer Staples . . . . . . . . . . . . . . . . . . . . . . . . . . . . . . . . . . . . . . . . . . . . . . . . . . . . . . . . . . . . . . . . . 0.8%Short-Term Investments . . . . . . . . . . . . . . . . . . . . . . . . . . . . . . . . . . . . . . . . . . . . . . . . . . . . . . . . . . . . 11.6%
Total . . . . . . . . . . . . . . . . . . . . . . . . . . . . . . . . . . . . . . . . . . . . . . . . . . . . . . . . . . . . . . . . . . . . . . 109.9%
The accompanying notes are an integral part of these financial statements.
26
M Capital Appreciation FundSCHEDULE OF INVESTMENTS (Unaudited) (Continued)
December 31, 2017

The accompanying notes are an integral part of these financial statements.
27
M Large Cap Value FundSCHEDULE OF INVESTMENTS
December 31, 2017
COMMON STOCKS—98.9%Aerospace & Defense—1.3%
2,302 Huntington Ingalls Industries, Inc. . . $ 542,582 385 Moog, Inc., Class A* . . . . . . . . . . . . . 33,437 7,856 Spirit AeroSystems Holdings, Inc.,
Class A . . . . . . . . . . . . . . . . . . . . . . 685,436
1,261,455
Airlines—1.3% 11,386 Delta Air Lines, Inc. . . . . . . . . . . . . . 637,616 27,261 JetBlue Airways Corp.* . . . . . . . . . . 609,011
1,246,627
Auto Components—2.5% 27,412 Dana Holding Corp. . . . . . . . . . . . . . 877,458 5,291 Lear Corp. . . . . . . . . . . . . . . . . . . . . . 934,708 9,448 Tenneco, Inc. . . . . . . . . . . . . . . . . . . . 553,086 1,171 Visteon Corp.* . . . . . . . . . . . . . . . . . 146,539
2,511,791
Automobiles—1.7% 16,056 Fiat Chrysler Automobiles NV* . . . . 286,439 33,345 General Motors Co. . . . . . . . . . . . . . . 1,366,812
1,653,251
Banks—9.6% 119,300 Bank of America Corp. . . . . . . . . . . . 3,521,736 11,729 Citigroup, Inc. . . . . . . . . . . . . . . . . . . 872,755 32,319 Citizens Financial Group, Inc. . . . . . 1,356,752 27,394 JPMorgan Chase & Co. . . . . . . . . . . . 2,929,514 15,565 Synovus Financial Corp. . . . . . . . . . . 746,186 3,891 TCF Financial Corp. . . . . . . . . . . . . . 79,765
9,506,708
Beverages—1.4% 11,543 PepsiCo, Inc. . . . . . . . . . . . . . . . . . . . 1,384,237
Biotechnology—0.8% 10,446 Exelixis, Inc.* . . . . . . . . . . . . . . . . . . 317,558 3,119 Gilead Sciences, Inc. . . . . . . . . . . . . . 223,445 1,872 Vertex Pharmaceuticals, Inc.* . . . . . . 280,538
821,541
Building Products—1.4% 12,479 Masco Corp. . . . . . . . . . . . . . . . . . . . 548,327 9,455 Owens Corning . . . . . . . . . . . . . . . . . 869,293
1,417,620
Capital Markets—4.5% 4,656 Ameriprise Financial, Inc. . . . . . . . . . $ 789,052 15,792 Lazard, Ltd., Class A . . . . . . . . . . . . . 829,080 7,202 LPL Financial Holdings, Inc. . . . . . . 411,522 14,472 Morgan Stanley . . . . . . . . . . . . . . . . . 759,346 7,379 S&P Global, Inc. . . . . . . . . . . . . . . . . 1,250,003 6,819 SEI Investments Co. . . . . . . . . . . . . . 490,013
4,529,016
Chemicals—2.7% 8,398 Cabot Corp. . . . . . . . . . . . . . . . . . . . . 517,233 2,255 Celanese Corp., Series A . . . . . . . . . . 241,465 7,805 Chemours Co. (The) . . . . . . . . . . . . . 390,718 9,166 LyondellBasell Industries NV,
Class A . . . . . . . . . . . . . . . . . . . . . . 1,011,193 6,761 Trinseo SA . . . . . . . . . . . . . . . . . . . . 490,849
2,651,458
Construction and Engineering—0.9%
993 Jacobs Engineering Group, Inc. . . . . 65,498 22,349 Quanta Services, Inc.* . . . . . . . . . . . 874,070
939,568
Consumer Finance—1.3% 29,062 Ally Financial, Inc. . . . . . . . . . . . . . . 847,448 1,227 Discover Financial Services . . . . . . . 94,381 29,079 Navient Corp. . . . . . . . . . . . . . . . . . . 387,332
1,329,161
Diversified Financial Services—1.8%
31,531 Leucadia National Corp. . . . . . . . . . . 835,256 19,705 Voya Financial, Inc. . . . . . . . . . . . . . . 974,807
1,810,063
Diversified Telecommunication Services—1.8%
34,161 Verizon Communications, Inc. . . . . . 1,808,142
Electric Utilities—3.4% 11,044 American Electric Power Co., Inc. . . 812,507 7,661 Edison International . . . . . . . . . . . . . 484,482 15,620 Entergy Corp. . . . . . . . . . . . . . . . . . . 1,271,312 17,040 Portland General Electric Co. . . . . . . 776,683
3,344,984
Value Shares (Note 1)
Value Shares (Note 1)

The accompanying notes are an integral part of these financial statements.
28
M Large Cap Value FundSCHEDULE OF INVESTMENTS (Continued)
December 31, 2017
Electronic Equipment, Instruments & Components—1.2%
17,526 Jabil Circuit, Inc. . . . . . . . . . . . . . . . . $ 460,057 36,688 Vishay Intertechnology, Inc.† . . . . . . 761,276
1,221,333
Equity Real Estate Investment Trusts (REITs)—1.9%
18,758 Gaming and Leisure Properties, Inc., REIT . . . . . . . . . . . . . . . . . . . . 694,046
22,447 Hospitality Properties Trust, REIT . . 670,043 3,973 Liberty Property Trust, REIT . . . . . . 170,879 6,282 Mack-Cali Realty Corp., REIT . . . . . 135,440 3,779 Ryman Hospitality Properties,
Inc., REIT . . . . . . . . . . . . . . . . . . . . 260,826
1,931,234
Food and Staples Retailing—2.0% 9,805 US Foods Holding Corp.* . . . . . . . . . 313,073 17,321 Wal-Mart Stores, Inc. . . . . . . . . . . . . 1,710,449
2,023,522
Food Products—3.0% 6,799 Bunge, Ltd. . . . . . . . . . . . . . . . . . . . . 456,077 2,134 Darling Ingredients, Inc.* . . . . . . . . . 38,689 5,270 Hershey Co. (The) . . . . . . . . . . . . . . . 598,198 9,654 Ingredion, Inc. . . . . . . . . . . . . . . . . . . 1,349,629 3,601 Pilgrim’s Pride Corp.†,* . . . . . . . . . . 111,847 3,409 Sanderson Farms, Inc. . . . . . . . . . . . . 473,101
3,027,541
Gas Utilities—0.6% 7,807 Southwest Gas Holdings, Inc. . . . . . . 628,307
Health Care Equipment and Supplies—1.5%
18,185 Baxter International, Inc. . . . . . . . . . 1,175,478 4,913 Haemonetics Corp.* . . . . . . . . . . . . . 285,347
1,460,825
Health Care Providers and Services—1.7%
2,243 Anthem, Inc. . . . . . . . . . . . . . . . . . . . 504,697 2,503 Centene Corp.* . . . . . . . . . . . . . . . . . 252,503 3,094 Express Scripts Holding Co.* . . . . . . 230,936 2,923 Humana, Inc. . . . . . . . . . . . . . . . . . . . 725,109
1,713,245
Household Durables—0.9% 20,336 Pulte Homes, Inc. . . . . . . . . . . . . . . . $ 676,172 3,914 Toll Brothers, Inc. . . . . . . . . . . . . . . . 187,950
864,122
Independent Power and Renewable Electricity Producers—0.8%
74,825 AES Corp./VA . . . . . . . . . . . . . . . . . 810,355
Insurance—8.1% 3,549 AFLAC, Inc. . . . . . . . . . . . . . . . . . . . 311,531 14,306 Allstate Corp. (The) . . . . . . . . . . . . . 1,497,981 15,729 Assured Guaranty, Ltd. . . . . . . . . . . . 532,741 28,317 CNO Financial Group, Inc. . . . . . . . . 699,147 13,778 Lincoln National Corp. . . . . . . . . . . . 1,059,115 4,889 Old Republic International Corp. . . . 104,527 13,799 Prudential Financial, Inc. . . . . . . . . . 1,586,609 7,670 Reinsurance Group of America, Inc. . 1,195,983 19,629 Unum Group . . . . . . . . . . . . . . . . . . . 1,077,436
8,065,070
Internet Software and Services—1.2%
10,718 VeriSign, Inc.†,* . . . . . . . . . . . . . . . . 1,226,568
IT Services—0.2% 2,201 Cognizant Technology Solutions
Corp., Class A . . . . . . . . . . . . . . . . 156,315
Leisure Equipment and Products—0.3%
4,570 Brunswick Corp/DE . . . . . . . . . . . . . 252,355
Life Sciences Tools and Services—0.3%
9,696 Bruker Corp. . . . . . . . . . . . . . . . . . . . 332,767
Machinery—1.4% 5,392 Cummins, Inc. . . . . . . . . . . . . . . . . . . 952,443 4,730 Oshkosh Corp. . . . . . . . . . . . . . . . . . 429,910
1,382,353
Media—1.1% 3,411 AMC Networks, Inc., Class A* . . . . . 184,467 5,347 John Wiley & Sons, Inc., Class A . . . 351,565 31,908 News Corp., Class A . . . . . . . . . . . . . 517,229
1,053,261
Value Shares (Note 1)
Value Shares (Note 1)

The accompanying notes are an integral part of these financial statements.
29
M Large Cap Value FundSCHEDULE OF INVESTMENTS (Continued)
December 31, 2017
Metals and Mining—0.4% 7,245 Alcoa Corp.* . . . . . . . . . . . . . . . . . . . $ 390,288
Multi-Utilities—0.4% 6,997 Public Service Enterprise
Group, Inc. . . . . . . . . . . . . . . . . . . . 360,346
Oil, Gas and Consumable Fuels—10.5%
7,041 Andeavor . . . . . . . . . . . . . . . . . . . . . . 805,068 9,176 Chevron Corp. . . . . . . . . . . . . . . . . . . 1,148,743 5,058 ConocoPhillips . . . . . . . . . . . . . . . . . 277,634 19,219 Devon Energy Corp. . . . . . . . . . . . . . 795,667 35,586 Exxon Mobil Corp. . . . . . . . . . . . . . . 2,976,413 20,076 Marathon Petroleum Corp. . . . . . . . . 1,324,615 9,898 PBF Energy, Inc., Class A . . . . . . . . . 350,884 4,549 Phillips 66 . . . . . . . . . . . . . . . . . . . . . 460,131 16,003 QEP Resources, Inc.* . . . . . . . . . . . . 153,149 57,026 Southwestern Energy Co.* . . . . . . . . 318,205 17,158 Valero Energy Corp. . . . . . . . . . . . . . 1,576,992 8,396 World Fuel Services Corp. . . . . . . . . 236,263
10,423,764
Paper and Forest Products—0.7% 1,536 Domtar Corp. . . . . . . . . . . . . . . . . . . 76,063 14,156 Louisiana-Pacific Corp.* . . . . . . . . . 371,736 8,212 Norbord, Inc. . . . . . . . . . . . . . . . . . . . 277,648
725,447
Personal Products—0.5% 6,727 Nu Skin Enterprises, Inc., Class A . . 458,983
Pharmaceuticals—9.7% 13,990 Bristol-Myers Squibb Co. . . . . . . . . . 857,307 3,839 Eli Lilly & Co. . . . . . . . . . . . . . . . . . 324,242 26,461 Johnson & Johnson . . . . . . . . . . . . . . 3,697,131 33,266 Merck & Co., Inc. . . . . . . . . . . . . . . . 1,871,878 79,210 Pfizer, Inc. . . . . . . . . . . . . . . . . . . . . . 2,868,986
9,619,544
Professional Services—0.7% 5,550 ManpowerGroup, Inc. . . . . . . . . . . . . 699,910
Real Estate Management and Development—2.4%
30,107 CBRE Group, Inc., Class A* . . . . . . 1,303,934 4,500 Jones Lang LaSalle, Inc. . . . . . . . . . . 670,185
Real Estate Management and Development (Continued)
15,783 Realogy Holdings Corp. . . . . . . . . . . $ 418,250
2,392,369
Road and Rail—1.6% 4,007 Old Dominion Freight Line, Inc. . . . 527,121 12,490 Ryder System, Inc. . . . . . . . . . . . . . . 1,051,283
1,578,404
Semiconductors and SemiconductorEquipment—1.7%
5,861 Advanced Energy Industries, Inc.* . . 395,500 21,674 Amkor Technology, Inc.* . . . . . . . . . 217,824 13,957 Applied Materials, Inc. . . . . . . . . . . . 713,482 9,614 Micron Technology, Inc.* . . . . . . . . . 395,327
1,722,133
Software—4.4% 11,361 Aspen Technology, Inc.* . . . . . . . . . . 752,098 7,466 Cadence Design Systems, Inc.* . . . . 312,228 3,095 Citrix Systems, Inc.* . . . . . . . . . . . . . 272,360 3,861 Intuit, Inc. . . . . . . . . . . . . . . . . . . . . . 609,188 13,753 Microsoft Corp. . . . . . . . . . . . . . . . . . 1,176,432 15,016 Synopsys, Inc.* . . . . . . . . . . . . . . . . . 1,279,964
4,402,270
Specialty Retail—0.7% 6,232 Aaron’s, Inc. . . . . . . . . . . . . . . . . . . . 248,345 16,719 American Eagle Outfitters, Inc. . . . . 314,317 49,497 Office Depot, Inc. . . . . . . . . . . . . . . . 175,220
737,882
Technology Hardware, Storage &Peripherals—0.2%
1,988 Western Digital Corp. . . . . . . . . . . . . 158,106
Textiles, Apparel and Luxury Goods—0.4%
6,473 Michael Kors Holdings, Ltd.* . . . . . . 407,475
Thrifts and Mortgage Finance—0.5%
1,987 Essent Group, Ltd.* . . . . . . . . . . . . . 86,276 25,042 MGIC Investment Corp.* . . . . . . . . . 353,343 5,140 Radian Group, Inc. . . . . . . . . . . . . . . 105,935
545,554
Value Shares (Note 1)
Value Shares (Note 1)

The accompanying notes are an integral part of these financial statements.
30
M Large Cap Value FundSCHEDULE OF INVESTMENTS (Continued)
December 31, 2017
Tobacco—0.8% 7,169 Philip Morris International, Inc. . . . . $ 757,405
Trading Companies and Distributors—0.1%
3,143 Triton International Ltd/Bermuda . . . 117,705
Wireless Telecommunication Services—0.6%
19,847 Telephone & Data Systems, Inc. . . . . $ 551,747
TOTAL COMMON STOCKS (Cost $81,797,055) . . . . . . . . . . . . . 98,414,127
Value Shares (Note 1)
Value Shares (Note 1)
SHORT-TERM INVESTMENTS—2.9%$1,015,803 State Street Bank and Trust Co. (Euro Time Deposit) . . . . . . . . . . . . . . . . . . . . . . . . . . . 0.120% 01/02/2018 1,015,803
Shares
1,851,917 State Street Navigator Securities Lending Prime Portfolio (Money Market)†† . . . . . . . 1.3471% 1,851,917
TOTAL SHORT-TERM INVESTMENTS (Cost $2,867,720) . . . . . . . . . . . . . . . . . . . . . . . . . . . . . . . . . . . . . . 2,867,720
TOTAL INVESTMENTS, AT VALUE—101.8%(Cost $84,664,775) . . . . . . . . . . . . . . . . . . . . . . . . . . . . . . . . . . . . . . . . . . . . . . . . . . . . . . . . . . . . . . . . . . . . . . . . 101,281,847
Liabilities in Excess of Other Assets—(1.8)% . . . . . . . . . . . . . . . . . . . . . . . . . . . . . . . . . . . . . . . . . . . . . . . . . . . (1,780,738)
NET ASSETS—100.0% . . . . . . . . . . . . . . . . . . . . . . . . . . . . . . . . . . . . . . . . . . . . . . . . . . . . . . . . . . . . . . . . . . . . $ 99,501,109
Notes to the Schedule of Investments:
REIT—Real Estate Investment Trust* Non-income producing security
† Denotes all or a portion of security on loan (Note 1)
†† Represents collateral received from securities lending transactions
Percentages indicated are based on net assets.
Par Amount Yield Maturity

At December 31, 2017, industry sector diversification of the M Large Cap Value Fund’s investments as apercentage of net assets was as follows:
Percentage of Net Summary of Sector Classifications Assets Financials . . . . . . . . . . . . . . . . . . . . . . . . . . . . . . . . . . . . . . . . . . . . . . . . . . . . . . . . . . . . . . . . . . . . . . . 25.8%Health Care . . . . . . . . . . . . . . . . . . . . . . . . . . . . . . . . . . . . . . . . . . . . . . . . . . . . . . . . . . . . . . . . . . . . . 14.0%Energy . . . . . . . . . . . . . . . . . . . . . . . . . . . . . . . . . . . . . . . . . . . . . . . . . . . . . . . . . . . . . . . . . . . . . . . . . 10.5%Information Technology . . . . . . . . . . . . . . . . . . . . . . . . . . . . . . . . . . . . . . . . . . . . . . . . . . . . . . . . . . . . 8.9%Industrials . . . . . . . . . . . . . . . . . . . . . . . . . . . . . . . . . . . . . . . . . . . . . . . . . . . . . . . . . . . . . . . . . . . . . . . 8.7%Consumer Staples . . . . . . . . . . . . . . . . . . . . . . . . . . . . . . . . . . . . . . . . . . . . . . . . . . . . . . . . . . . . . . . . . 7.7%Consumer Discretionary . . . . . . . . . . . . . . . . . . . . . . . . . . . . . . . . . . . . . . . . . . . . . . . . . . . . . . . . . . . 7.6%Utilities . . . . . . . . . . . . . . . . . . . . . . . . . . . . . . . . . . . . . . . . . . . . . . . . . . . . . . . . . . . . . . . . . . . . . . . . . 5.2%Real Estate . . . . . . . . . . . . . . . . . . . . . . . . . . . . . . . . . . . . . . . . . . . . . . . . . . . . . . . . . . . . . . . . . . . . . . 4.3%Materials . . . . . . . . . . . . . . . . . . . . . . . . . . . . . . . . . . . . . . . . . . . . . . . . . . . . . . . . . . . . . . . . . . . . . . . 3.8%Telecommunication Services . . . . . . . . . . . . . . . . . . . . . . . . . . . . . . . . . . . . . . . . . . . . . . . . . . . . . . . . 2.4%Short-Term Investments . . . . . . . . . . . . . . . . . . . . . . . . . . . . . . . . . . . . . . . . . . . . . . . . . . . . . . . . . . . . 2.9%
Total . . . . . . . . . . . . . . . . . . . . . . . . . . . . . . . . . . . . . . . . . . . . . . . . . . . . . . . . . . . . . . . . . . . . . . 101.8%
The accompanying notes are an integral part of these financial statements.
31
M Large Cap Value FundSCHEDULE OF INVESTMENTS (Unaudited) (Continued)
December 31, 2017

M Capital M International M Large Cap Appreciation M Large Cap Equity Fund Growth Fund Fund Value Fund Assets:
Investments, at value (Note 1)*/**—see accompanying Schedule of Investments . . . . . . . . . . . . . . . . . . . . . . . . . . . . . $245,825,751 $192,713,838 $230,087,503 $101,281,847
Cash denominated in foreign currencies*** . . . . . . . . . . . . . . . . 3,819 — — —Receivable from:
Dividends and interest . . . . . . . . . . . . . . . . . . . . . . . . . . . . . . . 835,910 87,042 76,092 85,619Securities sold . . . . . . . . . . . . . . . . . . . . . . . . . . . . . . . . . . . . . 28,320 702,362 2,791,143 254,438Capital stock subscriptions . . . . . . . . . . . . . . . . . . . . . . . . . . . 16,632 26,166 64,110 56,115
Prepaid expenses . . . . . . . . . . . . . . . . . . . . . . . . . . . . . . . . . . . . . 1,039 841 892 425 Total assets . . . . . . . . . . . . . . . . . . . . . . . . . . . . . . . . . . . . 246,711,471 193,530,249 233,019,740 101,678,444
Liabilities:Payable for:
Payable upon return of securities loaned (Note 1) . . . . . . . . . 2,302,217 — 23,114,401 1,851,917Securities purchased . . . . . . . . . . . . . . . . . . . . . . . . . . . . . . . . — — 397,264 240,314Investment Adviser, net (Note 2) . . . . . . . . . . . . . . . . . . . . . . . 140,722 97,879 159,993 36,478Capital stock redemptions . . . . . . . . . . . . . . . . . . . . . . . . . . . . 37,379 6,662 14,988 11,679M Financial Group-compliance expense (Note 2) . . . . . . . . . 4,720 4,092 4,318 1,991Accrued expenses and other liabilities . . . . . . . . . . . . . . . . . . 59,486 42,471 44,556 34,956
Total liabilities . . . . . . . . . . . . . . . . . . . . . . . . . . . . . . . . . . 2,544,524 151,104 23,735,520 2,177,335 Net assets . . . . . . . . . . . . . . . . . . . . . . . . . . . . . . . . . . . . . . . . . . . . . $244,166,947 $193,379,145 $209,284,220 $ 99,501,109
Net assets consist of:Paid-in capital . . . . . . . . . . . . . . . . . . . . . . . . . . . . . . . . . . . . . . . $289,001,082 $119,125,156 $122,425,162 $ 82,330,142Undistributed (distributions in excess of) net investment
income . . . . . . . . . . . . . . . . . . . . . . . . . . . . . . . . . . . . . . . . . . . (1,607,144) — — 44,064Accumulated net realized gain (loss) on investments . . . . . . . . . (90,000,730) 9,468,270 6,273,398 509,831Net unrealized appreciation on investments and foreign
currencies . . . . . . . . . . . . . . . . . . . . . . . . . . . . . . . . . . . . . . . . 46,773,739 64,785,719 80,585,660 16,617,072 Net assets . . . . . . . . . . . . . . . . . . . . . . . . . . . . . . . . . . . . . . . . . . . . . $244,166,947 $193,379,145 $209,284,220 $ 99,501,109 Shares outstanding# . . . . . . . . . . . . . . . . . . . . . . . . . . . . . . . . . . . . 17,979,746 7,158,709 6,698,771 7,143,907
Net asset value, offering price and redemption price per share . . . . $ 13.58 $ 27.01 $ 31.24 $ 13.93
* Cost of investments . . . . . . . . . . . . . . . . . . . . . . . . . . . . . . . . . $199,048,272 $127,928,129 $149,501,843 $ 84,664,775
** Includes securities on loan with market values of . . . . . . . . . . $ 2,229,609 $ — $ 22,233,734 $ 1,784,660
*** Cost of cash denominated in foreign currencies . . . . . . . . . . . $ 3,819 $ — $ — $ —
# The number of authorized shares with a par value of $0.001 per share, for each of the M International Equity Fund, the M Large CapGrowth Fund, the M Capital Appreciation Fund and the M Large Cap Value Fund is 100,000,000.
The accompanying notes are an integral part of these financial statements.
32
M Fund, Inc.STATEMENTS OF ASSETS AND LIABILITIES
December 31, 2017

M Capital M International M Large Cap Appreciation M Large Cap Equity Fund Growth Fund Fund Value Fund Investment income:
Interest . . . . . . . . . . . . . . . . . . . . . . . . . . . . . . . . . . . . . . . . . . . . . $ 5,049 $ 1,059 $ 3,620 $ 989Securities lending income . . . . . . . . . . . . . . . . . . . . . . . . . . . . . . 25,884 55,346 106,365 874Dividends* . . . . . . . . . . . . . . . . . . . . . . . . . . . . . . . . . . . . . . . . . . 4,472,105 916,462 1,985,576 2,049,795Non-cash dividends . . . . . . . . . . . . . . . . . . . . . . . . . . . . . . . . . . . 342,960 — — —
Total investment income . . . . . . . . . . . . . . . . . . . . . . . . . . 4,845,998 972,867 2,095,561 2,051,658
Expenses:Investment advisory fee (Note 2) . . . . . . . . . . . . . . . . . . . . . . . . . 1,525,753 1,083,870 1,853,431 420,020Custody, fund accounting, transfer agent and
administration fees . . . . . . . . . . . . . . . . . . . . . . . . . . . . . . . . . 283,045 130,760 178,401 96,106Directors’ fees and expenses . . . . . . . . . . . . . . . . . . . . . . . . . . . . 45,427 38,108 43,368 19,598Professional fees . . . . . . . . . . . . . . . . . . . . . . . . . . . . . . . . . . . . . 33,120 28,658 28,879 25,582Printing and shareholder reporting . . . . . . . . . . . . . . . . . . . . . . . 20,102 18,638 19,650 15,386Compliance expenses (Note 2) . . . . . . . . . . . . . . . . . . . . . . . . . . 18,197 15,537 17,716 7,924Other . . . . . . . . . . . . . . . . . . . . . . . . . . . . . . . . . . . . . . . . . . . . . . 28,928 23,813 29,515 13,978
Total expenses . . . . . . . . . . . . . . . . . . . . . . . . . . . . . . . . . . 1,954,572 1,339,384 2,170,960 598,594Less: Expenses waived by the Adviser (Note 2) . . . . . . . . . . . . . — — — (14,001) Net expenses . . . . . . . . . . . . . . . . . . . . . . . . . . . . . . . . . . . . . . . . 1,954,572 1,339,384 2,170,960 584,593
Net investment income (loss) . . . . . . . . . . . . . . . . . . . . . . . . . . . . . 2,891,426 (366,517) (75,399) 1,467,065
Realized and unrealized gain (loss):Net realized gain (loss) on:
Investment transactions . . . . . . . . . . . . . . . . . . . . . . . . . . . . . . 1,244,221 15,020,583 25,047,604 6,838,697Foreign currency transactions . . . . . . . . . . . . . . . . . . . . . . . . . (16,647) (910) — 33
Net realized gain . . . . . . . . . . . . . . . . . . . . . . . . . . . . . . . . 1,227,574 15,019,673 25,047,604 6,838,730 Net change in unrealized appreciation (depreciation) on:
Investments . . . . . . . . . . . . . . . . . . . . . . . . . . . . . . . . . . . . . . . 41,856,691 44,314,293 10,656,325 4,917,990Foreign currency translation . . . . . . . . . . . . . . . . . . . . . . . . . . 54,061 10 — 68
Net change in unrealized appreciation . . . . . . . . . . . . . . . 41,910,752 44,314,303 10,656,325 4,918,058 Net realized and unrealized gain . . . . . . . . . . . . . . . . . . . . . . . . . . 43,138,326 59,333,976 35,703,929 11,756,788 Net increase in net assets resulting from operations . . . . . . . . . . $46,029,752 $58,967,459 $35,628,530 $13,223,853
* Net of foreign taxes withheld of: . . . . . . . . . . . . . . . . . . . . . . . $ 491,961 $ 6,630 $ 8,036 $ 1,617
The accompanying notes are an integral part of these financial statements.
33
M Fund, Inc.STATEMENTS OF OPERATIONS
For the Year Ended December 31, 2017

M International M Large Cap Equity Fund Growth Fund Year Ended Year Ended Year Ended Year Ended December 31, December 31, December 31, December 31, 2017 2016 2017 2016 Increase (decrease) in net assets from:Operations:
Net investment income (loss) . . . . . . . . . . . . . . . . . . . . . . . . . . $ 2,891,426 $ 3,082,084 $ (366,517) $ (426,251)Net realized gain (loss) on investments and foreign currency
transactions . . . . . . . . . . . . . . . . . . . . . . . . . . . . . . . . . . . . . . 1,227,574 (2,655,763) 15,019,673 7,094,050Net change in unrealized appreciation (depreciation) on
investments and foreign currency . . . . . . . . . . . . . . . . . . . . . 41,910,752 (814,561) 44,314,303 (10,874,480) Net increase (decrease) in net assets resulting from
operations . . . . . . . . . . . . . . . . . . . . . . . . . . . . . . . . . . 46,029,752 (388,240) 58,967,459 (4,206,681)
Distributions to shareholders:From net investment income . . . . . . . . . . . . . . . . . . . . . . . . . . . (3,779,071) (2,304,828) — —From net realized capital gains . . . . . . . . . . . . . . . . . . . . . . . . . — — (5,204,806) (9,103,954)
Total distributions to shareholders . . . . . . . . . . . . . . . . . (3,779,071) (2,304,828) (5,204,806) (9,103,954)
Fund share transactions (Note 4):Proceeds from shares sold . . . . . . . . . . . . . . . . . . . . . . . . . . . . . 33,434,491 28,164,537 18,610,328 15,056,569Net asset value of shares issued on reinvestment of
distributions . . . . . . . . . . . . . . . . . . . . . . . . . . . . . . . . . . . . . . 3,779,071 2,304,828 5,204,806 9,103,954Cost of shares repurchased . . . . . . . . . . . . . . . . . . . . . . . . . . . . (29,206,624) (61,882,072) (41,964,468) (33,708,030)
Net increase (decrease) in net assets resulting from Fund share transactions . . . . . . . . . . . . . . . . . . . . . . . 8,006,938 (31,412,707) (18,149,334) (9,547,507)
Total change in net assets . . . . . . . . . . . . . . . . . . . . . . . . . . . . . . 50,257,619 (34,105,775) 35,613,319 (22,858,142)
Net assets:Beginning of year . . . . . . . . . . . . . . . . . . . . . . . . . . . . . . . . . . . 193,909,328 228,015,103 157,765,826 180,623,968 End of year* . . . . . . . . . . . . . . . . . . . . . . . . . . . . . . . . . . . . . . . $244,166,947 $193,909,328 $193,379,145 $157,765,826
* Including undistributed (distributions in excess of) net investment income of: . . . . . . . . . . . . . . . . . . . . . . . . . . . $ (1,607,144) $ (944,107) $ — $ —
The accompanying notes are an integral part of these financial statements.
34
M Fund, Inc.STATEMENTS OF CHANGES IN NET ASSETS

M Capital M Large Cap Appreciation Fund Value Fund Year Ended Year Ended Year Ended Year Ended December 31, December 31, December 31, December 31, 2017 2016 2017 2016 Increase (decrease) in net assets from:Operations:
Net investment income (loss) . . . . . . . . . . . . . . . . . . . . . . . . . . $ (75,399) $ (632,464) $ 1,467,065 $ 1,679,940Net realized gain (loss) on investments and foreign currency
transactions . . . . . . . . . . . . . . . . . . . . . . . . . . . . . . . . . . . . . . 25,047,604 11,357,341 6,838,730 (1,623,480)Net change in unrealized appreciation (depreciation) on
investments and foreign currency . . . . . . . . . . . . . . . . . . . . . 10,656,325 23,969,664 4,918,058 8,243,752 Net increase (decrease) in net assets resulting from
operations . . . . . . . . . . . . . . . . . . . . . . . . . . . . . . . . . . 35,628,530 34,694,541 13,223,853 8,300,212
Distributions to shareholders:From net investment income . . . . . . . . . . . . . . . . . . . . . . . . . . . — — (1,391,726) (1,632,623)From net realized capital gains . . . . . . . . . . . . . . . . . . . . . . . . . (22,028,826) (7,531,257) (4,643,266) —
Total distributions to shareholders . . . . . . . . . . . . . . . . . (22,028,826) (7,531,257) (6,034,992) (1,632,623)
Fund share transactions (Note 4):Proceeds from shares sold . . . . . . . . . . . . . . . . . . . . . . . . . . . . . 18,652,559 15,135,884 9,867,851 13,595,817Net asset value of shares issued on reinvestment of
distributions . . . . . . . . . . . . . . . . . . . . . . . . . . . . . . . . . . . . . . 22,028,825 7,531,257 6,034,992 1,632,623Cost of shares repurchased . . . . . . . . . . . . . . . . . . . . . . . . . . . . (42,213,419) (34,911,468) (14,779,680) (25,877,433)
Net increase (decrease) in net assets resulting from Fund share transactions . . . . . . . . . . . . . . . . . . . . . . . (1,532,035) (12,244,327) 1,123,163 (10,648,993)
Total change in net assets . . . . . . . . . . . . . . . . . . . . . . . . . . . . . . 12,067,669 14,918,957 8,312,024 (3,981,404)
Net assets:Beginning of year . . . . . . . . . . . . . . . . . . . . . . . . . . . . . . . . . . . 197,216,551 182,297,594 91,189,085 95,170,489 End of year* . . . . . . . . . . . . . . . . . . . . . . . . . . . . . . . . . . . . . . . $209,284,220 $197,216,551 $ 99,501,109 $ 91,189,085
* Including undistributed (distributions in excess of) net investment income of: . . . . . . . . . . . . . . . . . . . . . . . . . . . $ — $ — $ 44,064 $ 28,370
The accompanying notes are an integral part of these financial statements.
35
M Fund, Inc.STATEMENTS OF CHANGES IN NET ASSETS (Continued)

M International Equity Fund Year Ended Year Ended Year Ended Year Ended Year Ended December 31, December 31, December 31, December 31, December 31, 2017 2016 2015 2014 2013 Net asset value, beginning of year . . . . . . . . . . . . . . . $ 11.12 $ 11.26 $ 11.93 $ 13.15 $ 11.57
Income from investment operations:Net investment income‡ . . . . . . . . . . . . . . . . . . . . . . 0.17 0.17 0.19 0.24 0.20Net realized and unrealized gain (loss) on
investments . . . . . . . . . . . . . . . . . . . . . . . . . . . . . . 2.50 (0.18) (0.66) (1.16) 1.68 Total from investment operations . . . . . . . . . . 2.67 (0.01) (0.47) (0.92) 1.88
Less distributions to shareholders:From net investment income . . . . . . . . . . . . . . . . . . . (0.21) (0.13) (0.20) (0.30) (0.30)
Total distributions . . . . . . . . . . . . . . . . . . . . . . (0.21) (0.13) (0.20) (0.30) (0.30) Net asset value, end of year . . . . . . . . . . . . . . . . . . . . . $ 13.58 $ 11.12 $ 11.26 $ 11.93 $ 13.15 Total Return+ . . . . . . . . . . . . . . . . . . . . . . . . . . . . . . . . 24.05% (0.05)% (3.94)% (7.06)% 16.32%
Ratios/Supplemental Data:Net assets, end of year (000’s) . . . . . . . . . . . . . . . . . $244,167 $193,909 $228,015 $217,525 $301,740Net expenses to average daily net assets . . . . . . . . . . 0.90% 0.94% 0.95% 0.93% 0.94%Net investment income to average daily net assets . . 1.33% 1.51% 1.51% 1.83% 1.65%Without the waiver/reimbursement of expenses by
the adviser, the ratios of net expenses and net investment income to average daily net assets would have been:
Expenses . . . . . . . . . . . . . . . . . . . . . . . . . . . . . . . . . . N/A 0.97% 0.96% N/A N/ANet investment income . . . . . . . . . . . . . . . . . . . . . . . N/A 1.48% 1.50% N/A N/APortfolio turnover rate . . . . . . . . . . . . . . . . . . . . . . . . 10% 20% 27% 15% 14%
‡ Calculation based on average shares outstanding.
+ Does not reflect additional fees charged by separate accounts or variable insurance contracts that an investor in the Fund may pay. If
these additional fees were reflected, performance would have been lower.
The accompanying notes are an integral part of these financial statements.
36
M Fund, Inc.FINANCIAL HIGHLIGHTS
(FOR A SHARE OUTSTANDING THROUGHOUT EACH YEAR)

M Large Cap Growth Fund Year Ended Year Ended Year Ended Year Ended Year Ended December 31, December 31, December 31, December 31, December 31, 2017 2016 2015 2014 2013 Net asset value, beginning of year . . . . . . . . . . . . . . . $ 19.97 $ 21.66 $ 23.95 $ 24.74 $ 19.20
Income from investment operations:Net investment income (loss)‡ . . . . . . . . . . . . . . . . . (0.05) (0.05) (0.05) 0.02 0.05Net realized and unrealized gain (loss) on
investments . . . . . . . . . . . . . . . . . . . . . . . . . . . . . . 7.83 (0.45) 1.96 2.45 6.86 Total from investment operations . . . . . . . . . . 7.78 (0.50) 1.91 2.47 6.91
Less distributions to shareholders:From net investment income . . . . . . . . . . . . . . . . . . . — — (0.01) (0.01) (0.12)From net realized capital gains . . . . . . . . . . . . . . . . . (0.74) (1.19) (4.19) (3.25) (1.25)
Total distributions . . . . . . . . . . . . . . . . . . . . . . (0.74) (1.19) (4.20) (3.26) (1.37) Net asset value, end of year . . . . . . . . . . . . . . . . . . . . . $ 27.01 $ 19.97 $ 21.66 $ 23.95 $ 24.74 Total Return+ . . . . . . . . . . . . . . . . . . . . . . . . . . . . . . . . 38.97% (2.32)% 7.70% 10.21% 36.15%
Ratios/Supplemental Data:Net assets, end of year (000’s) . . . . . . . . . . . . . . . . . $193,379 $157,766 $180,624 $177,904 $183,264Net expenses to average daily net assets . . . . . . . . . . 0.73% 0.78% 0.76% 0.75% 0.77%Net investment income (loss) to average daily net
assets . . . . . . . . . . . . . . . . . . . . . . . . . . . . . . . . . . (0.20)% (0.26)% (0.20)% 0.07% 0.25%Portfolio turnover rate . . . . . . . . . . . . . . . . . . . . . . . . 49% 36% 69% 46% 74%
‡ Calculation based on average shares outstanding.
+ Does not reflect additional fees charged by separate accounts or variable insurance contracts that an investor in the Fund may pay. If
these additional fees were reflected, performance would have been lower.
The accompanying notes are an integral part of these financial statements.
37
M Fund, Inc.FINANCIAL HIGHLIGHTS
(FOR A SHARE OUTSTANDING THROUGHOUT EACH YEAR)

M Capital Appreciation Fund Year Ended Year Ended Year Ended Year Ended Year Ended December 31, December 31, December 31, December 31, December 31, 2017 2016 2015 2014 2013 Net asset value, beginning of year . . . . . . . . . . . . . . . $ 29.28 $ 25.15 $ 30.22 $ 29.71 $ 23.38
Income from investment operations:Net investment loss‡ . . . . . . . . . . . . . . . . . . . . . . . . . (0.01) (0.09) (0.10) (0.11) (0.06)Net realized and unrealized gain (loss) on
investments . . . . . . . . . . . . . . . . . . . . . . . . . . . . . . 5.55 5.38 (1.77) 3.81 9.13 Total from investment operations . . . . . . . . . . 5.54 5.29 (1.87) 3.70 9.07
Less distributions to shareholders:From net realized capital gains . . . . . . . . . . . . . . . . . (3.58) (1.16) (3.20) (3.19) (2.74)
Total distributions . . . . . . . . . . . . . . . . . . . . . . (3.58) (1.16) (3.20) (3.19) (2.74) Net asset value, end of year . . . . . . . . . . . . . . . . . . . . . $ 31.24 $ 29.28 $ 25.15 $ 30.22 $ 29.71 Total Return+ . . . . . . . . . . . . . . . . . . . . . . . . . . . . . . . . 19.02% 21.06% (6.58)% 12.42% 39.20%
Ratios/Supplemental Data:Net assets, end of year (000’s) . . . . . . . . . . . . . . . . . $209,284 $197,217 $182,298 $180,980 $187,107Net expenses to average daily net assets . . . . . . . . . . 1.05% 1.08% 1.07% 1.07% 1.07%Net investment loss to average daily net assets . . . . (0.04)% (0.35)% (0.34)% (0.34)% (0.23)%Portfolio turnover rate . . . . . . . . . . . . . . . . . . . . . . . . 20% 19% 23% 17% 18%
‡ Calculation based on average shares outstanding.
+ Does not reflect additional fees charged by separate accounts or variable insurance contracts that an investor in the Fund may pay. If
these additional fees were reflected, performance would have been lower.
The accompanying notes are an integral part of these financial statements.
38
M Fund, Inc.FINANCIAL HIGHLIGHTS
(FOR A SHARE OUTSTANDING THROUGHOUT EACH YEAR)

M Large Cap Value Fund Year Ended Year Ended Year Ended Year Ended Year Ended December 31, December 31, December 31, December 31, December 31, 2017 2016 2015 2014 2013 Net asset value, beginning of year . . . . . . . . . . . . . . . . $ 12.89 $ 11.96 $ 13.36 $ 13.77 $ 11.44
Income from investment operations:Net investment income‡ . . . . . . . . . . . . . . . . . . . . . . 0.21 0.22 0.18 0.15 0.20Net realized and unrealized gain (loss) on
investments . . . . . . . . . . . . . . . . . . . . . . . . . . . . . . 1.73 0.94 (0.24) 1.20 3.68 Total from investment operations . . . . . . . . . . 1.94 1.16 (0.06) 1.35 3.88
Less distributions to shareholders:From net investment income . . . . . . . . . . . . . . . . . . . (0.21) (0.23) (0.17) (0.17) (0.37)From return of capital . . . . . . . . . . . . . . . . . . . . . . . . — — (0.01) — —From net realized capital gains . . . . . . . . . . . . . . . . . (0.69) — (1.16) (1.59) (1.18)
Total distributions . . . . . . . . . . . . . . . . . . . . . . (0.90) (0.23) (1.34) (1.76) (1.55) Net asset value, end of year . . . . . . . . . . . . . . . . . . . . . $ 13.93 $ 12.89 $ 11.96 $ 13.36 $ 13.77 Total Return+ . . . . . . . . . . . . . . . . . . . . . . . . . . . . . . . . 14.99% 9.73%* (0.66)% 9.68% 34.22%
Ratios/Supplemental Data:Net assets, end of year (000’s) . . . . . . . . . . . . . . . . . . $99,501 $91,189 $95,170 $83,035 $93,033Net expenses to average daily net assets . . . . . . . . . . 0.64% 0.68% 0.69% 0.68% 0.61%Net investment income to average daily net assets . . 1.57% 1.85% 1.32% 1.05% 1.52%Without the waiver/reimbursement of expenses by
the adviser, the ratios of net expenses and net investment income to average daily net assets would have been:
Expenses . . . . . . . . . . . . . . . . . . . . . . . . . . . . . . . . . . 0.64% 0.68% N/A N/A 0.78%Net investment income . . . . . . . . . . . . . . . . . . . . . . . 1.56% 1.85% N/A N/A 1.35%Portfolio turnover rate . . . . . . . . . . . . . . . . . . . . . . . . 75% 54% 66% 80% 154%¤
‡ Calculation based on average shares outstanding.
+ Does not reflect additional fees charged by separate accounts or variable insurance contracts that an investor in the Fund may pay. If
these additional fees were reflected, performance would have been lower.
* Includes adjustments in accordance with accounting principles generally accepted in the United States and consequently, the net asset
value for financial reporting purposes and the returns based upon those net asset values may differ from the net asset values and returns
for shareholder processing.
¤ The increase in portfolio turnover rate during the period was primarily attributable to portfolio adjustments made in response to a change
in the Fund’s sub-adviser.
The accompanying notes are an integral part of these financial statements.
39
M Fund, Inc.FINANCIAL HIGHLIGHTS
(FOR A SHARE OUTSTANDING THROUGHOUT EACH YEAR)

M Fund, Inc. (the “Corporation”) was incorporated in Maryland on August 11, 1995 and is registered under theInvestment Company Act of 1940, as amended (the “1940 Act”), as an open-end management investment company.As of December 31, 2017, the Corporation consisted of four separate diversified investment portfolios:M International Equity Fund, M Large Cap Growth Fund, M Capital Appreciation Fund and M Large Cap ValueFund (each singularly a “Fund” or collectively the “Funds”), each of which is a separate mutual fund.
The Corporation offers shares of the Funds to certain insurance company separate accounts, which serve as theunderlying funding vehicles for certain variable annuity and variable life insurance policies. These annuities andinsurance policies are offered primarily by members of M Financial Holdings Incorporated (“M Financial Group”)and are issued by certain life insurance companies.
M International Equity Fund
M International Equity Fund will normally invest at least 80% of its total assets in equity securities of issuerslocated in at least three countries other than the United States. These countries may include, but are not limited to,the nations of Western Europe, North and South America, Australia, Africa and Asia. This strategy is not fundamental(it may be changed without shareholder approval), but should the Fund decide to change this strategy, it will provideshareholders with at least 60 days’ notice. Securities will generally be purchased in the form of common stock,preferred stock, securities that are convertible into common stock, American Depositary Receipts (ADRs), EuropeanDepositary Receipts (EDRs), International Depositary Receipts (IDRs) or Global Depositary Receipts (GDRs).The Fund focuses on stocks with capitalizations of $1 billion or more. The Fund also may invest in emerging marketsecurities. The Fund’s sub-adviser, Northern Cross, LLC’s (“Northern Cross”) investment philosophy is to buyundervalued quality companies with improving margins and aim to hold them for five to seven years.
M Large Cap Growth Fund
M Large Cap Growth Fund will normally invest at least 80% of its total assets in large-cap equity securities,including common stocks, preferred stocks and American Depositary Receipts. The Fund may invest up to 20% ofits assets in equity securities of foreign issuers. DSM Capital Partners LLC (“DSM”), the Fund’s sub-adviser defines“large-cap” as capitalizations of $10 billion or more. This strategy is not fundamental (it may be changed withoutshareholder approval), but should the Fund decide to change this strategy, it will provide shareholders with at least60 days’ notice. DSM uses a “bottom-up,” idea-driven approach and focuses on a long-term (e.g., three-yearminimum) investment horizon. DSM seeks to invest in growing businesses with solid fundamentals, attractiveprofitability and successful management. Candidate companies will typically have projected revenue and earningsgrowth in excess of 10% and will often have higher returns on equity and assets than average S&P 500 companies.Generally, these businesses will be generating free cash flow and will have financial returns that are stable or rising,driven by improving business fundamental all as determined by DSM.
M Capital Appreciation Fund
M Capital Appreciation Fund invests in common stock of U.S. companies of all sizes, with emphasis on stocks ofcompanies with capitalizations that are consistent with the capitalizations of those companies found in the Russell2500 Index. The Fund’s sub-adviser, Frontier Capital Management Company, LLC (“Frontier”) seeks to invest incompanies with unrecognized earnings potential. Earnings per share, growth and price appreciation are important
40
M Fund, Inc.NOTES TO FINANCIAL STATEMENTS
factors. Wall Street analysts do not usually widely follow small to mid-sized companies like those in which theFund invests and institutional investors usually do not own a large percentage of them. The cornerstone of Frontier’sinvestment process is internally generated fundamental research. Stocks are sold if earnings growth potential isrealized, when the fundamental reasons for purchase are no longer valid, or when a more attractive situation isidentified.
M Large Cap Value Fund
M Large Cap Value Fund will normally invest at least 80% of its total assets in the large-capitalization segment ofthe U.S. stock market, including equity securities of U.S. issuers. AJO, LP (“AJO”), the Fund’s sub-adviser, defines“large-capitalization” as capitalizations of $5 billion or more. This strategy is not fundamental (it may be changedwithout shareholder approval), but should the Fund decide to change this strategy, it will provide shareholders withat least 60 days’ notice. AJO uses a systematic, disciplined, quantitative investment process. AJO is value-oriented,but believes superior results are best achieved by combining value, management, momentum and sentiment. AJOfocuses on well-managed companies with quality cash profits, relatively low market valuations, positive price andearnings momentum and favorable investor sentiment. It optimizes portfolios to diversify multi-faceted risk. TheFund is fully invested, sector-neutral and well diversified in terms of industry, fundamental characteristics andvarious statistical measures of risk. AJO seeks to minimize implementation shortfall, defined as the differencebetween valuation price and execution price, including commissions, spreads, market impact and opportunity cost.
1. Significant Accounting Policies
The following is a summary of significant accounting policies for the Funds. Such policies are in conformity withaccounting principles generally accepted in the United States of America (“GAAP”) for investment companies andare consistently followed by the Funds in the preparation of the financial statements.
Use of Estimates
Each Fund is an investment company and accordingly follows the investment company accounting and reportingguidance of the Financial Accounting Standards Board (“FASB”) Accounting Standard Codification Topic 946Financial Services—Investment Companies. The preparation of financial statements in accordance with GAAPrequires management to make estimates and assumptions that affect the reported amounts of assets and liabilitiesand disclosure of contingent assets and liabilities at the date of the financial statements and the reported amountsof increases and decreases in net assets from operations during the reporting period. Actual results could differfrom those estimates.
Portfolio Valuation
Equity securities and other similar investments traded on a recognized U.S. securities exchange are valued at thelast sale price on the exchange on which the securities are traded. If no sale occurs, equity securities and othersimilar investments traded on a U.S. exchange are valued at the most recent bid price. Equity securities and othersimilar investments traded on the National Association of Securities Dealers Automated Quotation System(“NASDAQ”) are valued at the NASDAQ Official Closing Price. If no sale occurs, equity securities and othersimilar investments traded on NASDAQ are valued at the most recent bid price. Equity securities and other similar
41
M Fund, Inc.NOTES TO FINANCIAL STATEMENTS (Continued)

investments traded on a non-U.S. exchange are generally valued according to the latest closing values on thatexchange prior to the close of the New York Stock Exchange. However, if an event which may change the value ofa security occurs after the time that the closing value on the non-U.S. exchange was determined, the Board ofDirectors may decide to value the security based on fair value. The Board of Directors has approved the use of anindependent fair value service for foreign securities, which may provide a fair value price on trading days when theS&P 500 Index moves more than 1%. The use of a fair value price may cause the value of the security on the booksof the Fund to be significantly different from the closing value on the non-U.S. exchange and may affect thecalculation of the Fund’s NAV. Over-the-counter securities not quoted on NASDAQ are valued at the last sale priceon the valuation date or, if no sale occurs, at the most recent bid price. Short-term obligations maturing in sixtydays or less are valued at amortized cost, which approximates market value. Amortized cost valuation involvesinitially valuing a security at its cost, and thereafter, assuming a constant accretion or amortization to maturity ofany discount or premium, regardless of the impact of fluctuating interest rates on the market value of the security.Securities for which a pricing service supplies no quotations or quotations are not deemed to be representative ofmarket value or for which there are no readily available market quotations are valued at fair value as determined ingood faith by the Pricing Committee appointed by the Board of Directors (excluding debt securities with a remainingmaturity of sixty days or less).
Fair value is defined as the price that the Funds would receive upon selling an investment in a timely transaction toan independent buyer in the principal or most advantageous market for the investment. A three-tier hierarchy isutilized to maximize the use of observable data inputs and minimize the use of unobservable data inputs and toestablish classification of fair value measurements for disclosure purposes. Inputs refer broadly to the assumptionsthat market participants would use to price the asset or liability, including assumptions about risk. Observable inputsare inputs that reflect the assumptions market participants would use to price the asset or liability based on marketdata obtained from sources independent of the reporting entity. Unobservable inputs are inputs that reflect thereporting entity’s own assumptions about the assumptions market participants would use to price the asset or liabilitybased on the best information available in the circumstances. The three-tier hierarchy of inputs is summarized inthe three broad Levels listed below.
• Level 1—quoted prices in active markets for identical investments;
• Level 2—quoted prices in markets that are not active or other significant observable inputs (includingquoted prices for similar investments, interest rates, prepayment speeds, credit risk, etc.); and
• Level 3—significant unobservable inputs (including the Fund’s own assumptions used to determine thefair value of investments).
The valuation techniques used by the Funds to measure fair value during the year ended December 31, 2017maximized the use of observable inputs and minimized the use of unobservable inputs.
The availability of observable inputs can vary from security to security and is affected by a wide variety of factors,including, for example, the type of security, whether the security is new and not yet established in the marketplace,the liquidity of markets, and other characteristics particular to the security. To the extent that valuation is based onmodels or inputs that are less observable or unobservable in the market, the determination of fair value requiresmore judgment. Accordingly, the degree of judgment exercised in determining fair value is greatest for instrumentscategorized in Level 3.
42
M Fund, Inc.NOTES TO FINANCIAL STATEMENTS (Continued)
1. Significant Accounting Policies (Continued)

The inputs used to measure fair value may fall into different levels of the fair value hierarchy. In such cases, fordisclosure purposes, the level in the fair value hierarchy within which the fair value measurement falls in its entiretyis determined based on the lowest level input that is significant to the fair value measurement in its entirety.
As of December 31, 2017, the M Large Cap Growth Fund, the M Capital Appreciation Fund and the M Large CapValue Fund had (i) all long-term investments classified as Level 1, as represented on the Schedule of Investments;and (ii) all short-term investments classified as Level 2.
The following is a summary of the inputs used as of December 31, 2017 in valuing the M International Equity Fundinvestments:
Assets Valuation Input
Quoted Prices in Active Significant Markets for Other Significant Identical Observable Unobservable Assets Inputs Inputs Description (Level 1) (Level 2) (Level 3) Total
Common StocksAustria . . . . . . . . . . . . . . . . . . . . . . . . . . . . . . . $ 1,535,651 $ — $ — $ 1,535,651Belgium . . . . . . . . . . . . . . . . . . . . . . . . . . . . . . 4,357,490 — — 4,357,490Brazil . . . . . . . . . . . . . . . . . . . . . . . . . . . . . . . . 616,291 — — 616,291Canada . . . . . . . . . . . . . . . . . . . . . . . . . . . . . . . 676,212 — — 676,212China . . . . . . . . . . . . . . . . . . . . . . . . . . . . . . . . . 7,085,838 — — 7,085,838Colombia . . . . . . . . . . . . . . . . . . . . . . . . . . . . . 7,544,964 — — 7,544,964Denmark . . . . . . . . . . . . . . . . . . . . . . . . . . . . . . 4,650,071 — — 4,650,071France . . . . . . . . . . . . . . . . . . . . . . . . . . . . . . . . 41,462,617 — — 41,462,617Germany . . . . . . . . . . . . . . . . . . . . . . . . . . . . . . 23,549,637 — — 23,549,637Israel . . . . . . . . . . . . . . . . . . . . . . . . . . . . . . . . . 2,118,894 — — 2,118,894Italy . . . . . . . . . . . . . . . . . . . . . . . . . . . . . . . . . . 2,400,371 — — 2,400,371Japan . . . . . . . . . . . . . . . . . . . . . . . . . . . . . . . . . 24,241,943 — — 24,241,943Jersey . . . . . . . . . . . . . . . . . . . . . . . . . . . . . . . . 4,842,604 — — 4,842,604Macau . . . . . . . . . . . . . . . . . . . . . . . . . . . . . . . . 171,937 — — 171,937Mexico . . . . . . . . . . . . . . . . . . . . . . . . . . . . . . . 2,513,289 — — 2,513,289Netherlands . . . . . . . . . . . . . . . . . . . . . . . . . . . . 10,550,737 — — 10,550,737Norway . . . . . . . . . . . . . . . . . . . . . . . . . . . . . . . 1,231,496 — — 1,231,496Spain . . . . . . . . . . . . . . . . . . . . . . . . . . . . . . . . . 4,028,823 — — 4,028,823Sweden . . . . . . . . . . . . . . . . . . . . . . . . . . . . . . . 8,695,149 — — 8,695,149Switzerland . . . . . . . . . . . . . . . . . . . . . . . . . . . . 20,018,802 — — 20,018,802United Kingdom . . . . . . . . . . . . . . . . . . . . . . . . 24,990,732 — 25,424 25,016,156United States . . . . . . . . . . . . . . . . . . . . . . . . . . . 30,804,484 — — 30,804,484
Total Common Stocks . . . . . . . . . . . . . . . . . . . . . 228,088,032 — 25,424 228,113,456
43
M Fund, Inc.NOTES TO FINANCIAL STATEMENTS (Continued)
1. Significant Accounting Policies (Continued)

Quoted Prices in Active Significant Markets for Other Significant Identical Observable Unobservable Assets Inputs Inputs Description (Level 1) (Level 2) (Level 3) Total
WarrantMalaysia . . . . . . . . . . . . . . . . . . . . . . . . . . . . . . $ 78,595 $ — $ — $ 78,595
Preferred StockColombia . . . . . . . . . . . . . . . . . . . . . . . . . . . . . 703,306 — — 703,306
Short-Term InvestmentsShort-Term Investments . . . . . . . . . . . . . . . . . . — 14,628,177 — 14,628,177Investments in Security Lending Collateral . . . — 2,302,217 — 2,302,217
Total Short-Term Investments . . . . . . . . . . . . . . . — 16,930,394 — 16,930,394
Total . . . . . . . . . . . . . . . . . . . . . . . . . . . . . . . . . . . $228,869,933 $16,930,394 $25,424 $245,825,751
The following is a reconciliation of investments in securities for which significant unobservable inputs (Level 3)were used in determining value for the M International Equity Fund:
Net Change in Unrealized Appreciation (Depreciation) from Investments still held as of
Change 12/31/17Balance in Balance for the
as of Realized Unrealized Transfers Transfers as of period December 31, Gain Appreciation in to out of Demcember 31, ended
Investments in Securities 2016 (Loss) (Depreciation) Purchases Sales Level 3 Level 3 2017 12/31/17 Common Stocks . . . $— $— $473 $24,951 $— $— $— $25,424 $473 Total . . . . . . . . . . . . $— $— $473 $24,951 $— $— $— $25,424 $473
The Funds did not have significant transfers in and out among Levels 1, 2, or 3 of the fair value hierarchy duringthe year ended December 31, 2017.
Securities Transactions, Investment Income and Expenses
Securities transactions are recorded as of the trade date. Realized gains or losses from securities sold are recordedon the identified cost basis. Interest income is recorded on the accrual basis and consists of interest accrued and, ifapplicable, discount earned less premiums amortized. Dividend income is recorded on the ex-dividend date, exceptthat certain dividends from foreign securities are recorded as soon as the Fund is informed of the ex-dividend date.Investment income is recorded net of foreign taxes withheld where the recovery of such taxes is uncertain. Non-cash dividends included in dividend income, if any, are recorded at the fair market value of the securities received.
44
M Fund, Inc.NOTES TO FINANCIAL STATEMENTS (Continued)
1. Significant Accounting Policies (Continued)

Most expenses of the Corporation can be directly attributed to a Fund. Expenses that cannot be directly attributedare apportioned among Funds by the Corporation based on average net assets of each Fund.
Dividends and Distributions to Shareholders
Each Fund declares and pays dividends from net investment income, if any, and distributes net short-term capitalgains, if any, on an annual basis. Each Fund also distributes, at least annually, substantially all of the long-termcapital gains in excess of available capital losses, if any, which it realizes for each taxable year. Distributions arerecorded on the ex-dividend date. Income distributions and capital gain distributions are determined in accordancewith income tax regulations, which may differ from GAAP. These differences are primarily due to differing treatmentsof income and gains on various investment securities held by each Fund and timing differences, including thedeferral of wash sales and the deferral of net realized capital losses recognized subsequent to October. Permanentdifferences relating to shareholder distributions will result in differing characterizations of distributions made byeach Fund and reclassifications to paid-in capital.
Securities Lending
The Funds participate in a securities lending program under the terms of a Securities Lending Agency Agreementwith State Street Bank and Trust Company, which serves as the Funds’ securities lending agent. Each Fund mayloan its portfolio securities in an amount up to 33 1/3 of its total assets. The Funds receive cash (U.S. currency) ascollateral against the loaned securities. Such collateral is invested by the securities lending agent in a money marketmutual fund that meets the quality and diversification requirements in accordance with Rule 2a-7 under the 1940 Act.All collateral received will be in an amount at least equal to 102% (for loans of U.S. securities) or 105% (for loansof non-U.S. securities) of the market value of the loaned securities at the inception of each loan. The market valueof the loaned securities is determined each day at the close of business of the Funds and any change in the amountof collateral is delivered to or paid by the Fund the next day. The collateral value does not include the calculatedmark, which is the amount charged/returned to the borrower daily to maintain 102%/105% of market value. Thereis a day lag in receiving the mark, which may at times result in a collateral percentage above or below 102%/105%.
The collateral received is recorded on a lending Fund’s statement of assets and liabilities, along with the relatedobligation to return the collateral. A Fund may also record realized gain or loss on securities deemed sold due to aborrower’s inability to return securities on loan. Upon an event of default under the Securities Agency LendingAgreement, there is a risk of delay in the recovery of the securities or loss of rights in the collateral. If the borrowerfails to return loaned securities and cash collateral is insufficient to cover the value of loaned securities (providedthat the insufficiency is not due to investment losses), the securities lending agent has agreed, at its option, to paythe amount of any shortfall in collateral to the Funds; or to replace the securities. Any dividends or interest payableby the issuers of the loaned portfolio securities, during the time that the securities are on loan, are paid to theborrowers of those securities. Dividend or interest payments that are made to borrowers of the loaned securities arereimbursed by the borrowers to the Funds. Such reimbursement amounts do not comprise qualified dividend incomeunder the Internal Revenue Code of 1986, as amended.
45
M Fund, Inc.NOTES TO FINANCIAL STATEMENTS (Continued)
1. Significant Accounting Policies (Continued)

Income generated from the investment of cash collateral, less negotiated rebate fees paid to the borrower throughthe securities lending agent, is the source of the Fund’s securities lending income, 70% of which is paid to the Fund,30% of which is paid to the custodian as securities lending agent.
The following table presents financial instruments that are subject to enforceable netting arrangements as ofDecember 31, 2017.
Net Amounts Gross Amount Not Offset
Gross of Assets
in the Statement
Amounts Presented of Assets and Liabilities
Gross Offset in the in the
Amounts of Statement Statement CashRecognized Assets Assets Financial Collateral Net
Fund Assets and Liabilities and Liabilities Instruments Received Amount
M International Equity Fund . . . . . . . . . . . . . . . . $ 2,302,217 $— $ 2,302,217 $— $ 2,302,217 $—
M Large Cap Growth Fund . . . . . . . . . . . . . . . . $ — $— $ — $— $ — $—
M Capital Appreciation Fund . . . . . . . . . . . . . . . . $23,114,401 $— $23,114,401 $— $23,114,401 $—
M Large Cap Value Fund . . . . . . . . . . . . . . . . $ 1,851,917 $— $ 1,851,917 $— $ 1,851,917 $—
The following table presents the remaining contractual maturity of the Securities Lending Agency Agreement as ofDecember 31, 2017.
Greater Overnight and Up to 30 31-90 Than 90
Fund Security Type Continuous days days days Total
M International Equity Fund . . . . . . . . . . . . . . . . Common Stocks $ 2,302,217 $— $— $— $ 2,302,217
M Capital Appreciation Fund . . . . . . . . . . . . . . . . Common Stocks $23,114,401 $— $— $— $23,114,401
M Large Cap Value Fund . . . . . . . . . . . . . . . . Common Stocks $ 1,851,917 $— $— $— $ 1,851,917
Federal Income Taxes
Each Fund intends to continue to qualify as a regulated investment company by complying with the requirementsunder Subchapter M of the Internal Revenue Code of 1986, as amended, applicable to regulated investmentcompanies and by distributing substantially all of its earnings to its shareholders. Therefore, no provision for federalincome or excise tax is necessary.
46
M Fund, Inc.NOTES TO FINANCIAL STATEMENTS (Continued)
1. Significant Accounting Policies (Continued)
The Funds did not have any unrecognized tax benefits as of December 31, 2017, nor were there any increases ordecreases in unrecognized tax benefits for the year then ended. The Funds recognize interest and penalties, if any,related to unrecognized tax benefits as an income tax expense in the Statements of Operations. During the yearended December 31, 2017, the Funds did not incur any such interest or penalties. The Funds’ tax returns are subjectto examination by U.S. federal and state tax authorities for returns filed for the prior three fiscal years,December 2014 through December 2016. No examination of any of the Funds’ tax filings is currently in progress.
2. Advisory Fee and Other Transactions with Affiliates
The Corporation has entered into an investment advisory agreement (the “Advisory Agreement”) with M FinancialInvestment Advisers, Inc. (the “Adviser”), a wholly-owned subsidiary of M Financial Group. The AdvisoryAgreement provides that the Funds will pay the Adviser a fee at an annual rate of the value of each Fund’s averagedaily net assets as follows:
Fund Total Advisory Fees
M International Equity Fund . . . . . . . . . . . . . 0.70% on the first $1 billion 0.65% on the amounts above $1 billionM Large Cap Growth Fund . . . . . . . . . . . . . . 0.65% of the first $50 million 0.60% of the next $50 million 0.55% on the amounts above $100 millionM Capital Appreciation Fund . . . . . . . . . . . . 0.90%M Large Cap Value Fund* . . . . . . . . . . . . . . . 0.45% of the first $250 million 0.35% of the next $250 million 0.30% of the next $250 million 0.275% on the amounts thereafter
* On October 1, 2016, the Sub-Adviser for the Fund waived 5% of its sub-advisory fee. Consequently,the Adviser waived a portion of the fee payable by the Fund. For the year ended December 31, 2017,the fee payable to the Adviser for the Fund was 0.435% on the first $250 million, 0.34% on the next$250 million, 0.2925% on the next $250 million and 0.2688% thereafter on the Fund’s average dailynet assets. For the year ended December 31, 2017, the Adviser waived $14,001 otherwise payable bythe M Large Cap Value Fund.
Prior to May 1, 2017 and for the period May 1, 2017 to April 30, 2018, the Adviser has contractually agreed toreimburse each Fund for any expenses (other than advisory fees, brokerage or other portfolio transaction expensesor expenses for litigation, indemnification, taxes or other extraordinary expenses) to the extent that such expensesexceed 0.25% of a Fund’s annualized average daily net assets. For the year ended December 31, 2017, there wereno such reimbursements.
The Adviser has engaged Northern Cross, LLC, DSM Capital Partners LLC, Frontier Capital Management Company,LLC and AJO, LP to act as sub-advisers to provide day-to-day portfolio management for the M International EquityFund, the M Large Cap Growth Fund, the M Capital Appreciation Fund and the M Large Cap Value Fund,respectively.
47
M Fund, Inc.NOTES TO FINANCIAL STATEMENTS (Continued)
1. Significant Accounting Policies (Continued)

As compensation for their services, each sub-adviser receives a fee based on the average daily net assets of theapplicable Fund at the following annual rates:
Fund Total Sub-Advisory Fees
M International Equity Fund . . . . . . . . . . . . . 0.55% on the first $1 billion 0.50% on the amounts above $1 billionM Large Cap Growth Fund . . . . . . . . . . . . . . 0.50% on the first $50 million 0.45% on the next $50 million 0.40% on the amounts above $100 millionM Capital Appreciation Fund . . . . . . . . . . . . 0.75%M Large Cap Value Fund* . . . . . . . . . . . . . . . 0.30% on the first $250 million 0.20% on the next $250 million 0.15% on the next $250 million 0.125% on the amounts thereafter
* On October 1, 2016, the Sub-Adviser waived 5% of its sub-advisory fee. For the year endedDecember 31, 2017, the fee payable to the Sub-Adviser for the Fund was 0.285% on the first$250 million, 0.19% on the next $250 million, 0.1425% on the next $250 million and 0.1188%thereafter on the Fund’s average daily net assets.
The sub-advisory fees are paid by the Adviser out of the investment advisory fees disclosed above.
M Holdings Securities, Inc. acts as distributor (the “Distributor”) for each of the Funds. The Distributor is a wholly-owned subsidiary of M Financial Group. No fees are charged the Distributor for its services.
The Corporation pays no compensation to its officers, other than the Chief Compliance Officer (“CCO”). TheCorporation pays each Director $1,500 per meeting attended. The Corporation pays each non-interested Director anannual retainer of $20,000. Each member of the Audit Committee receives $1,500 per meeting of the Audit Committeethat he attends. The Chairman of the Board and Audit Committee Chair receive an additional $10,000 annually. CCOcompensation is paid to M Financial Group pursuant to an employee leasing agreement between the Corporation andM Financial Group and is included under compliance expenses on the Funds’ Statements of Operations.
3. Purchases and Sales of Securities
Cost of purchases and proceeds from sales of investment securities, excluding short-term investments, for the yearended December 31, 2017, were as follows:
Non-U.S. Government Securities Purchases Sales
M International Equity Fund . . . . . . . . . . . . . . . . . . . . . . . . . . . $25,272,898 $ 21,223,608M Large Cap Growth Fund . . . . . . . . . . . . . . . . . . . . . . . . . . . . 88,740,350 112,827,029M Capital Appreciation Fund . . . . . . . . . . . . . . . . . . . . . . . . . . 40,165,737 56,648,761M Large Cap Value Fund . . . . . . . . . . . . . . . . . . . . . . . . . . . . . . 69,400,830 73,179,100
48
M Fund, Inc.NOTES TO FINANCIAL STATEMENTS (Continued)
2. Advisory Fee and Other Transactions with Affiliates (Continued)
Changes in the capital shares outstanding were as follows:
M International Equity Fund M Large Cap Growth Fund Year Ended Year Ended Year Ended Year Ended December 31, December 31, December 31, December 31, 2017 2016 2017 2016
Shares sold . . . . . . . . . . . . . . . . 2,576,981 2,521,832 755,122 728,919Shares repurchased . . . . . . . . . . (2,318,859) (5,544,590) (1,689,858) (1,617,360)Distributions reinvested . . . . . . 278,912 208,017 192,384 451,205 Net increase (decrease) . . . . . . 537,034 (2,814,741) (742,352) (437,236)Fund Shares:
Beginning of year . . . . . . . . . 17,442,712 20,257,453 7,901,061 8,338,297 End of year . . . . . . . . . . . . . . 17,979,746 17,442,712 7,158,709 7,901,061
M Capital Appreciation Fund M Large Cap Value Fund Year Ended Year Ended Year Ended Year Ended December 31, December 31, December 31, December 31, 2017 2016 2017 2016
Shares sold . . . . . . . . . . . . . . . . 585,377 556,464 738,308 1,155,259Shares repurchased . . . . . . . . . . (1,323,145) (1,328,173) (1,098,551) (2,165,923)Distributions reinvested . . . . . . 700,269 258,551 430,456 126,266 Net increase (decrease) . . . . . . (37,499) (513,158) 70,213 (884,398)Fund Shares:
Beginning of year . . . . . . . . . 6,736,270 7,249,428 7,073,694 7,958,092 End of year . . . . . . . . . . . . . . 6,698,771 6,736,270 7,143,907 7,073,694
5. Financial Instruments
Foreign Investments and Foreign Currency
Each of the Funds may invest in securities of companies that are organized under the laws of a foreign country and(i) are unlisted or listed primarily on a non-U.S. exchange; or (ii) are listed on a U.S. exchange or over-the-counteras a sponsored or unsponsored American Depositary Receipt (“foreign issuers”). M International Equity Fund mayalso invest in non-U.S. dollar denominated securities and securities of foreign issuers represented by EuropeanDepositary Receipts (“EDRs”), International Depositary Receipts (“IDRs”) and Global Depositary Receipts(“GDRs”). The value of all assets and liabilities expressed in foreign currencies are translated into U.S. dollars atthe exchange rates captured as of twelve noon Eastern Time each business day other than market holidays or earlyclosures. Purchases and sales of investment securities, income receipts and expense payments are translated intoU.S. dollars at the prevailing exchange rate on the respective dates of such transactions. Net realized foreign currencygains and losses result from changes in exchange rates, including foreign currency gains and losses between tradedate and settlement date on investment securities transactions, foreign currency transactions and the difference
49
M Fund, Inc.NOTES TO FINANCIAL STATEMENTS (Continued)
4. Paid-in Capital

between the amounts of interest and dividends recorded on the books of the Funds and the amount actually received.The portion of foreign currency gains and losses related to fluctuation in exchange rates between the initial tradedate and subsequent sale trade date is included in realized gains and losses on investment transactions.M International Equity Fund does not isolate that portion of the results for changes in foreign currency exchangerates from the fluctuations arising from changes in market prices of securities held at year end.
Investments in non-U.S. dollar denominated securities or in the securities of foreign issuers may be affected bychanges in currency rates, changes in foreign or U.S. laws or restrictions applicable to such investments and inexchange control regulations (e.g., currency blockage). Some foreign stock markets may have substantially lessvolume than, for example, the New York Stock Exchange, and securities of some foreign issuers may be less liquidthan securities of comparable domestic issuers. Commissions and dealer mark-ups on transactions in foreigninvestments may be higher than for similar transactions in the United States. In addition, clearance and settlementprocedures for such securities may be different in foreign countries and, in certain markets, on certain occasionssuch procedures have been unable to keep pace with the volume of securities transactions.
Foreign issuers are not generally subject to uniform accounting, auditing and financial reporting standardscomparable to those applicable to domestic companies. There may be less publicly available information about aforeign issuer than about a domestic one. In addition, there is generally less government regulation of stockexchanges, brokers, and listed and unlisted issuers in foreign countries than in the United States. Furthermore, withrespect to certain foreign countries, there is a possibility of expropriation or confiscatory taxation, imposition ofwithholding taxes on dividend or interest payments, limitations on the removal of funds or other assets of the Funds,or political or social instability or diplomatic developments which could affect investments in those countries.Individual foreign economies also may differ favorably or unfavorably from the United States economy in suchrespects as growth of gross national product, rate of inflation, capital reinvestment and resource self-sufficiency.
Because investment in foreign issuers will usually involve currencies of foreign countries, and because the Fundsmay be exposed to currency exposure independent of their securities positions, the value of the assets of the Fundsinvested in foreign issuers as measured in U.S. dollars will be affected by changes in foreign currency exchangerates. To the extent that a Fund’s assets consist of investments denominated in a particular currency, the Fund is atrisk of adverse developments affecting the value of such currency.
Currency exchange rates may fluctuate significantly over short periods of time causing, along with other factors, aFund’s net asset value to fluctuate as well. Currency exchange rates generally are determined by the forces of supplyand demand in the foreign exchange markets and the relative merits of investments in different countries, actual oranticipated changes in interest rates and other complex factors, as seen from an international perspective. Currencyexchange rates also can be affected unpredictably by intervention by U.S. or foreign governments or central banks,or the failure to intervene, or by currency controls or political developments in the U.S. or abroad. To the extent thata substantial portion of a Fund’s total assets, adjusted to reflect the Fund’s net position after giving effect to currencytransactions, is denominated in the currencies of foreign countries, the Fund will be more susceptible to the risk ofadverse economic and political developments within those countries.
50
M Fund, Inc.NOTES TO FINANCIAL STATEMENTS (Continued)
5. Financial Instruments (Continued)
Shares of the Funds are owned by insurance companies through their separate accounts that are used primarily tofund variable annuity contracts and variable life insurance contracts and by M Financial Holdings Incorporatedthrough direct ownership of seed money and general investment shares. As of December 31, 2017, John HancockVariable Life Insurance Co., Pacific Life Insurance Co., Pruco Life Insurance Co. of Arizona, Security Life ofDenver (an indirect, wholly owned subsidiary of Voya Financial, Inc.), Lincoln National Life Insurance Co., NewYork Life Insurance Co., Nationwide Financial Services, Inc., Delaware Life Insurance Co. and TIAA-CREF LifeInsurance Co. and M Financial Holdings Incorporated owned all shares of the Funds. John Hancock Variable LifeInsurance Co. and Pacific Life Insurance Co. may each be deemed a control person of each Fund because theirseparate accounts hold more than 25% of the shares of each Fund.
As of December 31, 2017 the ownership of each Fund was as follows:
Percentage of Ownership John Hancock Pruco Life Voya-Security
M Financial Variable Life Pacific Life Insurance Co. Life ofHoldings, Inc. Insurance Co. Insurance Co. Of Arizona Denver
M International Equity Fund . . . 0.8% 45.4% 36.4% 6.0% 5.5%M Large Cap Growth Fund . . . . . 1.1% 52.6% 30.7% 6.1% 1.8%M Capital Appreciation Fund . . . 1.0% 47.2% 39.0% 2.7% 5.1%M Large Cap Value Fund . . . . . . 2.1% 50.6% 30.7% 5.0% 2.6%
Percentage of Ownership Lincoln Nationwide TIAA-CREF
National Life New York Life Financial Delaware Life LifeInsurance Co. Insurance Co. Services, Inc. Insurance Co. Insurance Co.
M International Equity Fund . . . 1.9% 0.0%(1) 0.8% 1.0% 2.2%M Large Cap Growth Fund . . . . . 2.3% —% 1.5% 1.5% 2.4%M Capital Appreciation Fund . . . 1.6% —% 1.3% 0.4% 1.7%M Large Cap Value Fund . . . . . . 2.8% —% 2.6% 0.6% 3.0%
(1) Amount rounds to less than 0.05%.
51
M Fund, Inc.NOTES TO FINANCIAL STATEMENTS (Continued)
6. Beneficial Interest
At December 31, 2017, aggregated gross unrealized appreciation for investment securities in which there is anexcess of value over tax cost and aggregate gross unrealized depreciation for investment securities in which there isan excess of tax cost over value were as follows:
Tax Basis Federal Tax Basis Tax Basis Net Unrealized Income Tax Unrealized Unrealized Appreciation/ Cost Appreciation Depreciation Depreciation
M International Equity Fund . . . . . . . . . . . . . . . . . $201,130,686 $52,054,094 $(7,359,029) $44,695,065M Large Cap Growth Fund . . . . . . . . . . . . . . . . . . 128,047,205 65,190,855 (524,222) 64,666,633M Capital Appreciation Fund . . . . . . . . . . . . . . . . 149,909,551 89,051,995 (8,874,043) 80,177,952M Large Cap Value Fund . . . . . . . . . . . . . . . . . . . . 84,757,713 17,581,885 (1,057,751) 16,524,134
The tax character of distributions paid during 2017 and 2016 was as follows:
December 31, December 31, 2017 2016 Amount Amount
M International Equity FundDistributions paid from:
Ordinary Income . . . . . . . . . . . . . . . . . . . . . . . . . . . . . . . . . $ 3,779,071 $2,304,828
Total Distributions . . . . . . . . . . . . . . . . . . . . . . . . . . . . . . . . . $ 3,779,071 $2,304,828
M Large Cap Growth FundDistributions paid from:
Ordinary Income . . . . . . . . . . . . . . . . . . . . . . . . . . . . . . . . . $ 444,865 $ —Long-Term Capital Gain . . . . . . . . . . . . . . . . . . . . . . . . . . . 4,759,941 9,103,954
Total Distributions . . . . . . . . . . . . . . . . . . . . . . . . . . . . . . . . . $ 5,204,806 $9,103,954
M Capital Appreciation FundDistributions paid from:
Ordinary Income . . . . . . . . . . . . . . . . . . . . . . . . . . . . . . . . . $ 260,114 $ 877,204Long-Term Capital Gain . . . . . . . . . . . . . . . . . . . . . . . . . . . 21,768,712 6,654,053
Total Distributions . . . . . . . . . . . . . . . . . . . . . . . . . . . . . . . . . $22,028,826 $7,531,257
M Large Cap Value FundDistributions paid from:
Ordinary Income . . . . . . . . . . . . . . . . . . . . . . . . . . . . . . . . . $ 1,391,726 $1,632,623Long-Term Capital Gain . . . . . . . . . . . . . . . . . . . . . . . . . . . 4,643,266 —
Total Distributions . . . . . . . . . . . . . . . . . . . . . . . . . . . . . . . . . $ 6,034,992 $1,632,623
52
M Fund, Inc.NOTES TO FINANCIAL STATEMENTS (Continued)
7. Tax Information

At December 31, 2017, the components of distributable earnings on a tax basis were as follows:
Late Year Undistributed Undistributed Ordinary and Unrealized Total
Ordinary Long-Term Capital Loss Post October Appreciation/ DistributableIncome Gain Carryforwards Loss Deferrals Depreciation Earnings
M International Equity Fund . . . . . . . . . . . . . . . $ — $ — $(89,364,149) $(161,311) $44,691,325 $(44,834,135)
M Large Cap Growth Fund . . . . . . . . . . . . . . . 941,033 8,646,313 — — 64,666,643 74,253,989
M Capital Appreciation Fund . . . . . . . . . . . . . . . 1,040,337 5,640,769 — — 80,177,952 86,859,058
M Large Cap Value Fund . . 44,064 602,769 — — 16,524,134 17,170,967
Under the Regulated Investment Company Modernization Act of 2010, the Funds are permitted to carry forwardcapital losses incurred in taxable years beginning after December 22, 2010, for an unlimited period. However, anylosses incurred during those future years will be required to be utilized prior to the losses incurred in pre-enactmenttax years. As a result of this ordering rule, pre-enactment capital loss carryforwards may be more likely to expireunused. Additionally, post-enactment capital losses that are carried forward will retain their character as eithershort-term or long-term capital losses rather than being considered all short-term as under previous law.
Net capital loss carryforwards may be applied against any net realized taxable gains in each succeeding year, oruntil their respective expirations dates, whichever occurs first. At December 31, 2017, M International Equity Fundhad available, for federal tax purposes, unused short-term capital losses of $10,383,578, expiring on December 31,2018. In addition, M International Equity Fund had unused short-term capital losses of $4,310,387 and unusedlong-term capital losses of $74,670,184 permitted to be carried for an unlimited period. Under current tax law,certain late year losses, as defined by the Code, within the taxable year may be deferred and treated as occurring onthe first day of the following tax year. For the tax year ended December 31, 2017, M International Equity Fundelected to defer late year losses of $161,311.
Dividends and distributions from net investment income and net realized capital gains are determined in accordancewith federal income tax regulations, which may differ from GAAP. These “book/tax” differences are consideredeither temporary or permanent in nature. To the extent these differences are permanent in nature, such amounts arereclassified within the capital accounts based on their federal tax-basis treatment. Temporary differences do notrequire reclassification.
During the year ended December 31, 2017, the Funds reclassified for book purposes, amounts arising frompermanent book/tax difference primarily relating to realized foreign currency gains and losses, return of capitaldistributions from non-REIT securities, capital gain distributions from REITs and passive foreign investmentcompany gains and losses.
53
M Fund, Inc.NOTES TO FINANCIAL STATEMENTS (Continued)
7. Tax Information (Continued)

Permanent differences incurred during the year ended December 31, 2017, resulting from differences in book andtax accounting, have been reclassified at year-end between undistributed net investment income (loss), undistributed(accumulated) net realized gain (loss) and paid-in capital as follows, with no impact to the net asset value per share:
Undistributed Undistributed (Accumulated) Net Investment Net Realized Income (Loss) Gain (Loss) Paid-in Capital
M International Equity Fund . . . . . . . . . . . . . . . . . . . . . . . . . . . . . $224,608 $43,359,333 $(43,583,941)M Large Cap Growth Fund . . . . . . . . . . . . . . . . . . . . . . . . . . . . . . 366,517 (366,517) —M Capital Appreciation Fund . . . . . . . . . . . . . . . . . . . . . . . . . . . . 75,399 (75,399) —M Large Cap Value Fund . . . . . . . . . . . . . . . . . . . . . . . . . . . . . . . . (59,645) 72,224 (12,579)
8. Disclosure of Certain Commitments and Contingencies
In the normal course of business, the Corporation may enter into contracts and agreements that contain a variety ofrepresentations and warranties that provide general indemnifications. The maximum exposure to the Corporationunder these arrangements is unknown, as it involves future claims that may be made against the Corporation thathave not yet occurred. However, based on experience, the Corporation believes that the current risk of loss is remote.
9. Subsequent Events
The Funds have evaluated subsequent events through the date of issuance of the Funds’ financial statements andhave determined there is no material impact to the Funds’ financial statements.
54
M Fund, Inc.NOTES TO FINANCIAL STATEMENTS (Continued)
7. Tax Information (Continued)

To the Board of Directors of M Fund, Inc.and the Shareholders of M International Equity Fund, M Large Cap Growth Fund, M Capital Appreciation Fund and M Large Cap Value Fund
Opinion on the Financial Statements
We have audited the accompanying statements of assets and liabilities of M International Equity Fund, M LargeCap Growth Fund, M Capital Appreciation Fund and M Large Cap Value Fund, each a series of shares of M Fund,Inc. (the “Funds”), including the schedules of investments, as of December 31, 2017, and the related statements ofoperations for the year then ended, the statements of changes in net assets for each of the years in the two-yearperiod then ended and the financial highlights for each of the years in the five-year period then ended, and therelated notes and schedules (collectively referred to as the “financial statements”). In our opinion, the financialstatements present fairly, in all material respects, the financial position of the Funds as of December 31, 2017, andthe results of their operations for the year then ended, the changes in their net assets for each of the years in thetwo-year period then ended and their financial highlights for each of the years in the five-year period then ended, inconformity with accounting principles generally accepted in the United States of America (“GAAP”).
Basis for Opinion
These financial statements are the responsibility of the Funds’ management. Our responsibility is to express anopinion on the Funds’ financial statements based on our audits. We are a public accounting firm registered with thePublic Company Accounting Oversight Board (United States) (“PCAOB”) and are required to be independent withrespect to the Funds in accordance with the U.S. federal securities law and the applicable rules and regulations ofthe Securities and Exchange Commission and the PCAOB.
We conducted our audits in accordance with the standards of the PCAOB. Those standards require that we planand perform the audits to obtain reasonable assurance about whether the financial statements are free of materialmisstatement, whether due to error or fraud. The Funds are not required to have, nor were we engaged to perform,an audit of their internal control over financial reporting. As part of our audits we are required to obtain anunderstanding of internal control over financial reporting but not for the purpose of expressing an opinion on theeffectiveness of the Funds’ internal control over financial reporting. Accordingly, we express no such opinion.
Our audits included performing procedures to assess the risk of material misstatement of those financial statements,whether due to error or fraud, and performing procedures that respond to those risks. Such procedures includedexamining, on a test basis, evidence regarding the amounts and disclosures in the financial statements. Our proceduresincluded confirmation of securities owned as of December 31, 2017 by correspondence with the custodian and brokersand by other appropriate auditing procedures where responses from brokers were not received. Our audits also includedevaluating the accounting principles used and significant estimates made by management, as well as evaluating theoverall presentation of the financial statements. We believe that our audits provide a reasonable basis for our opinion.
BBD, LLP
We have served as the auditor of one or more of the Funds in the M Fund, Inc. since 2008.
Philadelphia, PennsylvaniaFebruary 23, 2018
55
Report of Independent Registered Public Accounting Firm

Director’s and Officer’s Tables
Interested Directors*:
Other Number of Directorships Portfolios Held by Position Term of Office** in Fund Complex DirectorName, Address and Held with and Length of Principal Occupations Overseen by During Past 5Date of Birth Fund Time Served During Past 5 Years Director Years
There is no family relationship between any of the Directors or Officers of the Company.
(1) Mr. Mullin and Mr. Nease are deemed to be Interested Persons as defined by the 1940 Act, for the followingreasons:
• Mr. Mullin has the power to vote 18.6% of the stock of M Financial Group, which controls the Adviser;
• Mr. Nease owns 1.8% of the stock of M Financial Group;
• Messrs. Mullin and Nease are Directors of M Financial Group; and
• Mr. Nease is a Director of the Adviser.
* In accordance with the Corporation’s current by-laws, each Director serves for an indefinite term until thedate such Director resigns, retires or is removed by the Board of Directors or shareholders in accordance withthe Corporation’s Articles of Incorporation.
Peter W. Mullin(1)1125 NW Couch St.Suite 900Portland, OR 97209(Born: 1/14/41)
Director Indefinite22 Years
Chairman Emeritus,MullinTBG, Inc. (insuranceagency), from 2008 to present.
4 AveryDennison,(consumerpackaging),from 1988 to2013.
Lawton M. Nease(1)Nease Lagana Eden &Culley, Inc.1125 NW Couch St.Suite 900Portland, OR 97209(Born: 11/02/43)
Director Indefinite 8 Years President, Nease, LaganaEden & Culley (life insuranceadvisory firm), from 1988 topresent.
4 NLEC(specialityinsurance)
56
M Fund, Inc.SUPPLEMENTAL INFORMATION (Unaudited)

Independent Directors:
Other Number of Directorships Portfolios Held by Position(s) Term of Office** in Fund Complex DirectorName, Address and Held with and Length of Principal Occupation(s) Overseen by During Past 5Date of Birth Fund Time Served During Past 5 Years Director Years
** In accordance with the Corporation’s current by-laws, each Director serves for an indefinite term until thedate such Director resigns, retires or is removed by the Board of Directors or shareholders in accordance withthe Corporation’s Articles of Incorporation.
N/A4Retired. Through 2003, President andChief Executive Officer,Bidwell & Co. (discountbrokerage firm).
Indefinite22 Years
Director andChairman of theBoard
Gerald BidwellBidwell Capital LLC1125 NW Couch St.,Suite 900 Portland, OR 97209(Born: 6/06/42)
N/A4CEO and CIO, C.M. CapitalCorp., 2011 to present.
Indefinite10 Years
DirectorBruce W. Madding1125 NW Couch St.,Suite 900Portland, OR 97209(Born: 7/02/51)
Director,OaktreeCapital Group2007 topresent(investmentmanager).
4Chief Financial Officer, ChiefInvestment Officer, MeyerMemorial Trust, 1982 to 2014(private foundation); President(2005 to present) and Director(2004-2015), Acorn InvestorsLLC (investment holdingcompany); Principal CliffordCapital Partners LLC, 2010 topresent (investment manager).
Indefinite 6 YearsDirectorWayne Pierson1125 NW Couch St.,Suite 900Portland, OR 97209(Born: 11/05/50)
57
M Fund, Inc.SUPPLEMENTAL INFORMATION (Unaudited) (Continued)
Director’s and Officer’s Tables (Continued)

Principal Officers who are not Directors:
Positions Term of Office Name, Address and Held with and Length of Principal OccupationsDate of Birth Fund Time Served During Past 5 Years
Bridget McNamara-Fenesy1125 NW Couch Street, Suite 900 Portland, OR 97209(Born: 9/18/58)
President One Year SinceOctober 2017
President and CEO, M Securities Holdings, Inc.2017-present; Vice President, M Securities Holdings,Inc. 2016-2017; Interim Chief Compliance Officer,M Securities Holdings, Inc. March 2016-September 2016;President, Two Gaits Consulting 2001-2016.
David Lees1125 NW Couch St.,Suite 900Portland, OR 97209(Born: 2/01/65)
Secretary andTreasurer
One year11 Years
Accounting Director, M Financial Group, 2007-present;Secretary and Treasurer, M Financial InvestmentAdvisers, Inc., 2007-present; Secretary and Treasurer,M Financial Wealth Partners, Inc. and M Financial AssetManagement, Inc., 2016-present
Shannon Hartwell1125 NW Couch St.,Suite 900Portland, OR 97209(Born: 7/19/70)
ChiefComplianceOfficer
One Year12 Years
Chief Compliance Officer, M Financial AssetManagement, Inc., 2011-present; Chief ComplianceOfficer, M Financial Investment Advisers, Inc.,2006-present.
Dean Beckley1125 NW Couch St.,Suite 900Portland, OR 97209(Born: 3/07/71)
ChiefInformationSecurity Officer
One Year SinceMarch 2017
Director, Cyber Security & IT Operations, M FinancialGroup, 2016-present; Director, Technology of M BenefitSolutions, 2013-2016; Senior Project Manager ofM Financial Group, 2009-2013.
58
M Fund, Inc.SUPPLEMENTAL INFORMATION (Unaudited) (Continued)
Director’s and Officer’s Tables (Continued)

Quarterly Form N-Q Portfolio Schedule
Each Fund will file its complete schedule of portfolio holdings with the Securities and Exchange Commission (“SEC”)on Form N-Q at the end of the first and third fiscal quarters within 60 days of the end of the quarter to which it relates.The Corporation’s Form N-Q will be available on the Corporation’s website at www.mfin.com and on the SEC’swebsite at www.sec.gov and may also be reviewed and copied at the SEC’s Public Reference Room in Washington,D.C. Information on the operation of the Public Reference Room may be obtained by calling 1-800-SEC-0330.
Proxy Voting Policies and Procedures and Proxy Voting Record
A description of the Corporation’s proxy voting policies and procedures and the Corporation’s proxy voting recordfor the most recent twelve-month period ending June 30 are available (1) without charge, upon request, by callingthe Corporation toll-free at 1-888-736-2878; and (2) on Form N-PX on the SEC’s website at www.sec.gov.
Tax Disclosures
For corporate shareholders, a portion of the ordinary dividends paid during the Fund’s year ended December 31,2017 qualified for the dividends received deduction as follows.
Dividend ReceivedFund Deduction
M International Equity Fund . . . . . . . . . . . . . . . . . . . . . . . . . . . . . . . . . . . . . . . . . 16.15%M Large Cap Growth Fund . . . . . . . . . . . . . . . . . . . . . . . . . . . . . . . . . . . . . . . . . . 42.52%M Large Cap Growth Fund . . . . . . . . . . . . . . . . . . . . . . . . . . . . . . . . . . . . . . . . . . 81.95%M Large Cap Value Fund . . . . . . . . . . . . . . . . . . . . . . . . . . . . . . . . . . . . . . . . . . . . 100.00%
Pursuant to Internal Revenue Section 852(b), M Large Cap Growth Fund, M Capital Appreciation Fund and M LargeCap Value Fund paid $4,759,941, $21,768,712 and $4,643,266, respectively, which have been designated as capitalgains distributions for the fiscal year ended December 31, 2017.
M International Equity Fund
In accordance with federal tax law, the Fund elects to provide each shareholder with their portion of the Fund’sforeign taxes paid and the income sourced from foreign securities. Accordingly, the Fund made the followingdesignations regarding its fiscal year ended December 31, 2017:
• the total amount of foreign taxes creditable was $373,071
• the total amount of income sourced from foreign countries was $4,064,694
59
M Fund, Inc.SUPPLEMENTAL INFORMATION (Unaudited) (Continued)

As an indirect shareholder of a Fund, you incur ongoing costs, including management fees and other Fund expenses.The following example is intended to help you understand your ongoing costs (in dollars and cents) of investing ina Fund and to compare these costs with the ongoing costs of investing in other mutual funds.
The example is based on an investment of $1,000 invested at the beginning of the period and held for the entireperiod from July 1, 2017 to December 31, 2017.
Actual Expenses
The first line under each Fund in the table below provides information about actual account values and actualexpenses. You may use the information in this line, together with the amount you invested, to estimate the expensesthat you paid over the period. Simply divide your account value by $1,000 (for example, an $8,600 account valuedivided by $1,000 = 8.6), then multiply the result by the number in the first line for your Fund under the headingentitled “Expenses Paid During Period” to estimate the expenses you paid on your account during this period.
Hypothetical Example for Comparison Purposes
The second line under each Fund in the table below provides information about hypothetical account values andhypothetical expenses based on the Fund’s actual expense ratio and an assumed rate of return of 5% per year beforeexpenses, which is not the Fund’s actual return. The hypothetical account values and expenses may not be used toestimate the actual ending account balance or expenses you paid for the period. You may use this information tocompare the ongoing costs of investing in your Fund and other funds. To do so, compare this 5% hypotheticalexample with the 5% hypothetical examples that appear in the shareholder reports of the other funds.
Please note that the expenses shown in the table are meant to highlight your ongoing Fund costs only. As an indirectshareholder of a Fund, you do not incur any transactional costs, such as sales charges (loads), redemption fees orexchange fees. However, you do incur such transactional costs, as well as other fees and charges as an owner of avariable annuity contract or variable life insurance policy. If these transactional and other insurance company feesand charges were included, your costs would have been higher. Therefore, the second line under each Fund in thetable is useful in comparing ongoing Fund costs only, and will not help you determine the relative total costs ofowning different variable annuities or variable life insurance policies.
60
M Fund, Inc.HYPOTHETICAL EXPENSE EXAMPLE (Unaudited)

Expenses Ending Paid During Beginning Account Value Annualized Period* Account Value December 31, Expense (July 1, 2017 to July 1, 2017 2017 Ratio December 31, 2017)
M International Equity FundActual . . . . . . . . . . . . . . . . . . . . . . . . . . . . . . . . . . $1,000.00 $1,067.80 0.91% $4.74Hypothetical (5% return before expenses) . . . . . . 1,000.00 1,020.60 0.91% 4.63
M Large Cap Growth FundActual . . . . . . . . . . . . . . . . . . . . . . . . . . . . . . . . . . 1,000.00 1,136.30 0.73% 3.93Hypothetical (5% return before expenses) . . . . . . 1,000.00 1,021.50 0.73% 3.72
M Capital Appreciation FundActual . . . . . . . . . . . . . . . . . . . . . . . . . . . . . . . . . . 1,000.00 1,090.00 1.04% 5.48Hypothetical (5% return before expenses) . . . . . . 1,000.00 1,020.00 1.04% 5.30
M Large Cap Value FundActual . . . . . . . . . . . . . . . . . . . . . . . . . . . . . . . . . . 1,000.00 1,115.30 0.61% 3.25Hypothetical (5% return before expenses) . . . . . . 1,000.00 1,022.10 0.61% 3.11
* Expenses are calculated using each Fund’s annualized expense ratio (as disclosed in the table), multiplied by theaverage account value for the period, multiplied by the number of days in the period (184 days), and divided bythe number of days in the year (365 days).
61
M Fund, Inc.HYPOTHETICAL EXPENSE EXAMPLE (Unaudited) (Continued)