
M C We’re turning up the heat! - corporate-ir.net · We’re turning up the heat! ... 2005 Flavor...
60
We’re turning up the heat ! MCCORMICK & COMPANY 2004 ANNUAL REPORT
Transcript of M C We’re turning up the heat! - corporate-ir.net · We’re turning up the heat! ... 2005 Flavor...

We’re turning up the heat !
MCCORMICK & COMPANY 2004 ANNUAL REPORT
MCC
OR
MIC
K&
CO
MPA
NY
2004A
NN
UA
L RE
PO
RT
McCormick & Company, Incorporated
18 Loveton Circle
Sparks, Maryland 21152-6000 U.S.A.
410-771-7301

M C C O R M I C K & C O M P A N Y 2 0 0 4 A N N U A L R E P O R T
2005 Flavor Forecast
McCormick keeps its finger on the
pulse of flavor and food trends. We
published the McCormick 2005 Flavor
Forecast to showcase the tastes and
trends that will shape the way
people eat in coming years for our
customers and the media.
Throughout this year’s annual
report, discover new uses for these
products from some of our flavor
experts.
10 flavors to watch> Allspice > Ginger> Annatto > Mint> Cardamom > Pickling Spice> Cinnamon > Sage> Curry > Vanilla
5 trends to watchSatisfying the senses – A true multi-sensory experience delivered by theeffortless combination of flavors, colors, aromas and textures.
Location, location, location –
Ingredients from specific locationsknown for their premium flavors andfreshness.
Worldly tastes – Mini-flavor adven-tures that combine one or two globaltastes with familiar foods.
Health measures – Flavor is the keyto making food enjoyable for all typesof eating plans.
Elevating the basics – Classicfavorites reinvented to reach newheights in flavor.
Ginger
This year’s annual report carries the scent
of ginger. Often the “secret ingredient” in
flavorful dishes, this pungent spice
provides heat – but not the fire. It’s very
popular in Asian, Caribbean and North
African cuisines. On page 15 you can
discover how one of McCormick’s product
developers likes to use ginger.
Around the world, 8,000 McCormick employees areworking together to deliver great results – to ourcustomers, our consumers and our shareholders.
Acquisitions in 2003 and 2004
added annual sales of
nearly $200 million.
Debbie CalverEuropean Technical Manager,Flavour Group
57
M C C O R M I C K & C O M P A N Y 2 0 0 4 A N N U A L R E P O R T
investor information
This report is printed on recyclable paper. Adler Design Group designed this year’s report.
”I often sprinkleMcCormick curry powderalong with McCormickcoarse sea salt andMcCormick cracked blackpepper on roasted wintervegetables. This adds interest and excitement toan otherwise bland dish.The curry note works particularly well with a mixof sweet potatoes and bellpeppers, and you can useany of the McCormickcurry blends depending onyour preference for hot oraromatic flavor.”
World HeadquartersMcCormick & Company, Incorporated18 Loveton CircleSparks, MD 21152-6000U.S.A.(410) 771-7301www.mccormick.com
Stock InformationNew York Stock ExchangeSymbol: MKC
Anticipated Dividend Dates – 2005Record Date Payment Date
04/04/05 04/15/0507/08/05 07/22/0510/07/05 10/21/0512/30/05 01/20/06
McCormick has paid dividends for 80 consecutive years.
Independent AuditorsErnst & Young LLP621 East Pratt StreetBaltimore, MD 21202
CertificationsThe Company has filed the Chief Executive Officer and Chief Financial Officer certifications required by Section 302 of theSarbanes-Oxley Act in its Form 10-K. Additionally, the Chief ExecutiveOfficer has provided the required annual certifications to the New York Stock Exchange.
Investor InquiriesOur website www.mccormick.com has our corporate governanceprinciples, as well as annual reports, SEC filings, press releases,webcasts and other useful Company information.
To obtain without cost a copy of the annual report filed with theSecurities & Exchange Commission (SEC) on Form 10-K or forgeneral questions about McCormick or information in our annual orquarterly reports, contact Investor Relations at the world headquartersaddress, website or telephone:
Report ordering:(800) 424-5855 or (410) 771-7537
Investor and securities analysts’ inquiries:(410) 771-7244
Registered Shareholder InquiriesFor questions on your account, statements, dividend payments,reinvestment and direct deposit, and for address changes, lostcertificates, stock transfers, ownership changes or otheradministrative matters, contact our transfer agent.
Transfer Agent and RegistrarWells Fargo Bank, N.A.Shareowner Services161 North Concord Exchange Street, South St. Paul, MN 55075-1139
(877) 778-6784, or (651) 450-4064www.wellsfargo.com/shareownerservices
You may access your account information via the Internet atwww.shareowneronline.com
Investor Services Plan (Dividend Reinvestment and Direct Purchase Plan)The Company offers an Investor Services Plan which providesshareholders of record the opportunity to automatically reinvestdividends, make optional cash purchases of stock through theCompany, place stock certificates into safekeeping and sell sharesthrough the Plan. Individuals who are not current shareholders maypurchase their initial shares directly through the Plan. All transactionsare subject to the limitations set forth in the Plan prospectus, whichmay be obtained by contacting Wells Fargo Shareowner Services at:
(877) 778-6784 or (651) 450-4064www.wellsfargo.com/shareownerservices
Stock Price History3 months ended High Low Close
11/30/04 $37.41 $33.14 $36.4508/31/04 36.07 32.25 33.5505/28/04 35.56 31.00 35.4502/27/04 31.27 28.84 31.2711/28/03 30.21 26.43 28.69
Annual MeetingThe annual meeting of shareholders will be held at 10 a.m.,Wednesday, March 23, 2005, at Marriott’s Hunt Valley Inn, 245 Shawan Road (Exit 20A off I-83 north of Baltimore), Hunt Valley, Maryland 21031.
Online Receipt of Annual Report and Proxy StatementIf you are a registered shareholder and would like to access nextyear’s proxy statement and annual report over the Internet, go towww.econsent.com/mkcv/ to enroll for this service.
TrademarksUse of ® or TM in this annual report indicates trademarks owned orused by McCormick & Company, Incorporated and its subsidiaries and affiliates.

1
M C C O R M I C K & C O M P A N Y 2 0 0 4 A N N U A L R E P O R T
Higher gross profit margins are fueling our growth.
We have increased gross profit margins 1.9 percentage points since 2001.
No matter where you look, you’ll discover that we are turning up the heat at McCormick.Sales are sizzling, margins are rising, and we’ve spiced up our new product
efforts. We’ve uncovered the hottest eating trends in our 2005 Flavor Forecast.
At McCormick, we are fired up about our opportunities for growth.
In 2004, we increasedproductivity in developing new
products more than 25%.
03 04
More than70% of sales are now value-added.
M C C O R M I C K & C O M P A N Y 2 0 0 4 A N N U A L R E P O R T
2
financial highlights
table of contents
4 letter to shareholders6 board of directors8 consumer business
12 industrial business16 Q&A with Bob Lawless18 McCormick worldwide & executive officers19 community service20 financial information57 investor information
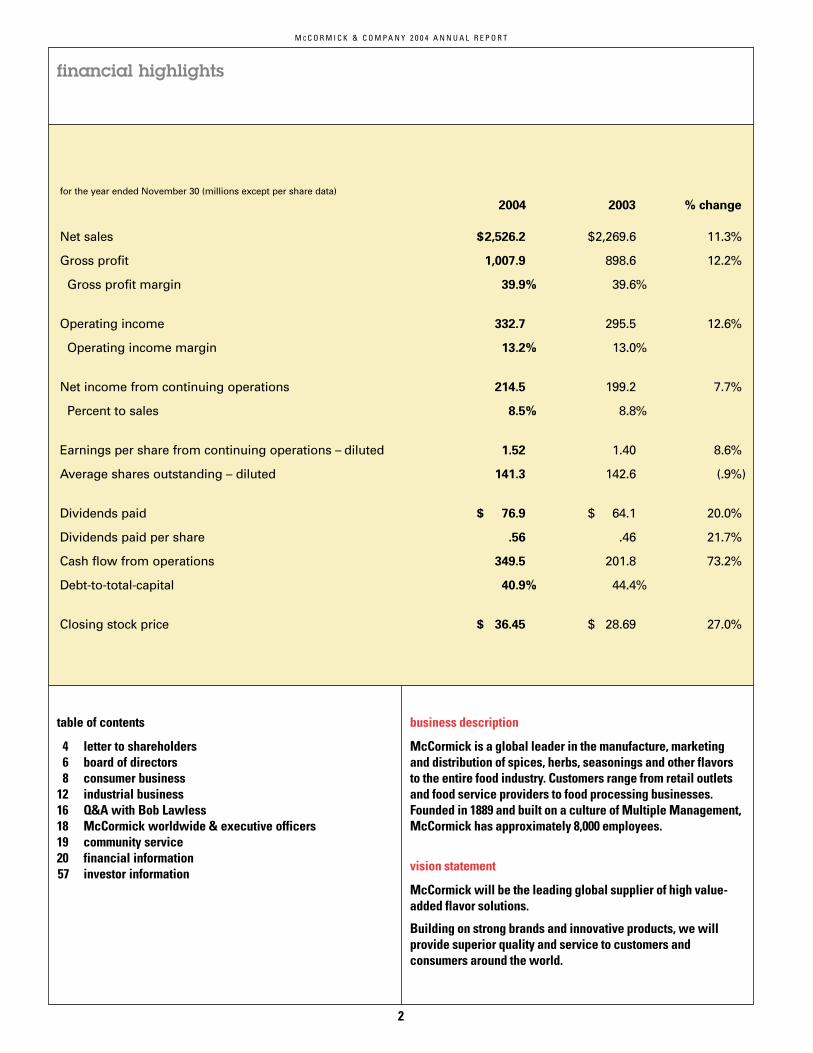
for the year ended November 30 (millions except per share data)
Net sales $2,526.2 $2,269.6 11.3%
Gross profit 1,007.9 898.6 12.2%
Gross profit margin 39.9% 39.6%
Operating income 332.7 295.5 12.6%
Operating income margin 13.2% 13.0%
Net income from continuing operations 214.5 199.2 7.7%
Percent to sales 8.5% 8.8%
Earnings per share from continuing operations – diluted 1.52 1.40 8.6%
Average shares outstanding – diluted 141.3 142.6 (.9%)
Dividends paid $ 76.9 $ 64.1 20.0%
Dividends paid per share .56 .46 21.7%
Cash flow from operations 349.5 201.8 73.2%
Debt-to-total-capital 40.9% 44.4%
Closing stock price $ 36.45 $ 28.69 27.0%
% change20032004
business description
McCormick is a global leader in the manufacture, marketingand distribution of spices, herbs, seasonings and other flavorsto the entire food industry. Customers range from retail outletsand food service providers to food processing businesses.Founded in 1889 and built on a culture of Multiple Management,McCormick has approximately 8,000 employees.
vision statement
McCormick will be the leading global supplier of high value-added flavor solutions.
Building on strong brands and innovative products, we willprovide superior quality and service to customers andconsumers around the world.

M C C O R M I C K & C O M P A N Y 2 0 0 4 A N N U A L R E P O R T
3
$0.00
dividends paid per share
2002 2003 2004
$0.60
$0.50
$0.40
$0.30
$0.20
$0.10
$0
cash flow from operations
2002 2003 2004
$360
$300
$240
$180
$120
$60
in millions
Nov. 99 Nov. 00 Nov. 01 Nov. 02 Nov. 03 Nov. 04
$16.03
$18.63
$21.50
$23.79
$28.69
$36.45
2002 2003 2004
$1.60
$1.20
$0.80
$0.40
$0.00
earnings per share from continuing operations – diluted
$2,600
$1,950
$1,300
$650
$0
net salesin millions
2002 2003 2004
McCormick’s share pricehas more than doubledsince 1999.
For the five years ended 11/30/04, McCormick’s total annual shareholder return has exceeded the S&P 500 Stock Index and S&P 500 Food Products Index.
McCormick & Company 20%
S&P 500 Stock Index -2%
S&P 500 Food Products Index 0%

M C C O R M I C K & C O M P A N Y 2 0 0 4 A N N U A L R E P O R T
4
fellow shareholders, 2004 was a terrific year at McCormick. Sales reached a record$2.5 billion. We completed the implementation of our B2Kprogram in the U.S. The goal for the first year of our $70 millioncost reduction program was exceeded. We reached $1.0 billionin gross profit and increased gross profit margin 0.3 percentagepoints. With $350 million in cash from operations we paid $77million in dividends, repurchased $175 million of shares andacquired Silvo, the leading brand of spices and herbs in theNetherlands, for $75 million.
Now in our 115th year, we continue to build shareholdervalue. In fact, total annual return for our shareholders has been20% during the past five years, twice that of our peer compa-nies. Everywhere you look, you’ll discover that McCormick isturning up the heat.
record results for 2004At the beginning of 2004, with confidence in our business andability to perform, we set several financial goals.
Our first objective was to grow sales 7-9%. We achievedsales growth of 11%. This was the result of launching successful
new products, introducing effective promotions and acquiringZatarain’s mid-year in 2003. We also benefited from higher pricing for vanilla and favorable foreign currency. Sales for ourconsumer business rose 15%, following a 17% increase in2003. Our industrial business picked up steam with a 7% salesincrease following a 5% increase in 2003.
Second, we set a range for earnings per share of $1.51 to$1.54. We ended the year with earnings per share of $1.52. Withhigher sales, improved gross profit margins, cost reductionsavings and the proceeds from the settlement of a lawsuit
claim, we were able to offset some costincreases in areas including employee bene-fits and fuel. More importantly, we were ableto invest in the business for future growth,increasing advertising and product develop-ment expense during 2004.
Our third target was to generate $350-$400 million from 2004 to 2006 in cash flowfrom operations, after net capital expendituresand dividends. Our 2004 result of $206 millionhas us well on our way toward meeting thistarget. We generated higher cash from anumber of sources including higher netincome, reduced inventory and lower prepaidallowances. During 2004, we increased divi-dends paid by 20% to $77 million from $64million in 2003.
turning up the heat For each step of our strategy: improve margins,invest in the business and increase sales and
profits...we are turning up the heat!A key to margin improvement is our B2K program, a global
initiative that is significantly improving our business processesthrough state-of-the-art technology. With the implementation forthe U.S. complete, our plan is to move international businessesonto this platform by 2006. Utilizing the power of B2K, employeesare improving the supply chain throughout the Company. As aresult, we significantly reduced costs in 2004, exceeding our $15million objective. In 2005 we expect to reduce costs an additional$25 million and in 2006 an additional $30 million.
Margin improvement fuels our growth. We will use a portion
letter to shareholders
Robert J. Lawless

M C C O R M I C K & C O M P A N Y 2 0 0 4 A N N U A L R E P O R T
5
of our consumer business. The Management Committee hasresponsibility for setting strategy, executing growth initiatives,allocating Company resources and for developing and advanc-ing our employees. I believe that our Board of Directors,Management Committee and leadership throughout McCormickare among the best in the food industry.
Toward the end of 2004, Jerry Wolfe was promoted toVice President – Supply Chain and Chief Information Officer. FranContino was named Executive Vice President–Strategic Planningand CFO. Throughout the Company, we continue to challengeand develop our people while tapping into their experience,knowledge and enthusiasm.
We like our business: flavor. Demand for great taste has fewboundaries. Kid-friendly flavors, bold and zesty flavors, ethnicflavors and flavors for those on a reduced calorie, low-carb, low-fat, or low-salt diet. From molecule to menu, McCormick has thebroadest range of flavor solutions in the industry.
I believe we have a great team at McCormick and a winningstrategy that continues to deliver record financial performanceyear after year. Our core values define the way we work withone another, how we value and serve our customers, and ourultimate responsibility to McCormick shareholders. These valuesare fundamental to our success.
Thank you to our employees for making our goals a reality.All of us at McCormick are committed to building shareholdervalue. I am confident of our future success.
Robert J. Lawless, Chairman, President and CEO
of this fuel to invest in the business. We are accelerating themarketing support behind our powerful brands. We have morethan doubled advertising expense since 1999. We invested ina promotional analysis process that in its first year significantlyincreased the effectiveness of our 2004 U.S. trade promotiondollars. Product development expense increased another 18%in 2004 and 84% since 1999. In addition to increasing ourresources behind product development, we’ve increasedproductivity. New product sales as measured per each R&Dprofessional have doubled in the past five years. A formulamanagement system will be available in 2005 that will give ourteams a running start on new products and further reduce thedevelopment cycle time for our customers.
Improved margins provide the fuel for business invest-ments...investments designed to increase sales and profits.Throughout the Company we are seeing signs of success in agreat number of new products. One product line is grinders. Afunctional, consumer-oriented package that originated underthe Ducros brand in France is being taken to other markets.Worldwide sales of grinders were up 36% in 2004, and newblends and an improved package are in the pipeline for 2005. Forseveral years now, sales to restaurant chains have been strong.Most recently, we have significantly increased sales of coatingsystems. We have also increased sales and profits with strate-gic acquisitions. Since its addition to the McCormick family inJune 2003, the performance of Zatarain’s has exceeded ourexpectations. At the end of 2004, we completed the acquisitionof another excellent brand, Silvo. This leading brand extends ourEuropean reach into the Netherlands and will add nearly $50million of sales in 2005.
We continue to reaffirm the long-term goals that we set in2002: to grow sales 5% annually with a range of 3-7% and toincrease earnings per share 10-12%. In a tough environment,these are aggressive goals for McCormick and, for that matter, anypackaged food company. But we like a challenge at McCormickand have established a strong track record in meeting our goals.In the coming years, we intend to continue our record of superiorfinancial results and increased shareholder value.
leadership at McCormick Early in 2004, a Management Committee was formed thatexpanded the former Executive Committee to include leaders
our core values
We believe…
> our people are the most important ingredient of our success.> our top priority is to continuously add value for our shareholders.> customers are the reason we exist.> our business must be conducted honestly and ethically.> the best way to achieve our goals is through teamwork.

Barry H. Beracha James T. Brady Francis A. Contino
Robert G. Davey Edward S. Dunn, Jr.
J. Michael Fitzpatrick Freeman A. Hrabowski, III Robert J. Lawless
Margaret M.V. Preston William E. Stevens Karen D. Weatherholtz
McCormick’s mission
is to enhance
shareholder value.
7
M C C O R M I C K & C O M P A N Y 2 0 0 4 A N N U A L R E P O R T
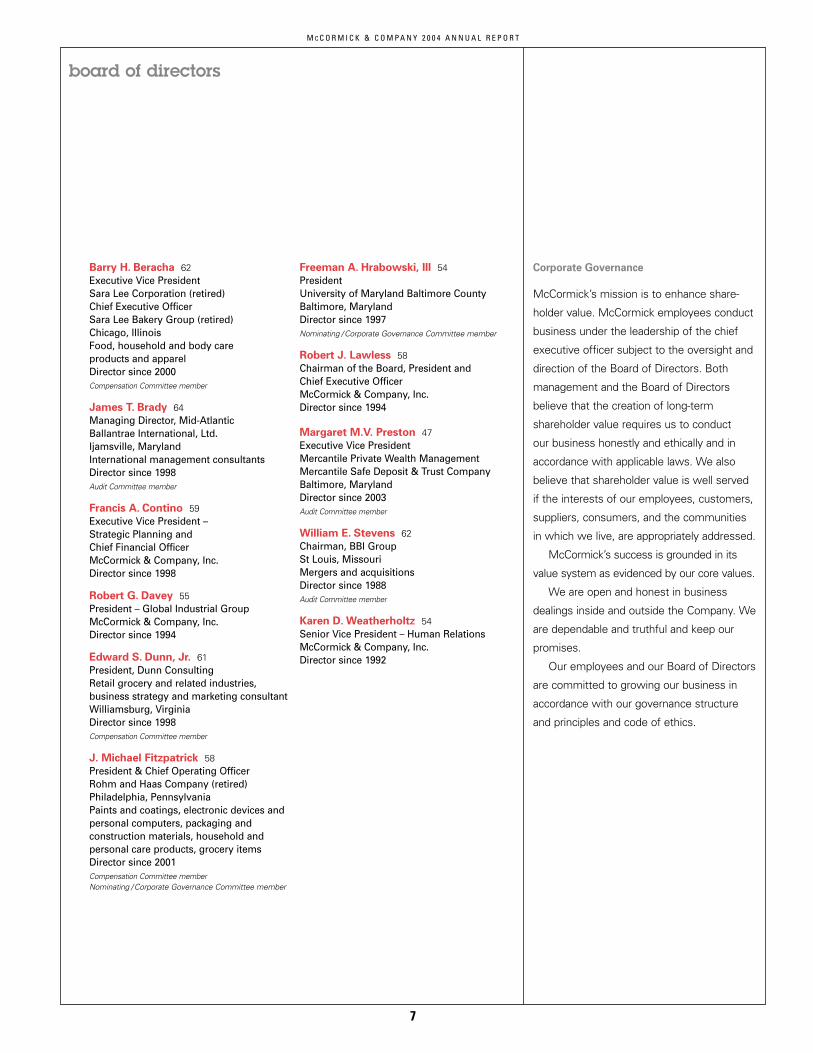
Corporate Governance
McCormick’s mission is to enhance share-
holder value. McCormick employees conduct
business under the leadership of the chief
executive officer subject to the oversight and
direction of the Board of Directors. Both
management and the Board of Directors
believe that the creation of long-term
shareholder value requires us to conduct
our business honestly and ethically and in
accordance with applicable laws. We also
believe that shareholder value is well served
if the interests of our employees, customers,
suppliers, consumers, and the communities
in which we live, are appropriately addressed.
McCormick’s success is grounded in its
value system as evidenced by our core values.
We are open and honest in business
dealings inside and outside the Company. We
are dependable and truthful and keep our
promises.
Our employees and our Board of Directors
are committed to growing our business in
accordance with our governance structure
and principles and code of ethics.
Freeman A. Hrabowski, III 54PresidentUniversity of Maryland Baltimore CountyBaltimore, MarylandDirector since 1997Nominating /Corporate Governance Committee member
Robert J. Lawless 58Chairman of the Board, President and Chief Executive OfficerMcCormick & Company, Inc.Director since 1994
Margaret M.V. Preston 47Executive Vice PresidentMercantile Private Wealth ManagementMercantile Safe Deposit & Trust CompanyBaltimore, MarylandDirector since 2003Audit Committee member
William E. Stevens 62Chairman, BBI GroupSt Louis, MissouriMergers and acquisitionsDirector since 1988Audit Committee member
Karen D. Weatherholtz 54Senior Vice President – Human RelationsMcCormick & Company, Inc.Director since 1992
Barry H. Beracha 62Executive Vice PresidentSara Lee Corporation (retired)Chief Executive OfficerSara Lee Bakery Group (retired)Chicago, IllinoisFood, household and body care products and apparelDirector since 2000Compensation Committee member
James T. Brady 64Managing Director, Mid-AtlanticBallantrae International, Ltd.Ijamsville, MarylandInternational management consultantsDirector since 1998Audit Committee member
Francis A. Contino 59Executive Vice President – Strategic Planning and Chief Financial Officer McCormick & Company, Inc.Director since 1998
Robert G. Davey 55President – Global Industrial GroupMcCormick & Company, Inc.Director since 1994
Edward S. Dunn, Jr. 61President, Dunn ConsultingRetail grocery and related industries, business strategy and marketing consultantWilliamsburg, VirginiaDirector since 1998Compensation Committee member
J. Michael Fitzpatrick 58President & Chief Operating OfficerRohm and Haas Company (retired)Philadelphia, Pennsylvania Paints and coatings, electronic devices and personal computers, packaging andconstruction materials, household andpersonal care products, grocery itemsDirector since 2001Compensation Committee memberNominating /Corporate Governance Committee member
board of directors

M C C O R M I C K & C O M P A N Y 2 0 0 4 A N N U A L R E P O R T
8
Victor SyVice President and Managing Director – Consumer – McCormick Asia
Iwan WilliamsPresident – Europe, Middle East & Africa
Alan WilsonPresident – U.S. Consumer Foods
Mark TimbiePresident – International Consumer Products Group
consumer business
2004 2003
net sales $1,339.8 $1,162.3
operating income $269.7 $230.9
Interest in flavors continues to grow as consumers all over the worldare exposed to different cuisines than their own. But food preparationmust be quick and easy. McCormick is satisfying this appetite foroutstanding flavor and simple preparation with leading brands in keymarkets around the world.
ASIA PACIFIC 4%
EUROPE 29%
AMERICAS 67%
financial results(in millions)
2004 net sales by region

M C C O R M I C K & C O M P A N Y 2 0 0 4 A N N U A L R E P O R T
9
McCormick’s consumer business markets seasoning blends,spices, herbs, extracts, sauces, marinades and specialtyfoods. Our customers span a broad range of retail outlets andinclude grocery, drug, mass merchandise and dollar stores.
2004 financial results
Net sales rose 15% in 2004. Volume, price and product mixincreased 11%. The 2003 acquisition of Zatarain’s was incre-mental to the first six months of the year and added 4% of the11% growth rate. Favorable foreign exchange added another4%. In the Americas, sales were particularly strong as a resultof new products, effective marketing, pricing actions and distri-bution expansion. In Europe, sales success with new productswas tempered by a more competitive situation.
Operating income rose 17%. The sales increase and initia-tives to improve margins helped to offset cost pressures thatincluded vanilla, fuel and employee benefits. The higher cost ofvanilla was also offset by higher pricing. During 2004, weincreased advertising 43%. As a percent of net sales, operatingincome reached 20.1%, as compared to 19.9% in 2003.
market position
Consumers want to add flavor to their foods – bold and zesty,kid-friendly and fun, ethnic and exotic. But preparation must beeasy. A recent Food Market Institute report stated, “Consumerscontinue to be time-pressed and are looking for solutions to cutthe time spent in meal preparation.”
As category leader, McCormick is meetingthese needs through initiativessuch as new products, better
This magazine advertisement
features Joe Montana,
McCormick’s first major
celebrity spokesperson. Joe
promotes the GrillMates line
of products. Worldwide, we
increased 2004 sales of grilling
seasonings, marinades,
sauces and rubs 8%.

”It’s not your old-fash-ioned pickling ingredient.McCormick pickling spiceis a versatile blend ofspices and herbs that hasmany comfort food applica-tions. Slow cookers are coming back. Try picklingspice with popular slowcooker recipes such ascorned beef & cabbage,sauerbraten beef or german style pot roast. An old favorite, McCormickpickling spice, can be agreat addition to today’smeals.”
Jeff CarterProduct Development Manager,U.S. Consumer Products Division
10
merchandising, effective marketing and a dynamic website.Our actions are driving category growth in many key markets.
In 2004, the spice and seasoning category rose 2% in the U.S.,5% in Canada and 1% in the U.K. A tough competitive situationin France, however, led to a 1% category decline in 2004.
With both brand and private label products, we enjoy aleading share in our largest markets. In the U.S. and the U.K. ourshare has increased to nearly 50%, and in France and Canadaour share exceeds 50%. We also have a leading share in Chinaand a strong presence in additional markets in Europe and Asia.
As a result of marketing initiatives and expanded distribu-tion we continue to gain market share. In 2004, we added 1.4percentage points to our U.S. market share of branded spicesand seasonings.
Following the acquisition of Zatarain’s in 2003, we
increased 2004 sales of this brand 20%. The increase
was due in part to the successful introduction of a new
“Ready-to-Serve” line of rice mixes.
Our unique
grinder top adds
fresh taste right
at the table. With
the introduction of new
flavors and the addition of
new markets, worldwide sales
of grinders grew by 36% in 2004.
2004 highlights
> In the Netherlands, acquired theSilvo business, gaining entry into theDutch market with a 63% market share.
> Launched new products in the last3 years that accounted for 6% of2004 sales.
> In the U.S., increased sales of theZatarain’s brand 20% with expandedproduct penetration and new items.
> In the U.S., significantly increasedthe effectiveness of trade promotions.This was one of the key factors in a17% sales increase in the Americas.
> In China, substantially improved our distributor network andstreamlined our business to 75 well-qualified distributors. Thiswas a reduction from 250 distributors in the network in 2003.
> Worldwide, grew sales of grinders by 36%. This innovativepackage originated in France, under the Ducros label.
> Increased sales of our grilling products, including seasonings,marinade blends and sauces, 8% worldwide. Rubs are featuredin the new product line up for 2005.
> In the U.S., strengthened a leading position with Hispanicconsumers with new products and a focused expansion intoTexas and Chicago markets. In 2005, for the first time,McCormick will advertise on Hispanic networks.
> In the U.K., converted more than 5,000 stores to new pack-aging and merchandising of the Schwartz brand spices andherbs in only two months. With this change, we have signifi-cantly reduced the variety of packaging formats in Europe.
> Throughout Europe, achieved 8% growth of dessert aids withnew products and new distribution.
M C C O R M I C K & C O M P A N Y 2 0 0 4 A N N U A L R E P O R T

M C C O R M I C K & C O M P A N Y 2 0 0 4 A N N U A L R E P O R T
growth initiatives
We are growing the consumer business by:
Developing innovative products. As category leader it is ourresponsibility to bring news and excitement to the category.Consumers are seeking new products that offer convenienceand great flavor.
Increasing marketing effectiveness. Approximately 10% of
each sales dollar is spent on trade promotions. We are meas-
uring the effectiveness of our promotions to optimize sales.
Through advertising we are driving consumer demand and
have more than doubled our advertising since 1999. We are
working to improve the appearance of our products in their
home department and gain additional store placements to
build consumer awareness.
Expanding distribution. We are adding customers in newgeographic regions in Europe and the Asia/Pacific region. Inmore established markets we are achieving better penetrationof products including our seafood complements, the Zatarain’sbrand and dessert aids.
Expanding through acquisitions. We will continue to acquireleading brands that take us into new markets, particularly inEurope. We will seek niche brands that fit well with our exist-ing product lines. To be successful, acquisitions must passfinancial hurdles and include a well-constructed integration plan.
outlook
Our growth initiatives are expected to drive 5% annual salesincreases. The pace of growth may vary year to year due toacquisitions, foreign exchange andother factors.
For 2005, new products in thepipeline include both wet and dryflavors for grilling, seafood andsalads. A relaunch for dry seasoningmixes with new packaging andmerchandising is planned in theU.S. Advertising will be focused onvalue-added products that meetconsumers’ demand for conven-ience and great taste. We willcontinue to expand our leadershipposition into new geographies.Sales growth and further progresswith margin improvement initia-tives will continue to improveoperating income margin for theconsumer business.
Interest in flavors continues to grow as consumers all overthe world are exposed to different cuisines than their own. Butfood preparation must be quick and easy. McCormick is satis-fying this appetite for outstanding flavor and simple preparationwith leading brands in key markets around the world.
11
With the acquisition of
Silvo at the end of 2004,
we gained entry into the
Dutch market with a
63% market share.
With television advertising
and a number of new
products, sales for our
Vahine dessert aids brand
in Europe grew 8% in 2004.
McCormick is the #1 spice and seasoning brand among
Hispanic consumers in the U.S. In 2004, we strengthened
this leading position with new products, and in 2005, for
the first time, will advertise on a major Hispanic
television network.
In the U.K., new packaging
and merchandising of our
Schwartz brand improves the
appearance of the products
and shopping experience for
the consumer. During 2004, our
team converted over 5,000
stores in only two months.

M C C O R M I C K & C O M P A N Y 2 0 0 4 A N N U A L R E P O R T
12
industrial business
2004 2003
net sales $1,186.4 $1,107.3
operating income $113.6 $108.9
financial results(in millions)
2004 net sales by region
We are building our leadership position in flavors. With our widerange of flavor solutions and ability to create consumer-preferredproducts, customers increasingly turn to McCormick for new productideas and as a preferred supplier of great flavor solutions.
Mike NavarreVice President – OperationsGlobal Industrial Group
Chuck LangmeadVice President & General Manager– Food Service & GlobalRestaurant Divisions
Jim MorrisroeVice President – Flavour Group – Europe
Dr. Hamed FaridiVice President – Research & Development
Randy CarperVice President &General Manager –Frito Worldwide Division
Randy HoffVice President &General Manager –McCormick Flavor Division
ASIA PACIFIC 8%
EUROPE 19%
AMERICAS 73%

M C C O R M I C K & C O M P A N Y 2 0 0 4 A N N U A L R E P O R T
13
2004 financial results
Net sales rose 7% in 2004. Volume, price and product mixincreased 4%. Favorable foreign exchange added another 3%.Sales growth in the Americas resulted from new productsuccesses, particularly with restaurant customers, as well ashigher pricing for higher cost vanilla, dairy products and other rawmaterials. In Europe, growth in more value-added products wasoffset by reduced sales of ingredients. This shift in mix was drivenby our decision to exit certain lower margin products and regions.
Operating income rose 4%. Higher sales, an improvedproduct mix, and initiatives to reduce costs provided an offsetto cost pressure from other areas including fuel and employeebenefits. During 2004, we increased product developmentexpense 18%.
market position
Interest in flavors continues to grow. A report published by TheFreedonia Group states that “flavors and flavor enhancers willcontinue to account for the largest share of overall food additives,due to their extensive use in many processed foods, dairy prod-ucts, baked goods and candy...opportunities are constantly beingcreated by consumer demand for new flavors based on ethniccuisines and more intense flavor preparations.”
With blended seasonings, spices and herbs, condi-ments, compound flavors and extracts, and coating systems,
McCormick’s industrial business markets blended seasonings, spicesand herbs, condiments, compound flavors and extracts, and coatingsystems to other food processors and to the away-from-home channel, both directly and through distributors and warehouse clubs.
For restaurant customers
and other food processors,
we develop and deliver
consumer-preferred
flavors. In fact, new
products launched over
the last three years
accounted for 22% of
2004 sales.
To further improve our
productivity, a new
formula management
system introduced in
2004 will provide a
running start on new
projects and reduce the
new product cycle time
for delivery to our
customers beginning
in 2005.
COMPOUND FLAVORS
Beverage flavors
Dairy flavors
Confectionery flavors
PROCESSED FLAVORS
Meat flavors
Savory flavors
SEASONINGS
Seasoning blends
Salty snack seasonings
Side dish seasonings
(rice, pasta, potato)
Sauces and gravies
COATING SYSTEMS
Batters
Breaders
Marinades
Glazes
Rubs
CONDIMENTS
Sandwich sauces
Ketchup
Mustards
Jams and jellies
Seafood cocktail sauces
Salad dressings
Flavored oils
INGREDIENTS
Spices and herbs
Extracts
Essential oils and oleoresins
Fruit and vegetable powders
Tomato powder

2004 highlights
> Launched new products during the last 3 years that accountedfor 22% of 2004 sales.
> In the U.S., increased sales of coating systems by more than30%. Directed primarily to the quick service restaurant industry,our flavorful products drove sales for key customers.
> Doubled the sales of new products measured per eachresearch and development professional in the past 5 years.Tripled cost savings per research and development professionalin the past 3 years.
> By focusing on more profitable items, reduced SKUs (numberof items sold) in the European market from more than 3,250 in2003 to less than 2,750 in 2004. In 2005, we will streamline ourbusiness to fewer than 2,000 individual products in Europe.
> Grew sales of food service herbs and spices 8% in China,establishing the brand as the product of choice among high-endrestaurants and catering outlets.
> Recognized by our customers for innovation, quality productsand reliable service. For the tenth consecutive year, Syscoranked McCormick among its top 100 suppliers. Fewer than10 other suppliers to Sysco share this honor. Frito-Laynamed McCormick its 2003 seasoning and ingredientsupplier of the year.
> Completed a formula management system that will providea running start on new projects and reduce new productcycle time delivery to our customers beginning in 2005.
> In the U.S., we are improving the quality of incomingmaterials through a rigorous vendor management program.This program led to a 36% reduction in incoming materialdefects during 2004.
We develop
flavorful coating
systems for quick
service restaurants.
In 2004, U.S. sales of
coating systems grew
by more than 30%.
M C C O R M I C K & C O M P A N Y 2 0 0 4 A N N U A L R E P O R T
McCormick has the broadest range of flavor solutions in theindustry. While there are many industrial competitors, mostmarket only one or two of these five categories. And as a lead-ing supplier to food service distributors and warehouse clubs,McCormick is well-positioned to grow with these customers.
For all customers, new products are an essential elementof growth. Our multifunctional sales teams work with customersto develop leading products that become marketplace winners.
Spending for research and development hasmore than doubled since 1998. Our focushas been on value-added, highermargin products. Together, ourdevelopment, application, culinaryand sensory areas enable us todeliver consumer-preferred flavors.
Chefs in China are adding
flavor with our McCormick
brand line of spices and
seasonings. We grew sales
of these food service
products 8% in 2004.
Our customers
have recognized
McCormick for
delivering innovation,
quality products and
reliable service.
NEW PHOTO TO

Claudio RattesSenior Food Technologist,Research & Development
”Ginger is commonlyused in baking but myfavorite use is to give arecipe some Asian character, especially withpoultry and seafood. I liketo add a spoonful ofMcCormick ground gingerper pound of fish alongwith some toasted sesameseeds in the breading. Itwill provide a very freshtaste, which may be com-plemented with lime juice(at the moment of serving)and will reduce any‘fishy’aroma.”
M C C O R M I C K & C O M P A N Y 2 0 0 4 A N N U A L R E P O R T
outlook
Our growth initiatives are expected to drive 5% annual salesincreases. The pace of growth may vary year to year due to acqui-sitions, foreign exchange and other factors. Our ongoing focuson value-added products will continue to boost profit margins.
For 2005, new products in the pipeline include flavoredbeverages, salty snack seasonings, and coating and grillingsystems. With cost reduction activities helping the bottom line,profit margins for the industrial business will continue to improve.
We are building our leadership position in flavors. With ourwide range of flavor solutions and ability to create consumer-preferred products, customers increasingly turn to McCormickfor new product ideas and as a preferred supplier of greatflavor solutions.
growth initiatives
We are growing the industrial business by:
Supporting the global expansion of our industry-leading
customers. Our customers are growing globally, and we aregrowing with them. Additional restaurant locations in China,product distribution into India, a new brand launched inEurope . . . each of these offers McCormick an opportunity forgrowth. We can supply much of this growth from existing facil-ities. We are also seeking to extend our global flavor capabilitiesinto new regions through acquisitions.
Building current and new strategic partnerships. At the endof 2004, our top 15 customers accounted for approximately 70%of sales. They rely on us for consistent, high quality products andflawless service. We will increase our business with existingcustomers by working collaboratively to pursue growth oppor-tunities. We also have in place a team devoted to identifying anddeveloping new strategic partners. These opportunities includelarge companies that we do not currently supply, as well asemerging businesses, such as restaurant chains, that are expe-riencing rapid growth.
Providing consumer-preferred value-added products.
Innovative new products are in demand. With our breadth offlavor solutions, we can participate in the latest high growth area,whether it is dairy, confection, high fiber or low carb. Our culi-nary and flavor experts add value by including sophisticatedflavors in coating systems, seasoning blends, condiments andother products. And our sensory teams conduct careful testingto measure consumer preferences. As our business shifts tomore consumer-preferred value-added products, we are grow-ing sales and improving profit margins.
15
With blended seasonings,
spices and herbs, condiments,
compound flavors and
extracts, and coating systems,
McCormick has the broadest
range of flavor solutions in
the industry.

M C C O R M I C K & C O M P A N Y 2 0 0 4 A N N U A L R E P O R T
16
What are your most significant opportunities to grow sales?
On average, we expect to grow sales 5% annually, within a 3-7% range. We do this through innovation, acquisitions andextending our geographic reach. New products will continueto be a vital part of our sales growth. In recent years, at least10% of annual sales came from new products launched in theprior three years. We continue to pursue acquisitions as animportant avenue of growth. Geographically, we are excitedabout opportunities to further expand our branded products inChina and to countries in Europe where we do not yet have aleading share.
In summary, sales growthwill vary year to year based onacquisition activity, foreigncurrency exchange rates andother factors. However, over timewe expect annual sales growthfrom the following sources: 2-3%from the base business, 1-2%from new products, 1-2% fromacquisitions, 0-1% from distribu-tion expansion and 0-1% frompricing actions.
How does concern about healthand wellness impact your business?
Consumers are invited to visit www.mccormick.com wherethey will find healthy recipe and meal ideas in our new “Tastefor Health” section. As a supplier of a broad range of flavors,McCormick can add taste to a variety of diets. For consumerson a low-carb diet who are eating more meat, poultry andseafood, we provide coatings, marinades and grilling seasonings.If one’s interest is in whole grains, we offer products that flavor
bread, cereal and wholesome snack foods. All too often, dietsthat call for low-fat, low-salt or low-calorie are often low in flavor.And that’s where McCormick steps in – to add great taste.
I’ve read that Americans are eating out more. Are they cooking less?
In October 2004, USA Today reported that 77% of meals aremade at home based on research conducted by NPD. And theFood Marketing Institute has indicated that 84% of consumersate a home-cooked meal at least three times a week comparedto 74% in 2001. At the same time, Americans would like prepa-ration time to be less than thirty minutes according to Parade
Magazine’s “What America Eats” issue.McCormick makes cooking quick and easy withproducts like GrillMates, seafood sauces, and newseasoning mixes that offer both convenience andgreat flavor. We’re delivering flavor in new ways too,with grinders, salad products and dessert toppingsthat add taste at the table.
For many of those occasions when peopleprefer to eat out, grab a snack or heat up a preparedmeal, McCormick continues to deliver the flavor!Through our industrial business, we add taste tothe products offered in leading restaurants, foodservice distributors and food processors. In fact,whether you are at home or eating out you can
enjoy something flavored by McCormick.
Costs for many basic food ingredients such as soy oil and dairy products can fluctuate year to year. How does this affect your business?
We strive to maintain stability in costs and pricing. In our indus-trial business, many customers accept price adjustments thatpass through commodity cost changes. In our consumer busi-ness, increases and decreases in the costs of spices, herbs and
Q&A with Bob Lawless
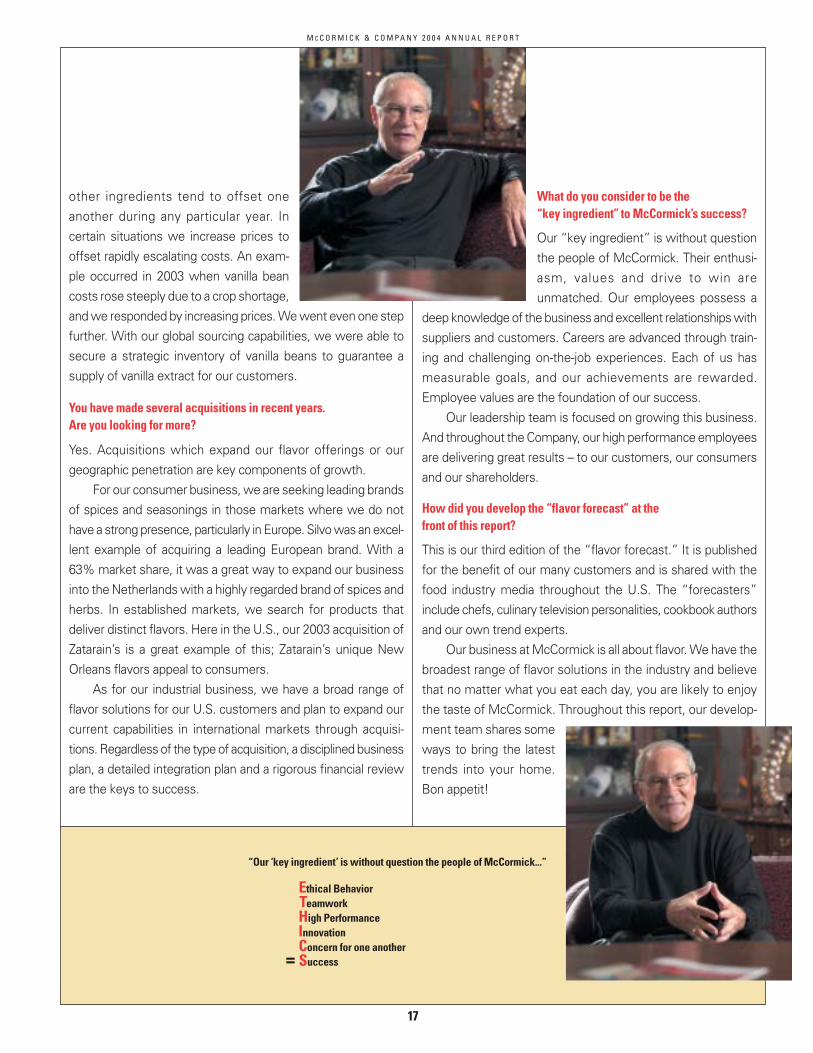
What do you consider to be the “key ingredient” to McCormick’s success?
Our “key ingredient” is without questionthe people of McCormick. Their enthusi-asm, values and drive to win areunmatched. Our employees possess a
deep knowledge of the business and excellent relationships withsuppliers and customers. Careers are advanced through train-ing and challenging on-the-job experiences. Each of us hasmeasurable goals, and our achievements are rewarded.Employee values are the foundation of our success.
Our leadership team is focused on growing this business.And throughout the Company, our high performance employeesare delivering great results – to our customers, our consumersand our shareholders.
How did you develop the “flavor forecast” at the front of this report?
This is our third edition of the “flavor forecast.” It is publishedfor the benefit of our many customers and is shared with thefood industry media throughout the U.S. The “forecasters”include chefs, culinary television personalities, cookbook authorsand our own trend experts.
Our business at McCormick is all about flavor. We have thebroadest range of flavor solutions in the industry and believethat no matter what you eat each day, you are likely to enjoythe taste of McCormick. Throughout this report, our develop-ment team shares someways to bring the latesttrends into your home.Bon appetit!
M C C O R M I C K & C O M P A N Y 2 0 0 4 A N N U A L R E P O R T
17
other ingredients tend to offset oneanother during any particular year. Incertain situations we increase prices tooffset rapidly escalating costs. An exam-ple occurred in 2003 when vanilla beancosts rose steeply due to a crop shortage,and we responded by increasing prices. We went even one stepfurther. With our global sourcing capabilities, we were able tosecure a strategic inventory of vanilla beans to guarantee asupply of vanilla extract for our customers.
You have made several acquisitions in recent years.Are you looking for more?
Yes. Acquisitions which expand our flavor offerings or ourgeographic penetration are key components of growth.
For our consumer business, we are seeking leading brandsof spices and seasonings in those markets where we do nothave a strong presence, particularly in Europe. Silvo was an excel-lent example of acquiring a leading European brand. With a63% market share, it was a great way to expand our businessinto the Netherlands with a highly regarded brand of spices andherbs. In established markets, we search for products thatdeliver distinct flavors. Here in the U.S., our 2003 acquisition ofZatarain’s is a great example of this; Zatarain’s unique NewOrleans flavors appeal to consumers.
As for our industrial business, we have a broad range offlavor solutions for our U.S. customers and plan to expand ourcurrent capabilities in international markets through acquisi-tions. Regardless of the type of acquisition, a disciplined businessplan, a detailed integration plan and a rigorous financial revieware the keys to success.
“Our ‘key ingredient’ is without question the people of McCormick...”
=
Ethical BehaviorTeamworkHigh PerformanceInnovationConcern for one anotherSuccess

Marianne GilletteDirector, Product Development,Restaurants
18
M C C O R M I C K & C O M P A N Y 2 0 0 4 A N N U A L R E P O R T
McCormick worldwide
CONSUMER BUSINESS
CONSOLIDATED OPERATIONS
JOINT VENTURES
LICENSEES
INDUSTRIAL BUSINESS
CONSOLIDATED OPERATIONS
JOINT VENTURES
LICENSEES
MCCORMICK
WORLD HEADQUARTERS –
SPARKS, MARYLAND U.S.A.
LOCATIONS ARE NEW
WITHIN THE LAST FIVE YEARS
From locations around the world, our consumer brands reach nearly 100 countries.Our industrial business provides a wide range of products to multinational restaurantsand food processors. McCormick flavors span the globe.
executive officers
Robert J. Lawless
Chairman of the Board, President & Chief Executive Officer
Paul C. Beard
Vice President – Finance & Treasurer
Francis A. Contino
Executive Vice President – Strategic Planning & Chief Financial Officer
Robert G. Davey
President – Global Industrial Group
H. Grey Goode, Jr.
Vice President – Tax
Kenneth A. Kelly, Jr.
Vice President & Controller
Robert W. Skelton
Senior Vice President, General Counsel & Secretary
Mark T. Timbie
President – International Consumer Products Group
Karen D. Weatherholtz
Senior Vice President – Human Relations
Alan D. Wilson
President – U.S. Consumer Foods
Jeryl Wolfe
Vice President – Supply Chain & Chief Information Officer
”Cardamom reminds meof a zesty grapefruit! I liketo add McCormick groundcardamom to tea for a citrus-like flavor. I also loveto add cardamom to apples,either in pie, applesauce orhealthy, fresh sliced apples.The kids like fresh slicedapples with cinnamon-cardamom-sugar sprinkledon top (1 part cardamom,
2 parts cinnamon, 5 partssugar). Cardamom is one ofmy secret ingredients for agreat apple pie!”

19
In McCormick’s 115-year history, the record ofcommunity service is long and proud.Communities around the world where theCompany has facilities have benefitedfrom a variety of philanthropic activities.Through financial contributions and the activeparticipation of employees, McCormicksupports numerous causes that improve thequality of life.
The Company has a formal programof charitable giving that grants funds to worthwhile causeswith civic, health, welfare, education and the arts receivingthe most attention. Programs like the Unsung HeroesAwards, student scholarships, and Charity Day, whichfosters employee giving to a wide range of civic causes, haveexisted for more than 60 years.
McCormick employees are the backbone ofthe Company’s civic efforts. Around the world, ouremployees devote time and talent to civic causes.Their spirit of volunteerism carries on a legacythat speaks to the very culture of McCormick.The newest chapter to that proud history wasrealized with the creation of the annual McCormickCommunity Service Award in the spring of 2004.The program recognizes those employees whobest exemplify McCormick’s commitment toimprove our communities. The five employeefinalists receive $5,000 for the charity of theirchoice. The 2004 finalists were Maria Teresa AvilaMeneses, of Mexico, Rick Ayers, of Canada andTed Eschmann, Nancy Lawn and Dennis Bayne ofMaryland. The grand-prize winner receives$25,000 to donate to similar charities. The 2004winner was Steve Sausnock of Maryland. As a member of thelocal Optimist Club, Steve distributed the funds to numerouscauses including The Children’s Cancer Campaign, soupkitchens like Our Daily Bread, schools, churches and tosupport firefighters and police.
Steve said, “My job is to see the money go where it isneeded.” Steve’s attitude reflects a commitment tocommunity that runs throughout the entire Company.
M C C O R M I C K & C O M P A N Y 2 0 0 4 A N N U A L R E P O R T
community service
The McCormick Community Service Award was initiated in 2004 to honor
employees who devote time and energy to better their communities. The
grand prize-winner was employee Steve Sausnock, seen receiving the award
from Chairman Bob Lawless (1). On behalf of the Optimist Club, Steve distrib-
uted the $25,000 grant to numerous charities and organizations such as the
Providence (Md.) Volunteer Fire Company (2), “Shop with a Cop” which pairs
needy children with police officers for mentoring (3), and Our Daily Bread
soup kitchen (4). The Community Service Award is the latest chapter in
McCormick’s long history of philanthropy.
1
2
4
3
M C C O R M I C K & C O M P A N Y 2 0 0 4 A N N U A L R E P O R T
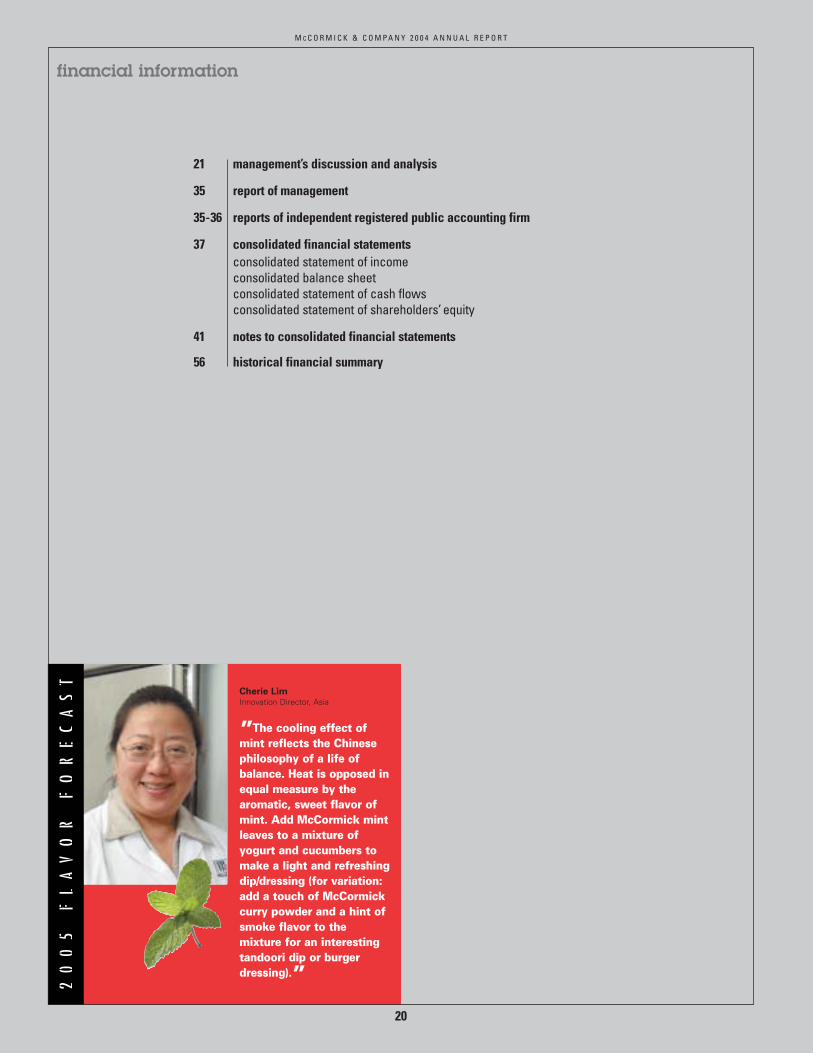
financial information
Cherie LimInnovation Director, Asia
”The cooling effect ofmint reflects the Chinesephilosophy of a life of balance. Heat is opposed inequal measure by the aromatic, sweet flavor ofmint. Add McCormick mintleaves to a mixture ofyogurt and cucumbers tomake a light and refreshingdip/dressing (for variation:add a touch of McCormickcurry powder and a hint ofsmoke flavor to the mixture for an interesting tandoori dip or burgerdressing).”
20
21 management’s discussion and analysis
35 report of management
35-36 reports of independent registered public accounting firm
37 consolidated financial statementsconsolidated statement of incomeconsolidated balance sheetconsolidated statement of cash flowsconsolidated statement of shareholders’ equity
41 notes to consolidated financial statements
56 historical financial summary

M C C O R M I C K & C O M P A N Y 2 0 0 4 A N N U A L R E P O R T
21
management’s discussion and analysis
Executive Summary
Business Overview
McCormick & Co. is a global leader in the manufacture,marketing and distribution of spices, herbs, seasoningsand other flavors to the entire food industry. TheCompany’s major sales, distribution and production facili-ties are located in North America and Europe and its prod-ucts reach nearly 100 countries around the world.Additional facilities are based in Mexico, Central America,Australia, China, Singapore, Thailand and South Africa. In2004, approximately 38% of sales were outside the U.S.
The Company operates in two business segments, con-sumer and industrial. In 2004, the consumer businessaccounted for 53% of sales and the industrial businessaccounted for 47% of sales. Consistent with market con-ditions in each segment, the consumer business has ahigher overall profit margin than the industrial business.
The consumer business supplies a variety of retail out-lets that include grocery, drug, dollar and mass merchan-dise stores. In the U.S., these customers are servicedboth directly and indirectly through food wholesalers. Ininternational markets customers are serviced eitherdirectly or indirectly through distributors. Products for theconsumer segment include spices, herbs, extracts, sea-soning blends, sauces, marinades and specialty foods. In2004, 67% of net sales were in the Americas, 29% inEurope and 4% in the Asia/Pacific region. In its primarymarkets, the Company supplies both branded and privatelabel products and has a leading share that is more thantwice the size of the next largest competitor. TheCompany is growing the consumer business by develop-ing innovative products, increasing marketing effective-ness, expanding distribution and acquiring leading brandsand niche products.
The industrial business supplies both food processorsand the restaurant industry. Restaurant customers are sup-plied both directly and indirectly through distributors andwarehouse club stores. Products for the industrial seg-ment include blended seasonings, spices, herbs, condi-ments, compound flavors and extracts, and coatingsystems. In 2004, 73% of net sales were in the Americas,19% in Europe and 8% in the Asia/Pacific region. TheCompany has many competitors who also supply productsto food processors, as well as restaurants, food service dis-tributors and warehouse clubs. The Company is drivingsales for the industrial business by supporting the globalexpansion of its customers, building current and newstrategic partnerships, and developing consumer-preferredvalue-added products. Through acquisitions, the Companyseeks to expand its flavor solutions globally.
With its consumer and industrial segments, theCompany has the customer base and product develop-ment skills to provide flavor solutions for all types of eatingoccasions, whether it is cooking at home, dining out, pur-chasing a quick service meal or enjoying a snack.
The Company purchases a significant amount of rawmaterials from areas throughout the world. The most signif-icant raw materials are vanilla, cheese, pepper, packagingsupplies, garlic, onion and capsicums. Some of these aresubject to price volatility caused by weather, market condi-tions, growing and harvesting conditions, governmentalactions and other unpredictable factors. While future move-ments of raw material costs are uncertain, the Companyresponds to this volatility in a number of ways includingstrategic raw material purchases, purchases of raw mate-rial for future delivery and customer price adjustments.
Strategy for Growth
The Company’s strategy is to improve margins, invest inthe business and increase sales and profits.
Margins are being improved with new capabilities andprocesses introduced through McCormick’s B2K program,a global initiative that is significantly improving businessprocesses through state-of-the-art technology. UtilizingB2K, employees are improving the supply chain through-out the Company. A goal to reduce costs by $70 millionthrough 2006 was set early in 2004. In 2004, $24 millionin cost savings were realized, comprised of $15 millionof cost of goods sold and $9 million of selling, generaland administrative expense savings. Margins are alsoimproving as higher-margin more value-added productsare introduced. Since 2001, gross profit margin hasincreased a total of 1.9 percentage points.
The Company is investing in areas such as productdevelopment and marketing support to drive sales.Research and development expense and advertisingbehind McCormick’s brands have increased significantlyand consistently since 1999. In 2004, research anddevelopment expense increased 18% and advertisingexpense increased 43%.
The Company’s long-term financial objectives, first set in2002, are to increase annual sales 3-7% and earningsper share 10-12%. With the opportunities to increase margins and the sales initiatives for the consumer andindustrial businesses, the Company expects to continueto achieve these objectives. Early in 2004, an additionalgoal was set to generate $350-$400 million of cash flowfrom operations after dividends and net capital expendi-tures for the three-year period 2004-2006. In 2004, thefirst $206 million of this goal was achieved. With this cash the Company is seeking to acquire businesses and torepurchase shares.

M C C O R M I C K & C O M P A N Y 2 0 0 4 A N N U A L R E P O R T
22
management’s discussion and analysis
Results of Operations – 2004 compared to 2003
for the year ended November 30 (millions except per share data) 2004 2003
Net sales $2,526.2 $2,269.6Gross profit 1,007.9 898.6
Gross profit margin 39.9% 39.6%
Selling, general and administrative expense 677.7 597.6Percentage of sales 26.8% 26.3%
Operating income 332.7 295.5Operating income margin 13.2% 13.0%
Earnings per share fromcontinuing operations – diluted 1.52 1.40
During 2004 and 2003, there were several acquisitionsand divestitures that affected comparability of operatingresults. In November of 2004, the Company acquiredSilvo, the market leader in the Dutch spices and herbsconsumer market. Silvo is expected to generate approxi-mately $50 million in sales in 2005. In June of 2003, theCompany acquired Zatarain’s, the leading U.S. brand ofauthentic New Orleans-style food. In January of 2003,Uniqsauces was acquired, which expanded condiment fla-vors and packaging formats for the Company.
During the third quarter of 2003, the Company sold itspackaging business and the U.K. Jenks brokerage opera-tion. As a result, prior period sales and related expensesfor these discontinued operations were reclassified andreported as “Net income from discontinued operations” inthe consolidated statement of income. The consolidatedbalance sheet and consolidated statement of cash flowswere also reclassified to present separately the assets, lia-bilities and cash flows of the discontinued operations.
For the year ended November 30, 2004, McCormickreported sales from continuing operations of $2.5 billion,an increase of 11.3% above 2003. Sales growth was theresult of a 4.2% volume increase, 3.7% from favorable for-eign exchange rates, 2.2% in the first half of the year fromthe acquisition of Zatarain’s, and a 1.2% increase in pricingand product mix. The acquisition of Silvo on November 1,2004 added $4.5 million in sales in 2004. During 2004, theCompany achieved higher volume with new products,expanded distribution and more effective marketing.
Gross profit margin increased to 39.9% in 2004 from39.6% in 2003. The gross profit margin increase was due tocost reductions achieved in the first year of a three-year $70million cost reduction program began in 2004. Sale of morevalue-added products and pricing actions in our consumerbusiness also improved gross profit margin. Higher costs ofemployee benefits, fuel and a competitive operating envi-
ronment in Europe during 2004 partly offset the gross profitmargin increase.
Selling, general and administrative expenses werehigher in 2004 than 2003 on both a dollar basis and as apercentage of net sales. These increases were primarilydue to increased distribution expenses, higher advertisingexpenses and increased employee benefit costs. Theincrease in distribution expenses was primarily due tohigher fuel costs, as well as freight and warehousing costsassociated with new product introductions, and incre-mental distribution costs related to the acquired Zatarain’sbusiness. The increase in employee benefit costs wasmainly the result of higher pension costs in 2004 comparedto 2003. In the consumer business, advertising expensesincreased in order to launch several new products and tosupport the brand name.
Special charges were a credit of $2.5 million in 2004compared to a charge of $5.5 million in 2003. This changewas primarily due to a net gain of $8.7 million recorded in2004 for funds received from a class action lawsuit thatwas settled in the Company’s favor.
Pension expense was $30.0 million and $22.1 million for the years ended November 30, 2004 and 2003, respec-tively. In connection with the valuation performed at theend of 2003, the discount rate was reduced from 7.0% to6.0% and the expected long-term rate of return on assetswas reduced from 9.0% to 8.5%. These changes alongwith the increased amortization of prior actuarial lossesincreased pension expense in 2004. Pension expense in2005 is expected to increase approximately 6%.
Interest expense from continuing operations increasedby $2.4 million. Higher average debt levels during 2004contributed to this increase, partially offset by repaymentof higher rate long-term debt.
Other income decreased to $2.1 million in 2004 com-pared to $13.1 million in 2003 due to two significant trans-actions recorded in 2003. In 2003, the Company benefitedfrom $5.4 million of interest income received on theDucros purchase price refund and a one-time gain of $5.2million from the sale of an interest in non-strategic royaltyagreements. The Company entered into the non-strategicroyalty agreements in 1995 and since then had benefitedmodestly from tax credits and royalty income.
The effective tax rate was 30.3% in 2004 down from30.9% in 2003. The decrease in the effective tax rate isdue to mix of earnings among the different taxing jurisdic-tions in which the Company operates and the settlementof tax audits for less than amounts previously accrued.Due to the anticipated change in available net operatingloss carryforwards in various jurisdictions and earningsmix, the Company anticipates the tax rate to increase by 1-2% in 2005.

M C C O R M I C K & C O M P A N Y 2 0 0 4 A N N U A L R E P O R T
23
Income from unconsolidated operations decreased11.0% in 2004 when compared to 2003. This decline ismainly attributable to lower income from the Company’sSignature Brands and Japan joint ventures. The SignatureBrands business, a cake decorating business in the U.S.,was impacted by a decline in the overall U.S. cake mix cat-egory. The Company’s retail joint venture in Japan movedits business to a new distributor in 2004 with the objectiveof building sales in this market over time. The joint venturein Japan is currently working through a period of start-upcosts associated with the transition to this new distributoruntil a higher level of sales is achieved. Income from thecompany’s joint venture in Mexico was equal to last year.
Income from continuing operations was $214.5 millionin 2004 compared to $199.2 million in 2003. Diluted earn-ings per share from continuing operations increased$0.12, comprised of $0.18 from higher sales and operatingmargin and a $0.02 benefit from fewer shares outstandingand lower tax rate, offset by a $0.05 decline in otherincome, a $0.02 increase in interest expense and minorityinterest, and a $0.01 decline in income from unconsoli-dated operations.
Consumer Business
for the year ended November 30 (millions) 2004 2003
Net sales $1,339.8 $1,162.3Operating income 269.7 230.9
Operating income margin 20.1% 19.9%
In 2004, sales for the consumer business increased15.3% compared to 2003. Higher volumes added 10.0%to sales, with 4.3% of the volume increase due to theimpact, in the first half of the year, of the Zatarain’s busi-ness. Favorable foreign exchange added 4.3% and posi-tive price and product mix added 1.0%. Sales rose 16.1%in the Americas, with 14.6% of the sales increase fromhigher volume, 0.8% from price and product mix, and0.7% from foreign exchange. New products, more effec-tive marketing and distribution gains drove an 8.1% vol-ume increase, with the remaining 6.5% attributable to theZatarain’s acquisition. Price increases on certain productswere partially offset by the change in mix of products sold.Sales in Europe rose 14.1%, with favorable foreignexchange contributing 11.7%, the Silvo acquisition inNovember 2004 adding 1.3%, and price and product mixadding 1.1%. Excluding the foreign exchange and Silvosales benefits, sales in Europe remained relatively flat.New product and distribution gains were offset by more
intense competitive conditions, particularly in France. Thespice and seasoning category in France was affected byprivate label and economy products, particularly with theexpansion of discount retail chains into this market. Salesin the Asia/Pacific region increased 11.2%, with favorableforeign exchange contributing 10.4% and higher volumeadding 2.7%, partially offset by a 1.9% decline due tounfavorable price and product mix. Volume was affectedby an initiative in China to de-emphasize lower marginproducts. New private label business in Australia con-tributed to an unfavorable price and product mix.
Operating income for the consumer business increased16.8% to $269.7 million, despite a $14.7 million increasein advertising expense. The operating income increasewas driven by strong sales performance, cost reductionefforts and pricing actions. Operating income margin(operating income as a percentage of sales) increasedfrom 19.9% in 2003 to 20.1% in 2004. Cost savings onsupply chain initiatives more than offset increases in fuel,employee benefit, advertising costs, international reorgan-ization costs, as well as the difficult competitive environ-ment in Europe. Special charges in the consumerbusiness decreased to $1.0 million in 2004 from $1.8 mil-lion in 2003. Special charges in the consumer business for2004 consisted of additional costs associated with thefinalization of the production facilities consolidation inCanada. Special charges in the consumer business for2003 consisted of costs associated with the productionfacilities consolidation in Canada and the realignment ofconsumer sales operations in Australia.
As discussed previously, the Company sold its Jenksbrokerage business in the U.K. on July 1, 2003 and accord-ingly, results of this business were classified as discontin-ued operations.
Industrial Business
for the year ended November 30 (millions) 2004 2003
Net sales $1,186.4 $1,107.3Operating income 113.6 108.9
Operating income margin 9.6% 9.8%
For 2004, sales from the industrial business rose 7.1% ascompared to 2003. Higher volumes added 2.7%, favor-able foreign exchange added 3.0% and price and productmix added 1.4%. Sales in the Americas rose 5.7% due toa 4.2% volume increase that was largely driven by sales ofnew products such as coating systems and sales of snackseasonings. Favorable price and product mix contributed1.0% and foreign exchange added another 0.5%.Strength in warehouse club sales also contributed to salesgrowth and more than offset continued weakness in the
M C C O R M I C K & C O M P A N Y 2 0 0 4 A N N U A L R E P O R T
24
management’s discussion and analysis
food service distributor channel. Higher costs for certainraw materials including vanilla, cheese and soy oil werepassed through in higher pricing. In Europe, sales rose12.3% with foreign exchange contributing 12.0% ofincrease. A favorable price and product mix increase of4.2% offset a 3.9% volume decline. A shift in emphasisfrom lower to higher margin products resulted in reducedsales of certain lower margin products. In the Asia/Pacificregion, sales increased 8.8%, with 5.5% of increase fromforeign exchange and 4.3% from higher volume, partiallyoffset by a 1.0% unfavorable price and product mix. Thevolume increase related to higher sales to quick servicerestaurants and of snack seasonings.
Operating income for the industrial business rose 4.3%to $113.6 million, despite a $6.1 million increase inresearch and development costs. Operating income margin was 9.6% in 2004 down from 9.8% in 2003.Increases in operating margin due to emphasis on morevalue-added, higher margin products and cost reductionefforts were more than offset by certain cost increases. Inthe fourth quarter of 2004, a $6.2 million adjustment,which arose in prior quarters, was recorded after theCompany identified and corrected the operational account-ing at an industrial plant in Scotland. Higher fuel,employee benefit costs and special charges as well asinternational reorganization costs also contributed to thedecline. Special charges in the industrial businessincreased to $3.0 million in 2004 from $2.3 million in 2003.Special charges in the industrial business for 2004 con-sisted of additional costs associated with the consolida-tion of production facilities in Canada and additional costsrelated to the consolidation of manufacturing facilities inthe U.K. Special charges in the industrial business for2003 consisted of costs associated with the consolidationof production facilities in Canada and severance and othercosts related to the consolidation of industrial manufactur-ing in the U.K.
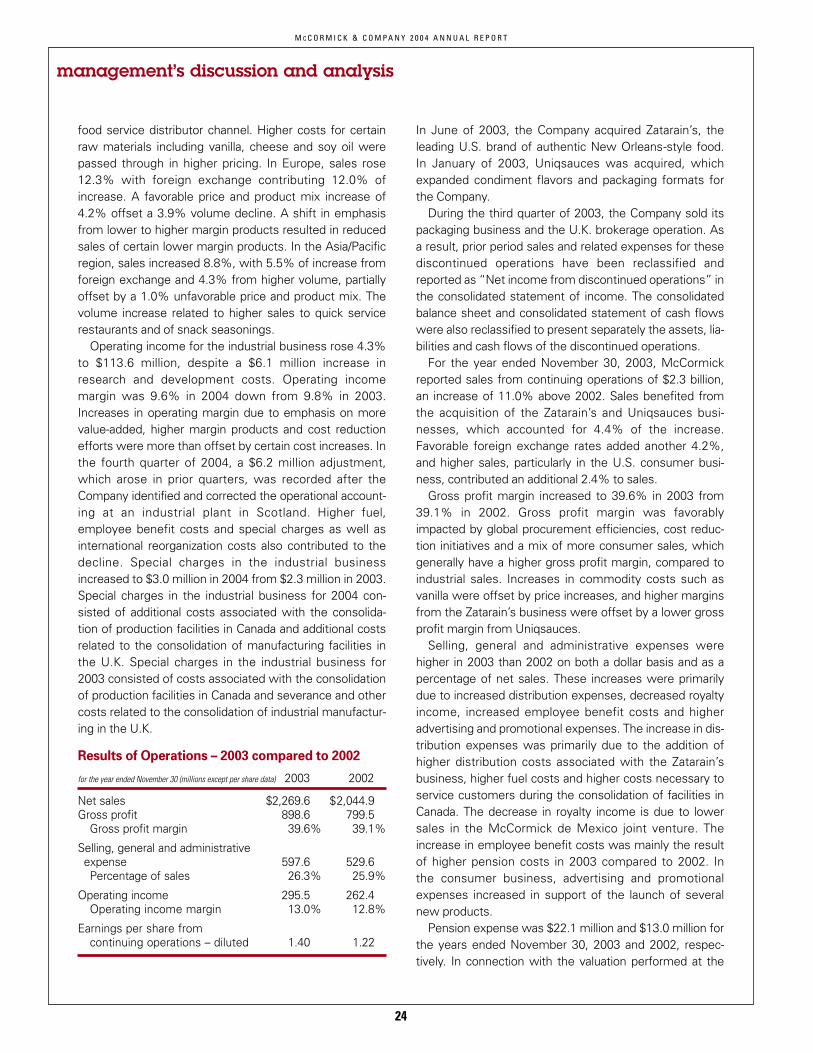
Results of Operations – 2003 compared to 2002
for the year ended November 30 (millions except per share data) 2003 2002
Net sales $2,269.6 $2,044.9Gross profit 898.6 799.5
Gross profit margin 39.6% 39.1%
Selling, general and administrative expense 597.6 529.6Percentage of sales 26.3% 25.9%
Operating income 295.5 262.4Operating income margin 13.0% 12.8%
Earnings per share fromcontinuing operations – diluted 1.40 1.22
In June of 2003, the Company acquired Zatarain’s, theleading U.S. brand of authentic New Orleans-style food.In January of 2003, Uniqsauces was acquired, whichexpanded condiment flavors and packaging formats forthe Company.
During the third quarter of 2003, the Company sold itspackaging business and the U.K. brokerage operation. Asa result, prior period sales and related expenses for thesediscontinued operations have been reclassified andreported as “Net income from discontinued operations” inthe consolidated statement of income. The consolidatedbalance sheet and consolidated statement of cash flowswere also reclassified to present separately the assets, lia-bilities and cash flows of the discontinued operations.
For the year ended November 30, 2003, McCormickreported sales from continuing operations of $2.3 billion,an increase of 11.0% above 2002. Sales benefited fromthe acquisition of the Zatarain’s and Uniqsauces busi-nesses, which accounted for 4.4% of the increase.Favorable foreign exchange rates added another 4.2%,and higher sales, particularly in the U.S. consumer busi-ness, contributed an additional 2.4% to sales.
Gross profit margin increased to 39.6% in 2003 from39.1% in 2002. Gross profit margin was favorablyimpacted by global procurement efficiencies, cost reduc-tion initiatives and a mix of more consumer sales, whichgenerally have a higher gross profit margin, compared toindustrial sales. Increases in commodity costs such asvanilla were offset by price increases, and higher marginsfrom the Zatarain’s business were offset by a lower grossprofit margin from Uniqsauces.
Selling, general and administrative expenses werehigher in 2003 than 2002 on both a dollar basis and as apercentage of net sales. These increases were primarilydue to increased distribution expenses, decreased royaltyincome, increased employee benefit costs and higheradvertising and promotional expenses. The increase in dis-tribution expenses was primarily due to the addition ofhigher distribution costs associated with the Zatarain’sbusiness, higher fuel costs and higher costs necessary toservice customers during the consolidation of facilities inCanada. The decrease in royalty income is due to lowersales in the McCormick de Mexico joint venture. Theincrease in employee benefit costs was mainly the resultof higher pension costs in 2003 compared to 2002. In the consumer business, advertising and promotionalexpenses increased in support of the launch of severalnew products.
Pension expense was $22.1 million and $13.0 million forthe years ended November 30, 2003 and 2002, respec-tively. In connection with the valuation performed at the

M C C O R M I C K & C O M P A N Y 2 0 0 4 A N N U A L R E P O R T
25
end of 2003, the discount rate was reduced from 7.0% to6.0% and the expected long-term rate of return on assetswas reduced from 9.0% to 8.5%. These changes werereflective of poor market returns in recent years and a con-tinued low interest rate environment. The changes inassumptions along with investment returns below theassumed rate resulted in the increased pension expense in2003 and will continue to impact expense going forward.
Interest expense from continuing operations decreasedin 2003 versus 2002 due to favorable interest rates.
Other income increased to $13.1 million in 2003 com-pared to $0.7 million in 2002. In the second quarter of2003, the Company received $5.4 million of interestincome on the Ducros purchase price refund. Also, in thefourth quarter of 2003, the Company recorded a one-timegain of $5.2 million from the sale of an interest in non-strategic royalty agreements. The Company entered intothese agreements in 1995 and since then had benefitedmodestly from tax credits and royalty income.
The effective tax rate for 2003 was 30.9%, down from31.0% in 2002.
Income from unconsolidated operations decreased26.8% in 2003 when compared to 2002. This decline ismainly attributable to lower income from the McCormickde Mexico joint venture during the first half of 2003 and toa lesser extent, the Signature Brands joint venture in thefourth quarter of 2003. The McCormick de Mexico busi-ness, which markets the leading brand of mayonnaise inMexico, experienced profit pressure from aggressive com-petition, higher raw material costs and a weak peso versusthe prior year. The Signature Brands business, a cake deco-rating business in the U.S., was impacted in part by thetiming of customers’ purchases of holiday products.
Income from continuing operations was $199.2 millionin 2003 compared to $173.8 million in 2002. Diluted earn-ings per share from continuing operations increased$0.18, comprised of $0.12 from higher sales and operatingmargin, $0.04 from acquisitions and $0.06 from otherincome, offset by a $0.04 decline in income from uncon-solidated operations.
Income from discontinued operations was $4.7 million in2003 compared to $6.0 million in 2002. Income from dis-continued operations for 2003 included 7 months of theoperating results of Jenks and 8 1/2 months of the operat-ing results of Packaging. Also included in discontinued oper-ations in 2003 was a net gain on the sale of discontinuedoperations of $9.0 million. This consisted of the gain on the
sale of Packaging of $11.6 million partially offset by the losson the sale of Jenks of $2.6 million. All amounts included indiscontinued operations were net of income taxes.
In the fourth quarter of 2003, the Company recorded acumulative effect of an accounting change that reducednet income by $2.1 million, net of tax. This charge wasrecorded in accordance with the adoption of certain provi-sions of a new accounting interpretation that required theconsolidation of the lessor of a leased distribution center.Previously, this entity was not consolidated and the distri-bution center was accounted for as an operating lease.Consolidation of this entity increased fixed assets by$11.2 million, long-term debt by $14.0 million and minorityinterest by $0.5 million. The effect of consolidation of thisentity in prior years would have reduced net income in2002 and 2001 by $0.3 million.
Consumer Business
for the year ended November 30 (millions) 2003 2002
Net sales $1,162.3 $993.9Operating income 230.9 191.9
Operating income margin 19.9% 19.3%
In 2003, sales from continuing operations for the con-sumer business increased 16.9% compared to 2002. Theacquisitions of Zatarain’s and Uniqsauces contributed6.3% of the sales increase, and the impact of foreignexchange added another 5.8%. Sales rose 15.3% in theAmericas, with Zatarain’s contributing 7.1% of salesincrease and foreign exchange contributing 0.9% ofincrease. The remaining 7.3% of sales increase was dueprimarily to higher volumes in the U.S. and Canada. In2003, the Company achieved new distribution in the dollarstore channel and with a major grocery retailer in the U.S.Sales in Europe rose 21.7%, with foreign exchange con-tributing 16.9% of increase, and the remaining increasedue to the acquisition of Uniqsauces. Sales in theAsia/Pacific region increased 12.3%, with foreignexchange contributing 11.7% of the increase. Sales in thisregion were adversely affected by competitive conditionsin Australia and an initiative to discontinue certain lowermargin products in China.
Operating income from continuing operations for theconsumer business reached $230.9 million, an increase of20.3%. Operating income margin (operating income as apercentage of sales) went up from 19.3% in 2002 to19.9% in 2003. Pricing actions and cost savings on supplychain initiatives more than offset higher expenses of pen-sion, promotion and advertising, distribution and certaincommodities. Special charges in the consumer business

M C C O R M I C K & C O M P A N Y 2 0 0 4 A N N U A L R E P O R T
26
management’s discussion and analysis
decreased to $1.8 million in 2003 from $2.7 million in2002. Special charges in the consumer business for 2003consisted of additional costs associated with the consoli-dation of production facilities in Canada and the realign-ment of consumer sales operations in Australia. Specialcharges in the consumer business for 2002 primarily con-sisted of severance, lease exit and relocation costs relatedto the workforce reduction and realignment of consumersales operations in the U.S.
The Company sold its Jenks brokerage business in theU.K. on July 1, 2003 and accordingly, results of this busi-ness were reclassified from the consumer segment todiscontinued operations.
Industrial Business
for the year ended November 30 (millions) 2003 2002
Net sales $1,107.3 $1,051.0Operating income 108.9 107.3
Operating income margin 9.8% 10.2%
For the fiscal year 2003, sales from the industrial businessrose 5.4% as compared to 2002. The acquisition ofUniqsauces contributed 2.7% of sales increase and for-eign exchange added another 2.6%. Sales rose 0.4% inthe Americas, with foreign exchange contributing 0.5% ofthe increase. In the Americas, the restaurant industry wasaffected by a slowdown in consumer traffic in 2003. Whilethis adversely affected the Company’s sales to food serv-ice distributors, direct sales to restaurant chains hadstrong growth resulting from successful new productsand customer promotions of existing products. Sales tofood processors were largely affected by lower pricing inresponse to a decrease in raw material costs, particularlyfor snack food seasonings. In Europe, sales rose 27.9%with Uniqsauces contributing 17.7% of increase and for-eign exchange contributing 12.0% of increase. Theremaining decrease of 0.5% was due to lower demand forseasoning products, which more than offset strong condi-ment sales. In the Asia/Pacific region, sales increased11.9%, with 5.9% of increase from foreign exchange and6.0% from higher volume.
Operating income from continuing operations for theindustrial business rose 1.5% to $108.9 million. Operatingincome margin was 9.8% in 2003 compared to 10.2% in2002. The operating income increase was generally in linewith the sales increase, excluding the Uniqsauces acquisi-tion. This acquisition was strategically made for its condi-ment production facility and certain of its customerrelationships. In the industrial segment, commodity costincreases and decreases are generally offset by pricingactions. However, in 2003 vanilla had a negative effect on
operating income due to significant volatility in this com-modity. The savings on supply chain initiatives were offsetby cost increases in pension and other benefit costs.Special charges in the industrial business increased to $2.3million in 2003 from $1.8 million in 2002. Special charges inthe industrial business for 2003 consisted of additionalcosts associated with the consolidation of production facili-ties in Canada and severance and other costs related to theconsolidation of industrial manufacturing in the U.K. Specialcharges in the industrial business for 2002 primarily con-sisted of further severance and other costs related to theworkforce reduction initiated in 2001 and further costsrelated to the closure of a U.S. distribution center.
Financial Condition
Strong cash flows from operations enabled the Companyto fund operating projects and investments that aredesigned to meet the Company’s growth objectives, tomake strategic acquisitions and to repurchase stock.
In the consolidated statement of cash flows, thechanges in operating assets and liabilities are presentedexcluding the effects of changes in foreign currencyexchange rates, as these do not reflect actual cash flows.Accordingly, the amounts in the consolidated statement ofcash flows do not agree with changes in the operatingassets and liabilities that are presented in the consolidatedbalance sheet. In addition, the net cash flows from operat-ing, investing and financing activities are presentedexcluding the effects of discontinued operations.
In the consolidated statement of cash flows, net cashprovided by continuing operating activities was $349.5 mil-lion in 2004 compared to $201.8 million in 2003 and $208.6million in 2002. The significant increase in operating cashflow in 2004 is primarily the result of a reduction in inven-tory in 2004 as compared to 2003 when inventoryincreased, an increase in other liabilities in 2004 comparedto a decrease in 2003 and the benefit of higher net incomefrom continuing operations. These favorable cash flowswere partially offset by increases in accounts receivablewhich are in line with increases in sales. The higher inven-tory in 2003 was due to the Company’s strategic decisionto purchase vanilla beans in order to ensure an ongoingsupply and manage the cost for this raw material. TheCompany decreased its vanilla bean inventory by $28 mil-lion in 2004 in anticipation of lower cost beans in 2005. Theincrease in other assets and liabilities in 2004 compared toa decrease in 2003 was due to the timing of liability pay-ments and a higher tax benefit on the exercise of stockoptions in 2004 compared to 2003. The Company gener-ally receives a tax deduction on the exercise of stock

M C C O R M I C K & C O M P A N Y 2 0 0 4 A N N U A L R E P O R T
27
options. These deductions increased in 2004, due to theincrease in both stock price and the exercise of stockoptions. When 2003 is compared with 2002, the major useof funds was the increase in inventory due to the purchaseof vanilla beans. The timing of liability payments con-tributed to the decrease in other liabilities in 2003.
Net cash used in continuing investing activities was$141.5 million in 2004 versus $100.7 million in 2003 and$95.3 million in 2002. Net capital expenditures (capitalexpenditures less proceeds from the sale of fixed assets)were $67.0 million in 2004, $81.7 million in 2003 and$93.9 million in 2002. The decrease over the three yearperiod is mainly due to lower B2K spending as 2002 wasthe peak year of software development expenditures. Netcapital expenditures in 2005 are expected to be higherthan in 2004 as the Company prepares for the B2K launchin Europe. Cash paid to acquire Silvo during 2004 was$74.5 million. Cash paid for the acquisitions of theZatarain’s and Uniqsauces businesses during 2003 was$202.9 million. Cash received from the sale of thePackaging and Jenks businesses during 2003 was $133.9million. The Company also received $55.4 million during2003 from the Ducros purchase price adjustment, ofwhich, $5.4 million represented interest and was includedin net cash flows from continuing operating activities.
Net cash used in continuing financing activities was$178.4 million in 2004, $137.7 million in 2003 and $114.9million in 2002. The Company’s total borrowings increased$19.3 million in 2004, compared to an increase of $16.4million in 2003 and a decrease of $74.4 million in 2002. Inthe second quarter of 2004, the Company issued a total of$50 million in medium-term notes under its existing $375million shelf registration. The $50 million of medium-termnotes mature on April 15, 2009 and pay interest semi-annually at a rate of 3.35%. The proceeds of this issuancewere used to pay down short-term debt. In 2004, theCompany purchased 5.1 million shares of common stockfor $173.8 million under its share repurchase programsversus 4.5 million shares of common stock for $119.5 mil-lion in 2003. In the second quarter of 2004, the Companycompleted its $250 million share repurchase authorizationand began to buy against its $300 million authorizationapproved by the Board of Directors in September 2003.As of November 30, 2004, $147.7 million remained underthe $300 million share repurchase program. Without sig-nificant acquisition activity, the Company expects this pro-gram to extend into 2006. The common stock issued in2004, 2003 and 2002 relates to the Company’s stock com-pensation plans.
Dividend payments increased to $76.9 million in 2004,up 20.0% compared to $64.1 million in 2003. Dividends
paid in 2004 totaled $0.56 per share, up from $0.46 pershare in 2003. In November 2004, the Board of Directorsapproved a 14.3% increase in the quarterly dividend from$0.14 to $0.16 per share. Over the last 5 years, dividendsper share have risen at a compounded annual rate of 9.9%.
The Company’s pension plans had a shortfall of planassets over accumulated benefit obligations at their 2004and 2003 measurement dates of $162.8 million and$166.6 million, respectively. These shortfalls were due tothe continued low interest rate environment and lowerthan assumed asset returns in 2001 and 2002. However,the shortfall decreased in 2004. As a result, the Companyrecorded a reduction in the minimum pension liabilitythrough a credit of $7.2 million ($4.4 million net of tax) toother comprehensive income in 2004. This compares toan increase in minimum pension liability recorded througha charge of $20.6 million ($14.4 million net of tax) to othercomprehensive income in 2003. Cash payments to pen-sion plans were $30.6 million in 2004, $27.2 million in2003 and $25.2 million in 2002. The Company plans tomake 2005 pension plan contributions similar to thosemade in 2004. Future increases or decreases in pensionliabilities and required cash contributions are highlydependent on changes in interest rates and the actualreturn on plan assets. The Company bases its investmentof plan assets, in part, on the duration of each plan’s liabili-ties. Across all plans, 68% of assets are invested in equi-ties and 32% in fixed income investments.
The Company’s ratio of debt-to-total-capital (total capitalincludes debt, minority interest and shareholders’ equity)was 40.9% as of November 30, 2004, a decrease from44.4% at November 30, 2003 and below the Company’starget range of 45-55%. The decrease was primarily theresult of an increase in shareholders’ equity. Foreign cur-rency had the effect of increasing shareholders’ equityand accordingly, decreased the ratio of debt-to-total-capi-tal by 2.6% in 2004. In June 2004, S&P raised theCompany’s short-term corporate credit and commercialpaper ratings to”A-1” from “A-2” and long-term corporatecredit and senior unsecured debt ratings to“A” from “A-”.During the year, the level of the Company’s short-termdebt varies. However, it is usually lower at the end of theyear. The average short-term borrowings outstanding forthe year ended November 30, 2004 and 2003 were$295.2 million and $287.6 million, respectively.
The reported values of the Company’s assets and liabili-ties held in its non-U.S. subsidiaries and affiliates havebeen significantly affected by fluctuations in foreignexchange rates between periods. During the year endedNovember 30, 2004, the exchange rates for the Euro,

M C C O R M I C K & C O M P A N Y 2 0 0 4 A N N U A L R E P O R T
28
management’s discussion and analysis
British pound sterling, Canadian dollar and Australian dollarwere substantially higher versus the U.S. dollar than in2003. Exchange rate fluctuations resulted in an increase inaccounts receivable of $21 million, inventory of $14 million,goodwill of $51 million and other comprehensive incomeof approximately $93 million since November 30, 2003.
The Company has available credit facilities with domes-tic and foreign banks for various purposes. The amount ofunused credit facilities at November 30, 2004 was $466.1million. Management believes that internally generatedfunds and the Company’s existing sources of liquidityunder its credit facilities are sufficient to meet currentliquidity needs and longer-term financing requirements. Ifthe Company were to undertake an acquisition thatrequires funds in excess of its existing sources of liquidity,it would look to sources of funding from additional creditfacilities or equity issuances.
Acquisitions
On November 1, 2004, the Company purchased C.M. vanSillevoldt B.V. (Silvo), the market leader in the Dutchspices and herbs consumer market, for €58 million in cash(equivalent to $74.5 million) funded with cash from opera-tions and current credit facilities. Silvo sells spices, herbsand seasonings under the Silvo brand in the Netherlandsand the India brand as well as private label store brands inBelgium. The brand has a strong heritage and high recog-nition among consumers in the Netherlands. The acquisi-tion is consistent with the Company’s strategy to acquireestablished brands to complement the Company’s leader-ship position in the development and marketing of flavorsfor food. The business is achieving growth through innova-tive products and packaging with a focus on convenience,quality, and ethnic flavors. The acquisition was accountedfor under the purchase method, and the results of opera-tions have been included in the Company’s consolidatedresults from the date of acquisition. The excess of the pur-chase price over the estimated fair value of the tangiblenet assets purchased was $59.4 million and is classifiedas goodwill in the consumer segment. The allocation ofthe purchase price is based on preliminary estimates, sub-ject to revision, after asset values have been finalized.Revisions to the allocation, which may be significant, willbe reported as changes to various assets and liabilities.The Company does not anticipate significant amounts tobe allocated to amortizable intangible assets and, there-fore, the amount of intangible asset amortization is notexpected to be material to the results of operations infuture periods.
In the second quarter of 2004, the Company completedthe purchase price allocation for the Zatarain’s acquisition.
The excess of the purchase price over the estimated fairvalue of the net assets purchased was $176.2 million,which includes $3.4 million of fees directly related to theacquisition. An analysis of the various types of intangibleassets resulted in a determination that the excess pur-chase price should be classified as the value of theacquired brand name and goodwill. No other intangibleassets were identified as a result of this analysis. TheCompany has concluded that a substantial portion of thevalue of the excess purchase price resides in consumertrust and recognition of the Zatarain’s brand name asauthentic New Orleans-style cuisine. As a result, theCompany has assigned $106.4 million of the excess pur-chase price to this unamortizable brand based on ananalysis of the premium value that is derived from con-sumer loyalty and trust in the brands’ quality. Zatarain’sbrand name has been used since 1889, and the Companyintends to use and support the brand name indefinitely.The Company will review this intangible asset for impair-ment annually using the discounted cash flow method.The remaining $69.8 million of intangible assets were allo-cated to goodwill in the consumer segment.
Beyond 2000
Late in 1999, the Company initiated the B2K program as aglobal program of business process improvement. B2K isdesigned to re-engineer transactional processes,strengthen the product development process, extend col-laborative processes with trading partners, optimize thesupply chain and generally enhance the Company’s capabil-ities to increase sales and profit. An integral part of B2K isthe design and implementation of an enterprise wide state-of-the-art technology and information system platform.
In 2002, the Company implemented the initial phase ofits B2K program and began using the new state-of-the-arttechnology and processes in a significant portion of U.S.operations, including its largest consumer operating unit.The rollout of B2K to the U.S. industrial operations wascompleted in 2004. The Company plans to rollout B2K toits international operations by 2006. The Company willcontinue to integrate and optimize all of its businessesthrough broader access to information and increased col-laboration with its trading partners. Through B2K,employee time devoted to transaction execution will bereduced and more time will be devoted to the growth andeffectiveness of the business.
Overall levels of capital spending and expense haveincreased from historical levels to support the B2K effort.To date, $120 million of costs associated with B2K havebeen capitalized and $33 million has been expensed.

M C C O R M I C K & C O M P A N Y 2 0 0 4 A N N U A L R E P O R T
29
Additional capital spending of approximately $25 million andan additional expense of approximately $15 million is antici-pated under this program. Capital costs under the B2K pro-gram are for computer hardware, software and softwaredevelopment and are reflected in property, plant and equip-ment in the consolidated balance sheet. Costs expensedunder the B2K program include costs of business re-engi-neering, data conversion and training and are reflected inboth cost of sales and selling, general and administrativeexpense in the consolidated statement of income.
Special Charges
In 2001, McCormick adopted a plan to further streamlineits operations. This plan, adopted during the fourth quarterof 2001, included the consolidation of several distributionand manufacturing locations, the reduction of administra-tive and manufacturing positions, and the reorganization ofseveral joint ventures. The estimated cost of the total planis approximately $32.6 million ($25.6 million after-tax). Totalcash expenditures in connection with these costs approxi-mates $16.7 million, which is funded through internallygenerated funds. The remaining $15.9 million of costsassociated with the plan consist of write-offs of assets.The total cost of the plan includes $1.8 million of specialcharges related to Packaging and Jenks that have beenclassified as income from discontinued operations in theconsolidated statement of income. Annualized cash sav-ings from the plan are expected to be approximately $8.0million ($5.3 million after-tax), most of which have beenrealized to date. Savings under the plan are being used forspending on initiatives such as brand support and supplychain management. These savings are included within thecost of goods sold and selling, general and administrativeexpenses in the consolidated statement of income.
In 2001, the Company recorded $11.2 million ($7.4 mil-lion after-tax) of charges from continuing operations asso-ciated with the 2001 restructuring plan. Of this amount,$10.3 million was classified as special charges and $0.9million as cost of goods sold in the consolidated state-ment of income. These charges related to the consolida-tion of manufacturing in Canada, a distribution centerconsolidation in the U.S., a product line elimination and arealignment of the Company’s sales operations in theU.K., and a workforce reduction which encompassesplans in all segments and across all geographic areas.
During the year ended November 30, 2002, theCompany recorded $7.5 million ($5.5 million after-tax) ofspecial charges associated with the 2001 restructuringplan, which could not be accrued at the time of the originalannouncement in 2001. These charges included the write-off of an investment in an industry purchasing consortium,
further costs of lease exit and relocation costs related tothe workforce reduction and realignment of consumersales operations in the U.S. and further severance andother costs related to the previously discussed workforcereduction. Also included in the 2002 charges were furthercosts related to the closure of a U.S. distribution centerand further costs of the consolidation of manufacturing inCanada which included the disposition of a manufacturingfacility. During 2002, total cash expenditures in connectionwith the plan were $6.3 million. The major components ofthe 2002 special charges include charges for employeetermination benefits of $3.3 million, asset write-downs of$3.3 million, and other related exit costs of $0.9 million.
During the year ended November 30, 2003, theCompany recorded special charges related to continuingoperations of $5.5 million ($3.6 million after-tax). The costsrecorded in 2003 included additional costs associated withthe consolidation of production facilities in Canada, net ofa gain on the sale of a manufacturing facility, severanceand other costs related to the consolidation of industrialmanufacturing in the U.K. and the realignment of theCompany’s consumer sales operations in Australia. During2003, total cash expenditures in connection with the planwere $4.7 million. The major components of the 2003special charges include charges for employee terminationbenefits of $4.7 million, gain on the sale of assets of $(0.6)million, and other related exit costs of $1.4 million.
During the year ended November 30, 2004, theCompany recorded special charges related to continuingoperations of $6.2 million ($4.3 million after-tax). The costsrecorded in 2004 primarily include costs related to the con-solidation of industrial manufacturing facilities in the U.K.and Canada, the reorganization of a consumer jointventure and additional severance costs for position elimi-nations. During 2004, total cash expenditures in connec-tion with the plan were $4.7 million. Also included inspecial charges/(credits) is a net gain of $8.7 million ($5.5million after-tax) related to funds received from a classaction lawsuit that was settled in the Company’s favor inthe second quarter of 2004. This matter dated back to1999 when a number of class action lawsuits were filedagainst manufacturers and sellers of various flavorenhancers for their violation of antitrust laws. TheCompany, as a purchaser of such products, participated asa member of the plaintiff class. In the second quarter of2004, the Company received $11.1 million as a settlementof this claim and as a result of the settlement, wasrequired to settle claims against the Company for a portionof this gross amount. The net gain recorded was $8.7 mil-lion. This amount was recorded as a special credit andwas not allocated to the business segments.
M C C O R M I C K & C O M P A N Y 2 0 0 4 A N N U A L R E P O R T
30
management’s discussion and analysis
Costs yet to be incurred from the 2001 restructuringplan include the possible reorganization of a joint ventureand completion of the reorganization of certain industrialmanufacturing facilities in the U.K. These actions areexpected to be completed in 2005. The total 2001 restruc-turing plan includes severance charges for 392 positionreductions. As of November 30, 2004, 389 of the 392planned position reductions had taken place.
Refer to note 4 of the notes to consolidated financialstatements for further information.
Discontinued Operations
On August 12, 2003, the Company completed the sale ofsubstantially all the operating assets of its packaging seg-ment (Packaging) to the Kerr Group, Inc. Packaging manu-factured certain products used for packaging theCompany’s spices and seasonings as well as packagingproducts used by manufacturers in the vitamin, drug andpersonal care industries. Under the terms of the saleagreement, Packaging was sold for $132.5 million in cashand possible additional future payments over five yearscontingent on the buyer meeting certain performanceobjectives. At the end of the first year of such possible con-tingent payment periods, no additional payment was duefrom the buyer for that year. The proceeds were used topay off a substantial portion of the commercial paper bor-rowing related to the Zatarain’s acquisition in 2003.The finalpurchase price is also subject to other contingenciesrelated to the performance of certain customer contractswhich could result in a decrease in the sale price. TheCompany recorded a net gain on the sale of Packaging of$11.6 million (net of income taxes of $7.9 million) in thethird quarter of 2003. Included in this gain was a net pen-sion and postretirement curtailment gain of $3.3 millionand the write-off of goodwill of $0.7 million. The contingentconsideration, if any, associated with the sale of Packagingwill be recognized in the future as an adjustment to thegain based on the performance criteria established. TheCompany also entered into a multi-year, market pricedagreement with the acquirer to purchase certain packagingproducts.
On July 1, 2003 the Company sold the assets of JenksSales Brokers (Jenks), a division of the Company’s wholly-owned U.K. subsidiary, to Jenks’ senior management for$5.8 million in cash. Jenks provided sales and distributionservices for other consumer product companies and waspreviously reported as a part of the Company’s consumersegment. The Company recorded a net loss on the sale of
Jenks of $2.6 million (net of an income tax benefit of $0.6million) in the third quarter of 2003. Included in this loss isa write-off of goodwill of $0.4 million.
The operating results of Packaging and Jenks wereclassified as “Income from discontinued operations, net”in the consolidated statement of income. Jenks was pre-viously included in the Company’s consumer segment,and Packaging was previously reported as a separate seg-ment. Certain fixed overhead charges previously allo-cated to Packaging have been reallocated to the otherbusiness segments. The cash flows of Packaging andJenks were reported as “Net cash (used in)/provided bydiscontinued operations” in the consolidated statementof cash flows.
Market Risk Sensitivity
The Company utilizes derivative financial instruments toenhance its ability to manage risk, including foreignexchange and interest rate exposures, which exist as partof its ongoing business operations. The Company doesnot enter into contracts for trading purposes, nor is it aparty to any leveraged derivative instrument. The use ofderivative financial instruments is monitored through regu-lar communication with senior management and the uti-lization of written guidelines. The information presentedbelow should be read in conjunction with notes 7 and 8 ofthe notes to consolidated financial statements.
Foreign Exchange Risk – The Company is exposed tofluctuations in foreign currency in the following mainareas: cash flows related to raw material purchases; thetranslation of foreign currency earnings to U.S. dollars; thevalue of foreign currency investments in subsidiaries andunconsolidated affiliates and cash flows related to repatri-ation of these investments. Primary exposures include theU.S. dollar versus functional currencies of the Company’smajor markets (Euro, British pound sterling, Australian dol-lar, Canadian dollar, Mexican peso, Japanese yen, andChinese renminbi). The Company enters into foreign cur-rency exchange contracts to facilitate managing foreigncurrency risk.
The following table summarizes the foreign currencyexchange contracts held at November 30, 2004. All con-tracts are valued in U.S. dollars using year-end 2004exchange rates and have been designated as hedges offoreign currency transactional exposures, firm commit-ments or anticipated transactions, all with a maturityperiod of less than one year.

M C C O R M I C K & C O M P A N Y 2 0 0 4 A N N U A L R E P O R T
31
Foreign Currency Exchange Contracts
AverageNotional contractual Fair
Currency value exchange rate valueCurrency sold received (millions) (USD/fc) (millions)
Euro USD $10.9 1.23 $ (.8)
British pound sterling USD 7.8 1.80 (.4)
Canadian dollar USD 29.9 .78 (2.5)
The Company has a number of smaller contracts with an aggregate notional value of $2.5 million to purchase or sell various other currencies, such as the Australiandollar, Japanese yen, and South African rand as of November 30, 2004. The aggregate fair value of these contracts was $(0.2) million at November 30, 2004.
At November 30, 2003, the Company had foreign currency exchange contracts for the Euro, British pound sterling, Canadian dollar, Australian dollar, Japanese yen andSouth African rand with a notional value of $58.9 million, all of which matured in 2004. The fair value of these contracts was $(1.7) million at November 30, 2003.
Contracts with durations which are less than 5 days and used for short-term cash flow funding within the Company are not included in the notes or table above.
Year of Maturity at November 30, 2004
(millions) 2005 2006 2007 2008 Thereafter Total Fair value
Debt
Fixed rate $ 32.5 $ 196.1 $ .3 $ 149.9 $ 104.4 $ 483.2 $ 523.5
Average interest rate 5.95% 7.33% – 7.69% 4.2%
Variable rate $ 140.7 – – – $ 14.3 $ 155.0 $ 155.0
Average interest rate 2.13% 2.43%
Year of Maturity at November 30, 2003
(millions) 2004 2005 2006 2007 Thereafter Total Fair value
Debt
Fixed rate $ 16.3 $ 32.3 $ 196.4 $ .3 $ 205.4 $ 450.7 $ 508.5
Average interest rate 7.00% 7.10% 7.42% – 7.53%
Variable rate $ 154.7 $ 14.2 – – – $ 168.9 $ 168.9
Average interest rate 1.52% 1.59%
Note: The table above displays the debt by the terms of the original debt instrument without consideration of interest rate swaps. These swaps have the followingeffects. The variable interest rate on $75 million of commercial paper is hedged by interest rate swaps through 2011. Net interest payments on the $75 million will befixed at 6.35% during this period. Interest rate swaps, settled upon the issuance of the medium-term notes maturing in 2006 and 2008, effectively fixed the interestrate on $294 million of the notes at a weighted-average fixed rate of 7.62%. The fixed interest rate on $100 million of the 6.4% medium-term notes due in 2006 iseffectively converted to a variable rate by interest rate swaps through 2006. Net interest payments on these notes are based on LIBOR plus 3.595% during this period. The fixed interest rate on $50 million of 3.35% medium-term notes due in 2009 is effectively converted to a variable rate by interest rate swaps through 2009.Net interest payments are based on LIBOR minus .21% during this period.
During 2004, the foreign currency translation compo-nent in other comprehensive income was principallyrelated to the impact of exchange rate fluctuations on theCompany’s net investments in France, the U.K., Canada,and Australia. The Company did not hedge its net invest-ments in subsidiaries and unconsolidated affiliates in2004, 2003, or 2002.
Interest Rate Risk – The Company’s policy is to man-age interest rate risk by entering into both fixed and variable rate debt. The Company also uses interest rate
swaps to minimize worldwide financing costs and toachieve a desired mix of its fixed and variable rate debt.The table that follows provides principal cash flows andrelated interest rates, excluding the effect of interestrate swaps, by fiscal year of maturity at November 30,2004 and 2003. For foreign currency-denominated debt,the information is presented in U.S. dollar equivalents.Variable interest rates are based on the weighted-average rates of the portfolio at the end of the year presented.

M C C O R M I C K & C O M P A N Y 2 0 0 4 A N N U A L R E P O R T
32
management’s discussion and analysis
Contractual Cash Obligations Due by Year
Less Morethan 1 1-3 3-5 than 5
(millions) Total year years years years
Notes payable $ 140.2 $ 140.2 – – –
Long-term debt 498.0 33.0 $ 196.4 $ 198.9 $ 69.7
Operating leases 58.8 13.9 19.2 11.1 14.6
Interest payments 166.2 35.4 42.8 19.0 69.0
Raw material purchase obligations (a) 91.6 91.6 – – –
Other purchase obligations (b) 7.4 7.4 – – –
Total contractual cash obligations $ 962.2 $ 321.5 $ 258.4 $ 229.0 $ 153.3
(a) Raw material purchase obligations outstanding as of year-end may not be indicative of outstanding obligations throughout the year due to the Company’s responseto varying raw material cycles.
(b) Other purchase obligations primarily consist of advertising media commitments.
Note: In 2005, the Company’s pension and postretirement funding is expected to be approximately $43 million. Pension and postretirement funding can vary significantly each year due to changes in legislation and the Company’s significant assumptions. As a result, the Company has not presented pension and postretirement funding in the table above.
Commercial Commitments Expiration by Year
Less Morethan 1 1-3 3-5 than 5
(millions) Total year years years years
Guarantees $ 6.6 $ 2.2 $ 4.2 $ .2 –
Standby and trade letters of credit 12.3 12.3 – – –
Lines of credit 466.1 241.1 225.0 – –
Total commercial commitments $485.0 $ 255.6 $ 229.2 $ .2 –
Note: In January 2005, the Company entered into a new five-year, $400 million credit facility, which expires in January 2010. This facility replaces the line of credit of$350 million existing at year end of which $125 million would have expired in June 2005 and $225 million would have expired in June 2006.
Commodity Risk – The Company purchases certainraw materials which are subject to price volatility causedby weather, market conditions, growing and harvestingconditions, governmental actions and other unpredictablefactors. While future movements of raw material costsare uncertain, the Company responds to this volatility in anumber of ways, including strategic raw material pur-chases, purchases of raw material for future delivery andcustomer price adjustments. Generally, the Companydoes not use derivatives to manage the volatility relatedto this risk.
Credit Risk – The customers of the consumer busi-ness are predominantly food retailers and food whole-salers. Recently, consolidations in these industries
have created larger customers, some of which arehighly leveraged. This has increased the Company’sexposure to credit risk. Several customers over thepast two years have filed for bankruptcy protection;however, these bankruptcies have not had a materialeffect on the Company’s results. The Company feelsthat the risks have been adequately provided for in itsbad debt allowance.
Contractual Obligations and
Commercial Commitments
The following table reflects a summary of the Company’scontractual obligations and commercial commitments asof November 30, 2004:

M C C O R M I C K & C O M P A N Y 2 0 0 4 A N N U A L R E P O R T
33
Off-Balance Sheet Arrangements
The Company had no off-balance sheet arrangements as ofNovember 30, 2004. In 2003, the Company consolidatedthe lessor of a leased distribution center and, as a result,the entity is reflected in the consolidated balance sheet.
Recently Issued Accounting Pronouncements
In January 2003, the FASB issued and subsequentlyrevised Interpretation No. 46, “Consolidation of VariableInterest Entities.” The Company adopted InterpretationNo. 46 as it relates to special purpose entities in the fourthquarter of 2003. The Company consolidated the lessor of aleased distribution center used by the Company andrecorded a cumulative effect of an accounting change of$2.1 million (net of income tax benefit of $1.2 million).Consolidation of this entity increased assets by $11.2 mil-lion, long-term debt by $14.0 million and minority interestby $0.5 million. The effect of consolidation of this entity inprior years would have reduced net income in 2002 by $0.3million. In the third quarter of 2004, the Company adoptedthe remaining provisions of Interpretation No. 46 and therewas no material effect upon adoption of this statement.
In May 2004, the FASB issued Staff Position 106-2,“Accounting and Disclosure Requirements Related to the Medicare Prescription Drug Improvement andModernization Act of 2003” which provides guidance onthe accounting for the effects of the Act. FASB StaffPosition 106-2 is effective for the first interim or annualperiod beginning after June 15, 2004. The Companyadopted FASB Staff Position 106-2 in the third quarter of2004. See Note 10 for impact of adoption.
In November 2004, the FASB issued SFAS No. 151,“Inventory Costs,” an amendment to ARB No. 43,Chapter 4, “Inventory Pricing.” SFAS No. 151 is effectivefor inventory costs incurred during fiscal years beginningafter June 15, 2005. The Company believes there will beno material effect upon adoption of this statement.
In December 2004, the FASB issued SFAS No. 123R,“Share-Based Payment,” a revision of SFAS No. 123,“Accounting for Stock-Based Compensation” and super-seding APB Opinion No. 25, “Accounting for Stock Issuedto Employees.” SFAS No. 123R requires the Company toexpense grants made under the stock option and employeestock purchase plan programs. That cost will be recognizedover the vesting period of the plans. SFAS No. 123R is
effective for the first interim or annual period beginningafter June 15, 2005. Upon adoption of SFAS No. 123R,amounts previously disclosed under SFAS No.123 will berecorded in the consolidated income statement. TheCompany is evaluating the alternatives allowed under thestandard, which the Company is required to adopt begin-ning in the fourth quarter of 2005.
Critical Accounting Estimates and Assumptions
In preparing the financial statements in accordance withUnited States generally accepted accounting principles(GAAP), management is required to make estimates andassumptions that have an impact on the assets, liabilities,revenue, and expense amounts reported. These esti-mates can also affect supplemental information disclosedby the Company, including information about contingen-cies, risk, and financial condition. The Company believes,given current facts and circumstances, its estimates andassumptions are reasonable, adhere to GAAP, and areconsistently applied. Inherent in the nature of an estimateor assumption is the fact that actual results may differfrom estimates and estimates may vary as new facts andcircumstances arise. In preparing the financial statements,the Company makes routine estimates and judgments indetermining the net realizable value of accounts receiv-able, inventory, fixed assets, and prepaid allowances.Management believes the Company’s most criticalaccounting estimates and assumptions are in the follow-ing areas:
Customer Contracts
In several of its major markets, the consumer businesssells its products by entering into annual or multi-year con-tracts with its customers. These contracts include provi-sions for items such as sales discounts, marketingallowances and performance incentives. The discounts,allowances, and incentives are expensed based on certainestimated criteria such as sales volume of indirect cus-tomers, customers reaching anticipated volume thresh-olds, and marketing spending. The Company routinelyreviews these criteria and makes adjustments as factsand circumstances change.
Goodwill and Brand Name Asset Valuation
The Company reviews the carrying value of goodwill andbrand name assets annually utilizing discounted cash flowmodels. Changes in estimates of future cash flows causedby items such as unforeseen events or changes in market
M C C O R M I C K & C O M P A N Y 2 0 0 4 A N N U A L R E P O R T
34
management’s discussion and analysis
conditions could negatively affect the reporting unit’s brandname assets’ fair value and result in an impairment charge.The Company cannot predict the occurrence of events thatmight adversely affect the reported value of goodwill andbrand name assets that totaled $819.3 million atNovember 30, 2004. However, the current fair values ofthe Company’s reporting units and brand name are signifi-cantly in excess of carrying values, and accordingly man-agement believes that only significant changes in the cashflow assumptions would result in impairment.
Income Taxes
The Company files income tax returns and estimatesincome taxes in each of the taxing jurisdictions in which itoperates. The Company is subject to tax audits in each ofthese jurisdictions, which could result in changes to theestimated taxes. The amount of these changes would vary by jurisdiction and would be recorded when known.Management has recorded valuation allowances to reduceits deferred tax assets to the amount that is more likelythan not to be realized. In doing so, management has con-sidered future taxable income and ongoing tax planningstrategies in assessing the need for a valuation allowance.
Pension and Postretirement Benefits
Pension and other postretirement plans’ costs require theuse of assumptions for discount rates, investment returns,projected salary increases, mortality rates, and health carecost trend rates. The actuarial assumptions used in theCompany’s pension and postretirement benefit reporting arereviewed annually and compared with external benchmarksto ensure that they appropriately account for the Company’sfuture pension and postretirement benefit obligations. Whilethe Company believes that the assumptions used are appro-priate, differences between assumed and actual experiencemay affect the Company’s operating results. A 1% changein the actuarial assumption for discount rate would impactpension and postretirement benefit expense by approxi-mately $12 million. A 1% change in the expected return onplan assets would impact pension expense by approxi-mately $4 million. In addition, see the preceding sections ofthe MD&A and notes 9 and 10 of notes to consolidatedfinancial statements for a discussion of these assumptionsand the effects on the financial statements.
Forward-Looking Information
Certain information contained in this report includes “for-ward-looking statements” within the meaning of section21(E) of the Securities Exchange Act. The Companyintends the forward-looking statements to be covered bythe safe harbor provisions for forward-looking statementsin this section. All statements regarding the Company’sexpected financial plans, future capital requirements, fore-casted, demographic and economic trends relating to itsindustry, ability to complete internal restructuring programsand to realize anticipated cost savings from such programs,ability to complete acquisitions, to realize anticipated costsavings and other benefits from acquisitions, to recoveracquisition-related costs, and similar matters are forward-looking statements. In some cases, these statements canbe identified by the Company’s use of forward-lookingwords such as “may,” “will,” “should,” “anticipate,”“estimate,” “expect,” “plan,” “believe,” “predict,”“potential,” or “intend.” The forward-looking information isbased on various factors and was derived using numerousassumptions. However, these statements only reflect theCompany’s predictions. These statements are subject toknown and unknown risks, uncertainties, and other factorsthat could cause the Company’s actual results to differmaterially from the statements. Important factors thatcould cause the Company’s actual results to be materiallydifferent from its expectations include actions of competi-tors, customer relationships, market acceptance of newproducts, actual amounts and timing of special chargeitems, removal and disposal costs, final negotiations ofthird-party contracts, the impact of stock market conditionson its share repurchase program, fluctuations in the costand availability of supply chain resources, global economicconditions, including interest and currency rate fluctua-tions, and inflation rates. The Company undertakes no obli-gation to update or revise publicly any forward-lookingstatements, whether as a result of new information, futureevents or otherwise.

M C C O R M I C K & C O M P A N Y 2 0 0 4 A N N U A L R E P O R T
35
The Board of Directors and Shareholders of McCormick & Company, Incorporated
We have audited management’s assessment, included in theaccompanying Report of Management, that McCormick &Company, Incorporated and subsidiaries maintained effectiveinternal control over financial reporting as of November 30,2004, based on the criteria established in Internal Control –Integrated Framework issued by the Committee of SponsoringOrganizations of the Treadway Commission (the COSO criteria).The Company’s management is responsible for maintainingeffective internal control over financial reporting and for itsassessment of the effectiveness of internal control over finan-cial reporting. Our responsibility is to express an opinion onmanagement’s assessment and an opinion on the effectivenessof the Company’s internal control over financial reporting basedon our audit.
We conducted our audit in accordance with the standardsof the Public Company Accounting Oversight Board (UnitedStates). Those standards require that we plan and perform theaudit to obtain reasonable assurance about whether effectiveinternal control over financial reporting was maintained in allmaterial respects. Our audit included obtaining an understand-ing of internal control over financial reporting, evaluatingmanagement’s assessment, testing and evaluating the designand operating effectiveness of internal control, and performingsuch other procedures as we considered necessary in thecircumstances. We believe that our audit provides a reasonablebasis for our opinion.
A company’s internal control over financial reporting is aprocess designed to provide reasonable assurance regardingthe reliability of financial reporting and the preparation of finan-cial statements for external purposes in accordance withgenerally accepted accounting principles. A company’s internalcontrol over financial reporting includes those policies andprocedures that (1) pertain to the maintenance of records that,in reasonable detail, accurately and fairly reflect the transactionsand dispositions of the assets of the company; (2) providereasonable assurance that transactions are recorded as neces-sary to permit preparation of financial statements in accordancewith generally accepted accounting principles, and that receiptsand expenditures of the company are being made only in accor-dance with authorizations of management and directors of thecompany; and (3) provide reasonable assurance regardingprevention or timely detection of unauthorized acquisition, use,or disposition of the company’s assets that could have a mate-rial effect on the financial statements.
Because of its inherent limitations, internal control overfinancial reporting may not prevent or detect misstatements.Also, projections of any evaluation of effectiveness to future
report of management report of independent registeredpublic accounting firminternal control over financial reporting
We are responsible for the preparation and integrity of theconsolidated financial statements appearing in our AnnualReport. The consolidated financial statements were prepared inconformity with United States generally accepted accountingprinciples and include amounts based on management’s estimates and judgments. All other financial information in thisreport has been presented on a basis consistent with the information included in the financial statements.
We are also responsible for establishing and maintainingadequate internal controls over financial reporting. We maintaina system of internal controls that is designed to provide reason-able assurance as to the fair and reliable preparation andpresentation of the consolidated financial statements, as well asto safeguard assets from unauthorized use or disposition.
Our control environment is the foundation for our systemof internal controls over financial reporting and is embodied inour Business Ethics Policy. It sets the tone of our organizationand includes factors such as integrity and ethical values. Our internal controls over financial reporting are supported byformal policies and procedures which are reviewed, modifiedand improved as changes occur in business conditions and operations.
The Audit Committee of the Board of Directors, which iscomposed solely of outside directors, meets periodically withmembers of management, the internal auditors and the inde-pendent auditors to review and discuss internal controls overfinancial reporting and accounting and financial reportingmatters. The independent auditors and internal auditors reportto the Audit Committee and accordingly have full and freeaccess to the Audit Committee at any time.
We conducted an evaluation of the effectiveness of ourinternal controls over financial reporting based on the frame-work in Internal Control – Integrated Framework issued by theCommittee of Sponsoring Organizations of the TreadwayCommission. This evaluation included review of the documenta-tion of controls, evaluation of the design effectiveness ofcontrols, testing of the operating effectiveness of controls and aconclusion on this evaluation. Although there are inherent limitations in the effectiveness of any system of internal controlsover financial reporting, based on our evaluation, we haveconcluded that our internal controls over financial reportingwere effective as of November 30, 2004.
Ernst & Young LLP, an independent registered publicaccounting firm, has issued an attestation report on manage-ment’s assessment of internal control over financial reporting,which is included herein.
Robert J. Lawless Chairman, President & Chief Executive Officer
Francis A. Contino Executive Vice President, Strategic Planning & Chief Financial Officer
Kenneth A. Kelly, Jr. Vice President & Controller, Chief Accounting Officer
Continued on page 36

M C C O R M I C K & C O M P A N Y 2 0 0 4 A N N U A L R E P O R T
36
report of independent registeredpublic accounting firmconsolidated financial statementsContinued from page 35
periods are subject to the risk that controls may become inade-quate because of changes in conditions, or that the degree ofcompliance with the policies or procedures may deteriorate.
In our opinion, management’s assessment thatMcCormick & Company, Incorporated and subsidiaries main-tained effective internal control over financial reporting as ofNovember 30, 2004, is fairly stated, in all material respects,based on the COSO criteria. Also in our opinion, McCormick &Company, Incorporated and subsidiaries maintained, in all mate-rial respects, effective internal control over financial reporting asof November 30, 2004, based on the COSO criteria.
We have also audited, in accordance with the standards ofthe Public Company Accounting Oversight Board (UnitedStates), the accompanying consolidated balance sheets ofMcCormick & Company, Incorporated and subsidiaries as ofNovember 30, 2004 and 2003 and the related statements ofincome, shareholders’ equity and cash flows for each of theyears in the three-year period ended November 30, 2004, andour report dated January 25, 2005 expresses an unqualifiedopinion on these statements.
Baltimore, MarylandJanuary 25, 2005
The Board of Directors and Shareholders of McCormick & Company, Incorporated
We have audited the accompanying consolidated balancesheets of McCormick & Company, Incorporated andsubsidiaries as of November 30, 2004 and 2003, and the relatedconsolidated statements of income, shareholders’ equity andcash flows for each of the three years in the period endedNovember 30, 2004. These financial statements are the respon-sibility of the Company’s management. Our responsibility is toexpress an opinion on these financial statements based on our audits.
We conducted our audits in accordance with the standardsof the Public Company Accounting Oversight Board (UnitedStates). Those standards require that we plan and perform theaudit to obtain reasonable assurance about whether the finan-cial statements are free of material misstatement. An auditincludes examining, on a test basis, evidence supporting theamounts and disclosures in the financial statements. An auditalso includes assessing the accounting principles used andsignificant estimates made by management, as well as evaluat-ing the overall financial statement presentation. We believe thatour audits provide a reasonable basis for our opinion.
In our opinion, the financial statements referred to abovepresent fairly, in all material respects, the consolidated financialposition of McCormick & Company, Incorporated and subsid-iaries at November 30, 2004 and 2003, and the consolidatedresults of its operations and its cash flows for each of the threeyears in the period ended November 30, 2004, in conformitywith United States generally accepted accounting principles.
As discussed in note 1 of the notes to consolidated finan-cial statements, the Company changed the manner in which it accounts for a variable interest entity upon adoption of certain provisions of Financial Accounting Standards BoardInterpretation No. 46, “Consolidation of Variable InterestEntities” (FIN 46) on September 1, 2003. The Company adoptedthe remaining provisions of FIN 46 effective May 31, 2004.
We also have audited, in accordance with the standards of the Public Company Accounting Oversight Board (UnitedStates), the effectiveness of McCormick & Company andsubsidiaries’ internal control over financial reporting as ofNovember 30, 2004, based on criteria established in InternalControl – Integrated Framework issued by the Committee of Sponsoring Organizations of the Treadway Commission andour report dated January 25, 2005 expressed an unqualifiedopinion thereon.
Baltimore, MarylandJanuary 25, 2005

M C C O R M I C K & C O M P A N Y 2 0 0 4 A N N U A L R E P O R T
37
consolidated statement of income
for the year ended November 30 (millions except per share data) 2004 2003 2002
Net sales $2,526.2 $2,269.6 $2,044.9Cost of goods sold 1,518.3 1,371.0 1,245.4
Gross profit 1,007.9 898.6 799.5Selling, general and administrative expense 677.7 597.6 529.6Special charges (credits) (2.5) 5.5 7.5
Operating income 332.7 295.5 262.4Interest expense 41.0 38.6 39.2Other income, net 2.1 13.1 .7
Income from consolidated operations before income taxes 293.8 270.0 223.9Income taxes 89.0 83.4 69.4
Net income from consolidated operations 204.8 186.6 154.5Income from unconsolidated operations 14.6 16.4 22.4Minority interest 4.9 3.8 3.1
Net income from continuing operations 214.5 199.2 173.8Discontinued operations, net of tax:
Net income – 4.7 6.0Gain on sale – 9.0 –
Net income before cumulative effect of accounting change 214.5 212.9 179.8Cumulative effect of accounting change, net of tax – (2.1) –
Net income $ 214.5 $ 210.8 $ 179.8
Earnings per share – basic:
Net income from continuing operations $ 1.57 $ 1.43 $ 1.25Net income from discontinued operations – .03 .04Gain on sale of discontinued operations – .06 –Cumulative effect of accounting change – (.02) –
Net income 1.57 1.51 1.29
Earnings per share – diluted:
Net income from continuing operations $ 1.52 $ 1.40 $ 1.22Net income from discontinued operations – .03 .04Gain on sale of discontinued operations – .06 – Cumulative effect of accounting change – (.01) –
Net income 1.52 1.48 1.26
See Notes to Consolidated Financial Statements, pages 41-55.
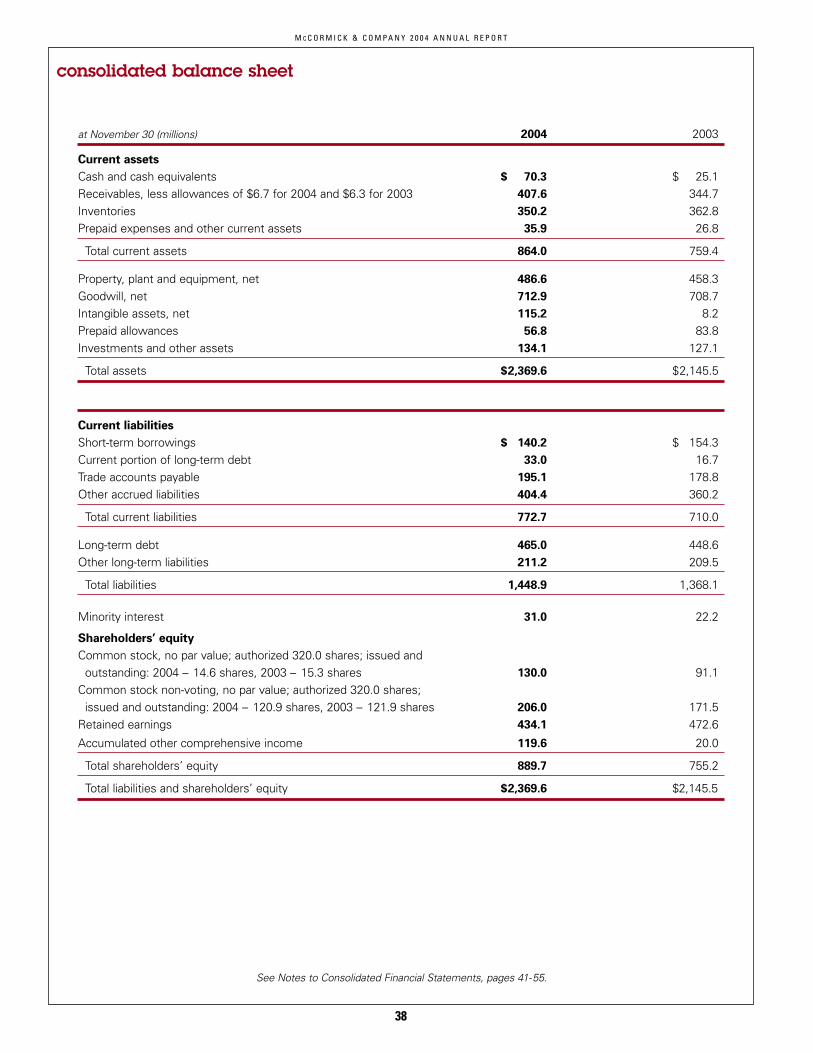
M C C O R M I C K & C O M P A N Y 2 0 0 4 A N N U A L R E P O R T
38
consolidated balance sheet
at November 30 (millions) 2004 2003
Current assets
Cash and cash equivalents $ 70.3 $ 25.1Receivables, less allowances of $6.7 for 2004 and $6.3 for 2003 407.6 344.7Inventories 350.2 362.8Prepaid expenses and other current assets 35.9 26.8
Total current assets 864.0 759.4
Property, plant and equipment, net 486.6 458.3Goodwill, net 712.9 708.7Intangible assets, net 115.2 8.2Prepaid allowances 56.8 83.8Investments and other assets 134.1 127.1
Total assets $2,369.6 $2,145.5
Current liabilities
Short-term borrowings $ 140.2 $ 154.3Current portion of long-term debt 33.0 16.7Trade accounts payable 195.1 178.8Other accrued liabilities 404.4 360.2
Total current liabilities 772.7 710.0
Long-term debt 465.0 448.6Other long-term liabilities 211.2 209.5
Total liabilities 1,448.9 1,368.1
Minority interest 31.0 22.2
Shareholders’ equity
Common stock, no par value; authorized 320.0 shares; issued and outstanding: 2004 – 14.6 shares, 2003 – 15.3 shares 130.0 91.1
Common stock non-voting, no par value; authorized 320.0 shares; issued and outstanding: 2004 – 120.9 shares, 2003 – 121.9 shares 206.0 171.5
Retained earnings 434.1 472.6
Accumulated other comprehensive income 119.6 20.0
Total shareholders’ equity 889.7 755.2
Total liabilities and shareholders’ equity $2,369.6 $2,145.5
See Notes to Consolidated Financial Statements, pages 41-55.
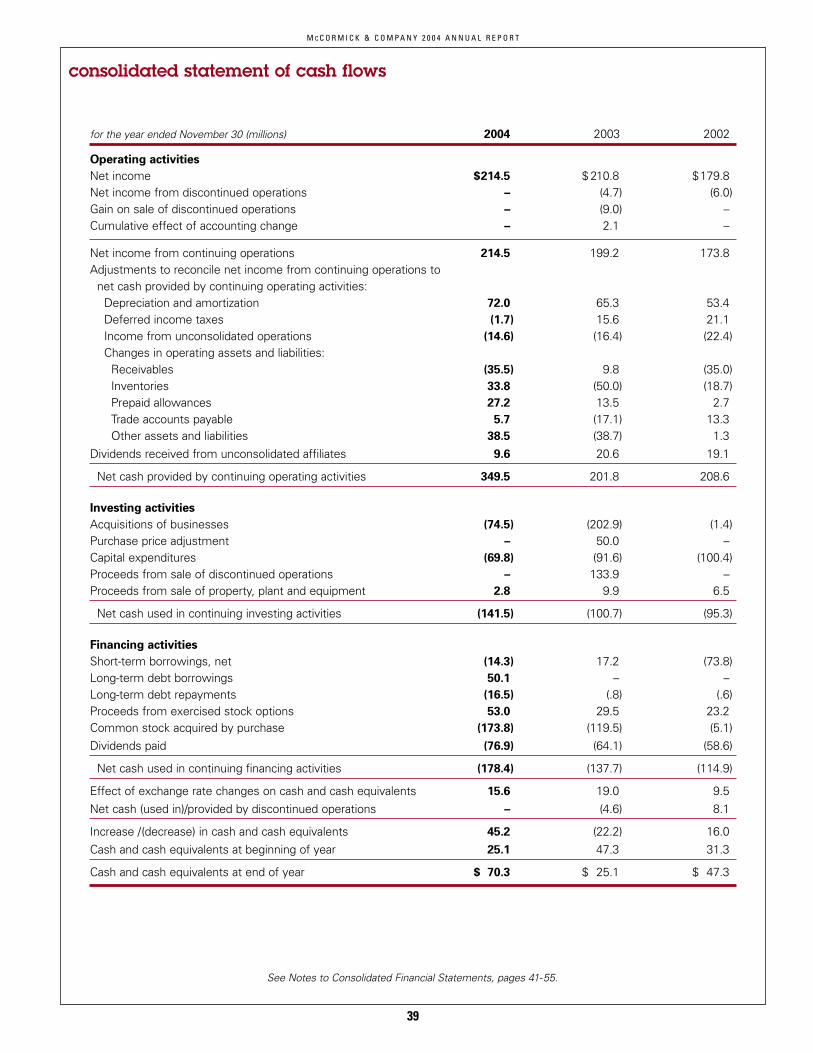
M C C O R M I C K & C O M P A N Y 2 0 0 4 A N N U A L R E P O R T
39
consolidated statement of cash flows
for the year ended November 30 (millions) 2004 2003 2002
Operating activities
Net income $214.5 $ 210.8 $179.8Net income from discontinued operations – (4.7) (6.0)Gain on sale of discontinued operations – (9.0) –Cumulative effect of accounting change – 2.1 –
Net income from continuing operations 214.5 199.2 173.8Adjustments to reconcile net income from continuing operations to
net cash provided by continuing operating activities:Depreciation and amortization 72.0 65.3 53.4Deferred income taxes (1.7) 15.6 21.1Income from unconsolidated operations (14.6) (16.4) (22.4)Changes in operating assets and liabilities:
Receivables (35.5) 9.8 (35.0)Inventories 33.8 (50.0) (18.7)Prepaid allowances 27.2 13.5 2.7Trade accounts payable 5.7 (17.1) 13.3Other assets and liabilities 38.5 (38.7) 1.3
Dividends received from unconsolidated affiliates 9.6 20.6 19.1
Net cash provided by continuing operating activities 349.5 201.8 208.6
Investing activities
Acquisitions of businesses (74.5) (202.9) (1.4)Purchase price adjustment – 50.0 –Capital expenditures (69.8) (91.6) (100.4)Proceeds from sale of discontinued operations – 133.9 –Proceeds from sale of property, plant and equipment 2.8 9.9 6.5
Net cash used in continuing investing activities (141.5) (100.7) (95.3)
Financing activities
Short-term borrowings, net (14.3) 17.2 (73.8)Long-term debt borrowings 50.1 – –Long-term debt repayments (16.5) (.8) (.6)Proceeds from exercised stock options 53.0 29.5 23.2Common stock acquired by purchase (173.8) (119.5) (5.1)Dividends paid (76.9) (64.1) (58.6)
Net cash used in continuing financing activities (178.4) (137.7) (114.9)
Effect of exchange rate changes on cash and cash equivalents 15.6 19.0 9.5Net cash (used in)/provided by discontinued operations – (4.6) 8.1
Increase /(decrease) in cash and cash equivalents 45.2 (22.2) 16.0Cash and cash equivalents at beginning of year 25.1 47.3 31.3
Cash and cash equivalents at end of year $ 70.3 $ 25.1 $ 47.3
See Notes to Consolidated Financial Statements, pages 41-55.
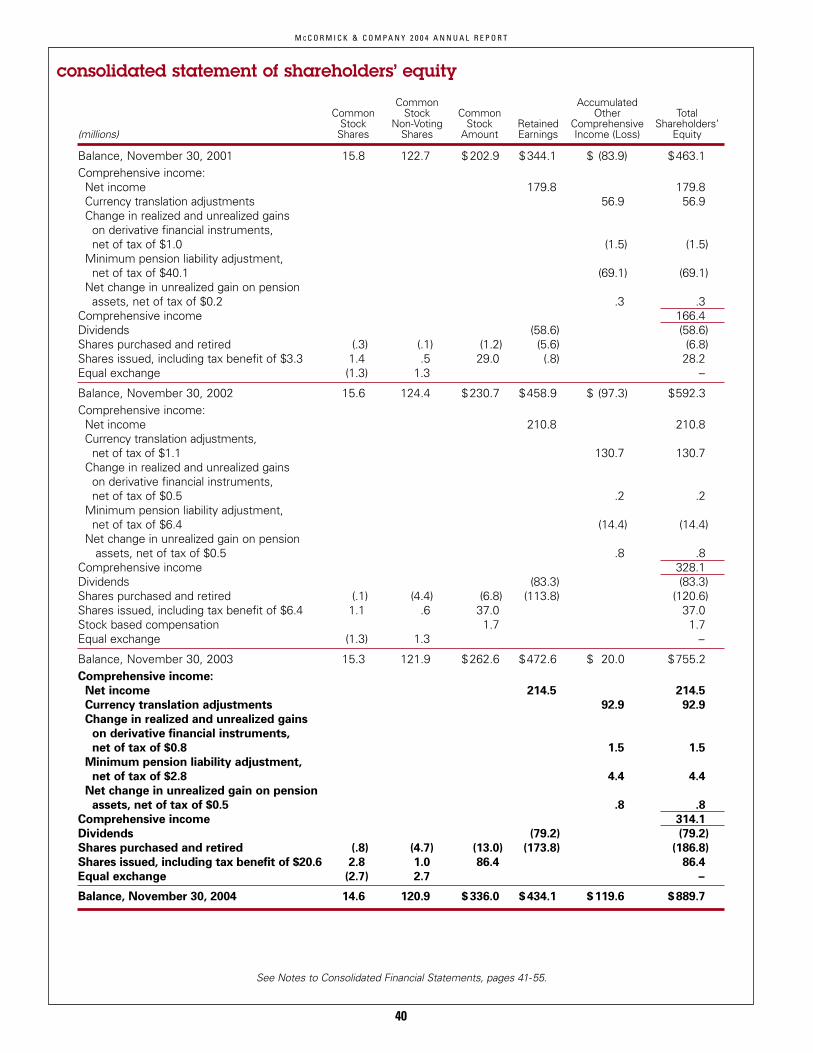
M C C O R M I C K & C O M P A N Y 2 0 0 4 A N N U A L R E P O R T
40
consolidated statement of shareholders’ equity
Common AccumulatedCommon Stock Common Other Total
Stock Non-Voting Stock Retained Comprehensive Shareholders’(millions) Shares Shares Amount Earnings Income (Loss) Equity
Balance, November 30, 2001 15.8 122.7 $ 202.9 $344.1 $ (83.9) $463.1Comprehensive income:
Net income 179.8 179.8Currency translation adjustments 56.9 56.9Change in realized and unrealized gains
on derivative financial instruments,net of tax of $1.0 (1.5) (1.5)
Minimum pension liability adjustment,net of tax of $40.1 (69.1) (69.1)
Net change in unrealized gain on pension assets, net of tax of $0.2 .3 .3
Comprehensive income 166.4Dividends (58.6) (58.6)Shares purchased and retired (.3) (.1) (1.2) (5.6) (6.8)Shares issued, including tax benefit of $3.3 1.4 .5 29.0 (.8) 28.2Equal exchange (1.3) 1.3 –
Balance, November 30, 2002 15.6 124.4 $230.7 $458.9 $ (97.3) $592.3Comprehensive income:
Net income 210.8 210.8Currency translation adjustments,
net of tax of $1.1 130.7 130.7Change in realized and unrealized gains
on derivative financial instruments, net of tax of $0.5 .2 .2
Minimum pension liability adjustment, net of tax of $6.4 (14.4) (14.4)
Net change in unrealized gain on pensionassets, net of tax of $0.5 .8 .8
Comprehensive income 328.1Dividends (83.3) (83.3)Shares purchased and retired (.1) (4.4) (6.8) (113.8) (120.6)Shares issued, including tax benefit of $6.4 1.1 .6 37.0 37.0Stock based compensation 1.7 1.7Equal exchange (1.3) 1.3 –
Balance, November 30, 2003 15.3 121.9 $262.6 $472.6 $ 20.0 $755.2Comprehensive income:
Net income 214.5 214.5
Currency translation adjustments 92.9 92.9
Change in realized and unrealized gains
on derivative financial instruments,
net of tax of $0.8 1.5 1.5
Minimum pension liability adjustment,
net of tax of $2.8 4.4 4.4
Net change in unrealized gain on pension
assets, net of tax of $0.5 .8 .8
Comprehensive income 314.1
Dividends (79.2) (79.2)
Shares purchased and retired (.8) (4.7) (13.0) (173.8) (186.8)
Shares issued, including tax benefit of $20.6 2.8 1.0 86.4 86.4
Equal exchange (2.7) 2.7 –
Balance, November 30, 2004 14.6 120.9 $ 336.0 $434.1 $119.6 $889.7
See Notes to Consolidated Financial Statements, pages 41-55.

M C C O R M I C K & C O M P A N Y 2 0 0 4 A N N U A L R E P O R T
41
1. SUMMARY OF SIGNIFICANT ACCOUNTING POLICIES
Consolidation
The consolidated financial statements include the accountsof the Company and its majority-owned or controlledsubsidiaries. Significant intercompany transactions have beeneliminated. Investments in unconsolidated affiliates, overwhich the Company exercises significant influence, but notcontrol, are accounted for by the equity method. Accordingly,the share of net income or loss of such unconsolidated affil-iates is included in consolidated net income. The implicationsof the Financial Accounting Standards Board (FASB)Interpretation No. 46, “Consolidation of Variable InterestEntities” on the Company’s consolidation policy are discussedlater in this note.
Use of Estimates
Preparation of financial statements in conformity with account-ing principles generally accepted in the U.S. requiresmanagement to make estimates and assumptions that affectthe amounts reported in the consolidated financial state-ments and accompanying notes. Actual amounts could differfrom these estimates.
Cash and Cash Equivalents
All highly liquid investments purchased with an original matu-rity date of 3 months or less are classified as cash equivalents.
Inventories
Inventories are stated at the lower of cost or market. Cost isdetermined using standard or average costs which approxi-mate the first-in, first-out costing method.
Property, Plant and Equipment
Property, plant and equipment is stated at historical costand depreciated over its estimated useful life using thestraight-line method for financial reporting and both acceler-ated and straight-line methods for tax reporting. Theestimated useful lives range from 20 to 40 years for build-ings and 3 to 12 years for the Company’s machinery,equipment and computer software.
Repair and maintenance costs incurred to restore or keepcapital assets at an acceptable level of operating condition, butwithout an increase in the previously estimated useful life orcapacity of the asset are expensed as incurred.
Software Development Costs
The Company capitalizes costs associated with softwaredeveloped or obtained for internal use in accordance withAmerican Institute of Certified Public Accountants Statementof Position 98-1, “Accounting for the Costs of ComputerSoftware Developed or Obtained for Internal Use.” Capitalizedinternal use software development costs include only (1)external direct costs of materials and services consumed indeveloping or obtaining the software, (2) payroll and payroll-related costs for employees who are directly associated with
and who devote time to the project, and (3) interest costsincurred, when material, while developing the software.Capitalization of these costs ceases when the project issubstantially complete and ready for its intended purpose.Capitalized internal use software development costs are amortized using the straight-line method over a range of3 to 8 years, but not exceeding the expected life of theproduct. The Company capitalized $14.1 million of softwareand software development costs during the year endedNovember 30, 2004 and $25.1 million during the year endedNovember 30, 2003.
In the fourth quarter of 2004, the Company changed its esti-mated useful life of certain software costs from 5 to 8 years.This change was due to the vendor stating their support forthe software for a period longer than originally anticipated. Inaccordance with APB 20, “Accounting Changes,” this changewas made beginning in the fourth quarter of 2004. The 2004favorable impact to depreciation expense as a result of thischange is $1.1 million ($0.8 million after-tax) and is reflectedin the consolidated statement of income.
Goodwill and Other Intangible Assets
In accordance with Statement of Financial AccountingStandard (SFAS) No. 142, ”Goodwill and Other IntangibleAssets,“ goodwill and indefinite-lived intangible assets arereviewed at least annually for impairment using thediscounted cash flow method. Separable intangible assetsthat have finite useful lives are amortized over their usefullives. An impaired intangible asset would be written downto fair value, using the discounted cash flow method.
Prepaid Allowances
Prepaid allowances arise when the Company prepays salesdiscounts and marketing allowances to certain customers inconnection with multi-year sales contracts. These costs arecapitalized and amortized against net sales. The majority ofthe Company’s contracts are for a specific committedcustomer sales volume while others are for a specific timeduration. Prepaid allowances on volume based contracts areamortized based on the actual volume of customer purchases,while prepaid allowances on time based contracts are amor-tized on a straight-line basis over the life of the contract. Theamounts reported in the consolidated balance sheet arestated at the lower of unamortized cost or management’s esti-mate of the net realizable value of these allowances.
Revenue Recognition
Revenue is recognized when it is realized or realizable and hasbeen earned. The Company recognizes revenue when it haspersuasive evidence of an arrangement, the product hasbeen delivered to the customer, the sales price is fixed or deter-minable and collectibility is reasonably assured. The Company
notes to consolidated financial statements

M C C O R M I C K & C O M P A N Y 2 0 0 4 A N N U A L R E P O R T
42
notes to consolidated financial statements
reduces revenue for estimated product returns, allowancesand price discounts based on historical experience.
Trade allowances, consisting primarily of customer pricingallowances, merchandising funds and consumer coupons, areoffered through various programs to customers andconsumers. Revenue is recorded net of trade allowances.
Receivables consist of amounts billed and currently duefrom customers. The Company has an allowance for doubt-ful accounts to reduce its receivables to their net realizablevalue. Management estimates the allowance for doubtfulaccounts based on factors including aging of receivables andhistorical collection experience.
Shipping and Handling
Shipping and handling costs are included in the selling,general and administrative expense caption in the consoli-dated statement of income. Shipping and handling expensewas $75.3 million, $60.9 million, and $52.4 million for the yearsended November 30, 2004, 2003 and 2002, respectively.
Research and Development
Research and development costs are expensed as incurredand are included in the selling, general and administrativeexpense caption in the consolidated statement of income.Research and development expense was $39.3 million, $33.2million, and $31.4 million for the years ended November 30,2004, 2003 and 2002, respectively.
Advertising
Advertising costs, which include the development and produc-tion of advertising materials and the communication of thismaterial through various forms of media, are expensed in theperiod the advertising first takes place. Advertising expenseis included in the selling, general and administrative expensecaption in the consolidated statement of income. Advertisingexpense was $49.2 million, $34.5 million, and $27.4 millionfor the years ended November 30, 2004, 2003 and 2002,respectively.
Stock-Based Compensation
The Company uses the intrinsic value method as defined inAccounting Principles Board Opinion No. 25, “Accountingfor Stock Issued to Employees,” to account for stock optionsissued to employees and directors. Accordingly, no compen-sation expense is recognized for these stock options since alloptions granted have an exercise price equal to the marketvalue of the underlying stock on the grant date. During 2003,the Company recorded $1.2 million (net of income taxes of$0.5 million) of stock compensation expense in discontinuedoperations as a result of accelerated vesting of certain optionsrelated to the employees of the discontinued operations. Thefollowing table illustrates the effect on net income and earn-ings per common share if the Company had applied the fairvalue recognition provisions of SFAS No. 123 to stock-basedemployee compensation.
(millions except per share data) 2004 2003 2002
Net income as reported $214.5 $210.8 $179.8Add: stock-based employee
compensation recorded, net of tax .3 1.2 –Deduct: stock-based employee
compensation expense, net of tax (15.5) (12.7) (9.2)
Pro forma net income $199.3 $199.3 $170.6
Earnings per common share:Basic – as reported $ 1.57 $ 1.51 $ 1.29Basic – pro forma 1.45 1.43 1.22Diluted – as reported 1.52 1.48 1.26Diluted – pro forma 1.41 1.40 1.20
The per share weighted-average fair value of optionsgranted was $6.79, $4.70, and $4.99 in 2004, 2003 and 2002,respectively. The fair value for these options was estimatedat the date of grant using a Black-Scholes option pricingmodel with the following range of assumptions for theCompany’s various stock option plans and Employee StockPurchase Plans:
2004 2003 2002
Risk-free interest rates 3.3 - 3.8% 1.7 - 3.3% 4.5%Dividend yield 1.8% 2.0% 2.0%Expected volatility 21.75% 19.1 - 22.3% 21.6%Expected lives 5.0 - 6.0 years 1.6 - 6.0 years 6.0 years
Recently Issued Accounting Pronouncements
In January 2003, the FASB issued and subsequently revisedInterpretation No. 46, “Consolidation of Variable InterestEntities.” The Company adopted Interpretation No. 46 as itrelates to special purpose entities in the fourth quarter of 2003.As a result, the Company consolidated the lessor of a leaseddistribution center used by the Company and recorded acumulative effect of an accounting change of $2.1 million (netof income tax benefit of $1.2 million). Consolidation of thisentity increased assets by $11.2 million, long-term debt by$14.0 million and minority interest by $0.5 million. The effectof consolidation of this entity in prior years would havereduced net income in 2002 by $0.3 million. In 2004, theCompany adopted the remaining provisions of InterpretationNo. 46 and there was no material effect on the consolidatedfinancial statements.
In May 2004, the FASB issued Staff Position 106-2,“Accounting and Disclosure Requirements Related to theMedicare Prescription Drug Improvement and ModernizationAct of 2003” which provides guidance on the accounting forthe effects of the Act. FASB Staff Position 106-2 is effectivefor the first interim or annual period beginning after June 15,2004. The Company adopted FASB Staff Position 106-2 in thethird quarter of 2004. See Note 10 for impact of adoption.
In November 2004, the FASB issued SFAS No. 151,“Inventory Costs,” an amendment to ARB No. 43, Chapter4,“Inventory Pricing.” FAS No. 151 is effective for inventorycosts incurred during fiscal years beginning after June 15,2005. The Company believes there will be no material effectupon adoption of this statement.

M C C O R M I C K & C O M P A N Y 2 0 0 4 A N N U A L R E P O R T
43
In December 2004, the FASB issued SFAS No. 123R,“Share-Based Payment,” a revision of SFAS No. 123,“Accounting for Stock-Based Compensation” and super-seding APB Opinion No. 25, “Accounting for Stock Issued toEmployees.” SFAS No. 123R requires the Company toexpense grants made under the stock option and employeestock purchase plan programs. That cost will be recognizedover the vesting period of the plans. SFAS No. 123R is effec-tive for the first interim or annual period beginning after June15, 2005. Upon adoption of SFAS No. 123R, amounts previ-ously disclosed under SFAS No. 123 will be recordedin the consolidated income statement. The Company is evaluating the alternatives allowed under the standard, whichthe Company is required to adopt beginning in the fourth quarter of 2005.
Reclassifications
Certain amounts in prior years have been reclassified toconform to the current year presentation. The effect of thesereclassifications is not material to the consolidated financialstatements.
2. ACQUISITIONS
On November 1, 2004, the Company purchased C.M. vanSillevoldt B.V. (Silvo), the market leader in the Dutch spicesand herbs consumer market, for €58 million in cash (equiva-lent to $74.5 million) funded with cash from operations andcurrent credit facilities. Silvo sells spices, herbs and season-ings under the Silvo brand in the Netherlands and the Indiabrand as well as private label store brands in Belgium. Thebrand has a strong heritage and high recognition amongconsumers in the Netherlands. The acquisition is consistentwith the Company’s strategy to acquire established brands tocomplement the Company’s leadership position in the devel-opment and marketing of flavors for food. The acquisition wasaccounted for under the purchase method, and the results ofoperations have been included in the Company’s consoli-dated results from the date of acquisition. The excess of thepurchase price over the estimated fair value of the net tangi-ble assets purchased was $59.4 million and is classified asgoodwill in the consumer segment. The allocation of thepurchase price is based on preliminary estimates, subject torevision, after asset values have been finalized. Revisions tothe allocation, which may be significant, will be reported aschanges to various assets and liabilities. The Company doesnot anticipate significant amounts to be allocated to amortiz-able intangible assets and, therefore, the amount of intangibleasset amortization is not expected to be material to the resultsof operations in future periods.
On June 4, 2003, the Company purchased Zatarain’s, theleading New Orleans-style food brand in the United States,for $180.0 million in cash funded with commercial paperborrowings. Zatarain’s manufactures and markets flavored rice
and dinner mixes, seafood seasonings and many otherproducts that add flavor to food. The acquisition wasaccounted for under the purchase method, and the results ofoperations have been included in the Company’s consolidatedresults from the date of acquisition. The excess of thepurchase price over the estimated fair value of the net assetspurchased was $176.2 million, which includes $3.4 million offees directly related to the acquisition. In the second quarterof 2004, the Company completed the purchase priceallocation for the Zatarain’s acquisition. An analysis of thevarious types of intangible assets resulted in the determinationthat the excess purchase price should be classified as thevalue of the acquired brand name and goodwill. No otherintangible assets were identified as a result of this analysis.The Company has concluded that a substantial portion of thevalue of the excess purchase price resides in consumer trustand recognition of the Zatarain’s brand name as authentic NewOrleans-style cuisine. As a result, the Company has assigned$106.4 million of the excess purchase price to thisunamortizable brand based on an analysis of the premiumvalue that is derived from consumer loyalty and trust in thebrand quality. Zatarain’s brand name has been used since1889, and the Company intends to use and support the brandname indefinitely. The Company will review this intangibleasset for impairment annually using the discounted cash flowmethod. The remaining $69.8 million of intangible assetswas allocated to goodwill in the consumer segment.
On January 9, 2003, the Company acquired theUniqsauces business, a condiment business based inEurope, for $19.5 million in cash. Uniqsauces manufacturesand markets condiments to retail grocery and food servicecustomers, including quick service restaurants. Theacquisition was accounted for under the purchase method,and the results of operations have been included in theCompany’s consolidated results from the date of acquisition.The purchase price of this acquisition was allocated entirelyto fixed assets and working capital. No goodwill was recordedas a result of this acquisition.
On August 31, 2000, the Company acquired Ducros, S.A.and Sodis, S.A.S. (Ducros) from Eridania Beghin-Say, for 2.75billion French francs (equivalent to $379 million). In conjunc-tion with this acquisition, the Company recorded $11.4 millionof liabilities for the reorganization of resources in the Ducrosorganization in Europe. Actions under this plan, which includedthe consolidation of sales areas and offices and the exit fromcertain smaller markets, were completed during 2003.
The Ducros purchase contract provided for a potentialadjustment to the purchase price with interest from the dateof purchase. On April 29, 2003, the Company settled thepurchase price adjustment with the prior owners of Ducros.

M C C O R M I C K & C O M P A N Y 2 0 0 4 A N N U A L R E P O R T
44
notes to consolidated financial statements
The Company received payment of €49.6 million (equivalentto $55.4 million). Of the $55.4 million received, $5.4 millionrepresented interest earned on the settlement amount fromthe date of acquisition in accordance with the terms of theoriginal purchase agreement. The interest income wasincluded in “Other income, net” in the consolidated statementof income for the year ended November 30, 2003. The remain-ing $50.0 million of the settlement amount was recorded asa reduction to goodwill related to the acquisition.
3. DISCONTINUED OPERATIONS
Following a review in 2002, the packaging business and theU.K. Jenks brokerage operation were determined to be non-core to the Company. On August 12, 2003, the Companycompleted the sale of substantially all the operating assets ofits packaging segment (Packaging) to the Kerr Group, Inc.Packaging manufactured certain products used for packagingthe Company’s spices and seasonings as well as packagingproducts used by manufacturers in the vitamin, drug andpersonal care industries. Under the terms of the sale agree-ment, Packaging was sold for $132.5 million in cash andpossible additional future payments over five years contingenton the buyer meeting certain performance objectives. At theend of the first year of such possible contingent payment peri-ods, no additional payment was due from the buyer for thatyear. The proceeds were used to pay off a substantial portionof the commercial paper borrowing related to the Zatarain’sacquisition. The final purchase price is also subject to othercontingencies related to the performance of certain customercontracts which could result in a decrease in the sale price.The Company recorded a net gain on the sale of Packagingof $11.6 million (net of income taxes of $7.9 million). Includedin this gain was a net pension and postretirement curtailmentgain of $3.3 million and the write-off of goodwill of $0.7million. The contingent consideration, if any, associated withthe sale of Packaging will be recognized in the future as anadjustment to the gain based on the performance criteriaestablished. The Company also entered into a multi-year,market priced, agreement with the acquirer to purchasecertain packaging products.
On July 1, 2003, the Company sold the assets of JenksSales Brokers (Jenks), a division of the Company’s wholly-owned U.K. subsidiary, to Jenks’ senior management for$5.8 million in cash. Jenks provided sales and distribution serv-ices for consumer product companies, including the Company,and was previously reported as a part of the Company’sconsumer segment. The Company recorded a net loss on thesale of Jenks of $2.6 million (net of an income tax benefit of$0.6 million) in 2003. Included in this loss is a write-off of good-will of $0.4 million.
The operations of Packaging and Jenks were reported as“Income from discontinued operations, net” in the consoli-
dated statement of income in accordance with the provi-sions of SFAS No. 144, “Accounting for the Impairment orDisposal of Long-Lived Assets.” Interest expense was allo-cated to discontinued operations based on the ratio of the netassets of the discontinued operations to the total net assetsof the Company. The cash flows of Packaging and Jenkswere reported as “Net cash (used in)/provided by discontin-ued operations” in the consolidated statement of cash flows.The disclosures in the notes to consolidated financial state-ments exclude discontinued operations.
Summary operating results for the discontinued businesseswere as follows: (millions) 2003 2002
Net sales – Packaging $120.3 $170.6Net sales – Jenks 59.6 104.5
Net sales – discontinued operations $179.9 $275.1
Pre-tax income – Packaging $ 12.4 $ 21.7Interest expense allocation (2.5) (4.0)Income taxes (3.9) (6.9)
Net income – Packaging 6.0 10.8
Pre-tax (loss) – Jenks (1.8) (6.6)Interest expense allocation (.1) (.2)Income taxes .6 2.0
Net (loss) – Jenks (1.3) (4.8)
Net income – discontinued operations $ 4.7 $ 6.0
The following table presents summarized cash flow infor-mation of the discontinued operations for the years endedNovember 30, 2003, and 2002:
(millions) 2003 2002
Operating activities $ 3.7 $ 18.4Investing activities (5.2) (10.3)Financing activities (3.1) –
Net cash (used in)/provided by discontinued operations $ (4.6) $ 8.1
4. SPECIAL CHARGES
During the fourth quarter of 2001, the Company adopted aplan to further streamline its operations. This plan included theconsolidation of several distribution and manufacturing loca-tions, the reduction of administrative and manufacturingpositions, and the reorganization of several joint ventures. Theestimated cost of the total plan is approximately $32.6 million($25.6 million after-tax). Total cash expenditures in connectionwith these costs approximate $16.7 million, which are fundedthrough internally generated funds. The remaining $15.9million of costs associated with the plan consist of write-offsof assets. The total cost of the plan includes $1.8 million ofcosts related to Packaging and Jenks that have been classi-fied as income from discontinued operations in theconsolidated statement of income. Annualized cash savingsare expected to be approximately $8.0 million ($5.3 millionafter-tax), most of which have been realized to date. Savings

M C C O R M I C K & C O M P A N Y 2 0 0 4 A N N U A L R E P O R T
45
under the plan are being used for spending on initiatives suchas brand support and supply chain management. Thesesavings are included within the cost of goods sold and sell-ing, general and administrative expenses in the consolidatedstatement of income.
In 2001, the Company recorded $11.2 million ($7.4 millionafter-tax) of charges from continuing operations associatedwith the 2001 restructuring plan. Of this amount, $10.3million was classified as special charges and $0.9 million ascost of goods sold in the consolidated statement of income.These charges related to the consolidation of manufacturingin Canada, a distribution center consolidation in the U.S., aproduct line elimination and a realignment of the Company’ssales operations in the U.K., and a workforce reductionwhich encompasses plans in all segments and across allgeographic areas.
During the year ended November 30, 2002, the Companyrecorded $7.5 million ($5.5 million after-tax) of special chargesfrom continuing operations associated with the 2001 restruc-turing plan, which could not be accrued at the time of theoriginal announcement in 2001. These charges included thewrite-off of an investment in an industry purchasing consor-tium, further lease exit and relocation costs related to theworkforce reduction and realignment of the Company’sconsumer sales operations in the U.S. and further severanceand other costs related to the previously discussed workforcereduction. Also included in the 2002 charges were furthercosts related to the closure of a U.S. distribution center andfurther costs of the consolidation of manufacturing in Canada,which included the disposition of a manufacturing facility.During 2002, total cash expenditures in connection with theplan were $6.3 million.
During the year ended November 30, 2003, the Companyrecorded special charges related to continuing operations of$5.5 million ($3.6 million after-tax). The costs recorded in2003 included additional costs associated with the consoli-dation of production facilities in Canada, net of a gain on thesale of a manufacturing facility, severance and other costsrelated to the consolidation of industrial manufacturing in theU.K. and the realignment of the Company’s consumer salesoperations in Australia. During 2003, total cash expendituresin connection with the plan were $4.7 million.
During the year ended November 30, 2004, the Companyrecorded special charges related to continuing operations of$6.2 million ($4.3 million after-tax). The costs recorded in2004 primarily include costs related to the consolidation ofindustrial manufacturing facilities in the U.K. and Canada, thereorganization of a consumer joint venture and additionalseverance costs for position eliminations. During 2004, totalcash expenditures in connection with the plan were $4.7million. Also included in special charges/(credits) is a net gainof $8.7 million ($5.5 million after-tax) related to funds received
from a class action lawsuit that was settled in the Company’sfavor in the second quarter of 2004. This matter dated backto 1999 when a number of class action lawsuits were filedagainst manufacturers and sellers of various flavor enhancersfor their violation of antitrust laws. The Company, as apurchaser of such products, participated as a member of theplaintiff class. In the second quarter of 2004, the Companyreceived $11.1 million as a settlement of this claim and as aresult of the settlement, was required to settle claims againstthe Company for a portion of this gross amount. The net gainrecorded was $8.7 million. This amount was recorded as aspecial credit and was not allocated to the business segments.
Costs yet to be incurred from the 2001 restructuring planinclude the possible reorganization of a joint venture andadditional costs related to completion of the reorganization ofcertain industrial manufacturing facilities in the U.K. Theseactions are expected to be completed in 2005. The total 2001restructuring plan, includes severance charges for 392 posi-tion reductions. As of November 30, 2004, 389 of the 392planned position reductions had taken place.
The major components of the special charges and theremaining accrual balance relating to the 2001 restructuringplan as of November 30, 2002, 2003 and 2004 follow:
Severance and personnel Asset Other
(millions) costs write-downs exit costs Total
2001Special charges $ 5.8 $ 1.6 $ 3.8 $ 11.2Amounts utilized – (1.6) – (1.6)
$ 5.8 $ .– $ 3.8 $ 9.6
2002Special charges $ 3.3 $ 3.3 $ .9 $ 7.5Amounts utilized (4.9) (3.3) .(3.0) (11.2)
$ 4.2 $ .– $ 1.7 $ 5.9
2003Special charges $ 4.7 $ (.6) $ 1.4 $ 5.5Amounts utilized (4.2) .6 (3.0) (6.6)
$ 4.7 $ – $ .1 $ 4.8
2004
Special charges $ 2.2 $ .8 $ 3.2 $ 6.2
Amounts utilized (2.9) (.8) (2.9) (6.6)
$ 4.0 $ – $ .4 $ 4.4
5. GOODWILL AND INTANGIBLE ASSETS
Effective December 1, 2001, the Company adopted SFAS No.142, “Goodwill and Other Intangible Assets,” which estab-lished financial accounting and reporting for acquired goodwilland other intangible assets. Under SFAS No. 142, goodwill andindefinite-lived intangible assets are no longer amortized butare reviewed at least annually for impairment. Separableintangible assets that have finite useful lives continue to beamortized over their useful lives.

M C C O R M I C K & C O M P A N Y 2 0 0 4 A N N U A L R E P O R T
46
notes to consolidated financial statements
As of November 30, 2004 and 2003, the Company testedfor impairment of goodwill and non-amortizable intangiblesusing discounted cash flow models. As a result of these tests,the Company was not required to recognize any impairment.
The following table displays the intangible assets thatcontinue to be subject to amortization and intangible assets notsubject to amortization as of November 30, 2004 and 2003:
2004 2003Gross Gross
carrying Accumulated carrying Accumulated(millions) amount amortization amount amortization
Amortizable intangible assets $ .6 $ .3 $ .4 $ .2Unamortizable intangible assets:
Brand name 106.4 – – –Goodwill 793.7 80.8 784.0 75.3Trademark 9.7 1.2 9.1 1.1
909.8 82.0 793.1 76.4
Total goodwill and intangible assets $910.4 $ 82.3 $ 793.5 $ 76.6
The changes in the carrying amount of goodwill by segmentfor the years ended November 30, 2004 and 2003 are as follows:
2004 2003(millions) Consumer Industrial Consumer Industrial
Beginning of year $664.9 $ 43.8 $ 458.2 $ 40.5Goodwill acquired 59.4 – 176.2 – Goodwill disposed – – (.4) –Goodwill transferred (106.4) – – –Purchase price adjustment – – (50.0) – Foreign currency fluctuations 47.0 4.2 80.9 3.3
End of year $664.9 $ 48.0 $ 664.9 $ 43.8
The Zatarain’s brand was transferred from goodwill to otherintangibles in 2004 when the purchase price allocation wascompleted. The excess of the purchase price over net tangi-ble assets recorded as part of the Silvo acquisition in 2004above is still subject to finalization of purchase price allocation.The table above excludes $0.7 million of goodwill that wasdisposed of in connection with the sale of Packaging in 2003.
6. INVESTMENTS IN AFFILIATES
Summarized year-end information from the financial state-ments of unconsolidated affiliates representing 100% of thebusinesses follows:(millions) 2004 2003 2002
Net sales $428.3 $403.0 $422.1Gross profit 157.3 159.6 187.2Net income 28.8 32.6 44.9
Current assets $189.2 $168.2 $165.4Noncurrent assets 94.1 101.7 106.5Current liabilities 97.4 100.7 83.0Noncurrent liabilities 23.4 25.5 39.4
The Company’s share of undistributed earnings of the affil-iates was $50.3 million at November 30, 2004. Royalty incomefrom unconsolidated affiliates was $9.7 million, $9.3 millionand $10.0 million for 2004, 2003, and 2002, respectively.
7. FINANCING ARRANGEMENTS
The Company’s outstanding debt is as follows:(millions) 2004 2003
Short-term borrowingsCommercial paper (1) $134.4 $139.6Other 5.8 14.7
$140.2 $154.3
Weighted-average interest rate of short-term borrowings at year-end 2.12% 1.51%
Long-term debt 5.78% - 7.77% medium-term notes
due 2004 to 2006 $ 79.0 $ 95.06.40% - 6.80% medium-term notes
due 2006 to 2008 (2) (3) 298.4 298.53.35% medium-term notes
due 2009 (4) 48.6 –7.63% - 8.12% medium-term notes
due 2024 55.0 55.0Other 17.0 16.8
498.0 465.3
Less current portion 33.0 16.7
$465.0 $448.6
(1) The variable interest rate on $75 million of commercial paper is hedged byinterest rate swaps through 2011. Net interest payments are fixed at 6.35%during this period.
(2) Interest rate swaps, settled upon the issuance of the medium-term notes,effectively fixed the interest rate on $294 million of the notes at a weightedaverage fixed rate of 7.62%.
(3) The fixed interest rate on $100 million of 6.40% medium-term notes due in 2006 is effectively converted to a variable rate by interest rate swapsthrough 2006. Net interest payments are based on LIBOR plus 3.595%during this period.
(4) The fixed interest rate on $50 million of 3.35% medium-term notes due in 2009 is effectively converted to a variable rate by interest rate swapsthrough 2009. Net interest payments are based on LIBOR minus .21% during this period.
Maturities of long-term debt during the years subsequentto November 30, 2005 are as follows (in millions):
2006 – $196.1 2008 – $149.92007 – $0.3 2009 – $49.0
Thereafter – $69.7On April 1, 2004, the Company issued $50 million of
medium-term notes under its existing $375 million shelf regis-tration statement filed with the Securities and ExchangeCommission in January 2001. The $50 million of medium-termnotes mature on April 15, 2009 and pay interest semi-annu-ally at a rate of 3.35%. The proceeds from the new issuancewere used to pay off commercial paper debt.
The Company has available credit facilities with domesticand foreign banks for various purposes. The amount of unusedcredit facilities at November 30, 2004 was $466.1 million, of

M C C O R M I C K & C O M P A N Y 2 0 0 4 A N N U A L R E P O R T
47
which $350.0 million supports a commercial paper borrowingarrangement. Of these unused facilities, $241.1 million expirein 2005 and $225.0 million expire in 2006. Some credit facil-ities in support of commercial paper issuance require acommitment fee. Annualized commitment fees at November30, 2004 and 2003 were $0.3 million.
Rental expense under operating leases was $23.5 millionin 2004, $23.0 million in 2003 and $18.1 million in 2002.Future annual fixed rental payments for the years endingNovember 30 are as follows (in millions):
2005 – $13.9 2008 – $6.32006 – $10.9 2009 – $4.82007 – $8.3 Thereafter – $14.6
At November 30, 2004, the Company had guarantees of$6.6 million with terms ranging from 1 to 5 years. At November30, 2004 and 2003, the Company had outstanding letters ofcredit of $12.3 million and $24.3 million, respectively. Theseletters of credit typically act as a guarantee of payment tocertain third parties in accordance with specified terms andconditions. The unused portion of the Company’s letter ofcredit facility was $33.7 million at November 30, 2004.
8. FINANCIAL INSTRUMENTS
The Company utilizes derivative financial instruments toenhance its ability to manage risk, including foreign currencyand interest rate exposures, which exist as part of its ongoingbusiness operations. The Company does not enter intocontracts for trading purposes, nor is it a party to any leveragedderivative instrument. The use of derivative financialinstruments is monitored through regular communication withsenior management and the utilization of written guidelines.
All derivatives are recognized at fair value in the consoli-dated balance sheet. In evaluating the fair value of financialinstruments, including derivatives, the Company uses third-party market quotes or calculates an estimated fair value ona discounted cash flow basis using the rates available forinstruments with the same remaining maturities.
Foreign Currency
The Company is potentially exposed to foreign currency fluc-tuations affecting net investments, transactions and earningsdenominated in foreign currencies. The Company selectivelyhedges the potential effect of these foreign currency fluctu-ations by entering into foreign currency exchange contractswith highly-rated financial institutions.
Contracts which are designated as hedges of anticipatedpurchases denominated in a foreign currency (generallypurchases of raw materials in U.S. dollars by operating unitsoutside the U.S.) are considered cash flow hedges. The gains
and losses on these contracts are deferred in other compre-hensive income until the hedged item is recognized in costof goods sold, at which time the net amount deferred inother comprehensive income is also recognized in cost ofgoods sold. Gains and losses from hedges of assets, liabili-ties or firm commitments are recognized through income,offsetting the change in fair value of the hedged item.
At November 30, 2004, the Company had foreign currencyexchange contracts maturing within one year to purchase orsell $51.1 million of foreign currencies versus $58.9 million atNovember 30, 2003. All of these contracts were designatedas hedges of anticipated purchases denominated in a foreigncurrency to be completed within one year or hedges of foreigncurrency denominated assets or liabilities. Hedge ineffec-tiveness was not material.
Interest Rates
The Company finances a portion of its operations with bothfixed and variable rate debt instruments, primarily commer-cial paper, notes and bank loans. The Company utilizes interestrate swap agreements to minimize worldwide financing costsand to achieve a desired mix of its variable and fixed rate debt.
In 2004, the Company entered into an interest rate swapcontract with a total notional amount of $50 million to receiveinterest at 3.356% and pay a variable rate of interest basedon six-month LIBOR minus .21%. The Company designatedthis swap, which expires on April 15, 2009, as a fair valuehedge of the changes in fair value of the $50 million ofmedium-term notes maturing on April 15, 2009. No hedgeineffectiveness is recognized as the interest rate swap’sprovisions match the applicable provisions of the debt.
In 2003, the Company entered into interest rate swapcontracts for a total notional amount of $100 million to receiveinterest at 6.4% and pay a variable rate of interest based onsix-month LIBOR plus 3.595%. The Company designatedthese swaps, which expire on February 1, 2006, as fair valuehedges of the changes in fair value of $100 million of the $150million 6.40% fixed rate medium-term notes maturing onFebruary 1, 2006. No hedge ineffectiveness is recognized asthe interest rate swaps’ provisions match the applicable provi-sions of the debt.
The variable interest on $75 million of commercial paperwas hedged by forward starting interest rate swaps for theperiod through 2011. Net interest payments on this commer-cial paper will be effectively fixed at 6.35% during the period.The unrealized gain or loss on these swaps is recorded in othercomprehensive income, as the Company intends to holdthese interest rate swaps until maturity. Hedge ineffective-ness was not material.
Subsequent to the starting date of these swaps, the netcash settlements are reflected in interest expense in theapplicable period.

M C C O R M I C K & C O M P A N Y 2 0 0 4 A N N U A L R E P O R T
48
notes to consolidated financial statements
The Company incurred a $14.7 million loss on the settlementof swaps used to hedge the 2001 issuance of $294 million ofmedium-term notes. The loss on these swaps was deferredin other comprehensive income and is being amortized overthe five to seven year life of the medium-term notes as acomponent of interest expense. Amounts reclassified fromother comprehensive income to interest expense for settledinterest rate swaps were $2.5 million in 2004 and 2003 andare included in the net change in unrealized gain or loss onderivative financial instruments in the statement of share-holders’ equity.
Fair Value of Financial Instruments
The carrying amount and fair value of the Company’s financialinstruments at November 30, 2004 and 2003 are as follows:
2004 2003Carrying Fair Carrying Fair
(millions) amount value amount value
Other investments $ 27.2 $ 27.2 $ 21.3 $ 21.3Long-term debt 498.0 538.2 465.3 523.1Derivative related to:
Interest rates (11.8) (11.8) (11.3) (11.3)Foreign currencies (3.9) (3.9) (1.7) (1.7)
Because of their short-term nature, the amounts reportedin the consolidated balance sheet for cash and cash equiva-lents, receivables, short-term borrowings and trade accountspayable approximate fair value. The fair value of long-term debtand derivative financial instruments are based on quotedmarket prices.
Investments in affiliates are not readily marketable, and itis not practicable to estimate their fair value. Other invest-ments are comprised of fixed income and equity securitiesheld on behalf of employees in certain employee benefitplans and are stated at fair value. The cost of these invest-ments was $28.6 million and $24.0 million at November 30,2004 and 2003, respectively.
Concentrations of Credit Risk
The Company is potentially exposed to concentrations ofcredit risk with trade accounts receivable, prepaid allowancesand financial instruments. Because the Company has a largeand diverse customer base with no single customer account-ing for a significant percentage of trade accounts receivableand prepaid allowances, there was no material concentrationof credit risk in these accounts at November 30, 2004. TheCompany evaluates the credit worthiness of the counterpar-ties to financial instruments and considers nonperformancecredit risk to be remote.
9. PENSION AND 401(k) RETIREMENT PLANS
The Company sponsors defined benefit pension plans in theU.S. and certain foreign locations. In addition, it sponsors401(k) retirement plans in the U.S. and contributes to govern-ment-sponsored retirement plans in locations outside the U.S.
Defined Benefit Pension Plans
A September 30th measurement date is utilized to value planassets and obligations for all of the Company’s defined benefitpension plans.
The significant assumptions used to determine benefitobligations are as follows:
United States International 2004 2003 2004 2003
Discount rate 6.0% 6.0% 5.3 - 5.8% 5.5 - 6.5%Salary scale 4.0% 4.0% 3.5 - 4.2% 3.5 - 4.0%Expected return on plan assets 8.5% 9.0% 6.5 - 8.5% 7.0 - 8.5%
The expected long-term rate of return on assets assump-tion is based on weighted-average expected returns for eachasset class. Expected returns reflect a combination of histor-ical performance analysis and the forward-looking views of thefinancial markets, and include input from actuaries, investmentservice firms and investment managers.
The Company’s pension expense is as follows:United States International
(millions) 2004 2003 2002 2004 2003 2002
Service cost $11.6 $11.0 $ 9.6 $ 5.4 $ 4.6 $ 3.5Interest costs 19.8 19.3 16.3 6.7 5.4 4.2 Expected return on
plan assets (18.6) (17.0) (17.8) (7.0) (6.7) (5.9)Amortization of prior
service costs – – – .1 .1 .1Amortization of
transition assets – – .2 (.1) (.1) – Curtailment loss – – – – .1 – Recognized net
actuarial loss 11.5 7.4 3.5 .6 – – Other retirement plans – – – – – 1.5Less: discontinued
operations – (2.0) (2.2) – – –
$24.3 $18.7 $ 9.6 $ 5.7 $ 3.4 $ 3.4
Rollforwards of the benefit obligation, fair value of planassets and a reconciliation of the pension plans’ funded statusat the measurement date, September 30, follow:
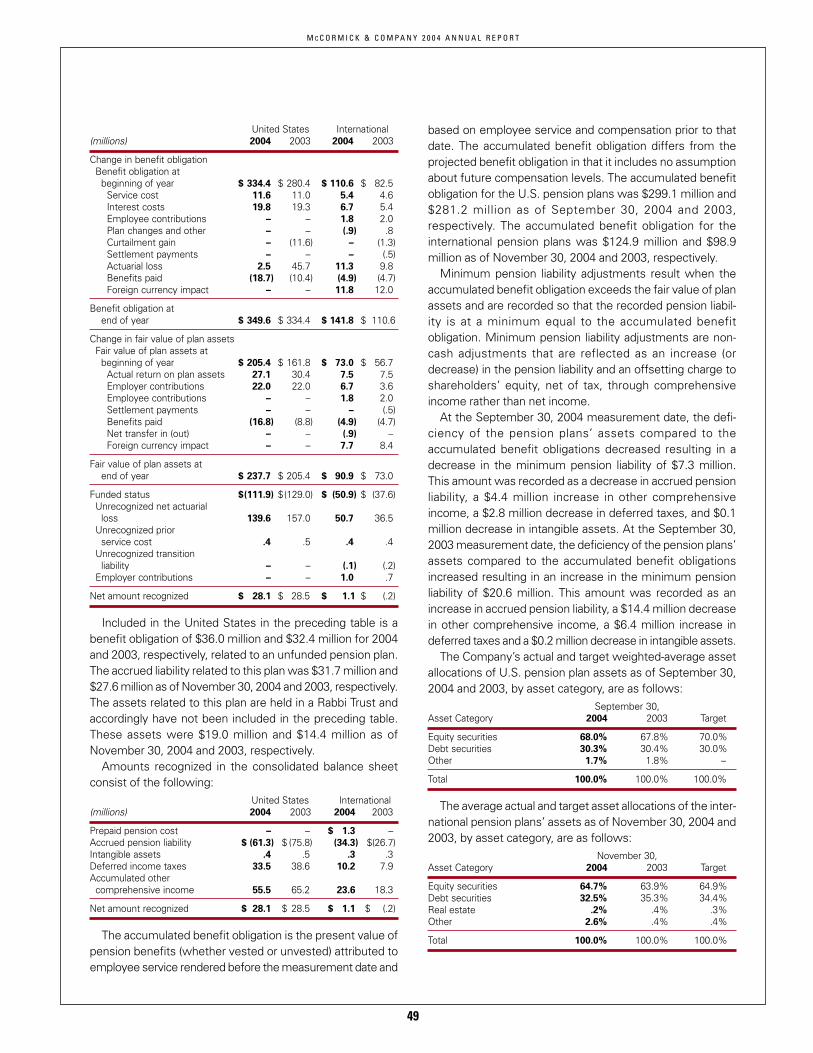
M C C O R M I C K & C O M P A N Y 2 0 0 4 A N N U A L R E P O R T
49
United States International (millions) 2004 2003 2004 2003
Change in benefit obligation Benefit obligation at
beginning of year $ 334.4 $ 280.4 $ 110.6 $ 82.5Service cost 11.6 11.0 5.4 4.6Interest costs 19.8 19.3 6.7 5.4Employee contributions – .– 1.8 2.0Plan changes and other – – (.9) .8 Curtailment gain – .(11.6) – (1.3)Settlement payments .– .– – (.5) Actuarial loss 2.5 45.7 11.3 9.8Benefits paid (18.7) (10.4) (4.9) (4.7) Foreign currency impact – .– 11.8 12.0
Benefit obligation at end of year $ 349.6 $ 334.4 $ 141.8 $ 110.6
Change in fair value of plan assets Fair value of plan assets at
beginning of year $ 205.4 $ 161.8 $ 73.0 $ 56.7Actual return on plan assets 27.1 30.4 7.5 7.5Employer contributions 22.0 22.0 6.7 3.6Employee contributions – .– 1.8 2.0 Settlement payments .– .– .– (.5)Benefits paid (16.8) (8.8) (4.9) (4.7)Net transfer in (out) – .– (.9) .–Foreign currency impact – .– 7.7 8.4
Fair value of plan assets atend of year $ 237.7 $ 205.4 $ 90.9 $ 73.0
Funded status $(111.9) $(129.0) $ (50.9) $ (37.6)Unrecognized net actuarial
loss 139.6 157.0 50.7 36.5Unrecognized prior
service cost .4 .5 .4 .4 Unrecognized transition
liability – – (.1) (.2)Employer contributions – .– 1.0 .7
Net amount recognized $ 28.1 $ 28.5 $ 1.1 $ (.2)
Included in the United States in the preceding table is abenefit obligation of $36.0 million and $32.4 million for 2004and 2003, respectively, related to an unfunded pension plan.The accrued liability related to this plan was $31.7 million and$27.6 million as of November 30, 2004 and 2003, respectively.The assets related to this plan are held in a Rabbi Trust andaccordingly have not been included in the preceding table.These assets were $19.0 million and $14.4 million as ofNovember 30, 2004 and 2003, respectively.
Amounts recognized in the consolidated balance sheetconsist of the following:
United States International(millions) 2004 2003 2004 2003
Prepaid pension cost – – $ 1.3 –Accrued pension liability $ (61.3) $ (75.8) (34.3) $(26.7) Intangible assets .4 .5 .3 .3Deferred income taxes 33.5 38.6 10.2 7.9Accumulated other
comprehensive income 55.5 65.2 23.6 18.3
Net amount recognized $ 28.1 $ 28.5 $ 1.1 $ (.2)
The accumulated benefit obligation is the present value ofpension benefits (whether vested or unvested) attributed toemployee service rendered before the measurement date and
based on employee service and compensation prior to thatdate. The accumulated benefit obligation differs from theprojected benefit obligation in that it includes no assumptionabout future compensation levels. The accumulated benefitobligation for the U.S. pension plans was $299.1 million and$281.2 million as of September 30, 2004 and 2003,respectively. The accumulated benefit obligation for theinternational pension plans was $124.9 million and $98.9million as of November 30, 2004 and 2003, respectively.
Minimum pension liability adjustments result when theaccumulated benefit obligation exceeds the fair value of planassets and are recorded so that the recorded pension liabil-ity is at a minimum equal to the accumulated benefitobligation. Minimum pension liability adjustments are non-cash adjustments that are reflected as an increase (ordecrease) in the pension liability and an offsetting charge toshareholders’ equity, net of tax, through comprehensiveincome rather than net income.
At the September 30, 2004 measurement date, the defi-ciency of the pension plans’ assets compared to theaccumulated benefit obligations decreased resulting in adecrease in the minimum pension liability of $7.3 million.This amount was recorded as a decrease in accrued pensionliability, a $4.4 million increase in other comprehensiveincome, a $2.8 million decrease in deferred taxes, and $0.1million decrease in intangible assets. At the September 30,2003 measurement date, the deficiency of the pension plans’assets compared to the accumulated benefit obligationsincreased resulting in an increase in the minimum pensionliability of $20.6 million. This amount was recorded as anincrease in accrued pension liability, a $14.4 million decreasein other comprehensive income, a $6.4 million increase indeferred taxes and a $0.2 million decrease in intangible assets.
The Company’s actual and target weighted-average assetallocations of U.S. pension plan assets as of September 30,2004 and 2003, by asset category, are as follows:
September 30,Asset Category 2004 2003 Target
Equity securities 68.0% 67.8% 70.0%Debt securities 30.3% 30.4% 30.0%Other 1.7% 1.8% –
Total 100.0% 100.0% 100.0%
The average actual and target asset allocations of the inter-national pension plans’ assets as of November 30, 2004 and2003, by asset category, are as follows:
November 30,Asset Category 2004 2003 Target
Equity securities 64.7% 63.9% 64.9%Debt securities 32.5% 35.3% 34.4%Real estate .2% .4% .3%Other 2.6% .4% .4%
Total 100.0% 100.0% 100.0%

M C C O R M I C K & C O M P A N Y 2 0 0 4 A N N U A L R E P O R T
50
notes to consolidated financial statements
The investment objectives of the pension benefit plans areto secure the benefit obligations to participants at a reasonablecost to the Company. The goal is to optimize the long-termreturn on plan assets at a moderate level of risk, by balancinghigher-returning assets such as equity securities, with lessvolatile assets, such as fixed income securities. The assets aremanaged by professional investment firms and performanceis evaluated quarterly against specific benchmarks.
Equity securities in the U.S. plan included the Company’sstock with a fair value of $33.6 million (0.9 million shares and13.5% of total U.S. pension plan assets) and $26.4 million (0.9million shares and 12.4% of total U.S. pension plan assets)at November 30, 2004 and 2003, respectively. Dividends paidon these shares were $0.5 million in 2004 and $0.4 millionin 2003.
Pension benefit payments are made from assets of thepension plans. It is anticipated that future benefit paymentsfor the U.S. plans will be as follows:
United StatesFiscal year Expected payments (millions)
2005 $ 13.02006 13.82007 15.02008 17.3 2009 18.12010 - 2014 117.7
It is anticipated that future benefit payments for the inter-national plans will be as follows:
InternationalFiscal year Expected payments (millions)
2005 $ 6.52006 4.22007 4.52008 5.7 2009 6.02010 - 2014 36.3
The Company expects to contribute approximately $28 million to its U.S. pension plans and $9 million to itsinternational pension plans in 2005.
401(k) Retirement Plans
Effective March 22, 2002, the U.S. McCormick 401(k)Retirement Plan was amended to provide that the McCormickStock Fund investment option be designated an employeestock ownership plan (ESOP). This designation allows partic-ipants investing in McCormick stock to elect to receive, incash, dividends that are paid on McCormick stock held in their401(k) Retirement Plan accounts. Dividends may also continueto be reinvested.
For the U.S. McCormick 401(k) Retirement Plan, theCompany matches 100% of the participant’s contribution upto the first 3% of the participant’s salary, and 50% of the next2% of a participant’s salary. Certain U.S. subsidiaries sponsorseparate 401(k) retirement plans. Company contributions
charged to expense under all 401(k) Retirement Plans were$5.7 million, $5.4 million and $5.5 million in 2004, 2003 and2002, respectively.
At the participant’s election, all 401(k) Retirement Plans held4.0 million shares, with a fair value of $144.2 million, of theCompany’s stock at November 30, 2004. Dividends paid onthese shares in 2004 were $2.3 million.
10. POSTRETIREMENT BENEFITS OTHER THAN PENSIONS
During 2002, the Company changed certain postretirementbenefits for employees who retire on or after January 1, 2004.Life insurance benefits changed to a fixed amount, Medicareeligible retirees have a fixed amount for medical plan cover-age and the medical cost sharing for dependents increased.
The Company currently provides postretirement medicaland life insurance benefits to certain U.S. employees whowere covered under the active employees’ plan and retireafter age 55 with at least 10 years of service (earned after age45). The benefits provided under these plans are based prima-rily on age at date of retirement.
The Company’s other postretirement benefit expensefollows:(millions) 2004 2003 2002
Service cost $ 2.7 $ 2.9 $ 3.1Interest costs 5.3 5.7 5.7Amortization of prior service cost (1.1) (1.4) (.6) Amortization of (gains)/losses 1.1 .9 –One time recognition of curtailment gain – (3.5) –Discontinued operations – 1.4 (2.4)
Postretirement benefit expense $ 8.0 $ 6.0 $ 5.8
Rollforwards of the benefit obligation, fair value of planassets and a reconciliation of the plans’ funded status atNovember 30, the measurement date, follow:(millions) 2004 2003
Change in benefit obligationBenefit obligation at beginning of year $ 95.9 $ 83.8
Service cost 2.7 2.9Interest costs 5.3 5.7Employee contributions 2.6 2.4Plan changes – –Actuarial (gain)/loss (6.7) 8.1Benefits paid (7.4) (7.0)
Benefit obligation at end of year $ 92.4 $ 95.9
Change in fair value of plan assetsFair value of plan assets at beginning of year – –
Employer contributions $ 4.8 $ 4.6Employee contributions 2.6 2.4Benefits paid (7.4) (7.0)
Fair value of plan assets at end of year $ – $ –
Funded status $(92.4) $(95.9) Unrecognized net actuarial loss 14.6 22.5 Unrecognized prior service cost (7.7) (8.8)
Other postretirement benefit liability $(85.5) $(82.2)

M C C O R M I C K & C O M P A N Y 2 0 0 4 A N N U A L R E P O R T
51
Estimated future benefit payments for the next 10 years areas follows:
Retiree Retiree LifeFiscal Year Medical Insurance Total (millions)
2005 $ 5.4 $ .7 $ 6.12006 5.5 .7 6.22007 5.8 .8 6.62008 6.0 .8 6.82009 6.3 .9 7.22010 - 2014 36.7 5.0 $41.7
The assumed discount rate was 6.0% for 2004 and 2003,respectively.
The assumed annual rate of increase in the cost of coveredhealth care benefits is 8.0% for 2005. It is assumed todecrease gradually to 4.5% in the year 2011 and remain at thatlevel thereafter. Changing the assumed health care cost trendwould have the following effect:
1-Percentage- 1-Percentage-(millions) point increase point decrease
Effect on total of service and interest cost components in 2004 $ .9 $ (.8)
Effect on benefit obligation as of November 30, 2004 9.2 (7.7)
In December of 2003, the Medicare Prescription DrugImprovement and Modernization Act of 2003 (the Act) wasenacted in the U.S. The Act introduced a prescription drugbenefit under Medicare as well as a federal subsidy of 28%of drug costs between $250 and $5,000, tax-free (theSubsidy), to sponsors of retiree health benefit plans thatprovide a benefit that meets certain criteria. The Company’sother postretirement plans covering U.S. retirees currentlyprovide certain prescription benefits to eligible participants.The Company’s actuaries have determined that one of theCompany’s prescription drug plans for retirees and theirdependents retired prior to January 1, 2004 provides a bene-fit that is at least actuarially equivalent to Medicare Part Dunder the Act.
In connection with the adoption of FASB Staff Position106-2, the Act had the effect of reducing the accumulatedpostretirement benefit obligation by $3.0 million. This resultedin an unrecognized net gain to the plan, which is currentlybeing amortized. The annual reduction in the Company’sother postretirement benefits expense due to the Subsidy isexpected to be approximately $0.4 million, which includes theamortization of the unrecognized net gain. The provisions ofthe Act do not have a material effect on the consolidated finan-cial statements.
11. INCOME TAXES
The provision for income taxes consists of the following:(millions) 2004 2003 2002
Income taxesCurrent
Federal $ 67.4 $ 48.2 $ 29.3State 7.7 4.1 1.4International 15.6 15.5 17.6
90.7 67.8 48.3
DeferredFederal 1.5 15.3 19.6State – 1.4 1.9International (3.2) (1.1) (.4)
(1.7) 15.6 21.1
Total income taxes $ 89.0 $ 83.4 $ 69.4
The components of income from consolidated continuingoperations before income taxes follow:(millions) 2004 2003 2002
Pretax incomeUnited States $204.5 $175.6 $140.7International 89.3 94.4 83.2
$293.8 $270.0 $223.9
A reconciliation of the U.S. federal statutory rate with theeffective tax rate follows:
2004 2003 2002
Federal statutory tax rate 35.0% 35.0% 35.0%State income taxes, net of
federal benefits 1.7 1.3 1.0Tax effect of international operations (5.8) (5.3) (4.4)Tax credits (.5) (.8) (1.2)Other, net (.1) .7 .6
Effective tax rate 30.3% 30.9% 31.0%
Deferred tax assets and liabilities are comprised of the following:(millions) 2004 2003
Deferred tax assetsEmployee benefit liabilities $ 58.0 $ 56.6Accrued expenses and other reserves 19.8 18.1Inventory 3.7 4.9Net operating and capital loss
carryforwards 11.5 7.9Other 38.5 30.7Valuation allowance (13.3) (7.0)
118.2 111.2
Deferred tax liabilitiesDepreciation 54.7 49.4Other 38.4 36.1
93.1 85.5
Net deferred tax asset $ 25.1 $ 25.7

M C C O R M I C K & C O M P A N Y 2 0 0 4 A N N U A L R E P O R T
52
notes to consolidated financial statements
At November 30, 2004, non-U.S. subsidiaries of theCompany have tax loss carryforwards of $22.0 million. Ofthese carryforwards, $11.6 million expire through 2014 and$10.4 million may be carried forward indefinitely. The currentstatutory rates in these countries range from 19% to 35%.
At November 30, 2004, non-U.S. subsidiaries of theCompany have capital loss carryforwards of $15.8 million. Ofthese carryforwards, $2.9 million expire in 2009 and $12.9million may be carried forward indefinitely. The current statu-tory rates in these countries range from 30% to 35%.
A valuation allowance has been provided to record deferredtax assets at their net realizable value. The 2004 net changein valuation allowance for deferred tax assets was an increaseof $6.3 million. During 2004, the Company utilized $2.5 millionof non-U.S. subsidiary tax loss carryforwards which previouslyhad valuation allowances. This was offset by $8.8 million ofadditions to the valuation allowance for tax assets added in2004 which may not be realized in future periods.
U.S. income taxes are not provided for unremitted earningsof international subsidiaries and affiliates where theCompany’s intention is to reinvest these earnings perma-nently or to repatriate the earnings when it is tax effective todo so. Accordingly, the Company believes that any U.S. taxon repatriated earnings would be substantially offset by U.S.foreign tax credits. Unremitted earnings of such entities were$230.5 million at November 30, 2004.
12. EMPLOYEE STOCK OPTION AND PURCHASE PLANS
Under the Company’s various stock option plans, options topurchase shares of the Company’s common stock weregranted to employees and directors. The option price forshares granted under these plans is the fair market value onthe grant date and the grants have ten-year terms.
The Company has Employee Stock Purchase Plans (ESPP)enabling employees in the U.S. and certain other countries topurchase the Company’s Common Stock Non-Voting at thelower of the stock price on the grant date or the exercise date.Similarly, options are granted for certain foreign-based employ-ees in lieu of their participation in the ESPP. Options grantedunder these plans have two- or three-year terms.
A summary of the Company’s stock option activity for theyears ended November 30, 2004, 2003 and 2002 follows:(shares in millions) 2004 2003 2002
Weighted- Weighted- Weighted- average average averageexercise exercise exercise
Shares price Shares price Shares price
Beginning of year 17.4 $18.60 14.6 $17.25 13.0 $15.46Granted 4.1 $30.71 4.6 $22.57 3.8 $21.39Exercised (3.9) $16.75 (1.6) $17.43 (1.9) $13.36Forfeited (.2) $24.16 (.2) $20.58 (.3) $17.09
End of year 17.4 $21.81 17.4 $18.60 14.6 $17.25
Exercisable – end of year 8.7 $18.24 8.8 $16.69 6.4 $15.67
A summary of the Company’s stock options outstanding atNovember 30, 2004 follows:(shares in millions) Options outstanding Options exercisable
Weighted- Weighted- Weighted- Range of average average average exercise remaining exercise exercise
price Shares life (yrs) price Shares price
$ 9.29 - $16.26 2.7 4.8 $13.38 2.7 $13.38$16.26 - $23.23 10.4 6.7 $20.43 5.5 $19.64$23.23 - $30.19 .3 1.6 $24.71 .3 $24.49$30.19 - $37.16 4.0 8.9 $30.71 .2 $32.16
17.4 6.8 $21.81 8.7 $18.24
Under all stock purchase and option plans, there were 12.6million and 9.8 million shares reserved for future grants atNovember 30, 2004 and 2003, respectively.
Included in stock options exercised are non-cash optionswaps and taxes paid with shares of $12.8 million, $1.1 millionand $1.7 million for November 30, 2004, 2003 and 2002,respectively. These amounts have been excluded fromcommon stock issued and acquired by purchase in the consol-idated cash flow statement as these are non-cash transactions.
13. EARNINGS PER SHARE
The reconciliation of shares outstanding used in the calcula-tion of basic and diluted earnings per share for the yearsended November 30, 2004, 2003 and 2002 follows:(millions) 2004 2003 2002
Average shares outstanding – basic 137.0 139.2 139.5Effect of dilutive securities:
Stock options and ESPP 4.3 3.4 2.8
Average shares outstanding – diluted 141.3 142.6 142.3
14. CAPITAL STOCKS
Holders of Common Stock have full voting rights except that(1) the voting rights of persons who are deemed to ownbeneficially 10% or more of the outstanding shares ofCommon Stock are limited to 10% of the votes entitled to becast by all holders of shares of Common Stock regardless ofhow many shares in excess of 10% are held by such person;(2) the Company has the right to redeem any or all shares ofstock owned by such person unless such person acquiresmore than 90% of the outstanding shares of each class of theCompany’s common stock; and (3) at such time as suchperson controls more than 50% of the vote entitled to be castby the holders of outstanding shares of Common Stock, auto-matically, on a share-for-share basis, all shares of CommonStock Non-Voting will convert into shares of Common Stock.
Holders of Common Stock Non-Voting will vote as a sepa-rate class on all matters on which they are entitled to vote.Holders of Common Stock Non-Voting are entitled to vote onreverse mergers and statutory share exchanges where thecapital stock of the Company is converted into other securi-ties or property, dissolution of the Company and the sale ofsubstantially all of the assets of the Company, as well asforward mergers and consolidation of the Company.

M C C O R M I C K & C O M P A N Y 2 0 0 4 A N N U A L R E P O R T
53
15. COMMITMENTS AND CONTINGENCIES
The Company is a party to various pending legal proceedingsand claims, tax issues and other matters arising out of thenormal course of business. Although the results of pendingclaims and litigation cannot be predicted with certainty, inmanagement’s opinion, the final outcome of these proceed-ings and claims, tax issues and other matters will not have amaterial effect on the consolidated results of operations,financial position or cash flows of the Company.
16. BUSINESS SEGMENTS AND GEOGRAPHIC AREAS
Business Segments
The Company operates in two business segments: consumerand industrial. The Company sold its packaging segmentduring the third quarter of 2003 (see Note 3). The consumerand industrial segments manufacture, market and distributespices, herbs, seasonings, condiments and other flavorsthroughout the world. The consumer segment sells to retailoutlets, including grocery, drug, dollar and mass merchandisestores under a variety of brands, including McCormick andZatarain’s in the U.S., Ducros, Vahine and Silvo in continentalEurope, Club House in Canada, and Schwartz in the U.K. Theindustrial segment sells to other food processors and therestaurant industry both directly and through distributors andwarehouse clubs.
In each of its segments, the Company produces and sellsmany individual products which are similar in composition andnature. It is impractical to segregate and identify profits foreach of these individual product lines.
The Company measures segment performance based onoperating income. Although the segments are managed sepa-rately due to their distinct distribution channels and marketingstrategies, manufacturing and warehousing are often inte-grated to maximize cost efficiencies. Management does notsegregate jointly utilized assets by individual segment forinternal reporting, evaluating performance or allocating capi-tal. Asset-related information has been disclosed in aggregate.
Accounting policies for measuring segment operatingincome and assets are substantially consistent with thosedescribed in Note 1, “Summary of Significant AccountingPolicies.” Because of manufacturing integration for certainproducts within the segments, products are not sold from onesegment to another but rather inventory is transferred atcost. Intersegment sales are not material. Corporate andother includes general corporate expenses and charges notdirectly attributable to the segments. Corporate assets includecash, deferred taxes, certain investments and fixed assets.
Segment information for the years ended November 30,2003 and November 30, 2002 has been restated to excludediscontinued operations. Certain fixed overhead charges previ-ously allocated to Packaging were reallocated to other segments.
Total Corporate(millions) Consumer Industrial Food & Other Total
2004
Net sales $1,339.8 $1,186.4 $2,526.2 – $2,526.2
Special charges (credits) 1.0 3.0 4.0 $ (6.5) (2.5)
Operating income 269.7 113.6 383.3 (50.6) 332.7
Income from unconsolidated operations 12.3 2.3 14.6 – 14.6
Goodwill, net 664.9 48.0 712.9 – 712.9
Assets – – 2,179.1 190.5 2,369.6
Capital expenditures – – 65.6 4.2 69.8
Depreciation and amortization – – 61.1 10.9 72.0
2003Net sales $1,162.3 $1,107.3 $2,269.6 – $2,269.6 Special charges 1.8 2.3 4.1 $ 1.4 5.5Operating income 230.9 108.9 339.8 (44.3) 295.5Income from unconsolidated operations 14.8 1.6 16.4 – 16.4Goodwill, net 664.9 43.8 708.7 – 708.7 Assets – – 2,003.9 141.6 2,145.5Capital expenditures – – 74.9 16.7 91.6Depreciation and amortization – – 56.1 9.2 65.3
2002Net sales $ 993.9 $1,051.0 $2,044.9 – $2,044.9Special charges 2.7 1.8 4.5 $ 3.0 7.5Operating income 191.9 107.3 299.2 (36.8) 262.4 Income from unconsolidated operations 21.2 1.2 22.4 – 22.4Goodwill, net 458.2 40.5 498.7 – 498.7Assets (a) – – 1,636.7 153.4 1,790.1Capital expenditures – – 86.8 13.6 100.4 Depreciation and amortization – – 46.8 6.6 53.4
(a) 2002 amount does not include $140.7 million of assets related to discontinued operations.

M C C O R M I C K & C O M P A N Y 2 0 0 4 A N N U A L R E P O R T
54
notes to consolidated financial statements
(millions) 2004 2003 2002
Depreciation $ 71.5 $ 64.8 $ 53.0Interest paid 41.0 39.0 43.1Income taxes paid 77.6 80.7 57.9Interest capitalized 2.7 2.7 3.3
(millions) 2004 2003
Accumulated other comprehensive income, net of tax where applicable
Foreign currency translation adjustment $210.8 $117.9Unrealized loss on foreign currency
exchange contracts (2.8) (1.8) Fair value of open interest rate swaps (6.0) (6.9) Unamortized value of settled interest rate swaps (3.3) (4.9)Net unrealized loss on pension assets – (.8)Minimum pension liability adjustment (79.1) (83.5)
$119.6 $ 20.0
Dividends paid per share were $0.56 in 2004, $0.46 in2003 and $0.42 in 2002.
Geographic Areas
The Company has net sales and long-lived assets in thefollowing geographic areas:
United Other(millions) States Europe countries Total
2004
Net sales $ 1,558.9 $ 610.5 $ 356.8 $2,526.2
Long-lived assets (1) 511.5 709.1 94.1 1,314.7
2003Net sales $ 1,401.4 $ 538.2 $ 330.0 $2,269.6Long-lived assets (1) 519.7 569.3 86.2 1,175.2
2002Net sales $ 1,312.2 $ 434.2 $ 298.5 $2,044.9Long-lived assets (1) 312.1 510.5 72.7 895.3
(1) Long-lived assets include property, plant and equipment, goodwill and intangibleassets, net of accumulated depreciation and amortization.
17. SUPPLEMENTAL FINANCIAL STATEMENT DATA
In 2003, the Company sold its interest in non-strategic royaltyagreements for $5.2 million in cash. This sale resulted in a one-time gain of $5.2 million which is included in “Other income,net” in the consolidated statement of income for 2003.
Supplemental income statement, balance sheet and cashflow information is as follows:
(millions) 2004 2003
InventoriesFinished products and work-in-process $196.7 $190.6Raw materials 153.5 172.2
$350.2 $362.8
Property, plant and equipmentLand and improvements $ 28.0 $ 22.1Buildings 258.1 227.8Machinery and equipment 631.2 569.7Construction in progress 71.7 92.8Accumulated depreciation (502.4) (454.1)
$486.6 $458.3
Investments and other assetsInvestments in affiliates $ 76.2 $ 70.8Other investments 27.2 21.3Other assets 30.7 35.0
$134.1 $127.1
Other accrued liabilitiesPayroll and employee benefits $ 86.5 $ 83.2Sales allowances 121.3 98.4Income taxes 21.0 26.4Other 175.6 152.2
$404.4 $360.2
Other long-term liabilitiesPension $ 99.1 $105.5Postretirement benefits 85.5 82.2Other 26.6 21.8
$211.2 $209.5

M C C O R M I C K & C O M P A N Y 2 0 0 4 A N N U A L R E P O R T
55
18. SELECTED QUARTERLY DATA (UNAUDITED)
(millions except per share data) First Second Third Fourth
2004
Net sales $572.4 $596.2 $613.5 $744.1
Gross profit 221.7 231.9 239.2 315.1
Operating income 61.4 69.7 74.0 127.6
Net income 38.1 42.9 46.2 87.3
Basic earnings per share .28 .31 .34 .64
Diluted earnings per share .27 .30 .33 .62
Dividends paid per share –
Common Stock and
Common Stock Non Voting .14 .14 .14 .14
Market Price – Common Stock
High 31.25 35.45 35.97 37.50
Low 28.86 31.22 32.40 33.10
Market price – Common Stock
Non Voting
High 31.27 35.56 36.07 37.41
Low 28.84 31.00 32.25 33.14
2003Net sales $485.4 $527.9 $557.6 $698.7Gross profit 186.1 197.8 212.5 302.2Operating income 55.0 56.4 62.7 121.4Net income from
continuing operations 33.4 38.5 40.1 87.2Net income 35.1 40.0 51.3 84.4Basic earnings per share
Continuing operations .24 .28 .29 .63Discontinued operations .01 .01 .01 –Gain on sale of
discontinued operations – – .07 –Cumulative effect – – – (.02)Net income .25 .29 .37 .61
Diluted earnings per shareContinuing operations .23 .27 .28 .61Discontinued operations .01 .01 .01 –Gain on sale of
discontinued operations – – .07 –Cumulative effect – – – (.01)Net income .25 .28 .36 .59
Dividends paid per share –Common Stock and Common Stock Non Voting .11 .11 .12 .12
Market Price – Common StockHigh 24.00 26.50 26.80 30.15Low 22.05 23.00 25.35 26.26
Market price – Common Stock Non Voting
High 24.04 26.90 27.40 30.21Low 22.10 23.11 25.30 26.43
In the second quarter of 2004, the Company settled a classaction lawsuit in the Company’s favor, resulting in a net one-time gain of $8.7 million, included in special charges/(credits).See Note 4 for further information.
In the fourth quarter of 2003, the Company consolidated thelessor of a leased distribution center in accordance with theprovisions of FASB Interpretation No. 46, resulting in acumulative effect of an accounting change of $(2.1) million,net of tax. See Note 1 for further information. Also in the fourthquarter of 2003, the Company sold its interest in non-strategicroyalty agreements, which resulted in a one-time gain of $5.2 million.
In the third quarter of 2003, the Company disposed of itsU.K. brokerage business and its packaging segment, result-ing in a net gain of $9.0 million. Financial information forprevious quarters was reclassified to present the results ofthese discontinued operations separately from continuingoperations. Refer to Note 3 for further information.

M C C O R M I C K & C O M P A N Y 2 0 0 4 A N N U A L R E P O R T
56
historical financial summary
(millions except per share data) 2004 2003 2002 2001 2000 1999 1998 1997 1996 1995 1994
For the year
Net sales under EITF 01-09 (1) $2,526.2 $2,269.6 $2,044.9 $1,939.1 $1,863.5 – – – – – – Net sales prior to EITF 01-09 (1) – – – 2,092.9 1,945.1 $1,837.2 $1,722.3 $1,621.1 $1,571.1 $1,543.3 $1,389.1
Percent increase 11.3% 11.0% 5.5% 4.1% 5.9% 6.7% 6.2% 3.2% 1.8% 11.1% 8.9%Operating income 332.7 295.5 262.4 219.6 200.5 149.2 163.9 153.9 92.3 152.2 66.3 Income from unconsolidated
operations 14.6 16.4 22.4 21.5 18.6 13.4 6.2 7.7 5.6 2.1 7.9Net income from continuing
operations 214.5 199.2 173.8 137.1 124.5 88.1 95.3 89.4 45.4 77.8 32.1Net income (2) (3) (4) (5) (6) 214.5 210.8 179.8 146.6 137.5 103.3 103.8 98.4 41.9 97.5 61.2
Per common share (7)
Earnings per share – dilutedContinuing operations $1.52 $1.40 $1.22 $.98 $.89 $.61 $.65 $.59 $.28 $.48 $.20Discontinued operations (2) (5) – .09 .04 .07 .09 .07 .06 .06 .03 .12 .18Extraordinary item – – – – – – – – (.05) – –Accounting change (3) (6) – (.01) – – – .04 – – – – –Net income 1.52 1.48 1.26 1.05 .99 .72 .71 .65 .26 .60 .38
Earnings per share – basic (2) (3) (5) (6) 1.57 1.51 1.29 1.06 1.00 .72 .70 .65 .26 .60 .38 Common dividends declared (8) .58 .49 .425 .405 .385 .350 .325 .305 .285 .265 .245Market closing price – end of year 36.45 28.69 23.79 21.50 18.63 16.03 16.69 13.25 12.32 11.82 9.50Book value per share 6.57 5.50 4.23 3.36 2.63 2.72 2.68 2.66 2.88 3.20 3.02
At Year-End (5)
Total assets $2,369.6 $2,145.5 $1,930.8 $1,772.0 $1,659.9 $1,188.8 $1,259.1 $1,256.2 $1,326.6 $1,614.3 $1,555.7Current debt 173.2 171.0 137.3 210.8 551.9 100.6 163.6 121.3 108.9 297.3 214.0Long-term debt 465.0 448.6 450.9 451.1 157.2 238.4 247.4 276.5 291.2 349.1 374.3Shareholders’ equity 889.7 755.2 592.3 463.1 359.3 382.4 388.1 393.1 450.0 519.3 490.0Total capital (9) 1,558.9 1,397.0 1,199.4 1,138.0 1,079.8 721.4 799.1 790.9 850.1 1,165.7 1,078.3
Statistics & Ratios
Percentage of net salesGross profit under EITF 01-09 (1) 39.9% 39.6% 39.1% 38.0% 35.2% – – – – – –Gross profit prior to EITF 01-09 (1) – – – 43.5% 38.5% 36.2% 35.0% 35.5% 36.0% 34.9% 36.8%Operating income
under EITF 01-09 (1) 13.2% 13.0% 12.8% 11.3% 10.8% – – – – – –Operating income
prior to EITF 01-09 (1) – – – 10.5% 10.3% 8.1% 9.5% 9.5% 5.9% 9.9% 4.8%Net income from continuing
operations 8.5% 8.8% 8.5% 7.1% 6.7% 4.8% 5.5% 5.5% 2.9% 5.0% 2.3%Effective tax rate 30.3% 30.9% 31.0% 32.6% 35.5% 40.4% 35.7% 36.8% 38.6% 35.7% 40.5%Depreciation and amortization (4) $72.0 $65.3 $53.4 $60.7 $49.7 $46.1 $43.7 $38.6 $52.6 $52.2 $52.0 Capital expenditures $69.8 $91.6 $100.4 $96.8 $42.0 $41.0 $37.8 $34.2 $63.8 $71.3 $71.0Debt-to-total-capital 40.9% 44.4% 49.0% 58.2% 65.7% 47.0% 51.4% 50.3% 47.1% 55.5% 54.6%Average shares outstanding (7)
Basic 137.0 139.2 139.5 137.8 137.6 142.8 146.6 151.4 161.2 162.4 162.4Diluted 141.3 142.6 142.3 140.2 139.2 144.0 147.6 151.8 161.4 162.6 163.2
(1) In 2002, the Company implemented EITF 01-09. Results have been reclassified for 2001 and 2000.
(2) The Company sold both Gilroy Foods, Incorporated and Gilroy Energy Company, Inc. in 1996.
(3) In 1999, the Company changed its actuarial method for computing pension expense.
(4) In 2002, the Company adopted SFAS No. 142, “Goodwill and Other Intangible Assets.” Prior year results have not been adjusted.
(5) In 2003, the Company sold its packaging segment and Jenks Sales Brokers in the U.K. All years have been restated for the sale of the packaging segment. Only 2002 and 2001 have been restated for the sale of Jenks.
(6) In 2003, the Company consolidated the lessor of a leased distribution center in accordance with FASB Interpretation No. 46, “Consolidation of Variable Interest Entities,” as revised.
(7) All share data adjusted for 2-for-1 stock split effective April 2002.
(8) Includes fourth quarter dividends which, in some years, were declared in December following the close of each fiscal year.
(9) Total capital includes debt, minority interest and shareholders’ equity.

M C C O R M I C K & C O M P A N Y 2 0 0 4 A N N U A L R E P O R T
2005 Flavor Forecast
McCormick keeps its finger on the
pulse of flavor and food trends. We
published the McCormick 2005 Flavor
Forecast to showcase the tastes and
trends that will shape the way
people eat in coming years for our
customers and the media.
Throughout this year’s annual
report, discover new uses for these
products from some of our flavor
experts.
10 flavors to watch> Allspice > Ginger> Annatto > Mint> Cardamom > Pickling Spice> Cinnamon > Sage> Curry > Vanilla
5 trends to watchSatisfying the senses – A true multi-sensory experience delivered by theeffortless combination of flavors, colors, aromas and textures.
Location, location, location –
Ingredients from specific locationsknown for their premium flavors andfreshness.
Worldly tastes – Mini-flavor adven-tures that combine one or two globaltastes with familiar foods.
Health measures – Flavor is the keyto making food enjoyable for all typesof eating plans.
Elevating the basics – Classicfavorites reinvented to reach newheights in flavor.
Ginger
This year’s annual report carries the scent
of ginger. Often the “secret ingredient” in
flavorful dishes, this pungent spice
provides heat – but not the fire. It’s very
popular in Asian, Caribbean and North
African cuisines. On page 15 you can
discover how one of McCormick’s product
developers likes to use ginger.
Around the world, 8,000 McCormick employees areworking together to deliver great results – to ourcustomers, our consumers and our shareholders.
Acquisitions in 2003 and 2004
added annual sales of
nearly $200 million.
Debbie CalverEuropean Technical Manager,Flavour Group
57
M C C O R M I C K & C O M P A N Y 2 0 0 4 A N N U A L R E P O R T
investor information
This report is printed on recyclable paper. Adler Design Group designed this year’s report.
”I often sprinkleMcCormick curry powderalong with McCormickcoarse sea salt andMcCormick cracked blackpepper on roasted wintervegetables. This adds interest and excitement toan otherwise bland dish.The curry note works particularly well with a mixof sweet potatoes and bellpeppers, and you can useany of the McCormickcurry blends depending onyour preference for hot oraromatic flavor.”
World HeadquartersMcCormick & Company, Incorporated18 Loveton CircleSparks, MD 21152-6000U.S.A.(410) 771-7301www.mccormick.com
Stock InformationNew York Stock ExchangeSymbol: MKC
Anticipated Dividend Dates – 2005Record Date Payment Date
04/04/05 04/15/0507/08/05 07/22/0510/07/05 10/21/0512/30/05 01/20/06
McCormick has paid dividends for 80 consecutive years.
Independent AuditorsErnst & Young LLP621 East Pratt StreetBaltimore, MD 21202
CertificationsThe Company has filed the Chief Executive Officer and Chief Financial Officer certifications required by Section 302 of theSarbanes-Oxley Act in its Form 10-K. Additionally, the Chief ExecutiveOfficer has provided the required annual certifications to the New York Stock Exchange.
Investor InquiriesOur website www.mccormick.com has our corporate governanceprinciples, as well as annual reports, SEC filings, press releases,webcasts and other useful Company information.
To obtain without cost a copy of the annual report filed with theSecurities & Exchange Commission (SEC) on Form 10-K or forgeneral questions about McCormick or information in our annual orquarterly reports, contact Investor Relations at the world headquartersaddress, website or telephone:
Report ordering:(800) 424-5855 or (410) 771-7537
Investor and securities analysts’ inquiries:(410) 771-7244
Registered Shareholder InquiriesFor questions on your account, statements, dividend payments,reinvestment and direct deposit, and for address changes, lostcertificates, stock transfers, ownership changes or otheradministrative matters, contact our transfer agent.
Transfer Agent and RegistrarWells Fargo Bank, N.A.Shareowner Services161 North Concord Exchange Street, South St. Paul, MN 55075-1139
(877) 778-6784, or (651) 450-4064www.wellsfargo.com/shareownerservices
You may access your account information via the Internet atwww.shareowneronline.com
Investor Services Plan (Dividend Reinvestment and Direct Purchase Plan)The Company offers an Investor Services Plan which providesshareholders of record the opportunity to automatically reinvestdividends, make optional cash purchases of stock through theCompany, place stock certificates into safekeeping and sell sharesthrough the Plan. Individuals who are not current shareholders maypurchase their initial shares directly through the Plan. All transactionsare subject to the limitations set forth in the Plan prospectus, whichmay be obtained by contacting Wells Fargo Shareowner Services at:
(877) 778-6784 or (651) 450-4064www.wellsfargo.com/shareownerservices
Stock Price History3 months ended High Low Close
11/30/04 $37.41 $33.14 $36.4508/31/04 36.07 32.25 33.5505/28/04 35.56 31.00 35.4502/27/04 31.27 28.84 31.2711/28/03 30.21 26.43 28.69
Annual MeetingThe annual meeting of shareholders will be held at 10 a.m.,Wednesday, March 23, 2005, at Marriott’s Hunt Valley Inn, 245 Shawan Road (Exit 20A off I-83 north of Baltimore), Hunt Valley, Maryland 21031.
Online Receipt of Annual Report and Proxy StatementIf you are a registered shareholder and would like to access nextyear’s proxy statement and annual report over the Internet, go towww.econsent.com/mkcv/ to enroll for this service.
TrademarksUse of ® or TM in this annual report indicates trademarks owned orused by McCormick & Company, Incorporated and its subsidiaries and affiliates.

We’re turning up the heat !
MCCORMICK & COMPANY 2004 ANNUAL REPORT
MCC
OR
MIC
K&
CO
MPA
NY
2004A
NN
UA
L RE
PO
RT
McCormick & Company, Incorporated
18 Loveton Circle
Sparks, Maryland 21152-6000 U.S.A.
410-771-7301


