M A K E A DIFFERENCE - OTC Markets
268
adidas Group Annual Report 2014 MAKE A DIFFERENCE
Transcript of M A K E A DIFFERENCE - OTC Markets

a d i d a s G r o u pAnnual Report
2 0 1 4
20
14
AN
NU
AL
RE
PO
RT
221 mm
M A K E A D I F F E R E N C E

TARGETS – RESULTS – OUTLOOK
Targets 2014 Results 2014 1) 2) Outlook 2015 1)
Currency-neutral sales development:
adidas Groupincrease at a
high-single-digit rate
Currency-neutral sales development:
adidas Groupincrease of
6%
Group sales of
€ 14.534 billion
Currency-neutral sales development:
adidas Groupincrease at a
mid-single-digit rate
Gross margin
49.5% – 49.8%Gross margin
47.6%Gross margin
47.5 % – 48.5 %
Operating margin
8.5% – 9.0%Operating margin
6.6%Operating margin
6.5% – 7.0%
Average operating working capital (in % of sales)
moderate decline expected
Average operating working capital (in % of sales)
22.4%
Average operating working capital (in % of sales)
moderate decline
Capital expenditure
€ 500 million – € 550 millionCapital expenditure
€ 554 millionCapital expenditure
around € 600 million
Gross borrowings
further reductionGross borrowings
€ 1.873 billionGross borrowings
moderate decline
Net borrowings/EBITDA ratio
to be maintained below 2Net borrowings/EBITDA ratio
0.1Net borrowings/EBITDA ratio
to be maintained below 2
Net income attributable to shareholders
€ 830 million – € 930 million
Net income attributable to shareholders decreases 32% to
€ 568 million 3)
Earnings per share decrease 32% to
€ 2.72 3)
Net income from continuing operationsincrease at a rate of
7% – 10%
Shareholder value
further increaseadidas AG share price decreases
38 %
Dividend per share
€ 1.50 4)
Shareholder value
increase
1) Figures refl ect continuing operations as a result of the planned divestiture of the Rockport business.2) Excluding goodwill impairment of € 78 million3) Includes continuing and discontinued operations.4) Subject to Annual General Meeting approval.
200 mm

F IN A NC I A L H IGHL IGH T S2 0 14
01 / Financial Highlights (IFRS)
2014 2013 Change
Operating Highlights (€ in millions)
Net sales 1) 14,534 14,203 2.3%
EBITDA 1) 1,283 1,496 (14.3%)
Operating profi t 1) 3) 4) 961 1,233 (22.1%)
Net income attributable to shareholders 2) 3) 4) 568 839 (32.2%)
Key Ratios
Gross margin 1) 47.6% 49.3% (1.7pp)
Operating expenses in % of net sales 1) 42.7% 42.3% 0.3pp
Operating margin 1) 3) 4) 6.6% 8.7% (2.1pp)
Effective tax rate 1) 3) 4) 29.7% 29.2% 0.5pp
Net income attributable to shareholders in % of net sales 2) 3) 4) 3.9% 5.9% (2.0pp)
Average operating working capital in % of net sales 1) 22.4% 21.3% 1.0pp
Equity ratio 45.3% 47.3% (2.0pp)
Net borrowings/EBITDA 1) 0.1 (0.2) n.a.
Financial leverage 3.3% (5.4%) 8.7pp
Return on equity 2) 8.7% 14.3% (5.6pp)
Balance Sheet and Cash Flow Data (€ in millions)
Total assets 12,417 11,599 7.1%
Inventories 2,526 2,634 (4.1%)
Receivables and other current assets 2,861 2,583 10.8%
Working capital 2,970 2,125 39.7%
Net cash/(net borrowings) (185) 295 n.a.
Shareholders’ equity 5,624 5,489 2.5%
Capital expenditure 554 479 15.5%
Net cash generated from operating activities 2) 701 634 10.5%
Per Share of Common Stock (€)
Basic earnings 2) 3) 4) 2.72 4.01 (32.1%)
Diluted earnings 2) 3) 4) 2.72 4.01 (32.1%)
Net cash generated from operating activities 2) 3.36 3.03 10.7%
Dividend 1.50 5) 1.50 –
Share price at year-end 57.62 92.64 (37.8%)
Other (at year-end)
Number of employees 1) 53,731 49,808 7.9%
Number of shares outstanding 204,327,044 209,216,186 (2.3%)
Average number of shares 208,776,457 209,216,186 (0.2%)
1) 2014 and 2013 refl ect continuing operations as a result of the planned divestiture of the Rockport business.2) Includes continuing and discontinued operations.3) 2014 excluding goodwill impairment of € 78 million.4) 2013 excluding goodwill impairment of € 52 million.5) Subject to Annual General Meeting approval.

OUR BRANDS
TaylorMade
TaylorMade leads the golf industry in metalwood sales and is the number one driver brand on the world’s six major professional golf tours. The brand is recognised globally for its capacity to develop innovative and performance-enhancing technologies for drivers,
fairway woods, hybrids, irons, putters and balls.
adidas Golf
adidas Golf develops high-performance golf footwear and apparel for active, serious, athletic-minded golfers seeking products to
elevate their game.
Adams Golf
Adams Golf designs and produces easy-to-hit equipment that makes playing the game more enjoyable for golfers of all skill levels. The brand ranks as the number one hybrid brand on the
world’s major professional golf tours.
Ashworth
Ashworth is an authentic golf apparel and footwear brand with powerful name recognition among true, authentic golfers, offering products that move effortlessly from the golf course to the
clubhouse and beyond.
adidas Sport Performance
The guiding principle of adidas Sport Performance is to make athletes better. The main focus is on fi ve key categories: football,
running, basketball, training and outdoor.
adidas Originals & Sport Style
adidas Originals: adidas Originals is the authentic, iconic sportswear label for the street. adidas Sport Style: adidas Sport Style includes the labels adidas NEO, Y-3 and Porsche Design Sport
by adidas.
Five Ten
Five Ten, the ‘Brand of the Brave’, is a leader in performance, high-friction footwear. From downhill mountain bike racing to rock climbing, from wingsuit fl ying to kayaking, Five Ten makes footwear
for the world‘s most dangerous sports.
A D I D A S I S A T R U L Y G L O B A L B R A N D W I T H
G E R M A N R O O T S
Reebok-CCM Hockey is a leading designer and marketer of ice hockey equipment and apparel, with two of the world’s most
recognised ice hockey brand names: Reebok Hockey and CCM
Reebok is an American-inspired sports brand with the clear objective to become the leading fi tness brand in the world. Understanding and embracing the multi-facets and lifestyle potential of fi tness, Reebok provides consumers with innovative products, experiences and inspirations. Its strong roots and history
in fi tness allow Reebok to empower consumers to be fi t for life.
F o r m o r e i n f o r m a t i o n o n o u r b r a n d s :
WWW.ADIDAS-GROUP.COM

a d i d a s G r o u pAnnual Report
2 0 1 4
M A K E A D I F F E R E N C E
I N SPORT, T H E Y M A K E A D I F F E R E N C E :
FRACTIONS OF A SECOND. ONLY A FEW CENTIMETRES. A COUPLE OF GRAMS.
T O ATHLETES, T H E Y M A K E A D I F F E R E N C E :
o u r g r o u n d b r e a k i n g
INNOVATIONS O u r d e c a d e s o f EXPERIENCE
O u r u n i q u e
PASSION O u r o v e r w h e l m i n g
AMBITIONSpor t has many facets and countless faces. Ever y spor ts enthusiast has his or her own ambition,
ever y athlete has a dif ferent form of motivation. We help them all to achieve
their ver y own indiv idual goals, to feel good, to win, and to experience and harness
the power of spor t – so they can make a dif ference.
D A Y A F T E R D A Y . A G A I N A N D A G A I N . E V E R Y W H E R E .
MAKE AD I F F E R E N C E
–

Let ter f rom the CEO 6E xecut i ve Boar d 10Super v isor y Boar d 12Super v isor y Boar d Repor t 14C or por ate Gover nance Repor t inc luding the Decl ar at ion on C or por ate Gover nance 2 0C ompens at ion Repor t 2 8Our Share 3 8
01.1
01.2
01.3
01.4
01.5
01.6
01.7
0 1 T O O U R S H A R E H O L D E R S
0 2 O U R G R O U P G R O U P M A N A G E M E N T R E P O R T
a d i d a s G r o u pAnnual Report
2 0 14–
G R O U P M A N A G E M E N T R E P O R T: This report contains the Group Management Report of the adidas Group, comprising adidas AG and its consolidated subsidiaries, and the Management Report of adidas AG.
Group Str ateg y 4 6Global S ale s Str ateg y 49Global Br ands Str ateg y 5 3O ther Busine s se s Str ateg y 6 0Global Oper at ions 6 6Re search and Development 7 3Employee s 8 2Sus t a inab i l i t y 8 9
02.1
02.2
02.3
02.4
02.5
02.6
02.7
02.8
/ Content /

Re sponsib i l i t y St atement 18 6Audi tor ’s Repor t 187C onsol idated St atement of F inanc ia l Pos i t ion 18 8C onsol idated Income St atement 19 0C onsol idated St atement of C omprehensi ve Income 191C onsol idated St atement of Change s in Equi t y 19 2C onsol idated St atement of C ash F low s 194Note s 195
Notes to the Consolidated Statement of Financial Position 207 Notes to the Consolidated Income Statement 234 Notes – Additional Information 239
St atement of Movement s of Int angib le and Tangib le A s s et s 2 4 6Sharehold ings 2 4 8
04.1
04.2
04.3
04.4
04.5
04.6
04.7
04.8
04.9
04.10
Inter nal Group Management Sy s tem 9 8Group Busine s s Per for mance 10 3
Economic and Sector Development 103 Income Statement 106 Statement of Financial Position and Statement of Cash Flows 115 Treasury 121 Financial Statements and Management Report of adidas AG 127 Disclosures pursuant to § 315 Section 4 and § 289 Section 4 of the German Commercial Code 131
Busine s s Per for mance by S egment 13 6 Wholesale Business Performance 136 Retail Business Performance 139 Other Businesses Performance 143
Subsequent Event s and Out look 14 6 Subsequent Events 146 Outlook 146
Risk and Oppor tuni t y Repor t 15 4 Strategic Risks 163 Operational Risks 165 Legal & Compliance Risks 170 Financial Risks 171 Strategic and Operational Opportunities 178 Financial Opportunities 180
Management A s se s sment of Per for mance, R isk s and Oppor tuni t ie s , and Out look 181
03.1
03.2
03.3
03.4
03.5
03.6
0 4 C O N S O L I D A T E D F I N A N C I A L S T A T E M E N T S
0 5 A D D I T I O N A L I N F O R M A T I O N
0 3 F I N A N C I A L R E V I E W G R O U P M A N A G E M E N T R E P O R T
/ Content /
05.1
05.2
05.3
05.4
Ten-Year O ver v iew 25 4Glos s ar y 25 8Decl ar at ion of Suppor t 261F inanc ia l C alendar 262


Let ter f rom the CEO 6E xecut i ve Boar d 10Super v isor y Boar d 12Super v isor y Boar d Repor t 14C or por ate Gover nance Repor t inc luding the Decl ar at ion on C or por ate Gover nance 2 0C ompens at ion Repor t 2 8Our Share 3 8
TO
OU
R SH
AR
EHO
LDER
S
01
01.1
01.2
01.3
01.4
01.5
01.6
01.7
TO OUR
S H A R E H O L D E R S

1
62 0 1 4
/ 01.1 /
Letter from the CEOTo Our Shareholders
adidas Group / 2014 Annual Report
Letter from the CEO
2014 was, without any question, a year of ups and downs for our Group. On the one hand, we look back on great moments such as the FIFA World Cup where we once again demonstrated what we are capable of when we focus and act with determination. We grew our currency-neutral football sales by more than 20% to € 2.1 billion, exceeding even our own high expectations. But football was by no means the only highlight of the past year. We also recorded numerous other successes:
/ Our revolutionary Boost technology not only gave significant impetus to runners on the streets but also to adidas Running, with sales growth in this category totalling 15%. All our regions contributed to the increase, with Western Europe a stand-out performer, recording growth of 22%.
/ Our lifestyle business returned to strength in 2014, increasing 12%. At adidas Originals, we posted improvements from one quarter to the next, which culminated in strong double-digit sales growth in the fourth quarter. This increase reflects the success of the ZX Flux and the Stan Smith product franchise as well as our first product launches as part of our partnerships with Rita Ora and Pharrell Williams, to name just a few. Also our NEO business continues to experience dynamic growth, with sales up 27%.
H e r b e r t H a i n e rA D I D A S G R O U P C E O

72 0 1 4
/ 01.1 /
Letter from the CEOTo Our Shareholders
adidas Group / 2014 Annual Report
/ Reebok sales grew 5% in total in 2014. During the fourth quarter, Reebok recorded its seventh consecutive quarter of growth. The 21% increase in the training category impressively underlines Reebok’s positioning as THE fitness brand.
In addition to these positive developments, the overall performance of the adidas brand underlines the strong improvement in our competitive position over the course of the year. adidas sales for the full year increased 11%, with double-digit growth rates throughout the year, with the exception of the first quarter. This shows that our sales dynamics are right, and the momentum of our core brands is fully intact.
At the same time, however, 2014 also brought major disappointments. Mid-way through the year, in light of the various challenges we were facing, we recognised that we wouldn’t be able to achieve our original goals for 2014. It never feels good to miss the mark, neither in sport nor in business. But it’s all the more painful when this is brought about not only by external circumstances that we cannot influence but also by executional mistakes on our part. So let me go into more detail on the various factors that resulted in not meeting your and our high expectations last year.
As far as our golf business is concerned, we misjudged the market situation at the beginning of the year. A decline in the number of active players as well as high levels and slow liquidation of old inventories caused immense problems in the entire industry, and as market leader this hit us particularly hard. However, we reacted decisively to these challenges, taking a leading role in the clean-up of excess inventories in the golf market. At the same time, we implemented an extensive restructuring programme which has involved the closure of one of our facilities in the USA and a 15% reduction in the global TaylorMade-adidas Golf workforce. Building on these significantly healthier foundations, and thanks to numerous promising product launches, TaylorMade-adidas Golf will be back on track for growth and profitability this year.
Russia, on the other hand, is a totally different story. Here, we are the victims of our own success. Being the clear market leader, we have been particularly impacted by the economic downturn, deteriorating consumer sentiment and the highly promotional environment in Russia. However, that does not alter the fact that Russia will remain a growth market for the adidas Group in the long term. And I am convinced that our perseverance will pay off. We have used the crisis as an opportunity, increasing our operational flexibility, significantly reducing the number of net store openings and further optimising our cost structure. With these initiatives, we aim to safeguard our profitability in this key market to the greatest extent possible and create optimal foundations for sustainable, profitable growth.
On top of this, we have been severely impacted by the significant devaluation of the rouble and other emerging market currencies. Negative currency effects wiped more than € 550 million off our top line last year. In addition, unfavourable hedging rates negatively impacted the Group’s gross margin by 60 basis points. But none of this changes our underlying strength in the developing economies in general and our excellent market position in Russia in particular.

82 0 1 4
/ 01.1 /
Letter from the CEOTo Our Shareholders
adidas Group / 2014 Annual Report
For me, one thing is certain: true champions come out and show their worth after defeat. Only those who analyse their mistakes, learn from them and work intensively on their own weaknesses have what it takes to be true champions. While the full results of our work over the last months will only become visible over time, I am proud of how hard our organisation and our employees have worked on themselves in the past few months in order to take up the fight for gold. As a result of our fast and decisive action, we have reached a first milestone, achieving our updated top- and bottom-line goals for last year, and now we are looking confidently out onto 2015.
We are also profiting from the progress we have made since the introduction of our ‘Route 2015’. Only those who set themselves ambitious goals are in a position to continuously improve. Against this background, in 2010, we created and presented to you our ambitious strategic business plan. And even though we will not achieve our sales and earnings targets this year, the adidas Group today is significantly stronger and better positioned than at the start of our Route 2015 journey. Two examples: we know that our brands and products resonate best with the consumer when we are able to present them in exactly the way we envisage. That is why we set ourselves the goal of generating 45% of our revenues from controlled space initiatives by 2015. We have made great progress in this respect over the past few years and today we are already generating more than 50% of our sales from controlled space initiatives. In addition, we have multiplied our eCommerce business over the last couple of years and we will over-achieve the targeted online sales level of € 500 million in 2015. We will continuously build on these successes and, with the help of our Concepts-to-Consumer team, which we strengthened with valuable expertise last year, we will further enhance the consumer shopping experience and the consistency of our messaging – across all distribution channels.
This, by the way, is a key characteristic that will increasingly distinguish us in future: our focus is on consumers and the brand experiences we create for them. In order to live up to this claim to the best possible extent, my Board colleagues Eric Liedtke and Roland Auschel have completed the realignment of our marketing and sales activities accordingly. As part of our ‘brand leadership’ initiative, the categories now for the first time have full end-to-end responsibility for all marketing processes. This massive shift in tactics will make us significantly more agile, enabling us to drive our brand initiatives in the marketplace more professionally and to bring our concepts to the consumer in a more effective way. We know that consumers today use several different channels simultaneously, and because consistent messaging across all these channels is crucial for enhancement of the consumer shopping experience we have also realigned our sales strategy. Thanks to our omni-channel approach, we will integrate all sales channels and marketing activation activities, utilise cross-selling opportunities and align pricing across all channels. As part of initial pilot projects, we have given consumers in some markets the option to order online and then pick up their products in a store. First feedback on our ‘click and collect’ offer is very encouraging. Therefore we will continue to invest in infrastructure and processes that will enable us to implement the omni-channel approach globally.

92 0 1 4
/ 01.1 /
Letter from the CEOTo Our Shareholders
adidas Group / 2014 Annual Report
A top priority for the entire senior management team in 2015 will be the North American market. Our new leadership team there, all high-calibre experts with Mark King, an American-born industry veteran, at the helm, will focus on increasing the relevance of our brands among US consumers. The brand campaigns that we launched for adidas and Reebok since the start of the year, with a clear focus on the US market, are a key step in this direction. They impressively underline our ambitions and make it clear that adidas and Reebok know and understand athletes’ motivations better than any other sports brand in the world – another important cornerstone is the development of the right products for the US market. The addition of new external talent in design and the opening of our design studio in New York will leave a clear and lasting mark on our efforts in this context. In addition, we need to make our brands more visible on the playing fields of sports that young American athletes love: basketball, American football and baseball, just to name a few. In this context, we will not only focus on growing our already strong portfolio in professional sports but will also significantly increase our visibility in college sports and at the grassroots level. At the same time, we aim to enhance our execution at the point of sale. Here too, we will significantly improve our brand presence and the presentation of our products.
To close, allow me to say that we have everything it takes to be successful going forward: our brands are enjoying great momentum, our product pipeline is full, and our campaigns will make our brands even more desirable. We know what our priorities are, we have drawn up our plan accordingly and we will now work in a consistent, resolute and bold way to implement it. At the same time, we will remain vigilant, in order to be able to react quickly and resolutely to any changes in the market environment. The roadmap for the future is clear. We will significantly improve our business and grow our top and bottom line in 2015. But that’s only just the beginning. At the end of March we will present our long-term strategy for the period up to 2020. Of course I cannot report on the contents of this strategy today. But I can already assure you of one thing: the adidas Group is and will remain a growth company, founded on strong brands. And with this, we will continue to make a difference going forward.
H E R B E RT H A I N E Radidas Group CEO

2
102 0 1 4
/ 01.2 /
Executive BoardTo Our Shareholders
adidas Group / 2014 Annual Report
Executive BoardOur Executive Board is comprised of five members. Each Board member is
responsible for at least one major function within the Group.
F O R M O R E I N F O R M A T I O N O N T H EA D I D A S G R O U P ’ S E X E C U T I V E B O A R D :
WWW.ADIDAS-GROUP.COM EXECUTIVE-BOARD
He r b e r t Ha ine rC H I E F E X E C U T I V E O F F I C E R
Herbert Hainer was born in Dingolfing, Germany, in 1954. Following his business studies, he spent eight years with Procter & Gamble in various sales and marketing positions. Herbert Hainer joined adidas Germany in 1987 and has held numerous management positions within the Group, including Managing Director Germany and Senior Vice President for Sales and Logistics in Europe, Africa and the Middle East. Herbert Hainer joined the Executive Board in 1997 and became CEO of adidas AG in 2001. He is married, has two daughters and lives in Herzogenaurach, Germany.
Herbert Hainer is also:/ Deputy Chairman of the Supervisory Board,
FC Bayern München AG, Munich, Germany/ Member of the Supervisory Board,
Allianz Deutschland AG, Munich, Germany/ Member of the Supervisory Board,
Deutsche Lufthansa AG, Cologne, Germany
Rob in J . S t a l ke rC H I E F F I N A N C I A L O F F I C E R
Robin J. Stalker was born in Palmerston North, New Zealand, in 1958. In 1982, following his degree in business studies, he began his professional career and qualified as a Chartered Accountant. He worked for Arthur Young in New Zealand and London and subsequently held financial and controlling positions in the entertainment industry, including United International Pictures and Warner Bros. International, and also worked as an independent consultant. Robin J. Stalker joined adidas AG in 1996. Since February 2000, he has been Chief Financial Officer of adidas AG and was appointed to the Executive Board, responsible for Finance, in 2001. In 2005, he assumed additional responsibility as Labour Director. Robin J. Stalker is married and lives near Herzogenaurach, Germany. Robin J. Stalker is also:/ Member of the Supervisory Board,
Schaeffler AG, Herzogenaurach, Germany

112 0 1 4
/ 01.2 /
Executive BoardTo Our Shareholders
adidas Group / 2014 Annual Report
Ro l and A us che lG L O B A L S A L E S
Roland Auschel was born in Bad Waldsee, Germany, in 1963. After obtaining his Bachelor’s degree in European business studies in Germany and the UK as well as an MBA in the United States, he joined the adidas team as a Strategic Planner in 1989. During his career with the adidas Group, he has held many senior management positions, including Business Unit Manager, Key Account Manager Europe and Head of Region Europe, Middle East and Africa. In 2009, he became Chief Sales Officer Multichannel Markets. In 2013, Roland Auschel was appointed to the Executive Board where he assumed responsibility for Global Sales. He is married, has two children and lives in Erlangen, Germany.
G l enn B enne t tG L O B A L O P E R A T I O N S
Glenn Bennett was born in New Hampshire, USA, in 1963. With a degree in computer science, he began his professional career with Reebok International Ltd. in 1983, where he worked for ten years in various operations and product functions, of which the latest was Director of Footwear Development. In 1993, Glenn Bennett joined adidas AG and began working as the Head of Worldwide Footwear Development. He was promoted to Senior Vice President of Footwear Operations a few months later. In 1997, Glenn Bennett was appointed to the Executive Board where he assumed responsibility for all Footwear, Apparel and Accessories & Gear Operations activities shortly thereafter. Glenn Bennett lives in Boston/Massachusetts, USA.
E r i c L i e d t ke 1)
G L O B A L B R A N D S
Eric Liedtke was born in Dayton/Ohio, USA, in 1966. After obtaining his Bachelor’s degree in journalism, he started his career at DMB&B Advertising in the USA. He joined the adidas Group in 1994 as Global Line Manager for Cross Training in Portland/Oregon. During his 20-year career with adidas, Eric Liedtke has held various senior management positions at adidas America, including Director of Footwear Marketing and Vice President Brand Marketing. In 2006, he moved to the adidas Group headquarters in Germany. In 2011, he became Senior Vice President adidas Sport Performance, responsible for all adidas sports categories globally. He was appointed to the Executive Board in 2014, where he assumed responsibility for Global Brands. Eric Liedtke lives in Nuremberg, Germany.
1) Appointed to the Executive Board effective March 6, 2014. Eric Liedtke succeeded Erich Stamminger who was responsible for Global Brands until March 5, 2014.

3
122 0 1 4
/ 01.3 /
Supervisory BoardTo Our Shareholders
adidas Group / 2014 Annual Report
Supervisory Board
I go r L andauC H A I R M A N 1)
residing in Lugano, SwitzerlandPensioner, Member of the Board of Directors, Sanofi-Aventis S.A., Paris, France
/ Member of the Supervisory Board, Allianz SE, Munich, Germany 2)
/ Member of the Board of Directors, Sanofi-Aventis S.A., Paris, France
S ab ine B aue r *D E P U T Y C H A I R W O M A N 1)
residing in Erlangen, GermanyChairwoman of the Central Works Council, adidas AG
W i l l i S ch w e r d t l eD E P U T Y C H A I R M A N 1)
residing in Munich, GermanyIndependent Management Consultant/Partner, WP Force Solutions GmbH, Bad Homburg v. d. Höhe, Germany
/ Member of the Supervisory Board, Eckes AG, Nieder-Olm, Germany
D ie t e r Hauen s t e in*residing in Herzogenaurach, GermanyFull-time member of the Works Council Herzogenaurach, adidas AG 3)
Dr. W o l f gang J äge r *residing in Bochum, GermanyManaging Director in charge of Public Relations and Scholarships, Hans-Böckler-Stiftung, Düsseldorf, Germany
Dr. S t e f an J en t z s chresiding in London, Great BritainCorporate Finance Consultant/Partner, Perella Weinberg Partners UK LLP, London, Great Britain
/ Member of the Supervisory Board, Sky Deutschland AG, Unterföhring, Germany
/ Deputy Chairman of the Supervisory Board, AIL Leasing München AG, Grünwald, Germany
Her b e r t K au f f m annresiding in Stuttgart, GermanyIndependent Management Consultant, Stuttgart, Germany
/ Chairman of the Supervisory Board, Uniscon universal identity control GmbH, Munich, Germany
/ Member of the Supervisory Board, DEUTZ AG, Cologne, Germany
K a t j a K r aus 4 )
residing in Hamburg, GermanyManaging Partner, Jung von Matt/sports GmbH, Hamburg, Germany
K a t h r in Menge s 4 )
residing in Neuss, GermanyExecutive Vice President Human Resources and Infrastructure Services, Henkel AG & Co. KGaA, Düsseldorf, Germany
Mandates within the Henkel Group/ Member of the Supervisory Board, Henkel
Central Eastern Europe GmbH, Vienna, Austria/ Member of the Supervisory Board, Henkel
Nederland B.V., Nieuwegein, The Netherlands/ Member of the Board of Directors,
Henkel Norden AB, Stockholm, Sweden/ Member of the Board of Directors,
Henkel Norden Oy, Vantaa, Finland/ Member of the Board of Directors,
Henkel of America, Inc., Wilmington, USA

132 0 1 4
/ 01.3 /
Supervisory BoardTo Our Shareholders
adidas Group / 2014 Annual Report
Ro l and No sko*residing in Wolnzach, GermanyTrade Union Official, IG BCE, Headquarter Nuremberg, Nuremberg, Germany
/ Deputy Chairman of the Supervisory Board, CeramTec GmbH, Plochingen, Germany
Han s Rup r e ch t *residing in Herzogenaurach, GermanySales Director Customer Service Central Europe West, adidas AG
He id i T ha l e r-Veh*residing in Uffenheim, GermanyMember of the Central Works Council, adidas AG
S TA N D I N G C O M M I T T E E S U N T I L M A Y 8 , 2 0 14
Steering Committee / Igor Landau (Chairman), Sabine Bauer*, Willi SchwerdtleGeneral Committee / Igor Landau (Chairman), Sabine Bauer*, Roland Nosko*, Willi SchwerdtleAudit Committee / Herbert Kauffmann (Chairman), Dr. Wolfgang Jäger*, Dr. Stefan Jentzsch, Hans Ruprecht*Nomination Committee / Igor Landau (Chairman), Willi Schwerdtle, Christian TourresMediation Committee pursuant to § 27 section 3 Co-Determination Act (MitbestG) / Igor Landau, Sabine Bauer*, Willi Schwerdtle, Heidi Thaler-Veh*
S TA N D I N G C O M M I T T E E S A S O F M A Y 8 , 2 0 14
Steering Committee / Igor Landau (Chairman), Sabine Bauer*, Willi SchwerdtleGeneral Committee / Igor Landau (Chairman), Sabine Bauer*, Roland Nosko*, Willi SchwerdtleAudit Committee / Herbert Kauffmann (Chairman), Dr. Wolfgang Jäger*, Dr. Stefan Jentzsch, Hans Ruprecht*Nomination Committee / Igor Landau (Chairman), Kathrin Menges, Willi SchwerdtleMediation Committee pursuant to § 27 section 3 Co-Determination Act (MitbestG) / Igor Landau, Sabine Bauer*, Willi Schwerdtle, Heidi Thaler-Veh*Finance and Investment Committee (as of September 25, 2014) / Igor Landau, Sabine Bauer*, Dr. Wolfgang Jäger*, Herbert Kauffmann
A l e x ande r Pop o vresiding in Moscow, RussiaChairman, RFSO ‘Lokomotiv’, Moscow, Russia
C hr i s t i an Tou r r e sresiding in Lungern, SwitzerlandFormer Member of the Executive Board of adidas AG
S U P E R V I S O R Y B O A R D M E M B E R S I N C U M B E N T U N T I L T H E E N D O F T H E A N N U A L G E N E R A L M E E T I N G O N M A Y 8 , 2 0 14
* Employee representative.1) Re-elected at the constituent meeting of the Supervisory Board on May 8, 2014.2) Until May 7, 2014.3) Since April 4, 2014; formerly Deputy Chairman of the Works Council Herzogenaurach.4) Since the end of the Annual General Meeting held on May 8, 2014.

4
142 0 1 4
/ 01.4 /
Supervisory Board ReportTo Our Shareholders
adidas Group / 2014 Annual Report
Supervisory Board Report
Dear Shareholders,
We look back on 2014 as a challenging year. Thanks to strong brands and partnerships in the world of sport, as well as first-class innovations, the adidas Group was again able to achieve strong sales growth. However, the ongoing weakness in the golf market, negative economic developments in Russia/CIS and continuing unfavourable currency developments, in particular the considerable devaluation of the Russian rouble, significantly impacted the Group’s results. Nevertheless, these issues have been resolutely managed, and we have taken the appropriate steps not only to safeguard the financial results in the short term but also to sustainably improve the Group’s profitability in the long term. Our company is now well positioned to again achieve sales growth at all brands as well as an overproportionate improvement in the Group’s profitability in 2015.
Supervision and advice in dialogue with the Executive BoardIn the year under review, we again performed all our tasks laid down by law, the Articles of Association and the Rules of Procedure carefully and conscientiously. We regularly advised the Executive Board on the management of the company and diligently and continuously supervised its management activities, assuring ourselves of the legality, expediency and regularity thereof.
The Executive Board involved us directly in all of the Group’s fundamental decisions. After in-depth consultation and examination of the detailed information submitted to us by the Executive Board, we approved individual transactions where required by law.
The Executive Board informed us extensively and in a timely manner through written and oral reports at our Supervisory Board meetings. This information covered all relevant aspects of the Group’s business strategy, business planning, including finance, investment and personnel planning, the course of business and the Group’s financial position and profitability. We were also kept up to date on matters relating to the risk situation, risk management and compliance as well as all major decisions and business transactions.
I g o r L a n d a uC H A I R M A N O F T H E S U P E R V I S O R Y B O A R D

152 0 1 4
/ 01.4 /
Supervisory Board ReportTo Our Shareholders
adidas Group / 2014 Annual Report
The Executive Board always explained immediately and in a detailed manner any deviations in business performance from the established plans, and the Supervisory Board as a whole discussed these matters in depth.
The Executive Board regularly provided us with comprehensive reports for the preparation of our meetings. We thus always had the opportunity to critically analyse the Executive Board’s reports and resolution proposals within the committees and within the Supervisory Board as a whole and to put forward suggestions before resolving upon the Executive Board’s proposals after in-depth examination and consultation. In the periods between our meetings, the Executive Board kept us informed on a monthly basis, and if necessary more frequently, regarding the current business situation.
In addition to the constituent meeting and five regular meetings of the Supervisory Board, we held two extraordinary meetings in the year under review. Apart from one regular meeting, which two members were prevented from attending due to other business appointments that could not be postponed, all Supervisory Board members attended all meetings in the year under review. The average attendance rate at meetings of the entire Supervisory Board was therefore just under 97%. All the committee meetings, with the exception of two Audit Committee meetings at which one member was absent, were fully attended. The external auditor, KPMG AG Wirtschaftsprüfungsgesellschaft (KPMG), attended all regular meetings of the Supervisory Board, inasfar as they did not deal with Executive Board matters. KPMG also attended all meetings of the Audit Committee. The employee representatives held separate meetings to prepare and discuss agenda items for all meetings of the entire Supervisory Board.
In the periods between meetings, the Supervisory Board Chairman and the Audit Committee Chairman maintained regular contact with the Chief Executive Officer and the Chief Financial Officer, conferring on matters such as corporate strategy, business development and planning, the risk situation and risk management as well as compliance. In addition, the Supervisory Board Chairman was immediately informed about any significant events of fundamental importance for evaluating the situation and development of the company and management activities.
Topics for the entire Supervisory BoardOur consultations and examinations focused on the following topics:
Situation and business developmentThe development of sales and earnings, the employment situation as well as the financial position of the Group and the business development of the Group’s individual segments and regions were presented to us in detail by the Executive Board following the close of the respective quarter and were discussed regularly. Further ongoing topics for discussion were the possible impact of global economic developments and negative currency translation effects as well as the development of our individual brands.
In March 2014, we reviewed and dealt intensively with the KPMG-certified 2013 annual financial statements and consolidated financial statements, including the combined management report for adidas AG and the Group, as well as the Executive Board’s proposal regarding the appropriation of retained earnings.
At the meetings held in February and August, the Executive Board provided us with comprehensive information on the continuing weakness of the golf market worldwide and the resulting unsatisfactory business development for the TaylorMade-adidas Golf segment in the year under review, and furthermore provided us with a first outlook on this segment’s future sales development. At two other meetings we dealt in depth with the Group’s goals laid out in the mid-term business plan ‘Route 2015’, which the Executive Board adjusted in July in light of increasingly negative currency effects, the significantly lower profit contribution expected from TaylorMade-adidas Golf as well as the increased investment into marketing. At the May and August meetings, we also dealt comprehensively with the Executive Board’s planned sale of the brown-shoe business segment Rockport. The Executive Board outlined to us the strategic reasons as well as the opportunities and risks of a potential divestiture. In order to advise the Executive Board on the contract negotiations efficiently and in a timely manner, we transferred the authority to approve conclusion of the contract to the ad hoc committee ‘Relay’ which we established for this purpose. In November, the Executive Board provided us with information on the growth potential of the adidas and Reebok brands in the North American market and presented the corresponding three-year plan 2015/2017, which we discussed intensively.

162 0 1 4
/ 01.4 /
Supervisory Board ReportTo Our Shareholders
adidas Group / 2014 Annual Report
Transactions requiring Supervisory Board approvalIn accordance with statutory regulations and the Rules of Procedure of the Supervisory Board, certain transactions and measures require a formal resolution or the prior approval of the Supervisory Board.
In the context of this requirement, at our meetings in January and February, we discussed in detail the Group’s warehouse infrastructure and the development of logistics and warehouse costs. In the interest of optimising profitability, we approved the purchase of the strategically important distribution centre in Spartanburg/South Carolina, USA, which had previously been leased. At our meeting in March, following detailed discussions, we resolved upon the resolutions to be proposed to the 2014 Annual General Meeting, including the proposal regarding the appropriation of retained earnings for the 2013 financial year and the candidates for election as shareholder representatives on the Supervisory Board. Another topic of this meeting was the resolution on the 2014 Budget and Investment Plan presented by the Executive Board.
Composition of the Executive BoardIn the year under review, we took important decisions concerning changes on the Executive Board. At our extraordinary meeting held in January, we dealt with the request of our long-standing Executive Board member Erich Stamminger to release him from his duties as Executive Board member effective March 5, 2014. After due consideration within the Supervisory Board as a whole, we approved the termination of his appointment by mutual consent and the termination agreement pertaining to his Executive Board service contract. As his successor, we appointed Eric Liedtke as member of the Executive Board responsible for Global Brands effective March 6, 2014 and resolved on the terms of his Executive Board service contract. At our meetings in March and May, we extensively discussed and resolved to extend the Executive Board mandates and service contracts of Herbert Hainer, Glenn Bennett and Robin J. Stalker.
With these personnel decisions, the Supervisory Board acknowledges the Executive Board’s performance and strives for continuity. Notwithstanding the above, in November the members of the General Committee discussed, inter alia, the matter of long-term succession planning for the Executive Board.
Executive Board compensationIn addition to the financial conditions of the Executive Board service contracts, we dealt at our January meeting with waiving the competition prohibition that had been agreed with Erich Stamminger and approved the respective contracts. Key topics of our meeting in February were the approval of the contractual conditions concerning Erich Stamminger’s departure as well as the in-depth discussion of the performance of the Executive Board members in the year under review, and we resolved upon the 2013 Performance Bonuses to be granted to them. As required by the German Corporate Governance Code (the ‘Code’), we examined the appropriateness of Executive Board compensation and, in this context, considered Executive Board target compensation in relation to the compensation of senior management and employees overall. In consideration of this aspect, at our meeting in March we comprehensively discussed the targets and key criteria for the 2014 Performance Bonus together with the individual Performance Bonus target amount determined for each Executive Board member, as well as the adjustment of Herbert Hainer’s Executive Board service contract, and resolved thereon.
In line with the Code, we commissioned an independent external compensation expert to review the Executive Board compensation system and the appropriateness of Executive Board compensation. The review found that the compensation structure is oriented towards sustainable development of the company and that it meets statutory requirements as well as those of the Code. A comparison with other companies regarding the compensation of individual Executive Board members’ target compensation, however, found that there is a need for action especially concerning the pension benefits granted to Executive Board members, and that there is room for a moderate increase in the future in order to ensure competitive compensation. At the meetings of the General Committee and of the Supervisory Board as a whole in May and August, the members of the Supervisory Board considered in detail the results of the review of Executive Board compensation and agreed with the assessment of the compensation expert. The Supervisory Board already took the findings of the review into consideration in its resolutions in August relating to the extension of Glenn Bennett’s and Robin J. Stalker’s Executive Board service contracts and their pension benefits.

172 0 1 4
/ 01.4 /
Supervisory Board ReportTo Our Shareholders
adidas Group / 2014 Annual Report
At our meeting in February 2015, we considered in-depth the performance of each Executive Board member in the year under review as well as during the three-year period 2012/2014, and then resolved upon the 2014 Performance Bonuses and the LTIP Bonuses 2012/2014 to be granted to them.
Further information on compensation for the 2014 financial year can be found in the Compensation Report / SEE COMPENSATION
REPORT, P. 28.
Corporate governanceThe Supervisory Board regularly monitors the application and further development of the corporate governance regulations within the company, in particular the implementation of the recommendations of the Code. At our February meetings, matters of corporate governance are usually the focal point. In February 2014, we discussed and resolved to introduce compensation caps, also covering any potential special bonus, for new or extended Executive Board service contracts. In preparation for the upcoming issuance of the 2015 Declaration of Compliance, our meeting in February 2015 focused on reviewing and resolving upon the key objectives for the composition of the Supervisory Board as a whole and the introduction of a severance payment cap for Executive Board service contracts. Thus, in this matter as well, we follow the recommendations of the Code for all newly concluded and extended Executive Board service contracts. After comprehensive discussion, we resolved upon the 2015 Declaration of Compliance. The Declaration of Compliance was then made permanently available to our shareholders on the corporate website at / WWW.ADIDAS-GROUP.COM/S/CORPORATE-GOVERNANCE.
In the year under review, no conflicts of interest arose with regard to the Executive Board members. With the exception of the following matter, there were also no conflicts of interest within the Supervisory Board.
At the beginning of the 2015 financial year, a consulting contract and a service contract, in each case project-specific, fixed-term and independent of one another, were entered into with two companies in which in each case one Supervisory Board member has an interest. Approval of these contracts was finally granted after being discussed in detail by the Supervisory Board at its meetings in November 2014 and January 2015 and at its meeting in February 2015. In order to avoid conflicts of interest, the two Supervisory Board members concerned participated neither in the respective discussions nor in the resolutions.
Further information on corporate governance at the adidas Group can be found in the Corporate Governance Report including the Declaration on Corporate Governance / SEE CORPORATE GOVERNANCE REPORT INCLUDING THE DECLARATION ON CORPORATE GOVERNANCE,
P. 20.
Efficient committee workIn order to perform our tasks in an efficient manner, in addition to the six Supervisory Board standing committees / SEE
SUPERVISORY BOARD, P. 12 we have also established the project-related ad hoc committee ‘Relay’. The committees prepare resolutions of the Supervisory Board as well as topics for Supervisory Board meetings. Within the legally permissible framework and in appropriate cases, we have furthermore delegated the Supervisory Board’s authority to pass certain resolutions to individual committees. With the exception of the Audit Committee, the Supervisory Board Chairman also chairs all the standing committees. The committee chairpersons inform the Supervisory Board about the content and results of the committee meetings at the subsequent meeting of the entire Supervisory Board.
/ The Steering Committee did not meet in the year under review.
/ The General Committee held six meetings in 2014, one of them by way of a conference call. Two additional meetings, dealing with topics of the year under review, took place in February 2015.
The main focus of the meetings of the General Committee was the preparation of the resolutions of the Supervisory Board as a whole, detailed individually above, concerning the termination agreement with Erich Stamminger, the conclusion of new or extended Executive Board service contracts as well as the concrete assessment of the Executive Board members’
182 0 1 4
/ 01.4 /
Supervisory Board ReportTo Our Shareholders
adidas Group / 2014 Annual Report
variable compensation such as the Performance Bonus for the 2013 and 2014 financial years and the LTIP Bonus 2012/2014. It furthermore dealt in depth with the results of the review of the appropriateness of Executive Board compensation overall.
/ The Audit Committee held five meetings in the year under review and also one meeting in March 2015, dealing with topics of the year under review. The Chief Financial Officer and the auditor were present at all meetings and reported to the committee members in detail.
/ The committee’s work focused on the comprehensive review of the quarterly reports and the first half year report together with the Chief Financial Officer and the auditor before the respective dates of publication, also the preliminary examination of the annual financial statements and the consolidated financial statements for 2013, including the combined management report of adidas AG and the Group, as well as the Executive Board’s proposal regarding the appropriation of retained earnings. Following an in-depth review of the audit reports with the auditor, the committee decided to recommend that the Supervisory Board approve the 2013 annual financial statements and consolidated financial statements. In addition, after obtaining the auditor’s declaration of independence, the Audit Committee prepared the Supervisory Board’s proposal to the Annual General Meeting concerning the selection of the auditor of the annual financial statements and the consolidated financial statements for 2014. Following extensive discussion by the committee, the priority topics for the audit of the 2014 annual financial statements and consolidated financial statements were determined and the audit assignment was granted together with the according audit fee. The committee furthermore dealt in depth with the 2013 Risk Report and with establishing best-practice requirements for the internal control systems.
/ The committee meeting in September focused on examining the efficiency of the internal audit system, the internal control system and the risk and compliance management system. In the context of this examination, the committee members reviewed in depth the main risk factors for the Group, the applied control methods and reporting systems and the efficiency thereof with the aid of written and oral reports. In the course of the following comprehensive discussions, inter alia with the auditor, the committee members assured themselves of the effectiveness of the systems and discussed possibilities for improvement. Furthermore, the 2014 report and the draft of the 2015 audit plan of Internal Audit were discussed in detail.
/ The reporting of the Chief Compliance Officer was a topic at every meeting of the Audit Committee. No material compliance issues were noted in the year under review.
/ The Mediation Committee, established in accordance with the German Co-Determination Act (Mitbestimmungsgesetz – MitbestG), had no reason to convene in 2014.
/ The Nomination Committee did not meet in the year under review.
/ The Finance and Investment Committee, which was established in September, held three meetings in the year under review and two meetings in the current year – in each case by way of a conference call.
In November, following extensive consideration, it granted approval on behalf of the Supervisory Board for the issuance of two bonds with an overall volume of € 1 billion and a term of seven years and twelve years, respectively. It furthermore discussed the parameters of a share buyback programme based on the authorisation granted by the Annual General Meeting on May 8, 2014, and resolved upon a first tranche with a volume of up to € 300 million.
/ The ‘Relay’ Committee convened once in the year under review and, following an in-depth discussion, approved on behalf of the Supervisory Board the sale of the Rockport brand to a new entity formed by Berkshire Partners and New Balance.
Examination of the 2014 annual financial statements and consolidated financial statementsKPMG audited the 2014 consolidated financial statements prepared by the Executive Board in accordance with § 315a German Commercial Code (Handelsgesetzbuch – HGB) in compliance with IFRS and issued an unqualified opinion thereon. The auditor

192 0 1 4
/ 01.4 /
Supervisory Board ReportTo Our Shareholders
adidas Group / 2014 Annual Report
also approved without qualification the 2014 annual financial statements of adidas AG, prepared in accordance with HGB requirements, and the combined management report for adidas AG and the Group. The financial statements, the proposal put forward by the Executive Board regarding the appropriation of retained earnings and the auditor’s reports were distributed by the Executive Board to all Supervisory Board members in a timely manner. We examined the documents in depth, with a particular focus on legality and regularity, in the presence of the auditor at the Audit Committee meeting held on March 2, 2015 and at the Supervisory Board’s March 4, 2015 financial statements meeting, during which the Executive Board explained the financial statements in detail. Further topics at these meetings were the Executive Board’s commentaries concerning the impairment of goodwill and the Rockport disposal group necessary for the 2014 financial year. At both meetings, the auditor reported the material results of the audit with a focus on the priority topics of the year under review as agreed with the Audit Committee and was available for questions and the provision of additional information. The auditor did not report any significant weaknesses with respect to the internal control and risk management system relating to the accounting process. We also discussed in depth with the Executive Board the proposal concerning the appropriation of retained earnings, which provides for a dividend of € 1.50 per dividend-entitled share and adopted the proposal under consideration of the share buyback programme, the Group’s financial situation and future prospects as well as the expectations of our shareholders. Based on our own examinations of the annual and consolidated financial statements, we came to the conclusion that there are no objections to be raised. At our financial statements meeting, therefore, following the recommendation of the Audit Committee, we approved the audit results and the financial statements prepared by the Executive Board. The annual financial statements of adidas AG were thus approved.
Changes on the Supervisory BoardThe term of office of all members of the Supervisory Board expired at the end of the Annual General Meeting on May 8, 2014. On the shareholder representatives’ side, Alexander Popov and Christian Tourres are no longer members of the Supervisory Board that was elected that day for a term of five years. We expressed our thanks to the departing members for their many years of dedicated and loyal collaboration. As new shareholder representatives on the Supervisory Board, the Annual General Meeting – in line with the nominations submitted by the Supervisory Board based on the suggestions of the Nomination Committee – elected Katja Kraus and Kathrin Menges. Furthermore, the Supervisory Board members seeking re-election either on the shareholder representatives’ or the employee representatives’ side were confirmed in their respective elections.
At the constituent meeting of the Supervisory Board directly following the Annual General Meeting, we again confirmed the Chairman, the Deputy Chairwoman and the Deputy Chairman in their respective offices, and also all the members of the co-determined committees. Besides the re-election of Willi Schwerdtle and myself, we also elected Kathrin Menges to join the Nomination Committee.
Expression of thanksOn behalf of the Supervisory Board, I wish to thank the Executive Board and all adidas Group employees around the world for their tremendous personal dedication and their ongoing commitment, and I also thank the employee representatives for their good collaboration.
For the Supervisory Board
I GOR L AND A UChairman of the Supervisory Board
March 2015

5
202 0 1 4
/ 01.5 /
Corporate Governance Report including the Declaration on Corporate GovernanceTo Our Shareholders
adidas Group / 2014 Annual Report
Corporate Governance Report including the Declaration on Corporate GovernanceCorporate governance stands for responsible and transparent management and corporate control oriented towards a sustainable increase in value. We are convinced that good corporate governance is an essential foundation for sustainable corporate success and enhances the confidence placed in our Group by our shareholders, business partners, employees and the financial markets. The following report includes the Corporate Governance Report and the Declaration on Corporate Governance issued by the Executive Board and Supervisory Board.
Dual board systemAs a globally operating public listed company with its registered seat in Herzogenaurach, Germany, adidas AG is, inter alia, subject to the provisions of German stock corporation law. A dual board system, which assigns the management of the company to the Executive Board and advice and supervision of the Executive Board to the Supervisory Board, is one of the fundamental principles of German stock corporation law. These two boards are strictly separated both in terms of members and of competencies. In the interest of the company, however, both Boards cooperate closely.
Composition and working methods of the Executive BoardThe composition of our Executive Board, which consists of five members, reflects the international character of our Group. No member of the Executive Board has accepted more than a total of three supervisory board mandates in non-Group listed companies or in supervisory bodies of non-Group companies with similar requirements. The Executive Board is responsible for independently managing the company, determining the Group’s strategic orientation, agreeing this with the Supervisory Board and ensuring its implementation. Further, it defines business targets, company policy and the organisation of the Group. Additionally, the Executive Board ensures appropriate risk management and risk controlling as well as compliance with statutory regulations and internal guidelines. It is bound to the company’s interest and obligated to strive for a sustainable increase in company value. When filling management positions in the company, the Executive Board takes diversity into consideration. It especially aims for an appropriate consideration of women. We plan to increase the number of women in management positions to 32% worldwide by the end of 2017.
Irrespective of the Executive Board’s overall responsibility, its members are individually responsible for managing their respective business areas in accordance with the Executive Board’s Business Allocation Plan. There are no Executive Board committees. The CEO is responsible in particular for leading the entire Executive Board as well as for guiding business development, including the coordination of the business segments, brands and markets. The members of the Executive Board keep each other informed on all significant developments in their business areas and align on all cross-functional measures. Further details on collaboration within the Executive Board are governed by the Rules of Procedure of the Executive Board and the Business Allocation Plan. These documents specifically stipulate requirements for meetings and resolutions as well as for cooperation with the Supervisory Board.
see Executive Board, p. 10
see Employees, p. 82
1) The Corporate Governance Report including the Declaration on Corporate Governance is an unaudited section of the Group Management Report.
1)

212 0 1 4
/ 01.5 /
Corporate Governance Report including the Declaration on Corporate GovernanceTo Our Shareholders
adidas Group / 2014 Annual Report
At the Supervisory Board meetings, the Executive Board reports in writing and orally on the agenda items and resolution proposals and answers all questions from the individual Supervisory Board members. The CEO and the CFO maintain regular contact and consult with the Chairman of the Supervisory Board and the Audit Committee Chairman on key aspects of strategy, planning and business development as well as on questions of risk management and compliance within the Group.
Composition and working methods of the Supervisory BoardOur Supervisory Board consists of six shareholder representatives and six employee representatives in accordance with the German Co-Determination Act (Mitbestimmungsgesetz – MitbestG). The shareholder representatives are elected by the shareholders at the Annual General Meeting, and the employee representatives by the employees of adidas AG. The last periodic election took place in 2014. The term of office of the current members of the Supervisory Board commenced on May 8, 2014 and expires at the end of the 2019 Annual General Meeting.
The Supervisory Board’s proposals with regard to shareholder representative candidates for election at the Annual General Meeting were prepared by the Nomination Committee. The Committee’s recommendations take into consideration the statutory requirements, the German Corporate Governance Code (hereinafter the ‘Code’) and the Rules of Procedure of the Supervisory Board, as well as the objectives and criteria determined by the Supervisory Board for its own composition:
Together, its members have the knowledge, skills and professional expertise required to properly perform their tasks. As the members of the Supervisory Board have extensive knowledge of various professional fields, and in some cases also many years of international experience, they bring a broad spectrum of expertise to the performance of their Supervisory Board function. The number of female Supervisory Board members has increased from two members to four. Assuming all of the employee representatives also in principle meet the independence criteria for Supervisory Board members as defined by the Code, in the Supervisory Board’s assessment, all of its members are independent. The members of our Supervisory Board do not exercise directorships or similar positions or advisory tasks for key competitors of the company. Further, they do not have business or personal relations with adidas AG, its Executive Board and Supervisory Board or a controlling shareholder which may cause a substantial and not merely temporary conflict of interest. The age limit of, in general, 72 years at the time of election was taken into account in the selection process.
Thus, the objectives for the composition of the Supervisory Board have been met in full. Information on the individual Supervisory Board members is available in this Annual Report and on our website.
see Supervisory Board Report, p. 14
see Supervisory Board, p. 12www.adidas-group.com/s/supervisory-board
Further information on Corporate Governance
More information on topics covered in this report can be found on our website
www.adidas-group.com/s/corporate-governance including:
/ Articles of Association/ Rules of Procedure of the Executive Board/ Rules of Procedure of the Supervisory
Board/ Rules of Procedure of the Audit Committee/ Supervisory Board Committees
(composition and tasks)

222 0 1 4
/ 01.5 /
Corporate Governance Report including the Declaration on Corporate GovernanceTo Our Shareholders
adidas Group / 2014 Annual Report
As the Supervisory Board, following the election, is in new composition since the end of the Annual General Meeting on May 8, 2014, at its meeting on February 11, 2015, it discussed the objectives that had been set for its composition and, notwithstanding that it cannot influence the selection of candidates for employee representatives on the Supervisory Board, resolved anew as follows:/ The composition of the Supervisory Board including members with international background
shall be maintained to the current extent. Diversity in terms of expertise and experience on the grounds of origin, education or professional activity shall continue to be taken into account in the future.
/ The number of women on the Supervisory Board, namely four, shall be maintained. Furthermore, one woman shall be a member of the Nomination Committee.
/ As in the past, all members of the Supervisory Board shall be independent. This presupposes that all employee representatives also in principle meet the independence criteria as defined by the Code. Substantial, not merely temporary conflicts of interest shall be avoided.
/ The members of the Supervisory Board shall dispose of sufficient time for performing their mandate.
/ The age limit of, in general, 72 years at the time of election shall be taken into account.
However, the basis for every Supervisory Board function remains the personal qualification of the Supervisory Board members. Therefore, other important criteria will also be considered when nominating candidates for election. Personality, integrity and sufficient diversity in terms of expert and industry knowledge as well as particular experience, e.g. in the fields of accounting or annual auditing, will continue to be taken into account as at present. These are important preconditions for the Supervisory Board to work together productively and to competently supervise and advise the Executive Board. The best interests of the company will continue to play a decisive role when nominating candidates for election.
The Supervisory Board supervises and advises the Executive Board in questions relating to Group management. The Executive Board regularly, expeditiously and comprehensively reports on business development and planning as well as on the risk situation including compliance and coordinates the strategy of the company and its implementation with the Supervisory Board. The Supervisory Board examines and approves the annual financial statements of adidas AG and the adidas Group, taking into consideration the auditor’s reports, and resolves upon the proposal of the Executive Board on the appropriation of retained earnings. Additionally, it resolves upon the resolution proposals to be presented to the Annual General Meeting. Certain business transactions and measures of the Executive Board with fundamental significance are subject to prior approval by the entire Supervisory Board or by a Supervisory Board committee.
The Supervisory Board is also responsible for the appointment and dismissal of members of the Executive Board. When appointing members of the Executive Board, the Supervisory Board pays attention to the best possible composition of the Executive Board. Experience, industry knowledge as well as personal and expert qualifications play an important role in this regard. In March 2014, Eric Liedtke, who has held various management positions within the adidas Group both in and outside Germany in the past 20 years, became the successor of Erich Stamminger as member of the Executive Board responsible for Global Brands. The Supervisory Board considers the increase in the number of women in management positions within the adidas Group as necessary to ensure that in the future more suitable female candidates are available for positions on the Executive Board. The Supervisory Board thus supports the Group’s diversity concepts, particularly regarding the management development programmes, with the goal of increasing the representation of women on the Executive Board in the long term.

232 0 1 4
/ 01.5 /
Corporate Governance Report including the Declaration on Corporate GovernanceTo Our Shareholders
adidas Group / 2014 Annual Report
The Supervisory Board further determines the Executive Board compensation system, examines it regularly and decides on the individual overall compensation of each Executive Board member. To this end, the relation between Executive Board compensation and that of senior management and employees overall is taken into account, also in terms of its development over time. Further information on Executive Board compensation is compiled in the Compensation Report.
In order to increase the efficiency of its work and to deal with complex topics, the Supervisory Board has formed six permanent expert committees from within its members, which, inter alia, prepare its resolutions and, in certain cases, pass resolutions on its behalf. These committees are the Steering Committee, the General Committee, the Audit Committee, the Finance and Investment Committee, which was newly formed in 2014, the Mediation Committee in accordance with § 27 section 3 MitbestG and the Nomination Committee. In addition, there is one project-based ad hoc committee which was established in 2014. The chairmen of the committees report to the entire Supervisory Board on the results of the committee work on a regular basis. The composition of the committees can be found in our overview of the Supervisory Board. Further information on the committees’ tasks is available on our website.
Apart from the tasks and responsibilities, the Rules of Procedure of the Supervisory Board and of the Audit Committee also set out the individual requirements expected of the members and the procedure for meetings and passing resolutions. These Rules of Procedure are available on our website. The Supervisory Board Report provides information on the activities of the Supervisory Board and its committees in the year under review.
The members of the Supervisory Board are individually responsible for undertaking any necessary training and professional development measures required for their tasks and, in doing so, are supported by adidas AG. The company informs the Supervisory Board regularly about current legislative changes as well as opportunities for external training, and provides the Supervisory Board with relevant specialist literature. In-house introductory events were held for the newly elected members of the Supervisory Board.
Every two years, the Supervisory Board and the Audit Committee examine the efficiency of their work by means of questionnaires and individual interviews. The next efficiency examinations will be carried out after the Annual General Meeting in 2015.
Avoiding conflicts of interestThe members of the Executive Board and Supervisory Board are obligated to disclose any conflicts of interest to the Supervisory Board without any delay. Substantial transactions between the company and members of the Executive Board or persons in a close relation with them require Supervisory Board approval. Contracts between the company and members of the Supervisory Board also require Supervisory Board approval. The Supervisory Board reports any conflicts of interest, as well as the handling thereof, to the Annual General Meeting. In the year under review, neither the members of the Executive Board nor the members of the Supervisory Board faced conflicts of interest, with the exception of the matter outlined in the Supervisory Board Report.
see Compensation Report, p. 28
see Supervisory Board, p. 12www.adidas-group.com/s/supervisory-board-committees
see Supervisory Board Report, p. 14
see Supervisory Board Report, p. 14

242 0 1 4
/ 01.5 /
Corporate Governance Report including the Declaration on Corporate GovernanceTo Our Shareholders
adidas Group / 2014 Annual Report
The Executive Board and Supervisory Board of adidas AG issued their last Declaration of Compliance pursuant to § 161 AktG on February 13, 2014. For the period from the publication of the last Declaration of Compliance up to September 30, 2014, the following Declaration refers to the German Corporate Governance Code (hereinafter referred to as the ’Code’) as amended on May 13, 2013. For the period as of October 1, 2014, the following Declaration refers to the recommendations of the Code as amended on June 24, 2014, which was published in the Federal Gazette on September 30, 2014.
The Executive Board and Supervisory Board of adidas AG declare that the recommendations of the ‘Government Commission on the German Corporate Governance Code’ have been and are met with the following deviations:
Capping overall compensation and variable compensation components (section 4.2.3 subsection 2 sentence 6)We follow the recommendations of the Code in all contracts that have been newly concluded or extended since the issuance of the last Declaration of Compliance, and we intend to follow the recommendations in the future as well when contracts are extended or newly concluded. The company cannot, however, unilaterally interfere with existing contracts, nor would such interference be in line with the principle of contractual fidelity.
Agreeing severance payment caps when concluding Executive Board service contracts (section 4.2.3 subsection 4)We believe that for contracts with a term of up to three years the short contractual term agreed in connection with further contractual provisions offers sufficient protection from inappropriate severance payments. Nevertheless, we have agreed on a severance cap in accordance with the recommendations of the Code for all contracts that have been newly concluded or extended since the issuance of the last Declaration of Compliance, and we intend to follow the recommendation in the future as well when contracts are extended or newly concluded.
Disclosure of shares held by the individual members of the Executive Board and Supervisory Board or financial instruments related thereto (section 6.3 sentence 1) In the past, we have not reported the ownership of shares or related financial instruments on an individual basis for the members of the Boards if such ownership exceeded 1% of the shares issued by adidas AG. Henceforth, we will observe this recommendation of the Code and report accordingly in the Corporate Governance Report.
Herzogenaurach, February 12, 2015
The aforementioned Declaration of Compliance dated February 12, 2015 has been published under and can be downloaded at www.adidas-Group.com/s/corporate-governance.
Declaration by the Executive Board and Supervisory Board of adidas AG pursuant to § 161 German Stock Corporation Act (Aktiengesetz – AktG)
on the German Corporate Governance Code
For the Executive Board
H E R B E RT H A I N E RChief Executive Officer
For the Supervisory Board
I G O R L A N D A UChairman of the Supervisory Board

252 0 1 4
/ 01.5 /
Corporate Governance Report including the Declaration on Corporate GovernanceTo Our Shareholders
adidas Group / 2014 Annual Report
Suggestions of the German Corporate Governance Code fulfilledIn addition to the recommendations, the Code contains a number of suggestions for good and responsible corporate governance, compliance with which is not required to be disclosed by law. The adidas Group is fully compliant with all suggestions of the Code.
Relevant management practicesPerformance, passion, integrity and diversity are the core values of our Group. They are actively lived by our Executive Board members, Supervisory Board members and our employees and have been incorporated into our Code of Conduct which we completely revised in the past year, eight years after it was originally introduced in 2006. Our business activities are oriented towards the legal systems in the various countries and markets in which we operate. This implies a high level of social and environmental responsibility.
Compliance with working and social standards: The development of company guidelines with regard to social minimum standards, work safety as well as health and environmental protection and the monitoring thereof at the production facilities of the adidas Group and its business partners is an integral component of our corporate policy. Our Group has a separate Code of Conduct for the supply chain, the ‘Workplace Standards’. These standards are oriented towards the conventions of the International Labour Organization (ILO) and follow the code of conduct of the World Federation of the Sporting Goods Industry (WFSGI). They help us to only choose such business partners who fulfil our Workplace Standards and the requirements of our business practices. We have appointed an expert team especially for the coordination of compliance with, and control of, the Workplace Standards. We report on our sustainability programme in this Annual Report, publish a detailed sustainability report annually and provide information on our progress throughout the year on our website.
Environmental responsibility: For long-term, successful management of the adidas Group, sustainable actions that embrace, in particular, social and environmental responsibility towards present and future generations are essential. Our Social & Environmental Affairs department, with its worldwide team, has for many years been monitoring the rights of employees in the supply chain as well as with the coordination of the environmental strategy and product safety management.
In line with the Group-wide sustainability programme, the adidas Group developed a comprehensive environmental strategy. The objective of the strategy is to make processes more efficient and environmentally friendly at every stage of the value chain. This ranges from areas such as product design, material development and selection, development and sourcing, logistics and IT systems, to improving the efficiency of company-owned locations. Optimising these processes makes it possible for the adidas Group to offer more sustainable products and improve the company’s environmental performance in the future. With our environmental strategy, we have set precise goals concerning the reduction of emissions. A key element of these goals is also the introduction of uniform environmental management systems at company-owned locations in compliance with ISO 14001.
www.adidas-group.com/s/standards-and-policies
see Sustainability, p. 89
www.adidas-group.com/s/green-company
Further information on the principles of our management
More information on topics covered in this report can be found on our website at
www.adidas-group.com including:
/ Code of Conduct/ Sustainability/ Social commitment/ Risk and opportunity management and
compliance/ Information and documents on the Annual
General Meeting/ Directors’ dealings/ Accounting and annual audit

262 0 1 4
/ 01.5 /
Corporate Governance Report including the Declaration on Corporate GovernanceTo Our Shareholders
adidas Group / 2014 Annual Report
Social commitment: The adidas Group cooperates with charity organisations in order to improve the quality of life for people by means of sport. Moreover, we support international humanitarian aid efforts, e.g. in the wake of natural disasters, and we are committed through various projects worldwide to education, science and humanitarian initiatives. Our employees also have a wide range of possibilities to participate in social programmes. Through the adidas Fund, for example, they can become involved in charitable causes around the world: South Africa, the Democratic Republic of the Congo, Albania, Kenya, Israel, Brazil, Hong Kong, Switzerland and Germany are only some of the countries in which adidas employees have already participated in projects. Support is provided especially to children and teenagers, who are introduced through sport to programmes that convey self-confidence, respect and team spirit while also opening up new opportunities and possibilities. Through their volunteer work, our employees experience what can be achieved through sport, and moreover learn a good deal about values, culture and life in different countries. Volunteer work furthermore enhances our employees’ motivation as well as their teamwork, leadership and communication skills. Our website provides information on the various projects.
Compliance and risk management within the adidas GroupOur compliance management system is linked to the Group’s risk and opportunity management system. Both systems are closely coordinated and continuously developed and improved. As part of our global Fair Play concept, the compliance management system establishes the organisational framework for Group-wide awareness of our internal rules and guidelines and for the legally compliant conduct of our business. It underscores our strong commitment to ethical and fair behaviour in our own organisation and also sets the parameters for how we deal with others. The risk and opportunity management system ensures risk-aware, opportunity-oriented and informed actions in a dynamic business environment in order to guarantee the competitiveness and sustainable success of the adidas Group.
Transparency and protection of shareholders’ interestsIt is our goal to inform all institutional investors, private shareholders, financial analysts, business partners, employees and the interested public about the company’s situation, at the same time and to an equal extent, through regular, transparent and up-to-date communication. We publish all essential information, such as press releases, ad hoc announcements and voting rights notifications as well as all presentations from analyst conferences, all financial reports and the financial calendar on our website. Our Investor Relations department maintains close and continuous contact with our shareholders and provides a comprehensive range of services to shareholders and the financial community.
In addition, we also provide all documents and information on our Annual General Meeting on our website. The shareholders of adidas AG exercise their shareholders’ rights at the Annual General Meeting. Each share grants one vote. Thus, our shareholders are involved in all fundamental resolutions at the Annual General Meeting. It is our intention to support our shareholders in exercising their voting rights at the Annual General Meeting.
www.adidas-group.com/s/employee-volunteering
see Risk and Opportunity Report, p. 154
www.adidas-group.comsee Our Share, p. 38

272 0 1 4
/ 01.5 /
Corporate Governance Report including the Declaration on Corporate GovernanceTo Our Shareholders
adidas Group / 2014 Annual Report
Therefore, at our next Annual General Meeting, taking place on May 7, 2015 in Fuerth (Bavaria), we will again provide our shareholders with the best possible service. Shareholders have the possibility, inter alia, to electronically register for the Annual General Meeting through our shareholder portal or to participate in online voting by granting powers of representation and voting instructions to the proxies appointed by the company. Further, all shareholders can follow the Annual General Meeting in full length live on the company’s website.
Share ownership of the Executive Board and Supervisory BoardAt the end of 2014, individual ownership of shares in the company or related financial instruments held by members of the Executive Board and the Supervisory Board was well under 1% of the shares issued by adidas AG. The same applies for the total number of shares held by all members of the Executive Board and the Supervisory Board.
A detailed overview of Directors’ dealings in 2014 is published on our website.
Accounting and annual auditadidas AG prepares the annual financial statements in accordance with the provisions of the German Commercial Code (Handelsgesetzbuch – HGB) and the Stock Corporation Act. The annual consolidated financial statements are prepared in accordance with the principles of the International Financial Reporting Standards (IFRS), as adopted by the European Union (EU).
KPMG AG Wirtschaftsprüfungsgesellschaft was appointed as auditor for the 2014 annual financial statements and annual consolidated financial statements by the Annual General Meeting. The Supervisory Board had previously assured itself of the auditor’s independence.
www.adidas-group.com/s/directors-dealings
see Auditor’s Report, p. 187

6
282 0 1 4
/ 01.6 /
Compensation ReportTo Our Shareholders
adidas Group / 2014 Annual Report
Compensation ReportThe Compensation Report outlines the principles of the compensation system and the level of Executive Board and Supervisory Board compensation in accordance with the legal requirements and the recommendations of the German Corporate Governance Code (the ‘Code’) as amended on June 24, 2014. For the adidas Group, transparent and comprehensible reporting on the compensation of the Executive Board and Supervisory Board is an essential element of good corporate governance.
Compensation system for the Executive BoardFollowing preparation by the Supervisory Board’s General Committee, the compensation system for our Executive Board and the total compensation of each member of the Executive Board is determined and regularly reviewed by the entire Supervisory Board. The compensation and personnel topics dealt with by the Supervisory Board and General Committee for the year under review are described in the Supervisory Board Report. The compensation system is geared towards creating an incentive for successful, sustainably value-oriented corporate development and management. In determining the Executive Board members’ compensation particularly in terms of its appropriateness, such factors as the size and global orientation, the economic situation, the success and outlook of the company are taken into consideration, as well as the common level of the compensation in comparison with peer companies and with the compensation structure applicable for other areas of the company. To this end, the relation between the Executive Board compensation and that of senior management and employees overall is taken into account, also in terms of its development over time. In addition, the tasks and contribution of each Executive Board member to the company’s success, their individual performance as well as the overall performance of the Executive Board are considered when determining the compensation of the Executive Board. It aims to appropriately remunerate exceptional performance, while diminishing variable compensation when targets are not met. Thus, in the Supervisory Board’s opinion, an appropriate level of compensation can be ensured.
The compensation system for the members of the Executive Board which has been applicable since the 2012 financial year was adopted by a large majority at the Annual General Meeting on May 10, 2012.
In 2014, a review of the compensation system was conducted by an independent external compensation expert. The review came to the conclusion that the compensation system meets the requirements of the German Stock Corporation Act (Aktiengesetz – AktG) and the recommendations of the German Corporate Governance Code.
Components of the Executive Board compensationThe total compensation of the Executive Board members – in the case of 100% target achievement – is made up of around one-third fixed compensation and two-thirds variable, i.e. performance-related compensation components: / The fixed compensation consists of the annual fixed salary, which is based on the tasks and
responsibilities of the individual Executive Board member. It is paid in twelve equal monthly instalments and basically remains unchanged for three years during the term of the service contract.
see Supervisory Board Report, p. 14
1) This Compensation Report is a component of the Group Management Report and is also part of the Corporate Governance Report including the Declaration on Corporate Governance.
1)

292 0 1 4
/ 01.6 /
Compensation ReportTo Our Shareholders
adidas Group / 2014 Annual Report
/ The variable, performance-related compensation consists of the following two components:/ the Performance Bonus measured over a one-year period and/ the LTIP Bonus, which is based on on the Long-Term Incentive Plan 2012/2014 (LTIP
2012/2014) measured over a three-year period, as a compensation component with long-term incentive effect.
The variable compensation components are designed in such a way that the incentive to achieve the decisive long-term targets set by the LTIP is significantly higher than the incentive to achieve the targets decisive for being granted the Performance Bonus. Corresponding contractual regulations ensure that this weighting will also be maintained in the future. More than 50% of the variable target compensation component is based upon multi-year performance criteria.
The variable components are structured as follows:/ The Performance Bonus serves as compensation for the Executive Board’s performance in the
past financial year in line with the short-term development of the company. It is determined by the Supervisory Board in a two-stage process:/ At the beginning of the financial year, the Supervisory Board establishes the differently
weighted performance criteria with their respective clear targets, and determines the individual amount of the Performance Bonus target amount for each member of the Executive Board, based on a target achievement of 100% (Bonus target amount).
/ At the end of the financial year, the Supervisory Board examines the precise target achievement of each Executive Board member and determines the amount of Performance Bonus to be paid, depending on the degree of actual target achievement. The bonus is payable following approval of the consolidated financial statements of the past financial year.
As criteria for the 2014 Performance Bonus the Supervisory Board established, in addition to the individual performance of the Executive Board member, the following business-related criteria (performance criteria):/ increase in currency-neutral net sales/ improvement of operating working capital/ improvement of the operating margin in the Retail segment.
In calculating the amount of the Performance Bonus, the degree of target achievement determined for each individual performance criterion is weighted according to the percentage value of the respective performance criterion. The sum of the weighted degrees of target achievement of the performance criteria is then multiplied by the individual Bonus target amount for each Executive Board member. The Performance Bonus is capped at a maximum of 150% of the individual Bonus target amount. If an Executive Board member takes or leaves office during a financial year, the Performance Bonus is calculated on a pro rata basis.

302 0 1 4
/ 01.6 /
Compensation ReportTo Our Shareholders
adidas Group / 2014 Annual Report
/ The LTIP Bonus serves – in line with sustainability-oriented corporate planning – as compensation for the long-term performance of the Executive Board based on the Long-Term Incentive Plan 2012/2014 (LTIP 2012/2014) measured over a three-year period. It is determined by the Supervisory Board in a two-stage process: / In determining the LTIP 2012/2014 at the beginning of the 2012 financial year, the Supervisory
Board defined the performance criteria, linked to clear targets and oriented towards the sustainable growth of the company, and also defined the individual amount of the LTIP Bonus target amount for each Executive Board member, based on a target achievement of 100% (LTIP target amount).
/ At the end of the 2014 financial year, the Supervisory Board examined the precise target achievement of each Executive Board member and determined the amount of Performance Bonus to be paid, depending on the degree of actual target achievement. Payout will be effected after the 2014 consolidated financial statements are approved.
The Supervisory Board determined the following performance criteria for the LTIP 2012/2014:/ increase in net income attributable to shareholders,/ increase in operating free cash flow,/ increase in adidas NEO Label sales, and/ development of the adidas AG share price.
In calculating the amount of the LTIP Bonus, the degree of target achievement determined for each individual performance criterion is weighted according to the percentage value of the respective performance criterion. The development of the individual performance criteria over the three-year period from 2012 to 2014 is decisive for the assessment of target achievement. The sum of the weighted degrees of target achievement of the performance criteria is multiplied by the individual LTIP target amount for each Executive Board member.
For the ultimate evaluation of the Executive Board’s performance, qualitative criteria determined by the Supervisory Board when establishing the LTIP 2012/2014 were taken into account, such as developing an HR reporting system in alignment with GRI (Global Reporting Initiative) guidelines. The LTIP Bonus is capped at a maximum of 150% of the individual LTIP target amount. If the overall degree of target achievement lies at or below 50%, the Executive Board member is not entitled to the LTIP Bonus. If an Executive Board member takes or leaves office during the term of the LTIP 2012/2014, the LTIP Bonus is calculated on a pro rata basis. There is no claim to payout if an Executive Board member resigns from office or voluntarily terminates his employment relationship during the term of the LTIP 2012/2014, nor in the event of termination of the service contract by the company.
A compensation component resulting from a management share option plan does not exist and is not planned. The development of the adidas AG share, however, provides one of the four performance criteria for the LTIP 2012/2014.

312 0 1 4
/ 01.6 /
Compensation ReportTo Our Shareholders
adidas Group / 2014 Annual Report
Other benefits and additional commitmentsThe Executive Board members are granted other minor benefits which are individually taxed in accordance with applicable law. These benefits primarily consist of paying for, or providing the monetary value of, non-cash benefits and other benefits such as the provision of a company car and contributions to standard insurance schemes. The Executive Board members do not receive any additional compensation for mandates within the adidas Group. The Executive Board members did not receive any loans or advance payments from adidas AG.
Pension commitmentsAll members of the Executive Board have individual contractual pension commitments which are calculated based on the length of appointment to the Executive Board as a percentage of contractually agreed pensionable income.
The amount of pensionable income for the members of the Executive Board currently equals the individual fixed annual salary indicated in the table ‘Benefits granted’. Starting from a base amount totalling 10% of the respective pensionable income, a module of two percentage points 2) 3) of the pensionable income is formed for each full year of tenure as an Executive Board member.
The Supervisory Board has, as its targeted level of provision regarding pension commitments for members of the Executive Board, determined a pension claim amounting to a maximum of 40% 4) of an Executive Board member’s pensionable income. Following the Executive Board member’s departure from the company, benefit payments are made on a monthly basis/ as a retirement pension upon reaching the age of 65, or/ as a disability pension in the event of occupational or general disability for medical reasons, for
no longer than up to the point a retirement pension is paid, amounting to the pension entitlement reached at the point the respective pension became payable;
/ as survivors’ benefits upon the death of an Executive Board member, providing the spouse or partner with 50% of the pension entitlements up to this point and, if applicable, 15% of the pension entitlements up to this point for each dependent half-orphan or 30% for each dependent orphan. Taken together, survivors’ benefits may not exceed the deceased Executive Board member’s total pension entitlement. If survivors’ entitlements exceed the pension entitlement, benefits for dependent children are reduced proportionately.
In the event that an Executive Board member leaves the company prior to reaching retirement age, the non-forfeiture of the pension entitlement will be in line with legal provisions. The pension entitlement is not, as legally envisaged, reduced pro rata temporis, i.e. it amounts to at least the base amount of the pension commitment made to the Executive Board member, plus the pension modules accumulated annually during the term of office.
Following commencement of retirement, ongoing pensions are adjusted in line with the development of state pensions.
Herbert Hainer, Roland Auschel, Eric Liedtke, Robin J. Stalker and Erich Stamminger, who belonged to the group of senior executives of adidas AG prior to their Executive Board appointments, will at the time of their retirement receive additional payments from the ‘adidas Management Pension Plan’. Until their appointment as Executive Board members, adidas AG had contributed pension components for Herbert Hainer, Roland Auschel, Eric Liedtke, Robin J. Stalker and Erich Stamminger under these supplementary provisions which were introduced for all senior executives of the company in 1989.
see Table 01
2) Initial appointment of Herbert Hainer and Erich Stamminger: effective March 6, 1997; deviating provision for Glenn Bennett: instead of his initial appointment date (effective March 6, 1997), January 1, 2000 is used for the calculation of his pension entitlements with a base amount of 20% of pensionable income; initial appointment of Robin J. Stalker: effective January 30, 2001; initial appointment of Roland Auschel: effective October 1, 2013; initial appointment of Eric Liedtke: effective March 6, 2014.
3) Increase of the annual pension components of Glenn Bennett and Robin J. Stalker to three percentage points of the pensionable income effective March 6, 2015.
4) Increase of the targeted provision level of Glenn Bennett and Robin J. Stalker to a pension entitlement of a maximum of 50% effective March 6, 2015.

322 0 1 4
/ 01.6 /
Compensation ReportTo Our Shareholders
adidas Group / 2014 Annual Report
If an Executive Board member dies during his term of office, his spouse or partner receives or, alternatively, any dependent children receive, in addition to pension benefits, the pro rata annual fixed salary for the month of death and the following three months, but no longer than until the agreed end date of the service contract.
Commitments to Executive Board members upon premature termination of tenureExecutive Board service contracts are usually agreed with a contractual term of three years. This term will be shortened accordingly if the Executive Board member reaches the age of 65 prior to expiration.
In case of premature termination of tenure in the absence of good cause, the Executive Board service contracts provide for compensatory payments of a maximum of twice the overall annual compensation, limited to payment claims for the remaining period of the service contract (Severance Payment Cap) 5). In this respect, the overall annual compensation means the overall compensation paid for the last full financial year prior to resignation from the Executive Board as outlined in the Compensation Report, excluding service costs and follow-up bonus, while considering the expected total compensation for the current financial year. If the service contract is terminated due to a change of control, a possible severance payment is limited to 150% of the Severance Payment Cap.
Unless otherwise agreed, upon regular termination of the service contract, i.e. in case of non-renewal of the service contract or termination upon reaching the age of 65, the departing Executive Board member is entitled to receive not only his annual fixed salary on a pro rata basis up to the date on which he leaves office, but also a potential pro-rated Performance Bonus and LTIP Bonus as well as an individually agreed follow-up bonus 6). The follow-up bonus is paid in two tranches, 12 and 24 months following the end of the contract 7).
01 / Pension commitments (€)
Service cost Accumulated pension obligation for all pension commitments
excluding deferred compensation
Executive Board members incumbent as at December 31, 2014 2014 2013 2014 1) 2013 2)
Herbert Hainer (CEO) 330,836 331,765 12,671,309 9,291,353
Roland Auschel 390,536 97,612 2,177,675 1,460,813
Glenn Bennett 3) 756,632 112,614 5,324,430 2,520,181
Eric Liedtke 315,951 – 658,518 –
Robin J. Stalker 3) 907,791 240,980 5,430,974 2,858,950
Erich Stamminger 4) 147,679 157,369 6,122,065 4,713,548
Total 2,849,425 940,340 32,384,971 20,844,845
1) Total deferred compensation amounted to € 719,324 (2013: € 127,770), implemented for Glenn Bennett in the amount of $ 754,753 (annual average rate 2014: 1.3296 $/€) and for Robin J. Stalker in the amount of € 151,670.
2) Total deferred compensation amounted to € 127,770, implemented for Robin J. Stalker.3) The service cost increased effective March 6, 2015 due to the amendment of the Pension Agreement comprising the 2014 service cost and the 2014 past service cost.4) Pro rata temporis until the date of resignation effective March 6, 2014.
5) A corresponding provision will be added to Roland Auschel’s service contract upon its renewal.
6) This bonus amounts to 75% for Roland Auschel, Glenn Bennett and Eric Liedtke, 100% for Robin J. Stalker and 125% for Herbert Hainer and Erich Stamminger and is based on the Performance Bonus granted to the respective Executive Board member for the last full financial year.
7) There is no claim to a follow-up bonus if the Executive Board service contract is terminated by release or for good cause.

332 0 1 4
/ 01.6 /
Compensation ReportTo Our Shareholders
adidas Group / 2014 Annual Report
The service contract of Erich Stamminger was terminated by mutual consent effective March 6, 2014. Until that date, he was granted the contractual payments. In connection with the mutual termination of his Executive Board mandate, Erich Stamminger received a Performance Bonus amounting to € 482,710 for the 2013 financial year. In view of the short term until his departure, no Performance Bonus was granted for the 2014 financial year. It was further agreed with Erich Stamminger that he will receive two thirds of the LTIP Bonus which the Supervisory Board resolved in February 2015 assuming his participation in the Plan from January 1, 2012 until December 31, 2014. In accordance with his service contract, Erich Stamminger will receive 75% and 50% of the Performance Bonus granted to him for the 2013 financial year at the end of March 2015 and March 2016, respectively, i.e. € 362,032 and € 214,355. Erich Stamminger agreed not to work for a key competitor of the adidas Group in the period until July 8, 2014. In accordance with the provisions of his service contract, he was paid compensation in the amount of € 104,530 gross for this post-contractual competition prohibition. The monthly compensatory payment amounts to 50% of the last fixed monthly salary. The claims to pension payments deriving from the adidas Management Pension Plan and the pension commitment dated March 6, 1997, as amended on March 1, 2011, remain unaffected.
Overall compensation 2014 in accordance with the German Corporate Governance Code (the ‘Code’)Based on the Supervisory Board’s determination outlined above, the overall compensation of the Executive Board for the 2014 financial year amounts to € 17.083 million (2013: € 6.500 million). Although the Executive Board was granted a Performance Bonus and LTIP Bonus well below the individual target bonuses as the targets set for the 2014 Performance Bonus and the LTIP Bonus were not achieved, the overall compensation increased significantly compared to the 2013 financial year. This increase is attributable to the payout of the LTIP Bonus resulting from the LTIP 2012/2014 measured over a three-year period and to the increased number of Executive Board members. In addition, the service costs for the pension commitments of Glenn Bennett and Robin J. Stalker increased, as the targeted individual pension level was raised effective March 6, 2015.
The recommendation of the Code to individually disclose the compensation components for each Executive Board member and to use the sample tables attached to the Code is implemented in the following.
Benefits granted in accordance with the CodeIn the following table, the benefits granted for the 2013 and 2014 financial years are disclosed including other benefits and service costs, and also including the maximum and minimum achievable compensation.
In accordance with the requirements of the Code, the Performance Bonus is disclosed with the amount granted in case of 100% target achievement. Pursuant to the recommendations of the Code, the LTIP Bonus resulting from the LTIP 2012/2014 measured over a three-year period is to be indicated with the pro rata temporis target amount of an ‘average probability scenario’ at the time of granting, whereas adidas AG takes the 100% target amount as the basis.
see Table 03

342 0 1 4
/ 01.6 /
Compensation ReportTo Our Shareholders
adidas Group / 2014 Annual Report
02 / Benefits granted (€)
Benefits granted Herbert Hainer CEO
Roland Auschel Executive Board member, Global Sales
Since October 1, 2013
2014 2013 2014 (min.) 2014 (max.) 2014 2013 2014 (min.) 2014 (max.)
Fixed compensation 1,500,000 1,481,989 1,500,000 1,500,000 550,000 137,500 550,000 550,000
Other benefits 35,397 53,744 35,397 35,397 19,931 4,704 19,931 19,931
Total 1,535,397 1,535,733 1,535,397 1,535,397 569,931 142,204 569,931 569,931
One-year variable compensation 1) 1,273,080 1,273,080 0 1,909,620 400,000 100,000 0 600,000
Multi-year variable compensation 1,540,000 1,540,000 0 2,310,000 550,000 137,500 0 825,000
LTIP 2012/2014 2) 1,540,000 1,540,000 0 2,310,000 550,000 137,500 0 825,000
Follow-up bonus 3) n.a. n.a. n.a. n.a. n.a. n.a. n.a. n.a.
Total 4,348,477 4,348,813 1,535,397 5,755,017 1,519,931 379,704 569,931 1,994,931
Service cost 4) 330,836 331,765 330,836 330,836 390,536 97,612 390,536 390,536
Overall compensation 4,679,313 4,680,578 1,866,233 6,085,853 1,910,467 477,316 960,467 2,385,467
Benefits granted Glenn Bennett Executive Board member, Global Sales
Eric Liedtke Executive Board member, Global Brands
Since March 6, 2014
2014 5) 2013 6) 2014 (min.) 2014 (max.) 2014 2013 2014 (min.) 2014 (max.)
Fixed compensation 546,029 546,563 546,029 546,029 409,946 n.a. 409,946 409,946
Other benefits 15,761 15,822 15,761 15,761 13,130 n.a. 13,130 13,130
Total 561,790 562,385 561,790 561,790 423,076 n.a. 423,076 423,076
One-year variable compensation 1) 370,292 370,654 0 555,438 333,333 n.a. 0 500,000
Multi-year variable compensation 839,726 840,548 0 1,259,589 437,500 n.a. 0 656,250
LTIP 2012/2014 2) 839,726 840,548 0 1,259,589 437,500 n.a. 0 656,250
Follow-up bonus 3) n.a. n.a. n.a. n.a. n.a. n.a. n.a. n.a.
Total 1,771,808 1,773,587 561,790 2,376,817 1,193,909 n.a. 423,076 1,579,326
Service cost 4) 756,632 112,614 756,632 756,632 315,951 n.a. 315,951 315,951
Overall compensation 2,528,440 1,886,201 1,318,422 3,133,449 1,509,860 n.a. 739,027 1,895,277
Benefits granted Robin J. Stalker Chief Financial Officer
Erich Stamminger Executive Board member, Global Brands
Until March 6, 2014
2014 2013 2014 (min.) 2014 (max.) 2014 2013 2014 (min.) 2014 (max.)
Fixed compensation 605,000 605,000 605,000 605,000 192,500 770,000 192,500 192,500
Other benefits 18,617 15,966 18,617 18,617 10,266 50,068 10,266 10,266
Total 623,617 620,966 623,617 623,617 202,766 820,068 202,766 202,766
One-year variable compensation 1) 402,730 402,730 0 604,095 0 742,630 0 0
Multi-year variable compensation 770,000 770,000 0 1,155,000 603,387 990,000 603,387 603,387
LTIP 2012/2014 2) 770,000 770,000 0 1,155,000 0 990,000 0 0
Follow-up bonus 3) n.a. n.a. n.a. n.a. 603,387 n.a. 603,387 603,387
Total 1,796,347 1,793,696 623,617 2,382,712 806,153 2,552,698 806,153 806,153
Service cost 4) 907,791 240,980 907,791 907,791 147,679 157,369 147,679 147,679
Overall compensation 2,704,138 2,034,676 1,531,408 3,290,503 953,832 2,710,067 953,832 953,832
1) No Performance Bonus granted to Erich Stamminger for 2014 due to his resignation effective March 6, 2014. Contractually agreed Performance Bonus target amount 2014 for Eric Liedtke effective March 6, 2014 due to his appointment during the year.
2) Contractually agreed LTIP Bonus target amount 2012/2014 due to the appointment of Roland Auschel (effective October 1, 2013) and Eric Liedtke (effective March 6, 2014) during the plan term. Contractually agreed LTIP Bonus target amount 2012/2014 due to the resignation of Erich Stamminger (effective March 6, 2014) during the plan term.
3) Contractually agreed follow-up bonus for Erich Stamminger: € 362,032 for the period from March 6, 2014 to March 5, 2015, payable by the end of March 2015, and € 241,355 for the period from March 6, 2015 to March 5, 2016, payable by the end of March 2016.
4) Increase of the service costs for Glenn Bennett and Robin J. Stalker for the 2014 financial year due to amendment of the Pension Agreements effective March 6, 2015, comprising the 2014 service cost and the 2014 past service cost.
5) Exchange rate 1.3296 $/€ (annual average rate 2014).6) Exchange rate 1.3283 $/€ (annual average rate 2013).

352 0 1 4
/ 01.6 /
Compensation ReportTo Our Shareholders
adidas Group / 2014 Annual Report
Allocation in accordance with the CodePursuant to the recommendations of the Code, the fixed compensation, other benefits and the service costs as well as the Performance Bonus are to be disclosed as an allocation for the financial year in which the compensation was granted. As stipulated by the Code, the LTIP Bonus resulting from the LTIP 2012/2014 measured over a three-year period is disclosed for the year in which the plan ends, i.e. for the 2014 financial year.
03 / Allocation (€)
Allocation Herbert Hainer CEO
Roland Auschel Executive Board member, Global Sales
Glenn Bennett Executive Board member, Global Sales
Since October 1, 2013
2014 2013 2014 2013 2014 1) 2013 2)
Fixed compensation 1,500,000 1,481,989 550,000 137,500 546,029 546,563
Other benefits 35,397 53,744 19,931 4,704 15,761 15,822
Total 1,535,397 1,535,733 569,931 142,204 561,790 562,385
One-year variable compensation 3) 700,194 827,502 220,000 65,000 203,660 240,925
Multi-year variable compensation 3,234,000 0 481,250 0 1,763,425 0
LTIP 2012/2014 4) 3,234,000 0 481,250 0 1,763,425 0
Follow-up bonus 5) n.a. n.a. n.a. n.a. n.a. n.a.
Total 5,469,591 2,363,235 1,271,181 207,204 2,528,875 803,310
Service cost 6) 330,836 331,765 390,536 97,612 756,632 112,614
Overall compensation 5,800,427 2,695,000 1,661,717 304,816 3,285,507 915,924
Allocation Eric Liedtke Executive Board member, Global Brands
Robin J. Stalker Chief Financial Officer
Erich Stamminger Executive Board member, Global Brands
Since March 6, 2014 Until March 6, 2014
2014 2013 2014 2013 2014 2013
Fixed compensation 409,946 n.a. 605,000 605,000 192,500 770,000
Other benefits 13,130 n.a. 18,617 15,966 10,266 50,068
Total 423,076 n.a. 623,617 620,966 202,766 820,068
One-year variable compensation 3) 183,333 n.a. 221,502 261,775 0 482,710
Multi-year variable compensation 306,250 n.a. 1,617,000 0 1,386,000 0
LTIP 2012/2014 4) 306,250 n.a. 1,617,000 0 1,386,000 0
Follow-up bonus 5) n.a. n.a. n.a. n.a. n.a. n.a.
Total 912,659 n.a. 2,462,119 882,741 1,588,766 1,302,778
Service cost 6) 315,951 n.a. 907,791 240,980 147,679 157,369
Overall compensation 1,228,610 n.a. 3,369,910 1,123,721 1,736,445 1,460,147
1) Exchange rate 1.3296 $/€ (annual average rate 2014).2) Exchange rate 1.3283 $/€ (annual average rate 2013).3) No Performance Bonus granted to Erich Stamminger for 2014 due to his resignation effective March 6, 2014. Pro rata temporis Performance Bonus 2014 for Eric Liedtke effective March 6, 2014
due to his appointment during the year.4) Pro rata temporis LTIP Bonus 2012/2014 due to the appointment of Roland Auschel (effective October 1, 2013) and Eric Liedtke (effective March 6, 2014) during the plan term. Pro rata temporis
LTIP Bonus 2012/2014 due to the resignation of Erich Stamminger (effective March 6, 2014) during the plan term.5) Payout of the follow-up bonus to Erich Stamminger at the end of March 2015 and March 2016.6) Increase of the service costs for Glenn Bennett and Robin J. Stalker for the 2014 financial year due to amendment of the Pension Agreements effective March 6, 2015 comprising the 2014
service cost and the 2014 past service cost.

362 0 1 4
/ 01.6 /
Compensation ReportTo Our Shareholders
adidas Group / 2014 Annual Report
As a variable compensation component with long-term incentive effect, our Executive Board will be granted a new Long-Term Incentive Plan, also covering a three-year period, as of the 2015 financial year.
Payments to former members of the Executive Board and their surviving dependantsIn 2014, pension payments to former Executive Board members or to their surviving dependants amounted to € 3.458 million (2013: € 3.421 million). As at December 31, 2014, the provisions for pension entitlements of this group of persons totalled € 45.900 million (2013: € 41.454 million). The increase can mainly be attributed to a lowering of the underlying interest rate from 3.7% to 2.1%.
There are further pension commitments towards three former Executive Board members who resigned after December 31, 2005, which are covered by a pension fund or a pension fund in combination with a reinsured pension trust fund. From this, indirect obligations amounting to € 13.576 million (prior year: € 6.859 million) arise for adidas AG, for which no accruals were established due to financing through the pension fund and pension trust fund. This increase is attributable to the resignation of Erich Stamminger and a lowering of the underlying interest rate.
The dynamisation of the pensions paid to former Executive Board members is effected in accordance with statutory regulations or regulations under collective agreements, unless a surplus from the pension fund is used for an increase in pension benefits after pension payments have already begun.
Review of Executive Board compensationIn 2014, the Supervisory Board had the Executive Board compensation system reviewed with regard to appropriateness by an independent external compensation expert. In doing so, the individual overall target annual compensation of the Executive Board members was examined in detail. The review found that the compensation meets the requirements of the German Stock Corporation Act, but that, compared to other companies, there is a need for action especially concerning the pension plans of the Executive Board members and that there is therefore room for a moderate increase, in order to thus ensure competitive compensation.
Compensation of the Supervisory BoardThe compensation of the Supervisory Board members is regulated by § 18 of the company’s Articles of Association and is linked to the size of the company and to the responsibility and scope of activities of the Supervisory Board members. After the end of the respective financial year, the members receive a fixed compensation amount for their function as well as compensation for the chairmanship of or membership in committees, in accordance with the Code. Variable compensation is not granted in addition. Supervisory Board members who have not been members of the Supervisory Board for the entire financial year receive a pro-rated amount of compensation.
For the 2014 financial year, each individual member of the Supervisory Board received € 40,000 as fixed annual compensation; three times this amount was paid to the Chairman of the Supervisory Board and twice this amount was paid to each Deputy Chairperson. Members of the General Committee and of the Finance and Investment Committee received additional compensation of € 20,000 and members of the Audit Committee received additional compensation of € 40,000. In addition to the fixed compensation, the Chairman of the General Committee and of the Finance

372 0 1 4
/ 01.6 /
Compensation ReportTo Our Shareholders
adidas Group / 2014 Annual Report
04 / Compensation of the Supervisory Board members (in €)
2014 2013
Supervisory Board members incumbent as at December 31, 2014
Igor Landau (Chairman of the Supervisory Board, Chairman of the General Comittee) 160,000 160,000
Sabine Bauer (Deputy Chairwoman of the Supervisory Board, Member of the General Committee) 100,000 100,000
Willi Schwerdtle (Deputy Chairman of the Supervisory Board, Member of the General Committee) 100,000 100,000
Dieter Hauenstein 40,000 40,000
Dr. Wolfgang Jäger (Member of the Audit Committee) 80,000 80,000
Dr. Stefan Jentzsch (Member of the Audit Committee) 80,000 80,000
Herbert Kauffmann (Chairman of the Audit Committee) 100,000 100,000
Katja Kraus 1) 25,973 n.a.
Kathrin Menges 1) 25,973 n.a.
Roland Nosko (Member of the General Committee) 60,000 60,000
Hans Ruprecht (Member of the Audit Committee) 80,000 80,000
Heidi Thaler-Veh 40,000 40,000
Supervisory Board members incumbent until the end of the Annual General Meeting on May 8, 2014
Alexander Popov 2) 14,027 40,000
Christian Tourres 2) 14,027 40,000
Total 920,000 920,000
1) First-time Supervisory Board member since the end of the Annual General Meeting held on May 8, 2014.2) Supervisory Board member until the end of the Annual General Meeting held on May 8, 2014.
and Investment Committee received annual compensation of € 40,000, while the Chairman of the Audit Committee received € 60,000. The remuneration paid for committee chairmanship also covers the membership in such committee. The members of the Steering Committee, the Mediation Committee, the Nomination Committee and committees which are established ad hoc do not receive additional compensation. If a Supervisory Board member is in more than one committee, the member only receives compensation for his/her task in the committee with the highest compensation. The Supervisory Board members are reimbursed for all expenses incurred in connection with their mandates as well as for the VAT payable on their compensation, insofar as they charge for it separately.
The total compensation paid to our Supervisory Board in the 2014 financial year amounted to € 0.92 million (2013: € 0.92 million).
At the Annual General Meeting on May 8, 2014, the shareholders resolved an increase of the fixed annual compensation from € 40,000 to € 50,000 as well as an attendance fee amounting to € 750 for each meeting requiring personal attendance with effect from the 2015 financial year. The structure concerning compensation for the Supervisory Board chairmanship and deputy chairmanship as well as chairmanship or membership of a committee set out in § 18 of the Articles of Association of the company remains unchanged.
Other benefits and additional commitmentsThe Supervisory Board members did not receive any loans or advance payments from adidas AG.

7
382 0 1 4
/ 01.7 /
Our ShareTo Our Shareholders
adidas Group / 2014 Annual Report
Our ShareIn 2014, international stock market performance was mixed, characterised by volatile movements. While the DAX-30 increased slightly by 3%, the MSCI World Textiles, Apparel & Luxury Goods Index declined 4%. Following a strong outperformance versus the overall market development in 2013, the adidas AG share faced significant pressure in 2014, underperforming both indices and declining 38% versus the prior year. The share price was negatively impacted as a result of the Group’s lowered financial outlook for 2014. This adjustment was mainly due to the continued weakness in the golf market, negative economic developments in Russia/CIS as well as ongoing currency headwinds. Given Management’s confidence in the strength of the Group’s financial position and long-term aspirations, we intend to propose an unchanged dividend per share of € 1.50 at our 2015 Annual General Meeting.
Mixed international stock market development in 2014In 2014, the performance of international stock markets was mixed, with European indices trading sideways, while US equities gained strongly, thereby clearly outperforming international indices. Ongoing expansionary ECB policy, robust US economic data as well as an accommodative monetary policy in China and Japan were key positive catalysts for international stock markets. In particular, the Fed’s signals of a patient approach to rising interest rates as well as robust leading US economic indicators, with the unemployment rate improving to a six-year low and monthly exports approaching new all-time highs, provided support for US equity markets. However, disappointing growth trends in the euro area as well as geopolitical risk factors, such as the crisis in Ukraine, remained a key headwind for equity markets during 2014. In addition, negative economic trends in Asia and emerging economies as well as the plunge in both the oil price and the Russian rouble weighed on investor sentiment and led to an overall volatile trading environment. Accordingly, while the DAX-30 increased 3%, the MSCI World Textiles, Apparel & Luxury Goods Index declined 4% in 2014. The Dow Jones Index gained 10% during the period.
adidas AG share price suffers considerably Following a strong outperformance versus the overall market development, the adidas AG share reached an all-time high at the end of 2013. As a result, the beginning of 2014 was characterised by profit-taking by some investors. In mid-January, the adidas AG share reversed its previous weakness, driven by several positive analyst commentaries, and reached a new all-time high of € 92.92 on January 22, 2014. However, the adidas AG share suffered strong losses during the remainder of the first quarter following the publication of the adidas Group’s 2013 full year financial results on March 5, 2014. While full year 2013 results came in slightly above market expectations, the Group’s full year 2014 outlook disappointed most market participants.
see Table 01
01 / Historical performance of the adidas AG share and important indices at year-end 2014 (in %)
1 year 3 years 5 years 10 years Since IPO
adidas AG (38) 15 53 94 496
DAX-30 3 66 65 130 346
MSCI World Textiles,Apparel & Luxury Goods (4) 51 108 177 397
Source: Bloomberg.1) This section is part of the audited
Group Management Report.
1)

392 0 1 4
/ 01.7 /
Our ShareTo Our Shareholders
adidas Group / 2014 Annual Report
02 / Five-year share price development 1)
| Dec. 31, 2009 Dec. 31, 2014 |
250
200
150
100
50
1) Index: December 31, 2009 = 100. adidas AG DAX-30 MSCI World Textiles, Apparel & Luxury Goods Index
adidas AG share at a glance
Important indices
/ DAX-30/ MSCI World Textiles,
Apparel & Luxury Goods/ Deutsche Börse Prime
Consumer / Dow Jones Sustainability
Indices (World and Europe)/ FTSE4Good Index Series/ Euronext Vigeo
(Eurozone 120, Europe 120, World 120)
/ Ethibel Index (Pioneer and Excellence)
/ ECPI Ethical Index (Euro and EMU)
/ STOXX Global ESG Leaders
03 / The adidas AG share
2014 2013
Number of shares outstanding 1) shares 204,327,044 209,216,186
Basic earnings per share € 2.72 2) 4.01 3)
Cash generated from operating activities per share € 3.36 3.03
Year-end price € 57.62 92.64
Year high € 92.92 92.64
Year low € 53.89 66.28
Market capitalisation 5) € in million 11,773 19,382
Dividend per share € 1.50 4) 1.50
Dividend payout 5) € in million 306 314
Dividend payout ratio 5) % 53.9 2) 37.4 3)
Dividend yield % 2.6 1.6
Shareholders’ equity per share 5) € 27.53 26.24
Price-earnings ratio at year-end % 21.2 2) 23.1 3)
Average trading volume per trading day 6) shares 1,356,914 842,318
1) All shares carry full dividend rights.2) Excluding goodwill impairment of € 78 million.3) Excluding goodwill impairment of € 52 million.4) Subject to Annual General Meeting approval.5) Based on number of shares outstanding at year-end.6) Based on number of shares traded on all German stock exchanges.

402 0 1 4
/ 01.7 /
Our ShareTo Our Shareholders
adidas Group / 2014 Annual Report
During the second quarter of 2014, the adidas AG share faced additional pressures, mainly as a result of the overall equity market weakness. In particular, the continued depreciation of several emerging market currencies versus the euro as well as geopolitical risk factors, such as the crisis in Ukraine, negatively impacted the adidas AG share price development, given the adidas Group’s high percentage of sales in emerging markets. In addition, negative newsflow with regard to the golf market as well as unfavourable point-of-sale data in North America increased negative sentiment towards the adidas AG share in June. On July 31, the adidas Group lowered its financial outlook for 2014 and postponed the delivery of its Route 2015 targets, mainly due to the continued weakness in the golf market, negative developments in Russia/CIS as well as ongoing currency headwinds, resulting in a significant share price decrease. Following the publication of the adidas Group’s first half results on August 7, the adidas AG share suffered further losses, as market participants remained concerned about the Group’s future top- and bottom-line development, waiting for clear signals of better execution before turning more constructive on the adidas AG share again. During the first half of the fourth quarter of 2014, the adidas AG share recovered and gained steadily, supported by positive market feedback following the release of the nine months results on November 7, with both top and bottom line exceeding market expectations. In particular, robust sales momentum at both adidas and Reebok, ongoing strong performances in Western Europe and emerging markets as well as Management’s confirmation of the full year 2014 guidance was well received by market participants. However, towards the end of the year, the adidas AG share again came under pressure, following several analyst reports indicating further margin pressure in 2015, mainly due to the significant depreciation of the Russian rouble. As a result, the adidas AG share closed 2014 at € 57.62, representing a 38% decrease over the year. This implies a market capitalisation of € 11.8 billion at the end of 2014 versus € 19.4 billion at the end of 2013.
see Diagram 02see Diagram 03
04 / 2014 adidas AG high and low share prices per month 1) (in €)
| Jan Feb Mar Apr May Jun Jul Aug Sep Oct Nov Dec |
90
80
70
60
50
30-day moving average ■ High and low share prices Source: Bloomberg. 1) Based on daily Xetra closing prices.
92.9
282
.89
86.7
381
.02
83.4
075
.34
79.6
075
.57
79.3
076
.64
78.5
072
.86
74.3
759
.41
60.3
055
.50
62.0
357
.09
59.8
653
.89
65.7
256
.27
63.7
455
.14

412 0 1 4
/ 01.7 /
Our ShareTo Our Shareholders
adidas Group / 2014 Annual Report
Average daily trading volume increases stronglyDuring 2014, the average daily trading volume of the adidas AG share on all German stock exchanges (excluding bank trades) increased strongly to 1.4 million shares (2013: 0.8 million). The average daily trading volume of the adidas AG share on alternative trading systems, such as CHI-X, Turquoise and BATS Europe, also almost doubled to 0.9 million shares per trading day (2013: 0.5 million). Share trading on OTC markets such as BOAT and EuroNext OTC decreased to 0.5 million shares per trading day (2013: 1.1 million).
Level 1 ADR performs in line with common stock Our Level 1 ADR closed 2014 at US $ 34.51, representing a decrease of 46% versus the prior year level (2013: US $ 64.23). The more pronounced decrease of the Level 1 ADR price compared to the ordinary share price was due to the appreciation of the US dollar versus the euro at the end of 2014 compared to year-end 2013. The number of Level 1 ADRs outstanding decreased to 5.9 million at year-end 2014 compared to 9.2 million at the end of 2013. The average daily trading volume more than doubled to 80,800 ADRs in 2014 (2013: 35,800). Deutsche Bank Trust Company Americas runs the adidas AG Level 1 ADR Programme. Further information on our ADR Programme can be found on our website.
adidas AG share member of important indicesThe adidas AG share is included in a variety of high-quality indices around the world, most importantly the DAX-30 and the MSCI World Textiles, Apparel & Luxury Goods Index. The DAX-30 is a blue chip stock market index consisting of the 30 major German companies trading on the Frankfurt Stock Exchange. The MSCI World Textiles, Apparel & Luxury Goods Index comprises our Group’s major competitors. At December 31, 2014, our weighting in the DAX-30, which is calculated on the basis of free float market capitalisation and twelve-month share turnover, decreased to 1.47% (2013: 2.36%). Our lower weighting compared to the prior year was mainly due to the decrease in market capitalisation of adidas AG which more than offset the increase in share turnover. Within the DAX-30, we ranked 21 on market capitalisation (2013: 16) and 15 on turnover (2013: 17) at year-end 2014. Additionally, in recognition of our social and environmental efforts, adidas AG is listed in several key sustainability indices.
Convertible bond closes the year at € 108.95In March 2012, adidas AG successfully issued a convertible bond, due on June 14, 2019, for an aggregate nominal amount of € 500 million. The bonds are not callable by the issuer or putable by the bondholders until June 2017. The bonds are convertible into up to 6.06 million new or existing adidas AG shares. Proceeds from the offering have allowed the Group to further optimise its debt structure. The bonds were priced with a 0.25% annual coupon and a conversion premium of 40% above the reference price of € 59.61, resulting in an initial conversion price of € 83.46 per share. As a consequence of contractual provisions relating to dividend protection, the conversion price was adjusted to € 82.56 per share. This adjustment became effective on May 9, 2014. The convertible bond closed the year at € 108.95, below the prior year value level of € 129.96.
www.adidas-group.com/adr
see Table 03
see Sustainability, p. 89
see Note 18, p. 213

422 0 1 4
/ 01.7 /
Our ShareTo Our Shareholders
adidas Group / 2014 Annual Report
Dividend proposal of € 1.50 per shareGiven their confidence in the strength of the Group’s financial position and long-term aspirations, the adidas AG Executive and Supervisory Boards intend to again recommend paying a dividend of € 1.50 to shareholders at the Annual General Meeting (AGM) on May 7, 2015 (2013: € 1.50). Subject to the meeting’s approval, the dividend will be paid on May 8, 2015. The total payout of € 306 million (2013: € 314 million) reflects a payout ratio of 53.9% of net income attributable to shareholders, excluding goodwill impairment losses, versus 37.4% in the prior year. While this is above our target ratio of between 20% and 40% of net income attributable to shareholders, it reflects our commitment to a reliable dividend policy aimed towards continuity.
Shareholder return programme initiatedOn October 1, 2014, adidas AG announced a multi-year shareholder return programme of up to € 1.5 billion in total to be completed by December 31, 2017. The shareholder return programme will be executed primarily by buying back shares via the stock exchange under the authorisation given by the Annual General Meeting on May 8, 2014, for the period through to May 7, 2019. The authorisation covers the repurchase of up to 10% of the company’s share capital on the stock exchange, currently representing 20,921,618 shares, subject to advantageous market conditions.
On December 15, 2014, adidas AG announced the completion of a first tranche of the share buyback programme. The total number of shares which adidas AG bought back within the framework of the first tranche of the share buyback programme in the period from November 7, 2014 up to and including December 12, 2014 amounted to 4,889,142 shares. This corresponds to 2.34% of the company’s nominal capital. The average purchase price per share was € 61.36. A total price of € 299,999,987 (excluding incidental purchasing costs) was paid to buy back the shares.
Strong international investor baseBased on our share register, we estimate that adidas AG currently has around 95,000 shareholders. In our latest ownership analysis conducted in February 2015, we identified around 93% of our shares outstanding. Institutional investors represent the largest investor group, holding 77% of shares outstanding. Undisclosed holdings, which also include private investors, account for 20%. Current members of the adidas Group Executive and Supervisory Boards hold less than 1% in total. Lastly, following the completion of the first tranche of our share buyback programme, adidas AG currently holds 2% of the company’s shares as treasury shares.
see Table 03
see Diagram 05
05 / Shareholder structure by investor group 1)
1) As of February 2015.
06 / Shareholder structure by region 1)
1) As of February 2015.
1 / 77% Institutional investors2 / 20% Other, undisclosed holdings3 / 2% Treasury shares4 / <1% Members of the adidas
Group Executive and Supervisory Boards
1 / 34% North America2 / 23% Rest of the world3 / 16% United Kingdom4 / 10% Germany5 / 10% Switzerland6 / 7% France
2014 2014
6 5
1
1 2
2
3
3
4
4

432 0 1 4
/ 01.7 /
Our ShareTo Our Shareholders
adidas Group / 2014 Annual Report
In terms of geographical distribution, the North American market currently accounts for 34% of institutional shareholdings, followed by the UK with 16% and Switzerland with 10%. Identified German institutional investors hold 10% of shares outstanding and France accounts for 7%. 23% of institutional shareholders were identified in other regions of the world.
Voting rights notifications publishedAll voting rights notifications received in 2014 and thereafter in accordance with §§ 21 section 1, 25 section 1 and 25a of the German Securities Trading Act (Wertpapierhandelsgesetz – WpHG) can be viewed on our corporate website. Information on reportable shareholdings that currently exceed or fall below a certain threshold can also be found in the Notes section of this Annual Report.
Directors’ dealings reported on corporate websiteThe purchase or sale of adidas AG shares (ISIN DE000A1EWWW0) or related financial instruments, as defined by § 15a WpHG, conducted by members of our Executive or Supervisory Boards, by key executives or by any person in close relationship with these persons, is reported on our website. In 2014, adidas AG received five notifications pursuant to § 15a WpHG: Herbert Kauffmann, member of the adidas AG Supervisory Board, purchased 1,000 shares on August 7, 2014, Herbert Hainer, CEO of adidas AG, purchased 7,000 shares on August 12, 2014, Robin J. Stalker, CFO of adidas AG, purchased 1,750 shares on August 12, 2014 and Willi Schwerdtle, member of the adidas AG Supervisory Board, purchased a total of 1,615 shares in two transactions on November 11, 2014.
adidas AG share again receives strong analyst supportThe adidas Group and the adidas AG share continued to receive strong analyst attention in 2014. Around 35 analysts from investment banks and brokerage firms regularly published research reports on our Group. As a consequence of the overall adidas AG share price development in 2014, the vast majority of analysts updated their recommendations as well as target prices during the twelve-month period. This is reflected in the recommendation split for our share as at December 31, 2014. 24% of analysts recommended investors to ’buy’ our share (2013: 74%). 57% advised to ‘hold’ our share (2013: 19%) and 19% of the analysts recommended to ‘sell’ our share (2013: 7%).
Successful Investor Relations activitiesadidas AG strives to maintain close contact to institutional and private shareholders as well as analysts. In 2014, Management and the Investor Relations team spent 29 days on roadshows and also spent 17 days presenting at 12 national and international conferences.
In July 2014, the adidas Group Annual Report once again won the Best of Corporate Publishing (BCP) Award. This is the second time in three years that the adidas Group Annual Report has received this prestigious award.
Extensive financial information available onlineWe offer extensive information around our share as well as the adidas Group’s strategy and financial results on our corporate website. Our event calendar lists all conferences and roadshows we attend and provides all presentations for download. In addition to live webcasts of all major events such as our Analyst Conferences, the Annual General Meeting and Investor Days, we also offer webcasts of our quarterly conference calls.
see Diagram 06
www.adidas-group.com/voting_rights_notificationssee Note 26, p. 221
www.adidas-Group.com/directors_dealings
www.adidas-group.com/investors


02
O
UR
GRO
UP
Group Str ateg y 4 6Global S ale s Str ateg y 49Global Br ands Str ateg y 5 3O ther Busine s s e s Str ateg y 6 0Global Oper at ions 6 6Re search and Development 7 3Employee s 8 2Sus t a inab i l i t y 8 9
02.1
02.2
02.3
02.4
02.5
02.6
02.7
02.8
OUR
G R O U PG R O U P M A N A G E M E N T R E P O R T
G R O U P M A N A G E M E N T R E P O R T: This report contains the Group Management Report of the adidas Group, comprising adidas AG and its consolidated subsidiaries, and the Management Report of adidas AG.

1
adidas Group / 2014 Annual Report
Group Management Report – Our Group
462 0 1 4
Group Strategy
/ 02.1 /
Group StrategyThe adidas Group strives to inspire and enable people to harness the power of sport in their lives. Inspired by our heritage, we know that a profound understanding of the consumer and their journey in sport is essential to achieving this goal. To anticipate and respond to their needs, we continuously strive to create a culture of innovation and creativity. By harnessing this culture together with our insights and knowledge of sport, we push the boundaries of products, services and processes to drive a long-term strategic advantage. This, in turn, will drive value creation for our company and our shareholders.
Diverse brand portfolioWe are a sports company. Our brands are driven to create and innovate through a common passion for sport and a sporting lifestyle. To maximise our consumer reach, we have embraced a multi-brand strategy. Consumers want choice. Whether it is the athlete looking for the best possible equipment, or the lifestyle consumer searching for the next fashion trend, we are inspired to develop and create products, experiences and services that engage consumers in long-lasting relationships with our brands. This approach allows us to tackle opportunities from several perspectives, as both a mass and a niche player, providing distinct and relevant products to a wide spectrum of consumers. In this way, each brand is able to keep a unique identity and focus on its core competencies, while simultaneously providing our Group with a broad product offering, increasing our leverage in the marketplace.
Investments focused on highest-potential markets and channels As a Group, we target strong market positions in all markets in which we compete. However, we have prioritised our investments based on those markets which offer the best medium- to long-term growth and profitability opportunities. In this respect, we place considerable emphasis on expanding our activities in the emerging markets as well as building our market share in the USA and Western Europe.
No matter in which market we operate, we recognise that consumer buying behaviour and the retail landscape are unique. Therefore, to fully exploit market opportunities, we tailor our distribution strategy to present our brands to the consumer in the most impactful and seamless way. This is achieved by following a coordinated distribution through our omni-channel approach.
see Global Brands Strategy, p. 53
see Global Sales Strategy, p. 49
01 / adidas Group strategic pillars
Brand Portfolio
Build and manage a diverse brand portfolio with distinctive brands covering consumers from sport performance to sport lifestyle.
Innovation
Maintain a culture of continuous innovation through improvements of products, services and processes.
Markets/Channels
Focus investment on the highest-potential markets and our distinct channel approach.
One Team
Develop a team that is grounded in our rich heritage, that is committed to the positive values found in sport – performance, passion, integrity and diversity – and that values sustainability.
Supply Chain
Become closest to every consumer by building and managing a supply chain that quickly responds to changing market needs and supports multiple distinct business models.
Sustainable Company
We strive to be a sustainable company that recognises its responsibilities towards the environment, our employees and the people who make our products.

adidas Group / 2014 Annual Report
Group Management Report – Our Group
472 0 1 4
Group Strategy
/ 02.1 /
Creating a flexible supply chainSpeed and agility are key to outpacing the competition, providing a constant flow of new and relevant products for our consumers and high service levels for our customers. We are committed to meeting the full range of consumer needs by providing game-changing technical innovations for sport, creating and driving trends in streetwear through our sports-inspired lifestyle products, while ensuring constant product availability in the correct size and colour to the highest quality standards.
A key strategic priority is to enable faster product creation and production by continuously improving our infrastructure, processes and systems. By sharing information from point of sale to source and vice versa, we strive to connect and more closely integrate the various elements of our supply chain, to enable quick reaction to changing consumer trends. To this end, we focus on building maximum flexibility within our supply chain. While leveraging the efficiency of common infrastructure and processes, the Group strives to provide tailored solutions for all our business models, be it the wholesale or retail channels, or the performance-oriented or style-oriented businesses.
Leading through innovationEvery adidas Group employee is responsible for driving innovation. Therefore, we foster a culture of challenging convention and embracing change, and we require all areas of the Group to generate at least one new innovation or meaningful improvement per year. In particular, we believe that technological evolution and cutting-edge design in our products are essential to achieving sustainable leadership in our industry. Beyond this, enhancing services for our customers and implementing more efficient and effective internal processes are other areas where our organisation strives to innovate.
Develop a team grounded in our heritage in sportOur culture is continuously shaped by influences from the past and the present as well as our future aspirations. We perpetuate the commitment of our founder, Adi Dassler, to the athlete and consumer, pride in what we do, quality and love of sport. We win as a team through open communication, collaboration and our shared values found in sport. Therefore, we foster a corporate culture of performance, passion, integrity and diversity by creating a work environment that stimulates innovation, team spirit and achievement based on strong leadership and employee engagement.
see Global Operations, p. 66
see Research and Development, p. 73see Global Sales Strategy, p. 49
see Employees, p. 82
Shared values
/ Performance/ Passion/ Integrity/ Diversity
These are the adidas Group values. They help us to create brands that our consumers believe in, and they commit us to playing by the rules that society expects of a responsible company.

adidas Group / 2014 Annual Report
Group Management Report – Our Group
482 0 1 4
Group Strategy
/ 02.1 /
Focusing on sustainabilityLike any global business, the adidas Group must manage wide-ranging commercial and competitive pressure to deliver increased financial returns and growth. At the same time, we are accountable for our employees and have a high degree of responsibility towards the workers in our suppliers’ factories and also for the environment. We are committed to striking the balance between shareholder interests and the needs and concerns of employees and workers, as well as the environment. We report publicly on the steps we take to have a more positive impact on society and the planet on our website.
Creating long-term shareholder value Creating long-term value for our shareholders through strong and consistent operating cash flow generation drives our overall decision-making process. Therefore, we are focused on rigorously managing those factors under our control, making strategic choices that will drive sustainable revenue and earnings growth, and ultimately operating cash flow. Across our operations, we pursue in particular the avenues for growth which we expect to be most value-enhancing, with particular emphasis on improving brand strength and Group profitability. In addition, rigorously managing working capital and optimising our capital structure remain key priorities for us. Furthermore, we are committed to increasing returns to shareholders with above-industry-average share price performance and dividends.
adidas Group new strategic goals to be announced in 2015In November 2010, the Group unveiled its 2015 strategic business plan named ‘Route 2015’, which defined strategies and objectives for the period up to 2015. Since its introduction, the plan has resulted in significant improvements in many of our business areas. We have, for example, already over-achieved our target of increasing the share of revenues from controlled space activities to more than 45% by 2015. In addition, we have multiplied our eCommerce business over the last couple of years and are well on track to achieving the targeted sales level of € 500 million through this channel by 2015. We have also successfully expanded our fast fashion adidas NEO label, increasing revenues for this sub-brand to over € 800 million in 2014 and building valuable expertise in a vertical business model. Additionally, we have significantly reduced complexity on a Group level by streamlining the global product range, consolidating our warehouse base as well as harmonising above-market service. Furthermore, our Global Operations function has been very successful in establishing in-season product creation capabilities and in significantly reducing lead times for both footwear and apparel. These achievements have set new standards with regard to productivity, efficiency and flexibility within our supply chain.
In 2014, however, mainly due to the continued weakness in the golf market, negative economic developments in Russia/CIS as well as ongoing currency headwinds, the Group postponed the delivery of its top- and bottom-line Route 2015 targets. As a result, the Group has been undergoing a thorough review of its strategic priorities and organisational set-up throughout 2014 and early 2015. In a first step, to strengthen brand leadership as well as drive faster decision-making and more effective and efficient consumer-focused strategies and execution in the marketplace, Management initiated a reorganisation of the Global Brands and Global Sales structures. The Group will release the full details on its updated strategies at the end of March 2015.
see Sustainability, p. 89www.adidas-group.com
see Internal Group Management System, p. 98
see Our Share, p. 38
see Glossary, p. 258

2
adidas Group / 2014 Annual Report
Group Management Report – Our Group
492 0 1 4
Global Sales Strategy
/ 02.2 /
Global Sales Strategy Global Sales drives the commercial performance of the adidas Group by building brand desire and by consistently meeting consumer needs across all touch points. Global Sales is responsible for all commercial activities of the adidas and Reebok brands. In 2014, we reviewed our sales strategy to enable and propel a heightened consumer-centric omni-channel mindset. As the consumer environment becomes even more dynamic with trends quickly changing, we are also increasing our focus on anticipating these changes and responding with speed.
Market set-up consolidated All of our markets across the globe are managed by the Global Sales function and supported by a centralised Sales Strategy & Excellence team which was created in 2014. Our market organisations are responsible for driving sustainable and profitable market share growth while increasing brand desirability. They are in charge of all our distribution channels – Wholesale including Franchise, Own Retail and eCommerce – within their geography. We tailor the way we serve our consumers according to the local needs. Our channel mix therefore varies across markets.
In order to reduce organisational complexity and increase consistency in execution, in 2014, we further consolidated our market structure by creating nine global markets. In the course of 2014, we for example successfully integrated all Western European markets. As a result, we have a fully consistent approach to our European key account partners as well as to our direct-to-consumer channels which are now operated by a single organisation.
We see significant growth opportunities for our brands across the globe. Western Europe, North America, Greater China and Russia/CIS are our key markets. We have initiated a major revamp of our business in North America. We are directing substantial resources into this key geography with the objective to increase desire for our brands and products, strengthen their relevance amongst US consumers and improve execution at the point of sale, thus achieving significant market share gains. In Greater China, we are further optimising the way we serve local consumers with the goal to become market leader. Given the economic and political uncertainty in Russia/CIS, we continue to closely monitor the developments in this region. We have adjusted our investment plans to account for current market risks. While we firmly believe in the long-term potential of the market, the
01 / adidas Performance execution in Karstadt Sports Hamburg, Germany

adidas Group / 2014 Annual Report
Group Management Report – Our Group
502 0 1 4
Global Sales Strategy
/ 02.2 /
short-term fundamentals of the business have changed materially due to the rapid depreciation of the Russian rouble in 2014 and the considerable risk of further deterioration in consumer spending. Therefore, we have and will continue to accelerate our real estate and inventory management initiatives.
We also address opportunities in growth markets including Latin America and other emerging markets. Similarly to Western Europe, we have consolidated the organisation in Latin America. We will drive the Own Retail and eCommerce expansion to enable our ambitious growth plans in this region. In other emerging markets such as the Middle East and North Africa, Turkey or India, we will further exploit the potential of new and fast-growing markets across these regions with excellence in execution.
Adapting to changing consumer behaviourOver the past years, we identified fundamental changes in consumer behaviour. Our findings led us to review our organisational set-up and to refine internal processes to better adapt to the ever-changing consumer environment.
The newly created Sales Strategy & Excellence team embraces an omni-channel approach and mindset as it combines all our sales channels – our Wholesale including Franchise, Own Retail and eCommerce business – under one roof. In the past, we had dedicated Centres of Excellence for each of these channels. The newly formed team develops the omni-channel sales strategy and brings operational excellence to market organisations. The team is also focused on exploiting sales innovation to better serve our consumers. Resources have therefore been dedicated to digital innovation and the creation of new business models.
We are confident that our new set-up will elevate our brand activation across the globe. It is our ambition to deliver the best branded shopping experiences at all consumer touch points, exceeding both customer and consumer expectations and accelerating our growth.
see Glossary, p. 258
02 / adidas Performance Store Nuremberg, Germany

adidas Group / 2014 Annual Report
Group Management Report – Our Group
512 0 1 4
/ 02.2 /
Global Sales Strategy /
Global Sales initiatives to focus on omni-channel approachWe have defined long-term priorities and established initiatives that will drive growth, our omni-channel approach and consumer experience:
/ DistributionGlobal Sales defines the vision and role for each channel from a holistic perspective to ensure success at the point of sale.
Wholesale and Franchise: To achieve profitable market share growth we strive to establish long-term partnerships with the most dynamic retailers, which include sporting goods chains, department stores, buying groups, lifestyle retail chains, e-tailers and franchisees. We will focus our joint efforts on early trend identification, joint campaign planning, shared inventories and seamless consumer journeys. A key emphasis will be on the execution at the point of sale with managed space playing a crucial part in this.
Direct-to-consumer (Own Retail and eCommerce): We are expecting strong growth from our direct-to-consumer channel in the upcoming years. Our Own Retail business is developing strongly thanks to ongoing traffic increases, more impactful brand activations and better conversion rates, driving solid comparable store growth across our store portfolio. We will be implementing a new, differentiated and consistent customer service model in all stores to further improve the retail metrics. Concept stores will continue to play an essential role in building and sustaining brand desirability. In 2014, we introduced our new HomeCourt and Neighbourhood retail concepts at 29 locations around the world. We will carry on rolling out these as well as other new formats (e.g. women’s) going forward.
Our eCommerce business has experienced exceptional growth. We believe that this growth will continue to accelerate due to changing consumer needs and behaviour. We will boost this growth by further enhancements of consumer experience across our sites on the various digital platforms including mobile. Our omni-channel approach will also make eCommerce even more complementary to the other channels.
see Glossary, p. 258
see Picture 02see Picture 03
03 / adidas Originals Store New York City

adidas Group / 2014 Annual Report
Group Management Report – Our Group
522 0 1 4
/ 02.2 /
Global Sales Strategy /
Focus on key cities: Global metropolises such as London, Paris, New York, Los Angeles, Shanghai or Tokyo play a key role in setting consumer trends. We have therefore developed a detailed omni-channel action plan for key cities across the globe. It sets a global framework for how to amplify brand desire in key cities. This enables us to address our target consumer communities in a more impactful way and supports us in targeting and better aligning our distribution within these cities.
/ Omni-channelSeamless transitions amongst all channels are crucial for enhancement of the consumer shopping experience. We invest heavily into infrastructure and processes that will enable us to implement omni-channel capabilities. For example, we piloted a ‘click and collect’ roll-out (consumers ordering online and picking up products in-store) at a number of stores in 2014. Furthermore, we are actively driving the integration of different consumer databases into a global CRM/loyalty programme. We are also dedicated to driving omni-channel consistency across all consumer touch points. This includes consistent messaging execution throughout the various physical points of sale as well as digital platforms.
/ SpeedSpeed has always been a topic in our Route 2015 efforts and will remain a crucial topic for our next Strategic Business Plan. We will transform our sales processes significantly and we will increase the share of product created closer to market. Innovative speed models in our supply chain will allow us to respond quickly to consumer needs. We will be able to take immediate action in response to changes to sell-out and fashion trends, even within the given season. This will create significant top-line and margin potential.
/ InnovationWith all the technological advances driving consumer behavioural changes in our industry, the need for exciting innovations in presenting and selling our products becomes increasingly important. We will fuel growth through greater utilisation of technology, creation of new business models and analysis of ‘big data’ to generate actionable insights. Digital innovation in sales is one of the biggest building blocks to win the consumer and we will be working with external and non-traditional partners to execute some of these innovations.
/ PeoplePeople are our most important asset and we aspire to have the best team in our industry. We invest in the development of our employees as we want them to become omni-channel experts who understand both sales and brand management. We will develop a new training programme in 2015 combining our comprehensive Wholesale and Retail programmes and adding omni-channel content. Job rotations and long-term switches between channels, functions and geographies is something we strongly encourage our sales talents to participate in. We have also implemented a leadership and management system to ensure consistent people management and development across all our locations around the globe.
Reebok Online Store www.reebok.com
adidas Online Store www.adidas.com

3
adidas Group / 2014 Annual Report
Group Management Report – Our Group
532 0 1 4
Global Brands Strategy
/ 02.3 /
Global Brands StrategyGlobal Brands is responsible for brand positioning, brand strategy, product creation, innovation and all the product and brand marketing functions of the adidas and Reebok brands. The primary objective of this portfolio strategy is to ensure that our brands seize market share and category opportunities through well-defined and coordinated go-to-market strategies. Each brand is responsible for the execution of its strategic focus by creating a constant stream of innovative and desirable products and generating communication strategies that connect with their target consumer in an engaging and compelling way.
Driving the long-term development of adidas and ReebokTo secure long-term sustainable growth for the adidas Group, Global Brands is focused on driving the development of the adidas and Reebok brands. The overall strategic goal is to build brands that inspire and enable consumers to harness the power of sport in their lives.
Areas within adidas and Reebok that were identified as key contributors and game changers for the adidas Group include: / Gaining sales and market share in the key global categories football, running and basketball with
adidas Sport Performance./ Expanding adidas Sport Style in fast fashion with the adidas NEO label./ Maintaining adidas Originals’ strong momentum with the fashion-driven lifestyle consumer./ Establishing Reebok as the leading fitness brand.
Global Brands also plays a key role in bringing efficiency initiatives to life, by focusing on speed, consistency and consumer focus. Among other things, we are striving to present adidas and Reebok in a more consistent way around the world in terms of ranges and pricing. In the long term, this should lead to range size efficiencies, higher levels of full-price sales and gross margin optimisation.
Focus on the consumerThe consumer and creating consumer desire for our products is at the heart of everything Global Brands does. By constantly developing desirable products and inspiring brand experiences, we can drive sustainable and quality growth, building a strong reputation and loyalty with consumers. Moreover, we also understand that, in order to have credible and authentic connections to create such desirability with our consumers, we must have the right market segmentation strategy. As part of its function, Global Brands has mapped out our target consumer universe, which spans from our roots in sport, the ‘pure performer’, through to today’s style setters who have embraced sporting goods brands as part of their lifestyle.
To be successful across consumer segments, we acknowledge that a strategy of mass production or mass marketing is no longer sufficient. Only by identifying and understanding consumers’ individual motivations and goals for doing sport, their lifestyle, their fitness level, where they are doing sport and their buying habits can we create meaningful products, services and experiences that build a lasting impression and brand loyalty.

adidas Group / 2014 Annual Report
Group Management Report – Our Group
542 0 1 4
Global Brands Strategy
/ 02.3 /
Brand architecture and differentiationWe believe that our Group’s multi-brand portfolio gives us an important competitive advantage. Through our brand portfolio, we seamlessly cover the sports and consumer segments we have defined as strategically important to support our Group’s ambition to inspire and engage people to harness the power of sport in their lives. Our portfolio of brands provides a depth of experience and knowledge in the world’s most popular individual and team sports as well as fitness activities.
Each brand and sub-brand is responsible for bringing its own distinct identity and positioning to life, through the creation of products, services and experiences that provide platforms and frameworks for long-term market share and profitability improvements. While adidas and Reebok each have unique identities, heritages, technologies, designs and reputations, the strategic principles and methods for driving future sales growth and profitability improvements are common to both. These include:/ Leadership in product innovation to inspire and excite the consumer. / Marketing and communication leadership to drive brand advocacy. / Activation and validation via a relevant set of promotion partnerships./ Extending brand reach and appeal through strategic partnerships.
adidas strategic positioningNo other brand has a more distinguished history and stronger connection with sport than adidas. As a true global brand with German roots, adidas’ mission is to be the best sports brand in the world. One major lever to achieve this is the brand’s broad and unique sports product portfolio, with expertise spanning from footwear, apparel and equipment for professional athletes to premium fashion. It allows adidas to address multiple consumer needs, exploit market opportunities from various angles as well as be less affected by one-dimensional market risks. adidas’ commitment to product innovation with clearly defined benefits and its rich heritage differentiates the brand from competitors and provides a solid platform for future growth.
01 / adidas Sport Performance #therewillbehaters football campaign
02 / adidas Sport Performance Ultra Boost running shoe

adidas Group / 2014 Annual Report
Group Management Report – Our Group
552 0 1 4
Global Brands Strategy
/ 02.3 /
adidas is mainly targeting competitive sports based on innovation and technology with adidas Sport Performance. This sub-brand is the multi-sport specialist. The target consumers range from sports participants at the highest level to those inspired by sport or who simply love sport. Everything at adidas reflects the spirit of Adi Dassler, the founder of the company. The main objective is simple: to make athletes better, with innovation at the heart of all adidas Sport Performance products. Football, running and basketball are our key strategic categories. However, to underline our credibility as the multi-sport specialist and leverage our brand strength, adidas also supports a wide range of other sports and sports activities such as training, outdoor, American football, rugby, tennis, baseball, handball, volleyball, badminton, table tennis, swimming, cycling, boxing and wrestling.
The adidas Originals sub-brand strives to take the brand’s unique heritage and design leadership to capture further potential in the sports lifestyle and fashion market. Streetwear and lifestyle sports fashion represents a unique opportunity for sporting goods companies. To be successful in this market segment, brand credibility and heritage is an important prerequisite. These consumers are looking for substance and craft and are inspired by stories and designs, which we serve through the iconic Trefoil logo and with products such as the Stan Smith, Superstar, ZX and Samba. To ensure sustainable success, adidas Originals has to keep up to date with and set trends as well as remain committed to serving consumer groups who are constantly looking for more options to express their individuality.
As part of our market segmentation strategy and to increase our appeal to a younger, more price-conscious generation of lifestyle consumers, the adidas NEO label was established to cater specifically to their needs. adidas NEO targets the young fashionable teen, aged between 14 and 19 years. These teens are ‘digital natives’ and live for now. They are ready to go, discovering their own way and style, and the NEO label is all about them. It is all about being open and engaged with this teenage consumer, enabling them to participate with the label and enjoy experiences that only NEO can provide, such as styling an outfit for Selena Gomez or being part of the NEO collection created especially for the New York Fashion Week. To ensure success, the NEO formula employs a ‘fast fashion’ business model. This means quick reaction to emerging trends through shorter lead times and excellence in retail execution.
see Picture 01see Picture 02
see Picture 03
see Picture 04
03 / adidas Originals 2015 Superstar campaign
04 / adidas NEO Fall/winter 2014/15 campaign
LIVE YOUR STYLE ADIDAS.COM/NEO
P I C T U R E Y O U R S E L F I N
© 2
014
adid
as A
G. a
dida
s, th
e Gl
obe
logo
and
the
3-St
ripes
mar
k ar
e re
gist
ered
trad
emar
ks o
f the
adi
das
Grou
p.

adidas Group / 2014 Annual Report
Group Management Report – Our Group
562 0 1 4
Global Brands Strategy
/ 02.3 /
Reebok strategic positioningReebok is an American-inspired global brand with a deep fitness heritage and the mission to design and create the best gear and experiences for the sport of fitness and for fitness athletes around the globe. Reebok strives to inspire people everywhere to be their absolute best – physically, mentally and socially. The ‘Fit Generation’ is Reebok’s inspiration and muse. These consumers live a fitness lifestyle and for them fitness is not just something they do, it is who they are. They are young, uninhibited, optimistic, brave and tribal, and they know that their bodies are the engine for a fulfilled life. Reebok connects with the Fit Generation through its ‘tough fitness’ mentality. Tough fitness is bigger than any diet or workout regimen, it is the gritty, ‘never back down’ attitude embodied by the Fit Generation consumer.
Adding to its core mission, Reebok Classics leverages the brand’s fitness heritage and celebrates how the brand’s past shapes who it is and what it will become. Reebok Classics represents the roots of the brand in the sports lifestyle market. Understanding the multi-facets of fitness, from running to yoga, Reebok applies a category-specific approach. The key categories, called ‘The House of Fitness’, address this diversity: Training, Studio, Reebok’s newest business Combat Training, Classics, Running and Walking.
Reebok provides specialised products for each of these categories, which allows Reebok to meet and engage with consumers, regardless of how they choose to stay fit. To drive commercial volumes for the brand, Reebok leverages its Royal and Kids offerings across its key categories. Royal offers trend-right casual footwear with optimal value for commercial distribution channels. Reebok Kids is focused on fun in functionality, driven by key brand product innovation takedowns as well as innovative and style-right kids-only products.
Leadership in product innovation to excite and inspire the consumerBy creating inspiring product and brand experiences, adidas and Reebok strive to enhance their positions as premium brands. This, in turn, is an important catalyst for sustaining and improving the brands’ gross margins, making continuous innovation an important enabler for future profitability improvements. By leveraging the extensive R&D expertise within the Group, adidas and Reebok continuously challenge the boundaries of functionality and performance. In addition, innovation plays a significant role in differentiating the adidas and Reebok product offerings in the minds of consumers.

adidas Group / 2014 Annual Report
Group Management Report – Our Group
572 0 1 4
Global Brands Strategy
/ 02.3 /
At adidas, the brand innovates through a focus on key performance benefits. The R&D focus is on cushioning and energy solutions, lightweight, body temperature management and digital sports technologies as well as sustainable product innovation. This focus enables the development of clear performance technology platforms, such as Boost, Clima and miCoach. By serving these core benefits through such scalable technology platforms, adidas aims to remain at the forefront of performance sport and further build on brand image. Additionally, at adidas, investments and research emphasis also include areas such as 3-D design, advanced materials and new manufacturing processes, e.g. machine knitting and 3-D printing. These areas offer potential to increase speed to market, bring new performance and design capabilities and support our position as a sustainability leader in the sporting goods industry.
At Reebok, the innovation focus is on fitness. The innovation and R&D priorities are on providing functional products in footwear and apparel that cater to evolving and new fitness activities. Areas of focus include specific products to meet the performance demands of Fit Generation consumers. Reebok is also investing in material development to support body temperature control, fit and durability.
see Picture 05
see Picture 06see Research and Development, p. 73
06 / Reebok Cardio Ultra studio shoe
05 / adidas Sport Performance miCoach Fit Smart watch

adidas Group / 2014 Annual Report
Group Management Report – Our Group
582 0 1 4
Global Brands Strategy
/ 02.3 /
Marketing and communication leadershipadidas and Reebok are focused on creating inspirational and innovative marketing capabilities that build brand equity and consumer advocacy. A key tenet of our marketing and communication strategy is to harness the emotion of sport and the benefits of a sporting lifestyle across all communication channels. Both adidas and Reebok regularly bring new global marketing concepts to life, which can be easily leveraged to create simple and powerful brand messages and support an array of product offerings.
In addition, Global Brands also endeavours to ensure all of its brands are at the forefront of new communication techniques, particularly as information flow becomes faster and faster. To increase the pace and relevance of our brands’ communication with the consumer, digital marketing now acts as a backbone for all brand marketing activities. Whether through social networks, mobile apps or digital broadcast mediums, these methods are providing a new scope of consumer experience in real time. With consumers spending more time online, the adidas and Reebok digital strategies allow the brands to move from campaign-based communication to developing deeper relationships with their respective target audience. In addition to adding significant value to all our communication efforts, our digital marketing and social interaction with consumers also provide the brands with accessible insights, learnings and measurable results, which in turn can be utilised to drive long-term brand equity.
To ensure our Group stays at the forefront of these developments, in 2014 both adidas and Reebok invested further in the digital space. To increase speed, bring greater consistency and drive higher levels of brand activation online, adidas established digital newsrooms around the globe. This served to better coordinate the brands’ online presence as well as leverage and magnify key brand initiatives throughout the year. For example, for the duration of the 2014 FIFA World Cup, adidas set up a newsroom in Rio de Janeiro called ‘Posto adidas’. Throughout the tournament, adidas created and shared content via its social media channels in real time, in highly debated moments during games or by giving fans exclusive insights into adidas’ player and federation partners. Reebok also created a global social centre at its headquarters in Canton. This centre and its team engaged with the Fit Generation consumer in the social world and will continue to enable Reebok to be part of the conversation in 2015. In addition, Reebok also opened the Reebok Production Studios, enabling the brand to become a constant creator of exciting and relevant content.
see Picture 07see Picture 08
07 / adidas Sport 15 brand campaign
08 / Reebok Be More Human brand campaign

adidas Group / 2014 Annual Report
Group Management Report – Our Group
592 0 1 4
Global Brands Strategy
/ 02.3 /
Activation and validation via a relevant set of promotion partnershipsThe utilisation of promotion partners such as federations, teams, leagues, events and individuals is an important part of validating and endorsing brand positioning, and an area to which the Group dedicates significant resources. This not only serves as a vehicle to showcase the credentials of adidas and Reebok products in the performance and fitness arenas, respectively, it also facilitates the extension of the adidas and Reebok brands in the sports-inspired lifestyle market. Both adidas and Reebok follow a partnership strategy geared to best reflect their respective positioning in the market.
One of the guiding principles of adidas is to equip all athletes to achieve their ‘impossible’. As such, adidas brings its passion for great products to the biggest stages in the world, with sponsorship agreements for the FIFA World Cup, the UEFA EURO, the UEFA Champions League, the NBA, the Boston Marathon and the IAAF (International Association of Athletics Federations). In addition, adidas has an extensive roster of high-profile sports teams, such as the national federations of Germany, Spain, Argentina, Russia, Mexico, Colombia and Japan, as well as top clubs Real Madrid, AC Milan, Chelsea FC, FC Bayern Munich and – starting in the summer of 2015 – Manchester United in football, the New Zealand All Blacks and France in rugby, American universities such as UCLA, as well as high-profile individuals such as football stars Lionel Messi, Gareth Bale and James Rodriguez, basketball stars Derrick Rose, John Wall and Damian Lillard, marathon record holder Dennis Kimetto, American football quarterback Robert Griffin III, also known as ‘RG3’, and tennis star Caroline Wozniacki. In addition, adidas also has a number of strategic partnerships and collaborations with top designers and design studios, such as with Yohji Yamamoto, Stella McCartney, Jeremy Scott, Nigo and Porsche Design. The brand also has similar relationships with many of the most creative personalities from across the entertainment industry, including Kanye West, Pharrell Williams and Rita Ora.
To activate and validate its key concepts, Reebok is partnering with some of the most influential fitness movements and organisations and accomplished people in the fitness industry. Reebok partnerships include those with the UFC, CrossFit (including the CrossFit Games), Spartan Race, Les Mills and Color Run. Additionally, Reebok’s partners include top influencers in the ‘tough fitness’ market such as UFC Champions Jon Jones, Ronda Rousey and Conor McGregor as well as CrossFit all-stars Rich Froning and Camille Leblanc-Bazinet. Reebok Classics partners with musicians, fashion leaders and artists to amplify activations and product validation in the lifestyle category, with ambassadors such as Kendrick Lamar and Melody Ehsani.
see Picture 09
see Picture 10
10 / Reebok CrossFit Games
09 / adidas FIFA World Cup

4
adidas Group / 2014 Annual Report
Group Management Report – Our Group
602 0 1 4
/ 02.4 /
Other Businesses Strategy / TaylorMade-adidas Golf Strategy
Other Businesses StrategyOther Businesses primarily include the TaylorMade-adidas Golf and Reebok-CCM Hockey segments. Each of these segments has its own strategy in place in order to address its specific target groups directly and further expand its market share.
TaylorMade-adidas Golf Strategy
TaylorMade-adidas Golf’s mission is to be the world’s leading golf company in terms of sales and profitability. The company’s foundation for success and its priorities for long-term growth include:/ A multi-brand strategy with four of golf’s most respected brands: TaylorMade, adidas Golf,
Adams Golf and Ashworth. / Focus on design and technologically advanced products./ Validation of products by tour professionals competing on the world’s major professional golf
tours. / A clear focus on marketing innovation and excellence in execution./ Creation and execution of new retail initiatives as well as improving global distribution.
Multi-brand approach levers the strength of four of golf’s most respected brandsTaylorMade-adidas Golf implements a multi-brand strategy with four well-defined golf brands under one roof:/ TaylorMade is the market leader in the metalwood and iron categories, and is among the leaders in wedges, putters, balls and accessories. / adidas Golf creates innovative products targeted at athletic, competitive-minded golfers seeking a performance edge in every piece of equipment they choose, including footwear, apparel and accessories. / Adams Golf adapts tour-proven technology to meet the needs of golfers seeking equipment that makes the game easier to play so every round is a great experience./ Ashworth focuses on classically rooted products that deliver style, comfort and natural performance to the golf enthusiast, complementing adidas Golf’s athletic high-performance positioning.
Focus on design and technologically advanced productsOne of TaylorMade-adidas Golf’s core objectives is to create the best performance golf products in the marketplace. This involves a clear and unrelenting commitment to innovation and technology. TaylorMade-adidas Golf strives to extend its industry-leading position by introducing the most innovative designs and technologically advanced products to the market. In 2014, for example, the SLDR irons and drivers were the leading products in the iron and metalwood categories, with the latter being the number one driver on the tour for the 2013-2014 PGA Tour season. In 2014, the focus, however, was on cleaning up retail inventories, especially in the USA. In light of this, TaylorMade-adidas Golf strategically reduced the number of new product introductions compared to previous years.
Strategic priority / Design and innovation
see Picture 01
see Info Box, p. 63
Strategic priority / Multi-brand approach

adidas Group / 2014 Annual Report
Group Management Report – Our Group
612 0 1 4
/ 02.4 /
Other Businesses Strategy / TaylorMade-adidas Golf Strategy
/ TaylorMade: TaylorMade’s priority is to become the leader in each individual golf category. That means strengthening its position as the number one metalwood (drivers, fairway woods and hybrids) and iron brand and ascending to the top market position in wedges, putters, balls and accessories. From a market share perspective, the latter two categories in particular offer significant market share and growth potential. In balls for example, in 2014, TaylorMade launched a new golf ball: Project (a). This multi-year R&D project has resulted in a ball which has been specially engineered to promote more shot-stopping spin control for the average amateur.
/ adidas Golf: A key component of adidas Golf’s strategy is creating innovative products that are targeted to an athletic, competitive-minded golfer who is seeking a performance edge in every piece of footwear and apparel. In 2014, the adizero franchise was continued with the second iteration with adizero One. This shoe incorporates a variety of cutting-edge technologies and is 10% lighter than the original adizero golf shoe. adidas Golf’s strategy also includes strengthening its year-round apparel offerings by adding to the Clima collection with ClimaChill apparel, engineered to regulate body temperatures with proprietary ClimaChill technology featuring small aluminium cooling dots.
/ Adams Golf: Adams Golf’s key strategy for growth is to adapt tour-proven technology to meet the needs of golfers seeking equipment that makes the game easier to play and thus a better experience. Additionally, Adams Golf uses its position as the number one hybrid brand on five of the world’s major professional golf tours, including the PGA Tour, to become the best-selling hybrid brand worldwide. Recent product introductions, including New Idea Tech Hybrid irons that are designed specifically for golfers with slower swing speeds, are examples of the brand’s product strategy to enhance the enjoyment of the game.
/ Ashworth: Ashworth focuses on re-establishing the brand’s reputation as an authentic golf brand dedicated to bringing modern style to the golf course. Specific emphasis is put on bringing more consistency to Ashworth’s messaging and product. A good example of this is the Ashworth
see Picture 02
see Picture 03
01 / TaylorMade SLDR irons
02 / adidas Golf ClimaChill golf apparel

adidas Group / 2014 Annual Report
Group Management Report – Our Group
622 0 1 4
/ 02.4 /
Other Businesses Strategy / TaylorMade-adidas Golf Strategy
Majors Series Apparel Collection which was the brand’s marketing focus in 2014, featuring a series of limited-edition golf shirts designed to commemorate the major victories of six of the company’s Tour Staff professionals. This premium collection was a building block for more superior pieces with higher price points to debut from the brand in 2015.
Tour validation critical to showcasing equipment at the highest levelGolfers of all levels are influenced by the equipment that the world’s best professional players play with and wear. Hence, TaylorMade-adidas Golf’s leadership and presence on the world’s major professional golf tours is imperative to increasing brand exposure and consumer traction. The strength of the TaylorMade-adidas Golf Tour Staff lies in the number and quality of its members, which include global stars such as 2014 U.S. Open champion Martin Kaymer, 2013 U.S. Open champion Justin Rose, Dustin Johnson, Sergio García, Jason Day and 2010 U.S. Open champion Paula Creamer. In addition, dozens more tour professionals also play TaylorMade metalwoods, helping to make TaylorMade the number one driver brand on the world’s six major tours – the PGA Tour, European Tour, Japan Tour, Champions Tour, Web.com Tour and LPGA Tour. The visibility and credibility that TaylorMade enjoys from this widespread use of its equipment is instrumental to brand and product awareness.
Adams Golf likewise maintains a strong Tour Staff, having in 2014 added fan favourite Ernie Els to a team that already includes Robert Garrigus, Aaron Baddeley, Tom Watson and Bernhard Langer.
Marketing innovation and excellence in executionInnovative and effective marketing is critical to TaylorMade-adidas Golf’s success. Great effort is put into creating compelling messages spread widely through a variety of channels. This includes television, print, social media, point of sale, demonstration events and carefully choreographed activities at professional tournaments.
see Picture 04
Strategic priority / Tour validation
Strategic priority / Marketing innovation
03 / Adams Golf New Idea Tech Hybrid iron
04 / Ashworth Majors Series apparel collection

adidas Group / 2014 Annual Report
Group Management Report – Our Group
632 0 1 4
/ 02.4 /
Other Businesses Strategy / TaylorMade-adidas Golf Strategy
Effective retail strategy leverages key accounts and assetsTaylorMade-adidas Golf makes it a point to create compelling point-of-sale communications and displays designed to clearly educate the consumer on product benefits and advantages. Furthermore, there is a focus with key retail partners (key accounts) to ensure a consistent and excellent retail experience for the consumer. Core channels include green grass retailers, off-course golf specialty retailers and sporting goods retail formats with golf-specific departments. TaylorMade-adidas Golf also maintains a close relationship with more than 3,000 golf professionals across the USA, who act as brand ambassadors in their green grass golf shops, selling the products of all four brands and turning golfers into brand loyalists. Additionally, in emerging markets around the world, the company employs established adidas Group infrastructures to distribute products and drive growth. This broad global presence offers significant growth and leverage opportunities in the future, particularly for Adams Golf and Ashworth, where penetration is still low outside of the United States.
Strategic priority / Excellence in retail
TaylorMade-adidas Golf actively tackles the challenges in the golf market
Management is convinced that TaylorMade-adidas Golf’s strategic approach as outlined above will support the company in extending its industry-leading position. The golf industry was weathering an extremely difficult year in 2014 and, as the biggest golf company in the world, TaylorMade-adidas Golf was severely impacted. We have therefore taken strategic steps to stabilise the underper-forming areas of our golf business. These include:
/ Strong focus on inventory management in 2014. Management decided to take a leading and responsible role for the industry clean-up of high retail inventory levels.
/ Realignment of key shipment and product launch cycles to more appropriately mirror market demand patterns. In light of Management’s efforts to shift to longer product launch cycles, TaylorMade-adidas Golf strategically reduced the number of new product introductions compared to previous years.
/ Implementation of a restructuring programme to align the organisation’s overheads to match future expectations in golf. This includes reducing our golf segment global workforce by 15% and integrating Adams Golf into TaylorMade’s offices in Carlsbad, California, to optimise efficiency and ensure product alignment.
/ Increased focus on direct-to-consumer business going forward.
see Other Businesses Performance, p. 143
see Glossary, p. 258

adidas Group / 2014 Annual Report
Group Management Report – Our Group
642 0 1 4
/ 02.4 /
Other Businesses Strategy / Reebok-CCM Hockey Strategy
Reebok-CCM Hockey Strategy
Reebok-CCM Hockey is a leading designer and marketer of ice hockey equipment and related apparel under two of the most recognised ice hockey brand names: Reebok Hockey and CCM. Reebok-CCM Hockey equips more professional NHL hockey players than any other company and is also the official outfitter of high-profile leagues such as the NHL. Reebok-CCM Hockey’s strategy is to increase market share by leveraging its performance positioning and dedication to innovate for the leading athletes in the sport.
Focus on high-end performanceReebok-CCM Hockey’s primary goal is to lead in the high-end performance segment of the ice hockey market. Reebok-CCM Hockey has therefore repositioned Reebok Hockey to focus on key categories where the brand has had success in the past while CCM is positioned across all segments and price tiers with a clear focus on performance. Strategic priorities for both brands include: / Focus on innovative and technologically advanced products. / Professional player validation. / Focus on key categories to drive growth. / Defined pricing strategy which reflects the brands’ positioning.
Product innovation key to brand positioningThe key priority for Reebok-CCM Hockey is to design and market innovative and technologically advanced products that give players the opportunity to perform at their highest levels on the ice. With an emphasis on continued product innovation, products incorporate proprietary and patented technological advances. The 2014 product launches are described in more detail below.
Professional players to drive brand credibility Reebok-CCM Hockey recognises that success with the consumer is heavily influenced by exposure generated at the professional level. Product usage by some of the best players in the game validates Reebok-CCM Hockey’s product performance credentials, and both brands are highly visible among professional ice hockey leagues worldwide: / Reebok-CCM Hockey has partnerships with the most important leagues in the industry. It is the exclusive licensee of jerseys for the National Hockey League (NHL), the American Hockey League (AHL), the Canadian Hockey League (CHL) as well as eight European National and 60 Elite League teams. Reebok-CCM Hockey is also the official equipment supplier of the United States Hockey League (USHL), the East Coast Hockey League (ECHL) and numerous National Collegiate Athletic Association (NCAA) Division 1 institutions./ Reebok-CCM Hockey has formed endorsement partnerships with many of the best athletes in the world. Reebok Hockey is currently endorsed by NHL players such as Sidney Crosby, Marc-André Fleury and Corey Crawford. CCM’s roster of player endorsees includes John Tavares, Pavel Datsyuk, Matt Duchene and 2014 NHL Rookie of the Year Nathan MacKinnon.
Key strategic categories to drive growthReebok-CCM Hockey intends to accomplish growth through a continuous stream of product launches in its key category priorities: skates, sticks, goalie gear, protective/helmets and licensed apparel.
Strategic priority / Product innovation
Strategic priority / Professional player
validation
see Glossary, p. 258
Strategic priority / Focus on key growth
categories

adidas Group / 2014 Annual Report
Group Management Report – Our Group
652 0 1 4
/ 02.4 /
Other Businesses Strategy / Reebok-CCM Hockey Strategy
/ Skates: The focus in the skate category is to drive market share increases through products addressing critical performance aspects such as fit, weight and durability. In 2014, Reebok Hockey launched the new RibCor skate, currently being worn by Sidney Crosby, as well as many other pro players. CCM brought back the legendary Tacks franchise in July 2014 with the new CCM Tacks skate. It features the AttackFrame technology, designed with extra-stiff reinforcements in key areas of the foot, to help generate maximum acceleration on the ice.
/ Sticks: To drive future growth in the sticks category, Reebok-CCM Hockey focuses on developing new technologies that incorporate enhanced power, feel, flexibility and weight. While 2014 was used to reposition Reebok Hockey in the sticks category, CCM launched three sticks in the second half of 2014, all focused on innovations and technologies to help players achieve their best performance on the ice: the Tacks stick, the RBZ SuperFast – developed in collaboration with TaylorMade – and the CCM RibCor stick.
/ Goalie: In 2014, with the introduction of the Premier XLT line, Reebok Hockey further strengthened its position in the goalie sector. CCM introduced the new Retro Flex goalie line, which offers goalies unique colour options for their new gear.
/ Protective: In 2014, CCM launched the new RBZ protective line, which features even lighter-weight equipment while maintaining maximum protection.
/ Licensed apparel: Reebok-CCM Hockey will strive to further leverage its league partnerships and exclusive uniform status to drive growth. In addition to official uniforms, Reebok-CCM Hockey will take advantage of its status as the official NHL locker room performance apparel supplier and its exclusive rights related to the NHL Players’ Association (NHLPA) for name and numbered apparel and headwear.
More information on these and other products can be found in the Research and Development section.
Pricing strategy mirrors product positioning Reebok-CCM Hockey’s pricing strategy is consistent with its high-performance positioning in the sport. Through a commitment to product innovation, Reebok-CCM Hockey’s pricing strategy is to focus on the premium price segments but also to have a strong presence in all key price tiers.
see Picture 05
see Picture 06
see Research and Development, p. 73
Strategic priority / Pricing
05 / CCM Tacks skate
06 / CCM RibCor sticks

5
adidas Group / 2014 Annual Report
Group Management Report – Our Group
662 0 1 4
Global Operations
/ 02.5 /
Global OperationsGlobal Operations manages the development, production planning, sourcing and distribution of the majority of our products. The function continually strives to increase efficiency throughout the Group’s supply chain and ensure the highest standards in product quality and delivery performance for our customers and our own-retail and eCommerce activities at competitive costs.
Clearly defined priorities for Global Operations The vision of Global Operations is to be closest to every consumer. The function strives to provide the right product to consumers – in the right size, colour and style, in the right place, at the right time, across the entire range of the Group’s channels and brands. Global Operations has successfully taken ownership for quality, cost and availability in the past years to be able to respond most efficiently to the fast-changing requirements of consumers and customers.
Global Operations has a strong track record for establishing state-of-the-art infrastructure, processes and systems. The function has been successfully consolidating and improving legacy structures, reducing complexity and cost for the Group in close collaboration with our IT function. Against this background, the Group took the strategic decision in 2014 to consolidate the IT and supply chain functions in one area of responsibility within Global Operations.
Global Operations focuses on delivering against five function-specific strategic priorities driven by several key initiatives: / Ensuring cost competitiveness and reducing product and supply chain costs./ Providing industry-leading availability and enhancing existing logistics services to create a
flexible and cost-efficient supply chain./ Enabling later ordering, i.e. closer to the point of sale./ Supporting the Group’s growth projects./ Modernising infrastructure by building the necessary operational backbone.
By delivering on these initiatives, Global Operations will ensure our Group’s supply chain remains a competitive advantage in making us the partner of choice for our consumers and customers alike. This continues to be underlined by our strong ‘On-Time In-Full’ (OTIF) metric, a non-financial KPI for our Group, measuring the adidas Group’s delivery performance towards our customers and our own-retail stores. In 2014, the adidas Group delivered 81% of its adidas and Reebok products ‘on time’ and ‘in full’ compared to 82% in the prior year. For 2015, Global Operations strives to maintain OTIF at a very strong level of around 80%. OTIF was measured for around 70% of all adidas and Reebok products in 2014. It is also planned to roll out OTIF to those markets that are currently not in scope, thereby increasing the overall share of adidas and Reebok products measured against ‘on time’ and ‘in full’.
see Internal Group Management System, p. 98

adidas Group / 2014 Annual Report
Group Management Report – Our Group
672 0 1 4
Global Operations
/ 02.5 /
Ensuring cost competitivenessGlobal Operations focuses on further optimising product creation through an efficient and simplified material and colour selection process. This, coupled with increased automation in manufacturing, will further enhance productivity, shorten lead times and improve overall quality. These improvements are expected to enhance profitability for the Group and ensure we provide our consumers with the best value proposition possible.
In the area of manufacturing excellence for footwear, automation represents the key driver for efficiencies. As part of this optimisation initiative, we support the implementation of state-of-the-art machinery and solutions, such as computer stitching, high-frequency cutting and automated production lines across factories, and we provide technical competency training to factory floor staff. The resulting improvements in the factories are both visible and tangible. With less manual labour required, manufacturers were able to reduce operating space and energy while increasing their right-first-time rate and optimising their operator utilisation. For apparel, our goal is to use the manufacturing excellence initiative to roll out modular production lines. In addition, we introduced Global Sewing Data (GSD) – a globally recognised, industry-leading pre-determined motion time system. It is an accurate and consistent way to measure the standard production time or Standard Minute Value (SMV) of a product.
Global Operations aims to further strengthen the Group’s overall price competitiveness. Therefore, in 2014, the function developed a new approach to material costing with increases in transparency on fabric cost structure. This new approach delivers valuable insights which are used in seasonal negotiations with our suppliers and allocation decisions. At the same time, it helps us further optimise level-loading within our factories.
Strategic priority / Cost competitiveness
01 / Global Operations in go-to-market process
Global Operations
Marketing
Briefing
Design
Concept
Product Development
Product creation
Sourcing
Manufacturing
Supply Chain Management
Distribution
Sales Subsidiaries
Sales
Centre of Excellence
Processes and infrastructure of the future

adidas Group / 2014 Annual Report
Group Management Report – Our Group
682 0 1 4
Global Operations
/ 02.5 /
Providing industry-leading availabilityOver the past years, Global Operations has built new supporting system solutions that use SAP as a basis to standardise, automate, bundle and execute market processes and system functionalities. The roll-out of these systems and processes is a prerequisite to enable enhanced value-added services (e.g. labelling, price tags and RFID tags) at our factories and distribution centres. These are also critical for our flexible make-to-stock service, which aims to improve product availability and inventory utilisation by planning and building inventory buffers at different locations further up the supply chain.
Other capabilities that the function has built include an increased level of transparency on inbound transportation in our supply chain. This allows for timely and accurate instructions on delivery times, planning and purchasing, resulting in a reduction of workload and increased customer satisfaction. Another important aspect is the introduction of the capability to transfer inventory between locations in a more automated manner.
Enabling later orderingEnabling later ordering is a cross-functional priority in Global Operations focused on allowing our customers and own-retail network to order products closer to the time of sale, thereby facilitating buying decisions that are based on better market knowledge.
The initiative for reducing standard lead times focuses on shortening production lead times on footwear and apparel to 60 days. This will allow us to align sales processes across the brands and improve efficiencies. The majority of adidas footwear and apparel is already on 60 days.
In 2014, Global Operations launched the strategic initiative ‘Digital Creation’. One main objective of this initiative is to increase the speed and efficiency of product creation by using digital instead of physical product samples (virtualisation technology). The initiative was successfully introduced for footwear in 2014 and will be rolled out for apparel in 2015, thereby significantly reducing the production of physical product samples in the creation process.
Strategic priority / Product availability
Strategic priority / Later ordering
see Glossary, p. 258
see Sustainability, p. 89

adidas Group / 2014 Annual Report
Group Management Report – Our Group
692 0 1 4
Global Operations
/ 02.5 /
Supporting the Group’s growth initiativesGlobal Operations supports the Group’s key growth projects. Over the past years, our focus has been on the following projects:
/ adidas NEO label: Global Operations contributes to establish a fast in-season creation process for the adidas NEO label. This includes expanding the company’s fashion source base and enabling articles on creation-to-shelf timelines of three months and less for all product divisions. In 2014, the function developed 2.4 million units based on this newly established process, representing a significant increase compared to the prior year (2013: 1.5 million units).
/ eCommerce and customisation: Global Operations provides support in further harmonising customisation processes and systems. It has clearly defined supply chain capabilities that enable the demand growth for the customisation business and have supported the evaluation of existing customisation processes for adidas and Reebok footwear.
Modernising the Group’s infrastructure Global Operations continues to focus on building the required infrastructure, processes and systems to support the Group’s growth plans. This includes further process simplification, consolidation of legacy systems and distribution structures, as well as the creation of state-of-the-art systems required to support new business demands.
In 2014, Global Operations focused on further stabilising and optimising processes in those distribution centres which were opened in the previous year, particularly the Central Distribution Centre near Osnabrueck in Germany. Also, 2014 saw the go-live of important distribution facilities such as the newly opened distribution centre in Tianjin, China.
The vast majority of our facilities operate a standardised warehouse management system which continues to be rolled out to all new and existing warehouses in the operations network.
Strategic priority / Support growth initiatives
see Global Brands Strategy, p. 53
see Global Brands Strategy, p. 53
Strategic priority / Modernise infrastructure

adidas Group / 2014 Annual Report
Group Management Report – Our Group
702 0 1 4
Global Operations
/ 02.5 /
Majority of production through independent suppliersTo minimise production costs, we outsource almost 100% of production to independent third-party suppliers, primarily located in Asia. While we provide them with detailed specifications for production and delivery, these suppliers possess excellent expertise in cost-efficient, high-volume production of footwear, apparel and hardware. The latest list of our suppliers can be found on our website.
The adidas Group also operates a limited number of own production and assembly sites in the USA (4), Canada (3) and Germany (1). In order to ensure the high quality that consumers expect from our products, we enforce strict control and inspection procedures at our suppliers and in our own factories. In addition, we promote adherence to social and environmental standards throughout our supply chain.
Global Operations manages product development, sourcing and distribution for adidas and Reebok as well as for adidas Golf and Ashworth. Due to the specific sourcing requirements in their respective fields of business, TaylorMade, Reebok-CCM Hockey, Adams Golf and the Sports Licensed Division are not serviced through Global Operations, but instead utilise their own purchasing organisations. In order to quickly seize short-term opportunities in their local market or react to trade regulations, Group subsidiaries may also source from selected local suppliers outside the realm of Global Operations. Local purchases, however, account only for a minor portion of the Group’s total sourcing volume.
Number of manufacturing partners increasesIn 2014, Global Operations worked with 340 independent manufacturing partners (2013: 322). Of our independent manufacturing partners, 83% were located in Asia, 9% in the Americas and 7% in Europe. Less than 1% of our manufacturing partners were located in Africa. 27% of all suppliers were located in China.
Vietnam share of footwear production increases96% of our total 2014 footwear volume for adidas, Reebok and adidas Golf was produced in Asia (2013: 96%). Production in Europe and the Americas combined accounted for 4% of the sourcing volume (2013: 4%). Vietnam represents our largest sourcing country with 39% of the total volume (2013: 35%), followed by China with 27% (2013: 31%) and Indonesia with 23% (2013: 24%). In 2014, our footwear suppliers produced approximately 258 million pairs of shoes (2013: 256 million pairs). Our largest footwear factory produced approximately 11% of the footwear sourcing volume (2013: 11%).
www.adidas-group.com/sustainability
see Sustainability, p. 89
see Diagram 02
see Diagram 03
see Diagram 04
02 / Suppliers by region 1)
1) Figures include adidas, Reebok, adidas Golf and Ashworth, but exclude local sourcing partners, sourcing agents, subcontractors, second-tier suppliers and licensee factories.
1 / 83% Asia2 / 9% Americas3 / 7% Europe4 / < 1% Africa
2014 1
2 3 4

adidas Group / 2014 Annual Report
Group Management Report – Our Group
712 0 1 4
Global Operations
/ 02.5 /
China remains largest source country for apparelIn 2014, we sourced 93% of the total apparel volume for adidas, Reebok, adidas Golf and Ashworth from Asia (2013: 92%). Europe remained the second-largest apparel sourcing region, representing 5% of the volume (2013: 5%). The Americas accounted for 2% of the volume (2013: 3%). China is the largest source country, representing 31% of the produced volume (2013: 32%), followed by Cambodia with 16% (2013: 12%) and Vietnam with 13% (2013: 12%). In total, our suppliers produced approximately 309 million units of apparel in 2014 (2013: 292 million units). The largest apparel factory produced approximately 11% of this apparel volume in 2014 (2013: 11%).
In addition, Reebok-CCM Hockey sourced around 3 million units of apparel in 2014. The majority of this volume was also produced in Asia, while small portions were sourced from the Americas (particularly Canada) and Europe.
The Sports Licensed Division sourced approximately 20 million units of apparel and 12 million units of headwear (2013: 21 million and 11 million, respectively). The majority of purchased apparel products were sourced as unfinished goods from Latin America (71%) and Asia (29%) (2013: 70% and 30%, respectively), and were subsequently finished in our own facilities in the USA. The vast majority of headwear sourced was finished products manufactured in Asia (more than 99%).
see Diagram 05
see Diagram 06
05 / Apparel production by region 1)
1) Figures include adidas, Reebok, adidas Golf and Ashworth.
20141 / 93% Asia2 / 5% Europe3 / 2% Americas
1
2 3
06 / Apparel production 1) 2) (in million units)
2014 309
2013 292
2012 262
2011 267
1) Figures include adidas, Reebok, adidas Golf and Ashworth.2) 2011–2013 restated due to a reclassification of certain apparel accessories from
apparel to hardware.
03 / Footwear production by region 1)
1) Figures include adidas, Reebok and adidas Golf.
1 / 96% Asia2 / 3% Americas3 / 1% Europe
2014 1
2 3
04 / Footwear production 1) (in million pairs)
2014 258
2013 256
2012 240
2011 239
1) Figures include adidas, Reebok and adidas Golf.

6
adidas Group / 2014 Annual Report
Group Management Report – Our Group
722 0 1 4
Global Operations
/ 02.5 /
China share of hardware production declines In 2014, 78% of adidas and Reebok branded hardware products, such as balls and bags, was produced in Asia (2013: 79%). European countries accounted for 22% (2013: 21%). China remained our largest source country, accounting for 38% of the sourced volume (2013: 42%), followed by Turkey and Pakistan with 20% and 13%, respectively (2013: 19% and 10%, respectively). The total hardware sourcing volume was approximately 99 million units (2013: 94 million units), with the largest factory accounting for 11% of production.
TaylorMade sourced 99% of their hardware volumes from Asia (2013: 99%). The vast majority of golf club components were manufactured by suppliers in Asia (China, Vietnam and Taiwan) and assembled in Asia, the USA and Europe.
Reebok-CCM Hockey sourced 87% of their hardware volumes from Asia (2013: 86%). In addition, Reebok-CCM Hockey sourced a portion of hardware products in the Americas.
see Diagram 07
see Diagram 08
07 / Hardware production by region 1)
1) Figures include adidas, Reebok and adidas Golf.
2014 1 / 78% Asia2 / 22% Europe
1
2
08 / Hardware production 1) 2) (in million units)
2014 99
2013 94
2012 93
2011 96
1) Figures include adidas, Reebok and adidas Golf.2) 2011–2013 restated due to a reclassification of certain apparel accessories from
apparel to hardware.

6
adidas Group / 2014 Annual Report
Group Management Report – Our Group
732 0 1 4
Research and Development
/ 02.6 /
Research and DevelopmentCreating innovative products to meet the needs of professional and everyday athletes and consumers is a prerequisite to strengthening our market position in the sporting goods industry. In a rapidly changing world, our culture and passion for innovation and consistent investment in research and development (R&D) is essential to the development of new product concepts, processes and production methods that are beneficial to our business objectives and our long-term sustainability ambitions.
R&D an integral part of the product and user experience creation processR&D within the adidas Group follows a decentralised approach. In line with their strategic and long-term visions and distinctive positioning, each brand runs its own R&D activities. However, fundamental research as well as expertise and competencies in sustainable product creation are shared across the Group.
For the adidas brand, R&D is closely integrated with the sourcing, design and product marketing functions. At the beginning of the product creation process, marketing defines a development priority, which, in recent years, has increasingly included sustainability targets. This is derived on a case-by-case basis from a combination of consumer research and feedback, competition analysis and own product testing.
Based on this, employees in our so-called FUTURE teams analyse new materials, production processes and scientific research to increase the exchange and scope of idea generation. Their scope also extends to areas such as consumer insights and social media. This helps promote a holistic and innovation-focused culture which gives deeper consumer insights, while also fuelling creativity and synergies across the organisation. To identify innovative materials as well as integrate sustainability, cost and production process aspects into the development phase, the FUTURE teams are in close contact with our sourcing and material teams within product development who, in turn, work closely with our suppliers.
Once conceptualised, new product technologies are engineered using state-of-the-art systems. Furthermore, by embracing entirely new production technology and material approaches, product creation and development can be decoupled from traditional processes. Extensive virtual prototype testing and engineering loops are carried out on every technology, which promotes faster development phases as well as improved concept and quality, while simultaneously reducing physical material and resource requirements. Once a new product technology is deemed viable, it is produced as a physical sample. These samples are then comprehensively tested by a broad range of users, including top athletes. Only when these comprehensive tests have been successful are the technologies handed over to product marketing, which commercialises the technology to a final product.

adidas Group / 2014 Annual Report
Group Management Report – Our Group
742 0 1 4
Research and Development
/ 02.6 /
Selective purchase of external R&D expertiseIn addition to its internal R&D efforts, the adidas Group also purchases a limited amount of R&D expertise from well-established research partners. This strategy allows for greater flexibility and faster access to know-how. Moreover, this accelerates the rate at which knowledge is built up internally and across the Group. To increase efficiency and protect research results, collaborations are usually long-term and exclusive. Major adidas relationships exist with the University of Calgary, Canada, the University of Michigan and Oregon State University, USA, the University of Loughborough, UK, the University of Erlangen-Nuremberg, RWTH Aachen University, the University of Bayreuth and the University of Freiburg, Germany.
In addition, the adidas Group participates in a collaborative initiative called ‘Speedfactory’, which is a research project under the umbrella of the Industry 4.0 initiative of the German government. It focuses on a new era of autonomic robotic manufacturing by combining state-of-the-art information and communication technologies (ICT) with industrial production, innovative products and skill-intensive electronic services. Research topics include production logistics, cognitive basic technologies, human-machine interaction and 3-D industrial applications. Within Speedfactory, the adidas Group is reviewing the whole process chain from raw material to the final product. Since 2014, we are combining and integrating new materials and process technologies into software solutions to enable automated and flexible production solutions. More information on Speedfactory can be found on our website.
www.adidas-group.com/en/group/stories/adidas-future-manufacturing
01 / Major R&D activities and locations
Main activities Major locations
adidas
The adidas FUTURE team is divided into groups that focus on performance footwear, apparel and hardware innovation, within which there are individual product focus categories. The teams are closely integrated with associated functions and resources to increase efficiencies and flexibility in all aspects of innovation and technology development.
Global Development Centre(FUTURE)
Global Development Centre(FUTURE)
Herzogenaurach, Germany
Portland/Oregon, USA
Dedicated innovation development centres in Asia, working closely with these teams, concentrate on the realisation of concepts through functional product develop ment as part of the creation process. These centres are important in terms of develop ment efficiencies, as product and technology development takes place in real production environments.
Product Creation Centre
Product Creation Centre
Shanghai, China
Tokyo, Japan
Reebok
R&D teams at Reebok create footwear, apparel and hardware with the primary emphasis being on fitness. Teams are structured along the brand’s category priorities. In addition, there are certain cross-category groups such as the Reebok Advanced Concepts (RAC) team, which ensures specific concepts can be taken right through from initial idea to production.
Global Development and Testing Centre
Canton/ Massachusetts, USA
Collaboration partners at Advanced Development Centres in China and Vietnam focus on new technology developments, cutting-edge materials and treatments as well as manufacturing solutions.
Advanced Develop- ment Centre
Development and Testing Centre
Fuzhou, China
Ho Chi Minh, Vietnam
TaylorMade-adidas GolfTaylorMade-adidas Golf’s R&D team is focused on continuously designing and developing industry-leading products. The team is structured according to the different product categories in golf.
Global Development and Testing Centre
Carlsbad/ California, USA
Reebok-CCM Hockey
The R&D team at Reebok-CCM Hockey is dedicated to continuously creating state-of-the-art ice hockey equipment designed to improve the experience for both profes-sional and recreational players. R&D teams are category-specific, combining the design, engineering and product management functions. The goal of this structure is to create category expertise and improve speed to market.
Development and Testing Centre
Montreal/Quebec, Canada

adidas Group / 2014 Annual Report
Group Management Report – Our Group
752 0 1 4
Research and Development
/ 02.6 /
In 2014, Reebok maintained its long-term biomechanics research relationships with Arizona State University and the University of Las Vegas. R&D of Reebok hard goods equipment in partnership with Loughborough University also continued in 2014. In addition, Reebok continued a research initiative on wearable electronics with the University of Ottawa.
TaylorMade-adidas Golf continued its long-term cooperation with researchers at the University of Calgary in 2014, identifying the players’ ground interaction style and functional requirements for footwear.
Active trademark and patent protection policyTo capitalise on the Group’s R&D achievements, we seek patent protection for our innovations. We also own a substantial portfolio of registered trademarks for the Group’s brands and related proprietary names. As part of our business policy, we enforce the Group’s trademarks and patents by monitoring the marketplace for infringements and taking action to prevent them. This includes a vigorous anti-counterfeiting programme. We also have comprehensive processes, and undertake significant research, to avoid infringement of third-party intellectual property rights. As we use a wide range of different technologies in our products, we are not dependent upon any single technology, or any patent rights related to any single technology.
Highly skilled technical personnelOur R&D departments comprise experienced and multi-skilled people from different areas of technical expertise and from diverse cultural backgrounds. Product designers, engineers and sports scientists as well as material engineering experts focus on product development. Process and production specialists also form an essential part of our product development competencies. Other professional backgrounds include software development, electronic engineering, Finite Element Analysis, advanced CAD design and kinesiology.
The number of people employed in the Group’s R&D activities at December 31, 2014, was 985, compared to 992 employees in the prior year. This represents 2% of total Group employees. In 2015, we expect the number of R&D employees to remain stable.
Initiatives to further streamline product creation processWe aim at improving our ability to adapt to changing consumer preferences more quickly, flexibly and efficiently. We achieve this by facilitating the direct interaction with and involvement of our suppliers in product creation, quality control, product testing and commercialisation. In 2014, we continued to enhance our computer simulation research platform to further reduce the time to market of product innovations. This software system, with its advanced material and design capabilities, allows for more creativity in the design phase and significantly improves the level of product detailing. While increasing speed and reducing the need for physical product samples and testing in the R&D process, the benefits also translate into other Group commercial and efficiency initiatives. Advanced 3-D models contributed to the Group’s cross-functional virtualisation project, where between 2010, when this project began, and year-end 2014 we reduced the number of manufactured physical samples by over 18%. An additional benefit of creating virtual assets is their application in other areas, such as e-commerce, computer games, virtual merchandising and digital communication.
see Risk and Opportunity Report, p. 154
see Global Operations, p. 66

adidas Group / 2014 Annual Report
Group Management Report – Our Group
762 0 1 4
Research and Development
/ 02.6 /
R&D expenses at prior year levelR&D expenses include expenses for personnel and administration, but exclude other costs, for example those associated with the design aspect of the product creation process. In 2014, as in prior years, all R&D costs were expensed as incurred. adidas Group R&D expenses from continuing operations increased 2% to € 126 million from € 124 million in the prior year. Personnel expenses represent the largest portion of R&D expenses, accounting for almost 75% of total R&D expenditure. In 2014, R&D expenses represented 2.0% of other operating expenses (2013: 2.0%). R&D expenses as a percentage of sales from continuing operations remained stable at 0.9% (2013: 0.9%).
Successful commercialisation of technological innovationsWe believe developing industry-leading technologies and user experiences is only one aspect of being an innovation leader. Even more important is the successful commercialisation of those technological innovations. The awards we attained in 2014 highlight our technology leadership within the sporting goods industry.
As in prior years, the majority of adidas Group sales were generated with products newly introduced in the course of 2014. New products tend to have a higher gross margin compared to products which have been in the market for more than one season. As a result, newly launched products contributed over-proportionately to the Group’s net income in 2014. We expect this development to continue in 2015 as our launch schedule includes a full pipeline of innovative products.
see Note 02, p. 197
see Table 02
see Table 04
see Subsequent Events and Outlook, p. 146
02 / Key R&D metrics 1) 2)
2014 2013 2012 2011 2010
R&D expenses (€ in millions) 126 124 128 115 102
R&D expenses (in % of net sales) 0.9 0.9 0.9 0.9 0.8
R&D expenses (in % of other operating expenses) 2.0 2.0 2.1 2.1 2.0
R&D employees 985 992 1,035 1,029 1,002
1) 2014 and 2013 reflect continuing operations as a result of the planned divestiture of the Rockport business.2) 2011 restated according to IAS 8. Prior years are not restated.

adidas Group / 2014 Annual Report
Group Management Report – Our Group
772 0 1 4
Research and Development
/ 02.6 /
Successful product launches across all major adidas categoriesIn 2014, adidas sales were again driven by the latest product offerings, with products launched during the course of the year accounting for 78% of brand sales (2013: 74%). Only 2% of sales were generated with products introduced three or more years ago (2013: 3%).
03 / Major product launches in 2014
Product Brand
adizero f50 Crazylight football boot adidas
Football World Cup Battle Pack adidas
Brazuca Final Rio – Official Match Ball for the World Cup Final adidas
miCoach Smart Ball football adidas
Predator Instinct football boot adidas
Messi icon football range adidas
New 11 Pro football boot adidas
Energy Boost 2.0 running shoe adidas
Pure Boost running shoe adidas
adizero Boston Boost running shoe adidas
ClimaHeat Rocket Boost running shoe adidas
Crazylight Boost basketball shoe adidas
John Wall basketball shoe adidas
D Rose 5 basketball shoe adidas
ClimaChill training apparel adidas
ClimaHeat training collection adidas
ClimaCool Boat Breeze outdoor shoe adidas
Terrex ClimaHeat outdoor apparel adidas
Originals Stan Smith shoe adidas
Originals ZX Flux shoe adidas
Originals by Topshop collection adidas
Originals and The Farm collection adidas
Originals #miZXFLUX photo app adidas
Pharrell Williams x adidas Originals collection adidas
adidas Originals by Rita Ora collection adidas
ZQuick running shoe Reebok
Z-Jet running shoe Reebok
All Terrain running shoe Reebok
CrossFit Nano 4.0 training shoe Reebok
Skyscape women's walking shoe Reebok
Les Mills studio collection Reebok
Dance and yoga collection Reebok
Cardio Ultra studio shoe Reebok
Reebok Pump limited anniversary editions Reebok
Project (a) golf balls TaylorMade
Tour Preferred wedges TaylorMade
Ultimate driving iron UDI TaylorMade
RSi irons TaylorMade
adizero One golf shoe adidas Golf
XTD iron set Adams Golf
Pro Series hybrids Adams Golf
RibCor skate Reebok Hockey
Goalie XLT equipment Reebok Hockey
Resistance helmet CCM
Tacks skate and stick CCM
CCM RBZ SuperFast stick powered by TaylorMade CCM

adidas Group / 2014 Annual Report
Group Management Report – Our Group
782 0 1 4
Research and Development
/ 02.6 /
The adidas brand introduced numerous major product innovations in 2014. These included:/ Back in 2013, adidas launched its groundbreaking material innovation called Boost, in partnership
with BASF. Boost is an industry-first cushioning technology designed to deliver maximum energy return, responsiveness and comfort to athletes. Following its successful launch in the running category over the course of 2013, Boost was integrated into additional running silhouettes as well as other sports categories in 2014. For example, adidas introduced Boost to the basketball category with the new Crazylight Boost and D Rose 5 Boost signature basketball shoe. Boost basketball technology underwent comprehensive testing for over a year with top NCAA and NBA players. All athletes participated through high-performance drills and game simulations and gave universally positive feedback, consistently preferring the Boost version of a shoe compared to a standard EVA alternative. Boost was also integrated into other categories, such as training, snowboarding and baseball.
/ In 2014, adidas launched a revolution in active cooling technology, the adidas ClimaChill apparel range. The range incorporates an innovative fabric using titanium and 3-D aluminium cooling spheres, which are strategically located to correspond with the warmest area of the body, cooling skin down upon contact. The groundbreaking SubZero flat yarn contains titanium and is woven throughout the inside of each ClimaChill jersey, delivering up to 36% more cooling capacity.
/ In addition, in the second half of 2014, adidas introduced the ClimaHeat range, which has been engineered for athletes who require power insulation for training in cold weather. The hollow-fibre fabrics are engineered with yarns that are built to have a hollow core, allowing higher amounts of warm air to be trapped, which ensures greater insulation without adding additional weight. The fibres provide advanced moisture control by wicking sweat away from the body and transporting it to the outer surface of the fabric.
/ The introduction of the world’s first knitted football boot, the adidas Samba Primeknit, as well as the adidas Primeknit FS, the world’s first all-in-one knitted football boot and sock hybrid, marked the latest chapter in a rich history of revolutionary adidas football products and further cemented Primeknit as one of the key technologies at the heart of adidas innovation. The unique ‘sock silhouette’ design provides a bespoke second-skin feel that offers the perfect fit from toe to calf. The one-piece design and strong light yarns of the Primeknit FS provide new levels of flexibility and comfort with stability and strength equal to that of conventional boots. The advanced production techniques used to make Primeknit also allow for the one-layer upper to be constructed with zones catering to various performance needs, ensuring that both football boots meet the requirements of all aspects of the game.
/ The adidas miCoach Smart Ball is a Bluetooth Smart and app-enabled football with integrated in-built sensors that track the ball’s movement for football kicking training through an automated coaching system. The Smart Ball relays data on how hard the ball has been struck, offers visual flight trajectories, depicts ball spin and shows impact points via the adidas miCoach Smart Ball app. This data can then be used to help train players, providing coaching instructions on how to alter kicking technique.
/ The #miZXFLUX app from adidas Originals has taken sneaker customisation to the next level, with a bespoke personal touch. Using the app on an iOS or Android phone, users can upload new images or photographs and apply them to the ZX Flux’s upper. Once the design is selected, a 360° 3-D preview allows users to rotate, scale and position their design until it is just right, with the ability to then save and share their designs on social networks and more.
More information on these and other products can be found in the Global Brands Strategy section. see Global Brands Strategy, p. 53

adidas Group / 2014 Annual Report
Group Management Report – Our Group
792 0 1 4
Research and Development
/ 02.6 /
Reebok introduces new technology platformsIn 2014, Reebok’s latest products continued to generate the majority of Reebok’s sales, with an estimated 73% of footwear sales coming from products launched in 2014 (2013: 59%). Only 15% of footwear product sales relate to products introduced three or more years ago (2013: 12%).
In 2014, Reebok presented several key product introductions. Some of the highlights included:/ The Reebok ZQuick was brought to market in 2014 and was designed to mimic technology found
in Z-rated tyres. ZQuick is engineered with a softer compound and cut-groove geometry to maximise ground contact area. The ZSeries of footwear will continue in 2015, especially with the highly anticipated launch of the ZPump Fusion.
/ In training, Reebok continued to expand its CrossFit Nano technology platform with a new version, the 4.0. The shoe contains an all-new based mesh for enhanced breathability as well as re-engineered multi-density Duracage for lightweight upper protection.
/ Reebok also introduced Checklight, a groundbreaking impact indicator for use in contact sports and activities. It has flexible electronics and motion sensors to accurately measure direct accelerations in real time and provide actionable objective measurement of impact force.
More information on these and other products can be found in the Global Brands Strategy section.
Innovation a key success factor for TaylorMade-adidas GolfAt TaylorMade-adidas Golf, current products (i.e. products launched in the last 18 months, which is the typical product life cycle in golf) represented 66% of total hardware sales in 2014 (2013: 81%). Products that had been brought to market three or more years ago accounted for 7% of sales in 2014 (2013: 5%).
Despite a challenging market environment in the golf industry, TaylorMade-adidas Golf retained its status as the world’s leading golf company in 2014, with market leadership in key categories such as metalwoods. However, in light of the Group’s efforts to clean retail inventories and the shift to longer product launch cycles, TaylorMade-adidas Golf made a strategic decision to reduce the number of new product introductions compared to previous years. Among the highlight product launches in 2014 were:/ Supplementing the SLDR driver introduced in the summer of 2013, in 2014 TaylorMade added
SLDR-S woods and the SLDR irons. With extremely low and forward weight distribution, the SLDR–S woods are able to deliver less spin and a higher launch angle when lofted up, producing significant distance gain for all players. The SLDR irons are designed for better players using the new sole slot technology.
/ Launched at the end of 2014, the RSi1 and RSi2 irons feature new face slots in addition to sole slots and are filled with a soft polymer, resulting in more distance consistency, while keeping the noticeably higher trajectory with a steeper angle of descent for soft landing of a slotted iron.
More information on these and other products can be found in the TaylorMade-adidas Golf Strategy section.
see Global Brands Strategy, p. 53
see TaylorMade-adidas Golf Strategy, p. 60

adidas Group / 2014 Annual Report
Group Management Report – Our Group
802 0 1 4
Research and Development
/ 02.6 /
Reebok-CCM Hockey innovates in sticks and skatesAt Reebok-CCM Hockey, products launched in 2014 accounted for 60% of global sales (2013: 53%). Only 16% of sales were generated with products introduced three or more years ago (2013: 11%).
Reebok-CCM Hockey product launches in 2014 included:/ 2014 marked the return of the legendary Tacks sub-brand to CCM skates and sticks. The Tacks
skate is powered by an AttackFrame featuring extra-stiff composite reinforcements to provide more explosive strides.
/ CCM launched the CCM RBZ SuperFast stick powered by TaylorMade. The RBZ stick worked on in conjunction with TaylorMade features Speed Pocket technology to maximise puck speed. In addition, CCM introduced the RibCor 40K stick.
/ Another major launch for CCM was the Resistance helmet developed in collaboration with the renowned Neurotrauma Impact Science Laboratory at the University of Ottawa. The helmet features a Rotational Energy Dampening System and impact pods to better manage rotational and linear impacts.
/ Reebok Hockey launch highlights in 2014 included the RibCor ice hockey skate. Designed with an agility profile, the RibCor skate includes key technologies such as The Pump for customisation and the new Black SpeedBlade for a harder, longer-lasting edge.
More information on these and other products can be found in the Reebok-CCM Hockey Strategy section.
Ambitious 2015 R&D targetsOur Group remains committed to maintaining a full and innovative product pipeline, bringing new groundbreaking technologies and evolutions of concepts to the market each year. This way, we want to further drive product leadership across all brands and increase consumer desire.
In 2015, cushioning and energy solutions, lightweight and digital sports technologies as well as sustainable product innovation will continue to be at the forefront of adidas R&D activities. Additionally, investments and research emphasis will also include areas such as new manufacturing processes and advanced materials to drive the development of revolutionary products and industry-changing manufacturing approaches as we aim to position the brand as both a technology and sustainability leader in the sporting goods industry.
Reebok’s R&D activities in 2015 will continue to centre on the brand’s strategy and focus on its technology pillars, including ZSeries, The Pump, DMX Moving Air, Skyscape, Smoothfit, ZigTech, RealFlex and Checklight.
see Reebok-CCM Hockey Strategy, p. 64
see Group Strategy, p. 46

adidas Group / 2014 Annual Report
Group Management Report – Our Group
812 0 1 4
Research and Development
/ 02.6 /
TaylorMade-adidas Golf’s development efforts will reinforce industry leadership by enhancing golfers’ performance through a focus on technologies which increase distance for woods combining improvements in low and forward weight distribution with new flexible sole pocket design which provides more consistent distance for irons with a combination of sole and face slots. Finally, developing new golf balls able to fly under lower spin conditions to maximise driver distance will also be a key part of TaylorMade-adidas Golf’s research efforts in 2015.
Reebok-CCM Hockey R&D efforts will focus on introducing new technologies and, at the same time, advancing existing product platforms with a focus on performance skates and sticks. Reebok-CCM Hockey will also continue its collaboration with TaylorMade-adidas Golf and its university research partners.
More information on 2015 product initiatives can be found in our outlook section. see Subsequent Events and Outlook, p. 146
04 / 2014 product awards
Brand Category Product Award
adidas Running adizero Adios Boost running shoe 2014 Editor’s Choice Award / Runner's World Magazine (UK)
adidas Running Supernova Sequence Boost running shoe
2014 Best Update / Runner's World Magazine (UK)
adidas Running Supernova Glide 6 & 7 running shoes
2014 Editor’s Choice Award / Runner's World Magazine (UK)
adidas Running Pure Boost running shoe Best Sneaker of 2014 / complex magazine (US)
adidas Running adizero Boston Boost 5 running shoe
Award for Best Renovation by Fortius / The Running Network (US)
adidas Running Response Boost running shoe Best Shoe of 2014 / Running Product Reviews
adidas miCoach Smart Run watch Best of the Best in Product Design / Red Dot Award 2014
adidas miCoach Smart Ball football Honoree for Best of Innovation / 2015 Consumer Electronics Show (CES)
adidas Training adidas by Stella McCartney Pure Boost Dark Space
Award for Best Sneaker / Vegan Fashion Award / Peta (Germany)
adidas Outdoor Terrex AllAlpine Concept jacket OutDoor Industry Award 2014 / OutDoor Show Friedrichshafen
adidas Originals Stan Smith shoe Shoe of the Year / WWD Footwear News
adidas Porsche Design Sport by adidas
BOUNCE:S4 shoe Award for Outstanding Product Design / 2014 Red Dot Award Awards for High Quality, Design and Ergonomics / Plus X Award Award for Best Product of the Year / Plus X Award
adidas Porsche Design Sport by adidas
Wool Mix jacket Awards for High Quality and Design / Plus X Award
adidas Porsche Design Sport by adidas
Functional Knit jacket Awards for High Quality and Design / Plus X Award
Reebok Training CrossFit Sprint TR training shoe Best Sneaker 2014 / Fitness Magazine (US)
Reebok Training CrossFit Nano 3.0 training shoe Best Strength Training Shoe / Men's Health (US)
Reebok Training Checklight Award for Best New Product / 2014 Corporate Entrepreneur Awards Fast Company Innovation by Design Award / Fast Company Magazine Award for Product Design in Sports & Fitness Category / Red Dot Award 2014 Award for Best Consumer Product / The Wearables 2014
TaylorMade Golf SLDR driver Editor's Hot List Gold Award 2014 / Golf Digest Hot List

7
adidas Group / 2014 Annual Report
Group Management Report – Our Group
822 0 1 4
Employees
/ 02.7 /
EmployeesBecoming the leader in the sporting goods industry depends upon the dedication, knowledge and performance of our employees and excellence of our leaders. As such, we place considerable effort into creating a work environment that stimulates innovation, team spirit, engagement and achievement.
Human Resources to support the achievement of the Group’s strategic targetsIn 2014, adidas Group Human Resources continued to drive organisational strategies through its initiatives and programmes comprising four strategic areas of focus: ‘Leadership’, ‘People’,
‘Capabilities’ and ‘Efficiencies’. 2015 activity will focus on sustaining existing programmes and reorienting for future strategy, under the leadership of Karen Parkin, our new Chief Human Resources Officer, in order to actively contribute to the success of our new Strategic Business Plan.
Commitment to leadership excellenceWe focus on elevating our leaders’ strengths, in particular how leaders create the right environment for our employees to be inspired, committed and motivated.
We therefore continue to have a strong focus on investing in the way we work and lead across our global leadership teams. At the beginning of 2014, over 85 global leadership teams (700 leaders) took part in a ‘Leadership Journey’. These journeys include intensive sessions of self-reflection of mindsets, and 360° feedback. The focus during the remainder of the year was to sustain the journey and embed in daily leadership routines.
Enabling employees to reach their personal bestTo reach their personal best, our Group’s employees are offered a wide variety of learning opportunities, building on their strengths, improving their skills and overcoming their own challenges. Our highest priority is to match individual employee aspirations with our organisational needs. As such, we continue to build our integrated talent management process, incorporating performance, succession, development and learning opportunities to enable our employees to reach their potential at every stage of their career.
Talent management: The quality of current and future talent and leadership within the adidas Group is key to our success. With specifically designed talent management tools, we identify talents at all levels of our Group who have the potential to become future leaders or key players within the organisation. In order to prepare them for more complex future roles, they participate in targeted development programmes and have tailored individual development plans.
Strategic area / LeadershipDevelopment of leadership talent
Strategic area / PeopleTalent, performance and succession management
see Diagram 01

adidas Group / 2014 Annual Report
Group Management Report – Our Group
832 0 1 4
Employees
/ 02.7 /
These comprise:/ Executive Development Programme (EDP): a global, cross-functional programme for employees
who show potential for the executive level. The programme is centrally managed and takes place every second year. It was not carried out in 2014 (2013: 49 participants).
/ Management Development Programme (MDP): a global programme which is executed regionally. This programme is tailored to employees from different functional areas and brands who show potential for director positions. In 2014, we had 87 employees participating in this programme (2013: 89).
/ People Manager Development Programme (PDP): a global programme which is executed locally. The programme targets employees at a professional level who show potential to become team leads or senior managers. In 2014, 114 employees participated in this programme (2013: 114).
In addition, we offer tailored graduate programmes. The Business Management Programme (BMP), a 24-month international, cross-functional and cross-brand programme, is aimed at attracting professionals with MBA degrees and three to five years of work experience. The goal of this programme is to prepare them for future management positions within our Group. At year-end 2014, six employees were participating in the BMP globally (2013: 6).
The Functional Trainee Programme (FTP) is an 18-month programme providing graduates with an international background and excellent educational credentials the opportunity to start a functional career within the adidas Group. The programme comprises six three-month assignments in various departments. At least one of these assignments takes place abroad. At year-end 2014, we employed 41 participants in our global FTP (2013: 57).
Our development programmes are complemented by apprenticeship and internship programmes. The adidas Group apprenticeship offers young people who want to join our Group directly out of school the opportunity to gain business experience in a two- to three-year rotation programme. The programme includes vocational training in retail, industrial management and IT, as well as integrated study programmes. At the end of 2014, we employed 60 apprentices in Germany (2013: 59) and 52 integrated study programme students (2013: 62). Our global internship programme offers students three to six months of work experience within the adidas Group. At the end of 2014, we employed 524 interns in Germany (2013: 532).
01 / Development and training framework
Talent Development ‘Fit for Tomorrow’
Executive Executive Development Programme (EDP)
Manager Management Development Programme (MDP)
ProfessionalPeople Manager Development Programme (PDP)Business Management Programme (BMP)Functional Trainee Programme (FTP)

adidas Group / 2014 Annual Report
Group Management Report – Our Group
842 0 1 4
Employees
/ 02.7 /
Performance management: To further drive a high-performance culture within the adidas Group, we use a performance management approach called ‘The Score’. It brings target setting, employee development and performance appraisal under one common process. While building on our key values of performance management, The Score also brings focus, simplicity and alignment in setting team and individual targets. Each employee is evaluated and receives feedback at least twice a year, and employee development planning is further supported by the process and system solution.
Succession management: The adidas Group succession management approach aims to ensure stability and certainty in business continuity. We achieve this through a globally consistent succession plan which covers successors for director level positions and above, including the Board positions of the Group. These positions and the respective potential successors are regularly discussed by senior management and our global HR leadership teams. The succession reviews create a clear picture of the successors’ readiness and outlines the necessary development actions. Based upon this information, we ensure individual development plans are in place to prepare successors for their potential next steps. We also use the successor information to create dynamic talent pools. All information is consolidated in a succession management risk analysis.
Remuneration system based on performance We are committed to rewarding our employees with compensation and benefit programmes that are competitive in the marketplace. Remuneration throughout the Group comprises fixed and variable monetary compensation, non-monetary rewards, as well as other intangible benefits. The cornerstone of our rewards programme is our Global Salary Management System, which is used as a basis for establishing and evaluating the value of employees’ positions and salaries in a market-driven and performance-oriented way. In addition to a fixed base salary, we offer our employees various variable compensation components.
Bonus programme: In order to allow our employees to participate in the Group’s success, and to reward them for their target achievement, we have a global bonus programme. To further drive our performance culture on the organisational as well as individual level, this programme provides an incentive influenced by both corporate performance (actual financial results measured against Group and market targets) as well as individual performance (measured in the performance management approach, The Score).
Profit participation programme: For employees at our Group headquarters and our other locations in Germany who do not participate in the bonus programme, we have a profit participation programme called the ‘Champions’ Bonus’.
Long-term incentive programmes: In order to encourage sustainable financial results, retain our top leadership and promote continuous commitment, the adidas Group offers a Long-Term Incentive Plan (LTIP) for leaders and Executive Board members. Other benefits include our 401(k) retirement plans in the USA and the adidas Group pension plan for our employees in Germany. In 2014, 3,572 employees participated in the latter (2013: 2,315).
Strategic area / PeoplePerformance-driven remuneration system

adidas Group / 2014 Annual Report
Group Management Report – Our Group
852 0 1 4
Employees
/ 02.7 /
02 / Key employee statistics 1)
2014 2013
Total number of employees 53,731 49,808
Total employees (in %)
Male 50% 51%
Female 50% 49%
Management positions (in %)
Male 72% 72%
Female 28% 28%
Average age of employees (in years) 2) 30 30
Average length of service (in years) 5 4
1) Figures reflect continuing operations as a result of the planned divestiture of the Rockport business.2) At year-end.
Our Group subsidiaries also grant a variety of benefits to employees, depending upon locally defined practices and country-specific regulations and norms.
Creating an attractive work environmentWe aim to offer our employees an attractive work environment. In this context, the following aspects play a central role:
Global mobility: As a global company with less than 10% of our employees located in Germany, we actively encourage global talent mobility and offer our employees the opportunity to gain international experience through a variety of assignment programmes and international placements. Besides offering our employees the possibility of pursuing an international career, our global mobility programme enables us to better fulfil consumer needs around the world. We comprehensively reviewed and further developed our mobility programme in 2014.
Work-life integration: We aim to harmonise the commercial interests of the adidas Group with the professional, private and family needs of our employees. Our Work-Life Integration Programme includes flexible work time and place, people development and leadership competence related to work-life integration, as well as family-oriented services. In addition to providing flexible working arrangements, teleworking, sabbaticals and parent/child offices, we have had a child-care facility at our company premises in Canton, USA, since 2002 and a day-care centre for 110 children at our headquarters in Herzogenaurach, Germany, since 2013.
Diverse sports activities for employees: We offer our employees a wide range of sports activities at our major sites. Employees in Herzogenaurach, Portland, Canton and at other subsidiaries have access to a company gym and numerous other sports facilities. Our Company Sports department in Herzogenaurach also organises various team and individual sports activities. In 2014, the Company Sports department in Germany offered 335 courses and 45 events, which were attended by more than 6,500 participants (2013: > 6,000).
Strategic area / PeopleOur objective: To be the employer of choice

adidas Group / 2014 Annual Report
Group Management Report – Our Group
862 0 1 4
Employees
/ 02.7 /
Diverse work environment: Diversity is one of the adidas Group’s four core values. We understand that it takes people with different ideas, strengths, interests and cultural backgrounds to ensure we achieve our goals. A high degree of diversity is already represented within our workforce. At our Group’s global headquarters, for example, we have employees from almost 80 nations.
In addition to the internationality of our workforce, we believe that diversity in the form of mixed leadership teams contributes to the strength of our company, and we are committed to bringing this to life. We have joined other DAX-30 companies in an effort to increase the proportion of women in management. We defined the specific target of increasing the proportion of women in management to 32% by the end of 2017 (2014: 28% worldwide). To reach this, we have strongly increased the proportion of women in our leadership development programmes to over 35%. In our global internal Women’s Networking Group, women can support, coach and advise other women, and promote female career development across the company. Following the Supervisory Board election in 2014, the number of female Supervisory Board members increased from two members to four.
Additional diversity initiatives include: / The adidas Group is an active member of the ‘Charta der Vielfalt’ (‘Diversity Charter’) in Germany
in order to share our best-practice knowledge regarding awareness of diversity and inclusion in the work environment.
/ We have regular events highlighting diversity as a key topic, e.g. on the occasion of our 2014 Diversity Day, addressing up-to-date diversity topics with internal and external presenters.
/ We continued our support of the LGBT community and built up our LGBT network in 2014, which is driven by our employees.
Employee engagement: To ensure that we will achieve our ambitious strategic targets we need an engaged and motivated workforce. The adidas Group regularly carries out employee engagement surveys in order to measure the engagement and motivation of our employees. The results of these surveys are a non-financial KPI for our Group. They enable us to develop the right focus and future people strategies across our organisation. The results of our first two global engagement surveys,
see Corporate Governance Report including the Declaration on Corporate Governance, p. 20
see Glossary, p. 258
see Internal Group Management System, p. 98
03 / Awards
The Candidate Experience Award/ The Talent Board
trendence School Leavers Barometer/Germany’s Top 100 Employers
The World’s Most Attractive Employers/Universum

adidas Group / 2014 Annual Report
Group Management Report – Our Group
872 0 1 4
Employees
/ 02.7 /
conducted in 2010 and 2013, were stable at a rate comparable to the average engagement level of our survey provider’s client database. In 2013, improvements were achieved in specific scores relating to performance management and learning and development opportunities. In 2014, the adidas Group continued to act on the findings of the second employee engagement survey as well as subsequent follow-up analysis. Globally coordinated Results to Action teams (R2A) have been formed across all departments in order to address our employees’ feedback. We aim to improve the overall engagement score in our next employee engagement survey, which will be conducted in 2016.
Employer of choice: Our ‘employer of choice’ status continues to garner worldwide recognition and enables us to attract, retain and engage industry-leading talent to sustain the company’s success and growth. In 2014, adidas Group locations around the world leveraged our employer brand attributes for attraction, retention and engagement strategies. In 2014, this work contributed to driving 4 million visitors to our career site, with 1.5 million job views and over 300,000 applications worldwide. This work has also enabled us to recruit some of the industry’s top talent.
Online platforms to drive employee collaboration and learningWe believe that a robust and state-of-the-art internal communication platform is essential for driving employee engagement and fostering learning as well as open collaboration within our organisation. We use an enterprise collaboration platform called ‘a-LIVE’, which brings the intranet, online collaboration platforms and important system applications under one roof. It allows departments and teams to quickly build and edit their own internal collaboration and communication platforms and connects users across departments as well as locations. It encourages employees to share knowledge, collaborate and discuss current topics. In addition, we have established an ‘Ask the Management’ platform on our intranet, enabling employees to openly address questions to our senior leaders which are then answered promptly.
see Diagram 03
Strategic area / CapabilitiesInternal collaboration and e-learning
04 / Number of employees by function 1)
2014 2013
Employees 2) Full-time equivalents 3)
Employees 2) Full-time equivalents 3)
Own retail 31,803 25,135 27,477 21,694
Sales 3,936 3,815 4,457 4,271
Logistics 6,009 5,545 5,945 5,405
Marketing 3,990 3,841 3,844 3,701
Central functions and administration 4,536 4,282 4,540 4,275
Production 1,360 1,287 1,501 1,437
Research & development 985 924 992 948
IT 1,112 1,088 1,052 1,028
Total 53,731 45,917 49,808 42,758
1) At year-end. Figures reflect continuing operations as a result of the planned divestiture of the Rockport business. 2) Number of employees on a headcount basis.3) Number of employees on a full-time equivalent basis. Due to the high share of part-time employees in our Retail segment,
this figure is lower than the number of employees counted on a headcount basis.

adidas Group / 2014 Annual Report
Group Management Report – Our Group
882 0 1 4
Employees
/ 02.7 /
05 / Employees by function 1)
1) At year-end.
1 / 59% Own retail2 / 11% Logistics3 / 9% Central functions & administration 4 / 7% Sales5 / 7% Marketing6 / 3% Production7 / 2% IT8 / 2% Research & development
06 / Employees by region 1)
1) At year-end.
1 / 33% European Emerging Markets
2 / 24% North America 3 / 21% Western Europe4 / 8% Greater China5 / 8% Latin America 6 / 6% Other Asian Markets
2014 also saw the global launch of the adidas Group ‘Learning Campus’ and with that the activation of a state-of-the-art learning platform that provides opportunities for both e-learning and sharing knowledge. Employees are able to access and share content 24/7 in a virtual environment.
Commitment to drive efficiency through HR processesWe are committed to establishing lean, system-supported HR processes to unleash efficiency gains while continuing to support employees with quality service. In 2014, therefore, we laid the foundation for a global adidas HR Services model, designed core processes, systems and tools and carried out pilot programmes for the model at our headquarters in Herzogenaurach, Germany.
Global employee base further increases On December 31, 2014, the Group had 53,731 employees, which represents an increase of 8% versus 49,808 in the previous year. This development is primarily related to the expansion of the Group’s own-retail store base, particularly in emerging markets globally. An overview of the development of our employee base in the past ten years can be found in our ten-year overview.
On a full-time equivalent basis, our Group had 45,917 employees on December 31, 2014 (2013: 42,758). Due to the high share of employees working on a part-time basis in the Retail segment, this figure is lower than the figure reported on a headcount basis. Personnel expenses for continuing operations increased slightly to € 1.842 billion in 2014 (2013: € 1.833 billion), representing 13% of Group sales (2013: 13%).
Strategic area / Efficiencies
see Table 04see Ten-Year Overview, p. 254
see Table 04
see Note 32, p. 235
2014 1 2
3
4 5 6 7 8
2014 1
2
3
6
4 5

8
adidas Group / 2014 Annual Report
Group Management Report – Our Group
892 0 1 4
Sustainability
/ 02.8 /
SustainabilityThe adidas Group is responsible and accountable for developing and implementing sustainable business practices that adhere to our operational needs as well as our social and environmental obligations. We therefore continuously engage with our various stakeholders with the goal of enhancing the social and environmental performance of the Group. Our activities in this area are based on a comprehensive Group-wide sustainability strategy.
Sustainability strategy founded on four pillars The adidas Group’s sustainability strategy is rooted in the Group’s values – performance, passion, integrity and diversity – and addresses those issues we have identified as most material for our business model. It is built on the achievements and learnings from previous years, while taking into account the societal landscape and future global trends.
The four pillars of our sustainability strategy are:
/ People: We positively influence the lives of our employees, factory workers and people living in the communities where we have a business presence.
/ Product: We find better ways to create our products – mainly through innovation, increased use of more sustainable materials and efficiencies.
/ Planet: We reduce the environmental footprint of both our own operations and our suppliers’ factories.
/ Partnership: We engage with critical stakeholders and collaborate with partners to improve our industry.
Supply chain as the core of our sustainability programme We have a responsibility to our employees and the workers in our suppliers’ factories as well as the environment. Malpractice in these areas, in particular human rights violations and dubious employment practices, can have a significant impact on the reputation and operational efficiency of our Group and our suppliers. Therefore, covering labour rights, health and safety as well as environmental protection at our own sites and our suppliers’ factories is of the highest importance to us.
Careful supplier selection: To improve working conditions throughout our supply chain, Global Operations works closely with our SEA (Social and Environmental Affairs) team on supplier selection. The SEA team assesses all potential new suppliers, and orders can only be placed with a new supplier if SEA approval has been granted.
Defined rules and standards in the supply chain: We have defined rules and standards embedding our own corporate values as well as those that society expects of global businesses. These standards follow International Labour Organization (ILO) and United Nations conventions relating to human rights and employment practices, as well as the model code of conduct of the World Federation of the Sporting Goods Industry (WFSGI). We have condensed our rules into a publicly available supplier code of conduct that we call our ‘Workplace Standards’. These Standards help us select manufacturing partners and serve as guiding principles in the early identification and treatment of potential issues of concern at our suppliers’ sites.
Strategic pillar / PeopleResponsibility to workers in our suppliers’ factories
see Global Operations, p. 66
www.adidas-group.com/s/workplace-standards
PEOPLE PRODUCT
PLANET
OUR 4 PILLARS OFSUSTAINABILITY
PARTNERSHIP

adidas Group / 2014 Annual Report
Group Management Report – Our Group
902 0 1 4
Sustainability
/ 02.8 /
To illustrate how suppliers should implement our Standards, we have created a set of detailed guidelines for use in factory settings, which demonstrate our expectations for fair, healthy, safe workplace conditions and environmentally sound factory operations. The guidelines are updated on a regular basis and are publicly available on our website. They are also used to determine suppliers’ compliance with our Standards and to advise and train our suppliers in improving their social and environmental performance.
Monitoring and rating our factories: The SEA team assesses compliance with the Workplace Standards by means of factory inspections. Our auditors check performance against a customised risk list for each factory that is monitored. The methodology is linked to a factory rating which measures the effectiveness of compliance systems and the work of their administrators. A KPI rating tool helps us evaluate six fundamental elements of social compliance covering management commitment, the quality of management systems in place, worker-management communication, training delivered, transparent reporting and measurement of compliance activities. According to the results, suppliers are assessed with a compliance rating (C rating) score between 1 and 5 (with 5 being the best rating). The latest results show that, in 2014, 64% of our direct suppliers achieved a 3C (good) or better rating (2013: 54%). We have thus already achieved our target for 2015 to have 60% of our direct suppliers meet a 3C (good) rating or better under our social compliance KPI rating. With this approach, we encourage our suppliers to take responsibility for their own performance including reporting of key social and health and safety indicators. These ratings are a non-financial KPI for our Group. They also enable us to precisely determine training needs at our suppliers’ factories.
During 2014, we conducted 1,299 factory visits (2013: 1,489 visits) involving different types of audits, trainings and meetings with factory management as well as employees at various levels in our supply chain. We have seen more supplier factories qualifying for self-governance status (factories that have reached 4C or 5C status) which means that factories have proven to operate effective human resources, health and safety as well as environmental management systems by themselves. Because of their high compliance performance, factory audits were slightly reduced at these factory facilities. In addition to our own monitoring activities, we value independent and unannounced assessment by third parties to demonstrate the credibility of and provide verified information about our programme to stakeholders. As a member of the Fair Labor Association (FLA), the adidas Group is subject to external assessment by independent monitors, participation in the FLA third-party complaint system and public reporting. The monitoring programme of the adidas Group has been accredited by the FLA twice since joining the organisation 15 years ago. During this period, more than 300 independent assessments have been conducted at adidas Group suppliers.
www.adidas-group.com/s/standards-and-policies
see Table 01
see Internal Group Management System, p. 98
01 / Compliance ratings
Grade KPI score band Performance description
1C 0–29% There are numerous severe non-compliance issues and no compliance management and compliance practices in place. The factory has been given notice that business will be terminated unless there is immediate improvement.
2C 30–59% There are some non-compliance issues and no compliance management systems. However, there are some effective compliance practices being delivered.
3C 60–79% There are minor non-compliance issues. The factory has compliance management systems and some effective compliance practices in place.
4C 80–89% Generally, there are no non-compliance issues. The factory has compliance management systems in place, and most of the components are effective.
5C 90–100% There are no non-compliance issues and all of the factory's management systems and practices are well delivered and effective.
see Diagram 02

adidas Group / 2014 Annual Report
Group Management Report – Our Group
912 0 1 4
Sustainability
/ 02.8 /
03 / Number of trainings
2014 131 1)
2013 148
2012 172
2011 170
2010 193
1) In 2014, we offered more group trainings instead of individual training sessions. As a result, we have been able to achieve higher efficiencies.
02 / Number of factory visits
2014 1,299 1)
2013 1,489
2012 1,564
2011 1,591
2010 1,451
1) With more supplier factories qualifying for self-governance status (factories that have reached 4C or 5C status), factory audits were slightly reduced at these factory facilities.
Encouraging self-governance and achieving sustainable compliance: We help our core business partners in establishing management systems with internationally recognised standards such as ISO 14001 for environmental management or OHSAS 18000 for health and safety management systems. We believe that good management systems help factories improve their day-to-day operations, support the process of self-governance and continuously enhance their social and environmental performance. We help them build and strengthen human resources systems to maintain proper working conditions, including factory grievance systems to routinely find and fix non-compliance issues. Furthermore, by enforcing employment standards at the sites of our manufacturing suppliers, we empower workers to protect their own rights and take an active role in decision-making.
Training our suppliers to achieve sustainable compliance: As part of the adidas Group’s continuous efforts to achieve more effective and sustainable practices within its supply chain, the Group has initiated a system of multi-level and cross-functional training sessions together with its global supplier network. Our SEA team not only offers specific training courses and workshops for factory supervisors and managers to help them apply our Standards and implement best practices but also promotes the establishment of structures that actively involve workers and management of our suppliers as well as local employee associations and non-governmental organisations (NGOs). In order to strengthen personnel capacities throughout our company, our SEA team similarly organises workshops for licensees, agents and adidas Group business entities. In this way, the consideration of fair working conditions becomes a routine part of our business activities. In 2014, the SEA team conducted 131 training sessions and workshops (2013: 148). We offered more group trainings, i.e. training sessions for more than one supplier instead of individual training sessions. That way, we have been able to achieve higher efficiencies and provide opportunities for cross-learning and best-practice sharing among suppliers.
see Diagram 03

adidas Group / 2014 Annual Report
Group Management Report – Our Group
922 0 1 4
Sustainability
/ 02.8 /
Warning-letter system to enforce compliance: Where a manufacturing supplier is performing poorly in terms of Workplace Standards compliance, we work closely with them to find solutions. However, when we find ongoing and serious instances of non-compliance as well as a lack of commitment from factory management to address the issues, we send out a formal warning letter including a notification to factory management that their business relationship with the adidas Group is in jeopardy. Overall, three warning letters result in a termination. In 2014, we terminated our business relationship with 13 suppliers for compliance reasons (2013: 9 terminations).
Revised adidas Group Code of Conduct for employeesThe adidas Group’s reputation is one of its key business assets and is fundamental to long-term success. All employees are expected to act with fairness and responsibility as well as in compliance with relevant laws and regulations while carrying out their tasks. In order to maintain good corporate governance, we have adopted the adidas Group Code of Conduct as part of our internal Global Policy Manual.
In 2014, the adidas Group significantly revised its existing Code of Conduct and organised various activations to familiarise its employees with the Code. In addition, a training plan ensures that all employees and relevant third parties understand and adhere to the Group’s compliance and ethics requirements.
Supporting communities with dedicated approachFor many years, the adidas Group has been actively supporting communities through various programmes such as the ongoing support from the adidas brand through its corporate volunteering programmes managed by the adidas Fund, Reebok‘s track record in supporting human rights groups or TaylorMade-adidas Golf‘s long-standing programme supporting charities.
All our programmes are built on three complementary pillars – community involvement, employee engagement and corporate giving – determined by local cultural, economic and social factors.
Programmes on Group level are supplementary programmes led by our SEA team. They include activities at Group headquarters, relief operations and projects in suppliers’ countries. For more information please see our website.
Sustainability in our product creation process One key goal of our sustainability strategy is to reduce the overall environmental impact of materials used in our products. We aim to find materials that reduce waste or have less of an impact throughout their whole life cycle. The adidas Group has various initiatives in place that help to achieve its goal of increasing the usage of recycled and sustainable materials.
Sustainable materials: Environmentally preferred materials have replaced conventional materials in many of our footwear and apparel products. In addition, we strive to continuously broaden the range of more sustainable products by developing environmentally friendly product solutions and using innovative materials.
Strategic pillar / PeopleOur employees
Strategic pillar / PeopleCommunity engagement
www.adidas-group.com/s/community-engagement
Strategic pillar / ProductProduct creation

adidas Group / 2014 Annual Report
Group Management Report – Our Group
932 0 1 4
Sustainability
/ 02.8 /
One example is our commitment to use 100% ‘sustainable cotton’ (Better Cotton, certified organic cotton or any other form of sustainably produced cotton that is currently available or might be in future) in all our products by 2018. More information about sustainable cotton can be found on our website.
Sustainable product construction: The number of adidas products that have integrated sustainability considerations has grown continuously in recent years. This growth is supported by ongoing innovation in the area of sustainable product construction and manufacturing techniques, such as the revolutionary DryDye technology or the low-waste initiative. DryDye is a polyester fabric dyeing process that uses no water, 50% fewer chemicals and 50% less energy than the traditional fabric dyeing process. The low-waste initiative produces footwear with fewer parts, recycled materials and maximum pattern efficiency, aiming to reduce material waste. For example, in footwear, we took on the challenge of creating a performance shoe with the least amount of waste possible. The result was the Element Voyager, a streamlined, simplified running shoe that reached 95% pattern efficiency in the upper and contains 60% fewer components than a traditional running shoe.
Virtual technologies: We increasingly use virtual technologies to reduce the quantity of physical samples required to design and sell new products. Virtualising processes help us save resources and money by reducing material waste, transportation and distribution costs. And with fewer samples being transported by airfreight, we are also reducing our carbon emissions.
Control and monitoring of restricted substances: We have specified clear standards for the use of restricted substances that follow the strictest local regulations and best practice standards for consumer care and safety. These standards are mandatory for all business partners and are updated regularly based on findings in our ongoing dialogue with scientific organisations. They cover general requirements for eco-labels and green seals (e.g. ÖKO-Tex Standard 100, Toxproof TÜV Rheinland) for footwear, apparel and hardware products. Both our own quality assurance laboratories and external testing institutes are used to constantly monitor material samples to ensure supplier compliance with these requirements. Materials that do not meet our standards and specifications are rejected.
In order to further guide our suppliers with input chemical chemistry selection, we partnered up with bluesign technologies in 2014 and are going to implement their chemical data management system, the bluefinder. With this, our suppliers select best-in-class chemicals, so that they can produce materials using chemicals that are included in the database.
www.bettercotton.org
www.adidas-group.com/s/product-materials
see Glossary, p. 258

adidas Group / 2014 Annual Report
Group Management Report – Our Group
942 0 1 4
Sustainability
/ 02.8 /
Improving our environmental footprint at our own sitesBased on an analysis of our environmental impacts in different areas of operation, we have put our Environmental Strategy in place. A part of our Environmental Strategy is the ‘Green Company’ initiative, which is targeted to substantially improve the environmental footprint of our own sites. One of the key goals is to operate certified environmental management systems at major sites of the adidas Group. Overall, by 2015, we aim to reduce the relative carbon emissions at our own sites by 30%. By the end of 2014, 13 major sites of the adidas Group had certified environmental management systems in place. Around 20% of the adidas Group’s workforce is located at these sites. Further information can be found on our website.
Driving environmental improvements in our supply chainIn our supply chain, activities focus on helping suppliers establish sound environmental management systems at their manufacturing plants to best reduce their negative environmental impacts. We have guidelines and training programmes in place for our suppliers, using the environmental performance of our own production sites as best practice examples.
The majority of our footwear sourcing volume is produced in factories which are OHSAS 18000 and/or ISO 14001 certified. The remaining part of our footwear sourcing volume is produced in factories that have management systems in place but have not yet been certified. All footwear factories are regularly assessed against the adidas Group’s standards on environment and workplace health and safety. We use ‘Environmental Key Performance Indicators’ to track the progress of environmental efforts undertaken by our strategic suppliers. Furthermore, we have established a database to collect environmental data from the factories of our core suppliers. A range of other activities have been implemented to reduce our carbon footprint in the supply and distribution chain.
Reducing our chemical footprint through a chemical management programme As part of our Environmental Strategy we have a chemical management programme in place ensuring the continuous improvement of our chemical footprint. The programme comprises four elements:
/ Product safety: Back in 1998, the company pioneered a Restricted Substances Policy for product materials, prohibiting the use of chemicals considered as harmful or toxic, which is updated annually. Ever since, we have continued to develop and update our policies which ban or restrict chemicals in our products.
/ Environmental audits: Over the years, we have developed a series of guidelines for suppliers with comprehensive and detailed standards on handling, storage and disposal of chemicals as well as standards for waste water treatment and effluents. These guidelines are the basis for factory inspections and assessments conducted by our Social & Environmental Affairs team and external auditors. In 2014, the company conducted 122 environmental audits at its suppliers’ factories (2013: 149).
/ Chemical input: In addition to the bluesign technologies bluefinder introduced in 2014, which guides our suppliers in selecting the right chemicals, we have committed to being 90% PFC-free in our products as of June 15, 2014 and to phasing out the use of long-chain PFCs by no later than January 1, 2015. As a further step, we have committed to being 99% PFC-free by no later than December 31, 2017. Chemical management on site will continue to be monitored through the adidas Group’s environmental audits.
Strategic pillar / PlanetEnvironmental management at own sites
www.adidas-group.com/s/green-company
Strategic pillar / PlanetEnvironmental management in the supply chain
Strategic pillar / PlanetChemical management
www.adidas-group.com/s/restricted-substances
www.adidas-group.com/s/environmental-guidelines

adidas Group / 2014 Annual Report
Group Management Report – Our Group
952 0 1 4
Sustainability
/ 02.8 /
/ Disclosure: As part of our approach in enhancing disclosure practices and transparency within our supply chain, the adidas Group has actively promoted reputable platforms such as the Institute of Public and Environmental Affairs (IPE) China Water Pollution Map and China Air Pollution Map. The adidas Group had disclosed 99% of the China-based ‘wet processes’ on the IPE platform by the end of 2014. Subsequently, the company has committed to achieve the disclosure of 50% of all ‘wet processes’ across its global supply chain by no later than December 31, 2015, and at least 80% by no later than July 1, 2016, via the IPE Detox platform.
Engaging with a variety of stakeholders globallyAt the adidas Group, we openly engage with numerous stakeholders, involving them in key social and environmental decisions that shape day-to-day operations. Through active participation in, for example, the Better Cotton Initiative, the Sustainable Apparel Coalition, the Leather Working Group and the AFIRM Working Group, we work closely with leading companies from a variety of sectors to develop sustainable business approaches and to debate social and environmental topics on a global level. This is also supported by our membership in organisations such as the World Federation of the Sporting Goods Industry (WFSGI), the Fair Factories Clearinghouse (FFC) and the Fair Labor Association (FLA). In addition, we build awareness, capacity and knowledge of laws and rights among factory management and workers by partnering with leading providers such as the EHS Academy in China and the IAO’s Better Work programme.
A key element of our transparent communication is the disclosure of our global supplier factory list on our corporate website. The list, which we have published since 2007, includes the factories that manufactured products for specific events such as the 2014 and 2010 FIFA World Cup as well as the London 2012 Olympic Games.
Ongoing external recognition for our sustainability efforts We have continuously received positive recognition from international institutions, rating agencies, NGOs and socially responsible investment analysts for our sustainability programme. In 2014, adidas AG was again represented in a variety of high-profile sustainability indices. For the 15th consecutive time, adidas AG was selected to join the Dow Jones Sustainability Indices (DJSI), the world’s first global sustainability index family tracking the performance of the leading sustainability-driven companies worldwide. In the sector ‘Textiles, Apparel & Luxury Goods’, adidas AG scored industry-best ratings in the categories Supply Chain Management, Product Stewardship and Stakeholder Engagement. An overview of all sustainability indices in which adidas AG is included can be found in the adjacent info box. Furthermore, in 2014, the adidas Group was again included in the list of The Global 100 Most Sustainable Corporations in the World (Global 100 Index), ranking eighth. Launched in 2005, this list is unveiled each year at the World Economic Forum in Davos, Switzerland, by Corporate Knights, a Canadian media and investment advisory company. The Global 100 Index is one of the most extensive data-driven corporate sustainability assessments in existence and is based on quantitative sustainability indicators covering economic, environmental as well as social aspects.
Strategic pillar / PartnershipEngaging with stakeholders
adidas AG in sustainability indices
/ Dow Jones Sustainability Indices (World and Europe)
/ FTSE4Good Index Series / Euronext Vigeo Indices
(World 120, Europe 120 and Eurozone 120)/ Ethibel Sustainability Index
(Pioneer and Excellence) / ECPI Euro Ethical Index (Euro and EMU)/ STOXX Global ESG Leaders


V
Inter nal Group Management Sy s tem 9 8Group Busine s s Per for mance 10 3
Economic and Sector Development 103 Income Statement 106 Statement of Financial Position and
Statement of Cash Flows 115 Treasury 121 Financial Statements and Management Report of adidas AG 127 Disclosures pursuant to § 315 Section 4 and § 289 Section 4
of the German Commercial Code 131Busine s s Per for mance by S egment 13 6
Wholesale Business Performance 136 Retail Business Performance 139 Other Businesses Performance 143
Subsequent Event s and Out look 14 6 Subsequent Events 146 Outlook 146
Risk and Oppor tuni t y Repor t 15 4 Strategic Risks 163 Operational Risks 165 Legal & Compliance Risks 170 Financial Risks 171 Strategic and Operational Opportunities 178 Financial Opportunities 180
Management A s se s sment of Per for mance, R isk s and Oppor tuni t ie s , and Out look 181
03.1
03.2
03.3
03.4
03.5
03.6
FINANCIAL
R E V I E WG R O U P M A N A G E M E N T R E P O R T
G R O U P M A N A G E M E N T R E P O R T: This report contains the Group Management Report of the adidas Group, comprising adidas AG and its consolidated subsidiaries, and the Management Report of adidas AG.
FI
NA
NCI
AL
REV
IEW
03

1
982 0 1 4
Internal Group Management System
/ 03.1 /
adidas Group / 2014 Annual Report
Group Management Report – Financial Review
Internal Group Management SystemThe adidas Group’s principal financial goal for increasing shareholder value is maximising operating cash flow. We strive to achieve this goal by continually improving our top- and bottom-line performance while at the same time optimising the use of invested capital. Our Group’s planning and controlling system is therefore designed to provide a variety of tools to assess our current performance and to align future strategic and investment decisions to best utilise commercial and organisational opportunities.
Operating cash flow as Internal Group Management focusWe believe operating cash flow is the most important driver to increase shareholder value. To support this, Group Management focuses on four major financial key performance indicators (KPIs). Increasing net sales and operating profit are the main contributors to improve operating cash flow. In addition, strict management of operating working capital and value-enhancing capital expenditure are beneficial for operating cash flow development. As a result, in order to maximise operating cash flow generation across our organisation, management of our operating segments have responsibility for improving net sales and operating profit as well as optimising operating working capital and capital expenditure. In addition, in order to keep senior management focused on long-term performance improvements, we have KPIs in place, which measure the development of the business units over a multi-year period.
Operating margin as important measure of operational progressOperating margin (defined as operating profit as a percentage of net sales) is our Group’s key focus measure to drive and improve our operational performance. It highlights the quality of our top line and operational efficiency. The primary drivers central to enhancing operating margin are as follows:
/ Sales and gross margin development: Management focuses on identifying and exploiting growth opportunities that not only provide for future top-line improvements, but also have potential to increase gross margin. Major levers for enhancing our Group’s sales and gross margin include: / Optimising our product mix./ Minimising clearance activities./ Improving the quality of distribution, with a particular focus on controlled space./ Realising supply chain efficiency initiatives.
see Glossary, p. 258
see Diagram 01
adidas Group financial KPIs /
Net sales and operating profit
see Glossary, p. 258
01 / Financial key performance indicators (KPIs) of the adidas Group
Net sales
Operating cash flowOperating profit
Change in operating working capital
Capital expenditure 1)
1) Less depreciation and amortisation.

Group Management Report – Financial Review
992 0 1 4
Internal Group Management System
/ 03.1 /
adidas Group / 2014 Annual Report
/ Operating expense control: Management puts high emphasis on tightly controlling operating expenses to leverage the Group’s sales growth through to the bottom line. This requires a particular focus on ensuring flexibility in the Group’s cost base. Marketing working budget is one of our largest operating expenses and at the same time one of the most important mechanisms for driving top-line growth sustainably. Therefore, we are committed to improving the utilisation of our marketing expenditure. This includes concentrating our communication efforts on key global brand initiatives and focusing our promotion spend on well-selected partnerships with top events, leagues, clubs athletes and artists.
We also aim to increase operational efficiency and tightly manage operating overhead expenses. In this respect, we regularly review our operational structure – streamlining business processes, eliminating redundancies and leveraging the scale of our organisation. These measures may also be supplemented by short-term initiatives such as temporarily curtailing operational investments, for example staff hiring.
Furthermore, we carefully analyse the different mix effects which impact the Group’s profit ratios, as our business performance differs significantly across geographical markets, business models and sales channels. The strategic implications and decisions taken in this respect are a key element of our strategic planning efforts, ensuring clarity and focus of the organisation to balance and broaden the Group’s future earnings stream and sustainably increase the Group’s operating margin.
Tight operating working capital managementDue to a comparatively low level of fixed assets required in our business, the efficiency of the Group’s balance sheet depends to a large degree on our operating working capital management. In this context, our key metric is operating working capital as a percentage of net sales. Monitoring the development of this metric facilitates the measurement of our progress in improving the efficiency of our business cycle.
We strive to proactively manage our inventory levels to meet market demand and ensure fast replenishment. Inventory ageing is controlled tightly to reduce inventory obsolescence and to minimise clearance activities. As a result, inventory days lasting is an important metric as it measures the average number of days goods remain in inventory before being sold, highlighting the efficiency of capital locked up in products. To optimise capital tied up in accounts receivable, we strive to improve collection efforts in order to reduce the Days of Sales Outstanding (DSO) and improve the ageing of accounts receivable. Likewise, we strive to optimise payment terms with our suppliers to best manage our accounts payable.
see Glossary, p. 258
see Glossary, p. 258
adidas Group financial KPIs /
Change in operating working capital

1002 0 1 4
Internal Group Management System
/ 03.1 /
adidas Group / 2014 Annual Report
Group Management Report – Financial Review
Capital expenditure targeted to maximise future returnsImproving the effectiveness of the Group’s capital expenditure is another lever to maximise our operating cash flow. We control capital expenditure with a top-down, bottom-up approach. In a first step, Group management defines focus areas and an overall investment budget based on investment requests from various functions within the organisation. Our operating segments then align their initiatives within the scope of assigned priorities and available budget. We evaluate potential return on planned investments utilising the net present value method. Risk is accounted for, adding a risk premium to the cost of capital and thus reducing our estimated future earnings streams where appropriate. By means of scenario planning, the sensitivity of investment returns is tested against changes in initial assumptions. For large investment projects, timelines and deviations versus budget are monitored on a monthly basis throughout the course of the project.
The final step of optimising return on investments is our selective post-mortem reviews, where larger projects in particular are evaluated and learnings are documented to be available for future capital expenditure decisions.
Non-financial key performance indicators In addition to the Group’s major financial KPIs to assess the current performance and operational success of the adidas Group, as outlined above, we have identified a set of non-financial KPIs that help us track our progress in areas that are critical for our long-term success but are, however, not directly reflected in the Group’s financial statements. These non-financial KPIs are assessed on a regular basis and managed by the respective Group functions. Non-financial KPIs include market share and consumer insight tracking, our customer delivery performance (On-Time In-Full), our employee engagement and a set of KPIs in the area of our sustainability performance.
Market share: Maintaining and enhancing brand image and reputation through the creation of strong brand identities is crucial for sustaining and driving revenue and profit growth. It is also an important credential as we extend our brands into new categories and regions. Therefore, mainly on a market and category level, we invest in primary qualitative and quantitative research such as trend scouting, consumer surveys and market share data to determine brand and category strength. Measures that are regularly tracked include market shares, brand awareness, likeability and purchase intent. These efforts are supported by global market research and consumer insight teams.
adidas Group financial KPIs /
Capital expenditure
see Management Assessment of Performance, Risks and Opportunities, and Outlook, p. 181
02 / Key financial metrics
1) Excluding acquisitions and finance leases.
Gross marginGross profit
= × 100Net sales
Operating marginOperating profit
= × 100Net sales
Average operating working capital
Sum of operating workingcapital at quarter-end
= 4
Net cash/Net borrowings =
Cash and cash equivalents + short-term financial assets – short-term borrowings – long-term borrowings
Operating working capitalin % of net sales
Average operatingworking capital
= × 100Net sales
Capital expenditure 1) = Additions of property, plant and
equipment plus intangible assets

Group Management Report – Financial Review
1012 0 1 4
Internal Group Management System
/ 03.1 /
adidas Group / 2014 Annual Report
Backlogs and sell-through data: To manage demand planning and anticipate our future performance, backlogs comprising orders received up to nine months in advance of the actual sale are monitored closely. However, due to the growing share of own retail in our business mix as well as fluctuating order patterns among our customers, order books are less indicative of anticipated revenues for the adidas Group compared to the past. Therefore, qualitative feedback from our retail partners on the sell-through success of our collections at the point of sale as well as data received from our own-retail activities is becoming even more important.
On-Time In-Full (OTIF): OTIF measures the adidas Group’s delivery performance towards customers and our own-retail stores. Managed by our Global Operations function, OTIF assesses to what degree customers received what they ordered and if they received it on time. It helps our Group to investigate improvement potential in the area of order book management and logistics processes. It therefore also helps us to improve our delivery performance, which is a major aspect when it comes to customer satisfaction. The OTIF assessment covers both the adidas and Reebok brands for our two biggest channels, Wholesale and Retail, in most of our key markets.
Employee engagement: To measure the level of engagement and motivation of all our employees, the adidas Group carries out employee engagement surveys. The surveys aim to provide key insight into how well as an employer we are doing in engaging our employees. It thus enables us to develop the right focus and future people strategies across our organisation. We aim to improve the overall engagement score in our next employee engagement survey, which will be conducted in 2016.
Sustainability performance: We have a strong commitment to enhance the social and environmental performance of our Group. By doing so, we firmly believe we will not only improve the Group’s overall reputation, but also increase our economic value. We have therefore implemented a comprehensive sustainability programme under which we regularly review our performance. We closely monitor our sustainability targets and have set ourselves clear milestones. A major focus lies on monitoring and rating our factories with regard to compliance with our Workplace Standards and rating the effectiveness of compliance systems. A rating tool helps us evaluate six fundamental elements of social compliance. We have a strong track record in sustainability reporting, with our Sustainability Progress Report being an integral part of this. All our social and environmental publications, which include more details and additional data, are provided on our corporate website.
see Glossary, p. 258
see Subsequent Events and Outlook, p. 146
see Global Operations, p. 66
see Employees, p. 82
see Sustainability, p. 89
see Sustainability, p. 89www.adidas-group.com/en/sustainability/reporting-policies-and-data/sustainability-reports

1022 0 1 4
Internal Group Management System
/ 03.1 /
adidas Group / 2014 Annual Report
Group Management Report – Financial Review
Structured performance measurement systemWe have developed an extensive performance measurement system, which utilises a variety of tools to measure the performance of the adidas Group. The Group’s key performance indicators as well as other important financial metrics are monitored and compared against initial targets as well as rolling forecasts on a monthly basis. When negative deviations exist between actual and target numbers, we perform a detailed analysis to identify and address the cause. If necessary, action plans are implemented to optimise the development of the Group’s operating performance. We also benchmark the Group’s financial results with those of our major competitors on a regular basis. To assess current sales and profitability development, management analyses sell-through information from our own-retail activities as well as short-term replenishment orders from retailers.
Taking into account year-to-date performance as well as opportunities and risks, the Group’s full year financial performance is forecasted four times a year. In this respect, also backlogs, sell-through data, feedback from customers and own-retail stores are assessed as available. Finally, as a further early indicator for future performance, the results of any relevant recent market and consumer research are assessed as available.
Enhanced integrated business planning and management approachIn order to further optimise profitability and working capital efficiency as well as operating cash flow development, 2014 saw the continuation of the Group-wide Integrated Business Planning initiative (IBP). This initiative focuses on developing and forming an enhanced forecasting approach by aligning processes and timelines of major business functions such as marketing, sales and operations at a market and global level. The centre-point of this approach is to improve the reliability of future business planning, leading to a new efficiency level of order book building and conversion. This, in turn, is expected to lead to improving full-margin business.
The whole process is set up in a rhythm and timeframe to facilitate full cross-functional alignment and forecasting clarity in advance of important business decision processes – in particular those related to product pricing, range building, material purchasing or production capacity fixing. To create a seamless flow between achieving our strategic objectives and implementing operational plans, we follow a rolling two-year time horizon. This ensures more focus on the mid-term perspective, while at the same time highlighting relevant information around short-term business events and volatilities. All target-setting is fully embedded into the integrated planning process and communicated in advance of all relevant business milestones.
see Glossary, p. 258

2Group Management Report – Financial Review
1032 0 1 4
/ 03.2 /
adidas Group / 2014 Annual Report
Group Business Performance / Economic and Sector Development
Group Business PerformanceIn 2014, adidas Group results were significantly impacted by a challenging golf market, negative currency effects and a weakening of consumer sentiment in Russia/CIS. Currency-neutral sales for the Group’s continuing operations increased 6% as a result of strong growth in Wholesale and Retail. In euro terms, adidas Group revenues grew 2% to € 14.534 billion from € 14.203 billion in 2013. The Group’s gross margin decreased 1.7 percentage points to 47.6% (2013: 49.3%), mainly due to negative currency effects, higher input costs, increased clearance activities in Russia/CIS as well as lower product margins at TaylorMade-adidas Golf. In 2014, the adidas Group incurred goodwill impairment losses of € 78 million (2013: € 52 million). These one-off expenses were non-cash in nature and did not affect the adidas Group’s liquidity. Excluding goodwill impairment losses, the Group’s operating profit from continuing operations declined 22% to € 961 million compared to € 1.233 billion in 2013, representing an operating margin of 6.6%, down 2.1 percentage points compared to the prior year (2013: 8.7%). This development was primarily due to the negative effects from the lower gross margin as well as higher other operating expenses as a percentage of sales. The Group’s net income from continuing operations, excluding goodwill impairment losses, decreased 22% to € 642 million. In 2014, the adidas Group incurred losses from discontinued operations of € 68 million (2013: gains from discontinued operations of € 17 million). As a result, net income attributable to shareholders from continuing and discontinued operations excluding goodwill impairment losses was down 32% to € 568 million (2013: € 839 million). Basic and diluted earnings per share from continuing and discontinued operations excluding goodwill impairment losses decreased 32% to € 2.72 from € 4.01 in 2013.
Economic and Sector Development
Global economy expands 2.6% in 2014In 2014, the global economy grew at a lower rate than initially projected, with global gross domestic product (GDP) modestly strengthening 2.6%. This weaker than expected global recovery mainly reflects accommodative monetary policies, declining commodity prices and weak international trade. Growth in major economies was disparate and developing countries recorded disappointing results, driven by lower external demand, political uncertainties and domestic policy tightening.
GDP in Western Europe grew 1.3% in 2014. While the UK gathered momentum and recorded robust expansion, the economies in the euro area grew only slightly after two years of recession. Most of the region’s economies were characterised by low inflationary pressures, relatively robust export activity and stable consumer spending. At the same time, high unemployment levels and lacklustre investment spending played a major role in the stuttering recovery.
European emerging markets recorded GDP growth of 2.3%. The deceleration from previous years was mainly the result of political unrest in Russia/Ukraine, sanctions and high inflationary pressures which resulted in lower consumer and investment spending. The further weakening of the rouble together with the continuous decline in oil prices put additional constraints on Russia’s growth.

1042 0 1 4
/ 03.2 /
adidas Group / 2014 Annual Report
Group Management Report – Financial ReviewGroup Business Performance / Economic and Sector Development
01 / Regional GDP development 1) (in %)
Global 2) Western Europe 3) European emerging markets 3)
USA 2) Asia 3) 4) Latin America 3)
5
4
3
2
1
0
–1
■ 2012 ■ 2013 ■ 2014 1) Real, percentage change versus prior year; 2012 and 2013 figures restated compared to prior year.2) Source: World Bank.3) Source: HSBC.4) Includes Japan and Area Pacific.
The US economy grew modestly in 2014, expanding 2.4%, despite a contraction in the first quarter. The recovery was supported by the Fed’s very accommodative monetary policy. In addition, an improving labour market and the decline in oil prices stimulated higher real household income, but a further appreciation of the US dollar may put the currently robust exports at risk.
Asia remained the fastest-growing region with 3.9% GDP growth, although this reflects a slowdown compared to previous years. In China, growth slowed marginally to 7.5% as policy measures introduced in an effort to control financial vulnerabilities were largely offset by growth-stimulating provisions to cushion the slowdown. Japan fell short of expectations with only 0.2% growth as the economy was unable to recover from the government’s sales tax increase in April, and exports remained sluggish despite the weakness of the yen. India emerged from two years of more modest growth, expanding 5.5% in 2014. This mainly reflects increasing export momentum and a sharp decline in inflation.
In Latin America, GDP development dropped to 1.0% with divergences across the region. While Central America remained strong, influenced by the strengthening activity in the USA, South America recorded a sharp slowdown in economic activity. In Brazil, declining commodity prices, contracting investments and election uncertainty drove a steep decline in growth. In Argentina, hard currency scarcity drove a contraction in economic activity.
Global sporting goods sector continues to growIn 2014, the global sporting goods industry grew at robust rates, supported by rising consumer spending in the emerging markets. The industry benefited particularly from the world’s largest sporting event, the FIFA World Cup in Brazil. The e-commerce channel continued to see rapid expansion, as retailers leveraged a wide variety of commercial opportunities across mobile technologies and social media. From a category perspective, basketball continued to enjoy strong momentum, while running grew at a slower pace but with modest improvements at year-end. Activities relating to the 2014 FIFA World Cup supported sales momentum in the football category throughout the year. In the outdoor category, the overall weakness in 2014 was reversed during the fall/winter season.

Group Management Report – Financial Review
1052 0 1 4
/ 03.2 /
adidas Group / 2014 Annual Report
Group Business Performance / Economic and Sector Development
03 / Quarterly development of Consumer Price Index 1)
(by region)
Q4 2013 Q1 2014 Q2 2014 Q3 2014 Q4 2014
USA 2) 1.5 1.5 2.1 1.7 0.8
Euro area 3) 0.8 0.5 0.5 0.3 (0.2)
Japan 4) 1.6 1.6 3.6 3.2 2.4
China 5) 2.5 2.4 2.3 1.6 1.5
Russia 6) 6.5 6.9 7.8 8.0 11.4
Brazil 7) 5.9 6.2 6.5 6.8 6.4
1) Quarter-end figures.2) Source: US Bureau of Labor Statistics.3) Source: Eurostat.4) Source: Japan Ministry of Internal Affairs and Communications.5) Source: China National Bureau of Statistics.6) Source: Russia Federal Service of State Statistics.7) Source: Brazil Institute of Geography and Statistics.
04 / Quarterly consumer confidence development 1)
(by region)
Q4 2013 Q1 2014 Q2 2014 Q3 2014 Q4 2014
USA 2) 77.5 83.9 86.4 89.0 93.1
Euro area 3) (13.5) (9.3) (7.5) (11.4) (10.9)
Japan 4) 40.0 36.9 40.5 39.6 37.5
China 5) 102.3 107.9 104.7 105.4 105.8
Russia 6) (11.0) (11.0) (6.0) (7.0) (18.0)
Brazil 7) 111.2 108.8 106.3 109.7 109.2
1) Quarter-end figures.2) Source: Conference Board.3) Source: European Commission.4) Source: Economic and Social Research Institute, Government of Japan.5) Source: China National Bureau of Statistics.6) Source: Russia Federal Service of State Statistics.7) Source: Brazil National Confederation of Industry.
02 / Quarterly unemployment rate by region 1)
(in % of total active population)
Q4 2013 Q1 2014 Q2 2014 Q3 2014 Q4 2014
USA 2) 7.0 6.6 6.2 6.1 5.7
Euro area 3) 11.8 11.7 11.5 11.5 11.4
Japan 4) 3.7 3.6 3.7 3.6 3.4
China 5) 4.1 4.1 4.1 4.1 4.1
Russia 6) 5.6 5.4 4.9 4.9 5.3
Brazil 7) 4.3 5.0 4.8 4.9 4.3
1) Quarter-end figures.2) Source: US Bureau of Labor Statistics.3) Source: Eurostat.4) Source: Japan Ministry of Internal Affairs and Communications.5) Source: China National Bureau of Statistics.6) Source: Russia Federal Service of State Statistics.7) Source: Brazil Institute of Geography and Statistics.
Western Europe saw a solid increase in the industry’s size, partly owing to the importance of football and the large number of teams from this region that qualified for the 2014 FIFA World Cup. Similarly, in many European emerging markets the significance of football and particularly Russia’s participation in Brazil supported the sector’s expansion.
In North America, the sporting goods industry grew modestly. The strong performance of the US team during the FIFA World Cup helped fuel strong football sales. Basketball footwear as well as apparel continued to be in strong demand, outperforming casual footwear and outdoor products. While the golf market was challenging through major parts of the year, as excess supply in retail channels led to the continuation of a highly promotional environment, fewer overall product launches led to a more healthy retail landscape and cleaner inventory levels at the end of the year.

1062 0 1 4
/ 03.2 /
adidas Group / 2014 Annual Report
Group Management Report – Financial ReviewGroup Business Performance / Income Statement
In Asia, rising disposable incomes and consumer spending promoted expansion of the sporting goods industry. This trend was particularly evident in China, supporting healthy industry sales growth, especially in the lower-tier cities. In India, the size of the sector continued to expand at double-digit rates.
The sporting goods industry in Latin America benefited from low unemployment levels and higher wages. Furthermore, given the significance of football in this region, the industry’s momentum was accelerated by sales relating to the 2014 FIFA World Cup in Brazil.
Income Statement
Focus on continuing operationsDue to the existence of a concrete plan to sell the Rockport operating segment, all income and expenses of the Rockport operating segment are reported as discontinued operations at year-end 2014. For the sake of clarity, all figures related to the 2013 and 2014 financial years in this report refer to the Group’s continuing operations unless otherwise stated.
On January 23, 2015, the adidas Group entered into a definitive agreement to sell its Rockport operating segment to a new entity formed by Berkshire Partners and New Balance as part of ongoing efforts to better focus on our core activities. The transaction, which is subject to customary closing conditions, is expected to be completed later in 2015.
adidas Group currency-neutral sales increase 6% in 2014In 2014, Group revenues increased 6% on a currency-neutral basis, driven by a double-digit sales increase in Retail and mid-single-digit growth in Wholesale. Currency translation effects had a negative impact on sales in euro terms. Group revenues grew 2% to € 14.534 billion in 2014 from € 14.203 billion in 2013.
see Diagram 07
06 / 2014 oil price development 1) (in US $ per barrel)
| Jan. 1, 2014 Dec. 31, 2014 |
100
70
40
1) West Texas Intermediate Cushing crude oil. Source: Bloomberg.
05 / Exchange rate development 1) (€ 1 equals)
Averagerate
2013
Q1 2014 Q2 2014 Q3 2014 Q4 2014 Averagerate
2014
USD 1.3283 1.3788 1.3658 1.2583 1.2141 1.3296
GBP 0.8492 0.8282 0.8015 0.7773 0.7789 0.8066
JPY 129.58 142.42 138.44 138.11 145.23 140.44
RUB 42.298 49.205 45.933 49.560 68.303 50.737
CNY 8.1674 8.4825 8.4035 7.7417 7.4291 8.1919
1) Spot rates at quarter-end.

Group Management Report – Financial Review
1072 0 1 4
/ 03.2 /
adidas Group / 2014 Annual Report
Group Business Performance / Income Statement
Group sales increase driven by strong growth in Wholesale and RetailIn 2014, currency-neutral Wholesale revenues increased 6%. While sales at adidas grew at a mid-single-digit rate, revenues at Reebok remained stable compared to the prior year. Currency-neutral Retail sales were up 21% versus the prior year as a result of double-digit sales increases at adidas and Reebok. Revenues in Other Businesses were down 19% on a currency-neutral basis, due to double-digit sales declines at TaylorMade-adidas Golf. Currency translation effects had a negative impact on segmental sales in euro terms. Wholesale revenues increased 3% to € 9.376 billion in 2014 from € 9.100 billion in 2013. Retail sales rose 11% to € 3.842 billion versus € 3.446 billion in the prior year. Sales in Other Businesses declined 21% to € 1.316 billion (2013: € 1.657 billion).
Currency-neutral sales grow in nearly all regionsIn 2014, currency-neutral adidas Group sales grew in all regions except North America. Revenues in Western Europe increased 8% on a currency-neutral basis, driven by strong sales growth in Germany, the UK, France and Spain. In European Emerging Markets, Group sales were up 19% on a currency-neutral basis, with double-digit sales increases in all of the region’s major markets. Currency-neutral sales for the adidas Group in North America decreased 6%, mainly due to sales declines in the USA. Sales in Greater China increased 10% on a currency-neutral basis. Currency-neutral revenues in Other Asian Markets grew 2%, driven by sales increases in South Korea and India. In Latin America, sales grew 19% on a currency-neutral basis with double-digit increases in most markets, in particular Argentina, Mexico and Brazil. Currency translation effects had a mixed impact on regional sales in euro terms.
see Table 11
07 / Net sales 1) 2) (€ in millions)
2014 14,534
2013 14,203
2012 14,883
2011 13,322
2010 11,990
1) 2014 and 2013 reflect continuing operations as a result of the planned divestiture of the Rockport business.
2) 2011 restated according to IAS 8 in the 2012 consolidated financial statements.
10 / Net sales by segment
1) Figures reflect continuing operations as a result of the planned divestiture of the Rockport business.
1 / 65% Wholesale2 / 26% Retail3 / 9% Other Businesses 1)
09 / Net sales by region 1)
1) Figures reflect continuing operations as a result of the planned divestiture of the Rockport business.
1 / 28% Western Europe2 / 20% North America3 / 14% Other Asian Markets4 / 13% European Emerging Markets5 / 12% Greater China6 / 11% Latin America
08 / Net sales by quarter 1) (€ in millions)
Q4 2014 3,610Q4 2013 3,391
Q3 2014 4,044Q3 2013 3,807
Q2 2014 3,400Q2 2013 3,314
Q1 2014 3,480Q1 2013 3,690
1) Figures reflect continuing operations as a result of the planned divestiture of the Rockport business.
2014 1
2
3
2014
6
5 1
2 3
4

1082 0 1 4
/ 03.2 /
adidas Group / 2014 Annual Report
Group Management Report – Financial ReviewGroup Business Performance / Income Statement
Currency-neutral Group sales up in footwear and apparelIn 2014, currency-neutral footwear sales increased 5%, mainly due to double-digit sales growth in the running category and at adidas NEO. Sales at adidas Originals were up at a high-single-digit rate. Apparel revenues grew 12% on a currency-neutral basis. This development reflects double-digit growth in the football and running categories as well as at adidas Originals and at adidas NEO. Currency-neutral hardware sales were down 9% compared to the prior year. This was primarily due to significant declines at TaylorMade-adidas Golf, which more than offset double-digit sales increases in the football and training categories. Currency translation effects had a negative impact on sales in euro terms.
Cost of sales increasesCost of sales is defined as the amount we pay to third parties for expenses associated with producing and delivering our products. In addition, own-production expenses are also included in the Group’s cost of sales. However, these expenses represent only a very small portion of total cost of sales.
see Table 12
11 / Net sales by region 1) (€ in millions)
2014 2013 Change Change (currency-neutral)
Western Europe 4,112 3,777 9% 8%
European Emerging Markets 1,932 1,867 4% 19%
North America 2,972 3,203 (7%) (6%)
Greater China 1,811 1,655 9% 10%
Other Asian Markets 2,085 2,135 (2%) 2%
Latin America 1,622 1,568 3% 19%
Total 2) 14,534 14,203 2% 6%
1) Figures reflect continuing operations as a result of the planned divestiture of the Rockport business.2) Rounding differences may arise in totals.
12 / Net sales by product category 1) (€ in millions)
2014 2013 Change Change (currency-neutral)
Footwear 6,658 6,587 1% 5%
Apparel 6,279 5,811 8% 12%
Hardware 1,597 1,806 (12%) (9%)
Total 2) 14,534 14,203 2% 6%
1) Figures reflect continuing operations as a result of the planned divestiture of the Rockport business.2) Rounding differences may arise in totals.
13 / Net sales by product category 1)
1) Figures reflect continuing operations as a result of the planned divestiture of the Rockport business.
1 / 46% Footwear2 / 43% Apparel3 / 11% Hardware
14 / Gross profit 1) 2) (€ in millions)
2014 6,924
2013 7,001
2012 7,103
2011 6,329
2010 5,730
1) 2014 and 2013 reflect continuing operations as a result of the planned divestiture of the Rockport business.
2) 2011 restated according to IAS 8 in the 2012 consolidated financial statements.
2014 1
2
3
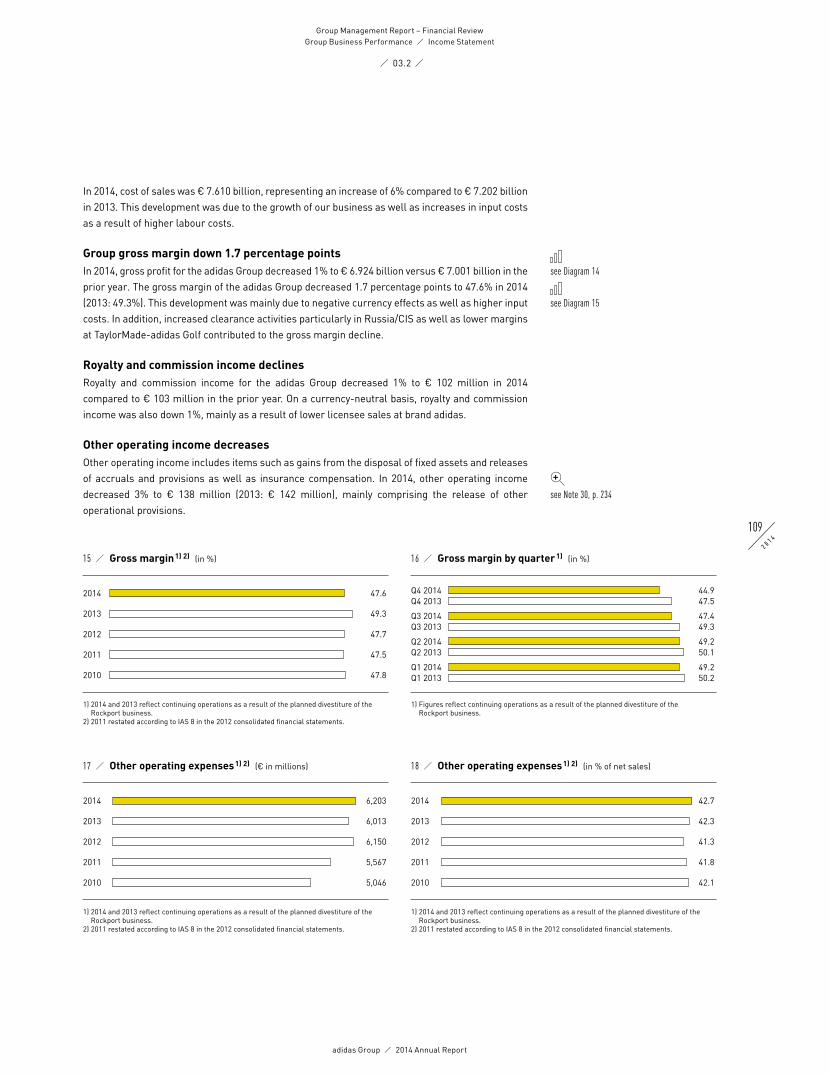
Group Management Report – Financial Review
1092 0 1 4
/ 03.2 /
adidas Group / 2014 Annual Report
Group Business Performance / Income Statement
In 2014, cost of sales was € 7.610 billion, representing an increase of 6% compared to € 7.202 billion in 2013. This development was due to the growth of our business as well as increases in input costs as a result of higher labour costs.
Group gross margin down 1.7 percentage pointsIn 2014, gross profit for the adidas Group decreased 1% to € 6.924 billion versus € 7.001 billion in the prior year. The gross margin of the adidas Group decreased 1.7 percentage points to 47.6% in 2014 (2013: 49.3%). This development was mainly due to negative currency effects as well as higher input costs. In addition, increased clearance activities particularly in Russia/CIS as well as lower margins at TaylorMade-adidas Golf contributed to the gross margin decline.
Royalty and commission income declinesRoyalty and commission income for the adidas Group decreased 1% to € 102 million in 2014 compared to € 103 million in the prior year. On a currency-neutral basis, royalty and commission income was also down 1%, mainly as a result of lower licensee sales at brand adidas.
Other operating income decreases Other operating income includes items such as gains from the disposal of fixed assets and releases of accruals and provisions as well as insurance compensation. In 2014, other operating income decreased 3% to € 138 million (2013: € 142 million), mainly comprising the release of other operational provisions.
see Diagram 14
see Diagram 15
see Note 30, p. 234
15 / Gross margin 1) 2) (in %)
2014 47.6
2013 49.3
2012 47.7
2011 47.5
2010 47.8
1) 2014 and 2013 reflect continuing operations as a result of the planned divestiture of the Rockport business.
2) 2011 restated according to IAS 8 in the 2012 consolidated financial statements.
17 / Other operating expenses 1) 2) (€ in millions)
2014 6,203
2013 6,013
2012 6,150
2011 5,567
2010 5,046
1) 2014 and 2013 reflect continuing operations as a result of the planned divestiture of the Rockport business.
2) 2011 restated according to IAS 8 in the 2012 consolidated financial statements.
18 / Other operating expenses 1) 2) (in % of net sales)
2014 42.7
2013 42.3
2012 41.3
2011 41.8
2010 42.1
1) 2014 and 2013 reflect continuing operations as a result of the planned divestiture of the Rockport business.
2) 2011 restated according to IAS 8 in the 2012 consolidated financial statements.
16 / Gross margin by quarter 1) (in %)
Q4 2014 44.9Q4 2013 47.5
Q3 2014 47.4Q3 2013 49.3
Q2 2014 49.2Q2 2013 50.1
Q1 2014 49.2Q1 2013 50.2
1) Figures reflect continuing operations as a result of the planned divestiture of the Rockport business.

1102 0 1 4
/ 03.2 /
adidas Group / 2014 Annual Report
Group Management Report – Financial ReviewGroup Business Performance / Income Statement
Other operating expenses as a percentage of sales up 0.3 percentage pointsOther operating expenses, including depreciation and amortisation, consist of items such as sales working budget, marketing working budget and operating overhead costs. In 2014, other operating expenses increased 3% to € 6.203 billion (2013: € 6.013 billion), as a result of higher expenditure related to the expansion of the Group’s own-retail activities as well as an increase in sales and marketing working budget expenditure. As a percentage of sales, other operating expenses increased 0.3 percentage points to 42.7% from 42.3% in 2013.
Sales working budget as a percentage of sales increases 0.2 percentage pointsSales working budget consists of expenses to support the Group’s sell-through development. Expenditures relate to advertising and promotion initiatives at the point of sale as well as store furniture and fixtures. As sales working budget expenses are channel specific, they are allocated to the Group’s operating segments. In absolute terms, sales working budget expenditure increased 12% to € 375 million in 2014 from € 336 million in the prior year. This development was mainly a result of higher expenditure related to the expansion of the Group’s own-retail activities. By brand, adidas sales working budget increased 13% to € 287 million compared to € 253 million in the prior year. Sales working budget for Reebok grew 12% to € 60 million at year-end (2013: € 53 million). The Group’s sales working budget as a percentage of sales increased 0.2 percentage points to 2.6% (2013: 2.4%).
Marketing working budget as a percentage of sales grows 0.4 percentage pointsMarketing working budget consists of items such as expenses for promotion partnerships, advertising and public relations. As marketing working budget expenses are not distribution channel specific, they are not allocated to the segments. In absolute terms, marketing working budget increased 7% to € 1.548 billion in 2014 (2013: € 1.451 billion) due to higher expenditure at both adidas and Reebok. By brand, the adidas marketing working budget grew 9% to € 1.245 billion from € 1.147 billion in 2013. Marketing working budget of the Reebok brand was up 6% to € 160 million (2013: € 150 million). The Group’s marketing working budget as a percentage of sales increased 0.4 percentage points to 10.6% (2013: 10.2%).
see Glossary, p. 258see Diagram 17
see Note 31, p. 234
see Diagram 18
see Diagram 20
see Diagram 21
19 / Other operating expenses by area 1) (€ in millions)
2014 2013
Sales working budget 375 336
Marketing working budget 1,548 1,451
Marketing overhead 427 420
Sales force 1,915 1,815
Logistics 763 753
Research & development 126 124
Central administration 1,050 1,114
Total 6,203 6,013
■ 2014 ■ 2013
1) Figures reflect continuing operations as a result of the planned divestiture of the Rockport business.

Group Management Report – Financial Review
1112 0 1 4
/ 03.2 /
adidas Group / 2014 Annual Report
Group Business Performance / Income Statement
Operating overhead expenses as a percentage of sales decrease 0.3 percentage pointsGroup operating overheads include overhead costs related to marketing, logistics, sales and R&D as well as central administration. Almost half of the operating overhead expenses are related to personnel costs. In absolute terms, operating overhead expenses grew 1% to € 4.280 billion in 2014 versus € 4.226 billion in 2013. This was primarily a result of the expansion of the Group’s own-retail activities, more than offsetting a decrease in central administration costs. As a percentage of sales, operating overhead expenses declined 0.3 percentage points to 29.4% (2013: 29.8%).
Number of Group employees up 8%At the end of December 2014, the Group employed 53,731 people. This represents an increase of 8% versus the prior year level of 49,808. New hirings related to the expansion of the Group’s own-retail store base were the main driver of this development. On a full-time equivalent basis, the number of employees increased 7% to 45,917 at the end of 2014 (2013: 42,758).
EBITDA decreases 14%The Group’s earnings before interest, taxes, depreciation and amortisation as well as impairment losses/reversal of impairment losses on property, plant and equipment and intangible assets (EBITDA) decreased 14% to € 1.283 billion in 2014 (2013: € 1.496 billion). Depreciation and amortisation expense for tangible and intangible assets (excluding impairment losses/reversal of impairment losses) increased 10% to € 309 million in 2014 (2013: € 281 million). This development is mainly due to an increase in property, plant and equipment. In accordance with IFRS, intangible assets with indefinite useful lives (goodwill and trademarks) are tested annually and additionally when there are indications of potential impairment. In this connection, impairment of intangible assets with unlimited useful lives was incurred in 2014.
see Employees, p. 82
see Diagram 22
20 / Sales working budget 1) 2) (in % of net sales)
2014 2.6
2013 2.4
2012 2.0
2011 2.5
1) 2014 and 2013 reflect continuing operations as a result of the planned divestiture of the Rockport business.
2) 2011 restated according to IAS 8 in the 2012 consolidated financial statements.
21 / Marketing working budget 1) 2) (in % of net sales)
2014 10.6
2013 10.2
2012 10.1
2011 10.2
1) 2014 and 2013 reflect continuing operations as a result of the planned divestiture of the Rockport business.
2) 2011 restated according to IAS 8 in the 2012 consolidated financial statements.
22 / EBITDA 1) 2) (€ in millions)
2014 1,283
2013 1,496
2012 1,445
2011 1,199
2010 1,159
1) 2014 and 2013 reflect continuing operations as a result of the planned divestiture of the Rockport business.
2) 2011 restated according to IAS 8 in the 2012 consolidated financial statements.

1122 0 1 4
/ 03.2 /
adidas Group / 2014 Annual Report
Group Management Report – Financial ReviewGroup Business Performance / Income Statement
Goodwill impairment in an amount of € 78 millionAs a result of the annual impairment test, the adidas Group has impaired goodwill and recorded a € 78 million pre-tax charge as at December 31, 2014 (2013: € 52 million). This charge was related to the Retail cash-generating unit Russia/CIS. As a result, the goodwill of this cash-generating unit is completely impaired. The impairment losses were mainly caused by adjusted growth assumptions due to the significant deterioration of the Russian rouble. In 2013, goodwill impairment losses of € 23 million were recognised within the Wholesale cash-generating unit Iberia. Within the Retail cash-generating unit North America, goodwill impairment losses of € 29 million were recognised in 2013. Both impairment losses were mainly caused by adjusted growth assumptions and an increase in the country-specific discount rates. The impairment losses in both years were non-cash in nature and do not affect the adidas Group’s liquidity.
Operating margin excluding goodwill impairment declines to 6.6%Group operating profit declined 25% to € 883 million in 2014 versus € 1.181 billion in 2013. The operating margin of the adidas Group decreased 2.2 percentage points to 6.1% (2013: 8.3%). Excluding the goodwill impairment losses, operating profit was down 22% to € 961 million from € 1.233 billion last year, representing an operating margin of 6.6%, down 2.1 percentage points (2013: 8.7%). This development was primarily due to the negative effects from the lower gross margin as well as higher other operating expenses as a percentage of sales.
Financial income down 27%Financial income declined 27% to € 19 million in 2014 from € 26 million in the prior year, due to a decrease in interest income.
Financial expenses down 28%Financial expenses decreased 28% to € 67 million in 2014 (2013: € 94 million). This development was the result of a decrease in both negative exchange rate effects as well as interest expenses.
see Note 02, p. 197
see Diagram 23
see Diagram 25
see Note 33, p. 235
see Diagram 26see Note 33, p. 235
23 / Operating profit 1) 2) 3) 4) 5) (€ in millions)
2014 961
2013 1,233
2012 1,185
2011 953
2010 894
1) 2014 and 2013 reflect continuing operations as a result of the planned divestiture of the Rockport business.
2) 2014 exluding goodwill impairment of € 78 million. 3) 2013 excluding goodwill impairment of € 52 million. 4) 2012 excluding goodwill impairment of € 265 million. 5) 2011 restated according to IAS 8 in the 2012 consolidated financial statements.
24 / Operating profit by quarter 1) (€ in millions)
Q4 2014 2) 38Q4 2013 3) 85
Q3 2014 399Q3 2013 457
Q2 2014 218Q2 2013 247
Q1 2014 306Q1 2013 445
1) Figures reflect continuing operations as a result of the planned divestiture of the Rockport business.
2) Excluding goodwill impairment of € 78 million. 3) Excluding goodwill impairment of € 52 million.

Group Management Report – Financial Review
1132 0 1 4
/ 03.2 /
adidas Group / 2014 Annual Report
Group Business Performance / Income Statement
Income before taxes excluding goodwill impairment down 22%Income before taxes (IBT) for the adidas Group decreased 25% to € 835 million from € 1.113 billion in 2013. IBT as a percentage of sales declined 2.1 percentage points to 5.7% in 2014 (2013: 7.8%). Excluding the goodwill impairment losses, IBT was down 22% to € 913 million from € 1.165 billion in 2013 and, as a percentage of sales, decreased 1.9 percentage points to 6.3 % from 8.2% in the prior year.
Net income from continuing operations excluding goodwill impairment declines 22%The Group’s net income from continuing operations decreased 27% to € 564 million in 2014 from € 773 million in 2013. Excluding the goodwill impairment losses, net income from continuing operations was down 22% to € 642 million (2013: € 825 million). The Group’s tax rate increased 1.9 percentage points to 32.5% in 2014 (2013: 30.5%), mainly due to a less favourable earnings mix. Excluding the goodwill impairment losses, the effective tax rate grew 0.5 percentage points to 29.7% from 29.2% in 2013.
Losses from discontinued operations total € 68 millionIn 2014, the Group incurred losses from discontinued operations of € 68 million, net of tax, related to the Rockport operating segment, which is planned to be divested during the course of 2015 (2013: gains from discontinued operations of € 17 million). Losses from discontinued operations in 2014 were mainly due to the loss recognised on the measurement to fair value less cost to sell, net of tax, in the amount of negative € 82 million, partly offset by income from Rockport’s operating activities of € 14 million.
see Diagram 27
see Note 34, p. 236
see Note 03, p. 206
25 / Operating margin 1) 2) 3) 4) 5) (in %)
2014 6.6
2013 8.7
2012 8.0
2011 7.2
2010 7.5
1) 2014 and 2013 reflect continuing operations as a result of the planned divestiture of the Rockport business.
2) 2014 exluding goodwill impairment of € 78 million. 3) 2013 excluding goodwill impairment of € 52 million. 4) 2012 excluding goodwill impairment of € 265 million. 5) 2011 restated according to IAS 8 in the 2012 consolidated financial statements.
26 / Financial expenses 1) (€ in millions)
2014 67
2013 94
2012 105
2011 115
2010 113
1) 2011 restated according to IAS 8 in the 2012 consolidated financial statements.
27 / Income before taxes 1) 2) 3) 4) 5) (€ in millions)
2014 913
2013 1,165
2012 1,116
2011 869
2010 806
1) 2014 and 2013 reflect continuing operations as a result of the planned divestiture of the Rockport business.
2) 2014 exluding goodwill impairment of € 78 million. 3) 2013 excluding goodwill impairment of € 52 million. 4) 2012 excluding goodwill impairment of € 265 million. 5) 2011 restated according to IAS 8 in the 2012 consolidated financial statements.
28 / Income before taxes by quarter 1) (€ in millions)
Q4 2014 2) 25Q4 2013 3) 68
Q3 2014 392Q3 2013 436
Q2 2014 203Q2 2013 232
Q1 2014 294Q1 2013 430
1) Figures reflect continuing operations as a result of the planned divestiture of the Rockport business.
2) Excluding goodwill impairment of € 78 million. 3) Excluding goodwill impairment of € 52 million.

1142 0 1 4
/ 03.2 /
adidas Group / 2014 Annual Report
Group Management Report – Financial ReviewGroup Business Performance / Income Statement
Net income attributable to shareholders excluding goodwill impairment down 32%The Group’s net income attributable to shareholders, which in addition to net income from continuing operations includes net income from discontinued operations, decreased to € 490 million in 2014 from € 787 million in 2013. This represents a decline of 38% versus the prior year level. Excluding the goodwill impairment losses, net income attributable to shareholders decreased 32% to € 568 million (2013: € 839 million).
Earnings per share from continuing and discontinued operations excluding goodwill impairment reach € 2.72Basic and diluted earnings per share (EPS) from continuing operations declined 27% to € 2.67 in 2014 (2013: € 3.68). Excluding the goodwill impairment losses, basic and diluted EPS from continuing operations decreased 22% to € 3.05 last year from € 3.93 in 2013. The Group’s basic and diluted EPS from continuing and discontinued operations amounted to € 2.35 (2013: € 3.76), representing a decrease of 37%. Excluding goodwill impairment losses, basic and diluted EPS from continuing and discontinued operations were down 32% to € 2.72 (2013: € 4.01). The weighted average number of shares used in the calculation was 208,776,457 (2013: 209,216,186).
see Diagram 29
see Diagram 31
see Note 35, p. 238
31 / Diluted earnings per share 1) 2) 3) 4) 5) (in €)
2014 2.72
2013 4.01
2012 3.78
2011 2.93
2010 2.71
1) Includes continuing and discontinued operations.2) 2014 exluding goodwill impairment of € 78 million. 3) 2013 excluding goodwill impairment of € 52 million. 4) 2012 excluding goodwill impairment of € 265 million. 5) 2011 restated according to IAS 8 in the 2012 consolidated financial statements.
29 / Net income attributable to shareholders 1) 2) 3) 4) 5)
(€ in millions)
2014 568
2013 839
2012 791
2011 613
2010 567
1) Includes continuing and discontinued operations.2) 2014 exluding goodwill impairment of € 78 million. 3) 2013 excluding goodwill impairment of € 52 million. 4) 2012 excluding goodwill impairment of € 265 million. 5) 2011 restated according to IAS 8 in the 2012 consolidated financial statements.
30 / Net income attributable to shareholders by quarter 1)
(€ in millions)
Q4 2014 2) (62)Q4 2013 3) 42
Q3 2014 282Q3 2013 316
Q2 2014 144Q2 2013 172
Q1 2014 204Q1 2013 308
1) Includes continuing and discontinued operations.2) Excluding goodwill impairment of € 78 million. 3) Excluding goodwill impairment of € 52 million.
32 / Diluted earnings per share by quarter 1) (in €)
Q4 2014 2) (0.30)Q4 2013 3) 0.20
Q3 2014 1.35Q3 2013 1.51
Q2 2014 0.69Q2 2013 0.82
Q1 2014 4) 0.96Q1 2013 1.47
1) Includes continuing and discontinued operations.2) Excluding goodwill impairment of € 78 million. 3) Excluding goodwill impairment of € 52 million. 4) Weighted average number of shares: 215,233,140.

Group Management Report – Financial Review
1152 0 1 4
/ 03.2 /
adidas Group / 2014 Annual Report
Group Business Performance / Statement of Financial Position and Statement of Cash Flows
Statement of Financial Position and Statement of Cash Flows
Accounting policyThe Group’s consolidated financial statements are prepared in accordance with the International Financial Reporting Standards (IFRS), as adopted by the EU. In 2014, new standards and interpretations and amendments to existing standards and interpretations were applicable. The changes mainly require additional disclosures in the Group’s financial statements.
Planned Rockport divestiture impacts balance sheet itemsAt December 31, 2014, all assets and liabilities of the Rockport operating segment are presented as assets and liabilities classified as held for sale due to the existence of a concrete plan to sell this operating segment. At the end of 2014, assets of € 260 million and liabilities of € 46 million were allocated to the Rockport operating segment. However, a restatement of the 2013 balance sheet items is not allowed under IFRS.
see Note 01, p. 196
see Note 03, p. 206
33 / Structure of statement of financial position 1) (in % of total assets)
2014 2013
Assets (€ in millions) 12,417 11,599
Cash and cash equivalents 13.6% 13.7%
Accounts receivable 15.7% 15.6%
Inventories 20.3% 22.7%
Fixed assets 35.0% 35.7%
Other assets 15.4% 12.3%
■ 2014 ■ 2013
1) For absolute figures see adidas AG Consolidated Statement of Financial Position, p. 190.
34 / Structure of statement of financial position 1) (in % of total liabilities and equity)
2014 2013
Liabilities and equity (€ in millions) 12,417 11,599
Short-term borrowings 2.3% 5.9%
Accounts payable 13.3% 15.7%
Long-term borrowings 12.8% 5.6%
Other liabilities 26.4% 25.5%
Total equity 45.2% 47.3%
■ 2014 ■ 2013
1) For absolute figures see adidas AG Consolidated Statement of Financial Position, p. 190.

1162 0 1 4
/ 03.2 /
adidas Group / 2014 Annual Report
Group Management Report – Financial ReviewGroup Business Performance / Statement of Financial Position and Statement of Cash Flows
AssetsAt the end of December 2014, total assets increased 7% to € 12.417 billion versus € 11.599 billion in the prior year, as a result of an increase in current as well as in non-current assets. The share of current assets and non-current assets within total assets remained unchanged at 59% and 41% at the end of December 2014 (2013: 59% and 41%).
Total current assets increased 7% to € 7.347 billion at the end of December 2014 compared to € 6.857 billion in 2013. Cash and cash equivalents increased 6% to € 1.683 billion at the end of December 2014 from € 1.587 billion in the prior year, as net cash generated from operating activities was only partly offset by net cash used in investing and financing activities. Currency effects had a positive impact on cash and cash equivalents in an amount of € 50 million. Group inventories decreased 4% to € 2.526 billion at the end of December 2014 versus € 2.634 billion in 2013. On a currency-neutral basis, inventories decreased 1%, mainly as a result of the transfer of Rockport inventories to assets classified as held for sale. Inventories from continuing operations decreased 1% (+2% currency-neutral), reflecting the Group’s focus on inventory management. Short-term financial assets declined 88% to € 5 million at the end of December 2014 from € 41 million in 2013. This development was driven by the decrease in short-term cash investments. Group receivables increased 8% to € 1.946 billion at the end of December 2014 (2013: € 1.809 billion). On a currency-neutral basis, receivables were up 2%. Receivables from continuing operations increased 10% (+5% currency-neutral), reflecting the growth of our business during the fourth quarter of 2014. Other current financial assets more than doubled to € 398 million at the end of December 2014 from € 183 million in 2013. This development was driven by an increase in the fair value of financial
see Diagram 35
see Note 09, p. 209
see Diagram 36
see Note 06, p. 207
see Note 07, p. 208
see Diagram 37
see Note 08, p. 208
35 / Total assets 1) (€ in millions)
2014 12,417
2013 11,599
2012 11,651
2011 11,237
2010 10,618
1) 2011 restated according to IAS 8 in the 2012 consolidated financial statements.
36 / Inventories 1) (€ in millions)
2014 2,526
2013 2,634
2012 2,486
2011 2,502
2010 2,119
1) 2011 restated according to IAS 8 in the 2012 consolidated financial statements.
37 / Accounts receivable 1) (€ in millions)
2014 1,946
2013 1,809
2012 1,688
2011 1,595
2010 1,667
1) 2011 restated according to IAS 8 in the 2012 consolidated financial statements.
38 / Accounts payable 1) (€ in millions)
2014 1,652
2013 1,825
2012 1,790
2011 1,887
2010 1,694
1) 2011 restated according to IAS 8 in the 2012 consolidated financial statements.

Group Management Report – Financial Review
1172 0 1 4
/ 03.2 /
adidas Group / 2014 Annual Report
Group Business Performance / Statement of Financial Position and Statement of Cash Flows
instruments. Other current assets decreased 16% to € 425 million at the end of December 2014 from € 506 million in 2013, mainly due to the decrease in prepayments.
Total non-current assets grew 7% to € 5.070 billion at the end of December 2014 from € 4.742 billion in 2013. Fixed assets increased 5% to € 4.346 billion at the end of December 2014 versus € 4.144 billion in 2013. Fixed assets include property, plant and equipment, goodwill, trademarks and other intangible assets as well as long-term financial assets. Additions of € 569 million were primarily related to the continued expansion of our own-retail activities, investments into the Group’s logistics infrastructure and IT systems, the acquisition of Luta Ltd. as well as the further development of the Group’s headquarters in Herzogenaurach. In addition, in 2014 the Group acquired its North American Distribution Centre in Spartanburg, South Carolina (USA), which was previously leased. Currency translation effects of € 290 million also contributed to the increase in fixed assets. Additions were partly offset by depreciation and amortisation of € 333 million, goodwill impairment of € 78 million, disposals of € 23 million as well as the reclassification of the net book value of Rockport fixed assets to assets classified as held for sale of € 224 million. The majority of goodwill is primarily related to the acquisition of the Reebok business in 2006. At the end of December 2014, goodwill decreased 3% to € 1.169 billion from € 1.204 billion in the prior year. The decrease is mainly related to goodwill impaired of € 78 million, in connection with the Group’s retail cash-generating unit Russia/CIS, caused by adjusted growth assumptions due to the significant deterioration of the Russian rouble. Other non-current financial assets grew 40% to € 42 million at the end of December 2014 from € 30 million in 2013.
see Note 10, p. 209
see Note 02, p. 197see Note 13, p. 211
see Note 16, p. 213
41 / Average operating working capital 1) 2) (in % of net sales)
2014 22.4
2013 21.3
2012 20.0
2011 20.4
2010 20.8
1) 2014 and 2013 reflect continuing operations as a result of the planned divestiture of the Rockport business.
2) 2011 restated according to IAS 8 in the 2012 consolidated financial statements.
39 / Shareholders’ equity 1) (€ in millions)
2014 5,624
2013 5,489
2012 5,304
2011 5,137
2010 4,616
1) 2011 restated according to IAS 8 in the 2012 consolidated financial statements.
40 / Operating working capital 1) (€ in millions)
Q4 2014 2,821Q4 2013 2,618
Q3 2014 3,689Q3 2013 3,273
Q2 2014 3,213Q2 2013 2,895
Q1 2014 3,280Q1 2013 3,324
1) Figures reflect continuing operations as a result of the planned divestiture of the Rockport business.

1182 0 1 4
/ 03.2 /
adidas Group / 2014 Annual Report
Group Management Report – Financial ReviewGroup Business Performance / Statement of Financial Position and Statement of Cash Flows
Liabilities and equityTotal current liabilities decreased 7% to € 4.378 billion at the end of December 2014 from € 4.732 billion in 2013. Accounts payable were down 9% to € 1.652 billion at the end of December 2014 versus € 1.825 billion in 2013. On a currency-neutral basis, accounts payable decreased 11%, partly as a result of the transfer of Rockport accounts payable to liabilities classified as held for sale. Accounts payable from continuing operations decreased 8% (-10% currency-neutral), reflecting the lower sourcing activity during the fourth quarter of 2014 compared to the prior year. At the end of December 2014, other current financial liabilities decreased 20% to € 91 million from € 113 million in 2013, primarily as a result of the decrease in the negative fair value of financial instruments. Short-term borrowings declined 58% to € 288 million at the end of December 2014 (2013: € 681 million). The repayment of the Group’s Eurobond, which matured in July 2014, was partly offset by an increase in bank borrowings. Other current provisions were up 4% to € 470 million at the end of December 2014 versus € 450 million in 2013. This primarily relates to an increase in provisions for warranties and returns. Currency translation effects of € 14 million also contributed to the increase in other current provisions. Current accrued liabilities grew 9% to € 1.249 billion at the end of December 2014 from € 1.147 billion in 2013, mainly due to an increase in accruals for customer discounts. Currency translation effects of € 61 million also contributed to the increase in current accrued liabilities. Other current liabilities were up 4% to € 287 million at the end of 2014 from € 276 million in 2013, mainly due to an increase in tax liabilities other than income taxes.
see Diagram 38
see Note 19, p. 215
see Note 20, p. 215
see Note 21, p. 216
see Note 22, p. 216
42 / Capital expenditure by segment
43 / Capital expenditure by region
2014 20141 / 58% HQ/Consolidation2 / 24% Retail3 / 13% Wholesale4 / 5% Other Businesses
1 / 37% North America2 / 27% Western Europe3 / 14% Greater China4 / 7% European Emerging Markets5 / 7% Other Asian Markets6 / 7% Latin America
1
1
2 3
2
3 5 4 6
4
44 / Capital expenditure by type
20141 / 55% Other2 / 24% Own-retail activities3 / 12% Retailer support4 / 9% IT
1 2
3
4
45 / Net borrowings/EBITDA 1)
2014 0.1
2013 (0.2)
2012 (0.3)
2011 (0.1)
2010 0.2
1) 2014 and 2013 reflect continuing operations as a result of the planned divestiture of the Rockport business.

Group Management Report – Financial Review
1192 0 1 4
/ 03.2 /
adidas Group / 2014 Annual Report
Group Business Performance / Statement of Financial Position and Statement of Cash Flows
Total non-current liabilities increased 75% to € 2.422 billion at the end of December 2014 from € 1.386 billion in the prior year. Long-term borrowings increased to € 1.584 billion at the end of December 2014 from € 653 million in the prior year. This development was primarily due to the issuance of two Eurobonds with an overall volume of € 1 billion.
Shareholders’ equity increased 2% to € 5.624 billion at the end of December 2014 versus € 5.489 billion in 2013. The net income generated during the last twelve months, positive currency translation effects of € 106 million as well as an increase in hedging reserves of € 210 million were the main contributors to this development. This was partly offset by the dividend of € 314 million paid to shareholders for the 2013 financial year as well as the repurchase of treasury shares in an amount of € 300 million. The Group’s equity ratio at the end of December 2014 decreased to 45.3% compared to 47.3% in the prior year.
Operating working capitalOperating working capital increased 8% to € 2.821 billion at the end of December 2014 compared to € 2.618 billion in 2013. Operating working capital from continuing operations increased 12% (+13% currency-neutral). This was mainly due to the increase in accounts receivable, reflecting the growth of our business during the fourth quarter of 2014, as well as lower accounts payable at the end of 2014. Average operating working capital as a percentage of sales from continuing operations increased 1.0 percentage points to 22.4% (2013: 21.3%).
Investment analysisCapital expenditure is defined as the total cash expenditure for the purchase of tangible and intangible assets (excluding acquisitions). Group capital expenditure increased 16% to € 554 million in 2014 (2013: € 479 million). Capital expenditure in property, plant and equipment amounted to € 504 million and was thus above the prior year level of € 427 million. The Group invested € 50 million in intangible assets, representing a 4% decrease compared to the prior year (2013: € 52 million). Depreciation and amortisation excluding impairment losses/reversal of impairment losses of tangible and intangible assets increased 10% to € 309 million in 2014 (2013: € 281 million).
The majority of the Group’s capital expenditure was recorded in HQ/Consolidation, accounting for 58% (2013: 52%), and was mainly related to investments in the Group’s logistics infrastructure and deployment of IT systems. The Retail segment accounted for 24% of the Group’s capital expenditure (2013: 29%). Investments primarily related to the expansion of our store base for the adidas and Reebok brands, particularly in emerging markets. Expenditure in the Wholesale segment accounted for 13% of total capital expenditure (2013: 13%). Capital expenditure in Other Businesses accounted for 5% of total expenditure (2013: 6%). From a regional perspective, capital expenditure in North America accounted for 37% (2013: 16%) of the Group’s capital expenditure, followed by Western Europe with 27% (2013: 41%), Greater China with 14% (2013: 13%), European Emerging Markets with 7% (2013: 17%), Other Asian Markets with 7% (2013: 7%) and Latin America with 7% (2013: 6%).
see Note 18, p. 213
see Diagram 39
see Note 26, p. 221
see Glossary, p. 258
see Diagram 40
see Diagram 41
see Diagram 42
see Diagram 43

1202 0 1 4
/ 03.2 /
adidas Group / 2014 Annual Report
Group Management Report – Financial ReviewGroup Business Performance / Statement of Financial Position and Statement of Cash Flows
Liquidity analysisIn 2014, net cash generated from operating activities increased to € 701 million (2013: € 634 million). Net cash generated from continuing operating activities increased to € 694 million (2013: € 608 million), primarily as a result of lower operating working capital requirements as well as lower income taxes paid, partly offset by a decline in income before taxes. Net cash used in investing activities more than doubled to € 537 million (2013: € 243 million). Net cash used in continuing investing activities also more than doubled to € 531 million (2013: € 237 million), mainly as a result of lower proceeds from the sale of short–term financial assets. The majority of investing activities in 2014 related to spending for property, plant and equipment, such as investments in the furnishing and fitting of stores in our Retail segment as well as investments in the Group’s logistics infrastructure and IT systems. Net cash used in financing activities totalled € 118 million (2013: € 439 million). The repayment of the Group’s Eurobond of € 500 million, the dividend of € 314 million paid to shareholders as well as the repurchase of treasury shares in the amount of € 300 million were partly offset by proceeds from the issuance of two Eurobonds in an amount of € 990 million. Exchange rate effects positively impacted the Group’s cash position by € 50 million in 2014 (2013: negative impact of € 35 million). As a result of all these developments, cash and cash equivalents increased € 96 million to € 1.683 billion at the end of December 2014 compared to € 1.587 billion at the end of December 2013. Net borrowings at December 31, 2014 amounted to € 185 million, compared to net cash of € 295 million in 2013, representing a decrease of € 479 million. This development is mainly a result of higher capital expenditure during 2014 as well as the utilisation of cash for the first tranche of our share buyback programme in an amount of € 300 million. Currency translation had a positive effect of € 36 million on net borrowings. The Group’s ratio of net borrowings over EBITDA amounted to 0.1 at the end of December 2014 (2013: –0.2).
Operating cash flow, as described in the Internal Group Management System, decreased 36% to € 530 million in 2014 from € 827 million in the prior year. The decrease was mainly due to a lower operating profit as well as higher capital expenditure.
see Diagram 46
see Treasury, p. 121
see Diagram 45
see Internal Group Management System, p. 98
46 / Change in cash and cash equivalents (€ in millions)
Cash and cash equivalents at the
end of 2013
Net cash generated from operating
activities
Net cash used in investing activities
Net cash used in financing activities
Effect of exchange rates
Cash and cash equivalents at the
end of 2014
1,587
701 (537)
50(118) 1,683

Group Management Report – Financial Review
1212 0 1 4
/ 03.2 /
adidas Group / 2014 Annual Report
Group Business Performance / Treasury
Off-balance sheet itemsThe Group’s most significant off-balance sheet items are commitments for promotion and advertising as well as operating leases, which are related to own-retail stores, offices, warehouses and equipment. The Group has entered into various operating leases as opposed to property acquisitions in order to reduce exposure to property value fluctuations. Minimum future lease payments for operating leases were € 1.711 billion at December 31, 2014, compared to € 1.669 billion at the end of December 2013, representing an increase of 3%. At the end of December 2014, financial commitments for promotion and advertising increased 37% to € 5.193 billion in 2014 (2013: € 3.791 billion), mainly as a result of the long-term promotion contract concluded with Manchester United F.C.
Treasury
Group financing policyIn order to be able to meet the Group’s payment commitments at all times, the major goal of our financing policy is to ensure sufficient liquidity reserves, while at the same time minimising the Group’s financial expenses. The operating activities of our Group segments and markets and the resulting cash inflows represent the Group’s main source of liquidity. Liquidity is planned on a rolling monthly basis under a multi-year financial and liquidity plan. This comprises all consolidated Group companies. Our in-house bank concept takes advantage of any surplus funds of individual Group companies to cover the financial requirements of others, thus reducing external financing needs and optimising our net interest expenses. By settling intercompany transactions via intercompany financial accounts, we are able to reduce external bank account transactions and thus bank charges. Effective management of our currency exposure and interest rate risks are additional goals and responsibilities of our Group Treasury department.
Treasury system and responsibilitiesOur Group’s Treasury Policy governs all treasury-related issues, including banking policy and approval of bank relationships, financing arrangements and liquidity/asset management, currency and interest risk management as well as the management of intercompany cash flows. Responsibilities are arranged in a three-tiered approach:/ The Treasury Committee consists of members of the Executive Board and other senior executives
who decide on the Group’s Treasury Policy and provide strategic guidance for managing treasury-related topics. Major changes to our Treasury Policy are subject to the prior approval of the Treasury Committee.
/ The Group Treasury department is responsible for specific centralised treasury transactions and for the global implementation of our Group’s Treasury Policy.
/ On a subsidiary level, where applicable and economically reasonable, local managing directors and financial controllers are responsible for managing treasury matters in their respective subsidiaries. Controlling functions on a Group level ensure that the transactions of the individual business units are in compliance with the Group’s Treasury Policy.
see Note 28, p. 226
see Note 38, p. 243

1222 0 1 4
/ 03.2 /
adidas Group / 2014 Annual Report
Group Management Report – Financial ReviewGroup Business Performance / Treasury
Centralised treasury functionIn accordance with our Group’s Treasury Policy, all worldwide credit lines are directly or indirectly managed by the Group Treasury department. Portions of those lines are allocated to the Group’s subsidiaries and backed by adidas AG guarantees. As a result of this centralised liquidity management, the Group is well positioned to allocate resources efficiently throughout the organisation. The Group’s debt is generally unsecured and may include standard financial covenants, which are reviewed on a quarterly basis. We maintain good relations with numerous partner banks, thereby avoiding a high dependency on any single financial institution. Banking partners of the Group and our subsidiaries are required to have at least a BBB+ long-term investment grade rating by Standard & Poor’s or an equivalent rating by another leading rating agency. Only in exceptional cases are Group companies authorised to work with banks with a lower rating. To ensure optimal allocation of the Group’s liquid financial resources, subsidiaries transfer excess cash to the Group’s headquarters in all instances where it is legally and economically feasible. In this regard, the standardisation and consolidation of the Group’s global cash management and payment processes, including automated domestic and cross-border cash pools, is a key priority for Group Treasury. In 2014, we successfully implemented a new in-house bank module in order to further automate intra-Group settlements.
Group financial flexibilityThe adidas Group’s financial flexibility is ensured by the availability of unutilised credit facilities of € 1.846 billion at the end of 2014 (2013: € 2.026 billion). These include a committed syndicated loan facility of € 500 million as well as bilateral credit lines at different banks of € 1.346 billion (2013: € 1.526 billion). The syndicated loan facility has a remaining time to maturity of five years. We monitor the ongoing need for available credit lines based on the current level of debt as well as future financing requirements.
Successful issuance of two Eurobonds2014 saw the successful issuance of two Eurobonds with an overall volume of € 1 billion. The seven-year Eurobond of € 600 million matures on October 8, 2021 and has a coupon of 1.25%. The twelve-year Eurobond of € 400 million matures on October 8, 2026 and has a coupon of 2.25%. With this transaction, we have taken the opportunity of a low interest rate environment in the Eurobond market to further strengthen the Group’s financing mix while increasing the overall duration.
Bilateral credit lines decreaseAt the end of 2014, bilateral credit lines declined 8% to € 1.520 billion compared to € 1.652 billion in the prior year, as a result of the issuance of two Eurobonds. Committed and uncommitted credit lines represent approximately 15% and 85% of total short-term bilateral credit lines, respectively (2013: 22% and 78%).
Standard financial covenantsIn the case of our committed credit facilities, we have entered into various covenants. These covenants may include limits on the disposal of fixed assets, the amount of debt secured by liens, cross default provisions and change of control. In addition, certain financial arrangements contain equity ratio covenants, minimum equity covenants as well as net loss covenants. If we failed to meet any covenant and were unable to obtain a waiver from a majority of partner banks, borrowings would become due and payable immediately. As at December 31, 2014, we were in
see Risk and Opportunity Report, p. 154
see Glossary, p. 258
see Note 18, p. 213
see Diagram 49

Group Management Report – Financial Review
1232 0 1 4
/ 03.2 /
adidas Group / 2014 Annual Report
Group Business Performance / Treasury
full compliance with all of our covenants, with ample coverage above all stipulated minimum requirements. As a result of our cash flow expectations, we are fully confident we will continue to be compliant with these covenants going forward. We believe that cash generated from operating activities, together with access to external sources of funds, will be sufficient to meet our future operating and capital needs.
see Subsequent Events and Outlook, p. 146
49 / Bilateral credit lines (€ in millions)
2014 2013
Committed 235 370
Uncommitted 1,285 1,282
Total 1,520 1,652
■ 2014 ■ 2013
48 / Remaining time to maturity of available facilities (€ in millions)
2014 2013
< 1 year 1,615 2,207
1 to 3 years 123 193
3 to 5 years 971 960
> 5 years 990 0
Total 3,699 3,360
■ 2014 ■ 2013
47 / Total credit facilities (€ in millions)
2014 2013
Bilateral credit facilities 1,520 1,652
Syndicated loan facility 500 500
Private placements 218 248
Eurobond 990 500
Convertible bond 471 460
Total 3,699 3,360
■ 2014 ■ 2013

1242 0 1 4
/ 03.2 /
adidas Group / 2014 Annual Report
Group Management Report – Financial ReviewGroup Business Performance / Treasury
Gross borrowings increaseGross borrowings increased 40% to € 1.873 billion at the end of 2014 from € 1.334 billion in the prior year. This increase is mainly due to the issuance of two Eurobonds with an overall volume of € 1 billion, which more than offset the repayment of the Eurobond of € 500 million which matured in July 2014. Bank borrowings (incl. commercial paper) amounted to € 194 million compared to € 126 million in the prior year. At the end of 2014, commercial paper of € 20 million was outstanding (2013: € 0 million). Private placements decreased 12% to € 218 million in 2014 (2013: € 248 million). Convertible bonds outstanding increased 2% to € 471 million from € 460 million in the prior year, as a result of accruing the debt component. At issuance in 2012, the convertible bond was split – after deducting the issuance costs – into the equity component amounting to € 55 million and the debt component amounting to € 441 million. The debt component is accrued to its nominal value amounting to € 500 million until 2017 by use of the effective interest method. The total amount of bonds outstanding at the end of 2014 was € 1.461 billion (2013: € 960 million).
Euro dominates currency mix The vast majority of our Group’s gross borrowings are denominated in euros and US dollars. At the end of 2014, gross borrowings denominated in euros accounted for 80% of total gross borrowings (2013: 76%). The share of gross borrowings held in US dollars decreased slightly to 12% (2013: 14%).
see Diagram 51
see Diagram 56
see Diagram 50
50 / Currency split of gross borrowings (€ in millions)
2014 2013
EUR 1,491 1,016
USD 218 193
All others 164 125
Total 1,873 1,334
■ 2014 ■ 2013
51 / Remaining time to maturity of gross borrowings (€ in millions)
2014 2013
< 1 year 288 681
1 to 3 years 123 193
3 to 5 years 471 460
> 5 years 990 0
Total 1,873 1,334
■ 2014 ■ 2013

Group Management Report – Financial Review
1252 0 1 4
/ 03.2 /
adidas Group / 2014 Annual Report
Group Business Performance / Treasury
Debt maturity profile improvesWith the issuance of two Eurobonds, our debt maturity profile improved over the course of 2014. In 2015, assuming unchanged maturities, debt instruments of € 288 million will mature. This compares to € 681 million which matured during the course of 2014.
Interest rate decreases The weighted average interest rate on the Group’s gross borrowings decreased to 3.1% in 2014 (2013: 3.8%). This development is mainly due to the repayment of both the Eurobond of € 500 million and a private placement of € 56 million, which carried higher interest rates. Fixed-rate financing represented 90% of the Group’s total gross borrowings at the end of 2014 (2013: 91%). Variable-rate financing accounted for 10% of total gross borrowings at the end of the year (2013: 9%).
Net debt position of € 185 millionThe Group ended the year with a net debt position of € 185 million, compared to a net cash position of € 295 million at the end of the prior year, representing a decrease of € 479 million. Higher capital expenditure than originally planned negatively influenced this development. In addition, during 2014 we utilised cash for the first tranche of our share buyback programme in an amount of € 300 million, which contributed to the net debt position. Currency effects had a positive impact of € 36 million on net debt development.
see Diagram 51
see Diagram 54
see Diagram 52
52 / Net cash/(net borrowings) (€ in millions)
2014 (185)
2013 295
2012 448
2011 90
2010 (221)
54 / Interest rate development 1) (in %)
2014 3.1
2013 3.8
2012 4.4
2011 4.9
2010 5.1
1) Weighted average interest rate of gross borrowings.
53 / Net cash/(net borrowings) by quarter 1) (€ in millions)
Q4 2014 (185)Q4 2013 295
Q3 2014 (543)Q3 2013 (180)
Q2 2014 (454)Q2 2013 (94)
Q1 2014 (254)Q1 2013 (180)
1) At end of period.
55 / Financial leverage (in %)
2014 3.3
2013 (5.4)
2012 (8.5)
2011 (1.7)
2010 4.8

1262 0 1 4
/ 03.2 /
adidas Group / 2014 Annual Report
Group Management Report – Financial ReviewGroup Business Performance / Treasury
Effective currency management a key priorityAs a globally operating company, the adidas Group is exposed to currency risks. Therefore, effective currency management is a key focus of Group Treasury, with the aim of reducing the impact of currency fluctuations on non-euro-denominated net future cash flows. In this regard, hedging US dollars is a central part of our programme. This is a direct result of the Group’s Asian-dominated sourcing, which is largely denominated in US dollars. In 2014, Group Treasury managed a net deficit of around US $ 5.6 billion related to operational activities (2013: US $ 5.2 billion). Thereof, around US $ 2.8 billion were against the euro (2013: US $ 2.6 billion). As governed by the Group’s Treasury Policy, we have established a hedging system on a rolling basis up to 24 months in advance, under which the vast majority of the anticipated seasonal hedging volume is secured approximately six months prior to the start of a season. As a result, we have almost completed our anticipated hedging needs for 2015 as of year-end 2014 and have already started hedging our exposure for 2016. In 2015, the positive effect from a more favourable EUR/USD conversion rate is expected to be more than offset by less favourable conversion rates in emerging markets, especially Russia. The use or combination of different hedging instruments, such as forward exchange contracts, currency options and swaps, protects us against unfavourable currency movements. The use of currency options allows the Group to benefit from future favourable exchange rate developments.
see Global Operations, p. 66
see Risk and Opportunity Report, p. 154
56 / Financing structure 1) (€ in millions)
2014 2013
Cash and short-term financial assets 1,688 1,629
Bank borrowings 174 126
Commercial paper 20 0
Private placements 218 248
Eurobond 990 500
Convertible bond 471 460
Gross total borrowings 1,873 1,334
Net cash (185) 295
1) Rounding differences may arise in totals.
57 / Issued bonds at a glance (in millions)
Issued bonds Volume Coupon Maturity
US private placement USD 115 fixed 2015
US private placement USD 150 fixed 2016
Convertible bond EUR 500 fixed 2019
Eurobond EUR 600 fixed 2021
Eurobond EUR 400 fixed 2026

Group Management Report – Financial Review
1272 0 1 4
/ 03.2 /
adidas Group / 2014 Annual Report
Group Business Performance / Financial Statements and Management Report of adidas AG
Financial Statements and Management Report of adidas AG
adidas AG is the parent company of the adidas Group. It includes operating business functions, primarily for the German market, as well as corporate headquarter functions such as Global Marketing, Group Treasury, Taxes, Legal and Finance. It also administers the shareholdings of the company.
Operating activities and capital structure of adidas AGThe majority of the operating business of adidas AG consists of the sale of merchandise to retailers and own-retail activities.
In addition to its own trading activities, the results of adidas AG are significantly influenced by its holding function for the adidas Group. This is reflected primarily in currency effects, transfer of costs for services provided, interest result and income from investments in affiliated companies.
The opportunities and risks as well as the future development of adidas AG largely reflect those of the adidas Group.
The asset and capital structure of adidas AG is significantly impacted by its holding and financing function for the Group. For example, 47% of total assets in 2014 related to financial assets, which primarily consist of shares in affiliated companies. Intercompany accounts, through which transactions between affiliated companies are settled, represent another 30% of total assets and 43% of total liabilities and equity as at December 31, 2014.
Preparation of accountsUnlike the consolidated financial statements of the adidas Group, which are in conformity with the International Financial Reporting Standards (IFRS), as adopted by the European Union as at December 31, 2014, the following financial statements of adidas AG have been prepared in accordance with the rules set out in the German Commercial Code (Handelsgesetzbuch – HGB).
Income Statement
see Subsequent Events and Outlook, p. 146see Risk and Opportunity Report, p. 154
58 / Statement of income in accordance with HGB (Condensed) 1) (€ in millions)
2014 2013
Net sales 2,142 1,954
Total output 2,142 1,954
Other operating income 647 1,165
Cost of materials (600) (532)
Personnel expenses (398) (357)
Depreciation and amortisation (91) (81)
Other operating expenses (1,581) (1,981)
Operating profit 119 168
Financial result 128 43
Taxes (71) (111)
Net income 176 100
Retained earnings brought forward 110 324
Withdrawals from other revenue reserves 21 0
Retained earnings 307 424
1) Rounding differences may arise in totals.

1282 0 1 4
/ 03.2 /
adidas Group / 2014 Annual Report
Group Management Report – Financial ReviewGroup Business Performance / Financial Statements and Management Report of adidas AG
Net sales increase 10%Sales of adidas AG comprise external revenues from adidas and Reebok products generated by adidas Germany, external revenues from Y-3 products as well as Group-internal revenues from foreign subsidiaries. Reported revenues also include royalty and commission income, mainly from affiliated companies, and other revenues. In 2014, adidas AG net sales grew 10% to € 2.142 billion (2013: € 1.954 billion). This growth is mainly due to an increase in royalty income from affiliated companies as well as higher sales at adidas Germany.
Other operating income down 44% In 2014, other operating income of adidas AG decreased 44% to € 647 million (2013: € 1.165 billion). This was primarily due to a decline in income from currency conversion.
Other operating expenses decrease 20%Other operating expenses of adidas AG declined 20% to € 1.581 billion in 2014 (2013: € 1.981 billion). This decrease was largely due to a decline in losses from currency translation, which more than offset an increase in cost transfers within the Group as well as an increase in expenditure, in particular depreciation of accounts receivable as well as legal and consultancy expenses.
Depreciation and amortisation increases 12%Depreciation and amortisation for adidas AG rose 12% to € 91 million in 2014 (2013: € 81 million), mainly as a result of the depreciation and amortisation of software and buildings.
Operating profit declines 29%In 2014, operating profit decreased 29% to € 119 million (2013: € 168 million). This was mainly due to the decline in other operating income as well as the increase in cost of materials and personnel expenses.
see Table 59
59 / adidas AG net sales 1) (€ in millions)
2014 2013
Royalty and commission income 1,177 1,088
adidas Germany 798 701
Foreign subsidiaries 96 103
Y-3 51 44
Other revenues 20 18
Total 2,142 1,954
1) Rounding differences may arise in totals.

Group Management Report – Financial Review
1292 0 1 4
/ 03.2 /
adidas Group / 2014 Annual Report
Group Business Performance / Financial Statements and Management Report of adidas AG
Financial result improves stronglyThe financial result of adidas AG improved to € 128 million in 2014 from € 43 million in 2013. This increase is due to lower interest paid to affiliated companies as well as higher income from investments in affiliated companies in an amount of € 170 million (2013: € 102 million). This includes the recognition of the dividend of the subsidiary in Korea in the same reporting period (date of resolution: February 12, 2015) in an amount of € 72 million.
Net interest expense of adidas AG declined 29% to € 44 million in 2014 (2013: € 62 million). This was mainly due to lower interest paid to affiliated companies.
Net income grows 76%Income from ordinary activities increased 17% to € 247 million in 2014 from € 211 million in 2013. This development is mainly attributable to the improved financial result, which more than offset lower operating profit. Net income, after taxes of € 71 million, was € 176 million in 2014 and was thus above the prior year level (2013: € 100 million).
Balance Sheet
60 / Balance sheet in accordance with HGB (Condensed) 1) (€ in millions)
Dec. 31, 2014 Dec. 31, 2013
Assets
Intangible assets 129 148
Property, plant and equipment 419 304
Financial assets 3,503 3,476
Fixed assets 4,051 3,928
Inventories 38 29
Receivables and other assets 2,312 1,928
Cash and cash equivalents, securities 934 736
Current assets 3,284 2,693
Prepaid expenses 80 73
Total assets 7,415 6,694
Equity and liabilities
Shareholders’ equity 2,051 2,489
Provisions 390 393
Liabilities and other items 4,974 3,812
Total equity and liabilities 7,415 6,694
1) Rounding differences may arise in totals.

1302 0 1 4
/ 03.2 /
adidas Group / 2014 Annual Report
Group Management Report – Financial ReviewGroup Business Performance / Financial Statements and Management Report of adidas AG
Total assets increase 11%At the end of December 2014, total assets grew 11% to € 7.415 billion compared to € 6.694 billion in the prior year. This was mainly a result of an increase in receivables and other assets in an amount of € 384 million.
Shareholders’ equity decreases 18%Shareholders’ equity declined 18% to € 2.051 billion at the end of December 2014 compared to € 2.489 billion in the prior year. This decrease was mainly due to the buyback of treasury shares and lower retained earnings in 2014 compared to the prior year. Accordingly, the equity ratio declined to 28%.
Provisions down 1% Provisions decreased 1% to € 390 million at the end of 2014 (2013: € 393 million).
Liabilities and other items up 30%Liabilities and other items increased 30% to € 4.974 billion at the end of 2014 (2013: € 3.812 billion). This increase primarily resulted from the issuance of two Eurobonds with an overall volume of € 1 billion.
Cash inflow from operating activities reflects net incomeadidas AG generated a positive cash flow from operating activities of € 61 million (2013: € 89 million). The change versus the prior year was mainly a result of higher payables to affiliated companies. Net cash outflow from investment activities was € 221 million (2013: € 115 million). This is largely attributable to capital expenditure for tangible and intangible fixed assets of € 195 million. Financing activities resulted in a cash inflow of € 359 million (2013: cash outflow of € 287 million). The net cash inflow from financing activities relates to the issuance of two Eurobonds. This was partly offset by the dividend payment of € 314 million and the buyback of shares in an amount of € 300 million. As a result of all these developments, cash and cash equivalents of adidas AG increased to € 934 million at the end of December 2014 compared to € 736 million at the end of December 2013.
adidas AG has a committed syndicated loan facility of € 500 million, which was unutilised at year-end 2014.
adidas AG is able to meet its financial commitments at all times.
see Treasury, p. 121

Group Management Report – Financial Review
1312 0 1 4
/ 03.2 /
adidas Group / 2014 Annual Report
Group Business Performance / Disclosures pursuant to § 315 Section 4 and § 289 Section 4 of the German Commercial Code
Disclosures pursuant to § 315 Section 4 and § 289 Section 4 of the German Commercial Code
Composition of subscribed capitalThe nominal capital of adidas AG amounts to € 209,216,186 (as at December 31, 2014) and is divided into the same number of registered no-par-value shares with a pro-rata amount in the nominal capital of € 1 each (‘shares’). Pursuant to § 4 section 9 of the Articles of Association, shareholders’ claims to the issuance of individual share certificates are, in principle, excluded. Each share grants one vote at the Annual General Meeting. All shares carry the same rights and obligations. As at December 31, 2014, adidas AG holds 4,889,142 treasury shares, which however do not confer any rights to the company in accordance with § 71b German Stock Corporation Act (Aktiengesetz – AktG).
In the USA, we have issued American Depositary Receipts (ADRs). ADRs are deposit certificates of non-US shares that are traded instead of the original shares on US stock exchanges. Two ADRs equal one share.
Restrictions on voting rights or transfer of sharesWe are not aware of any contractual agreements with adidas AG or other agreements restricting voting rights or the transfer of shares. Based on the Code of Conduct in conjunction with an internal guideline of adidas AG, however, particular lock-up periods do exist for members of the Executive Board with regard to the purchase and sale of adidas AG shares. These lock-up periods are connected with the publication of quarterly and full year results. Such lock-up periods also exist for employees who have access to yet unpublished financial results.
In addition, restrictions of voting rights may exist pursuant, inter alia, to § 136 AktG or for treasury shares pursuant to § 71b AktG as well as due to capital market regulations, in particular pursuant to §§ 21 et seq. German Securities Trading Act (Wertpapierhandelsgesetz – WpHG).
Shareholdings in share capital exceeding 10% of voting rightsWe have not been notified of, and are not aware of, any direct or indirect shareholdings in the share capital of adidas AG exceeding 10% of the voting rights.
Shares with special rights There are no shares bearing special rights. In particular, there are no shares with rights conferring powers of control.
Voting right control if employees have a share in the capitalLike all other shareholders, employees who hold adidas AG shares exercise their control rights directly in accordance with statutory provisions and the Articles of Association.
Executive Board appointment and dismissal Pursuant to § 6 of the Articles of Association and § 84 AktG, the Supervisory Board is responsible for determining the exact number of members of the Executive Board, for their appointment and dismissal as well as for the appointment of the Chief Executive Officer (CEO). The adidas AG Executive Board, which, as a basic principle, comprises at least two members, currently consists of the CEO as well as four further members. Executive Board members may be appointed for a maximum period of five years. Such appointments may be renewed and the terms of office may be extended, provided that no term exceeds five years.
see Note 25, p. 221
see Our Share, p. 38
see Executive Board, p. 10

1322 0 1 4
/ 03.2 /
adidas Group / 2014 Annual Report
Group Management Report – Financial ReviewGroup Business Performance / Disclosures pursuant to § 315 Section 4 and § 289 Section 4 of the German Commercial Code
The Supervisory Board may revoke the appointment of an individual as member of the Executive Board or CEO for good cause, such as gross negligence of duties or a vote of no confidence by the Annual General Meeting. As adidas AG is subject to the regulations of the German Co-Determination Act (Mitbestimmungsgesetz – MitbestG), the appointment of Executive Board members and also their dismissal requires a majority of at least two thirds of the Supervisory Board members (§ 31 MitbestG). If such a majority is not established in the first vote by the Supervisory Board, the Mediation Committee has to present a proposal which, however, does not exclude other proposals. The appointment or dismissal is then made in a second vote with a simple majority of the votes cast by the Supervisory Board members. Should the required majority not be established in this case either, a third vote, again requiring a simple majority, must be held in which, however, the Chairman of the Supervisory Board has two votes.
Furthermore, the Fuerth, Germany, local court shall, pursuant to § 85 section 1 AktG, in urgent cases, make the necessary appointment upon application by any party involved, if the Executive Board does not have the required number of members.
Amendments to the Articles of Association Pursuant to § 179 section 1 sentence 1 AktG, the Articles of Association of adidas AG can, in principle, only be amended by a resolution passed by the Annual General Meeting. Pursuant to § 21 section 3 of the Articles of Association in conjunction with § 179 section 2 sentence 2 AktG, the Annual General Meeting of adidas AG principally resolves upon amendments to the Articles of Association with a simple majority of the votes cast and with a simple majority of the nominal capital represented when passing the resolution. If mandatory legal provisions stipulate a larger majority of voting rights or capital, this is applicable. When it comes to amendments solely relating to the wording, the Supervisory Board is, however, authorised to make these modifications in accordance with § 179 section 1 sentence 2 AktG in conjunction with § 10 section 1 of the Articles of Association.
Authorisations of the Executive BoardThe authorisations of the Executive Board are regulated by §§ 76 et seq. AktG in conjunction with § 7 of the Articles of Association. The Executive Board is responsible, in particular, for managing the company and represents the company judicially and extra-judicially.
Authorisation of the Executive Board to issue shares The authorisation of the Executive Board to issue shares is regulated by § 4 of the Articles of Association and by statutory provisions:
Authorised Capital/ Until June 30, 2016, the Executive Board is authorised to increase the nominal capital, subject to
Supervisory Board approval, by issuing new shares against contributions in kind once or several times by no more than € 25,000,000 altogether (Authorised Capital 2013/II).
/ Until June 30, 2018, the Executive Board is authorised to increase the nominal capital, subject to Supervisory Board approval, by issuing new shares against contributions in cash once or several times by no more than € 50,000,000 altogether (Authorised Capital 2013/I).
/ Until June 30, 2018, the Executive Board is authorised to increase the nominal capital, subject to Supervisory Board approval, by issuing new shares against contributions in cash once or several times by no more than € 20,000,000 altogether (Authorised Capital 2013/III).
Subject to Supervisory Board approval, shareholders’ subscription rights may be excluded in certain cases for each of the above-mentioned authorisations. see Note 25, p. 221

Group Management Report – Financial Review
1332 0 1 4
/ 03.2 /
adidas Group / 2014 Annual Report
Group Business Performance / Disclosures pursuant to § 315 Section 4 and § 289 Section 4 of the German Commercial Code
Contingent Capital/ The nominal capital of the company is conditionally increased by up to € 36,000,000 (Contingent
Capital 2010). The Contingent Capital serves the purpose of granting holders or creditors of bonds that were issued based on the resolution of the Annual General Meeting on May 6, 2010 subscription or conversion rights relating to no more than a total of 36,000,000 shares in compliance with the corresponding conditions of the bonds.
On March 14, 2012, following the approval of the Supervisory Board, the Executive Board issued a convertible bond, excluding shareholders’ subscription rights, thus making partial use of the authorisation granted by the Annual General Meeting on May 6, 2010. However, the shares will only be issued insofar as bondholders make use of their conversion rights. The total number of shares to be issued to bondholders in case of full conversion currently amounts to up to 6,056,447 shares.
Moreover, the authorisation to issue bonds with warrants and/or convertible bonds granted on May 6, 2010 was cancelled by resolution of the Annual General Meeting on May 8, 2014.
/ Furthermore, the nominal capital of the company is conditionally increased by up to € 12,500,000 (Contingent Capital 2014). The Contingent Capital serves the purpose of granting holders or creditors of bonds that were issued based on the resolution of the Annual General Meeting on May 8, 2014 subscription or conversion rights relating to no more than a total of 12,500,000 shares in compliance with the corresponding conditions of the bonds. Based on the authorisation granted by the Annual General Meeting on May 8, 2014, the Executive Board is authorised, subject to Supervisory Board approval, to issue bonds with warrants and/or convertible bonds in an aggregate nominal value of up to € 1 billion with or without a limited term, against contributions in cash once or several times until May 7, 2019, and to guarantee bonds issued by subordinated Group companies. The Executive Board is also authorised, subject to Supervisory Board approval, to exclude shareholders’ subscription rights for fractional amounts and to exclude shareholders’ subscription rights insofar as this is necessary for granting subscription rights to which holders or creditors of previously issued bonds are entitled. Furthermore, the Executive Board is authorised, subject to Supervisory Board approval, to also exclude shareholders’ subscription rights if the issue price of the bonds is not significantly below the hypothetical market value of these bonds and the number of shares to be issued does not exceed 10% of the nominal capital. The issuance of new shares or the use of treasury shares must be taken into account when calculating the limit of 10% in certain other specific cases.
The Executive Board has so far not utilised the authorisation to issue bonds with warrants and/or convertible bonds granted by the Annual General Meeting on May 8, 2014.

1342 0 1 4
/ 03.2 /
adidas Group / 2014 Annual Report
Group Management Report – Financial ReviewGroup Business Performance / Disclosures pursuant to § 315 Section 4 and § 289 Section 4 of the German Commercial Code
Authorisation of the Executive Board to repurchase sharesThe authorisations of the Executive Board to repurchase adidas AG shares arise from §§ 71 et seq. AktG and, as at the balance sheet date, from the authorisation granted by the Annual General Meeting on May 8, 2014.
/ Until May 7, 2019, the Executive Board is authorised to repurchase adidas AG shares of up to an amount totalling 10% of the nominal capital at the date of the resolution (or, as the case may be, a lower amount of nominal capital at the date of utilisation of the authorisation) for any lawful purpose and within the legal framework. The authorisation may be used by the company but also by its subordinated Group companies or by third parties on account of the company or its subordinated Group companies or third parties assigned by the company or one of its subordinated Group companies.
The repurchase will be carried out via the stock exchange, through a public invitation to submit sale offers, through a public repurchase offer, or through granting tender rights to shareholders. Furthermore, the authorisation sets out the lowest and highest nominal value that may be granted in each case.
The purposes for which adidas AG shares repurchased based on this authorisation may be used are set out in Item 8 of the Agenda for the Annual General Meeting held on May 8, 2014. The shares may in particular be used as follows:
/ They may be sold via the stock exchange, through a public share purchase offer made to all shareholders or sold otherwise against cash (limited to 10% of the nominal capital taking into account certain offsets) at a price not significantly below the stock market price of shares with the same features.
/ They may be offered and assigned as consideration for the direct or indirect acquisition of companies, parts of companies, participations in companies or other economic assets or within the scope of company mergers.
/ They may be offered and sold as consideration for the acquisition of industrial property rights or intangible property rights or for the acquisition of licences relating to such rights, also through subordinated Group companies.
/ They may be used for purposes of meeting the subscription or conversion rights or obligations or the company’s right to delivery of shares arising from bonds with warrants and/or convertible bonds issued by the company or its subordinated Group companies.
/ They may be cancelled without the cancellation, or the execution thereof, requiring an additional resolution of the Annual General Meeting.
Furthermore, the shares may be assigned to members of the Executive Board as compensation by way of a stock bonus subject to the provision that resale by the Executive Board members shall only be permitted following a retention period of at least three years from the date of assignment. Responsibility in this case lies with the Supervisory Board.
In case of utilisation of shares for the above-mentioned purposes, except for the cancellation of shares, shareholders’ subscription rights are excluded.

Group Management Report – Financial Review
1352 0 1 4
/ 03.2 /
adidas Group / 2014 Annual Report
Group Business Performance / Disclosures pursuant to § 315 Section 4 and § 289 Section 4 of the German Commercial Code
The Supervisory Board may determine that transactions based on this authorisation may only be carried out subject to the approval of the Supervisory Board or one of its committees.
In the year under review, the Executive Board partly utilised the authorisation to repurchase treasury shares. In the period from November 7, 2014 up to and including December 12, 2014, adidas AG bought back 4,889,142 shares via the stock exchange.
/ In the scope of the authorisation resolved by the Annual General Meeting on May 8, 2014, the Executive Board is furthermore authorised to conduct the share buyback also by using equity derivatives which are arranged with a credit institution or financial services institution in close conformity with market conditions. adidas AG may acquire call options issued for physical delivery and/or sell put options or use a combination of call and put options or other equity derivatives if the option conditions ensure that these shares are only delivered if they were purchased in compliance with the equality principle. All share purchases using the aforementioned equity derivatives are limited to a maximum value of 5% of the nominal capital existing at the date on which the resolution was adopted by the Annual General Meeting (or, as the case may be, a lower amount of nominal capital at the date of utilisation of the authorisation). The term of the options may not exceed 18 months and must furthermore be chosen in such a way that the shares are acquired upon the exercise of the options no later than May 7, 2019. The authorisation furthermore sets out the lowest and highest nominal value that may be granted in each case.
For excluding subscription rights as well as for the use and cancellation of shares purchased using equity derivatives, the general provisions adopted by the Annual General Meeting (set out above) are applicable accordingly.
Change of control/compensation agreementsMaterial agreements entered into by adidas AG containing a change-of-control clause relate to financing agreements. In the case of a change of control, these agreements, in accordance with common practice, entitle the creditor to termination and early calling-in of any outstanding amounts.
No compensation agreements exist between adidas AG and members of the Executive Board or employees relating to the event of a takeover bid.

3
1362 0 1 4
/ 03.3 /
adidas Group / 2014 Annual Report
Group Management Report – Financial ReviewBusiness Performance by Segment / Wholesale Business Performance
Business Performance by SegmentThe adidas Group has divided its operating activities into Wholesale, Retail and Other Businesses. The Wholesale segment comprises the adidas and Reebok business activities with retailers. The Retail segment comprises the own-retail and e-commerce activities of the adidas and Reebok brands. The financial results of TaylorMade-adidas Golf, Reebok-CCM Hockey and Other Centrally Managed Brands, which comprise brands such as Y-3 and Five Ten, are aggregated under Other Businesses.
Wholesale Business Performance
Wholesale full year resultsIn 2014, sales in the Wholesale segment increased 6% on a currency-neutral basis. This development was driven by strong growth at adidas, while Reebok revenues remained stable versus the prior year. Currency translation effects negatively impacted segmental revenues in euro terms. Sales in the Wholesale segment grew 3% to € 9.376 billion from € 9.100 billion in 2013.
Wholesale gross profit increased 1% to € 3.911 billion from € 3.884 billion in 2013. Gross margin in the Wholesale segment decreased 1.0 percentage points to 41.7% in 2014 from 42.7% in 2013. The positive effect from a more favourable product mix was more than offset by negative currency effects following the devaluation of currencies such as the Argentine peso and Brazilian real as well as a less favourable pricing mix. By brand, the adidas wholesale gross margin declined 0.9 percentage points to 43.3% (2013: 44.2%). The wholesale gross margin for the Reebok brand decreased 2.4 percentage points to 28.6% (2013: 31.0%).
see Table 01
see Table 01
01 / Wholesale at a glance (€ in millions)
2014 2013 Change
Net sales 9,376 9,100 3%
Gross profit 3,911 3,884 1%
Gross margin 41.7% 42.7% (1.0pp)
Segmental operating profit 3,100 3,082 1%
Segmental operating margin 33.1% 33.9% (0.8pp)
02 / Wholesale net sales by region (€ in millions)
2014 2013 Change Change (currency-
neutral)
Western Europe 3,156 2,940 7% 7%
European Emerging Markets 625 545 15% 23%
North America 1,485 1,633 (9%) (8%)
Greater China 1,516 1,403 8% 8%
Other Asian Markets 1,401 1,368 2% 6%
Latin America 1,193 1,210 (1%) 14%
Total 1) 9,376 9,100 3% 6%
1) Rounding differences may arise in totals.

Group Management Report – Financial Review
1372 0 1 4
/ 03.3 /
adidas Group / 2014 Annual Report
Business Performance by Segment / Wholesale Business Performance
Segmental operating expenses in Wholesale primarily relate to sales working budget expenses as well as expenditure for sales force, administration and logistics. In euro terms, segmental operating expenses were up 1% to € 810 million versus € 802 million in 2013. This was primarily due to higher sales working budget expenses. Segmental operating expenses as a percentage of sales decreased 0.2 percentage points to 8.6% (2013: 8.8%).
Segmental operating profit increased 1% to € 3.100 billion versus € 3.082 billion in the prior year. Segmental operating margin declined 0.8 percentage points to 33.1% (2013: 33.9%), as the positive effect of lower segmental operating expenses as a percentage of sales was more than offset by the gross margin decline.
Wholesale development by regionIn 2014, currency-neutral sales for the Wholesale segment increased in all regions except North America. Currency-neutral revenues in Western Europe were up 7%, mainly due to strong sales increases in Germany, the UK, France, Poland and Spain. Currency-neutral sales in European Emerging Markets rose 23%, as a result of double-digit growth in all of the region’s major markets. Currency-neutral Wholesale sales in North America were down 8% due to declines in the USA. Revenues in Greater China increased 8% on a currency-neutral basis. Sales in Other Asian Markets grew 6% on a currency-neutral basis, driven by increases in South Korea, Japan and India. In Latin America, currency-neutral sales were up 14%, supported by double-digit sales growth in most markets, in particular Argentina, Mexico and Chile. Currency translation effects had a mixed impact on regional sales in euro terms.
see Table 01
see Table 02
04 / Wholesale net sales by brand
1 / 66% adidas Sport Performance2 / 24% adidas Originals &
Sport Style3 / 11% Reebok
03 / Wholesale net sales by region
1 / 34% Western Europe2 / 16% North America3 / 16% Greater China4 / 15% Other Asian Markets5 / 13% Latin America6 / 7% European Emerging Markets
2014 1
2
3
2014
6 5
1
2 3
4
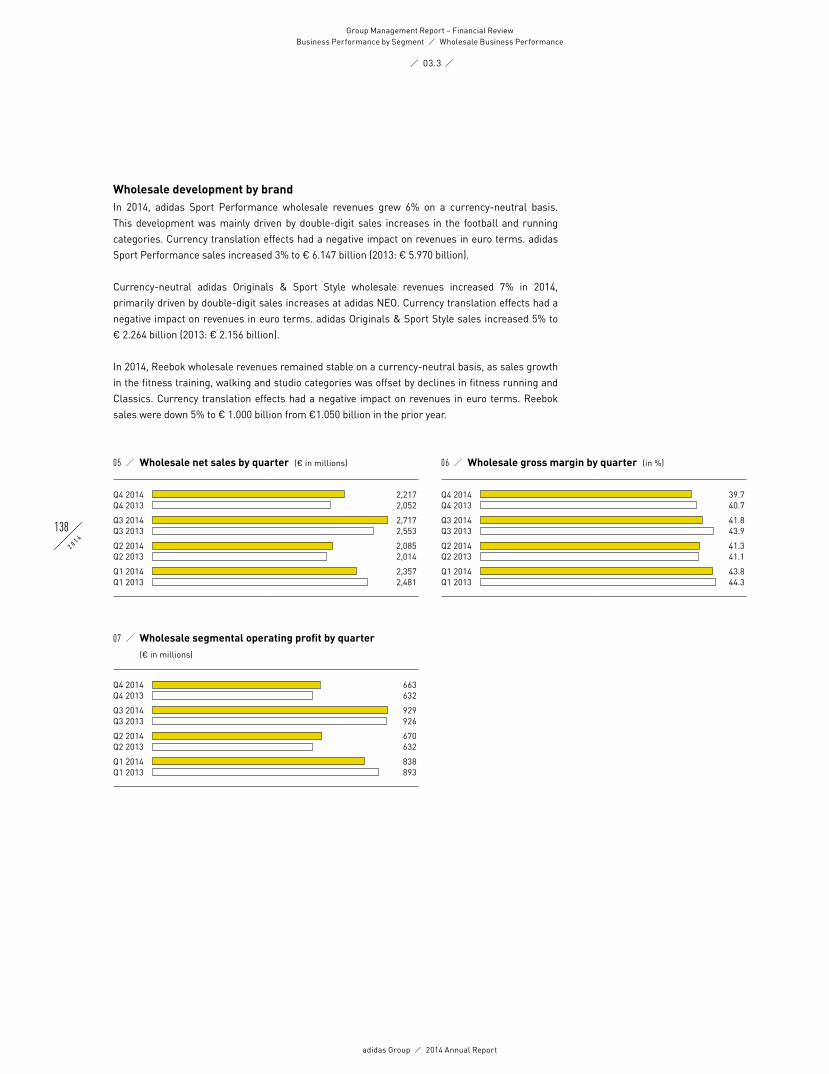
1382 0 1 4
/ 03.3 /
adidas Group / 2014 Annual Report
Group Management Report – Financial ReviewBusiness Performance by Segment / Wholesale Business Performance
Wholesale development by brandIn 2014, adidas Sport Performance wholesale revenues grew 6% on a currency-neutral basis. This development was mainly driven by double-digit sales increases in the football and running categories. Currency translation effects had a negative impact on revenues in euro terms. adidas Sport Performance sales increased 3% to € 6.147 billion (2013: € 5.970 billion).
Currency-neutral adidas Originals & Sport Style wholesale revenues increased 7% in 2014, primarily driven by double-digit sales increases at adidas NEO. Currency translation effects had a negative impact on revenues in euro terms. adidas Originals & Sport Style sales increased 5% to € 2.264 billion (2013: € 2.156 billion).
In 2014, Reebok wholesale revenues remained stable on a currency-neutral basis, as sales growth in the fitness training, walking and studio categories was offset by declines in fitness running and Classics. Currency translation effects had a negative impact on revenues in euro terms. Reebok sales were down 5% to € 1.000 billion from €1.050 billion in the prior year.
05 / Wholesale net sales by quarter (€ in millions)
Q4 2014 2,217Q4 2013 2,052
Q3 2014 2,717Q3 2013 2,553
Q2 2014 2,085Q2 2013 2,014
Q1 2014 2,357Q1 2013 2,481
06 / Wholesale gross margin by quarter (in %)
Q4 2014 39.7Q4 2013 40.7
Q3 2014 41.8Q3 2013 43.9
Q2 2014 41.3Q2 2013 41.1
Q1 2014 43.8Q1 2013 44.3
07 / Wholesale segmental operating profit by quarter
(€ in millions)
Q4 2014 663Q4 2013 632
Q3 2014 929Q3 2013 926
Q2 2014 670Q2 2013 632
Q1 2014 838Q1 2013 893

Group Management Report – Financial Review
1392 0 1 4
/ 03.3 /
adidas Group / 2014 Annual Report
Business Performance by Segment / Retail Business Performance
Retail Business Performance
Retail full year resultsIn 2014, Retail revenues increased 21% on a currency-neutral basis as a result of double-digit sales growth at both adidas and Reebok. Concept stores, factory outlets and concession corners were all up at double-digit rates versus the prior year. eCommerce grew 72% on a currency-neutral basis. Currency translation effects negatively impacted segmental revenues in euro terms. Sales grew 11% to € 3.842 billion from € 3.446 billion in the prior year. Currency-neutral comparable store sales increased 9% versus the prior year, as a result of sales growth across all store formats as well as all regions.
Retail gross profit rose 6% to € 2.281 billion from € 2.143 billion in 2013. Gross margin in the Retail segment decreased 2.8 percentage points to 59.4% from 62.2% in 2013. The positive effect from a more favourable product mix was more than offset by a less favourable pricing mix. In particular, the devaluation of the Russian rouble versus the euro and the US dollar was a major headwind in 2014. By brand, the adidas retail gross margin was down 2.8 percentage points to 60.3% (2013: 63.1%), while Reebok’s retail gross margin decreased 3.3 percentage points to 54.1% (2013: 57.4%).
Segmental operating expenses in Retail primarily relate to personnel and rent expenses as well as the sales working budget. In 2014, segmental operating expenses increased 10% to € 1.608 billion from € 1.465 billion in 2013. This was mainly a result of higher expenses related to the expansion of the Group’s store base, particularly in emerging markets. Higher sales working budget expenses also contributed to this development. Segmental operating expenses as a percentage of sales decreased 0.7 percentage points to 41.8% (2013: 42.5%).
see Glossary, p. 258
see Table 08
see Glossary, p. 258
see Table 08
08 / Retail at a glance (€ in millions)
2014 2013 Change
Net sales 3,842 3,446 11%
Gross profit 2,281 2,143 6%
Gross margin 59.4% 62.2% (2.8pp)
Segmental operating profit 673 678 (1%)
Segmental operating margin 17.5% 19.7% (2.1pp)
09 / Retail net sales by region (€ in millions)
2014 2013 Change Change (currency-
neutral)
Western Europe 673 545 23% 23%
European Emerging Markets 1,284 1,297 (1%) 18%
North America 732 639 15% 15%
Greater China 270 216 25% 26%
Other Asian Markets 463 406 14% 19%
Latin America 419 344 22% 39%
Total 1) 3,842 3,446 11% 21%
1) Rounding differences may arise in totals.

1402 0 1 4
/ 03.3 /
adidas Group / 2014 Annual Report
Group Management Report – Financial ReviewBusiness Performance by Segment / Retail Business Performance
Segmental operating profit decreased 1% to € 673 million in 2014 versus € 678 million in the prior year. Segmental operating margin declined 2.1 percentage points to 17.5% (2013: 19.7%), as the positive effects of lower segmental operating expenses as a percentage of sales were more than offset by the decline in gross margin.
Retail development by regionCurrency-neutral Retail sales increased at a double-digit rate in all regions. Retail revenues in Western Europe grew 23% on a currency-neutral basis, mainly due to double-digit sales increases in the UK, France, Germany and Spain. Sales in European Emerging Markets rose 18% on a currency-neutral basis, as a result of double-digit growth in all markets. Currency-neutral Retail sales in North America grew 15%, due to double-digit growth in both the USA and Canada. Retail revenues in Greater China increased 26% on a currency-neutral basis. Sales in Other Asian Markets grew 19% on a currency-neutral basis, driven by double-digit growth in Japan and South Korea. In Latin America, currency-neutral Retail sales grew 39%, with double-digit sales increases in all markets, in particular in Argentina, Colombia and Brazil. Currency translation effects had a mixed impact on regional sales in euro terms.
Retail development by brandIn 2014, adidas Group Retail sales increased at a double-digit rate at both adidas and Reebok. Currency-neutral adidas Sport Performance revenues grew 22% in the period, mainly due to double-digit growth in the football, training and running categories. adidas Originals & Sport Style sales also rose 22% on a currency-neutral basis, driven by double-digit sales increases at both adidas Originals and adidas NEO. Currency-neutral Reebok sales were 14% higher compared to the prior year, driven by double-digit growth in the fitness training and Classics categories. Comparable store sales for the adidas brand increased 10% on a currency-neutral basis, while Reebok comparable store sales grew 1% on a currency-neutral basis. Currency translation effects had a negative impact on revenues in euro terms. adidas Sport Performance own-retail sales increased 13% to € 2.112 billion in 2014 from € 1.875 billion in 2013. adidas Originals & Sport Style own-retail sales were also up 13% to € 1.153 billion from € 1.020 billion in 2013. Own-retail sales of Reebok branded products grew 5% to € 578 million (2013: € 549 million).
Retail store developmentAt December 31, 2014, the adidas Group Retail segment operated 2,913 stores compared to the prior year-end level of 2,740. This represents a net increase of 173 stores. Of the total number of stores, 1,616 were adidas and 446 were Reebok branded (December 31, 2013: 1,557 adidas stores, 404 Reebok stores). In addition, the adidas Group Retail segment operated 851 factory outlets (December 31, 2013: 779). During 2014, the Group opened 409 new stores, 236 stores were closed and 145 stores were remodelled.
see Table 08
see Table 09

Group Management Report – Financial Review
1412 0 1 4
/ 03.3 /
adidas Group / 2014 Annual Report
Business Performance by Segment / Retail Business Performance
Retail development by store formatConcept store revenues include sales from adidas and Reebok concept stores. In 2014, concept store revenues grew 20% on a currency-neutral basis, as a result of double-digit increases at both adidas and Reebok. Currency-neutral comparable concept store sales were up 12%. In 2014, the Group opened 251 new concept stores, 166 concept stores were closed. As a result, the number of concept stores increased by 85 to 1,746 at the end of 2014 (December 31, 2013: 1,661), of which 1,409 were related to the adidas brand and 337 to the Reebok brand. Currency translation effects had a negative impact on sales in euro terms. Concept store sales increased 7% to € 1.686 billion in 2014 from € 1.573 billion in 2013.
Factory outlet revenues include sales from adidas and Reebok factory outlets. In 2014, factory outlet revenues grew 13% on a currency-neutral basis. Sales increased at a double-digit rate at adidas, while Reebok sales grew at a low-single-digit rate. Comparable factory outlet sales increased 5% on a currency-neutral basis. In 2014, the Group opened 126 and closed 54 factory outlets. As a result, the number of factory outlets increased by 72 to 851 at the end of 2014 (December 31, 2013: 779). Currency translation effects had a negative impact on sales in euro terms. Factory outlet sales increased 6% to € 1.602 billion in 2014 from € 1.507 billion in 2013.
Concession corner revenues include adidas and Reebok concession corners. In 2014, sales from concession corners increased 17% on a currency-neutral basis. While adidas sales grew at a double-digit rate, revenues at Reebok increased at a mid-single-digit rate. Currency-neutral comparable sales from concession corners grew 13%. In 2014, the Group opened 32 concession corners and
see Table 16
see Table 16
11 / Retail net sales by store format
1 / 44% Concept stores2 / 42% Factory outlets3 / 11% eCommerce4 / 3% Concession corners
10 / Retail net sales by region
1 / 33% European Emerging Markets2 / 19% North America3 / 18% Western Europe4 / 12% Other Asian Markets5 / 11% Latin America6 / 7% Greater China
2014 1
2
3 4
2014
6 5
1
2 3
4
12 / Retail net sales by quarter (€ in millions)
Q4 2014 1,043Q4 2013 934
Q3 2014 1,047Q3 2013 923
Q2 2014 958Q2 2013 867
Q1 2014 794Q1 2013 722
13 / Retail gross margin by quarter (in %)
Q4 2014 59.2Q4 2013 61.0
Q3 2014 58.1Q3 2013 61.5
Q2 2014 60.5Q2 2013 65.4
Q1 2014 59.9Q1 2013 60.7

1422 0 1 4
/ 03.3 /
adidas Group / 2014 Annual Report
Group Management Report – Financial ReviewBusiness Performance by Segment / Retail Business Performance
15 / Retail number of stores by store format
2014 2013
Concept stores 1,746 1,661
Factory outlets 851 779
Concession corners 316 300
Total 2,913 2,740
■ 2014 ■ 2013
16 / Retail number of stores development
Total Concept stores
Factory outlets
Concession corners
2013 2,740 1,661 779 300
Opened 409 251 126 32
Closed 236 166 54 16
Opened (net) 173 85 72 16
2014 2,913 1,746 851 316
14 / Retail segmental operating profit by quarter
(€ in millions)
Q4 2014 181Q4 2013 166
Q3 2014 207Q3 2013 195
Q2 2014 180Q2 2013 216
Q1 2014 105Q1 2013 101
closed 16. As a result, the number of concession corners increased by 16 to 316 at the end of 2014 (December 31, 2013: 300), of which 207 were related to the adidas brand and 109 to the Reebok brand. Currency translation effects had a negative impact on sales in euro terms. Concession corner sales increased 15% to € 133 million in 2014 (2013: € 115 million).
eCommerce revenues include e-commerce operations of the adidas and Reebok brands. In 2014, sales from adidas and Reebok e-commerce platforms were up 72% on a currency-neutral basis. Sales increased at strong double-digit rates at both adidas and Reebok. Currency translation effects had a negative impact on sales in euro terms. eCommerce revenues grew 69% to € 422 million from € 250 million in 2013.
see Table 16

Group Management Report – Financial Review
1432 0 1 4
/ 03.3 /
adidas Group / 2014 Annual Report
Business Performance by Segment / Other Businesses Performance
Other Businesses Performance
Other Businesses full year resultsIn 2014, revenues of Other Businesses decreased 19% on a currency-neutral basis, due to double-digit sales declines at TaylorMade-adidas Golf. Sales at Reebok-CCM Hockey grew at a high-single-digit rate, and revenues of Other Centrally Managed Brands increased at a double-digit rate. Currency translation effects negatively impacted revenues in euro terms. Sales of Other Businesses declined 21% to € 1.316 billion (2013: € 1.657 billion).
Other Businesses gross profit was down 31% to € 457 million in 2014 versus € 660 million in 2013. Gross margin decreased 5.1 percentage points to 34.7% (2013: 39.8%). This development was mainly due to significantly lower product margins at TaylorMade-adidas Golf as a result of ongoing efforts to clean retail inventories, particularly in the USA, as well as the strategic decision to postpone product launches planned for 2014.
Segmental operating expenses in Other Businesses primarily relate to expenditure for sales force and administration as well as sales working budget expenses for TaylorMade-adidas Golf and Reebok-CCM Hockey. In 2014, segmental operating expenses decreased 1% to € 203 million from € 205 million in 2013 despite restructuring charges for the streamlining of the TaylorMade-adidas Golf organisation. Segmental operating expenses as a percentage of sales increased 3.0 percentage points to 15.4% (2013: 12.4%).
see Table 17
see Table 17
17 / Other Businesses at a glance 1) (€ in millions)
2014 2013 Change
Net sales 1,316 1,657 (21%)
Gross profit 457 660 (31%)
Gross margin 34.7% 39.8% (5.1pp)
Segmental operating profit 254 455 (44%)
Segmental operating margin 19.3% 27.4% (8.1pp)
1) Figures reflect continuing operations as a result of the planned divestiture of the Rockport business.
18 / Other Businesses net sales by region 1) (€ in millions)
2014 2013 Change Change (currency-
neutral)
Western Europe 282 291 (3%) (5%)
European Emerging Markets 23 24 (5%) 7%
North America 755 931 (19%) (18%)
Greater China 25 36 (32%) (31%)
Other Asian Markets 221 361 (39%) (35%)
Latin America 10 14 (31%) (20%)
Total 2) 1,316 1,657 (21%) (19%)
1) Figures reflect continuing operations as a result of the planned divestiture of the Rockport business.2) Rounding differences may arise in totals.

1442 0 1 4
/ 03.3 /
adidas Group / 2014 Annual Report
Group Management Report – Financial ReviewBusiness Performance by Segment / Other Businesses Performance
Segmental operating profit decreased 44% to € 254 million in 2014 versus € 455 million in the prior year. Segmental operating margin was down 8.1 percentage points to 19.3% from 27.4% in 2013. This was a result of the gross margin decrease as well as the negative impact from higher segmental operating expenses as a percentage of sales.
Other Businesses development by regionIn 2014, currency-neutral sales of Other Businesses decreased in most regions. Revenues in Western Europe were down 5% on a currency-neutral basis due to double-digit sales declines at TaylorMade-adidas Golf, which more than offset double-digit sales increases at Other Centrally Managed Brands. Revenues at Reebok-CCM Hockey decreased at a low-single-digit rate. Sales in European Emerging Markets increased 7% on a currency-neutral basis. Strong double-digit sales growth at Reebok-CCM Hockey was partly offset by sales declines at TaylorMade-adidas Golf. Currency-neutral sales in North America were down 18%, due to double-digit decreases at TaylorMade-adidas Golf. Revenues at Reebok-CCM Hockey increased at a high-single-digit rate, while sales at Other Centrally Managed Brands grew at a double-digit rate. Revenues in Greater China, Other Asian Markets and Latin America decreased 31%, 35% and 20%, respectively, due to double-digit sales decreases at TaylorMade-adidas Golf. Currency translation effects had a mixed impact on regional sales in euro terms.
Other Businesses development by segmentIn 2014, TaylorMade-adidas Golf revenues decreased 28% on a currency-neutral basis. The pronounced decrease is due to TaylorMade-adidas Golf’s strategic decision to clean retail inventories in the golf market and postpone product launches planned for 2014. This resulted in double-digit sales declines in metalwoods and irons in 2014. Currency translation effects negatively impacted TaylorMade-adidas Golf sales in euro terms. Revenues decreased 29% to € 913 million from € 1.285 billion in the prior year.
see Table 17
see Table 18
20 / Other Businesses net sales by segment 1)
1) Figures reflect continuing operations as a result of the planned divestiture of the Rockport business.
1 / 69% TaylorMade-adidas Golf2 / 20% Reebok-CCM Hockey3 / 10% Other Centrally Managed
Brands
19 / Other Businesses net sales by region 1)
1) Figures reflect continuing operations as a result of the planned divestiture of the Rockport business.
1 / 57% North America2 / 21% Western Europe3 / 17% Other Asian Markets4 / 2% European Emerging Markets5 / 2% Greater China6 / 1% Latin America
2014 1
2
3
2014
6 5
1 2
3 4

Group Management Report – Financial Review
1452 0 1 4
/ 03.3 /
adidas Group / 2014 Annual Report
Business Performance by Segment / Other Businesses Performance
Currency-neutral Reebok-CCM Hockey sales were up 7%. This increase is mainly due to growth in key categories such as sticks and protective equipment as well as in hockey apparel. Currency translation effects negatively impacted sales in euro terms. Reebok-CCM Hockey revenues increased 4% to € 269 million in 2014 from € 260 million in 2013.
Other Centrally Managed Brands revenues increased 19% on a currency-neutral basis, driven by double-digit growth at Y-3, Five Ten and Porsche Design Sport by adidas. Currency translation effects had a negative impact on sales in euro terms. Revenues in Other Centrally Managed Brands also increased 19% to € 134 million in 2014 (2013: € 112 million).
21 / Other Businesses net sales by quarter 1)
(€ in millions)
Q4 2014 350Q4 2013 405
Q3 2014 280Q3 2013 332
Q2 2014 357Q2 2013 433
Q1 2014 329Q1 2013 487
1) Figures reflect continuing operations as a result of the planned divestiture of the Rockport business.
22 / Other Businesses gross margin by quarter 1)
(in %)
Q4 2014 31.2Q4 2013 37.5
Q3 2014 32.7Q3 2013 32.4
Q2 2014 36.9Q2 2013 42.3
Q1 2014 37.9Q1 2013 44.6
1) Figures reflect continuing operations as a result of the planned divestiture of the Rockport business.
23 / Other Businesses segmental operating profit by quarter 1) (€ in millions)
Q4 2014 62Q4 2013 107
Q3 2014 42Q3 2013 56
Q2 2014 79Q2 2013 127
Q1 2014 71Q1 2013 165
1) Figures reflect continuing operations as a result of the planned divestiture of the Rockport business.

4
1462 0 1 4
Subsequent Events and Outlook
/ 03.4 /
adidas Group / 2014 Annual Report
Group Management Report – Financial Review
Subsequent Events and OutlookIn 2015, despite a high degree of economic uncertainty in Russia/CIS and the Middle East, we expect global economic growth to increase. This will be supported by a more favourable labour market development as well as low financing and energy costs, which are forecasted to positively impact consumer spending, providing a positive backdrop for the continued growth and expansion of the sporting goods industry. Through the extensive pipeline of new and innovative products at all brands and the positive effects from increased brand-building activities, tight control of inventory levels and strict cost management, we project top- and bottom-line improvements in our Group’s financial results in 2015. We forecast adidas Group sales to increase at a mid-single-digit rate on a currency-neutral basis, with growth expected at all brands. Given the recent strengthening of major currencies versus the euro, most notably the US dollar and the Chinese renminbi, currency translation is expected to have a positive impact on our top-line development in reported terms. Group gross margin is expected to be significantly impacted by adverse currency movements and is forecasted to be at a level between 47.5% and 48.5%. Group operating margin is expected to be at a level between 6.5% and 7.0%. As a result, we project net income from continuing operations to increase at a rate of 7% to 10%.
Subsequent Events
Divestiture of Rockport segment On January 23, 2015, the adidas Group announced that it had entered into a definitive agreement to sell its Rockport business for a total consideration of up to US $ 280 million, most of which will be paid in cash with the remainder comprised of notes. With this divestiture, the Group aims to better focus on core activities. The transaction, which is subject to customary closing conditions, is expected to be completed later in 2015.
Outlook
Forward-looking statementsThis Management Report contains forward-looking statements that reflect Management’s current view with respect to the future development of the adidas Group. The outlook is based on estimates that we have made on the basis of all the information available to us at this point in time. In addition, such forward-looking statements are subject to uncertainties as described in the Risk and Opportunity Report, which are beyond the control of the adidas Group. In case the underlying assumptions turn out to be incorrect or described risks or opportunities materialise, actual results and developments may materially deviate (negatively or positively) from those expressed by such statements. The adidas Group does not assume any obligation to update any forward-looking statements made in this Management Report beyond statutory disclosure obligations.
see Note 04, p. 207see Note 11, p. 209
see Risk and Opportunity Report, p. 154

Group Management Report – Financial Review
1472 0 1 4
Subsequent Events and Outlook
/ 03.4 /
adidas Group / 2014 Annual Report
Global economy to grow in 2015 1)
Global GDP growth is projected to increase moderately to 3.0% in 2015. At 2.2%, developed economies are expected to grow slightly faster than last year, supported by improving labour markets and low financing costs. Growth in developing countries should benefit from the strengthened recovery in high-income markets and accelerate somewhat in 2015. Oil prices are foreseen to remain low, encouraging global growth and resulting in more divergent outlooks for oil-exporting and oil-importing countries.
In Western Europe, external demand is likely to improve slightly, and consumer spending is expected to remain resilient as a result of stronger real wages from declining oil prices. Financial fragmentation as well as high unemployment and unresolved fiscal challenges in some countries are forecasted to dampen the recovery. As a result, the region’s GDP is expected to expand at around the same rate as in the previous year (2014: 1.3%). In Germany, private consumer demand will prevail as the major driver of growth, which is however projected to be held back by subdued investment spending.
European emerging markets are expected to grow at a moderate pace of 1.5% in 2015, as persistent political tensions and uncertainty will slow down investment spending, while further currency devaluations, high inflationary pressures and low real wages will impact private household demand. Such a high-risk scenario would particularly affect Russia’s economy, which is forecasted to contract 3.0% this year.
In the USA, private consumption is projected to remain the major source of growth supported by declining energy prices. While the strong US dollar will dampen export activity, investment spending is expected to increase. As a result, the US economy is forecasted to grow 3.2% in 2015.
Asia’s GDP is projected to increase 4.2% in 2015. With the exception of Japan, growth is expected to remain relatively high during the year, supported by healthy industrial activity, manageable inflationary pressures and significant wage increases. China should remain the fastest-growing economy, forecasted to expand 7.3%, with external demand picking up and private consumption remaining stable. While Japan is predicted to continue to grow at subdued levels, modestly profiting from low oil prices, India is expected to drive growth through private domestic demand and strengthened investment.
In Latin America, GDP growth is expected to increase somewhat to 1.2% in 2015, with exports and investment supporting expansion. Positive performance in several countries will offset the slow recovery of the largest economies, e.g. Brazil and Argentina, where currency fluctuations and the unfavourable job market conditions with its negative implications for household consumption will drive the forecasted decline in economic activity. 1) Sources: World Bank, HSBC Global Research.
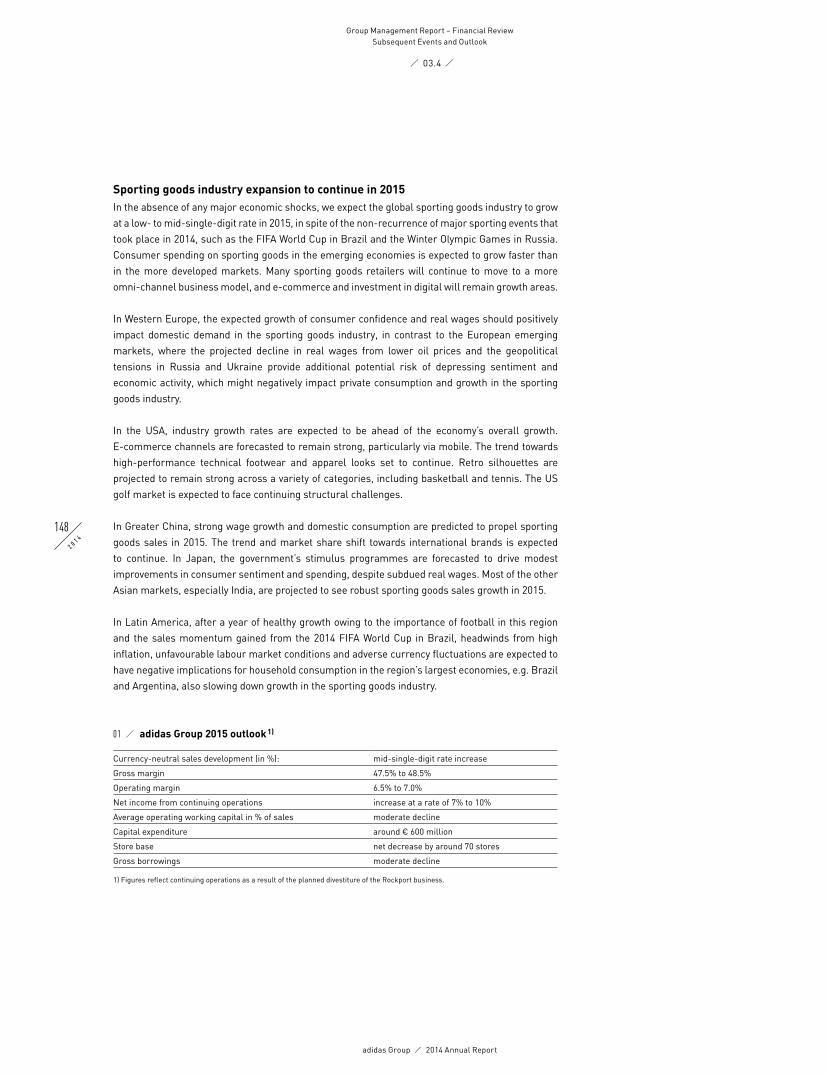
1482 0 1 4
Subsequent Events and Outlook
/ 03.4 /
adidas Group / 2014 Annual Report
Group Management Report – Financial Review
Sporting goods industry expansion to continue in 2015In the absence of any major economic shocks, we expect the global sporting goods industry to grow at a low- to mid-single-digit rate in 2015, in spite of the non-recurrence of major sporting events that took place in 2014, such as the FIFA World Cup in Brazil and the Winter Olympic Games in Russia. Consumer spending on sporting goods in the emerging economies is expected to grow faster than in the more developed markets. Many sporting goods retailers will continue to move to a more omni-channel business model, and e-commerce and investment in digital will remain growth areas.
In Western Europe, the expected growth of consumer confidence and real wages should positively impact domestic demand in the sporting goods industry, in contrast to the European emerging markets, where the projected decline in real wages from lower oil prices and the geopolitical tensions in Russia and Ukraine provide additional potential risk of depressing sentiment and economic activity, which might negatively impact private consumption and growth in the sporting goods industry.
In the USA, industry growth rates are expected to be ahead of the economy’s overall growth. E-commerce channels are forecasted to remain strong, particularly via mobile. The trend towards high-performance technical footwear and apparel looks set to continue. Retro silhouettes are projected to remain strong across a variety of categories, including basketball and tennis. The US golf market is expected to face continuing structural challenges.
In Greater China, strong wage growth and domestic consumption are predicted to propel sporting goods sales in 2015. The trend and market share shift towards international brands is expected to continue. In Japan, the government’s stimulus programmes are forecasted to drive modest improvements in consumer sentiment and spending, despite subdued real wages. Most of the other Asian markets, especially India, are projected to see robust sporting goods sales growth in 2015.
In Latin America, after a year of healthy growth owing to the importance of football in this region and the sales momentum gained from the 2014 FIFA World Cup in Brazil, headwinds from high inflation, unfavourable labour market conditions and adverse currency fluctuations are expected to have negative implications for household consumption in the region’s largest economies, e.g. Brazil and Argentina, also slowing down growth in the sporting goods industry.
01 / adidas Group 2015 outlook 1)
Currency-neutral sales development (in %): mid-single-digit rate increase
Gross margin 47.5% to 48.5%
Operating margin 6.5% to 7.0%
Net income from continuing operations increase at a rate of 7% to 10%
Average operating working capital in % of sales moderate decline
Capital expenditure around € 600 million
Store base net decrease by around 70 stores
Gross borrowings moderate decline
1) Figures reflect continuing operations as a result of the planned divestiture of the Rockport business.

Group Management Report – Financial Review
1492 0 1 4
Subsequent Events and Outlook
/ 03.4 /
adidas Group / 2014 Annual Report
adidas Group currency-neutral sales to increase at a mid-single-digit rate in 2015We expect adidas Group sales to increase at a mid-single-digit rate on a currency-neutral basis in 2015. Despite a high degree of uncertainty regarding the economic outlook and consumer spending in Russia/CIS, the positive sales development will be supported by rising consumer confidence in most geographical areas. In particular, Group sales development will be favourably impacted by a significantly improved top-line development at TaylorMade-adidas Golf as well as ongoing robust momentum at both adidas and Reebok. This, as well as the further expansion and improvement of our controlled space initiatives, will more than offset the non-recurrence of sales related to the 2014 FIFA World Cup. Currency translation is expected to positively impact our top-line development in reported terms, given the recent strengthening of major currencies such as the US dollar and the Chinese renminbi versus the euro.
Currency-neutral combined sales of adidas and Reebok expected to increase in most geographical areas In 2015, we expect currency-neutral combined revenues of adidas and Reebok to increase in all our geographical areas except Russia/CIS. In Western Europe, despite the non-recurrence of the 2014 FIFA World Cup, which provided a positive stimulus in the region during the year, the gradual improvement in the macroeconomic environment as well as the build-up to the UEFA EURO 2016 towards the end of the year will positively impact sales development in this region. As a result, we forecast currency-neutral combined sales of adidas and Reebok in Western Europe to grow at a mid-single-digit rate, with both brands contributing to the sales increase. In North America, currency-neutral combined sales of adidas and Reebok are projected to grow at a low- to mid-single-digit rate. We expect robust top-line improvements at adidas, as the brand will strengthen its visibility in the marketplace by stepping up marketing investments as well as improving the overall product offering in major categories such as running, basketball and Originals. Currency-neutral Reebok sales are projected to be below the prior year level as a result of Reebok’s efforts to further streamline the brand’s factory outlet business in North America. In Greater China, currency-neutral combined sales of adidas and Reebok are forecasted to increase at a high-single-digit rate, as we expect the strong sales momentum to continue in 2015, with both brands contributing to the increase. This development will be supported by further expanding and solidifying our distribution footprint in the market. In Russia/CIS, the low level of consumer confidence and consumer spending will weigh on the overall sales development in the region and the adidas brand in particular. In addition, sales performance will be negatively impacted by a reduction of the store base in the market. As a result, currency-neutral combined sales of adidas and Reebok in Russia/CIS are expected to decline. In Latin America, the robust positioning of the adidas and Reebok brands is expected to more than compensate for the non-recurrence of the positive impetus from sales associated with the 2014 FIFA World Cup. As a result, we project currency-neutral combined sales of adidas and Reebok in Latin America to increase at a low- to mid-single-digit rate, with both brands contributing to this development. In Japan, last year’s increase in the consumption tax rate continues to dampen growth prospects in the region. Consequently, currency-neutral combined sales of adidas and Reebok are forecasted to grow at a low-single-digit rate, with sales at both brands projected to be above the prior year level. Lastly, in the region Middle East, Africa and other Asian markets, we expect currency-neutral combined sales of adidas and Reebok to grow at a high-single-digit rate, driven by markets such as South Korea and Southeast Asia, where both adidas and Reebok enjoy strong momentum.
1502 0 1 4
Subsequent Events and Outlook
/ 03.4 /
adidas Group / 2014 Annual Report
Group Management Report – Financial Review
Currency-neutral Wholesale revenues to grow at a mid-single-digit rateWe project currency-neutral Wholesale revenues to increase at a mid-single-digit rate compared to the prior year, with sales increases at both adidas and Reebok. Our growth expectations are supported by our order backlog development as well as positive retailer and trade show feedback. adidas Group currency-neutral Retail sales are projected to be around the prior year level. While comparable store sales are expected to remain stable compared to the prior year, the Group expects a net decrease of its store base of around 70 adidas and Reebok stores in 2015. We plan to open around 220 new stores, depending on the availability of desired locations. Approximately 290 stores will be closed over the course of the year, primarily in Russia/CIS. Around 100 stores will be remodelled.
Currency-neutral sales of Other Businesses to grow at a double-digit rateIn 2015, revenues of Other Businesses are expected to increase at a double-digit rate on a currency-neutral basis, driven by double-digit currency-neutral sales increases at TaylorMade-adidas Golf. After a year characterised by high inventory levels and discounting activities, TaylorMade-adidas Golf will see major product launches in core categories such as metalwoods and irons throughout the year. In addition, new product introductions in footwear should support growth at TaylorMade-adidas Golf. Currency-neutral sales at Reebok-CCM Hockey are expected to grow at a mid-single-digit rate, supported by new product introductions in the key categories skates and protective equipment.
Group gross margin expected to be negatively impacted by currency movements In 2015, the adidas Group gross margin is forecasted to be at a level between 47.5% and 48.5% (2014: 47.6%). Higher product margins at TaylorMade-adidas Golf as a result of lower levels of clearance activity as well as a more favourable pricing and product mix at both adidas and Reebok are expected to positively influence the Group’s gross margin development. However, adverse currency movements in emerging markets, in particular in Russia/CIS, are expected to negatively impact the Group’s gross margin development. The wider than usual target corridor reflects the currently persisting high degree of uncertainty regarding future currency movements.

Group Management Report – Financial Review
1512 0 1 4
Subsequent Events and Outlook
/ 03.4 /
adidas Group / 2014 Annual Report
Group other operating expenses as a percentage of sales around prior year level In 2015, the Group’s other operating expenses as a percentage of sales are expected to be around the prior year level (2014: 42.7%). Sales and marketing working budget as a percentage of sales is projected to increase versus the prior year. Given the robust momentum at adidas and Reebok, we will step up marketing and point-of-sale investments in 2015 to secure and drive faster growth rates and market share gains, particularly in developed markets such as North America and Western Europe. As part of these marketing efforts, both adidas and Reebok launched major brand campaigns at the beginning of the year. Operating overhead expenditure as a percentage of sales is forecasted to be around the level recorded in 2014.
We expect the number of employees within the adidas Group to increase versus the prior year level. The adidas Group will continue to spend around 1% of Group sales on research and development in 2015. Areas of particular focus include cushioning and energy solutions, lightweight and digital sports technologies as well as sustainable product innovation. Additionally, investments and research emphasis will also include areas such as new manufacturing processes and advanced materials to drive the development of innovative products and industry-changing manufacturing approaches.
Operating margin to be between 6.5% and 7.0%In 2015, we expect the operating margin for the adidas Group to be at a level between 6.5% and 7.0% (2014 excluding goodwill impairment losses: 6.6%). This development will be strongly influenced by currency movements.
Net income from continuing operations to increase at a rate of 7% to 10%Net income from continuing operations is projected to increase at a rate of 7% to 10%, thus outpacing the Group’s expected top-line development (2014: net income from continuing operations of € 642 million). Interest rate expenses in 2015 are forecasted to remain at the prior year level, as the positive effects from lower interest rates as a result of the issuance of two Eurobonds will be offset by higher debt levels. Net foreign exchange losses in the financial result are also expected to be at a similar level compared to the prior year. The Group’s tax rate is expected to be at a level of around 29.5% and thus more favourable compared to the 2014 effective tax rate excluding goodwill impairment losses of 29.7%.
Average operating working capital as a percentage of sales to decrease moderatelyIn 2015, average operating working capital as a percentage of sales is expected to decrease moderately compared to the prior year level (2014: 22.4%). This is mainly due to working capital improvements we expect to achieve as we move through the year.
see Research and Development, p. 73

1522 0 1 4
Subsequent Events and Outlook
/ 03.4 /
adidas Group / 2014 Annual Report
Group Management Report – Financial Review
Capital expenditure of around € 600 million In 2015, capital expenditure is expected to increase to a level of around € 600 million (2014: € 554 million). Investments will mainly focus on adidas and Reebok controlled space initiatives in emerging markets as well as in Western Europe and North America. These investments will account for the majority of total capital expenditure in 2015. Other areas of investment include the Group’s logistics infrastructure as well as the further development of the adidas Group headquarters in Herzogenaurach. All investments within the adidas Group in 2015 are expected to be fully financed through cash generated from operating activities.
Excess cash to be used to support growth initiativesIn 2015, we expect continued positive cash flow from operating activities. Cash will be used to finance working capital needs, investment activities, dividend payments as well as the Group’s share buyback programme. We intend to largely use excess cash to invest in our growth activities, in particular the further expansion and improvement of our controlled space initiatives. In 2015, gross borrowings of € 288 million will mature. In order to ensure long-term flexibility, we aim to maintain a ratio of net borrowings over EBITDA of less than two times as measured at year-end (2014: 0.1).
Efficient liquidity management in place for 2015 and beyond Efficient liquidity management remains a priority for the adidas Group in 2015. We focus on continuously anticipating the operating cash flows of our Group segments, as this represents the main source of liquidity within the Group. Liquidity is planned on a rolling monthly basis under a multi-year financial and liquidity plan. Long-term liquidity is ensured by continued positive operating cash flows and sufficient financial flexibility through unused credit facilities.
Management to propose dividend of € 1.50The adidas AG Executive and Supervisory Boards intend to again recommend paying a dividend of € 1.50 to shareholders at the Annual General Meeting (AGM) on May 7, 2015 (2013: € 1.50). This reflects their confidence in the strength of the Group’s financial position and long-term aspirations. Subject to shareholder approval, the dividend will be paid on May 8, 2015. Based on the number of shares outstanding at the end of 2014, the total payout of € 306 million (2013: € 314 million) reflects a payout ratio of 53.9% of net income attributable to shareholders, excluding goodwill impairment losses, versus 37.4% in the prior year. While this is above the Group’s dividend payout corridor of between 20% and 40% of net income attributable to shareholders, it reflects our commitment to a consistent, shareholder-oriented dividend policy.
see Treasury, p. 121

Group Management Report – Financial Review
1532 0 1 4
Subsequent Events and Outlook
/ 03.4 /
adidas Group / 2014 Annual Report
03 / Major 2015 product launches
Product Brand
A totally new F50 football boot adidas
Newly designed Predator Nitrocharge and 11 Pro football boots adidas
New F50 Messi football boot adidas
Ultra Boost running shoe adidas
Supernova Glide 7 running shoe adidas
Springblade problade running shoe adidas
ClimaHeat Rocket Boost running shoe adidas
J Wall 2 basketball shoe adidas
D Rose 773 IV basketball shoe adidas
D Lillard basketball shoe adidas
Crazylight Boost prime basketball shoe adidas
adidas x Marvel Avengers collection adidas
ClimaChill training collection adidas
Manchester United licensed products adidas
Terrex Agravic outdoor line adidas
Terrex Boost outdoor shoe adidas
Originals Superstar shoe adidas
Originals ZX Flux shoe adidas
Originals Tubular shoe adidas
Originals Stan Smith shoe adidas
Originals x Rita Ora line adidas
ZPump Fusion TR running shoe Reebok
Nano 5.0 training shoe Reebok
UFC uniform collection Reebok
Skyscape Runaround 2.0 shoe Reebok
Ventilator OG shoe Reebok
Ventilator Reflective shoe Reebok
R15 driver TaylorMade
Aeroburner metalwood TaylorMade
Aeroburner fairway woods TaylorMade
adipower sport Boost golf shoe adidas Golf
Red hybrid Adams Golf
R-Series sticks Reebok Hockey
Tacks protective and gloves CCM
RibCor skates CCM
Ultra Tacks sticks CCM
JetSpeed skates CCM

5
1542 0 1 4
Risk and Opportunity Report
/ 03.5 /
adidas Group / 2014 Annual Report
Group Management Report – Financial Review
Risk and Opportunity ReportThe adidas Group continuously explores and develops opportunities to sustain earnings and drive long-term increases in shareholder value. We acknowledge that in our daily business we are exposed to various risks and that it is necessary to take certain risks in order to be competitive and ensure sustainable success. Our risk and opportunity management principles and system provide the framework for our Group to conduct business in a well-controlled environment.
Risk and opportunity management principlesWe define risk as the potential occurrence of an external or internal event (or series of events) that may negatively impact our ability to achieve the Group’s business objectives or financial goals. Opportunity is defined as the potential occurrence of an external or internal event (or series of events) that can positively impact the Group’s ability to achieve its business objectives or financial goals. We have summarised risks in four main categories: Strategic, Operational, Legal & Compliance and Financial. Opportunities are classified in two main categories: Strategic & Operational and Financial.
Risk and opportunity management systemThe adidas AG Executive Board has the overall responsibility to operate an effective risk and opportunity management system that ensures comprehensive and consistent management of all material risks and opportunities. The Group Risk Management department coordinates the execution and further development of the adidas Group’s risk and opportunity management system and is the owner of the centrally managed risk and opportunity management process on behalf of the adidas AG Executive Board. The adidas AG Supervisory Board has the responsibility to monitor the effectiveness of the Group’s risk management system. These duties are undertaken by the Supervisory Board’s Audit Committee. In addition, the Group Internal Audit department also includes an assessment of the effectiveness of risk management processes and compliance with the Group Risk Management Policy as part of its regular auditing activities with selected adidas Group subsidiaries or functions each year.
To facilitate effective risk and opportunity management, we implemented an integrated risk and opportunity management system, which is based on the integrated frameworks for enterprise risk management and internal controls developed and published by the Committee of Sponsoring Organizations of the Treadway Commission (COSO). Additionally, it has been adapted to more appropriately reflect the structure as well as company and management culture of the adidas Group. This system focuses on the identification, evaluation, handling, monitoring and reporting of risks and opportunities. The key objective of the risk and opportunity management system is to protect and further grow shareholder value through an opportunity-focused but risk-aware decision-making framework. Our Group Risk Management Policy, which is available on our intranet, outlines the principles, processes, tools, risk areas, key responsibilities, reporting requirements and communication timelines within our Group.

Group Management Report – Financial Review
1552 0 1 4
Risk and Opportunity Report
/ 03.5 /
adidas Group / 2014 Annual Report
Risk and opportunity management is a Group-wide activity which utilises critical day-to-day management insight from both global and local business units and functions. Our risk and opportunity management process contains the following components:
/ Risk and opportunity identification: The adidas Group continuously monitors the macroeconomic environment, developments in the sporting goods industry, as well as internal processes, to identify risks and opportunities as early as possible. Our Group-wide network of Risk Owners (i.e. all direct reports to the adidas AG Executive Board, including the Managing Directors of all our markets) ensures effective identification of risks and opportunities. The Group Risk Management department has defined a catalogue of potential risk areas (Risk Universe) to assist Risk Owners in identifying and categorising risks and opportunities.
The Risk Owners use various instruments in the risk and opportunity identification process, such as primary qualitative and quantitative research including trend scouting, consumer surveys as well as feedback from our business partners and controlled space network. These efforts are supported by global market research and competitor analysis. Through this process, we seek to identify the markets, categories, consumer target groups and product styles which show most potential for future growth at a local and global level. Equally, our analysis focuses on those areas that are at risk of saturation or exposed to increased competition or changing consumer tastes. However, our risk and opportunity identification process is not only limited to external risk factors or opportunities; it also includes an internal perspective that considers processes, projects, human resources and compliance aspects.
Supervisory and Executive Boards
Group Risk ManagementRisk Management Policy & Methodology/Support
Monitoring & Reporting
Identification
Evaluation
Handling Risk Owners
01 / adidas Group risk and opportunity management system

1562 0 1 4
Risk and Opportunity Report
/ 03.5 /
adidas Group / 2014 Annual Report
Group Management Report – Financial Review
/ Risk and opportunity evaluation: In order to manage risks and opportunities in an effective way, we evaluate identified risks and opportunities individually according to a systematic evaluation methodology, which is applied consistently and allows adequate prioritisation as well as allocation of resources. Risk and opportunity evaluation is also part of the Risk Owners’ responsibility. The Group Risk Management department supports and guides the Risk Owners in the evaluation process. According to our risk and opportunity management methodology, risks and opportunities are evaluated by looking at two dimensions: the potential (financial) impact and the likelihood that this impact materialises, both considering the upcoming twelve-month period. This, however, does not mean that the respective Risk Owners are only looking at risks from a short-term perspective. Their assessment also includes a mid-term (12 to 24 months) and long-term (beyond 24 months) perspective. The potential impact is evaluated by utilising five categories: marginal, minor, moderate, significant and major. These categories represent quantitative or equivalent qualitative measurements. The quantitative measurements are based on the potential financial effect on the relevant income statement metrics (operating profit, financial result or tax expenses). Qualitative measurements used are, for example, the degree of media exposure or additional senior management attention needed. Likelihood represents the possibility that a given risk or opportunity may materialise with the specific impact. The likelihood of individual risks and opportunities is evaluated on a percentage scale divided into five categories: unlikely, possible, likely, probable and highly probable.
see Table 02
02 / Corporate risk evaluation categories
Like
lihoo
d
Highly probable > 85%
Probable 50% – 85%
Likely 30% – 50%
Possible 15% – 30%
Unlikely < 15 %
Marginal Minor Moderate Significant Major
Financial equivalent 1)
≤ € 1 million € 1 million – € 10 million
€ 10 million – € 50 million
€ 50 million – € 100 million
≥ € 100 million
Qualitative equivalent
Almost no media coverage
Almost no senior management attention
Limited local media coverage
Less than 5% additional senior management attention
Local and limited national media coverage
5 – 10% additional senior management attention
National and limited international media coverage
10 – 20% additional senior management attention
Extensive international media coverage
Over 20% additional senior management attention
Potential impact
1) Based on operating profit, financial result or tax expenses.
Material risks

Group Management Report – Financial Review
1572 0 1 4
Risk and Opportunity Report
/ 03.5 /
adidas Group / 2014 Annual Report
When assessing risks, we consider two perspectives: the gross risk and the net risk. While the gross risk reflects the inherent (‘worst-case’) risk before any mitigating action, the net risk reflects the residual (‘expected’) risk after all mitigating action. On the one hand, this approach allows for a good understanding of the impact of mitigating action taken, and on the other hand it provides the basis for scenario analysis. Our assessment of risks presented in this report only reflects the net risk perspective. We measure the actual financial impact of high-level risks that materialised against the original assessment on a yearly basis. In this way, we ensure continuous monitoring of the accuracy of risk evaluations across the Group, which enables us to continuously improve evaluation methodology based on our findings.
In assessing the potential effect from opportunities, each opportunity is appraised with respect to viability, commerciality and potential risks. This approach is applied to longer-term strategic prospects but also to shorter-term tactical and opportunistic initiatives at both the Group and, more extensively, the market and brand level. In contrast to the risk evaluation, only the net perspective exists for assessing opportunities.
/ Risk and opportunity handling: Risks and opportunities are treated in accordance with the Group’s risk and opportunity management principles as described in the Group Risk Management Policy. Risk Owners are in charge of developing and implementing appropriate risk-mitigating action and exploiting opportunities within their area of responsibility. In addition, the Risk Owners need to determine a general risk handling strategy for the identified risks, which is either risk avoidance, risk reduction with the objective to minimise (financial) impact and/or likelihood, risk transfer to a third party or risk acceptance. The decision on the implementation of the respective risk handling strategy also takes into account the costs in relation to the effectiveness of any planned mitigating action if applicable. The Group Risk Management department works closely with the Risk Owners to monitor the continuous progress of planned mitigating action and assess the viability of already implemented mitigating action.
/ Risk and opportunity monitoring and reporting: Our integrated risk and opportunity management system aims to increase the transparency of Group risks and opportunities. As both risks and opportunities are subject to constant change, Risk Owners not only monitor developments but also the adequacy and effectiveness of the current risk handling strategy on an ongoing basis.
Regular risk reporting consists of a two-step reporting stream supported and facilitated by a globally used Group-wide IT solution that was implemented in 2011. Firstly, on a quarterly basis, Risk Owners are required to report to Group Risk Management risks with a possible gross impact rating of at least moderate or a net impact rating of at least minor, both regardless of the likelihood of materialising. Risk owners are also required to report all opportunities with an impact rating of at least minor. Secondly, Group Risk Management aggregates the reported risks and opportunities and, also on a quarterly basis, provides the adidas AG Executive Board with a consolidated Group-wide report based on the Risk Owners’ input, which highlights substantial individual risks and opportunities as well as, on an aggregated level, key areas of risk and opportunity.
Material changes in previously reported risks and/or newly identified risks with a potential net impact of at least moderate, and any issues identified which due to their material nature require immediate reporting to the Executive Board, are also reported outside the regular quarterly reporting stream on an ad hoc basis.

1582 0 1 4
Risk and Opportunity Report
/ 03.5 /
adidas Group / 2014 Annual Report
Group Management Report – Financial Review
Compliance management system (adidas Group Fair Play Compliance Framework)At the adidas Group, we consider compliance with the law as well as external and internal regulations to be imperative. Every employee is required to act ethically and in compliance with the law as well as with external and internal regulations while executing the Group’s business. Violations must be avoided under all circumstances. As a company with worldwide operations and more than 50,000 employees, however, the Group accepts that it will never be possible to exclude compliance violations with absolute certainty.
Both the adidas Group Fair Play Compliance Framework and our risk and opportunity management system are closely aligned and both are overseen by the Group’s Chief Compliance Officer who reports directly to the Group’s Chief Executive Officer. Together, these systems create the organisational requirements for Group-wide awareness of the respective governing law and of our internal rules and guidelines as well as for ensuring their observance. We see compliance as all-encompassing, spanning all business functions throughout the entire value chain, from supply chain through to the end consumer. As a result, the identification, analysis and evaluation of potential compliance risks are essential for our risk and opportunity management process. The Group Risk Management department works closely with the Risk Owners and responsible Compliance Officers to conduct a systematic assessment of key compliance risks on a quarterly basis.
The Group’s compliance management system is based on the OECD Principles of Corporate Governance. It refers to the OECD Guidelines for Multinational Enterprises and is designed to: / Support the achievement of qualitative and sustainable growth through good corporate
governance practice. / Reduce and mitigate the risk of financial losses or damage caused by non-compliant conduct. / Protect and further enhance the value and reputation of the Group and its brands through
compliant conduct. / Preserve diversity by fighting harassment and discrimination. / Contribute to continuous improvement in all aspects of the Group’s business.
Our Fair Play Code of Conduct, which is applicable in all regions and business areas, stipulates guidelines for behaviour in everyday work and is available both on our website and on our intranet. The Code of Conduct is the cornerstone of our compliance management programme which is founded on three pillars: prevention, detection and response.
see Legal & Compliance Risks, p. 170

Group Management Report – Financial Review
1592 0 1 4
Risk and Opportunity Report
/ 03.5 /
adidas Group / 2014 Annual Report
Prevention includes, for example, training such as the web-based Code of Conduct training (which is mandatory for all employees worldwide), general data protection training and an anti-trust training programme (for employees who are exposed to customers and competitors) incorporating web-based training and face-to-face training workshops.
To ensure timely detection of potential infringements of statutory regulations or internal guidelines, we have implemented whistleblowing procedures which allow employees to either report concerns over wrongdoing/potential compliance violations internally (e.g. directly to their supervisor, to the Chief Compliance Officer or other Compliance Officers, the relevant HR manager or the Works Council) or externally via an independent, confidential reporting hotline and email service. The hotline (Fair Play hotline) is available around the clock, seven days a week and can be called free of charge in over 60 countries worldwide. In addition, our Group Internal Audit and Profit Protection departments conduct regular audits and investigations to detect potential incidents of non-compliance. In case of reported or suspected compliance violations, ad hoc investigations may be undertaken as well.
Appropriate and timely response to compliance violations is essential. Therefore, we have established a global network of local Compliance Officers reporting directly to the Chief Compliance Officer of the Group as dedicated contact persons to whom complaints and information concerning compliance violations can be reported. We track, monitor and report potential incidents of non-compliance worldwide using a web-based reporting solution, which can be accessed by all Compliance Officers across the Group. Appropriate sanction mechanisms (including termination of employment) are used to react promptly to possible compliance violations. Insights gained from the investigation of past violations are used to continuously improve the compliance management system.
The Chief Compliance Officer regularly reports to the Executive Board on the further development of the compliance programme and on major compliance cases, which are also reported to the Audit Committee. Further, he reports to the Audit Committee at one of its meetings at least once a year concerning the contents and the further development of the compliance programme.
see Glossary, p. 258

1602 0 1 4
Risk and Opportunity Report
/ 03.5 /
adidas Group / 2014 Annual Report
Group Management Report – Financial Review
Description of the main features of the internal control and risk management system relating to the consolidated financial reporting process pursuant to § 315 section 2 no. 5 German Commercial Code (Handelsgesetzbuch – HGB)The internal control and risk management system relating to the consolidated financial reporting process of the adidas Group represents a process embedded within the Group-wide corporate governance system. It aims at providing reasonable assurance regarding the reliability of the Group’s external financial reporting by ensuring Group-wide compliance with statutory provisions, in particular the International Financial Reporting Standards (IFRS) and internal consolidated financial reporting policies (Group Finance Manual). We regard the internal control and risk management system as a process based on the principle of segregation of duties, encompassing various sub-processes in the areas of Accounting, Controlling, Taxes, Treasury, Planning, Reporting and Legal, focusing on the identification, assessment, treatment, monitoring and reporting of financial reporting risks. Clearly defined responsibilities are assigned to each distinct sub-process in the various areas. In a first step, the internal control and risk management system serves to identify and assess as well as to limit and control risks identified in the consolidated financial reporting process which might result in our consolidated financial statements not being in conformity with internal and external regulations.
Internal Control over Financial Reporting (ICoFR) serves to provide reasonable assurance regarding the reliability of reporting and compliance with applicable laws and regulations despite identified financial reporting risks. To monitor the effectiveness of ICoFR, the Group Internal Audit department and the Group Policies & Internal Controls department regularly review accounting-related processes. Additionally, as part of the year-end audit, the external auditor selects and examines internal controls, including the IT systems, to assess their effectiveness. The Audit Committee of the adidas AG Supervisory Board also monitors the effectiveness of ICoFR. However, due to limitations of ICoFR, even with appropriate and functional systems absolute certainty about the effectiveness of ICoFR cannot be guaranteed.
All Group companies are required to comply with consolidated financial reporting policies (Group Finance Manual), which are available to all employees involved in the financial reporting process through the Group-wide intranet. We update the Group Finance Manual on a regular basis, dependent on regulatory changes and internal developments. Changes to the Group Finance Manual are promptly communicated to all Group companies. Clear policies serve to limit employees’ scope of discretion with regard to recognition and valuation of assets and liabilities, thus reducing the risk of inconsistent accounting practices within the Group. We aim to ensure compliance with the Group Finance Manual through continuous adherence to the four-eyes principle in accounting-related processes. In addition, the local manager responsible for the accounting process within the Group companies and the respective local Managing Director confirm adherence to the Group Finance Manual and International Financial Reporting Standards in a signed representation letter, which is provided to Group Accounting on a quarterly basis.

Group Management Report – Financial Review
1612 0 1 4
Risk and Opportunity Report
/ 03.5 /
adidas Group / 2014 Annual Report
The accounting for Group companies is conducted either locally or by an adidas Group Shared Service Centre. Most of the IT ERP systems used are based on a Group-wide standardised SAP system. Some Group companies use Navision-based ERP software. As part of an initiative aimed at harmonising our system infrastructure (One ERP), we will also introduce an SAP-based ERP system within these Group companies in the medium term. Following approval by the Finance Director of the respective Group company, the local financial statements are transferred into a central consolidation system based on SAP SEM-BCS. At Group level, the regularity and reliability of the financial statements prepared by Group companies are reviewed by Group Accounting and Controlling. These measures include automated validation in the system as well as creation of reports and analyses to ensure data integrity and adherence to reporting logic. In addition, differences between current year and prior year financial data as well as budget figures are analysed on a distribution channel and market level. If necessary, the Group seeks the opinion of independent experts to review business transactions that occur infrequently and not on a routine basis. After ensuring data plausibility, the centrally coordinated and monitored consolidation process begins, running automatically on SAP SEM-BCS. Controls within the individual consolidation steps, such as those relating to the consolidation of debt or of income and expenses, are conducted both manually and system-based, using automatically created consolidation logs. Any inadequacies are remedied manually by systematically processing the individual errors and differences and are reported back to the Group companies. After finalisation of all consolidation steps, all items in the consolidated income statement and in the consolidated statement of financial position are analysed with respect to trends and variances. Unless already otherwise clarified, the Group companies are asked to explain any identified material deviations.
All financial systems used are protected against malpractice by means of appropriate authorisation concepts, approval concepts and access restrictions. Access authorisations are reviewed on a regular basis and updated if required. The risk of data loss or outage of accounting-related IT systems is minimised by Group IT through central control and monitoring of virtually all IT systems, centralised management of change processes and regular data backups.
Group’s governance structures and processes enhanced in 2014In 2014, we made further improvements to the Group’s governance structures and processes. We launched a completely overhauled Code of Conduct (our Fair Play Code of Conduct), updated our web-based Code of Conduct training and introduced a Fair Play mobile phone application available for download for the Group’s employees. Regarding risk and opportunity management, the Group Risk Management department held training sessions and workshops with Risk Owners and revamped the Risk Universe after benchmarking the Group’s risk and opportunity categories with those reported by the Group’s main competitors and retail partners.

1622 0 1 4
Risk and Opportunity Report
/ 03.5 /
adidas Group / 2014 Annual Report
Group Management Report – Financial Review
This report focuses on what we perceive as the Group’s material risks with the exception of interest rate risks and financing and liquidity risks. Material risks are all risks which were assessed with a major impact as well as all risks with an impact rating of significant and a likelihood rating of at least possible. The update of the Risk Universe affected the consolidation and aggregation of risks. As a result, some risks illustrated in this report may not be fully comparable with risks presented in last year’s report. The assessment of all risks is shown in the risks overview table.
see Table 03
03 / Corporate risk overview
Potential impact Change (2013 rating)
Likelihood Change (2013 rating)
Strategic risks
Macroeconomic, socio-political and regulatory risks Major Possible
Risks related to risk and control environment Major Possible (Unlikely)
Risks related to media and stakeholder activities Significant Likely
Competition risks Significant Likely (Possible)
Risks related to organisational structure and change Significant Likely
Operational risks
Business partner risks Major Possible
Own-retail risks Major Unlikely (Possible)
Hazard risks Major Unlikely (Possible)
IT risks Major Unlikely
Project risks Major Unlikely
Inventory risks Significant (Moderate) Likely
Marketing risks Significant Likely
Risks related to product assortment, innovation and design Significant Likely
Logistics risks Significant (Major) Possible
Legal & Compliance risks
Risks related to competition, trade, customs and tax regulations Major Unlikely (Possible)
Product quality risks Major (Significant) Unlikely (Possible)
Fraud and corruption risks Major Unlikely
Risks related to product counterfeiting and imitation Significant Likely (Unlikely)
Financial risks
Currency risks Major Likely
Risks related to impairment of goodwill/other intangible assets Major (Significant) Possible (Unlikely)
Credit risks Major Unlikely
Interest rate risks Minor Likely
Financing and liquidity risks Minor Unlikely
Group Management Report – Financial Review
1632 0 1 4
/ 03.5 /
adidas Group / 2014 Annual Report
Risk and Opportunity Report / Strategic Risks
Strategic Risks
Macroeconomic, socio-political and regulatory risksGrowth in the sporting goods industry is highly dependent on consumer spending and consumer confidence. Economic downturns and socio-political factors such as military conflicts, civil unrest, nationalisation or expropriation, in particular in regions where the Group is highly represented, therefore pose a significant risk to the Group’s business activities and top- and bottom-line performance. In addition, substantial changes in the regulatory environment (e.g. trade restrictions, social security systems, minimum wages, tax legislation, economic and political sanctions, etc.) could lead to potential sales shortfalls or cost increases.
To mitigate these macroeconomic, socio-political and regulatory risks, the Group strives to balance sales across key global regions and also between developed and emerging markets. We also continuously monitor the macroeconomic, political and regulatory landscape in all our key markets to anticipate potential problem areas, so that we are able to quickly adjust our business activities accordingly upon any change in conditions. Potential adjustments may be changes in product prices, closures of own-retail stores, more conservative product purchasing, tight working capital management and an increased focus on cost control. In addition, by building on our leading position within the sporting goods industry, we actively engage in supporting policymakers and regulators to liberalise global trade, curtail trade barriers and proactively adapt to significant changes in the regulatory environment.
Risks related to risk and control environmentFailure to identify and actively manage substantial risks and to implement and maintain adequate internal controls across the Group could result in incorrect decisions, higher costs, compliance violation and fraud and also cause reputational damage. Inadequate design, implementation and maintenance of the compliance management system may result in insufficient prevention and detection of, as well as response to, compliance violations and unethical behaviour. This could trigger fines or penalties, increased cost and management liability as well as reputational damage for the Group. Furthermore, a lack of documentation, training and enforcement of policies, processes and procedures could result in a lack of risk awareness among the Group’s employees and facilitates improper behaviour and compliance violations.
In order to adequately manage these risks, we continuously review and further develop our Group-wide risk management system, compliance management system and internal control network. In addition, we maintain a Global Policy Manual that illustrates all relevant Group policies and is freely accessible to all employees via the Group’s intranet. This is supported by regular employee training (e.g. Code of Conduct, anti-trust, workplace safety, etc.). We also document key business processes to create transparency and enable the implementation of proper control mechanisms.

1642 0 1 4
/ 03.5 /
adidas Group / 2014 Annual Report
Group Management Report – Financial ReviewRisk and Opportunity Report / Strategic Risks
Risks related to media and stakeholder activitiesThe adidas Group faces considerable risk if we are unable to uphold high levels of consumer awareness, affiliation and purchase intent for our brands. Adverse media coverage on our products or business practices as well as negative social media discussion may significantly hurt the Group’s reputation and brand image, lead to public misperception of the Group’s business performance and eventually result in a sales slowdown. Similarly, certain activities on the part of key stakeholders (e.g. non-governmental organisations, governmental institutions, etc.) could cause reputational damage, distract top management and disrupt business activities.
To mitigate these risks, we pursue proactive, open communication and engagement with key stakeholders (e.g. consumers, media, non-governmental organisations, the financial community, etc.) on a continuous basis. In addition, we have established clear crisis communication processes to ensure a quick and effective response to adverse developments. On a case-by-case basis, we also seek external advice from experts in communication and stakeholder management. We have also defined clear mission statements, values and goals for all our brands. These form the foundation of our product and brand communication strategies. Furthermore, we continue to invest significant marketing resources to build brand equity and foster consumer awareness.
Competition risksStrategic alliances amongst competitors and/or retailers, the increase of retailers’ own private label businesses and intense competition for consumers and promotion partnerships from well-established industry peers and new market entrants (e.g. new brands, vertical retailers) pose a substantial risk to the adidas Group. This could lead to harmful competitive behaviour, such as price wars in the marketplace or bidding wars for promotion partnerships. Sustained pricing pressure in one of the Group’s key markets could threaten the Group’s sales and profitability development. Aggressive competitive practices could also drive increases in marketing costs and market share losses, thus hurting the Group’s profitability and market position.
To mitigate competition risks, we continuously monitor and analyse competitive and market information in order to be able to anticipate unfavourable changes in the competitive environment rather than reacting to such changes. This enables us to proactively adjust our marketing and sales activities when needed. We also pursue a strategy of entering into long-term agreements with key promotion partners such as FIFA, FC Bayern Munich or Lionel Messi, as well as adding new partners to refresh and diversify our portfolio, e.g. Manchester United, UFC, James Rodriguez or Andrew Wiggins. In addition, our product and communication initiatives are designed to drive market share growth and to strengthen our brands’ market position.
see Global Brands Strategy, p. 53see Other Businesses Strategy, p. 60

Group Management Report – Financial Review
1652 0 1 4
/ 03.5 /
adidas Group / 2014 Annual Report
Risk and Opportunity Report / Operational Risks
Risks related to organisational structure and changeThe Group operates in a dynamic and fast-changing competitive environment. Therefore, organisational flexibility and the ability to adapt quickly to new competitive circumstances are critical to remain successful. A complex organisational structure and unclear roles and responsibilities across the Group can lead to untimely or sub-optimal decision-making, inefficient and ineffective processes and, consequently, higher costs. Improper planning and execution of reorganisation initiatives may reduce employee engagement, cause business disruption and result in higher costs. A high frequency in organisational changes could cause fatigue among the workforce and lead to reduced efficiency and productivity. Inadequate change management could lead to non-acceptance of changes by the workforce, lower employee engagement and inefficiencies.
We mitigate these risks by frequent, open and transparent communication with our employees. Our Executive Board members as well as the senior management team across the Group hold regular ‘town hall’ meetings to update employees on organisational changes and openly explain the reasons for change. To adequately manage change and to ensure clarity about roles and responsibilities throughout the organisation, we also utilise internal and external experts in project management, change management and communication, who actively educate and engage the workforce to embrace and support new organisational structures and processes.
Operational Risks
Business partner risksThe adidas Group interacts and enters into partnerships with various third parties such as retail partners, distributors, licensees, joint venture partners, suppliers, service providers or promotion partners. As a result, the Group is exposed to a multitude of business partner risks.
Failure to cement and maintain strong relationships with retailers, for example, could have substantial negative effects on our wholesale activities and thus the Group’s business performance. Losing important customers in key markets due to sub-par relationship management would result in significant sales shortfalls. In a few individual markets, we work with distributors or strategic partners whose approach might differ from our own distribution practices and standards, which could also negatively impact the adidas Group’s business performance. Similarly, failure to maintain strong relationships with suppliers or service providers could negatively impact the Group’s sales and profitability. Injuries to promotion partners, e.g. individual athletes, or weak on-field performance on the part of sponsored teams or athletes could reduce their consumer appeal and eventually result in lower sales and attractiveness of our brands. Risks may also arise from a dependence on particular suppliers, customers or service providers. Over-reliance on a supplier for a substantial portion of the Group’s product volume, or over-dependence on a particular customer, increases the Group’s vulnerability to delivery and sales shortfalls and could lead to significant margin pressure. Business partner default or other disruptive events such as strikes may negatively affect the Group’s business activities and result in additional costs and liabilities as well as lower sales for the Group. Unethical or non-compliant business practices on the part of business partners could have a negative spill-over effect on the Group’s reputation, lead to higher costs or liabilities and disrupt business activities.
see Glossary, p. 258

1662 0 1 4
/ 03.5 /
adidas Group / 2014 Annual Report
Group Management Report – Financial ReviewRisk and Opportunity Report / Operational Risks
To mitigate business partner risks, the Group has implemented various measures. For example, to reduce the risk of business interruption, we work with business partners who demonstrate reliability, quality and innovation. Furthermore, in order to minimise any potential negative consequences such as a violation of our Workplace Standards by our suppliers, we enforce strict control and inspection procedures at our suppliers and also demand adherence to social and environmental standards throughout our supply chain. In addition, we have selectively bought insurance coverage for the risk of business interruptions caused by physical damage to suppliers’ premises. To ensure strong relationships with retailers, the Group is committed to delivering outstanding customer service and providing our retail partners with the support and tools to establish and maintain a mutually successful business relationship. Customer relationship management is not only a key activity for our sales force but also of highest importance for our Group’s top executives and second-line management. To reduce dependency on any particular business partner, the Group follows a strategy of diversification. In this context, the Group works with a broad network of suppliers and, for the vast majority of its products, does not have a single-sourcing model. We also utilise a broad distribution strategy which includes further expanding our controlled space activities to reduce the risk of over-reliance on particular key customers. Specifically, no single customer accounted for more than 10% of Group sales in 2014. In addition, we work with a broad portfolio of promotion partners including individual athletes, club teams, federations or associations in numerous sports.
Own-retail risksNew own-retail stores require considerable up-front investment in furniture and fixtures as well as ongoing maintenance. In addition, own-retail activities often require longer-term lease or rent commitments. Retail also employs significantly more personnel in relation to sales than our wholesale business. The higher portion of fixed costs compared to our wholesale business may cause a larger profitability impact in cases of significant sales declines. Success in own retail is predominantly related to the skills and performance of our employees. High turnover of staff as well as a lack of the required skills and qualifications of own-retail employees could negatively affect sales and profitability. Ineffective or inconsistent leadership and an inadequate culture with respect to operating own-retail stores with commercial expertise may also contribute to suboptimal business performance. In addition, delayed openings or poorly executed store operations could lead to sales shortfalls and also negatively affect brand image. Furthermore, inability to secure appropriate store locations may result in a worse than expected sales development.
The Group reduces these risks by applying various measures. For example, the vast majority of our new lease contracts have durations of between five and ten years. In addition, store openings are managed according to a standardised Group-wide business plan model, taking into account our year-long own-retail experience and best practices from around the world. Store performance is measured by a retail scorecard consisting of nine quantitative key performance indicators. Underperforming stores are reorganised, remodelled or closed, as appropriate. Furthermore, we run multiple training initiatives for own-retail employees at all levels, from store assistant to top management. At the same time, we constantly monitor staff turnover and actively manage succession and career development to reduce attrition.
see Sustainability, p. 89
see Glossary, p. 258

Group Management Report – Financial Review
1672 0 1 4
/ 03.5 /
adidas Group / 2014 Annual Report
Risk and Opportunity Report / Operational Risks
Hazard risksThe adidas Group is exposed to external risks such as natural disasters, unfavourable weather conditions, epidemics, fire, accidents and malicious acts. Physical damage to our own or our suppliers’ premises, production units, warehouses and stock in transit can lead to property damage and business interruption.
These risks are mitigated by loss prevention measures such as working with reliable suppliers and logistics providers who guarantee high safety standards. In addition to the insurance coverage we have secured, the Group has implemented loss prevention (e.g. sprinklers in facilities) and contingency plans to quickly recover business activities in order to minimise potential negative effects.
IT risksKey business processes, including product marketing, order management, warehouse management, invoice processing, customer support and financial reporting, are all dependent on IT systems. A significant systems outage or application failure could result in considerable disruptions to our business. Virus or malware attacks could also lead to systems disruption and may result in the loss of business-critical and/or confidential information. Theft or leakage of confidential and sensitive information or data (e.g. product data, employee data, consumer data, etc.) could lead to reputational damage, penalties and higher costs.
To mitigate these risks, our IT organisation proactively engages in system preventive maintenance, service continuity planning and adherence to applicable IT policies. Data security is managed by restricting user access based on job description and adhering to data protection regulations. Additional security measures such as anti-virus software and firewalls are designed to further protect our systems and critical information. We perform multiple backups at alternating data centre locations for the Group’s core Enterprise Resource Planning System (ERP) on a daily basis. In addition, for the ERP system, our contingency solution allows us to quickly switch to a remote site if necessary – without any loss of data. System security, controls and reliability are regularly reviewed and tested by the Group’s Internal Audit department.
Project risksTo effectively support further business growth and improve efficiency, the Group continuously invests in new projects such as the creation, implementation and expansion of IT systems and distribution centres or the construction of office buildings. Ineffective project management could delay the execution of critical projects and lead to higher expenditures. Inadequate project planning and controlling as well as executional mistakes could cause inefficiencies, delays or business disruption, resulting in higher costs and sales shortfalls. Inappropriate project governance, prioritisation and oversight of the project portfolio may lead to suboptimal resource allocation and undesired project results.
We manage projects utilising reviews by project teams as well as project steering committees to ensure that the progress, quality and costs of those projects are regularly evaluated. To ensure true end-to-end management of key projects for the Group, we have established a cross-functional programme board under the leadership of the Group’s Executive Board member responsible for Global Operations. This approach allows early detection of project risks and quick implementation of corrective action or timely cancellation of projects with a low chance of success.

1682 0 1 4
/ 03.5 /
adidas Group / 2014 Annual Report
Group Management Report – Financial ReviewRisk and Opportunity Report / Operational Risks
Inventory risksAs we place initial production orders around six months in advance of delivery, the adidas Group is exposed to inventory risks relating to misjudging consumer demand at the time of production planning. A sudden decline in demand has the potential to cause excess inventories for the Group as well as in the marketplace. This can have negative implications for our financial performance, including product returns, higher levels of clearance activity and inventory obsolescence as well as reduced liquidity due to higher operating working capital requirements.
Similarly, a sudden increase in demand can lead to product shortfalls at the point of sale. In this situation, our Group faces the risk of missed sales opportunities and/or customer and consumer disappointment, which could lead to a reduction in brand loyalty and hurt our reputation as an On-Time In-Full supplier. In addition, the Group faces potential profitability impacts from additional costs such as airfreight in efforts to speed up replenishment.
In order to mitigate these risks, we actively manage inventory levels, for example by continuous monitoring of stock levels as well as centralising stock holding and clearance activities. We also continuously strive to improve our forecasting and material planning processes. To that end, in 2014, we continued to focus on our integrated business planning capabilities. In addition, our Global Operations function offers sophisticated and tailored replenishment models in order to shorten order-to-delivery times, ensuring availability of products while avoiding excess inventories. Furthermore, we are combining our global supply chain management and IT functions, to increase supply chain agility and reliability by leveraging real-time data analytics, thus ensuring product availability that meets consumer expectations.
Marketing risksFlawless execution of marketing activities is critical to the success of the Group and its brands. Therefore, unaligned product creation, range development, go-to-market or brand communication processes could lead to higher costs, suboptimal sales performance and the inability to resonate with the consumer as desired. Poorly executed marketing activities may also result in negative media coverage and hurt brand image. Similarly, inadequate or insufficient investment in brand-building could negatively affect our ability to maintain brand momentum and our competitive edge in the marketplace.
In 2014, as a result of the Group’s recent reorganisation aimed at strengthening ‘brand leadership’, our marketing organisation was given significantly broader responsibility along the entire product cycle, which will ensure closer alignment between the different functions, provide more consistency in execution and enable faster decision-making. Through continuous planning and collaboration within the marketing organisation and also cross-functionally, we enable both consumer relevance and operational excellence. For example, the new department ‘Concepts-to-Consumer’ will implement simpler and faster operations due to a direct flow of communications to each market, merging our product footprint and the ‘look & feel’.
In addition, we clearly prioritise spending in marketing initiatives and promotion partnerships by strategic relevance to ensure an appropriate return on investment.
see Internal Group Management System, p. 98
see Global Operations, p. 66

Group Management Report – Financial Review
1692 0 1 4
/ 03.5 /
adidas Group / 2014 Annual Report
Risk and Opportunity Report / Operational Risks
Risks related to product assortment, innovation and designInnovative and attractive products generate strong sales and, more importantly, create a halo effect for other products. Fulfilling the highest standards in terms of product quality and safety is critical to sustainable commercial success and forms an integral part of the product design and development phase. The speed with which new product technologies and fresh designs are brought to market is decisive for maintaining competitive advantage. Failure to create innovative products with cutting-edge design and strong consumer appeal could lead to a slowdown in brand momentum, lower brand attractiveness and, as a result, sales shortfalls and market share losses. Insufficient investment in innovation and design capabilities could negatively affect the Group’s competitive position in the marketplace and negatively impact top-line development. In addition, a lack of breadth and depth of our product ranges as well as an inappropriate price/value relationship in our products may negatively affect the Group’s top- and bottom-line performance.
Therefore, we continue to invest in innovation and design processes as well as the recruitment and retention of creative and innovative talent. In this context, we will open a new design studio in Brooklyn, New York/USA in 2015. To ensure we identify and quickly adapt to changing consumer preferences, we utilise extensive primary and secondary research tools and focus on streamlining research and development processes to speed up the time to market. Stringent product life cycle management enables us to keep our product offering fresh and cutting-edge.
Logistics risksAs a global company with business operations in numerous countries, the Group requires well-functioning logistics processes, from the supplier to our distribution centres and subsequently to the customer. Any interruption of these processes could negatively affect our ability to fulfil orders and deliver products, leading to higher inventory levels, sales shortfalls, additional costs and deterioration of customer relationships. Inability to secure transportation or warehousing capacity, errors by employees as well as malfunctions in IT logistics systems could all disrupt the flow of goods.
To mitigate these risks, we continuously monitor the global transportation market in order to be able to quickly adapt to changes in the transportation environment and secure required capacity. We work closely with multiple logistics service providers to guarantee transportation of our products to the desired destinations. In addition, we buy insurance coverage against theft or physical damage during transportation and storage. Furthermore, in case of malfunctioning logistics systems or warehouse processes, we actively re-prioritise the allocation of products to minimise damage caused.
see Research and Development, p. 73

1702 0 1 4
/ 03.5 /
adidas Group / 2014 Annual Report
Group Management Report – Financial ReviewRisk and Opportunity Report / Legal & Compliance Risks
Legal & Compliance Risks
Risks related to competition, trade, customs and tax regulationsNumerous laws and regulations regarding competition, trade, customs and taxes affect the adidas Group’s business practices worldwide. Non-compliance with regulations concerning fair competition, pricing, advertising, product imports (including calculation of customs values) or taxes could lead to substantial financial penalties and additional costs as well as negative media coverage and therefore reputational damage.
To proactively manage such risks, we constantly seek expert advice from specialised law or tax advisory firms and provide subject-matter training to our employees (e.g. competition law training). In addition, our internal legal, customs or tax departments advise our operational management teams to ensure appropriate and compliant business practices. Furthermore, we work closely with customs authorities and governments worldwide to make sure we adhere to customs and import regulations and obtain the required clearance of products to fulfil sales demand. In order to reduce the financial risk, we also create provisions in our financial statements in accordance with the relevant accounting regulations to account for potential disputes with customs or tax authorities.
Product quality risksThe adidas Group faces a risk of selling defective products, which may result in injury to consumers and/or brand and product image impairment. We mitigate this risk by employing dedicated teams that monitor the quality of our products on all levels of the supply chain through rigorous testing prior to production, close cooperation with suppliers throughout the manufacturing process, random testing after retail delivery, open communication about defective products and quick settlement of product liability claims when necessary. In 2014, we voluntarily recalled two Reebok-CCM Hockey products – an elbow pad and a goalie neck guard – in North America because they did not meet the Group’s high product quality standards.
Fraud and corruption risksWe face the risk that our employees and Executive Board breach rules and standards that guide appropriate and responsible business behaviour. This includes the risks of fraud, financial misstatements or manipulation, bribery and corruption. Our Group’s Fair Play Compliance Framework helps us manage these risks in a proactive way and enables us to prevent, detect and adequately respond in case of fraudulent or corrupt behaviour. Our Global Policy Manual provides a framework for basic work procedures and processes and our Fair Play Code of Conduct stipulates that every employee shall act ethically in compliance with the laws and regulations of the legal systems where they conduct Group business. All of our employees have to participate in a special Code of Conduct training. In addition, our Compliance Officers across the Group guide and advise our operating managers regarding fraud and corruption topics. Furthermore, we utilise controls such as segregation of duties in IT systems and data analytics technology to prevent or detect fraudulent activities. Whenever reasonable, we actively investigate and, in case of unlawful conduct, we work with state authorities to ensure rigorous enforcement of criminal law.

Group Management Report – Financial Review
1712 0 1 4
/ 03.5 /
adidas Group / 2014 Annual Report
Risk and Opportunity Report / Financial Risks
Risks related to product counterfeiting and imitationAs popular consumer brands which rely on technological and design innovation as defining characteristics, the Group’s brands are frequent targets for counterfeiting and imitation. To reduce the loss of sales and the potential damage to brand reputation resulting from counterfeit products, the adidas Group makes use of extensive legal protection (generally through registration) and works closely with law enforcement authorities, investigators and external legal counsel. Although we have stepped up measures such as product security labelling with our authorised suppliers, the development of these measures remains a key priority on an ongoing basis. In 2014, around twelve million counterfeit adidas Group products were seized worldwide (2013: ten million).
Financial Risks
Currency risksCurrency risks for the adidas Group are a direct result of multi-currency cash flows within the Group. Furthermore, translation impacts from the conversion of non-euro-denominated results into our Group’s functional currency, the euro, might lead to a material negative impact on our Group’s financial performance. The biggest single driver behind this risk results from the mismatch of the currencies required for sourcing our products versus the denominations of our sales. The vast majority of our sourcing expenses are in US dollars, while sales are denominated in other currencies to a large extent – most notably the euro. Our main exposures are presented in the table. The exposure from firm commitments and forecasted transactions was calculated on a one-year basis.
In line with IFRS 7 requirements, we have calculated the impact on net income and shareholders’ equity based on changes in our most important currency exchange rates. The calculated impacts mainly result from changes in the fair value of our hedging instruments. The analysis does not include effects that arise from the translation of our foreign entities’ financial statements into the Group’s reporting currency, the euro. The sensitivity analysis is based on the net balance sheet exposure, including intercompany balances from monetary assets and liabilities denominated in foreign currencies. Moreover, all outstanding currency derivatives were re-evaluated using hypothetical foreign exchange rates to determine the effects on net income and equity. The analysis was performed on the same basis for both 2013 and 2014.
Based on this analysis, a 10% increase in the euro versus the US dollar at December 31, 2014 would have led to a € 7 million increase in net income. The more negative market values of the US dollar hedges would have decreased shareholders’ equity by € 188 million. A 10% weaker euro at December 31, 2014 would have led to a € 8 million decrease in net income. Shareholders’ equity would have increased by € 233 million. The impacts of fluctuations of the US dollar against the Russian rouble and of the euro against the British pound and the Japanese yen on net income and shareholders’ equity are also included in accordance with IFRS requirements.
see Table 04
see Table 05

1722 0 1 4
/ 03.5 /
adidas Group / 2014 Annual Report
Group Management Report – Financial ReviewRisk and Opportunity Report / Financial Risks
However, many other financial and operational variables that could potentially reduce the effect of currency fluctuations are excluded from the analysis. For instance: / Interest rates, commodity prices and all other exchange rates are assumed constant./ Exchange rates are assumed at a year-end value instead of the more relevant sales-weighted
average figure, which we utilise internally to better reflect both the seasonality of our business and intra-year currency fluctuations.
/ The underlying forecasted cash flow exposure (which the hedge instrument mainly relates to) is not required to be revalued in this analysis.
/ Operational issues, such as potential discounts to key accounts, which have high transparency regarding the impacts of currency on our sourcing activities (due to their own private label sourcing efforts), are also excluded from this presentation.
Utilising a centralised currency risk management system, our Group hedges currency needs for projected sourcing requirements on a rolling basis up to 24 months in advance. Our goal is to have the vast majority of our hedging volume secured six months prior to the start of a given season. In rare instances, hedges are contracted beyond the 24-month horizon. The Group also largely hedges balance sheet risks. Due to our strong global position, we are able to partly minimise currency risk by utilising natural hedges.
Nevertheless, our gross US dollar cash flow exposure after natural hedges calculated for 2015 was roughly € 5.2 billion at year-end 2014, which we hedged using forward exchange contracts, currency options and currency swaps. Our Group’s Treasury Policy allows us to utilise hedging instruments, such as currency options or option combinations, which provide protection from negative exchange rate fluctuations while – at the same time – retaining the potential to benefit from future favourable exchange rate developments in the financial markets.
As 2015 hedging has almost been completed, it is clear that the EUR/USD conversion rate will improve compared to 2014. However, this positive effect is expected to be more than offset by less favourable exchange rates in the emerging markets (in particular Russia). Volume forecast variances, currency volatility and an increasing portion of our business in emerging markets, where currencies have depreciated rapidly in 2014 and at the beginning of 2015, will expose the adidas Group to substantial currency effects in 2015. Our financial targets set for 2015 take these trends into consideration.
Risks related to impairment of goodwill/other intangible assetsAs a result of various acquisitions in the past, our balance sheet carries book values of approximately € 1.2 billion in goodwill and € 1.6 billion in other intangible assets (including trademarks). Deterioration in the business performance, and particularly in future business prospects, as well as significant exchange rate fluctuations could require corrections of these book values by incurring impairment charges. In addition, increases in market interest rates could trigger increases in discount rates used in our impairment test for goodwill and require impairment charges. An impairment charge would be a purely accounting, non-cash effect impacting the Group’s operating result.
see Treasury, p. 121
see Table 04
see Subsequent Events and Outlook, p. 146
see Note 02, p. 197

Group Management Report – Financial Review
1732 0 1 4
/ 03.5 /
adidas Group / 2014 Annual Report
Risk and Opportunity Report / Financial Risks
04 / Exposure to foreign exchange risk 1) (based on notional amounts, € in millions)
USD RUB GBP JPY
As at December 31, 2014
Exposure from firm commitments and forecasted transactions (4,890) 318 521 372
Balance sheet exposure including intercompany exposure (393) 13 13 5
Total gross exposure (5,283) 331 534 377
Hedged with other cash flows 99
Hedged with currency options 278
Hedged with forward contracts 3,128 (14) (355) (345)
Net exposure (1,778) 317 179 32
As at December 31, 2013
Exposure from firm commitments and forecasted transactions (3,811) 348 370 362
Balance sheet exposure including intercompany exposure (358) 106 (7) 6
Total gross exposure (4,169) 454 363 368
Hedged with other cash flows 87
Hedged with currency options 425 (47)
Hedged with forward contracts 2,604 (107) (298) (209)
Net exposure (1,053) 347 65 112
1) Rounding difference may arise in totals.
05 / Sensitivity analysis of foreign exchange rate changes (€ in millions)
USD RUB GBP JPY
As at December 31, 2014
EUR +10% USD +10% EUR +10% EUR +10%
Equity (188) – 29 27
Net income 7 4 (1) 0
EUR –10% USD –10% EUR –10% EUR –10%
Equity 233 – (35) (33)
Net income (8) (4) 1 0
As at December 31, 2013
EUR +10% USD +10% EUR +10% EUR +10%
Equity (176) – 21 17
Net income 2 (8) 1 0
EUR –10% USD –10% EUR –10% EUR –10%
Equity 214 – (25) (20)
Net income (3) 7 (1) 0

1742 0 1 4
/ 03.5 /
adidas Group / 2014 Annual Report
Group Management Report – Financial ReviewRisk and Opportunity Report / Financial Risks
Credit risksA credit risk arises if a customer or other counterparty to a financial instrument fails to meet its contractual obligations. The adidas Group is exposed to credit risks from its operating activities and from certain financing activities. Credit risks arise principally from accounts receivable and, to a lesser extent, from other third-party contractual financial obligations such as other financial assets, short-term bank deposits and derivative financial instruments. Without taking into account any collateral, the carrying amount of financial assets and accounts receivable represents the maximum exposure to credit risk.
At the end of 2014, there was no relevant concentration of credit risk by type of customer or geography. Our credit risk exposure is mainly influenced by individual customer characteristics. Under the Group’s credit policy, new customers are analysed for creditworthiness before standard payment and delivery terms and conditions are offered. Tolerance limits for accounts receivable are also established for each customer. Both creditworthiness and accounts receivable limits are monitored on an ongoing basis. Customers that fail to meet the Group’s minimum creditworthiness are, in general, allowed to purchase products only on a prepayment basis.
Other activities to mitigate credit risks include retention of title clauses as well as, on a selective basis, credit insurances, accounts receivable sales without recourse and bank guarantees.
Objective evidence that financial assets are impaired includes, for instance, significant financial difficulty of the issuer or debtor, indications of the potential bankruptcy of the borrower and the disappearance of an active market for a financial asset because of financial difficulties. The Group utilises allowance accounts for impairments that represent our estimate of incurred credit losses with respect to accounts receivable.
Allowance accounts are used as long as the Group is satisfied that recovery of the amount due is possible. Once this is no longer the case, the amounts are considered irrecoverable and are directly written off against the financial asset. The allowance consists of two components: (1) an allowance established for all receivables dependent on the ageing structure of receivables
past due date and(2) a specific allowance that relates to individually assessed risk for each specific customer –
irrespective of ageing.
At the end of 2014, no Group customer accounted for more than 10% of accounts receivable.
see Note 29, p. 228

Group Management Report – Financial Review
1752 0 1 4
/ 03.5 /
adidas Group / 2014 Annual Report
Risk and Opportunity Report / Financial Risks
The Group Treasury department arranges currency, commodity and interest rate hedges, and invests cash, with major banks of a high credit standing throughout the world. adidas Group companies are authorised to work with banks rated BBB+ or higher. Only in exceptional cases are subsidiaries authorised to work with banks rated lower than BBB+. To limit risk in these cases, restrictions are clearly stipulated, such as maximum cash deposit levels. In addition, the credit default swap premiums of our partner banks are monitored on a monthly basis. In the event that the defined threshold is exceeded, credit balances are shifted to banks compliant with the limit.
We believe our risk concentration is limited due to the broad distribution of our investment business with more than 20 globally operating banks. At December 31, 2014, no bank accounted for more than 5% of our investments. Including subsidiaries’ short-term deposits in local banks, the average concentration was 1%. This leads to a maximum exposure of € 82 million in the event of default of any single bank. We have further diversified our investment exposure by investing into AAA-rated money market funds.
In addition, we held derivatives with a positive fair market value in the amount of € 285 million. The maximum exposure to any single bank resulting from these assets amounted to € 67 million and the average concentration was 6%.
According to IFRS 7, the table below includes further information about set-off possibilities of derivative financial assets and liabilities. The majority of agreements between financial institutions and the adidas Group include a mutual right to set-off. However, these agreements do not meet the criteria for offsetting in the statement of financial position, because the right to set-off is enforceable only in the event of counterparty defaults.
The carrying amounts of recognised derivative financial instruments, which are subject to the mentioned agreements, are presented in the table below.
see Table 06
see Table 06
06 / Set-off possibilities of derivative financial assets and liabilities (€ in millions)
2014 2013
Assets
Gross amounts of recognised financial assets 285 59
Financial instruments which qualify for set-off in the statement of financial position 0 0
Net amounts of financial assets presented in the statement of financial position 285 59
Set-off possible due to master agreements (53) (53)
Total net amount of financial assets 232 6
Liabilities
Gross amounts of recognised financial liabilities (55) (93)
Financial instruments which qualify for set-off in the statement of financial position 0 0
Net amounts of financial liabilities presented in the statement of financial position (55) (93)
Set-off possible due to master agreements 53 53
Total net amount of financial liabilities (2) (40)

1762 0 1 4
/ 03.5 /
adidas Group / 2014 Annual Report
Group Management Report – Financial ReviewRisk and Opportunity Report / Financial Risks
Interest rate risksChanges in global market interest rates affect future interest payments for variable-interest liabilities. As the Group does not have material variable-interest liabilities, significant interest rate increases should have only slight adverse effects on the Group’s profitability, liquidity and financial position.
In line with IFRS 7 requirements, we have analysed the impact of changes in the Group’s most important interest rates on net income and shareholders’ equity. The effect of interest rate changes on future cash flows is excluded from this analysis. Nevertheless, accrued interest, which is recognised as a liability, has been recalculated based on the hypothetical market interest rates as at December 31, 2014. Fair values for derivative interest rate instruments accounted for as cash flow hedges were then re-evaluated based on the hypothetical market interest rates with the resulting effects on net income and equity included in the sensitivity analysis.
However, the effect on the income statement from changes in the fair values of hedged items and hedging instruments attributable to interest rate changes was not material. Exclusions from this analysis are as follows:/ Some fixed-rate financial instruments, such as certificates of deposit, which we value at ‘fair
value through profit or loss’ due to the short-term maturity of these instruments. Potential effects due to changes in interest rates are considered immaterial and are not recognised in the sensitivity analysis.
/ Other fixed-rate financial instruments are measured at amortised cost. Since a change in interest rates would not change the carrying amount of this category of instruments, there is no net income impact and they are excluded from this analysis.
The interest rate sensitivity analysis assumes a parallel shift of the interest yield curve for all currencies and was performed on the same basis for both 2013 and 2014. As in the prior year, a 100 basis point increase or decrease in interest rates at December 31, 2014 would have had no major impact on shareholders’ equity and net income.
To reduce interest rate risks and maintain financial flexibility, a core tenet of our Group’s financial strategy is to continue to use surplus cash flow from operations to reduce gross borrowings. Beyond that, the adidas Group is constantly looking for adequate hedging strategies through interest rate derivatives in order to mitigate interest rate risks.
In 2014, interest rates in Europe and North America remained at low levels. Given the central banks’ current interest rate policies and macroeconomic uncertainty, we do not foresee any major interest rate increases in Europe in 2015. Due to the positive macroeconomic development in the USA, however, we believe a slight increase in US interest rates is likely. At December 31, 2014, 80% of the Group’s financing was denominated in euros.
see Treasury, p. 121

Group Management Report – Financial Review
1772 0 1 4
/ 03.5 /
adidas Group / 2014 Annual Report
Risk and Opportunity Report / Financial Risks
Financing and liquidity risksLiquidity risks arise from not having the necessary resources available to meet maturing liabilities with regard to timing, volume and currency structure. In addition, the adidas Group faces the risk of having to accept unfavourable financing terms due to liquidity restraints. Our Group Treasury department uses an efficient cash management system to manage liquidity risk. At December 31, 2014, Group cash and cash equivalents together with marketable securities amounted to € 1.688 billion (2013: € 1.629 billion). Moreover, our Group maintains € 1.520 billion bilateral credit lines and a € 500 million committed long-term syndicated loan facility with international banks, which does not include a market disruption clause. The € 2.020 billion in credit lines are designed to ensure sufficient liquidity at all times.
Future cash outflows arising from financial liabilities that are recognised in the Consolidated Statement of Financial Position are presented in the table below. This includes payments to settle obligations from borrowings as well as cash outflows from cash-settled derivatives with negative market values. Financial liabilities that may be settled in advance without penalty are included on the basis of the earliest date of potential repayment. Cash flows for variable-interest liabilities are determined with reference to the conditions at the balance sheet date.
We ended the year 2014 with net debt of € 185 million (2013: net cash of € 295 million). Thus, the ratio of net borrowings over EBITDA was 0.1 times at year-end, which is in line with the Group’s medium-term guideline of less than two times.
see Treasury, p. 121
see Table 07
07 / Future cash outflows 1) (€ in millions)
Up to 1 year
Up to 2 years
Up to 3 years
Up to 4 years
Up to 5 years
Up to 6 years
Up to 7 years
Total
As at December 31, 2014
Bank borrowings incl. commercial paper 2) 194 194
Private placements 3) 108 127 235
Eurobond 3) 17 17 17 17 17 17 617 719
Convertible bond 3) 1 1 502 504
Accounts payable 1,652 1,652
Other financial liabilities 38 7 44
Accrued liabilities 4) 491 491
Derivative financial liabilities 53 0 0 0 0 0 0 55
Total 2,554 152 519 17 17 17 617 3,894
As at December 31, 2013
Bank borrowings 2) 126 126
Private placements 3) 70 95 111 276
Eurobond 3) 514 514
Convertible bond 3) 1 1 1 502 505
Accounts payable 1,825 1,825
Other financial liabilities 33 9 42
Accrued liabilities 4) 464 464
Derivative financial liabilities 80 12 1 93
Total 3,113 117 113 502 3,845
1) Rounding difference may arise in totals.2) Classified as long-term (between 1 and 3 years) in the consolidated financial statements, as they are covered by the committed mid-term syndicated loan.3) Including interest payments.4) Accrued interest excluded.

1782 0 1 4
/ 03.5 /
adidas Group / 2014 Annual Report
Group Management Report – Financial ReviewRisk and Opportunity Report / Strategic and Operational Opportunities
Opportunities which have a mid- to long-term positive impact for the Group’s top- and bottom-line performance are already reflected in the Group’s strategic aspirations and are therefore not included in this report. As a result, some opportunities may not be fully comparable with opportunities presented in last year’s report. The assessment of all opportunities is shown in the opportunities overview table.
Strategic and Operational Opportunities
Organic growth opportunitiesControlled space: The sporting goods retail environment is changing constantly. We therefore continue to adapt our distribution strategy to cater for this change and have made controlled space initiatives a strategic priority. This includes retail space management with key retail partners as well as the introduction of new own-retail store formats. In addition, we continue to expand our direct-to-consumer activities in emerging markets such as South East Asia, India or the Middle East and North Africa. Successful results from these initiatives could enable us to accelerate top- and bottom-line growth.
Fashion trends: Trends can rapidly change in our industry as certain styles, looks and colourways fall in and out of relevance for the consumer. Given our broad product offering, additional sales opportunities may arise when our products are more on-trend than those of our major competitors. Further establishing a premium price positioning could strengthen consumers’ perception of our brands, particularly in fashion categories, and open up additional margin opportunities.
New activities and categories: Exploiting the potential of emerging, fast-growing sports categories is another organic growth opportunity for our brands. Our brand teams conduct market research and engage in trend marketing to detect changes in the lifestyle and consumer needs of our target audience as early as possible. As a result, we continue to see untapped market potential around new fitness concepts such as CrossFit and obstacle racing. Similarly, we see tremendous additional growth potential in the running category, in particular in North America, on the back of our revolutionary Boost concept.
see Table 08
08 / Corporate opportunities overview
Potential impact Change in 2014 (2013 rating)
Likelihood Change in 2014 (2013 rating)
Strategic and operational opportunities
Organic growth opportunities Major Unlikely
Opportunities related to organisational and process improvements Major (Significant) Possible
Personnel opportunities Moderate (Significant) Possible (Unlikely)
Macroeconomic, socio-political and regulatory opportunities Moderate Possible (Unlikely)
Acquisition opportunities Minor Possible
Financial opportunities
Favourable financial market changes Major Possible (Unlikely)

Group Management Report – Financial Review
1792 0 1 4
/ 03.5 /
adidas Group / 2014 Annual Report
Risk and Opportunity Report / Strategic and Operational Opportunities
Sustainable products: As consumers demand more products that are environmentally benign and produced on a sustainable basis, the adidas Group continues its efforts to create meaningful product platforms that drive growth in this area. We remain focused on the extension of the adidas ‘Better Place’ programme. Products and packaging in the programme are designed taking sustainability principles into account, such as broadening the use of recycled materials and monitoring energy use in material and product preparation.
Strategic partnerships: The adidas Group is constantly evolving its partnership network within sports and culture, with academic organisations and other industries in research and development, designers in the fashion industry, other brands and non-traditional sporting goods retailers. These partnerships have generated multiple new growth avenues for the Group, as we have acquired product or process know-how and gained access to new distribution channels or markets. Partnerships, strategic alliances and collaborations may enable the adidas Group to pursue further growth and efficiency opportunities.
Opportunities related to organisational and process improvementsContinued optimisation of key business processes and strict cost control are vital to achieving high profitability and return on invested capital. We are confident that there is still significant opportunity to further streamline cost structures throughout our Group. For example, we continuously search for ways to increase efficiency in our supply chain and make it truly demand-driven. Furthermore, by implementing end-to-end planning processes and improving our replenishment capabilities, we see opportunities not only to better serve our customers but also to reduce our operating working capital needs.
Furthermore, constant improvements in manufacturing excellence (e.g. process simplification), manufacturing innovation or warehouse consolidation may help us increase efficiency and profitability for the Group. Innovations in production could also support the Group in reducing its environmental impact, while at the same time enabling the Group to provide consumers with the best value proposition possible. For example, a higher level of automation in the production processes for footwear and apparel manufacturing could result in productivity enhancements, shorten lead times and improve overall quality.
In addition, consolidating and upgrading our distribution centres represents an opportunity for the Group to realise further efficiency gains, reduce operating overheads and provide the operational ability to drive additional revenue growth and working capital improvements. Process improvements in other areas of the Group’s business activities could also positively impact profitability. For example, further centralising ranging and product purchasing for our own-retail business could lead to an increase in efficiency and drive additional sales, thus helping us increase overall Group profitability. More consistent, effective and efficient in-store execution could lead to an increase in conversion and therefore drive additional sales and profitability. In addition, we see improvement potential in our rental expenses for own-retail stores by negotiating more favourable contract terms with landlords.

1802 0 1 4
/ 03.5 /
adidas Group / 2014 Annual Report
Group Management Report – Financial ReviewRisk and Opportunity Report / Financial Opportunities
Personnel opportunitiesThe recruitment of highly qualified talent as well as the training and development of our employees, in particular for our own-retail segment, may help us to increase productivity, efficiency and employee engagement and generate better than expected top- and bottom-line results. For example, a reduction of the attrition rates in our own-retail stores could increase conversion rates as well as store productivity and also lead to lower expenses for recruiting activities. In addition, successfully establishing a performance culture as well as developing key talents across the Group may contribute positively to sales and profitability improvements.
Macroeconomic, socio-political and regulatory opportunities Since we are a consumer goods company, consumer confidence and spending can impact our sales development. Therefore, better than initially forecasted macroeconomic developments, which support increased private consumption, can have a positive impact on our sales and profitability. Low unemployment rates, rising real incomes as well as a growing middle class with increasing spending power are fuelling consumption, particularly in emerging economies – and, subsequently, our industry. In addition, legislative and regulatory changes, e.g. the elimination of trade barriers, can potentially open up new channels of distribution and positively impact Group profitability.
Acquisition opportunitiesAlthough the Group’s focus is on organic growth initiatives, we consider acquisitions of smaller, fast-growing or innovative companies as an opportunity to generate additional sales and profits. Furthermore, acquisition opportunities may arise as a result of challenging macroeconomic and competitive conditions that could lead to financial distress of companies which, while not as financially healthy as industry leaders, possess certain assets that could help the adidas Group further improve its business performance.
Financial Opportunities
Favourable financial market changesFavourable exchange and interest rate developments can potentially have a positive impact on the Group’s financial results. Our Group Treasury department closely monitors the financial markets to identify and exploit opportunities. Translation effects from the conversion of non-euro-denominated results into our Group’s functional currency, the euro, might positively impact our Group’s financial performance.
see Treasury, p. 121

Group Management Report – Financial Review
1812 0 1 4
Management Assessment of Performance, Risks and Opportunities, and Outlook
/ 03.6 /
adidas Group / 2014 Annual Report
Assessment of performance versus targetsWe communicate our Group’s financial targets on an annual basis. We also provide updates throughout the year as appropriate. In 2014, the adidas Group results were significantly impacted by a challenging golf market, geopolitical factors such as the crisis in Ukraine and its economic consequences as well as volatile currency exchange rates. In particular, the continued depreciation of several emerging market currencies versus the euro as well as the weakening of consumer sentiment in Russia/CIS weighed on the Group’s financial performance. As a result, we lowered our full year 2014 guidance in July, compared to our initial expectations.
In 2014, Group revenues rose 6% on a currency-neutral basis, driven by sales increases in both Wholesale and Retail. Currency-neutral Group sales grew in all regions except North America, with a particularly strong performance in the emerging markets. Nevertheless, Group revenues increased slightly below our initial guidance of a high-single-digit currency-neutral increase. This was due to double-digit sales declines at TaylorMade-adidas Golf. Gross margin decreased 1.7 percentage points to 47.6% and was thus below our initial expectations of 49.5% to 49.8%. This development was mainly due to negative currency effects, higher input costs, increased clearance activities in Russia/CIS as well as lower product margins at TaylorMade-adidas Golf. Operating margin excluding goodwill impairment losses declined 2.1 percentage points to 6.6%, below our initial guidance of between 8.5% and 9.0%. This development was primarily due to the negative effects from the lower gross margin as well as higher other operating expenses as a percentage of sales. As a result, net income attributable to shareholders excluding goodwill impairment losses was € 568 million. While this was below our initial guidance of between € 830 million and € 930 million, we have reached our adjusted guidance of net income attributable to shareholders of around € 650 million, after adjustment for the book loss in an amount of € 82 million resulting from the planned Rockport divestiture.
In 2014, operating working capital and cash management were negatively impacted by increased working capital requirements at the beginning of the year. While we had initially expected average operating working capital as a percentage of sales to decrease moderately in 2014, challenges in Russia/CIS as well as at TaylorMade-adidas Golf resulted in higher inventories at the beginning of the year. As a result, average operating working capital as a percentage of sales increased versus the prior year and thus exceeded our initial expectations.
see Table 01
see Economic and Sector Development, p. 103
see Income Statement, p. 106
see Statement of Financial Position and Statement of Cash Flows, p. 115
Management Assessment of Performance, Risks and Opportunities, and Outlook
6

1822 0 1 4
Management Assessment of Performance, Risks and Opportunities, and Outlook
/ 03.6 /
adidas Group / 2014 Annual Report
Group Management Report – Financial Review
Beyond our financial performance, we also actively monitor the Group’s key non-financial KPIs on a regular basis, as available. From a market share perspective, we continue to be very encouraged by our strong performance compared to our major competitors in key emerging markets. In particular, Greater China, Latin America and South Korea were notable standouts, as we further improved our market share in these markets in 2014. In Western Europe, we saw momentum accelerate in 2014, supported by the positive effects from the 2014 FIFA World Cup. Less pleasing, however, was our underperformance in North America, which continued in 2014. As a result, we have made several changes to our organisational set-up in the market and also announced that we will step up brand investments to engage more closely with the US consumer. In the golf market, despite a challenging year for TaylorMade-adidas Golf, we continue to enjoy healthy market share positions. We remain market leader in key categories such as metalwoods and irons, with market shares above 30% and 20%, respectively. A key focus for TaylorMade-adidas Golf in 2014 was the clean-up of retail inventories, especially in the USA. In light of this, TaylorMade-adidas Golf made the strategic decision to reduce the number of new product introductions compared to previous years.
We continued to maintain a very strong level of on-time in-full (OTIF) deliveries to our customers and own-retail stores in 2014. As in prior years, the majority of our sales in 2014 were again generated from products launched in the past 12 to 18 months. In addition, we received several awards and industry recognitions for our new product innovations. Finally, our diligence and discipline in sustainability matters continues to yield strong recognition for our Group. In 2014, for the 15th consecutive time, we were selected to join the Dow Jones Sustainability Indexes (DJSI) and scored industry-best ratings in the categories ‘Supply Chain Management’, ‘Product Stewardship’ and ‘Stakeholder Engagement’ in the sector ‘Textiles, Apparel & Luxury Goods’.
Assessment of overall risks and opportunitiesThe Group’s Risk Management team aggregates all risks and opportunities reported by different business units and functions through the quarterly risk and opportunity assessment process. In addition, the Group’s Executive Board discusses and assesses Group risks and opportunities on a regular basis. Taking into account the potential financial impact as well as the likelihood of materialising of the risks explained within this report, and considering the strong balance sheet as well as the current business outlook, we do not foresee any material jeopardy to the viability of
see Internal Group Management System, p. 98
see Global Operations, p. 66
see Research and Development, p. 73
see Sustainability, p. 89
01 / adidas Group targets versus actual key metrics
2013 Results 1)
2014 Targets 1)
2014 Results 2)
2015 Outlook 2)
Sales (year-over-year change, currency-neutral) 3% high-single-digit increase 6% mid-single-digit increase
Gross margin 49.3% 49.5% to 49.8% 47.6% 47.5% to 48.5%
Other operating expenses (in % of sales) 42.3% around prior year level 42.7% around prior year level
Operating margin 8.7% 3) between 8.5% and 9.0% 6.6% 4) between 6.5% and 7.0%
Net income from continuing operations (€ in million) – – 642 4) increase at a rate of 7% to 10%
Net income attributable to shareholders (€ in million) 839 3) 830 to 930 568 4) 5) –
Average operating working capital (in % of net sales) 20.9% moderate decline 22.4% moderate decline
Capital expenditure (€ in millions) 6) 479 500 to 550 554 5) around 600
Gross borrowings (€ in millions) 1,334 further reduction of gross borrowings
1,873 5) moderate decline
1) As published on March 5, 2014. The outlook was updated over the course of the year.2) Figures reflect continuing operations as a result of the planned divestiture of the Rockport business.3) Excluding goodwill impairment of € 52 million. 4) Excluding goodwill impairment of € 78 million. 5) Includes continuing and discontinued operations.6) Excluding acquisitions and finance leases.

Group Management Report – Financial Review
1832 0 1 4
Management Assessment of Performance, Risks and Opportunities, and Outlook
/ 03.6 /
adidas Group / 2014 Annual Report
the Group as a going concern. This assessment is also supported by the historical response to our financing demands. The adidas Group therefore has not sought an official rating by any of the leading rating agencies. We remain confident that the Group’s earnings strength forms a solid basis for our future business development and provides the resources necessary to pursue the opportunities available to the Group. Compared to the prior year, our assessment of certain risks has changed in terms of likelihood of occurrence and/or potential financial impact. The partial changes in risk evaluation have no substantial impact on the overall adidas Group risk profile, which we believe remains virtually unchanged compared to the prior year.
Assessment of financial outlookIn November 2010, the Group unveiled its 2015 strategic business plan named ‘Route 2015’, which defined strategies and objectives for the period up to 2015. In 2014, mainly due to the continued weakness in the golf market, negative economic developments in Russia/CIS as well as ongoing currency headwinds, the Group postponed the delivery of its top- and bottom-line Route 2015 targets. As a result, we have been undergoing a strategic review of priorities and our organisational set-up throughout 2014 and early 2015. We will release details on our updated strategies at the end of March 2015.
In 2015, we will see a specific emphasis on continuing to pursue growth opportunities, while also focusing on driving improvements in the Group’s earnings. We will increase our investments in brand-building activities and continue to focus on innovation platforms such as Boost, expanding our digital activities as well as rolling out our new own-retail concepts globally.
Through our extensive pipeline of new and innovative products, which have received favourable reviews from retailers, as well as through tight control of inventory levels and strict cost management, we project top- and bottom-line improvements in our Group’s financial results in 2015. The Group’s profitability is expected to benefit primarily from higher product margins at TaylorMade-adidas Golf as well as a more favourable pricing and product mix at adidas and Reebok. We believe that our outlook for 2015 is realistic within the scope of the current trading and economic environment.
Assuming no significant deterioration in the global economy, we are confident to grow our top and bottom line in 2015. However, the high degree of uncertainty regarding the economic outlook and consumer sentiment in certain geographical areas, in particular Russia/CIS, as well as persisting high levels of currency volatility, represent risks to the achievement of our stated financial goals and aspirations. No other material event between the end of 2014 and the publication of this report has altered our view.
see Treasury, p. 121
see Risk and Opportunity Report, p. 154
see Group Strategy, p. 46
see Global Brands Strategy, p. 53see Global Sales Strategy, p. 49
see Subsequent Events and Outlook, p. 146
see Group Strategy, p. 46


Re sponsib i l i t y St atement 18 6Audi tor ’s Repor t 187C onsol idated St atement of F inanc ia l Pos i t ion 18 8C onsol idated Income St atement 19 0C onsol idated St atement of C omprehensi ve Income 191C onsol idated St atement of Change s in Equi t y 19 2C onsol idated St atement of C ash F low s 194Note s 195
Notes to the Consolidated Statement of Financial Position 207 Notes to the Consolidated Income Statement 234 Notes – Additional Information 239
St atement of Movement s of Int angib le and Tangib le A s s et s 2 4 6Sharehold ings 2 4 8
FI
NA
NCI
AL
STAT
EMEN
TS
04
04.1
04.2
04.3
04.4
04.5
04.6
04.7
04.8
04.9
04.10
CONSOLIDATED FINANCIAL
S T A T E M E N T S

1
adidas Group / 2014 Annual Report
Consolidated Financial Statements
1862 0 1 4
Responsibility Statement
/ 04.1 /
Responsibility StatementTo the best of our knowledge, and in accordance with the applicable reporting principles, the consolidated financial statements give a true and fair view of the assets, liabilities, financial position and profit or loss of the Group, and the Group Management Report, which has been combined with the Management Report of adidas AG, includes a fair review of the development and performance of the business and the position of the Group, together with a description of the material opportunities and risks associated with the expected development of the Group.
Herzogenaurach, February 13, 2015
R O L A N D A U S C H E LGlobal Sales
G L E N N B E N N E T TGlobal Operations
E R I C L I E D T K EGlobal Brands
R O B I N J . S TA L K E RCFO
H E R B E R T H A I N E RCEO

2
adidas Group / 2014 Annual Report
Consolidated Financial Statements
1872 0 1 4
Auditor’s Report
/ 04.2 /
Auditor’s ReportWe have audited the consolidated financial statements prepared by adidas AG, Herzogenaurach, comprising the statement of financial position, income statement, statement of comprehensive income, statement of changes in equity, statement of cash flows and the notes, together with the management report of the Company and the Group for the business year from January 1 to December 31, 2014. The preparation of the consolidated financial statements and the Group management report in accordance with IFRS, as adopted by the EU, and the additional requirements of German commercial law pursuant to § 315a (1) HGB (Handelsgesetzbuch – ‘German Commercial Code’) is the responsibility of the Company’s Executive Board. Our responsibility is to express an opinion on the consolidated financial statements and on the Group management report based on our audit.
We conducted our audit of the consolidated financial statements in accordance with § 317 HGB and German generally accepted standards for the audit of financial statements promulgated by the Institut der Wirtschaftsprüfer (Institute of Public Auditors in Germany) (IDW). Those standards require that we plan and perform the audit such that misstatements materially affecting the presentation of the net assets, financial position and profit or loss in the consolidated financial statements in accordance with the applicable financial reporting framework and in the Group management report are detected with reasonable assurance. Knowledge of the business activities and the economic and legal environment of the Group and expectations as to possible misstatements are taken into account in the determination of audit procedures. The effectiveness of the accounting-related internal control system and the evidence supporting the disclosures in the consolidated financial statements and the Group management report are examined primarily on a test basis within the framework of the audit. The audit includes assessing the annual financial statements of the entities included in consolidation, the determination of entities to be included in consolidation, the accounting and consolidation principles used and significant estimates made by management, as well as evaluating the overall presentation of the consolidated financial statements and Group management report. We believe that our audit provides a reasonable basis for our opinion.
Our audit has not led to any reservations.
In our opinion, based on the findings of our audit, the consolidated financial statements comply with IFRS, as adopted by the EU, and the additional requirements of German commercial law pursuant to § 315a (1) HGB and give a true and fair view of the net assets, financial position and profit or loss of the Group in accordance with these requirements. The Group management report is consistent with the consolidated financial statements and as a whole provides a suitable view of the Group’s position and suitably presents the opportunities and risks of future development.
Munich, February 18, 2015
KPMG AGWirtschaftsprüfungsgesellschaft
(Original German version signed by:)
Braun WolperWirtschaftsprüfer Wirtschaftsprüfer(German Public Auditor) (German Public Auditor)

3
adidas Group / 2014 Annual Report
Consolidated Financial Statements
1882 0 1 4
Consolidated Statement of Financial Position
/ 04.3 /
.. / adidas AG Consolidated Statement of Financial Position (IFRS) (€ in millions)
Note Dec. 31, 2014 Dec. 31, 2013 Change in %
ASSETS
Cash and cash equivalents 5 1,683 1,587 6.0
Short-term financial assets 6 5 41 (87.6)
Accounts receivable 7 1,946 1,809 7.6
Other current financial assets 8 398 183 117.9
Inventories 9 2,526 2,634 (4.1)
Income tax receivables 34 92 86 7.3
Other current assets 10 425 506 (15.9)
Assets classified as held for sale 11 272 11 2,289.5
Total current assets 7,347 6,857 7.2
Property, plant and equipment 12 1,454 1,238 17.5
Goodwill 13 1,169 1,204 (2.9)
Trademarks 14 1,432 1,419 0.9
Other intangible assets 14 162 164 (0.8)
Long-term financial assets 15 129 120 6.9
Other non-current financial assets 16 42 30 39.8
Deferred tax assets 34 577 486 18.8
Other non-current assets 17 105 81 28.2
Total non-current assets 5,070 4,742 6.9
Total assets 12,417 11,599 7.1
Rounding differences may arise in percentages and totals. The accompanying notes are an integral part of these consolidated financial statements.
Consolidated Statement of Financial Position

adidas Group / 2014 Annual Report
Consolidated Financial Statements
1892 0 1 4
Consolidated Statement of Financial Position
/ 04.3 /
.. / adidas AG Consolidated Statement of Financial Position (IFRS) (€ in millions)
Note Dec. 31, 2014 Dec. 31, 2013 Change in %
LIABILITIES AND EQUITY
Short-term borrowings 18 288 681 (57.7)
Accounts payable 1,652 1,825 (9.5)
Other current financial liabilities 19 91 113 (19.6)
Income taxes 34 294 240 22.6
Other current provisions 20 470 450 4.3
Current accrued liabilities 21 1,249 1,147 8.9
Other current liabilities 22 287 276 4.4
Liabilities classified as held for sale 11 46 – n.a.
Total current liabilities 4,378 4,732 (7.5)
Long-term borrowings 18 1,584 653 142.7
Other non-current financial liabilities 23 9 22 (59.1)
Pensions and similar obligations 24 284 255 11.6
Deferred tax liabilities 34 390 338 15.4
Other non-current provisions 20 38 25 49.7
Non-current accrued liabilities 21 81 64 27.0
Other non-current liabilities 25 35 29 18.7
Total non-current liabilities 2,422 1,386 74.7
Share capital 204 209 (2.3)
Reserves 581 321 80.4
Retained earnings 4,839 4,959 (2.4)
Shareholders’ equity 26 5,624 5,489 2.5
Non-controlling interests 27 (7) (8) 15.5
Total equity 5,618 5,481 2.5
Total liabilities and equity 12,417 11,599 7.1
Rounding differences may arise in percentages and totals. The accompanying notes are an integral part of these consolidated financial statements.

4
adidas Group / 2014 Annual Report
Consolidated Financial Statements
1902 0 1 4
Consolidated Income Statement
/ 04.4 /
.. / adidas AG Consolidated Income Statement (IFRS) (€ in millions)
Note Year ending Dec. 31, 2014
Year ending Dec. 31, 2013
Change
Net sales 36 14,534 14,203 2.3%
Cost of sales 7,610 7,202 5.7%
Gross profit 6,924 7,001 (1.1%)
(% of net sales) 47.6% 49.3% (1.7pp)
Royalty and commission income 102 103 (1.1%)
Other operating income 30 138 142 (2.6%)
Other operating expenses 12, 14, 31 6,203 6,013 3.2%
(% of net sales) 42.7% 42.3% 0.3pp
Goodwill impairment losses 13 78 52 48.5%
Operating profit 883 1,181 (25.2%)
(% of net sales) 6.1% 8.3% (2.2pp)
Financial income 33 19 26 (26.7%)
Financial expenses 33 67 94 (28.4%)
Income before taxes 835 1,113 (24.9%)
(% of net sales) 5.7% 7.8% (2.1pp)
Income taxes 34 271 340 (20.2%)
(% of income before taxes) 32.5% 30.5% 1.9pp
Net income from continuing operations 564 773 (27.0%)
(% of net sales) 3.9% 5.4% (1.6pp)
Losses/gains from discontinued operations, net of tax 3 (68) 17 n.a.
Net income 496 790 (37.2%)
(% of net sales) 3.4% 5.6% (2.1pp)
Net income attributable to shareholders 490 787 (37.6%)
(% of net sales) 3.4% 5.5% (2.2pp)
Net income attributable to non-controlling interests 6 3 67.2%
Basic earnings per share from continuing operations (in €) 35 2.67 3.68 (27.3%)
Diluted earnings per share from continuing operations (in €) 35 2.67 3.68 (27.3%)
Basic earnings per share from continuing and discontinued operations (in €) 35 2.35 3.76 (37.5%)
Diluted earnings per share from continuing and discontinued operations (in €) 35 2.35 3.76 (37.5%)
Rounding differences may arise in percentages and totals. The accompanying notes are an integral part of these consolidated financial statements.
Consolidated Income Statement

5
adidas Group / 2014 Annual Report
Consolidated Financial Statements
1912 0 1 4
Consolidated Statement of Comprehensive Income
/ 04.5 /
.. / adidas AG Consolidated Statement of Comprehensive Income (IFRS) (€ in millions)
Note Year ending Dec. 31, 2014
Year ending Dec. 31, 2013
Net income after taxes 496 790
Items of other comprehensive income that will not be reclassified subsequently to profit or loss
Remeasurements of defined benefit plans (IAS 19), net of tax 1) 24 (57) 5
Subtotal of items of other comprehensive income that will not be reclassified subsequently to profit or loss (57) 5
Items of other comprehensive income that will be reclassified subsequently to profit or loss when specific conditions are met
Net gain/(loss) on cash flow hedges, net of tax 29 211 (13)
Currency translation differences 104 (309)
Subtotal of items of other comprehensive income that will be reclassified subsequently to profit or loss when specific conditons are met 315 (322)
Other comprehensive income 258 (317)
Total comprehensive income 754 473
Attributable to shareholders of adidas AG 749 467
Attributable to non-controlling interests 5 6
1) Includes actuarial gains or losses relating to defined benefit obligations, return on plan assets (excluding interest income) and the asset ceiling effect.Rounding differences may arise in percentages and totals.The accompanying notes are an integral part of these consolidated financial statements.
Consolidated Statement of Comprehensive Income

6
adidas Group / 2014 Annual Report
Consolidated Financial Statements
1922 0 1 4
Consolidated Statement of Changes in Equity
/ 04.6 /
Consolidated Statement of Changes in Equity
.. / adidas AG Consolidated Statement of Changes in Equity (IFRS) (€ in millions)
Note Share capital Capital reserve Cumulative currency
translation differences
Hedging reserve Other reserves 1) Retained earnings Shareholders’ equity
Non-controlling interests
Total equity
Balance at December 31, 2012 209 777 (51) (21) (64) 4,454 5,304 (13) 5,291
Net income recognised directly in equity (312) (13) 5 (320) 3 (317)
Net income 787 787 3 790
Total comprehensive income (312) (13) 5 787 467 6 473
Dividend payment 26 (282) (282) (1) (283)
Balance at December 31, 2013 209 777 (363) (34) (59) 4,959 5,489 (8) 5,481
Net income recognised directly in equity 106 210 (57) 259 (1) 258
Net income 490 490 6 496
Total comprehensive income 106 210 (57) 490 749 5 754
Repurchase of treasury shares 26 (5) (295) (300) (300)
Dividend payment 26 (314) (314) (4) (318)
Balance at December 31, 2014 204 777 (257) 176 (117) 4,839 5,624 (7) 5,618
1) Reserves for remeasurements of defined benefit plans (IAS 19), share option plans and acquisition of shares from non-controlling interest shareholders.Rounding differences may arise in percentages and totals.The accompanying notes are an integral part of these consolidated financial statements.

adidas Group / 2014 Annual Report
Consolidated Financial Statements
1932 0 1 4
Consolidated Statement of Changes in Equity
/ 04.6 /
.. / adidas AG Consolidated Statement of Changes in Equity (IFRS) (€ in millions)
Note Share capital Capital reserve Cumulative currency
translation differences
Hedging reserve Other reserves 1) Retained earnings Shareholders’ equity
Non-controlling interests
Total equity
Balance at December 31, 2012 209 777 (51) (21) (64) 4,454 5,304 (13) 5,291
Net income recognised directly in equity (312) (13) 5 (320) 3 (317)
Net income 787 787 3 790
Total comprehensive income (312) (13) 5 787 467 6 473
Dividend payment 26 (282) (282) (1) (283)
Balance at December 31, 2013 209 777 (363) (34) (59) 4,959 5,489 (8) 5,481
Net income recognised directly in equity 106 210 (57) 259 (1) 258
Net income 490 490 6 496
Total comprehensive income 106 210 (57) 490 749 5 754
Repurchase of treasury shares 26 (5) (295) (300) (300)
Dividend payment 26 (314) (314) (4) (318)
Balance at December 31, 2014 204 777 (257) 176 (117) 4,839 5,624 (7) 5,618
1) Reserves for remeasurements of defined benefit plans (IAS 19), share option plans and acquisition of shares from non-controlling interest shareholders.Rounding differences may arise in percentages and totals.The accompanying notes are an integral part of these consolidated financial statements.

7
adidas Group / 2014 Annual Report
Consolidated Financial Statements
1942 0 1 4
Consolidated Statement of Cash Flows
/ 04.7 /
.. / adidas AG Consolidated Statement of Cash Flows (IFRS) (€ in millions)
Note Year ending Dec. 31, 2014
Year ending Dec. 31, 2013
Operating activities:
Income before taxes 835 1,113
Adjustments for:
Depreciation, amortisation and impairment losses 12, 13, 14, 31, 33 405 340
Reversals of impairment losses 30 (1) (2)
Unrealised foreign exchange losses, net 32 10
Interest income 33 (17) (25)
Interest expense 33 62 73
Losses on sale of property, plant and equipment, net 16 6
Other non-cash income 30, 31 (1) (1)
Payment for external funding of pension obligations (CTA) (65) –
Operating profit before working capital changes 1,267 1,515
Increase in receivables and other assets (36) (302)
Increase in inventories (76) (299)
(Decrease)/increase in accounts payable and other liabilities (117) 151
Cash generated from operations before interest and taxes 1,037 1,065
Interest paid (59) (68)
Income taxes paid (284) (390)
Net cash generated from operating activities – continuing operations 694 608
Net cash generated from operating activities – discontinued operations 7 26
Net cash generated from operating activities 701 634
Investing activities:
Purchase of trademarks and other intangible assets (49) (52)
Proceeds from sale of trademarks and other intangible assets 1 1
Purchase of property, plant and equipment (499) (422)
Proceeds from sale of property, plant and equipment 4 4
Acquisition of subsidiaries and other business units net of cash acquired 4 (6) –
Proceeds from sale of short-term financial assets 37 226
Purchase of investments and other long-term assets (36) (20)
Interest received 17 25
Net cash used in investing activities – continuing operations (531) (237)
Net cash used in investing activities – discontinued operations (6) (6)
Net cash used in investing activities (537) (243)
Financing activities:
Proceeds from issue of Eurobonds 18 990 –
Repayment of Eurobond 18 (500) –
Repayments of finance lease obligations (2) (2)
Dividend paid to shareholders of adidas AG 26 (314) (282)
Dividend paid to non-controlling interest shareholders (4) (1)
Repurchase of treasury shares 26 (300) –
Proceeds from short-term borrowings 68 67
Repayments of short-term borrowings 18 (56) (221)
Net cash used in financing activities (118) (439)
Effect of exchange rates on cash 50 (35)
Increase/(decrease) of cash and cash equivalents 96 (83)
Cash and cash equivalents at beginning of the year 5 1,587 1,670
Cash and cash equivalents at end of period 5 1,683 1,587
Rounding differences may arise in percentages and totals. The accompanying notes are an integral part of these consolidated financial statements.
Consolidated Statement of Cash Flows

8
adidas Group / 2014 Annual Report
Consolidated Financial Statements
1952 0 1 4
Notes
/ 04.8 /
Notes
adidas AG (hereafter also referred to as ‘the company’) is a listed German stock corporation and parent of the adidas Group located at Adi-Dassler-Str. 1, 91074 Herzogenaurach, Germany. adidas AG and its subsidiaries (collectively the ‘adidas Group’ or the ‘Group’) design, develop, produce and market a broad range of athletic and sports lifestyle products. The operating activities of the adidas Group are divided into six operating segments: Wholesale, Retail, TaylorMade-adidas Golf, Rockport, Reebok-CCM Hockey and Other Centrally Managed Brands.
The Wholesale segment comprises all business activities relating to the distribution of adidas and Reebok products to retail customers.
The Retail segment comprises all business activities relating to the sale of adidas and Reebok products directly to end consumers through own retail and own e-commerce platforms.
adidas and Reebok branded products include footwear, apparel and hardware, such as bags and balls.
TaylorMade-adidas Golf includes the four brands TaylorMade, adidas Golf, Adams Golf and Ashworth. TaylorMade designs, develops and distributes primarily golf clubs, balls and accessories. adidas Golf branded products include footwear, apparel and accessories. Adams Golf designs and distributes mainly golf clubs as well as a small range of accessories. Ashworth designs and distributes men’s and women’s golf-inspired apparel and footwear.
Rockport predominantly designs and distributes leather footwear for men and women. Due to concrete plans to sell the Rockport operating segment, this segment is reported as discontinued operations as at December 31, 2014.
Reebok-CCM Hockey designs, produces and distributes ice hockey equipment such as sticks, skates and protection gear. In addition, Reebok-CCM Hockey designs, produces and distributes apparel mainly under the brand names Reebok Hockey and CCM.
The Other Centrally Managed Brands segment primarily includes the business activities of the labels Y-3 and Porsche Design Sport by adidas as well as the business activities of the brand Five Ten in the outdoor action sports sector. Furthermore, the segment also comprises the German own-retail activities of the adidas NEO label.

8
adidas Group / 2014 Annual Report
Consolidated Financial Statements
1962 0 1 4
Notes
/ 04.8 /
The consolidated financial statements of adidas AG as at December 31, 2014 comprise adidas AG and its subsidiaries and are prepared in compliance with International Financial Reporting Standards (IFRS), as adopted by the European Union (EU) as at December 31, 2014, and the additional requirements pursuant to § 315a section 1 German Commercial Code (Handelsgesetzbuch – HGB).
The following new standards and interpretations and amendments to existing standards and interpretations are applicable for the first time for financial years beginning on January 1, 2014:/ IFRS 10 Consolidated Financial Statements (effective date: January 1, 2014): This new standard had no material impact on the Group’s financial statements./ IFRS 11 Joint Arrangements (effective date: January 1, 2014): This new standard had no impact on the Group’s financial statements./ IFRS 12 Disclosure of Interests in Other Entities (effective date: January 1, 2014): This new standard required additional disclosures in the Group’s financial statements./ Consolidated Financial Statements, Joint Arrangements and Disclosure of Interests in Other Entities: Transition Guidance (Amendments to IFRS 10, IFRS 11 and IFRS 12) (effective date: January 1, 2014): These amendments had no material impact on the Group’s financial statements./ Investment Entities (Amendments to IFRS 10, IFRS 12 and IAS 27) (effective date: January 1, 2014): These amendments had no impact on the Group’s financial statements./ IAS 27 Separate Financial Statements – Revised (2011) (effective date: January 1, 2014): This amendment had no impact on the Group’s financial statements./ IAS 28 Investments in Associates and Joint Ventures – Revised (2011) (effective date: January 1, 2014): This amendment had no impact on the Group’s financial statements./ IAS 32 Amendment – Offsetting Financial Assets and Financial Liabilities (effective date: January 1, 2014): This amendment had no material impact on the Group’s financial statements./ IAS 39 Amendment – Novation of Derivatives and Continuation of Hedge Accounting (effective date: January 1, 2014): This amendment had no impact on the Group’s financial statements./ IFRIC 21 Levies (effective date: January 1, 2014): This new interpretation had no material impact on the Group’s financial statements.
New standards and interpretations as well as amendments to existing standards and interpretations are usually not applied by the Group before the effective date. One exception was the early application of the following standard:/ IAS 36 Amendment – Recoverable Amount Disclosures for Non-Financial Assets (effective date: January 1, 2014): By having applied this amendment early in the 2013 financial year, the unintentionally introduced requirement to disclose the recoverable amounts of cash-generating units irrespective of whether an impairment has actually occurred is waived.
New standards and interpretations and amendments to existing standards and interpretations that will be effective for financial years beginning after January 1, 2014, and which have not been applied in preparing these consolidated financial statements are:/ IAS 19 Amendment – Defined Benefit Plans: Employee Contributions (effective date: July 1, 2014): This amendment is not expected to have any material impact on the Group’s financial statements./ Improvements to IFRSs (2010 – 2012) (effective date: July 1, 2014): These improvements are expected to require additional disclosures in the Group’s financial statements./ Improvements to IFRSs (2011 – 2013) (effective date: July 1, 2014): These improvements are not expected to have any material impact on the Group’s financial statements.
The consolidated financial statements have in principle been prepared on the historical cost basis with the exception of certain items in the statement of financial position such as financial instruments valued at fair value through profit or loss, available-for-sale financial assets, derivative financial instruments, plan assets and receivables, which are measured at fair value.
The consolidated financial statements are presented in euros (€) and, unless otherwise stated, all values are presented in millions of euros (€ in millions). Due to rounding principles, numbers presented may not sum up exactly to totals provided.
01 General

adidas Group / 2014 Annual Report
Consolidated Financial Statements
1972 0 1 4
Notes
/ 04.8 /
The consolidated financial statements are prepared in accordance with the consolidation, accounting and valuation principles described below.
Principles of consolidation The consolidated financial statements include the financial statements of adidas AG and all its direct and indirect subsidiaries, which are prepared in accordance with uniform accounting principles. A company is considered a subsidiary if it is controlled by adidas AG. Control exists when the adidas Group is exposed to, or has rights to, variable returns from its involvement with the investee and has the ability to affect those returns through its power over the investee.
The number of consolidated subsidiaries evolved as follows for the years ending December 31, 2014 and December 31, 2013, respectively:
Number of consolidated subsidiaries
2014 2013
January 1 161 177
First-time consolidated subsidiaries 3 4
Thereof: newly founded 2 4
Thereof: purchased 1 –
Deconsolidated/divested subsidiaries (1) (7)
Intercompany mergers (9) (13)
December 31 154 161
The subsidiaries are held either directly by adidas AG or indirectly via the two holding companies adidas Beteiligungsgesellschaft mbH in Germany or adidas International B.V. in the Netherlands.
A schedule of the shareholdings of adidas AG is shown in Attachment II to the consolidated financial statements / SEE SHAREHOLDINGS OF ADIDAS AG, HERZOGENAURACH, P. 248. This schedule comprises information about the name, domicile, currency and equity of all consolidated subsidiaries as well as the respective share held in the capital of these subsidiaries. Furthermore, the schedule of the shareholdings of adidas AG will be published on the electronic platform of the German Federal Gazette.
Within the scope of the first-time consolidation, all acquired assets and liabilities are recognised in the statement of financial position at fair value at the acquisition date. A debit difference between the acquisition cost and the proportionate fair value of assets, liabilities and contingent liabilities is shown as goodwill. A credit difference is recorded in the income statement.
Acquisitions of additional investments in subsidiaries which are already controlled are recorded as equity transactions. Therefore, neither fair value adjustments of assets and liabilities nor gains or losses are recognised. Any difference between the cost for such an additional investment and the carrying amount of the net assets at the acquisition date is directly recorded in shareholders’ equity.
The financial effects of intercompany transactions as well as any unrealised gains and losses arising from intercompany business relations are eliminated in preparing the consolidated financial statements.
02 Summary of significant accounting policies

adidas Group / 2014 Annual Report
Consolidated Financial Statements
1982 0 1 4
Notes
/ 04.8 /
Principles of measurementThe following table includes an overview of selected measurement principles used in the preparation of the consolidated financial statements.
Overview of selected measurement principles
Item Measurement principle
Assets
Cash and cash equivalents Nominal amount
Short-term financial assets At fair value through profit or loss
Accounts receivable Amortised cost
Inventories Lower of cost or net realisable value
Assets classified as held for sale Lower of carrying amount and fair value less costs to sell
Property, plant and equipment Amortised cost
Goodwill Impairment-only approach
Intangible assets (except goodwill):
With definite useful life Amortised cost
With indefinite useful life Impairment-only approach
Other financial assets (categories according to IAS 39):
At fair value through profit or loss At fair value through profit or loss
Held to maturity Amortised cost
Loans and receivables Amortised cost
Available-for-sale At fair value in other comprehensive income or at amortised cost
Liabilities
Borrowings Amortised cost
Accounts payable Amortised cost
Other financial liabilities Amortised cost
Provisions:
Pensions Projected unit credit method
Other provisions Expected settlement amount
Accrued liabilities Amortised cost
Currency translation Transactions in foreign currencies are initially recorded in the respective functional currency by applying the spot exchange rate valid at the transaction date to the foreign currency amount.
In the individual financial statements of subsidiaries, monetary items denominated in non-functional currencies of the subsidiaries are generally translated into the functional currency at closing exchange rates at the balance sheet date. The resulting currency gains and losses are recorded directly in the income statement.
Assets and liabilities of the Group’s non-euro functional currency subsidiaries are translated into the presentation currency, the euro, which is also the functional currency of adidas AG, at closing exchange rates at the balance sheet date. For practical reasons, revenues and expenses are translated at average rates for the period which approximate the exchange rates on the transaction dates. All cumulative differences from the translation of equity of foreign subsidiaries resulting from changes in exchange rates are included in a separate item within shareholders’ equity without affecting the income statement.

adidas Group / 2014 Annual Report
Consolidated Financial Statements
1992 0 1 4
Notes
/ 04.8 /
A summary of exchange rates to the euro for major currencies in which the Group operates is as follows:
Exchange rates
(€ 1 equals) Average rates for the year ending Dec. 31, Spot rates at Dec. 31,
2014 2013 2014 2013
USD 1.3296 1.3283 1.2141 1.3791
GBP 0.8066 0.8492 0.7789 0.8337
JPY 140.4395 129.5777 145.2300 144.7200
CNY 8.1919 8.1674 7.4291 8.4082
RUB 50.7372 42.2979 68.3033 45.1368
Discontinued operationsA component of the Group’s business is classified as a discontinued operation if the operations and cash flows of the component can be clearly distinguished, operationally and for financial reporting purposes, from the rest of the Group and if the component either has been disposed of or is classified as held for sale, and:/ represents a separate major line of business or geographic area of operations,/ is part of a single coordinated plan to dispose of a separate major line of business or geographic area of
operations or/ is a subsidiary acquired exclusively with a view to resale.
When an operation is classified as a discontinued operation, the comparative consolidated income statement and consolidated statement of cash flows are restated and presented as if the operation had been discontinued from the start of the comparative year.
Derivative financial instruments The Group uses derivative financial instruments, such as currency options, forward exchange contracts, commodity futures as well as interest rate swaps and cross-currency interest rate swaps, to hedge its exposure to foreign exchange, commodity price and interest rate risks. In accordance with its Treasury Policy, the Group does not enter into transactions with derivative financial instruments for trading purposes.
Derivative financial instruments are initially recognised in the statement of financial position at fair value, and subsequently also measured at their fair value. The method of recognising the resulting gains or losses is dependent on the nature of the hedge. On the date a derivative contract is entered into, the Group designates derivatives as either a hedge of a forecasted transaction (cash flow hedge), a hedge of the fair value of a recognised asset or liability (fair value hedge) or a hedge of a net investment in a foreign entity.
Changes in the fair value of derivatives that are designated and qualify as cash flow hedges, and that are effective, as defined in IAS 39 ‘Financial instruments: recognition and measurement’, are recognised in equity. When the effectiveness is not 100%, the ineffective portion of the change in the fair value is recognised in the income statement. Accumulated gains and losses in equity are transferred to the income statement in the same periods during which the hedged forecasted transaction affects the income statement.
For derivative financial instruments designated as fair value hedges, the gains or losses on the derivatives and the offsetting gains or losses on the hedged items are recognised immediately in the income statement.
Certain derivative transactions, while providing effective economic hedges under the Group’s risk management policies, may not qualify for hedge accounting under the specific rules of IAS 39. Changes in the fair value of any derivative instruments that do not meet these rules are recognised immediately in the income statement.
Hedges of net investments in foreign entities are accounted for in a similar way to cash flow hedges. If, for example, the hedging instrument is a derivative (e.g. a forward exchange contract) or, for example, a foreign currency borrowing, effective currency gains and losses in the derivative and all gains and losses arising on the translation of the borrowing, respectively, are recognised in equity.

adidas Group / 2014 Annual Report
Consolidated Financial Statements
2002 0 1 4
Notes
/ 04.8 /
The Group documents the relationship between hedging instruments and hedge objects at transaction inception, as well as the risk management objectives and strategies for undertaking various hedge transactions. This process includes linking all derivatives designated as hedges to specific firm commitments and forecasted transactions. The Group also documents its assessment of whether the derivatives that are used in hedging transactions are highly effective by using different methods of effectiveness testing, such as the ‘dollar offset method’ or the ‘hypothetical derivative method’.
The fair values of currency options, forward exchange contracts and commodity futures are determined on the basis of market conditions on the reporting dates. The fair value of a currency option is determined using generally accepted models to calculate option prices. The fair market value of an option is influenced not only by the remaining term of the option but also by additional factors, such as the actual foreign exchange rate and the volatility of the underlying foreign currency base. Fair values are determined taking into consideration the counterparty risk. Due to immateriality, no adjustment has been recorded. The adidas Group has exercised the option to calculate the amounts on counterparty level according to IFRS 13 ‘Fair Value Measurement’, paragraph 48.
Cash and cash equivalents Cash and cash equivalents represent cash at banks, cash on hand and short-term deposits with maturities of three months or less from the date of acquisition.
Cash equivalents are short-term, highly liquid investments that are readily convertible to known amounts of cash and which are subject to an insignificant risk of changes in value.
Receivables and other financial assets Receivables and other financial assets are recognised at fair value, which corresponds to the nominal value for current receivables and other financial assets. For non-current receivables and other financial assets, the fair value is estimated as the present value of future cash flows discounted at the market rate of interest at the balance sheet date. Subsequently, these are measured at amortised cost using the ‘effective interest method’. Required allowances, if necessary, are determined on the basis of individual risk assessments, and on the ageing structure of receivables past due.
Inventories Merchandise and finished goods are valued at the lower of cost or net realisable value, which is the estimated selling price in the ordinary course of business less the estimated costs of completion and the estimated costs necessary to make the sale. Costs are determined using a standard valuation method: the ‘average cost method’. Costs of finished goods include cost of raw materials, direct labour and the components of the manufacturing overheads which can reasonably be attributed. The allocation of overheads is based on the planned average utilisation. The net realisable value allowances are computed consistently throughout the Group based on the age and expected future sales of the items on hand.
Assets/liabilities and disposal groups classified as held for sale Assets/liabilities and disposal groups classified as held for sale are primarily non-current assets and liabilities expected to be recovered principally through sale rather than through continuing use. These are measured at the lower of their carrying amount and fair value less costs to sell. Assets classified as held for sale are not depreciated on a straight-line basis.
Property, plant and equipment Property, plant and equipment are measured at amortised cost. This comprises any costs directly attributable to bringing the asset to the condition necessary for it to be capable of operating in the manner intended by Management less accumulated depreciation (except for land and construction in progress) and accumulated impairment losses. Depreciation is recognised over the estimated useful life utilising the ‘straight-line method’ and taking into account any potential residual value, except where the ‘declining-balance method’ is more appropriate in light of the actual utilisation pattern. Parts of an item of property, plant and equipment with a cost that is significant in relation to the total cost of the item are depreciated separately.

adidas Group / 2014 Annual Report
Consolidated Financial Statements
2012 0 1 4
Notes
/ 04.8 /
Land leases are measured at the lower of the fair value or the present value of minimum lease payments and are depreciated on a straight-line basis over the contractually agreed lease term.
Estimated useful lives are as follows:
Estimated useful lives of property, plant and equipment
Years
Land indefinite
Land leases 99
Buildings and leasehold improvements 20 – 50 1)
Technical equipment and machinery as well as other equipment and furniture and fixtures 2 – 10
1) Or, if shorter, the lease term/useful life (see Note 28).
Expenditures for repairs and maintenance are expensed as incurred. Renewals and improvements are capitalised and depreciated separately, if the recognition criteria are met.
Impairment losses If facts and circumstances indicate that non-current assets (e.g. property, plant and equipment, intangible assets including goodwill and certain financial assets) might be impaired, the recoverable amount is determined. It is measured at the higher of its fair value less costs to sell and value in use. Non-financial instruments measured at the recoverable amount primarily relate to impaired property, plant and equipment being measured at Level 3 according to IFRS 13 ‘Fair Value Measurement’ and taking unobservable inputs (e.g. profit or cash flow planning) into account. The recoverable amount for furniture and fixtures in own-retail stores is calculated using the discounted cash flow method as part of determining the profitability of the respective own-retail stores. An impairment loss is recognised in other operating expenses or reported in goodwill impairment losses if the carrying amount exceeds the recoverable amount. If there is an impairment loss for a cash-generating unit, first the carrying amount of any goodwill allocated to the cash-generating unit is reduced. Subsequently, provided that the recoverable amount is lower than the carrying amount, the other non-current assets of the unit are reduced pro rata on the basis of the carrying amount of each asset in the unit.
Irrespective of whether there is an impairment indication, intangible assets with an indefinite useful life and goodwill acquired in business combinations are tested annually for impairment.
An impairment loss recognised in goodwill is not reversible. With respect to all other impaired assets, an impairment loss recognised in prior periods is reversed affecting the income statement if there has been a change in the estimates used to determine the recoverable amount. An impairment loss is reversed only to the extent that the asset’s carrying amount does not exceed the carrying amount that would have been determined (net of depreciation or amortisation) if no impairment loss had been recognised.
LeasesUnder finance lease arrangements, the substantial risks and rewards associated with an asset are transferred to the lessee. At the beginning of the lease arrangement, the respective asset and a corresponding liability are recognised at the fair value of the asset or, if lower, the net present value of the minimum lease payments. For subsequent measurement, minimum lease payments are apportioned between the finance expense and the reduction of the outstanding liability. The finance expense is allocated to each period during the lease term so as to produce a constant periodic interest rate on the remaining balance of the liability. In addition, depreciation and any impairment losses for the associated assets are recognised. Depreciation is performed over the lease term or, if shorter, over the useful life of the asset.
Under operating lease agreements, rent expenses are recognised on a straight-line basis over the term of the lease.

adidas Group / 2014 Annual Report
Consolidated Financial Statements
2022 0 1 4
Notes
/ 04.8 /
Goodwill Goodwill is an asset representing the future economic benefits arising from assets acquired in a business combination that are not individually identified and separately recognised. This results when the purchase cost exceeds the fair value of acquired identifiable assets, liabilities and contingent liabilities. Goodwill arising from the acquisition of a foreign entity and any fair value adjustments to the carrying amounts of assets, liabilities and contingent liabilities of that foreign entity are treated as assets, liabilities and contingent liabilities of the respective reporting entity, and are translated at exchange rates prevailing at the date of the initial consolidation. Goodwill is carried in the functional currency of the acquired foreign entity.
Acquired goodwill is valued at cost and is tested for impairment on an annual basis and additionally when there are indications of potential impairment.
The cash-generating units are defined as the geographic regions (split into wholesale and retail) which are responsible for the joint distribution of adidas and Reebok as well as the other operating segments TaylorMade-adidas Golf, Rockport and Reebok-CCM Hockey. The number of cash-generating units amounted to 23 at the point in time of the annual impairment test. Due to the consolidation of five former single markets (Central Europe, North Europe, South Europe, France and Iberia) into the new market Western Europe and the integration of the market India into European Emerging Markets, the number of cash-generating units decreased from 32 in 2013 to 23 in 2014. At December 31, 2014, the cash-generating unit Rockport is classified as a disposal group and is shown in ‘Assets/liabilities classified as held for sale’ due to the concrete plans to divest the operating segment, leading to a further decrease in the number of cash-generating units to 22.
The cash-generating units represent the lowest level within the Group at which goodwill is monitored for internal management purposes. The impairment test for goodwill has been performed based on cash-generating units.
The recoverable amount of a cash-generating unit is determined on the basis of value in use. This calculation uses cash flow projections based on the financial planning covering a six-year period in total. The planning is based on long-term expectations of the adidas Group and reflects in total for the cash-generating units an average annual mid- to high-single-digit sales increase with varying forecasted growth prospects for the different units. For the majority of the cash-generating units of the Retail segment an increase above the Group average is expected. Furthermore, we expect the operating margin to expand, primarily driven by an improvement in the gross margin as well as lower operating expenses as a percentage of sales. The planning for capital expenditure and working capital is primarily based on past experience. The planning for future tax payments is based on current statutory corporate tax rates of the single cash-generating units. Cash flows beyond this six-year period are extrapolated using steady growth rates of 1.7% (2013: 1.7%). According to our expectations, these growth rates do not exceed the long-term average growth rate of the business in which each cash-generating unit operates.
Discount rates are based on a weighted average cost of capital calculation considering a five-year average market-weighted debt/equity structure and financing costs referencing the Group’s major competitors for each cash-generating unit. The discount rates used are after-tax rates and reflect the specific equity and country risk of the relevant cash-generating unit.
In total, goodwill impairment losses of € 78 million have been recognised in 2014 (2013: € 52 million). The carrying amount of the cash-generating unit Retail CIS was determined to be higher than its recoverable amount of € 619 million and an impairment loss amounting to € 78 million was recognised in the Retail segment. The goodwill of this cash-generating unit is completely impaired. The impairment losses were mainly caused by adjusted growth assumptions due to the significant deterioration of the Russian rouble. In 2013, within the Wholesale segment, goodwill impairment losses amounted to € 23 million in Iberia (part of Western Europe since 2014), and within the Retail segment goodwill impairment losses amounted to € 29 million in North America.
A change in the discount rate by approximately 0.7 percentage points or a reduction of planned free cash inflows by approximately 12% would cause the carrying amount to exceed the recoverable amount for the cash-generating unit TaylorMade-adidas Golf. For all other cash-generating units, even an increase in the discount rate by approximately 1.5 percentage points or a reduction of planned free cash inflows by approximately 30% would not result in any additional impairment requirement.

adidas Group / 2014 Annual Report
Consolidated Financial Statements
2032 0 1 4
Notes
/ 04.8 /
The carrying amounts of acquired goodwill allocated to the respective cash-generating units and the respective discount rates applied to the cash flow projections are as follows:
Allocation of goodwill
Goodwill (€ in millions)
Discount rate (after taxes)
Dec. 31, 2014 Dec. 31, 2013 Dec. 31, 2014 Dec. 31, 2013
Wholesale Western Europe 422 389 8.1% 7.9 – 11.3%
Wholesale Greater China 168 156 7.8% 8.6%
Wholesale – Other 158 146 7.9 – 9.7% 8.7 – 10.5%
Wholesale 748 691
Retail Western Europe 59 55 8.1% 7.9 – 11.3%
Retail CIS 0 76 9.7% 10.4%
Retail – Other 71 66 7.8 – 11.2% 7.7 – 12.1%
Retail 131 197
TaylorMade-adidas Golf 290 288 7.3% 8.0%
Rockport 0 28 8.2% 8.4%
Other Businesses 290 316
Total 1,169 1,204
Intangible assets (except goodwill) Intangible assets are valued at amortised cost. Amortisation is calculated on a straight-line basis taking into account any potential residual value.
Expenditures during the development phase of internally generated intangible assets are capitalised as incurred if they qualify for recognition under IAS 38 ‘Intangible Assets’.
Estimated useful lives are as follows:
Estimated useful lives of intangible assets
Years
Trademarks indefinite
Software 5 – 7
Patents, trademarks and concessions 5 – 15
The adidas Group determined that there was no impairment necessary for any of its trademarks with indefinite useful lives in the years ending December 31, 2014 and 2013. In addition, an increase in the discount rate of up to approximately 1.5 percentage points or a reduction of cash inflows of up to approximately 20% would not result in any impairment requirement.
The recoverable amount is determined on the basis of fair value less costs to sell (costs to sell are calculated with 1% of the fair value). The fair value is determined in discounting notional royalty savings after tax and adding a tax amortisation benefit, resulting from the amortisation of the acquired asset (‘relief-from-royalty method’). These calculations use projections of net sales related royalty savings, based on financial planning which covers a period of five years in total. The level of the applied royalty rate for the determination of the royalty savings is based on contractual agreements between the adidas Group and external licensees as well as publicly available royalty rate agreements for similar assets. Notional royalty savings beyond this period are extrapolated using steady growth rates of 1.7% (2013: 1.7%). The growth rates do not exceed the long-term average growth rate of the business to which the trademarks are allocated.

adidas Group / 2014 Annual Report
Consolidated Financial Statements
2042 0 1 4
Notes
/ 04.8 /
The discount rate is based on a weighted average cost of capital calculation derived using a five-year average market-weighted debt/equity structure and financing costs referencing the Group’s major competitors. The discount rate used is an after-tax rate and reflects the specific equity and country risk. The applied discount rate depends on the respective intangible asset being valued and ranges between 6.7% and 8.4% (2013: between 6.8% and 8.8%).
Research and development Research costs are expensed in full as incurred. Development costs are also expensed as incurred if they do not meet the recognition criteria of IAS 38 ‘Intangible Assets’.
The Group spent € 126 million and € 124 million on product research and development (continuing operations) for the years ending December 31, 2014 and 2013, respectively.
Financial assets All purchases and sales of financial assets are recognised on the trade date. Costs of purchases include transaction costs. Available-for-sale financial assets include non-derivative financial assets which are not allocable under another category of IAS 39. If their respective fair value can be measured reliably, they are subsequently carried at fair value. If this is not the case, these are measured at amortised cost. Realised and unrealised gains and losses arising from changes in the fair value of financial assets are included in the income statement for the period in which they arise, except for available-for-sale financial assets where unrealised gains and losses are recognised in equity unless they are impaired.
Borrowings and other liabilities Borrowings (e.g. Eurobonds) and other liabilities are recognised at fair value using the ‘effective interest method’, net of transaction costs incurred. In subsequent periods, long-term borrowings are stated at amortised cost using the ‘effective interest method’. Any difference between proceeds (net of transaction costs) and the redemption value is recognised in the income statement over the term of the borrowing.
Compound financial instruments (e.g. convertible bonds) are divided into a liability component shown under borrowings and into an equity component resulting from conversion rights. The equity component is included in the capital reserve. The fair value of the liability component is determined by discounting the interest and principal payments of a comparable liability without conversion rights, applying risk-adjusted interest rates. The liability component is subsequently measured at amortised cost using the ‘effective interest method’. The equity component is determined as the difference between the fair value of the total compound financial instrument and the fair value of the liability component and is reported within equity. There is no subsequent measurement of the equity component. At initial recognition, directly attributable transaction costs are assigned to the equity and liability component pro rata on the basis of the respective carrying amounts.
Other provisions and accrued liabilities Other provisions are recognised where a present obligation (legal or constructive) to third parties has been incurred as a result of a past event which can be estimated reliably and is likely to lead to an outflow of resources, and where the timing or amount is uncertain. Other non-current provisions are discounted if the effect of discounting is material.
Accrued liabilities are liabilities to pay for goods or services that have been received or supplied but have not been paid, invoiced or formally agreed with the supplier, including amounts due to employees. Here, however, the timing and amount of an outflow of resources is not uncertain.
Pensions and similar obligations Provisions and expenses for pensions and similar obligations relate to the Group’s obligations for defined benefit and defined contribution plans. The obligations under defined benefit plans are determined separately for each plan by valuing the employee benefits accrued in return for their service during the current and prior periods. These benefit accruals are discounted to calculate their present value, and the fair value of any plan assets is deducted in order to determine the net liability. The discount rate is set on the basis of yields of high-quality corporate bonds at the balance sheet date provided there is a deep market for high-quality corporate bonds in a given currency. Otherwise, government bond yields are used as a reference. Calculations are performed by qualified actuaries using the ‘projected unit credit method’ in accordance with IAS 19 ‘Employee Benefits’. Obligations for contributions to defined contribution plans are recognised as an expense in the income statement as incurred.

adidas Group / 2014 Annual Report
Consolidated Financial Statements
2052 0 1 4
Notes
/ 04.8 /
Contingent liabilities Contingent liabilities are possible obligations that arise from past events and whose existence will be confirmed only by the occurrence of one or more uncertain future events not wholly within the control of the Group. Additionally, contingent liabilities may be present obligations that arise from past events but which are not recognised because it is not probable that an outflow of resources will be required to settle the obligation or the amount of the obligation cannot be measured with sufficient reliability. Contingent liabilities are not recognised in the consolidated statement of financial position but are disclosed and explained in the Notes / SEE NOTE 38.
Treasury sharesWhen treasury shares recognised as equity are repurchased, the amount of the consideration paid, which includes directly attributable costs, net of any tax effects, is recognised as a deduction from equity. The nominal value of € 1 per treasury share is debited to share capital. Any premium or discount to the nominal value is shown as an adjustment to the retained earnings. If treasury shares are sold or re-issued, the nominal value of the shares will be credited to share capital.
Recognition of revenues Sales are recognised at the fair value of the consideration received or receivable, net of returns, trade discounts and volume rebates, when the significant risks and rewards of ownership of the goods are transferred to the buyer, and when it is probable that the economic benefits associated with the transaction will flow to the Group.
Royalty and commission income is recognised based on the contract terms on an accrual basis.
Advertising and promotional expenditures Production costs for media campaigns are included in prepaid expenses (other current and non-current assets) until the services are received, and upon receipt expensed in full. Significant media buying costs are expensed over the intended duration of the broadcast.
Promotional expenses that involve payments, including one-time up-front payments for promotion contracts, are expensed on a straight-line basis over the term of the agreement.
Interest Interest is recognised as income or expense as incurred using the ‘effective interest method’ with the exception of interest that is directly attributable to the acquisition, construction or production of a qualifying asset. This interest is capitalised as part of the cost of the qualifying asset.
Income taxes Current income taxes are computed in accordance with the applicable taxation rules established in the countries in which the Group operates.
The Group computes deferred taxes for all temporary differences between the carrying amount and the tax base of its assets and liabilities and tax loss carry-forwards. As it is not permitted to recognise a deferred tax liability for goodwill, the Group does not compute any deferred taxes thereon.
Deferred tax assets arising from deductible temporary differences and tax loss carry-forwards which exceed taxable temporary differences are only recognised to the extent that it is probable that the company concerned will generate sufficient taxable income to realise the associated benefit.
Income tax is recognised in the income statement except to the extent that it relates to items recognised directly in equity, in which case it is recognised in equity.

adidas Group / 2014 Annual Report
Consolidated Financial Statements
2062 0 1 4
Notes
/ 04.8 /
Estimation uncertainties and judgementsThe preparation of financial statements in conformity with IFRS requires the use of assumptions and estimates that affect reported amounts and related disclosures. Although such estimates are based on Management’s best knowledge of current events and actions, actual results may ultimately differ from these estimates.
The key assumptions concerning the future and other key sources of estimation uncertainty at the balance sheet date which have a significant risk of causing a material adjustment to the carrying amounts of assets and liabilities within the next financial year are outlined in the respective Notes, in particular goodwill / SEE
NOTE 13, trademarks / SEE NOTE 14, other provisions / SEE NOTE 20, pensions / SEE NOTE 24, derivatives / SEE NOTE 29, deferred taxes / SEE NOTE 34 as well as litigation and other legal risks / SEE NOTE 38.
Judgements have, for instance, been used in classifying leasing arrangements as well as in determining valuation methods for intangible assets.
Plans to sell the Rockport operating segment became concrete towards the end of 2014 and a divestiture within the next twelve months is considered as highly probable. For this reason, the Rockport operating segment is reported as discontinued operations at December 31, 2014. The focus and the strategic direction of the Group’s brand portfolio primarily lies in the field of sports with the result that the Rockport operating segment is no longer regarded as significant in terms of the Group’s strategic direction.
The Rockport operating segment was neither classified as assets held for sale nor as discontinued operations at December 31, 2013. The 2013 figures of the consolidated income statement and the consolidated statement of cash flows have been restated to show the discontinued operations separately from continuing operations.
The results of the Rockport operating segment are shown as discontinued operations in the consolidated income statement for all periods:
Discontinued operations
(€ in millions) Dec. 31, 2014 Dec. 31, 2013
Net sales 283 289
Expenses 264 268
Income from operating activities 19 21
Income taxes 5 4
Income from operating activities, net of tax 14 17
Loss recognised on the measurement to fair value less costs to sell (110) –
Income taxes 28 –
Loss recognised on the measurement to fair value less costs to sell, net of tax (82) –
Losses/gains from discontinued operations, net of tax (68) 17
Basic earnings per share from discontinued operations (€) (0.32) 0.08
Diluted earnings per share from discontinued operations (€) (0.32) 0.08
Losses from discontinued operations in an amount of € 68 million (2013: gains of € 17 million) are entirely attributable to the shareholders of adidas AG.
03 Discontinued operations

adidas Group / 2014 Annual Report
Consolidated Financial Statements
2072 0 1 4
/ 04.8 /
Notes / Notes to the Consolidated Statement of Financial Position
Effective November 24, 2014, Reebok International Limited completed the acquisition of Luta Ltd. (‘Luta’). Based in London (UK), Luta designs and sells boxing and workout clothing. With this acquisition, the adidas Group has entered into a long-term partnership with ‘Fight for Peace’, a non-profit organisation which combines boxing and martial arts with education and personal development. In addition, this partnership facilitated the completion of a licence agreement with the mixed martial arts organisation ‘Ultimate Fighting Championship’ (UFC). The entire business of Luta was acquired for a purchase price of GBP 5 million in cash.
The acquisition had the following effect on the Group’s assets and liabilities, based on a preliminary purchase price allocation:
Net assets of Luta Ltd. at the acquisition date
(€ in millions) Pre-acquisition carrying amounts
Fair value adjustments
Recognised values on acquisition
Cash and cash equivalents 0 – 0
Accounts receivable 0 – 0
Inventories 0 – 0
Other current assets 0 – 0
Property, plant and equipment 0 – 0
Trademarks and similar rights – 7 7
Accounts payable (0) – (0)
Deferred tax liabilities – (1) (1)
Net assets 1 6 6
Goodwill arising on acquisition –
Purchase price settled in cash 6
Less: cash and cash equivalents acquired (0)
Cash outflow on acquisition 6
The following valuation method for the acquired assets was applied:/ Trademarks and similar rights: The ‘relief-from-royalty method’ was applied. The fair value was determined by discounting notional royalty savings after tax and adding a tax amortisation benefit, resulting from the amortisation of the acquired asset.
The acquired subsidiary generated net sales of € 0 million as well as net losses of € 0.2 million in December 2014. If this acquisition had occurred on January 1, 2014, total Group net sales would have been € 14.5 billion and net income attributable to shareholders would have been € 489 million for the year ending December 31, 2014.
Notes to the Consolidated Statement of Financial Position
Cash and cash equivalents consist of cash at banks, cash on hand, short-term bank deposits and investments in money market funds. Short-term financial assets are only shown as cash and cash equivalents if they are readily convertible to a known amount of cash and are subject to an insignificant risk of changes in value.
Short-term financial assets are classified ‘at fair value through profit or loss’. Changes in the fair value are recognised in the income statement as they occur.
The majority of short-term financial assets are time deposits.
04 Acquisition
05 Cash and cash equivalents
06 Short-term financial assets

adidas Group / 2014 Annual Report
Consolidated Financial Statements
2082 0 1 4
/ 04.8 /
Notes / Notes to the Consolidated Statement of Financial Position
Accounts receivable consist mainly of the currencies euro, US dollar and Japanese yen and are as follows:
Accounts receivable
(€ in millions) Dec. 31, 2014 Dec. 31, 2013
Accounts receivable, gross 2,085 1,929
Less: accumulated allowances for doubtful accounts (139) (120)
Accounts receivable, net 1,946 1,809
Movement in allowances for doubtful accounts
(€ in millions) 2014 2013
Allowances at January 1 120 121
Additions 65 51
Reversals (40) (41)
Write-offs charged against the allowance accounts (9) (8)
Currency translation differences 4 (4)
Other changes (1) 1
Allowances at December 31 139 120
Accounts receivable past due but not impaired
(€ in millions) Past due 1 – 30 days
Past due31 – 60 days
Past due61 – 90 days
Past due91 – 180 days
Past due> 180 days
Dec. 31, 2014 169 77 10 6 1
Dec. 31, 2013 162 52 8 4 0
With respect to accounts receivable as at the balance sheet date past due but not impaired, based on credit history and current credit ratings, there are no indications that customers will not be able to meet their obligations.
Further, no indications of default are recognisable for accounts receivable that are neither past due nor impaired.
Due to concrete plans to sell the Rockport operating segment, assets amounting to € 49 million were transferred from ‘Accounts receivable‘ to ‘Assets classified as held for sale’ at year-end 2014 / SEE NOTE 11.
For further information about credit risks / SEE RISK AND OPPORTUNITY REPORT, P. 154.
Other current financial assets consist of the following:
Other current financial assets
(€ in millions) Dec. 31, 2014 Dec. 31, 2013
Currency options 30 6
Forward exchange contracts 240 47
Security deposits 64 69
Sundry 64 61
Other current financial assets 398 183
For further information about currency options and forward exchange contracts / SEE NOTE 29.
07 Accounts receivable
08 Other current financial assets

adidas Group / 2014 Annual Report
Consolidated Financial Statements
2092 0 1 4
/ 04.8 /
Notes / Notes to the Consolidated Statement of Financial Position
Inventories by major classification are as follows:
Inventories
(€ in millions) Dec. 31, 2014 Dec. 31, 2013
Gross value Allowance for obsolescence
Net value Gross value Allowance for obsolescence
Net value
Merchandise and finished goods on hand 1,898 (92) 1,806 1,872 (69) 1,803
Goods in transit 688 – 688 800 – 800
Raw materials 34 (2) 32 31 (1) 30
Work in progress 1 – 1 1 – 1
Inventories 2,620 (94) 2,526 2,704 (70) 2,634
Goods in transit mainly relate to shipments of finished goods and merchandise from suppliers in Asia to subsidiaries in Europe, Asia, North America and Latin America.
Due to concrete plans to sell the Rockport operating segment, assets amounting to € 88 million were transferred from ‘Inventories‘ to ‘Assets classified as held for sale’ at year-end 2014 / SEE NOTE 11.
Other current assets consist of the following:
Other current assets
(€ in millions) Dec. 31, 2014 Dec. 31, 2013
Prepaid expenses 194 236
Tax receivables other than income taxes 129 133
Sundry 103 138
Other current assets, gross 426 507
Less: accumulated allowances 2 1
Other current assets, net 425 506
Prepaid expenses relate mainly to promotion and service contracts as well as rents.
At December 31, 2014, part of the assets of adidas AG, which mainly comprise land amounting to € 11 million (2013: € 11 million), are still presented as held for sale following a signed contract of sale, which is still awaiting certain conditions to be fulfilled that are not in the area of influence of the adidas Group. The automatic accretion of the assets, formerly owned by GEV Grundstücksgesellschaft Herzogenaurach mbH & Co. KG, into adidas AG is caused by the merger of the partner with limited liability GEV GmbH with adidas AG.
In addition, at December 31, 2014, all assets and liabilities of the Rockport operating segment are presented as a disposal group held for sale due to the concrete plans to sell the operating segment. The Rockport operating segment is part of Other Businesses.
Impairment losses of € 104 million (before transaction costs) for write-downs of the disposal group Rockport to the lower of its carrying amount and its fair value less costs to sell have been included in ‘Losses/gains from discontinued operations, net of tax’ / SEE NOTE 03. At December 31, 2014, the fair value less costs to sell amounts to € 211 million. The impairment losses have been applied to reduce the carrying amount of goodwill, trademarks and other intangible assets as well as property, plant and equipment.
09 Inventories
10 Other current assets
11 Assets/liabilities and disposal groups classified as held for sale
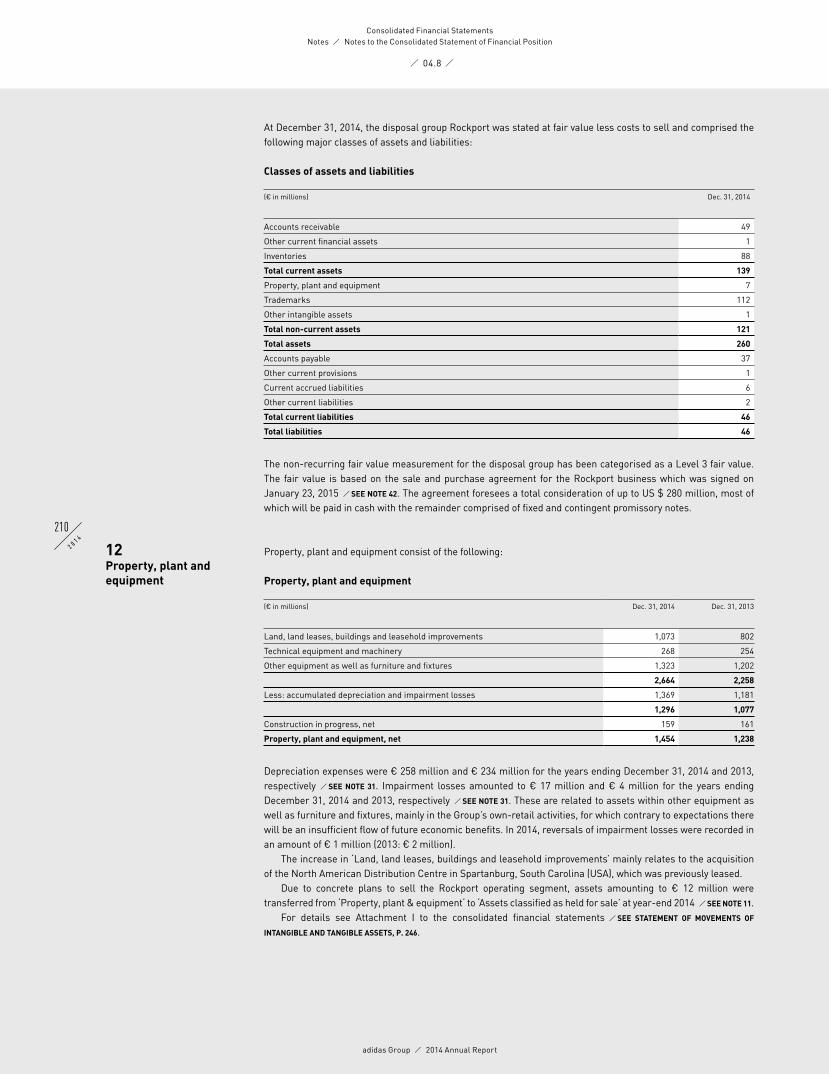
adidas Group / 2014 Annual Report
Consolidated Financial Statements
2102 0 1 4
/ 04.8 /
Notes / Notes to the Consolidated Statement of Financial Position
At December 31, 2014, the disposal group Rockport was stated at fair value less costs to sell and comprised the following major classes of assets and liabilities:
Classes of assets and liabilities
(€ in millions) Dec. 31, 2014
Accounts receivable 49
Other current financial assets 1
Inventories 88
Total current assets 139
Property, plant and equipment 7
Trademarks 112
Other intangible assets 1
Total non-current assets 121
Total assets 260
Accounts payable 37
Other current provisions 1
Current accrued liabilities 6
Other current liabilities 2
Total current liabilities 46
Total liabilities 46
The non-recurring fair value measurement for the disposal group has been categorised as a Level 3 fair value. The fair value is based on the sale and purchase agreement for the Rockport business which was signed on January 23, 2015 / SEE NOTE 42. The agreement foresees a total consideration of up to US $ 280 million, most of which will be paid in cash with the remainder comprised of fixed and contingent promissory notes.
Property, plant and equipment consist of the following:
Property, plant and equipment
(€ in millions) Dec. 31, 2014 Dec. 31, 2013
Land, land leases, buildings and leasehold improvements 1,073 802
Technical equipment and machinery 268 254
Other equipment as well as furniture and fixtures 1,323 1,202
2,664 2,258
Less: accumulated depreciation and impairment losses 1,369 1,181
1,296 1,077
Construction in progress, net 159 161
Property, plant and equipment, net 1,454 1,238
Depreciation expenses were € 258 million and € 234 million for the years ending December 31, 2014 and 2013, respectively / SEE NOTE 31. Impairment losses amounted to € 17 million and € 4 million for the years ending December 31, 2014 and 2013, respectively / SEE NOTE 31. These are related to assets within other equipment as well as furniture and fixtures, mainly in the Group’s own-retail activities, for which contrary to expectations there will be an insufficient flow of future economic benefits. In 2014, reversals of impairment losses were recorded in an amount of € 1 million (2013: € 2 million).
The increase in ‘Land, land leases, buildings and leasehold improvements’ mainly relates to the acquisition of the North American Distribution Centre in Spartanburg, South Carolina (USA), which was previously leased.
Due to concrete plans to sell the Rockport operating segment, assets amounting to € 12 million were transferred from ‘Property, plant & equipment‘ to ‘Assets classified as held for sale’ at year-end 2014 / SEE NOTE 11.
For details see Attachment I to the consolidated financial statements / SEE STATEMENT OF MOVEMENTS OF
INTANGIBLE AND TANGIBLE ASSETS, P. 246.
12 Property, plant and equipment

adidas Group / 2014 Annual Report
Consolidated Financial Statements
2112 0 1 4
/ 04.8 /
Notes / Notes to the Consolidated Statement of Financial Position
Goodwill primarily relates to the Group’s acquisitions of the Reebok and TaylorMade businesses as well as acquisitions of subsidiaries, primarily in the United States, Australia/New Zealand, the Netherlands, Denmark and Italy.
Goodwill
(€ in millions) Dec. 31, 2014 Dec. 31, 2013
Goodwill, gross 1,588 1,533
Less: accumulated impairment losses (419) (329)
Goodwill, net 1,169 1,204
The majority of goodwill which primarily relates to the acquisition of the Reebok business in 2006 is denominated in US dollars. A currency translation effect of positive € 73 million and negative € 25 million was recorded for the years ending December 31, 2014 and 2013, respectively.
The Group determines whether goodwill impairment is necessary at least on an annual basis. This requires an estimation of the value in use of the cash-generating units to which the goodwill is allocated. Estimating the value in use requires the Group to make an estimate of the expected future cash flows from the cash-generating units and also to choose a suitable discount rate in order to calculate the present value of those cash flows.
Goodwill impairment losses for 2014 amounted to € 78 million (2013: € 52 million). The goodwill impairment amount related to 2014 comprises an impairment loss within the Retail segment of € 78 million (2013: € 29 million Retail segment and € 23 million Wholesale segment).
Future changes in expected cash flows and discount rates may lead to impairments of the reported goodwill in the future. For details see Attachment I to the consolidated financial statements / SEE STATEMENT OF MOVEMENTS
OF INTANGIBLE AND TANGIBLE ASSETS, P. 246.The reconciliation of goodwill is as follows:
Reconciliation of goodwill, net
(€ in millions) Wholesale Retail Other Businesses
Total
January 1, 2014 691 197 316 1,204
Currency translation differences 57 12 4 73
Impairment losses – (78) – (78)
Transfer to assets held for sale – – (30) (30)
December 31, 2014 748 131 290 1,169
At December 31, 2014, the carrying amount of acquired goodwill allocated to the cash-generating unit Rockport was transferred to ‘Assets held for sale’ due to the concrete plans to sell the Rockport operating segment and is impaired completely in connection with the fair value measurement of the disposal group / SEE NOTE 11.
13 Goodwill

adidas Group / 2014 Annual Report
Consolidated Financial Statements
2122 0 1 4
/ 04.8 /
Notes / Notes to the Consolidated Statement of Financial Position
Trademarks and other intangible assets consist of the following:
Trademarks and other intangible assets
(€ in millions) Dec. 31, 2014 Dec. 31, 2013
Reebok 1,276 1,123
Rockport – 158
Reebok-CCM Hockey 107 94
Other 49 44
Trademarks 1,432 1,419
Software, patents and concessions 772 720
Less: accumulated amortisation and impairment losses 609 556
Other intangible assets 162 164
Trademarks and other intangible assets 1,594 1,583
At December 31, 2014, trademarks, mainly related to the acquisition of Reebok International Ltd. (USA) in 2006 and Ashworth, Inc. in 2008, have indefinite useful lives. This is due to the expectation of permanent use of the acquired brand names.
At December 31, 2014, the Rockport trademark was transferred to ‘Assets held for sale’ due to the concrete plans to sell the Rockport operating segment and is impaired by € 68 million in connection with the fair value measurement of the disposal group / SEE NOTE 11.
The reported other trademarks mainly relate to the brand names Ashworth, Adams Golf and Five Ten. The Group tests at least on an annual basis whether trademarks with indefinite useful lives are impaired. This
requires an estimation of the fair value less costs to sell of the trademarks. As part of this estimation, the Group is required to make an estimate of the expected future trademark-specific sales and appropriate arm’s length notional royalty rates and also to choose a suitable discount rate in order to calculate the present value of those cash flows. There was no need for impairment for the years ending December 31, 2014 and 2013.
Future changes in expected cash flows and discount rates may lead to impairments of the accounted trademarks in the future.
As part of the goodwill impairment test, the Reebok trademark is allocated on a pro rata basis to the cash-generating units. Thereof, the major shares relate to Retail CIS (€ 276 million), Retail North America (€ 209 million), Wholesale Western Europe (€ 201 million), Wholesale Latin America (€ 119 million) and Wholesale North America (€ 117 million).
Amortisation expenses for intangible assets with definite useful lives were € 58 million and € 52 million for the years ending December 31, 2014 and 2013, respectively / SEE NOTE 31.
For details see Attachment I to the consolidated financial statements / SEE STATEMENT OF MOVEMENTS OF
INTANGIBLE AND TANGIBLE ASSETS, P. 246.
Long-term financial assets primarily include a 8.33% investment in FC Bayern München AG (2013: 9.1%) of € 80 million (2013: € 80 million). The percentage share held in the investment has decreased due to the issuance of new shares which have been bought by another shareholder. This investment is classified as ‘fair value through profit or loss’ and recorded at fair value. This equity security does not have a quoted market price in an active market. Therefore, existing contractual arrangements were used in order to calculate the fair value as at December 31, 2014.
The line item ‘Investments and other financial assets’ comprises the shares in Immobilieninvest und Betriebsgesellschaft Herzo-Base GmbH & Co. KG as well as other minority shareholdings amounting to € 16 million (2013: € 13 million) which are classified as ‘Available-for-sale’ and measured at amortised cost as a reliable determination of the fair value is impossible without having concrete negotiations regarding a sale. These shares are unlisted and do not have an active market. There is no intention to sell these shares.
Additionally, long-term financial assets include investments which are mainly invested in insurance products and are measured at fair value, as well as other financial assets.
14 Trademarks and other intangible assets
15 Long-term financial assets

adidas Group / 2014 Annual Report
Consolidated Financial Statements
2132 0 1 4
/ 04.8 /
Notes / Notes to the Consolidated Statement of Financial Position
Long-term financial assets
(€ in millions) Dec. 31, 2014 Dec. 31, 2013
Investment in FC Bayern München AG 80 80
Investments and other financial assets 49 40
Long-term financial assets 129 120
Other non-current financial assets consist of the following:
Other non-current financial assets
(€ in millions) Dec. 31, 2014 Dec. 31, 2013
Currency options 10 6
Forward exchange contracts 5 0
Security deposits 27 24
Sundry 0 –
Other non-current financial assets 42 30
For further information about currency options and forward exchange contracts / SEE NOTE 29.
Other non-current assets consist of the following:
Other non-current assets
(€ in millions) Dec. 31, 2014 Dec. 31, 2013
Prepaid expenses 99 80
Sundry 6 1
Other non-current assets 105 81
Prepaid expenses mainly include prepayments for long-term promotion contracts and rents / SEE NOTES 38 AND 28.
Borrowings are denominated in a variety of currencies in which the Group conducts its business. The largest portions of effective gross borrowings (before liquidity swaps for cash management purposes) as at December 31, 2014 are denominated in euros (2014: 80%; 2013: 76%) and US dollars (2014: 12%; 2013: 14%).
The weighted average interest rate on the Group’s gross borrowings decreased to 3.1% in 2014 (2013: 3.8%).As at December 31, 2014, the Group had cash credit lines and other long-term financing arrangements totalling
€ 3.7 billion (2013: € 3.4 billion); thereof unused credit lines accounted for € 1.8 billion (2013: € 2.0 billion). In addition, at December 31, 2014, the Group had separate lines for the issuance of letters of credit and guarantees in an amount of approximately € 0.2 billion (2013: € 0.2 billion).
The Group’s outstanding financings are unsecured and may include standard financial covenants, which are reviewed on a quarterly basis. These covenants may include limits on the disposal of fixed assets, the maximum amount of debt secured by liens, cross default provisions and change of control. In addition, certain financial arrangements contain equity ratio covenants, minimum equity covenants as well as net loss covenants.
As at December 31, 2014, and December 31, 2013, shareholders’ equity was well above the amount of the minimum equity covenant. Likewise, the relevant amount of net income clearly exceeded net loss covenants.
16 Other non-current financial assets
17 Other non-current assets
18 Borrowings and credit lines

adidas Group / 2014 Annual Report
Consolidated Financial Statements
2142 0 1 4
/ 04.8 /
Notes / Notes to the Consolidated Statement of Financial Position
The amounts disclosed as gross borrowings represent outstanding borrowings under the following arrangements with aggregated expiration dates as follows:
Gross borrowings as at December 31, 2014
(€ in millions) Up to 1 year
Between 1 and 3 years
Between 3 and 5 years
More than 5 years
Total
Bank borrowings incl. commercial paper 194 – – – 194
Private placements 95 123 – – 218
Eurobond – – – 990 990
Convertible bond – 471 – – 471
Total 288 594 – 990 1,873
The above table includes two Eurobonds amounting to € 1 billion in total issued on October 1, 2014. The seven-year Eurobond of € 600 million matures on October 8, 2021 and has a coupon of 1.25%. The twelve-year Eurobond of € 400 million matures on October 8, 2026 and has a coupon of 2.25%. The Eurobonds have denominations of € 1,000 each and were priced with a spread of 68 basis points and 100 basis points, respectively, above the corresponding euro mid-swap rate. The issue price was fixed at 99.145% and 99.357%, respectively.
In addition, gross borrowings include a convertible bond for an aggregate nominal amount of € 500 million divided into denominations of € 200,000 which was issued on March 21, 2012. The bond has a maximum maturity (including prolongation options) until June 14, 2019. The coupon of the bond amounts to 0.25% and is payable annually, commencing on June 14, 2013. The bond is, at the option of the respective holder, convertible at any time from and including May 21, 2012, up to and including June 5, 2019, into up to 6.06 million new or existing adidas AG shares. The convertible bond has a conversion premium of 40% above the reference price of € 59.61, which resulted in an initial conversion price of € 83.46 per share. As a consequence of contractual provisions relating to dividend protection, the conversion price was adjusted from € 83.10 to € 82.56 per share. This adjustment became effective on May 9, 2014. On June 14, 2017, the bondholders have the right to call the bond at nominal value plus interest accrued on the nominal amount. adidas AG is entitled to redeem the remaining bonds in whole if, at any time, the aggregate principal amount of bonds outstanding falls below 15% of the aggregate principal amount of the bonds that were initially issued. Furthermore, as of July 14, 2017, adidas AG is entitled to redeem the bonds in whole if, on 20 of 30 consecutive trading days, the share price of adidas AG exceeds the current conversion price of € 82.56 by at least 30%.
According to IAS 32 ‘Financial Instruments: Presentation’, the conversion right represented in the convertible bond constitutes a financial instrument which is covered in the capital reserve in an amount of € 55 million after deduction of the issuance cost. The initial liability component amounted to € 441 million after deduction of the issuance cost and is shown within long-term borrowings. The initial difference of € 59 million compared to the nominal amount of € 500 million is accrued as interest expense of the financial liability over the expected maturity of the convertible bond using the ‘effective interest method’. As at December 31, 2013, the financial liability amounted to € 471 million.
Gross borrowings as at December 31, 2013
(€ in millions) Up to 1 year
Between 1 and 3 years
Between 3 and 5 years
More than 5 years
Total
Bank borrowings incl. commercial paper 126 – – – 126
Private placements 55 193 – – 248
Eurobond 500 – – – 500
Convertible bond – – 460 – 460
Total 681 193 460 – 1,334
The above table includes a Eurobond issued on July 6, 2009 in a nominal amount of € 500 million and with an initial maturity of five years. The Eurobond with an annual coupon of 4.75% was repaid on July 14, 2014.
Furthermore, on June 4, 2014, a private placement amounting to € 56 million was repaid.For further details on future cash outflows / SEE RISK AND OPPORTUNITY REPORT, P. 154.

adidas Group / 2014 Annual Report
Consolidated Financial Statements
2152 0 1 4
/ 04.8 /
Notes / Notes to the Consolidated Statement of Financial Position
Other current financial liabilities consist of the following:
Other current financial liabilities
(€ in millions) Dec. 31, 2014 Dec. 31, 2013
Currency options 0 3
Forward exchange contracts 50 77
Commodity futures 3 –
Finance lease obligations 3 4
Sundry 35 29
Other current financial liabilities 91 113
For further information about currency options, forward exchange contracts and commodity futures / SEE NOTE 29. For information about finance lease obligations / SEE NOTE 28.
Other provisions consist of the following:
Other provisions
(€ in millions) Jan. 1, 2014
Currency translation differences
Usage Reversals Additions Transfers Dec. 31, 2014
Thereof non-current
Marketing 57 1 (54) (3) 75 – 79 –
Personnel 57 2 (38) (10) 35 2 48 8
Returns, allowances and warranty 167 9 (95) (13) 138 (8) 200 –
Taxes, other than income taxes 19 1 (3) – 13 – 27 –
Sundry 175 1 (37) (43) 58 – 154 30
Other provisions 475 15 (227) (69) 319 (6) 508 38
Marketing provisions mainly consist of provisions for promotion contracts.Provisions for personnel mainly consist of provisions for short- and long-term variable compensation
components as well as of provisions for social plans relating to restructuring measures. With regard to provisions for early retirement, claims for reimbursement in an amount of € 0 million (2013: € 0 million) are shown under other non-current assets.
Provisions for returns, allowances and warranty primarily arise due to bonus agreements with customers and the obligation of fulfilling customer claims with regard to the return of products sold by the Group. The amount of the provision follows the historical development of returns, allowances and warranty as well as current agreements.
Provisions for taxes other than income taxes mainly relate to value added tax, real estate tax and motor vehicle tax.
Sundry provisions mainly include provisions for customs risks as well as anticipated losses from purchases and other transactions, and provisions for litigation and other legal risks.
The reversal of sundry provisions in 2014 is mainly related to the completion of customs audits and a risk reassessment.
Management follows past experience from similar transactions when assessing the recognition and the measurement of other provisions; in particular, external legal opinions are considered for provisions for customs risks and for litigation and other legal risks. All evidence from events until the preparation of the consolidated financial statements is taken into account.
The transfers include reclassifications to ‘Liabilities classified as held for sale’.
19 Other current financial liabilities
20 Other provisions

adidas Group / 2014 Annual Report
Consolidated Financial Statements
2162 0 1 4
/ 04.8 /
Notes / Notes to the Consolidated Statement of Financial Position
Accrued liabilities consist of the following:
Accrued liabilities
(€ in millions) Jan. 1, 2014
Currency translation differences
Usage Reversals Additions Transfers Dec. 31, 2014
Thereof non-current
Goods and services not yet invoiced 460 18 (331) (12) 367 (7) 494 9
Marketing and sales 350 26 (315) (3) 380 4 442 2
Personnel 353 19 (200) (29) 208 1 352 68
Sundry 48 2 (41) – 32 – 42 2
Accrued liabilities 1,211 65 (887) (44) 987 (2) 1,330 81
Marketing accrued liabilities mainly consist of accruals for distribution, such as discounts, rebates and sales commissions.
Accrued liabilities for personnel mainly consist of accruals for outstanding salary payments, such as bonuses and overtime, as well as outstanding vacation.
Sundry accrued liabilities mainly include accruals for promotion contracts as well as accruals for interest.The transfers include reclassifications to ‘Liabilities classified as held for sale’.
Other current liabilities consist of the following:
Other current liabilities
(€ in millions) Dec. 31, 2014 Dec. 31, 2013
Tax liabilities other than income taxes 105 81
Liabilities due to personnel 48 43
Liabilities due to social security 20 21
Deferred income 30 30
Customers with credit balances 42 50
Sundry 42 51
Other current liabilities 287 276
Other non-current financial liabilities consist of the following:
Other non-current financial liabilities
(€ in millions) Dec. 31, 2014 Dec. 31, 2013
Currency options 2 11
Forward exchange contracts – 2
Finance lease obligations 7 9
Sundry 0 0
Other non-current financial liabilities 9 22
For further information about currency options and forward exchange contracts / SEE NOTE 29. For information about finance lease obligations / SEE NOTE 28.
21 Accrued liabilities
22 Other current liabilities
23 Other non-current financial liabilities

adidas Group / 2014 Annual Report
Consolidated Financial Statements
2172 0 1 4
/ 04.8 /
Notes / Notes to the Consolidated Statement of Financial Position
The Group has recognised post-employment benefit obligations arising from defined benefit plans. The benefits are provided pursuant to the legal, fiscal and economic conditions in each respective country and mainly depend on the employees’ years of service and remuneration.
Pensions and similar obligations
(€ in millions) Dec. 31, 2014 Dec. 31, 2013
Liability arising from defined benefit pension plans 271 243
Similar obligations 14 12
Pensions and similar obligations 284 255
Defined contribution pension plans The total expense for defined contribution plans amounted to € 46 million in 2014 (2013: € 47 million).
Defined benefit pension plans Given the diverse Group structure, different defined benefit pension plans exist, comprising a variety of post-employment benefit arrangements. The Group’s major defined benefit pension plans relate to adidas AG and its subsidiaries in the UK and Japan. The defined benefit pension plans generally provide payments in case of death, disability or retirement to former employees and their survivors. The obligations arising from defined benefit pension plans are partly covered by plan assets.
In Germany, adidas AG grants its employees contribution-based and final salary defined benefit pension schemes, which provide employees with entitlements in the event of retirement, disability and death. In general, German pension plans operate under the legal framework of the German Company Pensions Act (‘Betriebsrentengesetz’) and under the German Labour Act. A large proportion of the pension plans are closed to new entrants. New employees are entitled to benefits in accordance with the adidas Pension Plan or the adidas Management Pension Plan. The adidas pension plan is a matching contribution plan; the contributions to this pension plan are partly paid by the employee and partly paid by the employer. The contributions are transferred into benefit building blocks. The benefits are paid out in the form of a pension, a lump sum or instalments. The pension plans in Germany are financed using book reserves, a contractual trust arrangement (CTA), a pension fund (‘Pensionsfonds’) or a provident fund (‘Unterstützungskasse’). The benefits granted to some members of the Executive Board are funded via a pension fund (‘Pensionsfonds’) or a provident fund (‘Unterstützungskasse’). An insurance company is responsible for the determination and the implementation of the investment strategy. Further details about the pension entitlements of members of the Executive Board of adidas AG are contained in the Compensation Report / SEE COMPENSATION REPORT, P. 28.
The final salary defined benefit pension scheme in the UK is closed to new entrants and to future accrual. The benefits are mainly paid out in the form of pensions. The scheme operates under UK trust law as well as under the jurisdiction of the UK Pensions Regulator and therefore is subject to a minimum funding requirement. The Trustee Board is responsible for setting the scheme’s funding objective, agreeing the contributions with the company and determining the investment strategy of the scheme.
In Japan, employees are entitled to benefits from a defined benefit plan that is not funded by plan assets. The benefits in case of retirement are dependent on final salary and service, and are paid out as a lump sum. The pension plan is subject to Japanese labour law. In the first six months of 2015, it is planned to transfer the liabilities from the defined benefit plan to a defined contribution plan.
24 Pensions and similar obligations

adidas Group / 2014 Annual Report
Consolidated Financial Statements
2182 0 1 4
/ 04.8 /
Notes / Notes to the Consolidated Statement of Financial Position
Breakdown of the present value of the obligation arising from defined benefit pension plans in the major countries
(€ in millions) Dec. 31, 2014 Dec. 31, 2013
Germany UK Japan Germany UK Japan
Active members 178 – 15 123 – 14
Former employees with vested rights 49 50 – 31 37 –
Pensioners 78 4 – 70 4 –
Total 305 54 15 224 41 14
The Group’s pension plans are subject to risks from changes in actuarial assumptions, such as the discount rate, salary and pension increase rates, and risks from changes in longevity. A lower discount rate results in a higher defined benefit obligation and/or in higher contributions to the pension funds. Lower than expected performance of the plan assets could lead to an increase in required contributions or to a decline of the funded status.
The following tables analyse the defined benefit plans, plan assets, present values of the defined benefit pension plans, expenses recognised in the consolidated income statement, actuarial assumptions and other information.
Amounts for defined benefit pension plans recognised in the consolidated statement of financial position
(€ in millions) Dec. 31, 2014 Dec. 31, 2013
Present value of funded obligation from defined benefit pension plans 391 95
Fair value of plan assets (157) (83)
Funded status 234 12
Present value of unfunded obligation from defined benefit pension plans 37 230
Asset ceiling effect 0 1
Net defined benefit liability 271 243
Thereof: liability 271 243
Thereof: adidas AG 212 199
Thereof: asset (0) (0)
Thereof: adidas AG – –
The determination of assets and liabilities for defined benefit plans is based upon statistical and actuarial valuations. In particular, the present value of the defined benefit obligation is driven by financial variables (such as the discount rates or future increases in salaries) and demographic variables (such as mortality and employee turnover). The actuarial assumptions may differ significantly from the actual circumstances and could lead to different cash flows.
Weighted average actuarial assumptions
(in %) Dec. 31, 2014 Dec. 31, 2013
Discount rate 2.4 3.7
Expected rate of salary increases 3.2 3.2
Expected pension increases 1.7 2.2
The weighted average actuarial assumptions as at the balance sheet date are used to determine the defined benefit liability at that date and the pension expense for the upcoming financial year.
The actuarial assumptions for withdrawal and mortality rates are based on statistical information available in the various countries. In Germany, the Heubeck 2005 G mortality tables are used. In the UK, assumptions are based on the S1NA base table with modified improvement of the life expectancy mortality tables. In Japan, the ‘21st Life Tables revised in 2010’ mortality tables are used. The rate of the expected pension increases in Germany was reduced to 1.5% for the financial year 2014 (2013: 2.0%).

adidas Group / 2014 Annual Report
Consolidated Financial Statements
2192 0 1 4
/ 04.8 /
Notes / Notes to the Consolidated Statement of Financial Position
As in the previous year, the calculation of the pension liabilities in Germany is based on a discount rate determined using the ‘Mercer Yield Curve (MYC)’ approach.
Remeasurements, such as gains or losses arising from changes in the actuarial assumptions for defined benefit pension plans during the financial year or a return on the plan assets exceeding the interest income, are immediately recognised outside the income statement as a change in other reserves in the consolidated statement of comprehensive income.
Pension expenses for defined benefit pension plans
(€ in millions) Year ending Dec. 31, 2014
Year ending Dec. 31, 2013
Current service cost 16 16
Net interest 8 8
Thereof: interest cost 12 11
Thereof: interest income (4) (3)
Past service cost 1 0
Expenses for defined benefit pension plans (recognised in the consolidated income statement) 25 24
Actuarial losses/(gains) 79 (3)
Thereof: due to changes in financial assumptions 79 (7)
Thereof: due to changes in demographic assumptions 0 1
Thereof: due to experience adjustments 0 3
Return on plan assets (not included in net interest income) (1) (3)
Asset ceiling effect (1) 0
Remeasurements for defined benefit pension plans (recognised as decrease/(increase) in other reserves in the consolidated statement of comprehensive income) 77 (6)
Total 102 18
Of the total pension expenses recorded in the consolidated income statement, an amount of € 17 million (2013: € 16 million) relates to employees of adidas AG, € 0.2 million (2013: € 0.2 million) relates to employees in the UK and € 2 million (2013: € 2 million) relates to employees in Japan. The amendment of pension arrangements for members of the Executive Board of adidas AG in 2014 resulted in past service cost of € 1 million. The pension expense is mainly recorded within other operating expenses. The production-related part of the pension expenses is recognised within cost of sales.
Present value of the defined benefit obligation
(€ in millions) 2014 2013
Present value of the obligation from defined benefit pension plans as at January 1 325 317
Currency translation differences 7 (6)
Current service cost 16 16
Interest cost 12 11
Contribution by plan participants 0 0
Pensions paid (13) (10)
Actuarial losses/(gains) 79 (3)
Thereof: due to changes in financial assumptions 79 (7)
Thereof: due to changes in demographic assumptions 0 1
Thereof: due to experience adjustments 0 3
Past service cost 1 0
Plan settlements 0 0
Present value of the obligation from defined benefit pension plans as at December 31 427 325

adidas Group / 2014 Annual Report
Consolidated Financial Statements
2202 0 1 4
/ 04.8 /
Notes / Notes to the Consolidated Statement of Financial Position
In the following table, the effects of reasonably conceivable changes in the actuarial assumptions on the present value of the obligation from defined benefit pension plans are analysed. In addition, for Germany, UK and Japan the average duration of the obligation is shown.
Sensitivity analysis of the obligation from defined benefit pension plans
(€ in millions) Dec. 31, 2014 Dec. 31, 2013
Germany UK Japan Germany UK Japan
Present value of the obligation from defined benefit pension plans 305 54 15 224 41 14
Increase in the discount rate by 0.5% 279 47 14 207 35 13
Reduction in the discount rate by 0.5% 335 63 16 243 47 15
Average duration of the obligations (in years) 18 30 12 16 30 12
Since many pension plans are closed to future accrual or are not dependent on the salary, the salary trend plays a minor role in determining pension obligations. Due to the fact that about half of the benefits of the German pension plans are paid as lump sums or instalment payments, the pension increase rate and the mortality assumption have significantly less impact than the discount rate when calculating the pension obligations. In Germany, the pension increase rate was reduced to 1.5% as at December 31, 2014 (2013: 2%). This resulted in a decrease in the present value of the pension obligations by € 10 million as at December 31, 2014.
Fair value of plan assets
(€ in millions) 2014 2013
Fair value of plan assets at January 1 83 76
Currency translation differences 4 (2)
Pensions paid (5) (2)
Contributions by the employer 68 5
Contributions paid by plan participants 0 0
Interest income from plan assets 4 3
Return on plan assets (not included in net interest income) 1 3
Plan settlements 0 0
Fair value of plan assets at December 31 157 83
Approximately 90% (2013: 83%) of the total plan assets are allocated to plan assets in the UK (2014: 26%, 2013: 44%), Germany (2014: 59%, 2013: 30%) and Switzerland (2014: 4%, 2013: 9%).
The adidas Group has set up a Contractual Trust Arrangement (CTA) in Germany for the purpose of funding the pension obligations of adidas AG and insolvency insurance with regard to part of the pension obligations of adidas AG. The trustee is the registered association ‘adidas Pension Trust e.V.’, which was established in December 2013. The investment committee of the adidas Pension Trust determines the investment strategy with the goal to match the pension liabilities as far as possible and to generate a sustainable return. In August 2014, an amount of € 65 million in cash was transferred to the trustee. The cash has been invested in equity index funds, hybrid bonds, fixed interest rate bonds and money market funds. adidas AG does not intend to further fund the CTA in the 2015 financial year. Another part of the plan assets in Germany is invested in insurance contracts via pension funds or provident funds.
In the UK, the plan assets are held under trust within the pension fund. The plan assets in Switzerland are held by a pension foundation. The investment strategy is aligned with the structure of the pension obligations in these countries. In the rest of the world, the plan assets consist predominantly of insurance contracts.

adidas Group / 2014 Annual Report
Consolidated Financial Statements
2212 0 1 4
/ 04.8 /
Notes / Notes to the Consolidated Statement of Financial Position
The expected payments for the 2015 financial year amount to € 12 million. Thereof, € 7 million relates to benefits directly paid to pensioners by the Group companies and € 4 million to employer contributions paid into the plan assets. In 2014, the actual return on plan assets was € 6 million (2013: € 6 million).
Composition of plan assets
(€ in millions) Dec. 31, 2014 Dec. 31, 2013
Cash and cash equivalents 31 14
Equity instruments 51 28
Bonds 41 11
Real estate 1 1
Pension plan reinsurance 27 25
Insurance policies 5 4
Other assets 0 0
Fair value of plan assets 157 83
All equities and bonds are traded freely and have a quoted market price in an active market. The other assets consist predominantly of foreign insurance products.
At each balance sheet date, the company analyses the over- or underfunding and, where appropriate, adjusts the composition of plan assets.
Other non-current liabilities consist of the following:
Other non-current liabilities
(€ in millions) Dec. 31, 2014 Dec. 31, 2013
Liabilities due to personnel 5 7
Deferred income 29 22
Sundry 1 0
Other non-current liabilities 35 29
The nominal capital of adidas AG (‘the company’) has remained unchanged since December 31, 2013. As at the balance sheet date, and in the period beyond, up to and including February 13, 2015, it amounted to € 209,216,186 divided into 209,216,186 registered no-par-value shares (‘registered shares’) and is fully paid in.
Each share grants one vote and is entitled to dividends starting from the beginning of the year it was issued. Treasury shares held directly or indirectly are not entitled to dividend payment in accordance with § 71b German Stock Corporation Act (Aktiengesetz – AktG). At the balance sheet date, and in the period beyond, up to and including February 13, 2015, the company holds 4,889,142 treasury shares, corresponding to a notional amount of € 4,889,142 in the nominal capital and consequently 2.34% of the nominal capital.
Authorised Capital The Executive Board of adidas AG did not utilise the existing amounts of authorised capital of up to € 95 million in the 2014 financial year or in the period beyond the balance sheet date up to and including February 13, 2015.
The authorised capital of the company, which is set out in § 4 sections 2, 3 and 4 of the Articles of Association as at the balance sheet date, entitles the Executive Board, subject to Supervisory Board approval, to increase the nominal capital until June 30, 2018/ by issuing new shares against contributions in cash once or several times by no more than € 50 million and, subject to Supervisory Board approval, to exclude residual amounts from shareholders’ subscription rights (Authorised Capital 2013/I);until June 30, 2016/ by issuing new shares against contributions in kind once or several times by no more than € 25 million and, subject to Supervisory Board approval, to exclude shareholders’ subscription rights (Authorised Capital 2013/II);
25 Other non-current liabilities
26 Shareholders’ equity

adidas Group / 2014 Annual Report
Consolidated Financial Statements
2222 0 1 4
/ 04.8 /
Notes / Notes to the Consolidated Statement of Financial Position
until June 30, 2018/ by issuing new shares against contributions in cash once or several times by no more than € 20 million and, subject to Supervisory Board approval, to exclude residual amounts from shareholders’ subscription rights and to exclude shareholders’ subscription rights when issuing the new shares at a value not essentially below the stock market price of shares with the same features; this exclusion of subscription rights can also be associated with the listing of the company’s shares on a foreign stock exchange (Authorised Capital 2013/III). The authorisation to exclude subscription rights pursuant to the previous sentence may, however, only be used to the extent that the pro rata amount of the new shares in the nominal capital together with the pro rata amount in the nominal capital of other shares which have been issued by the company since May 8, 2013, subject to the exclusion of subscription rights pursuant to or in accordance with § 186 section 3 sentence 4 AktG on the basis of an authorised capital or following a repurchase, or for which conversion or subscription rights or conversion or subscription obligations were granted after May 8, 2013, through the issuance of convertible bonds and/or bonds with warrants, with subscription rights excluded in accordance with § 186 section 3 sentence 4 AktG, does not exceed 10% of the nominal capital existing on the date of the entry of this authorisation into the commercial register or – if this amount is lower – as of the respective date on which the authorisation is used.
Contingent Capital The following description of the Contingent Capital is based on § 4 sections 5 and 6 of the Articles of Association of the company as well as on the underlying resolutions of the Annual General Meeting held on May 6, 2010 and May 8, 2014. Additional contingent capital does not exist.
Contingent Capital 2010At the balance sheet date, the nominal capital is conditionally increased by up to € 36 million divided into not more than 36,000,000 registered shares (Contingent Capital 2010). The contingent capital increase will be implemented only to the extent that holders or creditors of option or conversion rights or the persons obligated to exercise option or conversion duties on bonds issued by the company or a subordinated Group company, pursuant to the authorisation of the Executive Board granted by the resolution adopted by the Annual General Meeting of May 6, 2010, up to May 5, 2015 and guaranteed by the company, exercise their option or conversion rights or, if they are obliged to exercise the option or conversion duties, meet their obligations to exercise the warrant or convert the bond, or to the extent that the company exercises its rights to choose to deliver shares in the company for the total amount or partially instead of a payment and insofar as no cash settlement, treasury shares or shares of another public listed company are used to serve these rights. The new shares shall be issued at the respective option or conversion price to be established in accordance with the aforementioned authorisation resolution. The new shares shall carry dividend rights from the commencement of the financial year in which the shares are issued. The Executive Board is authorised, subject to Supervisory Board approval, to stipulate any additional details concerning the implementation of the contingent capital increase.
The Executive Board of adidas AG did not issue shares from the Contingent Capital 2010 in the 2014 financial year or in the period beyond the balance sheet date up to and including February 13, 2015.
Contingent Capital 2014At the balance sheet date, the nominal capital is conditionally increased by up to € 12.5 million divided into not more than 12,500,000 registered shares (Contingent Capital 2014). The contingent capital increase will be implemented only to the extent that holders or creditors of option or conversion rights or the persons obligated to exercise option or conversion duties based on bonds issued by the company or a subordinated Group company, pursuant to the authorisation of the Executive Board granted by the resolution adopted by the Annual General Meeting on May 8, 2014 (Agenda Item 7), up to May 7, 2019 and guaranteed by the company, exercise their option or conversion rights or, if they are obliged to exercise the option or conversion duties, meet their obligations to exercise the warrant or convert the bond, or to the extent that the company exercises its rights to choose to deliver shares in the company for the total amount or a part amount instead of payment of the amount due and insofar as no cash settlement, treasury shares or shares of another public listed company are used to serve these rights. The new shares will be issued at the respective option or conversion price to be established in accordance with the aforementioned authorisation resolution. The new shares will carry dividend rights from the commencement of the financial year in which the shares are issued. The Executive Board is authorised, subject to Supervisory Board approval, to stipulate any additional details concerning the implementation of the contingent capital increase.
The Executive Board of adidas AG did not issue shares from the Contingent Capital 2014 in the 2014 financial year or in the period beyond the balance sheet date up to and including February 13, 2015.

adidas Group / 2014 Annual Report
Consolidated Financial Statements
2232 0 1 4
/ 04.8 /
Notes / Notes to the Consolidated Statement of Financial Position
Convertible Bond On March 14, 2012, the Executive Board, with the approval of the Supervisory Board, made partial use of the authorisation of the Annual General Meeting from May 6, 2010, and on March 21, 2012 issued a convertible bond due on June 14, 2019 in a nominal value of € 500 million via an offer to institutional investors outside the USA excluding shareholders’ subscription rights. In principle, the conversion rights are exercisable between May 21, 2012 and June 5, 2019, subject to lapsed conversion rights as set out under § 6 section 3 or to the excluded periods as defined by § 6 section 4 of the bond terms and conditions, and (subject to an adjustment to the conversion rights resulting from the dilution adjustment regulations set out under § 10 or a change of control in accordance with § 13 of the bond terms and conditions) are convertible into 6,056,447 shares of the company. The conversion price currently amounts to € 82.56 per share. The convertible bond bears an interest rate of 0.25% per annum. Bondholders are entitled to demand early redemption of the bonds as of June 14, 2017. As of July 14, 2017, adidas AG may conduct an early redemption of the bond, if, on 20 of 30 consecutive trading days, the share price of adidas AG exceeds the current conversion price of € 82.56 by at least 30%. The bonds are listed on the Open Market segment of the Frankfurt Stock Exchange.
Repurchase of adidas AG sharesThe authorisation of the Executive Board to repurchase treasury shares, which was granted by the Annual General Meeting on May 6, 2010 and which was not utilised, was cancelled by the Annual General Meeting on May 8, 2014. At the same time, the Annual General Meeting granted the Executive Board a new authorisation to repurchase treasury shares up to an amount totalling 10% of the nominal capital until May 7, 2019. The authorisation may be used by the company but also by its subordinated Group companies or by third parties on account of the company or its subordinated Group companies or third parties assigned by the company or one of its subordinated Group companies.
Based on the authorisation to repurchase treasury shares granted by the Annual General Meeting on May 8, 2014, the adidas AG Executive Board commenced a share buyback programme on November 7, 2014. The repurchased shares may either be cancelled (capital reduction) or else be used to meet obligations arising from the potential conversion of the company’s € 500 million convertible bond due on June 14, 2019.
In November 2014, 1,881,836 shares were repurchased at an average price of € 62.89, corresponding to a notional amount of € 1,881,836 in the nominal capital and consequently 0.90% of the nominal capital. In December 2014, 3,007,306 shares were repurchased at an average price of € 60.41, corresponding to a notional amount of € 3,007,306 in the nominal capital and consequently 1.44% of the nominal capital. Under the granted authorisation, adidas AG repurchased a total of 4,889,142 shares for a total price of € 299,999,987 (excluding incidental purchasing costs), i.e. for an average price of € 61.36 per share, in a first tranche between November 7, 2014 and December 12, 2014 inclusive. On December 12, 2014, the first tranche of the share buyback programme was concluded. The company reserves the right to continue with or to resume the share buyback programme in the future in alignment with the published parameters. For details / SEE DISCLOSURES PURSUANT TO § 315 SECTION 4 AND
§ 289 SECTION 4 OF THE GERMAN COMMERCIAL CODE, P. 131.
Changes in the percentage of voting rightsPursuant to § 160 section 1 no. 8 AktG, existing shareholdings which have been notified to the company in accordance with § 21 section 1 or section 1a of the German Securities Trading Act (Wertpapierhandelsgesetz – WpHG) need to be disclosed.
The following table reflects shareholdings reportable as at February 13, 2015 which have been notified to the company. The respective details are taken from the most recent voting rights notification received by the company. All voting rights notifications disclosed by the company in the year under review and up to and including February 13, 2015 are available on the adidas Group website / WWW.ADIDAS-GROUP.COM/S/VOTING-RIGHTS-NOTIFICATIONS. The details on the percentage of shareholdings and voting rights may no longer be up to date.

adidas Group / 2014 Annual Report
Consolidated Financial Statements
2242 0 1 4
/ 04.8 /
Notes / Notes to the Consolidated Statement of Financial Position
Notifying party Date of reaching, exceeding or falling below
Reporting threshold Attributions in accordance with WpHG
Shareholdings in %
Number of voting rights
BlackRock Financial Management, Inc., New York, NY, USA 1)
January 28, 2015 Exceeding 3% § 22 sec. 1 sent. 1 no. 1, § 22 sec. 1 sent. 1 no. 2 in conjunction with § 22 sec. 1 sent. 2, § 22 sec. 1 sent. 1 no. 6, § 22 sec. 1 sent. 1 no. 6 in conjunction with § 22 sec. 1 sent. 2
3.21 6,709,315
O. Mason Hawkins, USA 2) January 22, 2015 Exceeding 3% § 22 sec. 1 sent. 1 no. 6 in conjunction with § 22 sec. 1 sent. 2
3.06 6,398,123
Southeastern Asset Management, Inc., Memphis, TN, USA 2)
January 22, 2015 Exceeding 3% § 22 sec. 1 sent. 1 no. 6 3.06 6,398,123
The Capital Group Companies, Inc., Los Angeles, CA, USA 3)
December 2, 2014 Falling below 3% § 22 sec. 1 sent. 1 no. 6 in conjunction with § 22 sec. 1 sent. 2 and 3
2.88 6,018,378
Capital Research and Management Company, Los Angeles, CA, USA 3)
December 2, 2014 Falling below 3% § 22 sec. 1 sent. 1 no. 6 2.88 6,018,378
BlackRock, Inc., New York, NY, USA 4) November 20, 2014 Falling below 5% §§ 21, 22, 25, 25a 5) 4.99 10,432,583
BlackRock Holdco 2, Inc., Wilmington, DE, USA 6)
November 13, 2014 Falling below 5% §§ 21, 22, 25, 25a 7) 4.99 10,431,246
BlackRock Advisors Holdings, Inc., New York, NY, USA 8)
September 25, 2014 Falling below 3% § 22 sec. 1 sent. 1 no. 1, § 22 sec. 1 sent. 1 no. 2 in conjunction with § 22 sec. 1 sent. 2, § 22 sec. 1 sent. 1 no. 6 in conjunction with § 22 sec. 1 sent. 2, § 22 sec. 1 sent. 1 no. 1 and § 22 sec. 1 sent. 1 no. 6 in conjunction with § 22 sec. 1 sent. 2
2.61 5,465,659
BlackRock International Holdings, Inc., New York, NY, USA 8)
September 25, 2014 Falling below 3% § 22 sec. 1 sent. 1 no. 1, § 22 sec. 1 sent. 1 no. 2 in conjunction with § 22 sec. 1 sent. 2, § 22 sec. 1 sent. 1 no. 6 in conjunction with § 22 sec. 1 sent. 2, § 22 sec. 1 sent. 1 no. 1 and § 22 sec. 1 sent. 1 no. 6 in conjunction with § 22 sec. 1 sent. 2
2.61 5,465,659
BR Jersey International Holdings, L.P., St. Helier, Jersey, Channel Islands 8)
September 25, 2014 Falling below 3% § 22 sec. 1 sent. 1 no. 1, § 22 sec. 1 sent. 1 no. 2 in conjunction with § 22 sec. 1 sent. 2, § 22 sec. 1 sent. 1 no. 6 in conjunction with § 22 sec. 1 sent. 2, § 22 sec. 1 sent. 1 no. 1 and § 22 sec. 1 sent. 1 no. 6 in conjunction with § 22 sec. 1 sent. 2
2.61 5,465,659
BlackRock Group Limited, London, Great Britain 8)
September 25, 2014 Falling below 3% § 22 sec. 1 sent. 1 no. 1, § 22 sec. 1 sent. 1 no. 6 in conjunction with § 22 sec. 1 sent. 2, § 22 sec. 1 sent. 1 no. 1 and § 22 sec. 1 sent. 1 no. 6 in conjunction with § 22 sec. 1 sent. 2
2.46 5,138,626
Garrett Thornburg, USA 9) August 4, 2014 Falling below 3% § 22 sec. 1 sent. 1 no. 6 in conjunction with § 22 sec. 1 sent. 2
2.73 5,714,818
Thornburg Investment Management, Inc., Santa Fe, NM, USA 9)
August 4, 2014 Falling below 3% § 22 sec. 1 sent. 1 no. 6 2.73 5,714,818
1) See the company’s disclosure dated February 3, 2015.2) See the company’s disclosure dated January 26, 2015.3) See the company’s disclosure dated December 8, 2014.4) See the company’s disclosure dated November 26, 2014.5) Notification in accordance with § 25a sec. 1 WpHG: 0.01% (19,904) in accordance with § 25a WpHG (thereof 0.01% = 19,904 held indirectly); 0.22% (457,602) in accordance with § 25 WpHG
(thereof 0.22% = 457,602 held indirectly); 4.76% (9,955,077) in accordance with §§ 21, 22 WpHG.6) See the company’s disclosure dated November 20, 2014.7) Notification in accordance with § 25a sec. 1 WpHG: 0.01% (22,561) in accordance with § 25a WpHG (thereof 0.01% = 22,561 held indirectly); 0.17% (356,251) in accordance with § 25 WpHG
(thereof 0.17% = 356,251 held indirectly); 4.80% (10,052,434) in accordance with §§ 21, 22 WpHG.8) See the company’s disclosure dated September 30, 2014 and correction dated October 6, 2014.9) See the company’s disclosure dated August 14, 2014.
Capital management The Group’s policy is to maintain a strong capital base so as to uphold investor, creditor and market confidence and to sustain future development of the business.
The Group seeks to maintain a balance between a higher return on equity that might be possible with higher levels of borrowings and the advantages and security afforded by a sound capital position. The Group further aims to maintain net debt below two times EBITDA over the long term.
Notified reportable shareholdings as at February 13, 2015

adidas Group / 2014 Annual Report
Consolidated Financial Statements
2252 0 1 4
/ 04.8 /
Notes / Notes to the Consolidated Statement of Financial Position
Financial leverage is defined as the ratio between net borrowings (short- and long-term borrowings less cash and cash equivalents as well as short-term financial assets) in an amount of € 185 million (2013: negative € 295 million) and shareholders’ equity in an amount of € 5.624 billion (2013: € 5.489 billion). EBITDA (continuing operations) amounted to € 1.283 billion for the financial year ending December 31, 2014 (2013: € 1.496 billion). The ratio between net borrowings and EBITDA (continuing operations) amounted to 0.1 for the financial year ending December 31, 2014 (2013: negative 0.2).
Reserves Reserves within shareholders’ equity are as follows:/ Capital reserve: primarily comprises the paid premium for the issuance of share capital as well as the equity component of issued convertible bonds./ Cumulative currency translation differences: comprise all foreign currency differences arising from the translation of the financial statements of foreign operations./ Hedging reserve: comprises the effective portion of the cumulative net change in the fair value of cash flow hedges related to hedged transactions that have not yet occurred as well as of hedges of net investments in foreign subsidiaries./ Other reserves: comprise the remeasurements of defined benefit plans [consisting of the cumulative net change of actuarial gains or losses relating to the defined benefit obligations, the return on plan assets (excluding interest income) and the asset ceiling effect] as well as expenses recognised for share option plans and effects from the acquisition of non-controlling interests./ Retained earnings: comprise the accumulated profits less dividends paid as well as considerations paid for the repurchase of treasury shares exceeding the nominal value.
Distributable profits and dividends Distributable profits to shareholders are determined by reference to the retained earnings of adidas AG and calculated under German Commercial Law.
Based on the resolution of the 2014 Annual General Meeting, the dividend for 2013 was € 1.50 per share (total amount: € 314 million). The Executive Board of adidas AG will propose to shareholders a dividend payment of € 1.50 per dividend-entitled share for the year 2014 to be made from retained earnings of € 307 million reported in the financial statements of adidas AG according to the German Commercial Code as at December 31, 2014. The subsequent remaining amount will be carried forward.
As at December 31, 2014, 204,327,044 dividend-entitled shares exist, resulting in a dividend payment of € 306 million.
This line item within equity comprises the non-controlling interests in several subsidiaries which are not directly or indirectly attributable to adidas AG.
Non-controlling interests are assigned to six subsidiaries as at December 31, 2014 and 2013, respectively / SEE
ATTACHMENT II TO THE CONSOLIDATED FINANCIAL STATEMENTS (SEE SHAREHOLDINGS OF ADIDAS AG, HERZOGENAURACH, P. 248). These subsidiaries were partly acquired in connection with the acquisition of Reebok and partly through purchases or foundations in the last years.
With respect to the consolidated financial statements of adidas AG, on a single basis, no subsidiary has a material non-controlling interest.
For the following subsidiaries with non-controlling interests the main financial information is presented combined.
Subsidiaries with material non-controlling interests
Legal entity name Principle place of business Ownership interests held by non- controlling interests (in %)
Dec. 31, 2014 Dec. 31, 2013
adidas Levant Limited Levant 45% 45%
adidas Levant Limited – Jordan Jordan 45% 45%
Life Sport Ltd. Israel 49% 49%
Reebok India Company India 6.85% 6.85%
27 Non-controlling interests

adidas Group / 2014 Annual Report
Consolidated Financial Statements
2262 0 1 4
/ 04.8 /
Notes / Notes to the Consolidated Statement of Financial Position
The following table presents the main financial information on subsidiaries with non-controlling interests.
Financial information on subsidiaries with non-controlling interests
(€ in millions) Material non-controlling interests
Other Total non-controlling interests
Dec. 31, 2014 Dec. 31, 2013 Dec. 31, 2014 Dec. 31, 2013 Dec. 31, 2014 Dec. 31, 2013
Net sales (non-Group) 133 124
Net income/loss 14 (5)
Net income/loss attributable to non-controlling interests 6 3 (0) (0) 6 3
Other comprehensive income (29) 42
Total comprehensive income (15) 37
Total comprehensive income attrib-utable to non-controlling interests 5 6 (0) (0) 5 6
Current assets 86 64
Non-current assets 15 14
Current liabilities 121 98
Non-current liabilities 1 1
Net assets (20) (22)
Net assets attributable to non-controlling interests (7) (8) (0) (0) (7) (8)
Net cash used in operating activities (6) (23)
Net cash used in investing activities (3) (5)
Net cash generated from financing activities 10 27
Net increase of cash and cash equivalents 0 (1)
Dividends paid to non-controlling interests during the year 1) 4 1
1) Included in net cash generated from financing activities.
Operating leases The Group leases primarily retail stores as well as offices, warehouses and equipment. The contracts regarding these leases with expiration dates of between 1 and 11 years partly include renewal options and escalation clauses. Rent expenses (continuing operations), which partly depend on net sales, amounted to € 643 million and € 672 million for the years ending December 31, 2014 and 2013, respectively.
Future minimum lease payments for minimum lease durations on a nominal basis are as follows:
Minimum lease payments for operating leases
(€ in millions) Dec. 31, 2014 Dec. 31, 2013
Within 1 year 476 447
Between 1 and 5 years 959 945
After 5 years 277 277
Total 1,711 1,669
28 Leasing and service arrangements

adidas Group / 2014 Annual Report
Consolidated Financial Statements
2272 0 1 4
/ 04.8 /
Notes / Notes to the Consolidated Statement of Financial Position
Finance leases The Group also leases various premises for administration and warehousing which are classified as finance leases.
The net carrying amount of these assets of € 10 million and € 13 million was included in property, plant and equipment as at December 31, 2014 and 2013, respectively. For the year ending December 31, 2014, interest expenses (continuing operations) were € 0 million (2013: € 0 million) and depreciation expenses (continuing operations) were € 4 million (2013: € 5 million).
Minimum lease payments for finance leases in 2014 include land leases with a remaining lease term of 98 years. The minimum lease payments under these contracts amount to € 11 million. The estimated amount representing interest is € 9 million and the present value amounts to € 2 million.
The net present values and the minimum lease payments under these contracts over their remaining terms up to 2017 and the land leases with a remaining lease term of 98 years are as follows:
Minimum lease payments for finance leases
(€ in millions) Dec. 31, 2014 Dec. 31, 2013
Lease payments falling due:
Within 1 year 3 4
Between 1 and 5 years 5 7
After 5 years 11 12
Total minimum lease payments 19 23
Less: estimated amount representing interest 9 10
Present value of minimum lease payments 10 13
Thereof falling due:
Within 1 year 3 4
Between 1 and 5 years 4 7
After 5 years 3 2
Service arrangements The Group has outsourced certain logistics and information technology functions, for which it has entered into long-term contracts. Financial commitments under these contracts mature as follows:
Financial commitments for service arrangements
(€ in millions) Dec. 31, 2014 Dec. 31, 2013
Within 1 year 75 89
Between 1 and 5 years 101 99
After 5 years 18 28
Total 193 216

adidas Group / 2014 Annual Report
Consolidated Financial Statements
2282 0 1 4
/ 04.8 /
Notes / Notes to the Consolidated Statement of Financial Position
Carrying amounts of financial instruments as at December 31, 2014, according to categories of IAS 39 and their fair values
(€ in millions) Categoryaccording to
IAS 39
Carryingamount
Dec. 31, 2014
Measurement according to IAS 39 Measurement according to
IAS 17
Fair valueDec. 31, 2014
Amortisedcost
Fair valuerecognised
in equity
Fair valuerecognised
in net income
Financial assets
Cash and cash equivalents n.a. 1,683 1,683 1,683
Short-term financial assets FAHfT 5 5 5
Accounts receivable LaR 1,946 1,946 1,946
Other current financial assets
Derivatives being part of a hedge n.a. 224 224 224
Derivatives not being part of a hedge FAHfT 46 46 46
Other financial assets LaR 128 128 128
Long-term financial assets
Other equity investments FAHfT 80 80 80
Available-for-sale financial assets AfS 49 16 33 49
Loans LaR 0 0 0
Other non-current financial assets
Derivatives being part of a hedge n.a. 5 5 5
Derivatives not being part of a hedge FAHfT 10 10 10
Other financial assets LaR 27 27 27
Assets classified as held for sale LaR 51 51 51
Financial liabilities
Short-term borrowings
Bank borrowings FLAC 194 194 194
Private placements FLAC 95 95 100
Eurobond FLAC – – –
Convertible bond FLAC – – –
Accounts payable FLAC 1,652 1,652 1,652
Current accrued liabilities FLAC 500 500 500
Other current financial liabilities
Derivatives being part of a hedge n.a. 44 44 44
Derivatives not being part of a hedge FLHfT 9 9 9
Other financial liabilities FLAC 35 35 35
Finance lease obligations n.a. 3 3 3
Long-term borrowings
Bank borrowings FLAC – – –
Private placements FLAC 123 123 129
Eurobond FLAC 990 990 1,000
Convertible bond FLAC 471 471 545
Non-current accrued liabilities FLAC 9 9 9
Other non-current financial liabilities
Derivatives being part of a hedge n.a. – – –
Derivatives not being part of a hedge FLHfT 2 2 2
Other financial liabilities FLAC 0 0 0
Finance lease obligations n.a. 7 7 7
Liabilities classified as held for sale FLAC 41 41 41
Thereof: aggregated by category according to IAS 39
Financial assets at fair value through profit or loss 141
Thereof: designated as such upon initial recognition (Fair Value Option – FVO) −
Thereof: Held for Trading (FAHfT) 141
Loans and Receivables (LaR) 2,152
Available-for-Sale Financial Assets (AfS) 49
Financial Liabilities Measured at Amortised Cost (FLAC) 4,110
Financial Liabilities at fair value through profit or loss Held for Trading (FLHfT) 11
29 Financial instruments
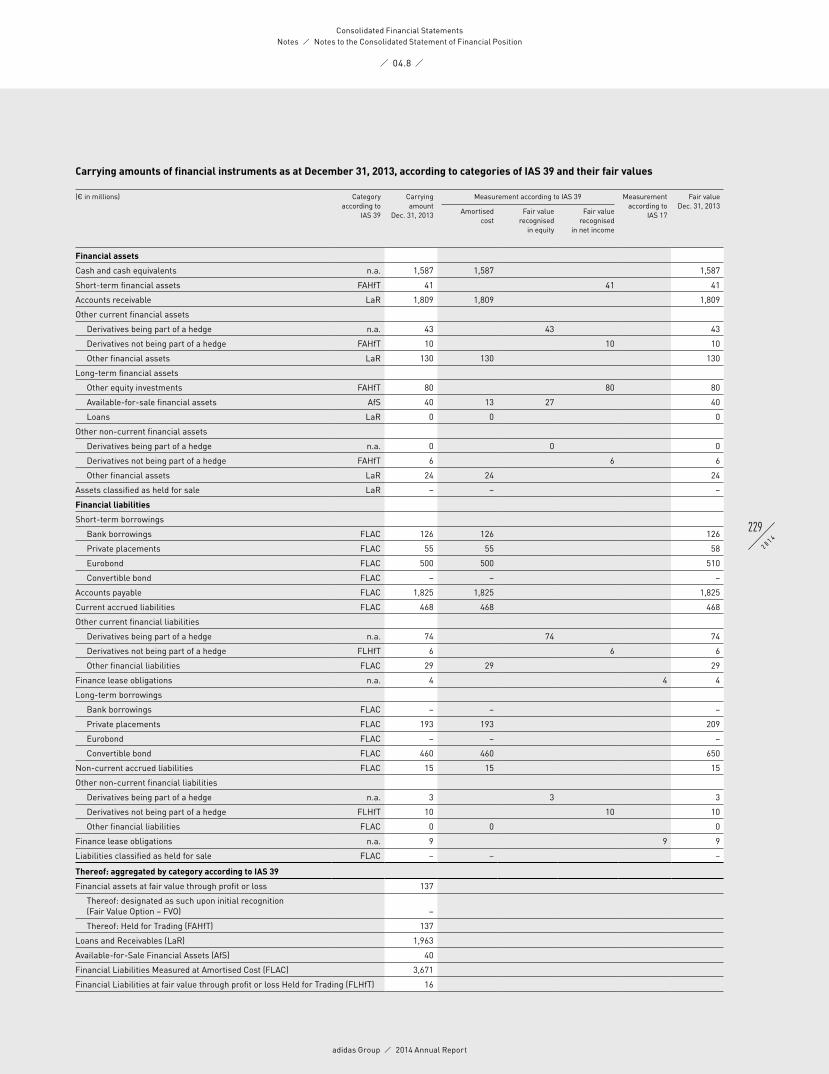
adidas Group / 2014 Annual Report
Consolidated Financial Statements
2292 0 1 4
/ 04.8 /
Notes / Notes to the Consolidated Statement of Financial Position
Carrying amounts of financial instruments as at December 31, 2013, according to categories of IAS 39 and their fair values
(€ in millions) Categoryaccording to
IAS 39
Carryingamount
Dec. 31, 2013
Measurement according to IAS 39 Measurement according to
IAS 17
Fair valueDec. 31, 2013
Amortisedcost
Fair valuerecognised
in equity
Fair valuerecognised
in net income
Financial assets
Cash and cash equivalents n.a. 1,587 1,587 1,587
Short-term financial assets FAHfT 41 41 41
Accounts receivable LaR 1,809 1,809 1,809
Other current financial assets
Derivatives being part of a hedge n.a. 43 43 43
Derivatives not being part of a hedge FAHfT 10 10 10
Other financial assets LaR 130 130 130
Long-term financial assets
Other equity investments FAHfT 80 80 80
Available-for-sale financial assets AfS 40 13 27 40
Loans LaR 0 0 0
Other non-current financial assets
Derivatives being part of a hedge n.a. 0 0 0
Derivatives not being part of a hedge FAHfT 6 6 6
Other financial assets LaR 24 24 24
Assets classified as held for sale LaR – – –
Financial liabilities
Short-term borrowings
Bank borrowings FLAC 126 126 126
Private placements FLAC 55 55 58
Eurobond FLAC 500 500 510
Convertible bond FLAC – – –
Accounts payable FLAC 1,825 1,825 1,825
Current accrued liabilities FLAC 468 468 468
Other current financial liabilities
Derivatives being part of a hedge n.a. 74 74 74
Derivatives not being part of a hedge FLHfT 6 6 6
Other financial liabilities FLAC 29 29 29
Finance lease obligations n.a. 4 4 4
Long-term borrowings
Bank borrowings FLAC – – –
Private placements FLAC 193 193 209
Eurobond FLAC – – –
Convertible bond FLAC 460 460 650
Non-current accrued liabilities FLAC 15 15 15
Other non-current financial liabilities
Derivatives being part of a hedge n.a. 3 3 3
Derivatives not being part of a hedge FLHfT 10 10 10
Other financial liabilities FLAC 0 0 0
Finance lease obligations n.a. 9 9 9
Liabilities classified as held for sale FLAC – – –
Thereof: aggregated by category according to IAS 39
Financial assets at fair value through profit or loss 137
Thereof: designated as such upon initial recognition (Fair Value Option – FVO) −
Thereof: Held for Trading (FAHfT) 137
Loans and Receivables (LaR) 1,963
Available-for-Sale Financial Assets (AfS) 40
Financial Liabilities Measured at Amortised Cost (FLAC) 3,671
Financial Liabilities at fair value through profit or loss Held for Trading (FLHfT) 16

adidas Group / 2014 Annual Report
Consolidated Financial Statements
2302 0 1 4
/ 04.8 /
Notes / Notes to the Consolidated Statement of Financial Position
Fair value hierarchy of financial instruments according to IFRS 13 as at December 31, 2014
(€ in millions) Fair valueDec. 31, 2014
Level 1 Level 2 Level 3
Short-term financial assets 5 5
Derivative financial instruments
Derivatives being part of a hedge 229 229
Derivatives not being part of a hedge 56 56
Long-term financial assets 113 33 80 1)
Financial assets 403 323 80
Short-term borrowings 294 294
Derivative financial instruments
Derivatives being part of a hedge 44 44
Derivatives not being part of a hedge 11 11
Long-term borrowings 1,674 1,545 129
Financial liabilities 2,023 1,545 478
Fair valueJan. 1, 2014
Gains Losses Fair valueDec. 31, 2014
1) This category relates to a 8.33% investment in FC Bayern München AG of € 80 million. Dividends are distributed by FC Bayern München AG instead of regular interest payments. These dividends are recognised in other financial income.
80 1 – 80
Level 1 is based on quoted prices in active markets for identical assets or liabilities.Level 2 is based on inputs other than quoted prices included within Level 1 that are observable for the asset or liability, either directly (i.e. as prices) or indirectly (i.e. derived from prices).Level 3 is based on inputs for the asset or liability that are not based on observable market data (unobservable inputs).
Fair value hierarchy of financial instruments according to IFRS 13 as at December 31, 2013
(€ in millions) Fair valueDec. 31, 2013
Level 1 Level 2 Level 3
Short-term financial assets 41 41
Derivative financial instruments
Derivatives being part of a hedge 43 43
Derivatives not being part of a hedge 16 16
Long-term financial assets 107 27 80 1)
Financial assets 207 127 80
Short-term borrowings 694 510 184
Derivative financial instruments
Derivatives being part of a hedge 77 77
Derivatives not being part of a hedge 16 16
Long-term borrowings 859 650 209
Financial liabilities 1,646 1,160 486
Fair valueJan. 1, 2013
Gains Losses Fair valueDec. 31, 2013
1) This category relates to a 9.1% investment in FC Bayern München AG of € 80 million. Dividends are distributed by FC Bayern München AG instead of regular interest payments. These dividends are recognised in other financial income.
79 1 – 80
Level 1 is based on quoted prices in active markets for identical assets or liabilities.Level 2 is based on inputs other than quoted prices included within Level 1 that are observable for the asset or liability, either directly (i.e. as prices) or indirectly (i.e. derived from prices).Level 3 is based on inputs for the asset or liability that are not based on observable market data (unobservable inputs).

adidas Group / 2014 Annual Report
Consolidated Financial Statements
2312 0 1 4
/ 04.8 /
Notes / Notes to the Consolidated Statement of Financial Position
Due to the short-term maturities of cash and cash equivalents, short-term financial assets, accounts receivable and payable as well as other current financial receivables and payables, their respective fair values approximate their carrying amount.
The fair values of non-current financial assets and liabilities are estimated by discounting expected future cash flows using current interest rates for debt of similar terms and remaining maturities and adjusted by an adidas Group specific credit risk premium.
Fair values of long-term financial assets classified as ‘Available-for-sale’ are based on quoted market prices in an active market or are calculated as present values of expected future cash flows.
The fair values of currency options, forward exchange contracts and commodity futures are determined on the basis of market conditions at the balance sheet date. The fair value of a currency option is determined using generally accepted models to calculate option prices. The fair market value of an option is influenced not only by the remaining term of the option, but also by other determining factors such as the actual foreign exchange rate and the volatility of the underlying foreign currency base.
In accordance with IFRS 13, the following tables show the valuation methods used in measuring Level 1, Level 2 and Level 3 fair values, as well as the significant unobservable inputs used.
Financial instruments Level 1 not measured at fair value
Type Valuation method Significant unobservable inputs
Category
Convertible bond The fair value is based on the market price of the convertible bond as at December 31, 2014.
Not applicable FLAC
Eurobond The fair value is based on the market price of the Eurobond as at December 31, 2014.
Not applicable FLAC
Financial instruments Level 2 measured at fair value
Type Valuation method Significant unobservable inputs
Category
Short-term financial assets
The discounted cash flow method is applied, which considers the present value of expected payments, discounted using a risk-adjusted discount rate. Due to their short-term maturities, their respective fair value is equal to the notional amount.
Not applicable FAHfT
Available-for-sale financial assets
The fair value is based on the market price of the assets as at December 31, 2014.
Not applicable AfS
Forward exchange contracts
For EUR/USD, the adidas Group applies the par method, which uses actively traded forward rates. For the other currency pairs, the zero coupon method is applied. The zero method is a model for the determination of forward rates based on deposit and swap interest rates.
Not applicable n.a. respectively FAHfT
Currency options The adidas Group applies the Garman-Kohlhagen model, which is an extended version of the Black-Scholes model.
Not applicable n.a. respectively FAHfT
Commodity futures The fair value is determined based on commodity forward curves, discounted by deposit and swap interest rates.
Not applicable n.a. respectively FAHfT
Financial instruments Level 2 not measured at fair value
Type Valuation method Significant unobservable inputs
Category
Private placements The discounted cash flow method is applied, which considers the present value of expected payments, discounted using a risk-adjusted discount rate.
Not applicable FLAC

adidas Group / 2014 Annual Report
Consolidated Financial Statements
2322 0 1 4
/ 04.8 /
Notes / Notes to the Consolidated Statement of Financial Position
Financial instruments Level 3 measured at fair value
Type Valuation method Significant unobservable inputs
Category
Investment in FC Bayern München AG
This equity security does not have a quoted market price in an active market. Existing contractual arrangements (based on the externally observable dividend policy of Bayern München AG) are used in order to calculate the fair value as at December 31, 2014.
See column ‘Valuation method’
FAHfT
Net gains/losses on financial instruments recognised in the consolidated income statement
(€ in millions) Year ending Dec. 31, 2014
Year ending Dec. 31, 2013
Financial assets or financial liabilities at fair value through profit or loss (13) (16)
Thereof: designated as such upon initial recognition – –
Thereof: classified as held for trading (13) (16)
Loans and receivables (26) (13)
Available-for-sale financial assets – –
Financial liabilities measured at amortised cost 12 15
Net gains or losses on financial assets or financial liabilities held for trading include the effects from fair value measurements of the derivatives that are not part of a hedging relationship, and changes in the fair value of other financial instruments as well as interest payments.
Net gains or losses on loans and receivables comprise mainly impairment losses and reversals. Net gains or losses on financial liabilities measured at amortised cost include effects from early settlement
and reversals of accrued liabilities.The disclosures required by IFRS 7 ‘Financial Instruments: Disclosures’, paragraphs 13A to 13F (‘Offsetting
financial assets and financial liabilities’) as well as 31 to 42 (‘Nature and Extent of Risks arising from Financial Instruments’) can be found in / NOTE 07 and the Group Management Report / SEE RISK AND OPPORTUNITY REPORT,
P. 154.
Financial instruments for the hedging of foreign exchange riskThe adidas Group uses natural hedges and arranges forward exchange contracts, currency options and currency swaps to protect against foreign exchange risk. As at December 31, 2014, the Group had outstanding currency options with premiums paid totalling an amount of € 0 million (2013: € 2 million). The effective part of the currency hedges is directly recognised in hedging reserves and as part of the acquisition costs of inventories, respectively, and posted into the income statement at the same time as the underlying secured transaction is recorded. An amount of positive € 22 million after taxes (2013: positive € 2 million) for currency options and an amount of positive € 154 million after taxes (2013: negative € 34 million) for forward exchange contracts were recorded in hedging reserves. Currency option premiums impacted net income in the amount of € 3 million in 2014 (2013: € 4 million).
The total time value of the currency options not being part of a hedge in an amount of negative € 0 million (2013: negative € 4 million) was recorded in the income statement in 2014. In 2014, due to a change in the exposure, some of the currency hedges were terminated and consequently an amount of € 0 million was reclassified from hedging reserves to the income statement.
In the years ending December 31, 2014 and 2013, hedging instruments related to product sourcing were bought to hedge a total net amount of US $ 5.6 billion and US $ 5.2 billion, respectively.

adidas Group / 2014 Annual Report
Consolidated Financial Statements
2332 0 1 4
/ 04.8 /
Notes / Notes to the Consolidated Statement of Financial Position
The notional amounts of all outstanding currency hedging instruments, which are mainly related to cash flow hedges, are summarised in the following table:
Notional amounts of all outstanding currency hedging instruments
(€ in millions) Dec. 31, 2014 Dec. 31, 2013
Forward exchange contracts 6,738 4,430
Currency options 278 472
Total 7,016 4,902
The comparatively high amount of forward exchange contracts is primarily due to currency swaps for liquidity management purposes and hedging transactions.
Of the total amount of outstanding hedges, the following contracts related to the US dollar (i.e. the biggest single exposure of product sourcing):
Notional amounts of outstanding US dollar hedging instruments
(€ in millions) Dec. 31, 2014 Dec. 31, 2013
Forward exchange contracts 3,192 2,605
Currency options 278 425
Total 3,470 3,030
The fair value of all outstanding currency hedging instruments is as follows:
Fair values
(€ in millions) Dec. 31, 2014 Dec. 31, 2013
Positive fair value
Negative fair value
Positive fair value
Negative fair value
Forward exchange contracts 245 (50) 47 (79)
Currency options 26 (0) 11 (13)
Total 271 (50) 58 (92)
A total net fair value of positive € 163 million (2013: negative € 36 million) for forward exchange contracts related to hedging instruments falling under hedge accounting as per definition of IAS 39 ‘Financial Instruments: Recognition and Measurement’ was recorded in the hedging reserve. The remaining net fair value of positive € 32 million (2013: positive € 4 million), mainly related to liquidity swaps for cash management purposes and to forward exchange contracts hedging intercompany dividend receivables, was recorded in the income statement. The total fair value of positive € 26 million (2013: negative € 2 million) for outstanding currency options related to cash flow hedges. This consists of a positive time value of € 0 million (2013: positive € 8 million) and of a negative time value of € 0 million (2013: negative € 12 million) and, in contrast to the preceding table above, does not include the intrinsic value of the options.
The fair value adjustments of outstanding cash flow hedges for forecasted sales are reported in the income statement when the forecasted sales transactions are recorded. The vast majority of these transactions are forecasted to occur in 2015. At the balance sheet date, inventories were adjusted by negative € 1 million (2013: positive € 20 million) which will be recognised in the income statement in 2015.
In the hedging reserve, a negative amount of € 4 million (2013: negative € 6 million) is included for hedging the currency risk of net investments in foreign entities, mainly for the subsidiaries LLC “adidas, Ltd.” and adidas Sports (China) Co. Ltd. This reserve will remain until the investment in the foreign entity has been sold. As at December 31, 2014, no ineffective part of the hedges was recorded in the income statement.
In order to determine the fair values of its derivatives that are not publicly traded, the adidas Group uses generally accepted quantitative financial models based on market conditions prevailing at the balance sheet date.
In 2014, the fair values of the derivatives were determined applying mainly the ‘par method’, which uses actively traded forward rates.

adidas Group / 2014 Annual Report
Consolidated Financial Statements
2342 0 1 4
/ 04.8 /
Notes / Notes to the Consolidated Income Statement
Notes to the Consolidated Income Statement
Other operating income consists of the following:
Other operating income (continuing operations)
(€ in millions) Year ending Dec. 31, 2014
Year ending Dec. 31, 2013
Income from release of accrued liabilities and other provisions 89 83
Income from accounts receivable previously written off 3 3
Gains from disposal of fixed assets 2 1
Reversals of impairment losses for intangible and tangible assets 1 2
Sundry income 44 53
Other operating income 138 142
Sundry income mainly relates to income from cost reimbursements.
Other operating expenses include expenses for sales, marketing, research and development, as well as for logistics and central administration. In addition, they include impairment losses as well as depreciation of tangible assets and amortisation of intangible assets (except goodwill impairment losses), with the exception of depreciation and amortisation which is included in the cost of sales.
Marketing working budget is a material component of other operating expenses. The marketing working budget consists of promotion and communication spending such as promotion contracts, advertising, events and other communication activities. However, it does not include marketing overhead expenses, which are presented in marketing overheads. In 2014, marketing working budget of continuing operations accounted for 25% (2013: 24%) of the total other operating expenses.
Expenses for central administration include the functions IT, Finance, Legal, Human Resources, Facilities & Services as well as General Management.
Depreciation and amortisation expense (continuing operations) for tangible and intangible assets (except goodwill impairment losses) and impairment losses were € 332 million and € 291 million for the years ending December 31, 2014 and 2013, respectively. Thereof, € 2 million and € 3 million were recorded within the cost of sales as they are directly assigned to the production costs.
Other operating expenses (continuing operations)
(€ in millions) Year ending Dec. 31, 2014
Year ending Dec. 31, 2013
Marketing working budget 1,548 1,451
Sales working budget 375 336
Marketing overhead 1) 427 420
Sales force 1) 1,915 1,815
Logistics 1) 763 753
Research and development 1) 126 124
Central administration 1) 1,050 1,114
Other operating expenses 6,203 6,013
Thereof: depreciation, amortisation and impairment losses 323 282
1) Including personnel and administration expenses.
30 Other operating income
31 Other operating expenses
adidas Group / 2014 Annual Report
Consolidated Financial Statements
2352 0 1 4
/ 04.8 /
Notes / Notes to the Consolidated Income Statement
Expenses are presented by function according to the ‘cost of sales method’ in the income statement. Supplementary information on the expenses by nature is detailed below.
Cost of materials The total cost of materials (continuing operations) relating to the amount of inventories recognised as an expense during the period was € 7.478 billion and € 7.060 billion for the years ending December 31, 2014 and 2013, respectively.
Personnel expensesPersonnel expenses were as follows:
Personnel expenses (continuing operations)
(€ in millions) Year ending Dec. 31, 2014
Year ending Dec. 31, 2013
Wages and salaries 1,593 1,590
Social security contributions 178 173
Pension expenses 71 70
Personnel expenses 1,842 1,833
Personnel expenses are primarily included within other operating expenses. Personnel expenses which are directly attributable to the production costs of goods are included within the cost of sales.
Financial result consists of the following:
Financial income
(€ in millions) Year ending Dec. 31, 2014
Year ending Dec. 31, 2013
Interest income from financial instruments measured at amortised cost 4 8
Interest income from financial instruments at fair value through profit or loss 13 17
Interest income from non-financial assets 0 0
Other 3 1
Financial income 19 26
Financial expenses
(€ in millions) Year ending Dec. 31, 2014
Year ending Dec. 31, 2013
Interest expense on financial instruments measured at amortised cost 59 73
Interest expense on financial instruments at fair value through profit or loss 0 0
Interest expense on other provisions and non-financial liabilities 3 0
Net foreign exchange losses 3 18
Other 2 3
Financial expenses 67 94
Interest income from financial instruments, measured at amortised cost, mainly consists of interest income from bank deposits and loans.
Interest income/expense from financial instruments at fair value through profit or loss mainly includes interest payments from investment funds as well as net interest payments from interest derivatives not being part of a hedging relationship. Unrealised gains/losses from fair value measurement of such financial assets are shown in other financial income or expenses.
32 Cost by nature
33 Financial income/ financial expenses

adidas Group / 2014 Annual Report
Consolidated Financial Statements
2362 0 1 4
/ 04.8 /
Notes / Notes to the Consolidated Income Statement
Interest expense on financial instruments measured at amortised cost mainly includes interest on borrowings and effects from using the ‘effective interest method’.
Interest expense on other provisions and non-financial liabilities particularly includes effects from measurement of other provisions at present value and interest on non-financial liabilities such as tax payables.
Other financial expenses include impairment losses on other financial assets amounting to € 2 million for the year ending December 31, 2014 (2013: € 3 million).
Information regarding the Group’s available-for-sale investments, borrowings and financial instruments is also included in these Notes / SEE NOTES 06, 15, 18 AND 29.
adidas AG and its German subsidiaries are subject to German corporate and trade taxes. For the years ending December 31, 2014 and 2013, the statutory corporate income tax rate of 15% plus a surcharge of 5.5% thereon is applied to earnings. The municipal trade tax is approximately 11.4% of taxable income.
For non-German subsidiaries, deferred taxes are calculated based on tax rates that have been enacted or substantively enacted by the closing date.
Deferred tax assets and liabilities Deferred tax assets and liabilities are offset if they relate to the same fiscal authority. The following deferred tax assets and liabilities, determined after appropriate offsetting, are presented in the consolidated statement of financial position:
Deferred tax assets/liabilities
(€ in millions) Dec. 31, 2014 Dec. 31, 2013
Deferred tax assets 577 486
Deferred tax liabilities (390) (338)
Deferred tax assets, net 186 148
The movements of deferred taxes are as follows:
Movement of deferred taxes
(€ in millions) 2014 2013
Deferred tax assets, net as at January 1 148 160
Deferred tax income 43 14
Change in consolidated companies 1) (1) 0
Change in deferred taxes on assets classified as held for sale 2) 27 0
Change in deferred taxes attributable to remeasurements of defined benefit plans recorded in other comprehensive income 3) 21 (1)
Change in deferred taxes attributable to effective portion of qualifying hedging instruments recorded in other comprehensive income 4) (37) (1)
Currency translation differences (13) (24)
Deferred tax assets, net as at December 31 186 148
1) See Note 04.2) See Note 03 and 11.3) See Note 24.4) See Note 29.
34 Income taxes

adidas Group / 2014 Annual Report
Consolidated Financial Statements
2372 0 1 4
/ 04.8 /
Notes / Notes to the Consolidated Income Statement
Gross Group deferred tax assets and liabilities after valuation allowances, but before appropriate offsettings, are attributable to the items detailed in the table below:
Deferred taxes
(€ in millions) Dec. 31, 2014 Dec. 31, 2013
Non-current assets 183 145
Current assets 197 166
Accrued liabilities and provisions 250 198
Accumulated tax loss carry-forwards 92 69
Deferred tax assets 722 578
Non-current assets 363 303
Current assets 102 72
Accrued liabilities and provisions 69 55
Deferred tax liabilities 534 430
Deferred tax assets, net 186 148
Deferred tax assets are recognised only to the extent that the realisation of the related benefit is probable. For the assessment of probability, in addition to past performance and the respective prospects for the foreseeable future, appropriate tax structuring measures are also taken into consideration.
Deferred tax assets for which the realisation of the related tax benefits is not probable increased from € 435 million to € 524 million for the year ending December 31, 2014. These amounts mainly relate to tax losses carried forward and unused foreign tax credits of the US tax group, which begin to expire in 2026. The remaining unrecognised deferred tax assets relate to subsidiaries operating in markets where the realisation of the related tax benefit is not considered probable.
The Group does not recognise deferred tax liabilities for unremitted earnings of non-German subsidiaries to the extent that they are expected to be permanently invested in international operations. These earnings, the amount of which cannot be practicably computed, could become subject to additional tax if they were remitted as dividends or if the Group were to sell its shareholdings in the subsidiaries.
Tax expenses Tax expenses are split as follows:
Income tax expenses (continuing operations)
(€ in millions) Year ending Dec. 31, 2014
Year ending Dec. 31, 2013
Current tax expenses 315 354
Deferred tax income (43) (14)
Income tax expenses 271 340
The deferred tax income includes tax income of € 24 million in total (2013: € 25 million) related to the origination and reversal of temporary differences.

adidas Group / 2014 Annual Report
Consolidated Financial Statements
2382 0 1 4
/ 04.8 /
Notes / Notes to the Consolidated Income Statement
The effective tax rate of the Group differs from an assumed tax rate of 30% for the year ending December 31, 2014 as follows:
Tax rate reconciliation (continuing operations)
Year ending Dec. 31, 2014 Year ending Dec. 31, 2013
€ in millions in % € in millions in %
Expected income tax expenses 251 30.0 334 30.0
Tax rate differentials (117) (14.1) (133) (12.0)
Non-deductible expenses 18 2.2 82 7.4
Goodwill impairment losses 23 2.8 16 1.4
Losses for which benefits were not recognisable and changes in valuation allowances 42 5.0 24 2.1
Changes in tax rates 6 0.7 (35) (3.1)
Other, net 1 0.1 1 0.1
224 26.8 289 25.9
Withholding tax expenses 47 5.6 51 4.6
Income tax expenses 271 32.5 340 30.5
For 2013, the line item ‘Non-deductible expenses’ includes tax expenses of in total € 27 million related to the resolution of domestic tax audits for prior years.
For 2014 and 2013, the effective tax rate is affected by non-tax-deductible goodwill impairment losses. Excluding the goodwill impairment losses, the effective tax rate is 29.7% and 29.0%, respectively.
For 2014, the line item ‘Losses for which benefits were not recognisable and changes in valuation allowances’ mainly relates to changes in valuation allowances of the US tax group.
For 2013, the line item ‘Changes in tax rates’ mainly reflects a UK tax rate deduction effective in 2013.
Basic earnings per share from continuing operations are calculated by dividing the net income from continuing operations attributable to shareholders by the weighted average number of shares outstanding during the year, excluding ordinary shares purchased by the adidas Group and held as treasury shares.
Basic earnings per share from continuing and discontinued operations are calculated by dividing the net income attributable to shareholders by the weighted average number of shares outstanding during the year, excluding ordinary shares purchased by the adidas Group and held as treasury shares.
A dilutive effect from 6.06 million potential shares arising from the convertible bond does not apply in 2014 as the conversion right does not have any value as at the balance sheet date / SEE NOTE 18.
Earnings per share
Year ending Dec. 31, 2014
Year ending Dec. 31, 2013
Net income from continuing operations (€ in millions) 564 773
Net income attributable to non-controlling interests (€ in millions) 6 3
Net income from continuing operations attributable to shareholders (€ in millions) 558 770
Weighted average number of shares 208,776,457 209,216,186
Basic and diluted earnings per share from continuing operations (in €) 2.67 3.68
Net income attributable to shareholders (€ in millions) 490 787
Weighted average number of shares 208,776,457 209,216,186
Basic and diluted earnings per share from continuing and discontinued operations (in €) 2.35 3.76
For further information on basic and diluted earnings per share from discontinued operations / SEE NOTE 03.
35 Earnings per share

adidas Group / 2014 Annual Report
Consolidated Financial Statements
2392 0 1 4
/ 04.8 /
Notes / Notes – Additional Information
Notes – Additional Information
The Group operates predominantly in one industry segment – the design, distribution and marketing of athletic and sports lifestyle products.
Following the Group’s internal management reporting and in accordance with the definition of IFRS 8 ‘Operating Segments’, six operating segments have been identified: Wholesale, Retail, TaylorMade-adidas Golf, Rockport, Reebok-CCM Hockey and Other Centrally Managed Brands. According to the criteria of IFRS 8 for reportable segments, the business segments Wholesale and Retail are reported separately, while the remaining are aggregated under Other Businesses due to their only subordinate materiality.
The Wholesale segment comprises all business activities relating to the distribution of adidas and Reebok products to retail customers.
The Retail segment comprises all business activities relating to the sale of adidas and Reebok products directly to end consumers through own retail and own e-commerce platforms.
The operating segment TaylorMade-adidas Golf comprises the brands TaylorMade, adidas Golf, Adams Golf and Ashworth.
The Other Centrally Managed Brands segment primarily includes the business activities of the labels Y-3 and Porsche Design Sport by adidas as well as the business activities of the brand Five Ten in the outdoor action sports sector. Furthermore, the segment also comprises the German own-retail activities of the adidas NEO label.
Certain centralised Group functions do not meet the definition of IFRS 8 for a reportable operating segment. This includes functions such as central treasury, global sourcing as well as other headquarter departments. Assets, liabilities, income and expenses relating to these corporate functions are presented together with other non-allocable items and intersegment eliminations in the reconciliations.
Compared to the 2013 consolidated financial statements, Rockport is shown in the segmental reporting as discontinued operations.
The chief operating decision maker for the adidas Group has been defined as the joint Executive Board of adidas AG.
There are no intersegment sales between the reportable segments. Accounting and valuation policies applied for reporting segmental information are the same as those used for the adidas Group / SEE NOTE 02.
The results of the operating segments are reported in the line item ‘Segmental operating profit’. This is defined as gross profit minus costs directly attributable to the segment or the group of segments (primarily sales and logistics costs) before marketing working budget expenditures and operating overhead costs not directly attributable.
Segmental assets include accounts receivable as well as inventories. Only these items are reported to the chief operating decision maker on a regular basis. Depreciation, amortisation, impairment losses (except for goodwill) and reversals of impairment losses as well as capital expenditures for tangible and intangible assets are part of the segmental reporting, even though segmental assets do not contain tangible and intangible assets. Depreciation and amortisation as well as impairment losses and reversals of impairment losses not directly attributable to a segment or a group of segments are presented under HQ/Consolidation in the reconciliations.
Segmental liabilities only contain accounts payable from operating activities as there are no other liability items reported regularly to the chief operating decision maker.
Interest income and interest expenses as well as income taxes are not allocated to the reportable segments and are not reported separately to the chief operating decision maker.
36 Segmental information

adidas Group / 2014 Annual Report
Consolidated Financial Statements
2402 0 1 4
/ 04.8 /
Notes / Notes – Additional Information
(€ in millions) Wholesale Retail Other Businesses (continuing operations)
Other Businesses (discontinued
operations)
Other Businesses (total)
Total
2014 2013 2014 2013 2014 2013 2014 2013 2014 2013 2014 2013
Net sales (non-Group) 9,376 9,100 3,842 3,446 1,316 1,657 283 289 1,599 1,946 14,817 14,492
Segmental operating profit 3,100 3,082 673 678 254 455 46 54 300 508 4,074 4,269
Segmental assets 2,945 2,763 799 898 706 621 139 128 846 749 4,590 4,410
Segmental liabilities 358 360 125 99 134 147 37 30 171 176 654 635
Capital expenditure 71 62 134 139 20 22 6 6 26 28 232 229
Depreciation and amortisation 52 45 93 87 7 6 7 5 14 11 159 143
Impairment losses and reversals of impairment losses (1) 1 16 1 1 0 0 0 1 0 16 2
ReconciliationsThe following tables include reconciliations of segmental information to the aggregate numbers of the consolidated financial statements, taking into account items which are not directly attributable to a segment or a group of segments.
Net sales (non-Group)
(€ in millions) Year ending Dec. 31, 2014
Year ending Dec. 31, 2013
Reportable segments 13,218 12,546
Other Businesses 1,599 1,946
Reclassification to discontinued operations (283) (289)
Total 14,534 14,203
Operating profit
(€ in millions) Year ending Dec. 31, 2014
Year ending Dec. 31, 2013
Operating profit for reportable segments 3,774 3,760
Operating profit for Other Businesses 300 508
Segmental operating profit 4,074 4,269
HQ/Consolidation 245 293
Marketing working budget (1,548) (1,451)
Other operating expenses (1,944) (1,979)
Royalty and commission income 102 103
Reclassification to discontinued operations (46) (54)
Operating profit 883 1,181
Financial income 19 26
Financial expenses (67) (94)
Income before taxes 835 1,113
Operating profit of centralised functions which do not represent a segment, such as central treasury and global sourcing, is shown under HQ/Consolidation.
Segments

adidas Group / 2014 Annual Report
Consolidated Financial Statements
2412 0 1 4
/ 04.8 /
Notes / Notes – Additional Information
Capital expenditure
(€ in millions) Year ending Dec. 31, 2014
Year ending Dec. 31, 2013
Reportable segments 205 201
Other Businesses 26 28
HQ/Consolidation 322 250
Total 554 479
Depreciation and amortisation
(€ in millions) Year ending Dec. 31, 2014
Year ending Dec. 31, 2013
Reportable segments 146 132
Other Businesses 14 11
Reclassification to discontinued operations (7) (5)
HQ/Consolidation 156 143
Total 309 281
Impairment losses and reversals of impairment losses
(€ in millions) Year ending Dec. 31, 2014
Year ending Dec. 31, 2013
Reportable segments 15 2
Other Businesses 1 0
Reclassification to discontinued operations 0 0
HQ/Consolidation 78 52
Total 94 54
Assets
(€ in millions) Dec. 31, 2014 Dec. 31, 2013
Accounts receivable and inventories of reportable segments 3,744 3,661
Accounts receivable and inventories of Other Businesses 846 749
Segmental assets 4,590 4,410
Non-segmental accounts receivable and inventories 22 33
Current financial assets 2,086 1,811
Other current assets 789 603
Non-current assets 5,070 4,742
Reclassification to assets classified as held for sale (139) –
Total 12,417 11,599

adidas Group / 2014 Annual Report
Consolidated Financial Statements
2422 0 1 4
/ 04.8 /
Notes / Notes – Additional Information
Liabilities
(€ in millions) Dec. 31, 2014 Dec. 31, 2013
Accounts payable of reportable segments 483 459
Accounts payable of Other Businesses 171 176
Segmental liabilities 654 635
Non-segmental accounts payable 1,035 1,190
Current financial liabilities 379 794
Other current liabilities 2,346 2,113
Non-current liabilities 2,422 1,386
Reclassification to liabilities classified as held for sale (37) –
Total 6,799 6,118
Product information
Net sales (non-Group)
(€ in millions) Year ending Dec. 31, 2014
Year ending Dec. 31, 2013
Footwear 6,939 6,873
Apparel 6,281 5,813
Hardware 1,597 1,806
Reclassification to discontinued operations (283) (289)
Total 14,534 14,203
Geographical informationNet sales (non-Group) are shown in the geographic market in which the net sales are realised. Non-current assets are allocated to the geographic market based on the domicile of the respective subsidiary independent of the segmental structure and consist of tangible assets, goodwill, trademarks, other intangible assets and other non-current assets.
Geographical information
(€ in millions) Net sales (non-Group) Non-current assets
Year ending Dec. 31, 2014
Year ending Dec. 31, 2013
Dec. 31, 2014 Dec. 31, 2013
Western Europe 4,138 3,800 1,619 1,488
European Emerging Markets 1,959 1,894 563 608
North America 3,124 3,362 1,107 1,023
Greater China 1,811 1,655 359 296
Other Asian Markets 2,157 2,206 438 483
Latin America 1,627 1,575 236 208
HQ/Consolidation 0 0 0 0
Reclassification to discontinued operations (283) (289) – –
Total 14,534 14,203 4,322 4,106
With regard to Germany, Western Europe contains net sales (non-Group) (continuing operations) amounting to € 827 million and € 724 million as well as non-current assets amounting to € 806 million and € 739 million for the years 2014 and 2013, respectively. With regard to the USA, North America contains net sales (non-Group) (continuing operations) amounting to € 2.579 billion and € 2.782 billion as well as non-current assets amounting to € 833 million and € 862 million for the years 2014 and 2013, respectively.
The reporting by segments will be adjusted starting 2015 in order to reflect the new internal management reporting. In the future, the management and reporting of the Group will no longer be split into Wholesale and Retail as well as Other Businesses, but into geographical markets and Other Businesses.

adidas Group / 2014 Annual Report
Consolidated Financial Statements
2432 0 1 4
/ 04.8 /
Notes / Notes – Additional Information
In 2014, the increase in cash generated from operating activities compared to the prior year was primarily due to lower working capital requirements.
Net cash outflow from investing activities in 2014 was mainly related to spending for property, plant and equipment such as investments in the furnishing and fitting of stores in the Retail segment, in new office buildings, warehouses and IT systems.
Cash outflows from financing activities were mainly related to the dividend paid to shareholders of adidas AG and to the repurchase of treasury shares.
Net cash generated from discontinued operations
(€ in millions) Dec. 31, 2014 Dec. 31, 2013
Net cash generated from operating activities 19 23
Net cash used in investing activities (7) (6)
Net cash used in/generated from financing activities – –
Total 12 17
Other financial commitments The Group has other financial commitments for promotion and advertising contracts, which mature as follows:
Financial commitments for promotion and advertising
(€ in millions) Dec. 31, 2014 Dec. 31, 2013
Within 1 year 836 724
Between 1 and 5 years 2,590 2,054
After 5 years 1,766 1,013
Total 5,193 3,791
Commitments with respect to promotion and advertising contracts maturing after five years have remaining terms of up to 16 years from December 31, 2014.
Commitments for promotion and advertising contracts increased by € 1.4 billion compared to December 31, 2013 due to the conclusion of new contracts and the prolongation of existing partnerships. The increase mainly resulted from the long-term promotion contract concluded with Manchester United F.C.
Information regarding commitments under lease and service contracts is also included in these Notes / SEE
NOTE 28.
Litigation and other legal risks The Group is currently engaged in various lawsuits resulting from the normal course of business, mainly in connection with distribution agreements as well as intellectual property rights. The risks regarding these lawsuits are covered by provisions when a reliable estimate of the amount of the obligation can be made / SEE NOTE 20. In the opinion of Management, the ultimate liabilities resulting from such claims will not materially affect the assets, liabilities, financial position and profit or loss of the Group.
In connection with the financial irregularities at Reebok India Company in 2012, various legal uncertainties were identified. The risks cannot be assessed conclusively. However, based on legal opinions and internal assessments, Management assumes that the effects will not have any material influence on the assets, liabilities, financial position and profit or loss of the Group.
37 Additional cash flow information
38 Commitments and contingencies

adidas Group / 2014 Annual Report
Consolidated Financial Statements
2442 0 1 4
/ 04.8 /
Notes / Notes – Additional Information
According to the definitions of IAS 24 ‘Related Party Disclosures’, the Supervisory Board and the Executive Board of adidas AG were identified as related parties who solely received remuneration in connection with their function as key management personnel. For information about the remuneration of the Supervisory Board and the Executive Board of adidas AG / SEE NOTE 40 / SEE COMPENSATION REPORT, P. 28.
In addition, adidas Pension Trust e.V., a registered association, is regarded as a related party. Based on a Contractual Trust Arrangement, adidas Pension Trust e.V. manages the plan assets in the form of an administrative trust to fund and protect part of the pension obligations of adidas AG / SEE NOTE 24. Employees, senior executives and members of the Executive Board of adidas AG can be members of the registered association. adidas AG has the right to claim a refund of pension payments from adidas Pension Trust e.V. under specific contractually agreed conditions.
Employees The average numbers of employees are as follows:
Employees
Year ending Dec. 31, 2014
Year ending Dec. 31, 2013
Own retail 30,785 26,130
Sales 4,095 4,521
Logistics 6,034 5,952
Marketing 3,999 3,800
Central administration 4,569 4,450
Production 1,499 1,601
Research and development 1,036 1,029
Information technology 1,108 1,035
Total 53,125 48,518
Accountant service fees for the auditor of the financial statements The expenses for the audit fees comprise the expenses of adidas AG, Herzogenaurach, as well as all German subsidiaries of adidas AG. In 2014, the expenses for the professional service fees of the auditor KPMG AG amounted to € 1.0 million (2013: € 1.0 million).
Expenses for tax consultancy services provided by the auditor, for other confirmation services provided by the auditor and for other services provided by the auditor amounted to € 0.1 million (2013: € 0.1 million), € 1.0 million (2013: € 0.0 million) and € 0.3 million (2013: € 0.1 million), respectively.
Remuneration of the Supervisory Board and the Executive Board of adidas AG Supervisory BoardPursuant to the Articles of Association, the Supervisory Board members’ fixed annual payment amounted to € 0.9 million (2013: € 0.9 million).
Members of the Supervisory Board were not granted any loans in 2014.
Executive BoardIn 2014, the overall compensation of the members of the Executive Board totalled € 5.9 million (2013: € 9.9 million), € 5.4 million thereof relates to short-term benefits (2013: € 5.6 million) and € 0.5 million to long-term benefits (2013: € 4.3 million). Post-employment benefits (costs for accrued pension entitlements for members of the Executive Board) totalled € 2.8 million (2013: € 0.9 million).
In 2014, former members of the Executive Board and their survivors received pension payments totalling € 3.5 million (2013: € 3.4 million).
39 Related party disclosures
40 Other information

adidas Group / 2014 Annual Report
Consolidated Financial Statements
2452 0 1 4
/ 04.8 /
Notes / Notes – Additional Information
Pension obligations relating to former members of the Executive Board and their survivors amount in total to € 59.5 million (2013: € 48.3 million).
In connection with the mutually agreed termination of Erich Stamminger’s Executive Board mandate as of March 6, 2014, the termination of his Executive Board service contract was agreed at the same time. Until that date, he was granted the contractual payments as agreed / SEE COMPENSATION REPORT, P. 28. The entitlements agreed under the contract remained in effect until that date.
In accordance with the provisions of his final agreement, Erich Stamminger was paid compensation in the amount of € 0.1 million for post-contractual competition prohibition. Hereunder, Erich Stamminger agreed not to work for a key competitor of the adidas Group in the period until July 8, 2014.
Members of the Executive Board were not granted any loans in 2014.Further information on disclosures according to § 314 section 1 no. 6a German Commercial Code
(Handelsgesetzbuch – HGB) is provided in the Compensation Report / SEE COMPENSATION REPORT, P. 28.
Information pursuant to § 161 German Stock Corporation Act (Aktiengesetz – AktG)On February 12, 2015, the Executive Board and Supervisory Board of adidas AG issued the updated Declaration of Compliance in accordance with §161 AktG. The full text of the Declaration of Compliance is available on the Group’s corporate website.
Group-specific subsequent events On January 23, 2015, the adidas Group announced that it had entered into a definitive agreement to sell its Rockport business for a total consideration of up to US $ 280 million, most of which will be paid in cash with the remainder comprised of notes. The transaction, which is subject to customary closing conditions, is expected to be completed later in 2015. Due to concrete plans to sell the Rockport operating segment, it is reported as discontinued operations as at December 31, 2014 / SEE NOTE 03, leading to a non-operational effect in the consolidated income statement in an amount of negative € 68 million / SEE ADIDAS AG CONSOLIDATED INCOME
STATEMENT (IFRS), P. 190.
Date of preparationThe Executive Board of adidas AG prepared and approved the consolidated financial statements for submission to the Supervisory Board on February 13, 2015. It is the Supervisory Board’s task to examine the consolidated financial statements and give their approval and authorisation for issue.
Herzogenaurach, February 13, 2015The Executive Board of adidas AG
41 Information relating to the German Corporate Governance Code
42 Events after the balance sheet date

9
adidas Group / 2014 Annual Report
Consolidated Financial Statements
2462 0 1 4
Statement of Movements of Intangible and Tangible Assets
/ 04.9 /
Statement of Movements of Intangible and Tangible Assets
.. / Statement of Movements of Intangible and Tangible Assets (€ in millions) ATTACHMENT I
Goodwill Trademarks Software, patents and concessions
Internally generated software
Total intangible assets
Land, land leases, buildings and leasehold
improvements
Technical equipment and machinery
Other equipment, furniture and fixtures
Construction in progress
Total tangible assets
Acquisition cost
January 1, 2013 1,569 1,484 689 10 3,752 670 199 1,203 189 2,262
Currency effect (35) (65) (23) – (123) (20) (12) (86) (4) (121)
Additions – – 51 1 52 75 40 175 138 427
Transfers – – (4) 5 2 87 42 32 (162) (2)
Disposals – – (10) – (10) (10) (15) (123) (1) (148)
December 31, 2013/January 1, 2014 1,533 1,419 704 16 3,672 802 254 1,202 161 2,419
Currency effect 111 193 36 – 340 41 (8) 4 8 44
Additions – – 48 2 50 181 32 182 109 504
Increase in companies consolidated – – 7 – 7 – – – – –
Transfers to assets held for sale (56) (180) (15) – (251) (10) (6) (15) (0) (31)
Transfers – – (20) 25 5 70 9 35 (118) (5)
Disposals – (0) (31) (1) (32) (10) (13) (84) (1) (108)
December 31, 2014 1,588 1,432 730 41 3,792 1,074 268 1,323 159 2,823
Accumulated depreciation, amortisation and impairment
January 1, 2013 287 0 527 5 819 233 102 832 0 1,167
Currency effect (10) (0) (19) – (29) (10) (9) (67) (0) (85)
Additions – 0 49 3 52 35 29 170 – 234
Impairment losses 52 – 0 – 52 2 0 2 – 4
Reversals of impairment losses – – (0) – (0) (0) (0) (2) – (2)
Transfers – – – – – 11 0 (11) – 0
Disposals – – (9) – (9) (8) (14) (115) – (137)
December 31, 2013/January 1, 2014 329 0 549 7 885 262 109 810 0 1,181
Currency effect 38 0 30 – 68 20 (6) 15 (0) 30
Additions – 0 47 10 58 42 35 181 – 258
Impairment losses 78 – 0 – 78 9 – 8 – 17
Reversals of impairment losses – – – – – (0) (0) (0) – (1)
Transfers to assets held for sale (26) – (12) – (38) (6) (4) (9) – (19)
Transfers – – 0 – 0 1 (0) (2) – (0)
Disposals – (0) (21) (1) (22) (9) (12) (76) – (97)
December 31, 2014 419 0 592 17 1,029 320 122 926 0 1,369
Net carrying amount
January 1, 2013 1,281 1,484 162 5 2,933 437 97 371 189 1,095
December 31, 2013 1,204 1,419 155 9 2,787 540 145 392 161 1,238
December 31, 2014 1,169 1,432 138 24 2,763 753 145 397 159 1,454
Rounding differences may arise in percentages and totals.

adidas Group / 2014 Annual Report
Consolidated Financial Statements
2472 0 1 4
Statement of Movements of Intangible and Tangible Assets
/ 04.9 /
.. / Statement of Movements of Intangible and Tangible Assets (€ in millions) ATTACHMENT I
Goodwill Trademarks Software, patents and concessions
Internally generated software
Total intangible assets
Land, land leases, buildings and leasehold
improvements
Technical equipment and machinery
Other equipment, furniture and fixtures
Construction in progress
Total tangible assets
Acquisition cost
January 1, 2013 1,569 1,484 689 10 3,752 670 199 1,203 189 2,262
Currency effect (35) (65) (23) – (123) (20) (12) (86) (4) (121)
Additions – – 51 1 52 75 40 175 138 427
Transfers – – (4) 5 2 87 42 32 (162) (2)
Disposals – – (10) – (10) (10) (15) (123) (1) (148)
December 31, 2013/January 1, 2014 1,533 1,419 704 16 3,672 802 254 1,202 161 2,419
Currency effect 111 193 36 – 340 41 (8) 4 8 44
Additions – – 48 2 50 181 32 182 109 504
Increase in companies consolidated – – 7 – 7 – – – – –
Transfers to assets held for sale (56) (180) (15) – (251) (10) (6) (15) (0) (31)
Transfers – – (20) 25 5 70 9 35 (118) (5)
Disposals – (0) (31) (1) (32) (10) (13) (84) (1) (108)
December 31, 2014 1,588 1,432 730 41 3,792 1,074 268 1,323 159 2,823
Accumulated depreciation, amortisation and impairment
January 1, 2013 287 0 527 5 819 233 102 832 0 1,167
Currency effect (10) (0) (19) – (29) (10) (9) (67) (0) (85)
Additions – 0 49 3 52 35 29 170 – 234
Impairment losses 52 – 0 – 52 2 0 2 – 4
Reversals of impairment losses – – (0) – (0) (0) (0) (2) – (2)
Transfers – – – – – 11 0 (11) – 0
Disposals – – (9) – (9) (8) (14) (115) – (137)
December 31, 2013/January 1, 2014 329 0 549 7 885 262 109 810 0 1,181
Currency effect 38 0 30 – 68 20 (6) 15 (0) 30
Additions – 0 47 10 58 42 35 181 – 258
Impairment losses 78 – 0 – 78 9 – 8 – 17
Reversals of impairment losses – – – – – (0) (0) (0) – (1)
Transfers to assets held for sale (26) – (12) – (38) (6) (4) (9) – (19)
Transfers – – 0 – 0 1 (0) (2) – (0)
Disposals – (0) (21) (1) (22) (9) (12) (76) – (97)
December 31, 2014 419 0 592 17 1,029 320 122 926 0 1,369
Net carrying amount
January 1, 2013 1,281 1,484 162 5 2,933 437 97 371 189 1,095
December 31, 2013 1,204 1,419 155 9 2,787 540 145 392 161 1,238
December 31, 2014 1,169 1,432 138 24 2,763 753 145 397 159 1,454
Rounding differences may arise in percentages and totals.

10
adidas Group / 2014 Annual Report
Consolidated Financial Statements
2482 0 1 4
Shareholdings
/ 04.10 /
.. / Shareholdings of adidas AG, Herzogenaurach (at December 31, 2014) ATTACHMENT II
Company and domicile Currency Equity (currency unitsin thousands)
Share in capitalheld by 1)
in %
Shareholdings
1) The number refers to the number of the company 2) Profit and loss transfer agreement 3) Companies with no active business 4) Sub-group Taylor Made Golf Limited5) Sub-group adidas India Private Ltd. 6) Sub-group adidas (UK) Limited 7) Sub-group Sports Licensed Division of the adidas Group, LLC 8) Sub-group Reebok-CCM Hockey, U.S., Inc. 9) Sub-group Reebok International Limited 10) Sub-group Reebok International Ltd. 11) Sub-group Taylor Made Golf Co., Inc.
Germany
1 adidas Insurance & Risk Consultants GmbH 2) Herzogenaurach (Germany) EUR 26 directly 100
2 adidas Beteiligungsgesellschaft mbH 2) Herzogenaurach (Germany) EUR 391,990 directly 100
3 adidas CDC Immobilieninvest GmbH Herzogenaurach (Germany) EUR 11,806 12 100
4 adidas Verwaltungsgesellschaft mbH 3) Herzogenaurach (Germany) EUR 4,347 98 100
Europe (incl. Middle East and Africa)
5 adidas sport gmbh Cham (Switzerland) CHF 6,869 directly 100
6 adidas Austria GmbH Klagenfurt (Austria) EUR 6,271 directly 95.89
5 4.11
7 adidas France S.a.r.l. Landersheim (France) EUR 122,058 23 100
8 adidas International B.V. Amsterdam (Netherlands) EUR 6,689,379 directly 93.97
7 6.03
9 adidas International Trading B.V. Amsterdam (Netherlands) EUR 732,621 8 100
10 adidas International Marketing B.V. Amsterdam (Netherlands) EUR 48,335 8 100
11 adidas International Finance B.V. Amsterdam (Netherlands) EUR 13,610 8 100
12 adidas International Property Holding B.V. Amsterdam (Netherlands) EUR 60,126 109 100
13 adidas Infrastructure Holding B.V. Amsterdam (Netherlands) EUR 0 8 100
14 adidas Benelux B.V. Amsterdam (Netherlands) EUR 2,104 directly 100
15 Rockport (Europe) B.V. Amsterdam (Netherlands) USD 5,446 90 100
16 Hydra Ventures B.V. Amsterdam (Netherlands) EUR (4,038) 8 100
17 adidas (UK) Limited 6) Stockport (Great Britain) GBP 39,000 23 100
18 adidas (ILKLEY) Limited 6) 3) Stockport (Great Britain) GBP – 17 100
19 LARA SPORT (UK) Limited 6) 3) Stockport (Great Britain) GBP – 17 100
20 Sarragan (UK) Limited 6) 3) Stockport (Great Britain) GBP – 17 100
21 adidas Trefoil Trading (U.K.) Limited 6) 3) Stockport (Great Britain) GBP – 20 100
22 Three Stripes Limited 6) 3) Stockport (Great Britain) GBP – 17 50
18 50
23 Reebok International Limited 9) London (Great Britain) EUR 1,366,928,057 8 65.1
96 34.9
24 Trafford Park DC Limited London (Great Britain) GBP 351 13 100
25 RBK Holdings Limited 3) 9) London (Great Britain) GBP – 96 89
89 11
26 Reebok Sports Limited 3) London (Great Britain) USD – 23 100
27 J.W. Foster & Sons (Athletic Shoes) Limited 3) 9) London (Great Britain) GBP – 23 100
28 The Rockport Company Limited 3) 9) London (Great Britain) GBP – 23 100
29 Reebok Eastern Trading Limited 3) London (Great Britain) USD – 23 100
30 Reebok Pensions Management Limited 3) 9) London (Great Britain) GBP – 23 100
31 Reebok Europe Holdings London (Great Britain) GBP 25,570 23 100
32 Luta Limited 9) London (Great Britain) GBP – 23 100
33 Adams Golf, U.K. Ltd. 3) 11) London (Great Britain) GBP – 86 100
34 Taylor Made Golf Limited 4) Basingstoke (Great Britain) GBP (599) 8 100
35 Ashworth U.K. Ltd. 3) 4) Bristol (Great Britain) GBP – 34 100
36 adidas (Ireland) Limited Dublin (Ireland) EUR 2,485 8 100
37 adidas International Re Limited Dublin (Ireland) EUR 18,791 8 100
38 Reebok Ireland Limited 3) Dublin (Ireland) EUR 56 36 100
39 adidas Belgium NV Brussels (Belgium) EUR 2,763 14 100
40 Five Ten Europe NV 3) Wavre (Belgium) EUR (36) 99 100
41 adidas Espana S.A.U. Zaragoza (Spain) EUR 36,181 2 100
42 adidas Finance Spain S.A.U. Zaragoza (Spain) EUR 35,579 96 100
43 Global Merchandising, S.L. Madrid (Spain) EUR 1,102 8 100
44 adidas Italy S.p.A. Monza (Italy) EUR 42,942 8 100
45 adidas Portugal – Artigos de Desporto, S.A. Lisbon (Portugal) EUR 7,217 8 100

adidas Group / 2014 Annual Report
Consolidated Financial Statements
2492 0 1 4
Shareholdings
/ 04.10 /
.. Shareholdings of adidas AG, Herzogenaurach (at December 31, 2014) ATTACHMENT II
Company and domicile Currency Equity (currency unitsin thousands)
Share in capitalheld by 1)
in %
1) The number refers to the number of the company 2) Profit and loss transfer agreement 3) Companies with no active business 4) Sub-group Taylor Made Golf Limited5) Sub-group adidas India Private Ltd. 6) Sub-group adidas (UK) Limited 7) Sub-group Sports Licensed Division of the adidas Group, LLC 8) Sub-group Reebok-CCM Hockey, U.S., Inc. 9) Sub-group Reebok International Limited 10) Sub-group Reebok International Ltd. 11) Sub-group Taylor Made Golf Co., Inc.
46 adidas Business Services Lda. Maia (Portugal) EUR 551 8 98
directly 2
47 adidas Norge AS Lillestrom (Norway) NOK 24,782 directly 100
48 Reebok-CCM Hockey AS Gressvik (Norway) NOK 2,084 47 100
49 adidas Sverige AB Solna (Sweden) SEK 66,250 directly 100
50 adidas Finance Sverige AB Solna (Sweden) SEK 579,797 98 100
51 Reebok-CCM Hockey AB Solna (Sweden) SEK 88,306 49 100
52 adidas Suomi Oy Helsinki (Finland) EUR 1,625 8 100
53 Reebok-CCM Hockey Oy Espoo (Finland) EUR 8,386 8 100
54 adidas Danmark A/S Århus (Denmark) DKK 18,171 8 100
55 adidas CR s.r.o. Prague (Czech Republic) CZK 78,982 directly 100
56 adidas Budapest Kft. Budapest (Hungary) HUF 361,141 directly 100
57 adidas Bulgaria EAD Sofia (Bulgaria) BGN 12,279 directly 100
58 LLC ‘adidas, Ltd.’ Moscow (Russia) RUB 31,470,546 6 100
59 adidas Poland Sp.z o.o. Warsaw (Poland) PLN 37,727 directly 100
60 adidas Finance Poland S.A. Warsaw (Poland) PLN 96,022 96 100
61 adidas Romania S.R.L. Bucharest (Romania) RON 23,203 8 100
62 adidas Baltics SIA Riga (Latvia) EUR 1,602 8 100
63 adidas Slovakia s.r.o. Bratislava (Slovak Republic) EUR 2,168 directly 100
64 adidas Trgovina d.o.o. Ljubljana (Slovenia) EUR 375 directly 100
65 SC ‘adidas-Ukraine’ Kiev (Ukraine) UAH 618,389 directly 100
66 adidas LLP Almaty (Republic of Kazakhstan) KZT 2,821,072 directly 100
67 adidas Serbia d.o.o. New Belgrade (Serbia) RSD 104,173 8 100
68 adidas Croatia d.o.o. Zagreb (Croatia) HRK 26,844 8 100
69 adidas Hellas A.E. Athens (Greece) EUR 16,181 directly 100
70 adidas (Cyprus) Limited Nicosia (Cyprus) EUR (37) directly 100
71 adidas Spor Malzemeleri Satis ve Pazarlama A.S. Istanbul (Turkey) TRY 278,286 8 100
72 adidas Emerging Markets L.L.C (formerly: adidas Emerging Market L.L.C) Dubai (United Arab Emirates) USD 57,928 indirectly 51
7 49
73 adidas Emerging Markets FZE Dubai (United Arab Emirates) USD 71,572 8 100
74 adidas Levant Limited Dubai (United Arab Emirates) JOD 2,839 73 55
75 adidas Levant Limited – Jordan Amman (Jordan) JOD 2,443 74 100
76 adidas Imports & Exports Ltd. Cairo (Egypt) EGP 1,494 77 100
77 adidas Sporting Goods Ltd. Cairo (Egypt) EGP 88,914 8 90
9 10
78 adidas Egypt Ltd. 3) Cairo (Egypt) USD (1,831) directly 100
79 Reebok Israel Ltd. Holon (Israel) ILS 8,379 directly 100
80 Life Sport Ltd. Holon (Israel) ILS 94,487 8 51
81 adidas (South Africa) (Pty) Ltd. Cape Town (South Africa) ZAR 201,009 directly 100
North America
82 adidas North America, Inc. Portland, Oregon (USA) USD 4,683,668 8 100
83 adidas America, Inc. Portland, Oregon (USA) USD 107,760 82 100
84 adidas International, Inc. Portland, Oregon (USA) USD 65,054 82 100
85 adidas Team, Inc. 3) Portland, Oregon (USA) USD (1,013) 82 100
86 Taylor Made Golf Co., Inc. 11) Carlsbad, California (USA) USD 17,534 82 100
87 Ashworth, LLC. 3) 11) Carlsbad, California (USA) USD – 86 100
88 The Reebok Worldwide Trading Company, LLC Wilmington, Delaware (USA) USD 14,980 96 100
89 Reebok Securities Holdings LLC 10) Wilmington, Delaware (USA) USD – 96 100
90 The Rockport Company, LLC Wilmington, Delaware (USA) USD 34,586 96 100
91 Textronics, Inc. Wilmington, Delaware (USA) USD 11,025 84 100
92 Ashworth Acquisition Corp. 3) 11) Wilmington, Delaware (USA) USD – 87 100
93 Putter, LLC 3) 11) Montgomery, Alabama (USA) USD – 92 100

adidas Group / 2014 Annual Report
Consolidated Financial Statements
2502 0 1 4
Shareholdings
/ 04.10 /
.. / Shareholdings of adidas AG, Herzogenaurach (at December 31, 2014) ATTACHMENT II
Company and domicile Currency Equity (currency unitsin thousands)
Share in capitalheld by 1)
in %
1) The number refers to the number of the company 2) Profit and loss transfer agreement 3) Companies with no active business 4) Sub-group Taylor Made Golf Limited5) Sub-group adidas India Private Ltd. 6) Sub-group adidas (UK) Limited 7) Sub-group Sports Licensed Division of the adidas Group, LLC 8) Sub-group Reebok-CCM Hockey, U.S., Inc. 9) Sub-group Reebok International Limited 10) Sub-group Reebok International Ltd. 11) Sub-group Taylor Made Golf Co., Inc.
94 Onfield Apparel Group, LLC 3) 7) Dover, Delaware (USA) USD – 96 99
95 1
95 Reebok Onfield, LLC 3) 7) Dover, Delaware (USA) USD – 96 100
96 Reebok International Ltd. 10) Canton, Massachusetts (USA) USD (1,102,053) 82 100
97 Sports Licensed Division of the adidas Group, LLC 7) Boston, Massachusetts (USA) USD 93,344 96 99
89 1
98 Reebok-CCM Hockey U.S., Inc. 8) Montpelier, Vermont (USA) USD 58,910 96 100
99 Stone Age Equipment, Inc. Redlands, California (USA) USD 16,117 83 100
100 Spartanburg DC, Inc. Spartanburg, South Carolina (USA) USD 9,783 83 100
101 adidas Canada Ltd. Woodbridge, Ontario (Canada) CAD 110,327 directly 100
102 Sport Maska Inc. New Brunswick (Canada) CAD 25,955 8 100
Asia
103 adidas Sourcing Limited Hong Kong (China) USD 369,462 9 100
104 adidas Services Limited Hong Kong (China) USD 11,002 8 100
105 adidas Hong Kong Ltd. Hong Kong (China) HKD 266,648 directly 100
106 Smedley Industries (Hong Kong) Limited 3) 8) Hong Kong (China) HKD – 98 100
107 Reebok Trading (Far East) Limited Hong Kong (China) USD 31,083 96 100
108 adidas (Suzhou) Co. Ltd. Suzhou (China) CNY 222,947 2 100
109 adidas Sports (China) Co. Ltd. Suzhou (China) CNY 6,639,121 2 100
110 adidas (China) Ltd. Shanghai (China) CNY 304,063 8 100
111 Zhuhai adidas Technical Services Limited Zhuhai (China) CNY 18,288 103 100
112 adidas Logistics (Tianjin) Co., Ltd. Tianjin (China) CNY 125,589 12 100
113 adidas Business Services (Dalian) Limited Dalian (China) CNY 1,182 8 100
114 adidas Japan K.K. Tokyo (Japan) JPY 9,523,984 23 100
115 Taylor Made Golf Co., Ltd. Tokyo (Japan) JPY 6,231,088 23 100
116 Adams Golf Japan, Inc. 3) 11) Tokyo (Japan) JPY – 86 100
117 adidas Korea Ltd. Seoul (Korea) KRW 196,194,050 directly 100
118 Taylor Made Korea Ltd. Seoul (Korea) KRW 11,882,870 directly 100
119 adidas Korea Technical Services Limited Pusan (Korea) KRW 3,500,265 103 100
120 adidas India Private Ltd. 5) New Delhi (India) INR 4,703,178 directly 10.68
8 89.32
121 adidas India Marketing Pvt. Ltd. 5) New Delhi (India) INR – 120 98.99
8 1.01
122 adidas Technical Services Pvt. Ltd. New Delhi (India) USD 3,313 103 100
123 Reebok India Company New Delhi (India) INR (4,934,579) 133 93.15
124 PT adidas Indonesia Jakarta (Indonesia) IDR 142,016,983 8 99
directly 1
125 adidas (Malaysia) Sdn. Bhd. Petaling Jaya (Malaysia) MYR 43,190 directly 60
8 40

adidas Group / 2014 Annual Report
Consolidated Financial Statements
2512 0 1 4
Shareholdings
/ 04.10 /
.. Shareholdings of adidas AG, Herzogenaurach (at December 31, 2014) ATTACHMENT II
Company and domicile Currency Equity (currency unitsin thousands)
Share in capitalheld by 1)
in %
126 adidas Philippines Inc. Pasig City (Philippines) PHP 419,539 directly 100
127 adidas Singapore Pte. Ltd. Singapore (Singapore) SGD 14,722 directly 100
128 adidas Taiwan Limited Taipei (Taiwan) TWD 1,000,074 8 100
129 adidas (Thailand) Co., Ltd. Bangkok (Thailand) THB 725,949 directly 100
130 adidas Australia Pty. Limited Mulgrave (Australia) AUD 68,586 8 100
131 adidas New Zealand Limited Auckland (New Zealand) NZD 11,358 directly 100
132 adidas Vietnam Company Limited Ho Chi Minh City (Vietnam) VND (42,025,995) 8 100
133 Reebok (Mauritius) Company Limited Port Louis (Mauritius) USD 2,194 96 99
88 1
Latin America
134 adidas Argentina S.A. Buenos Aires (Argentina) ARS 777,325 2 51.22
8 48.78
135 Reebok Argentina S.A. Buenos Aires (Argentina) ARS 41,239 9 73.86
8 26.13
136 ASPA do Brasil Ltda. 3) São Paulo (Brazil) BRL 169 103 100
137 adidas do Brasil Ltda. São Paulo (Brazil) BRL 304,533 2 100
138 adidas Franchise Brasil Servicos Ltda. São Paulo (Brazil) BRL 2,488 137 100
139 Reebok Produtos Esportivos Brasil Ltda. Jundiai (Brazil) BRL (57,530) 8 99.99
140 adidas Chile Limitada Santiago de Chile (Chile) CLP 79,524,717 directly 99
1 1
141 adidas Colombia Ltda. Bogotá (Colombia) COP 108,912 directly 100
142 adidas Peru S.A.C. Lima (Peru) PEN 46,835 directly 99.21
140 0.79
143 adidas de Mexico, S.A. de C.V. Mexico City (Mexico) MXN (86,781) directly 100
144 adidas Industrial, S.A. de C.V. Mexico City (Mexico) MXN 235,507 directly 100
145 Reebok de Mexico, S.A. de C.V. 3) Mexico City (Mexico) MXN (428,451) directly 100
146 adidas Latin America, S.A. Panama City (Panama) USD (21,319) directly 100
147 Concept Sport, S.A. Panama City (Panama) USD 789 8 100
148 adidas Market LAM, S.A. 3) Panama City (Panama) USD 0 8 100
149 3 Stripes S.A. (adidas Uruguay) 3) Montevideo (Uruguay) UYU (436) directly 100
150 Tafibal S.A. Montevideo (Uruguay) UYU 6,559 directly 100
151 Raelit S.A. Montevideo (Uruguay) UYU 8,726 directly 100
152 Reebok Central America S.A. 10) San Pedro Sula (Honduras) HNL – 96 99.6
88 0.4
153 adidas Corporation de Venezuela, S.A. 3) Caracas (Venezuela) VEF (17) directly 100
154 adisport Corporation San Juan (Puerto Rico) USD (1,536) 8 100
1) The number refers to the number of the company 2) Profit and loss transfer agreement 3) Companies with no active business 4) Sub-group Taylor Made Golf Limited5) Sub-group adidas India Private Ltd. 6) Sub-group adidas (UK) Limited 7) Sub-group Sports Licensed Division of the adidas Group, LLC 8) Sub-group Reebok-CCM Hockey, U.S., Inc. 9) Sub-group Reebok International Limited 10) Sub-group Reebok International Ltd. 11) Sub-group Taylor Made Golf Co., Inc.


05
A
DD
ITIO
NA
L IN
FOR
MAT
ION
05.1
05.2
05.3
05.4
Ten-Year O ver v iew 25 4Glos s ar y 25 8Decl ar at ion of Suppor t 261F inanc ia l C alendar 262
ADDITIONAL
I N F O R M A T I O N

1
adidas Group / 2014 Annual Report
Additional Information
2542 0 1 4
/ 05.1 /
Ten-Year Overview
Ten-Year Overview
Rounding differences may arise in percentages and totals.1) 2011 restated according to IAS 8 in the 2012 consolidated financial statements.2) Including Reebok, Rockport and Reebok-CCM Hockey from February 1, 2006 onwards. 3) 2014 and 2013 reflect continuing operations as a result of the planned divestiture of the Rockport business.4) 2005 reflects continuing operations as a result of the divestiture of the Salomon business segment.5) 2014 excluding goodwill impairment of € 78 million.6) 2013 excluding goodwill impairment of € 52 million.7) 2012 excluding goodwill impairment of € 265 million.8) Includes income from continuing and discontinued operations.9) 2014 and 2013 net sales for Rockport are reflected within discontinued operations.10) Figures adjusted for 1: 4 share split conducted on June 6, 2006.11) Subject to Annual General Meeting approval.
.. / Ten-Year Overview
2014 2013 2012 2011 1) 2010 2009 2008 2007 2006 2) 2005
Income Statement Data (€ in millions)
Net sales 3) 4) 14,534 14,203 14,883 13,322 11,990 10,381 10,799 10,299 10,084 6,636
Gross profit 3) 4) 6,924 7,001 7,103 6,329 5,730 4,712 5,256 4,882 4,495 3,197
Royalty and commission income 3) 4) 102 103 105 93 100 86 89 102 90 47
Other operating income 3) 4) 138 142 127 98 110 100 103 80 55 36
Other operating expenses 3) 4) 6,203 6,013 6,150 5,567 5,046 4,390 4,378 4,115 3,759 2,573
EBITDA 3) 4) 1,283 1,496 1,445 1,199 1,159 780 1,280 1,165 1,078 806
Operating profit 3) 4) 5) 6) 7) 961 1,233 1,185 953 894 508 1,070 949 881 707
Net financial result 4) (48) (68) (69) (84) (88) (150) (166) (135) (158) (52)
Income before taxes 3) 4) 5) 6) 7) 913 1,165 1,116 869 806 358 904 815 723 655
Income taxes 3) 4) 271 340 327 261 238 113 260 260 227 221
Net income attributable to non-controlling interests 4) 6 3 (2) (5) (1) 0 (2) (4) (13) (8)
Net income attributable to shareholders 5) 6) 7) 8) 568 839 791 613 567 245 642 551 483 383
Income Statement Ratios
Gross margin 3) 4) 47.6% 49.3% 47.7% 47.5% 47.8% 45.4% 48.7% 47.4% 44.6% 48.2%
Operating margin 3) 4) 5) 6) 7) 6.6% 8.7% 8.0% 7.2% 7.5% 4.9% 9.9% 9.2% 8.7% 10.7%
Interest coverage 3) 4) 19.3 24.0 14.6 12.2 10.1 3.9 7.4 6.8 5.9 18.4
Effective tax rate 3) 4) 5) 6) 7) 29.7% 29.2% 29.3% 30.0% 29.5% 31.5% 28.8% 31.8% 31.4% 33.7%
Net income attributable to shareholders in % of net sales 5) 6) 7) 8) 3.9% 5.9% 5.3% 4.6% 4.7% 2.4% 5.9% 5.4% 4.8% 5.8%
Net Sales by Brand (€ in millions)
adidas 11,774 11,059 11,344 9,867 8,714 7,520 7,821 7,113 6,626 5,861
Reebok 1,578 1,599 1,667 1,940 1,913 1,603 1,717 1,831 1,979 –
TaylorMade-adidas Golf 913 1,285 1,344 1,044 909 831 812 804 856 709
Rockport 9) 283 289 285 261 252 232 243 291 293 –
Reebok-CCM Hockey 269 260 243 210 200 177 188 210 202 –
Net Sales by Product Category (€ in millions)
Footwear 3) 4) 6,658 6,587 6,922 6,242 5,389 4,642 4,919 4,751 4,733 2,978
Apparel 3) 4) 6,279 5,811 6,290 5,733 5,380 4,663 4,775 4,426 4,105 2,798
Hardware 3) 4) 1,597 1,806 1,671 1,347 1,221 1,076 1,105 1,121 1,246 860
Balance Sheet Data (€ in millions)
Total assets 12,417 11,599 11,651 11,237 10,618 8,875 9,533 8,325 8,379 5,750
Inventories 2,526 2,634 2,486 2,502 2,119 1,471 1,995 1,629 1,607 1,230
Receivables and other current assets 2,861 2,583 2,444 2,431 2,324 2,038 2,523 2,048 1,913 1,551
Working capital 2,970 2,125 2,504 1,990 1,972 1,649 1,290 1,522 1,733 2,644
Net cash/(net borrowings) (185) 295 448 90 (221) (917) (2,189) (1,766) (2,231) 551
Shareholders’ equity 5,624 5,489 5,304 5,137 4,616 3,771 3,386 3,023 2,828 2,684

adidas Group / 2014 Annual Report
Additional Information
2552 0 1 4
/ 05.1 /
Ten-Year Overview
.. / Ten-Year Overview
2014 2013 2012 2011 1) 2010 2009 2008 2007 2006 2) 2005
Income Statement Data (€ in millions)
Net sales 3) 4) 14,534 14,203 14,883 13,322 11,990 10,381 10,799 10,299 10,084 6,636
Gross profit 3) 4) 6,924 7,001 7,103 6,329 5,730 4,712 5,256 4,882 4,495 3,197
Royalty and commission income 3) 4) 102 103 105 93 100 86 89 102 90 47
Other operating income 3) 4) 138 142 127 98 110 100 103 80 55 36
Other operating expenses 3) 4) 6,203 6,013 6,150 5,567 5,046 4,390 4,378 4,115 3,759 2,573
EBITDA 3) 4) 1,283 1,496 1,445 1,199 1,159 780 1,280 1,165 1,078 806
Operating profit 3) 4) 5) 6) 7) 961 1,233 1,185 953 894 508 1,070 949 881 707
Net financial result 4) (48) (68) (69) (84) (88) (150) (166) (135) (158) (52)
Income before taxes 3) 4) 5) 6) 7) 913 1,165 1,116 869 806 358 904 815 723 655
Income taxes 3) 4) 271 340 327 261 238 113 260 260 227 221
Net income attributable to non-controlling interests 4) 6 3 (2) (5) (1) 0 (2) (4) (13) (8)
Net income attributable to shareholders 5) 6) 7) 8) 568 839 791 613 567 245 642 551 483 383
Income Statement Ratios
Gross margin 3) 4) 47.6% 49.3% 47.7% 47.5% 47.8% 45.4% 48.7% 47.4% 44.6% 48.2%
Operating margin 3) 4) 5) 6) 7) 6.6% 8.7% 8.0% 7.2% 7.5% 4.9% 9.9% 9.2% 8.7% 10.7%
Interest coverage 3) 4) 19.3 24.0 14.6 12.2 10.1 3.9 7.4 6.8 5.9 18.4
Effective tax rate 3) 4) 5) 6) 7) 29.7% 29.2% 29.3% 30.0% 29.5% 31.5% 28.8% 31.8% 31.4% 33.7%
Net income attributable to shareholders in % of net sales 5) 6) 7) 8) 3.9% 5.9% 5.3% 4.6% 4.7% 2.4% 5.9% 5.4% 4.8% 5.8%
Net Sales by Brand (€ in millions)
adidas 11,774 11,059 11,344 9,867 8,714 7,520 7,821 7,113 6,626 5,861
Reebok 1,578 1,599 1,667 1,940 1,913 1,603 1,717 1,831 1,979 –
TaylorMade-adidas Golf 913 1,285 1,344 1,044 909 831 812 804 856 709
Rockport 9) 283 289 285 261 252 232 243 291 293 –
Reebok-CCM Hockey 269 260 243 210 200 177 188 210 202 –
Net Sales by Product Category (€ in millions)
Footwear 3) 4) 6,658 6,587 6,922 6,242 5,389 4,642 4,919 4,751 4,733 2,978
Apparel 3) 4) 6,279 5,811 6,290 5,733 5,380 4,663 4,775 4,426 4,105 2,798
Hardware 3) 4) 1,597 1,806 1,671 1,347 1,221 1,076 1,105 1,121 1,246 860
Balance Sheet Data (€ in millions)
Total assets 12,417 11,599 11,651 11,237 10,618 8,875 9,533 8,325 8,379 5,750
Inventories 2,526 2,634 2,486 2,502 2,119 1,471 1,995 1,629 1,607 1,230
Receivables and other current assets 2,861 2,583 2,444 2,431 2,324 2,038 2,523 2,048 1,913 1,551
Working capital 2,970 2,125 2,504 1,990 1,972 1,649 1,290 1,522 1,733 2,644
Net cash/(net borrowings) (185) 295 448 90 (221) (917) (2,189) (1,766) (2,231) 551
Shareholders’ equity 5,624 5,489 5,304 5,137 4,616 3,771 3,386 3,023 2,828 2,684

adidas Group / 2014 Annual Report
Additional Information
2562 0 1 4
/ 05.1 /
Ten-Year Overview
Rounding differences may arise in percentages and totals.1) 2011 restated according to IAS 8 in the 2012 consolidated financial statements.2) Including Reebok, Rockport and Reebok-CCM Hockey from February 1, 2006 onwards. 3) 2014 and 2013 reflect continuing operations as a result of the planned divestiture of the Rockport business.4) 2005 reflects continuing operations as a result of the divestiture of the Salomon business segment.5) 2014 excluding goodwill impairment of € 78 million.6) 2013 excluding goodwill impairment of € 52 million.7) 2012 excluding goodwill impairment of € 265 million.8) Includes income from continuing and discontinued operations.9) 2014 and 2013 net sales for Rockport are reflected within discontinued operations.10) Figures adjusted for 1: 4 share split conducted on June 6, 2006.11) Subject to Annual General Meeting approval.
.. / Ten-Year Overview (continued)
2014 2013 2012 2011 1) 2010 2009 2008 2007 2006 2) 2005
Balance Sheet Ratios
Net borrowings/EBITDA 3) 4) 0.1 (0.2) (0.3) (0.1) 0.2 1.2 1.7 1.5 2.1 (0.7)
Average operating working capital in % of net sales 3) 22.4% 21.3% 20.0% 20.4% 20.8% 24.3% 24.5% 25.2% 25.8% 26.0%
Financial leverage 3.3% (5.4%) (8.5%) (1.8%) 4.8% 24.3% 64.6% 58.4% 78.9% (20.5%)
Equity ratio 45.3% 47.3% 45.5% 45.7% 43.5% 42.5% 35.5% 36.3% 33.8% 46.7%
Equity-to-fixed-assets ratio 110.9% 115.8% 111.1% 104.6% 97.4% 85.9% 73.6% 72.2% 63.5% 194.0%
Asset coverage I 158.7% 145.0% 152.7% 140.7% 141.5% 137.4% 127.7% 136.1% 138.7% 284.1%
Asset coverage II 105.9% 93.2% 100.4% 93.2% 97.7% 102.9% 89.1% 98.0% 102.0% 150.4%
Fixed asset intensity of investments 40.8% 40.9% 41.0% 43.7% 44.6% 49.5% 48.2% 50.3% 53.2% 24.1%
Current asset intensity of investments 59.2% 59.1% 59.0% 56.3% 55.4% 50.5% 51.8% 49.7% 46.8% 75.9%
Liquidity I 38.6% 34.4% 44.3% 31.6% 35.5% 30.0% 10.5% 14.5% 15.8% 92.0%
Liquidity II 83.0% 72.6% 82.9% 68.3% 78.2% 80.4% 55.1% 70.3% 80.4% 148.0%
Liquidity III 140.7% 128.3% 139.7% 126.0% 132.4% 132.2% 109.8% 132.6% 153.7% 219.4%
Working capital turnover 3) 4.9 6.7 5.9 6.7 6.1 6.3 8.4 6.8 5.8 2.6
Return on equity 8) 8.7% 14.3% 9.9% 11.9% 12.3% 6.5% 18.9% 18.2% 17.1% 14.3%
Return on capital employed 8) 13.8% 23.6% 19.3% 19.9% 20.2% 11.3% 19.8% 20.2% 17.6% 49.3%
Data Per Share 10)
Share price at year-end (in €) 57.62 92.64 67.33 50.26 48.89 37.77 27.14 51.26 37.73 40.00
Basic earnings 5) 6) 7) 8) (in €) 2.72 4.01 3.78 2.93 2.71 1.25 3.25 2.71 2.37 2.05
Diluted earnings 5) 6) 7) 8) (in €) 2.72 4.01 3.78 2.93 2.71 1.22 3.07 2.57 2.25 1.93
Price/earnings ratio at year-end 5) 6) 7) 8) 21.2 23.1 17.8 17.1 18.0 31.0 8.8 19.9 16.8 20.7
Market capitalisation at year-end (€ in millions) 11,773 19,382 14,087 10,515 10,229 7,902 5,252 10,438 7,679 8,122
Net cash generated from operating activities 8) (in €) 3.36 3.03 4.50 3.86 4.28 6.11 2.52 3.83 3.74 1.88
Dividend (in €) 1.50 11) 1.50 1.35 1.00 0.80 0.35 0.50 0.50 0.42 0.33
Dividend payout ratio 5) 6) 7) 8) (in %) 53.9 37.4 35.7 34.1 29.5 29.8 15.1 18.0 17.7 17.2
Number of shares outstanding at year-end (in thousands) 204,327 209,216 209,216 209,216 209,216 209,216 193,516 203,629 203,537 203,047
Employees
Number of employees at year-end 3) 4) 53,731 49,808 46,306 46,824 42,541 39,596 38,982 31,344 26,376 15,935
Personnel expenses 3) 4) (€ in millions) 1,842 1,833 1,872 1,646 1,521 1,352 1,283 1,186 1,087 706

adidas Group / 2014 Annual Report
Additional Information
2572 0 1 4
/ 05.1 /
Ten-Year Overview
.. / Ten-Year Overview (continued)
2014 2013 2012 2011 1) 2010 2009 2008 2007 2006 2) 2005
Balance Sheet Ratios
Net borrowings/EBITDA 3) 4) 0.1 (0.2) (0.3) (0.1) 0.2 1.2 1.7 1.5 2.1 (0.7)
Average operating working capital in % of net sales 3) 22.4% 21.3% 20.0% 20.4% 20.8% 24.3% 24.5% 25.2% 25.8% 26.0%
Financial leverage 3.3% (5.4%) (8.5%) (1.8%) 4.8% 24.3% 64.6% 58.4% 78.9% (20.5%)
Equity ratio 45.3% 47.3% 45.5% 45.7% 43.5% 42.5% 35.5% 36.3% 33.8% 46.7%
Equity-to-fixed-assets ratio 110.9% 115.8% 111.1% 104.6% 97.4% 85.9% 73.6% 72.2% 63.5% 194.0%
Asset coverage I 158.7% 145.0% 152.7% 140.7% 141.5% 137.4% 127.7% 136.1% 138.7% 284.1%
Asset coverage II 105.9% 93.2% 100.4% 93.2% 97.7% 102.9% 89.1% 98.0% 102.0% 150.4%
Fixed asset intensity of investments 40.8% 40.9% 41.0% 43.7% 44.6% 49.5% 48.2% 50.3% 53.2% 24.1%
Current asset intensity of investments 59.2% 59.1% 59.0% 56.3% 55.4% 50.5% 51.8% 49.7% 46.8% 75.9%
Liquidity I 38.6% 34.4% 44.3% 31.6% 35.5% 30.0% 10.5% 14.5% 15.8% 92.0%
Liquidity II 83.0% 72.6% 82.9% 68.3% 78.2% 80.4% 55.1% 70.3% 80.4% 148.0%
Liquidity III 140.7% 128.3% 139.7% 126.0% 132.4% 132.2% 109.8% 132.6% 153.7% 219.4%
Working capital turnover 3) 4.9 6.7 5.9 6.7 6.1 6.3 8.4 6.8 5.8 2.6
Return on equity 8) 8.7% 14.3% 9.9% 11.9% 12.3% 6.5% 18.9% 18.2% 17.1% 14.3%
Return on capital employed 8) 13.8% 23.6% 19.3% 19.9% 20.2% 11.3% 19.8% 20.2% 17.6% 49.3%
Data Per Share 10)
Share price at year-end (in €) 57.62 92.64 67.33 50.26 48.89 37.77 27.14 51.26 37.73 40.00
Basic earnings 5) 6) 7) 8) (in €) 2.72 4.01 3.78 2.93 2.71 1.25 3.25 2.71 2.37 2.05
Diluted earnings 5) 6) 7) 8) (in €) 2.72 4.01 3.78 2.93 2.71 1.22 3.07 2.57 2.25 1.93
Price/earnings ratio at year-end 5) 6) 7) 8) 21.2 23.1 17.8 17.1 18.0 31.0 8.8 19.9 16.8 20.7
Market capitalisation at year-end (€ in millions) 11,773 19,382 14,087 10,515 10,229 7,902 5,252 10,438 7,679 8,122
Net cash generated from operating activities 8) (in €) 3.36 3.03 4.50 3.86 4.28 6.11 2.52 3.83 3.74 1.88
Dividend (in €) 1.50 11) 1.50 1.35 1.00 0.80 0.35 0.50 0.50 0.42 0.33
Dividend payout ratio 5) 6) 7) 8) (in %) 53.9 37.4 35.7 34.1 29.5 29.8 15.1 18.0 17.7 17.2
Number of shares outstanding at year-end (in thousands) 204,327 209,216 209,216 209,216 209,216 209,216 193,516 203,629 203,537 203,047
Employees
Number of employees at year-end 3) 4) 53,731 49,808 46,306 46,824 42,541 39,596 38,982 31,344 26,376 15,935
Personnel expenses 3) 4) (€ in millions) 1,842 1,833 1,872 1,646 1,521 1,352 1,283 1,186 1,087 706

2
adidas Group / 2014 Annual Report
Additional Information
2582 0 1 4
Glossary
/ 05.2 /
Glossary
/ B
Backlogs Also called order backlogs. The value of orders
received for future delivery. Most retailers’ orders
are received six to nine months in advance.
/ C
Capital expenditure Total cash expenditure used for the purchase
of tangible and intangible assets, excluding
acquisitions and finance leases.
Cash pooling A cash management technique for physical
concentration of cash. Cash pooling allows the
adidas Group to combine credit and debit positions
from various accounts and several subsidiaries into
one central account. This technique supports our
in-house bank concept where advantages are taken
of any surplus funds of subsidiaries to cover cash
requirements of other subsidiaries, thus reducing
external financing needs and optimising our net
interest expenses.
Comparable (comp) store sales Sales generated in stores which have been open
for the entire prior financial year and are currently
operating. Remodelled stores are included if
the store format and store size have remained
unchanged. Comparable store sales therefore
show the organic growth of the Retail segment
and do not include sales generated from new store
openings.
Concession corners Retail space that is fully operated by one brand of
the adidas Group and is part of a larger sales area
operated by a retail partner.
Controlled space Includes own-retail business, mono-branded
franchise stores, shop-in-shops, joint ventures with
retail partners and co-branded stores. Controlled
space offers a high level of brand control and
ensures optimal product offering and presentation
according to brand requirements.
Conversion rate A key ratio in retail business describing the number
of buying customers compared to those who
entered the store without buying something; i.e.
a 25% conversion rate means that 100 persons
entered a store with 25 of them buying something.
/ D
DryDye A fabric dyeing technology that uses pressurised
carbon dioxide to inject dye into fabric instead
of water, which is the traditional medium for
fabric dyeing. This process saves roughly 25
litres of water for a T-shirt and reduces energy
and chemical use by approximately 50%. The
technology was developed in cooperation between
adidas and the Thailand-based Yeh Group.
/ E
Emerging markets Developing countries showing potential for growth
in both economic strength and private wealth in the
future. For the adidas Group, emerging markets are
the developing countries of Asia, Eastern Europe,
Latin America and Africa.
/ F
Financial leverage Ratio reflecting the role of borrowings within the
financing structure of a company.
Financial leverage = (net borrowings / shareholders’
equity) × 100
Free cash flow Cash that is generated by a company’s operating
activities after the deduction of net investments
and other cash expenses such as taxes and interest
from the operating profit.
Free cash flow = operating profit +/– change in
operating working capital +/– net investments (capital
expenditure less depreciation and amortisation) +/–
financial result and income taxes
/ G
German Co-Determination Act (Mitbestimmungsgesetz – MitbestG)An act that governs the form of co-determination
of employees in corporations employing more than
2,000 employees. It stipulates, among other things,
that such a corporation’s Supervisory Board must
be composed of an equal number of employee and
shareholder representatives.
Goodwill Intangible asset that quantifies the price that a
buyer of a company has paid for the reputation,
know-how and market position of the acquired
company. Goodwill is the excess of the amount paid
over the fair value of the net assets acquired at the
purchase date. It is stated at cost and tested for
impairment annually or on such other occasions
that events or changes in circumstances indicate
that it might be impaired.
Green grass retailers Golf distribution channel. Small golf specialty
shops typically located at a golf course.

adidas Group / 2014 Annual Report
Additional Information
2592 0 1 4
Glossary
/ 05.2 /
/ H
Hardware A product category which comprises equipment
that is used rather than worn by the consumer,
such as bags, balls, fitness equipment, golf clubs
and hockey sticks.
/ L
LGBT An acronym that stands for lesbian, gay, bisexual
and transgender.
Licensed apparel Apparel products which are produced and
marketed under a licence agreement. The adidas
Group has licence agreements with several
associations (e.g. FIFA, UEFA), leagues (e.g. NBA,
NHL), teams (e.g. Real Madrid, AC Milan) and
universities (e.g. UCLA, Notre Dame).
Licensees Companies that have the authorisation to use the
name of a brand or business for the production and
sale of products. For example, for adidas, licensed
products include cosmetics, watches and eyewear,
for Reebok, fitness equipment.
Liquidity I, II, III The liquidity ratio indicates how quickly a company
can liquidate its assets to pay for current liabilities.
Liquidity I: [(Cash + short-term financial assets) /
current liabilities] × 100
Liquidity II: [(Cash + short-term financial assets +
accounts receivable) / current liabilities] × 100
Liquidity III: [(Cash + short-term financial assets +
accounts receivable + inventories) / current liabilities]
× 100
/ M
Marketing working budget (MWB) Promotion and communication spending including
sponsorship contracts with teams and individual
athletes, as well as advertising, events and other
communication activities, but excluding marketing
overhead expenses. As marketing working budget
expenses are not distribution channel specific, they
are not allocated to the adidas Group’s operating
segments.
Mature markets Developed countries which have highly
industrialised economies, high income levels and
in which most people have a high standard of living.
For the adidas Group, mature markets are the
high-income countries of Western Europe, North
America and Japan.
/ N
Net cash/Net borrowings Net cash is when the sum of cash and short-term
financial assets exceeds gross borrowings. Net
borrowings is the portion of gross borrowings
not covered by the sum of cash and short-term
financial assets.
Net cash/Net borrowings = cash and cash equivalents
+ short-term financial assets – short-term
borrowings – long-term borrowings
Non-controlling interests Part of net income or equity which is not
attributable to the shareholders of the reporting
company as it relates to outside ownership
interests in subsidiaries that are consolidated
with the parent company for financial reporting
purposes.
/ O
Omni-channel sales approach Describes the ambition to achieve a globally
consistent product offer, brand communication,
availability and service across all sales channels
(Wholesale, Retail and eCommerce) and consumer
touch points.
Operating cash flow Comprises operating profit, change in operating
working capital and net investments.
Operating cash flow = operating profit +/– change in
operating working capital +/– net investments (capital
expenditure less depreciation and amortisation)
Operating overheads Expenses which are not directly attributable to
the products or services sold, such as costs for
distribution, marketing overhead costs, logistics,
research and development, as well as general and
administrative costs, but not including costs for
promotion, advertising and communication.
Operating working capitalA company’s short-term disposable capital which
is used to finance its day-to-day business. In
comparison to working capital, operating working
capital does not include non-operational items
such as financial assets and taxes.
Operating working capital = accounts receivable +
inventories – accounts payable
/ P
Performance business In the sporting goods industry, performance
business relates to technical footwear and apparel
used primarily in doing sports.
Price points Specific selling prices, normally using
‘psychological’ numbers, e.g. a product price of
US $ 99.99 instead of US $ 100.

adidas Group / 2014 Annual Report
Additional Information
2602 0 1 4
Glossary
/ 05.2 /
Profit protection A business activity (mainly found within retail
companies) designed to reduce preventable losses
caused, for example, by theft, fraud, vandalism,
waste, abuse, misconduct or failure by employees
to follow existing policies or procedures.
Promotion partnerships Partnerships with events, associations, leagues,
clubs and individual athletes. In exchange for the
services of promoting the adidas Group, the party
is provided with products and/or cash and/or
promotional materials.
/ R
Rolling forecast A projection about the future that is updated at
regular intervals, keeping the forecasting period
constant (e.g. twelve months).
/ S
Sales working budget Expenditures that relate to advertising and
promotion initiatives at the point of sale as well
as to store fittings and furniture. As sales working
budget expenses are channel-specific, they
are allocated to the adidas Group’s operating
segments.
Segment Also called business segment. Units within a
company that have profit and loss responsibility.
The adidas Group is currently divided into six
business segments: Wholesale, Retail, TaylorMade-
adidas Golf, Rockport, Reebok-CCM Hockey and
Other Centrally Managed Brands.
Share turnover The total value of all shares traded in the share
price currency over a specific period of time
(normally daily). It is calculated by multiplying the
number of shares traded by the respective price.
Signature collection A collection which is developed in close
collaboration with top athletes and personalities,
bearing the signature, logo and/or name of the
athlete. The offering can be either a single product
or a broader product family (footwear, apparel and
hardware).
Single-sourcing model Supply chain activities limited to one specific
supplier. Due to the dependency on only one
supplier, the adidas Group can face disadvantages
during the sourcing process.
/ T
Top and bottom line A company’s bottom line is its net income
attributable to shareholders. More specifically,
the bottom line is a company’s income after all
expenses have been deducted from revenues. The
top line refers to a company’s sales or revenues.
Top-down, bottom-up A specific concept for information and knowledge
processing. In a first step, information and
empowerment of management decisions is
delegated from top to bottom. After going into more
detail on the bottom level, the final information and
decision are then transported back to the top.
Trend scouting Identification and commercialisation of future
trends, particularly lifestyle trends.
/ V
Vertical retailer A retail company that (vertically) controls the entire
design, production and distribution processes of its
products.
Visual merchandising Activity of promoting the sale of goods, especially
by their presentation at the point of sale. This
includes combining products, environments and
spaces into a stimulating and engaging display to
encourage the sale of a product or service.
VirtualisationComputer technology enabling physical product
samples to be replaced by digital, virtual product
samples in the footwear and apparel development
process, thus reducing the volume of physical
samples produced.

3
adidas Group / 2014 Annual Report
Additional Information
2612 0 1 4
Declaration of Support
/ 05.3 /
Declaration of Support
adidas (China) Ltd., Shanghai, Chinaadidas (Cyprus) Limited, Nicosia, Cyprusadidas (Ireland) Limited, Dublin, Irelandadidas (Malaysia) Sdn. Bhd., Petaling Jaya,
Malaysiaadidas (South Africa) (Pty) Ltd., Cape Town,
South Africaadidas (Suzhou) Co. Ltd., Suzhou, Chinaadidas (Thailand) Co., Ltd., Bangkok, Thailandadidas (UK) Limited, Stockport, Great Britainadidas America, Inc., Portland, Oregon, USAadidas Argentina S.A., Buenos Aires, Argentinaadidas Australia Pty. Limited, Mulgrave, Australiaadidas Austria GmbH, Klagenfurt, Austriaadidas Baltics SIA, Riga, Latviaadidas Belgium N.V., Brussels, Belgiumadidas Benelux B.V., Amsterdam, Netherlandsadidas Budapest Kft., Budapest, Hungaryadidas Bulgaria EAD, Sofia, Bulgariaadidas Business Services (Dalian) Limited,
Dalian, Chinaadidas Business Services Lda., Maia, Portugaladidas Canada Ltd., Woodbridge, Ontario, Canadaadidas CDC Immobilieninvest GmbH,
Herzogenaurach, Germanyadidas Chile Limitada, Santiago de Chile, Chileadidas Colombia Ltda., Bogotá, Colombiaadidas CR s.r.o., Prague, Czech Republicadidas Croatia d.o.o., Zagreb, Croatiaadidas Danmark A/S, Århus, Denmarkadidas de Mexico, S.A. de C.V., Mexico City, Mexicoadidas do Brasil Ltda., São Paulo, Braziladidas Emerging Markets FZE, Dubai,
United Arab Emiratesadidas Emerging Markets L.L.C., Dubai,
United Arab Emiratesadidas Espana S.A.U, Zaragoza, Spainadidas France S.a.r.l., Landersheim, Franceadidas Hellas A.E., Athens, Greeceadidas Hong Kong Ltd., Hong Kong, Chinaadidas Imports & Exports Ltd., Cairo, Egyptadidas India Marketing Pvt. Ltd., New Delhi, India
adidas Industrial, S.A. de C.V., Mexico City, Mexicoadidas Insurance & Risk Consultants GmbH,
Herzogenaurach, Germanyadidas International B.V., Amsterdam, Netherlandsadidas International Finance B.V.,
Amsterdam, Netherlandsadidas International Marketing B.V.,
Amsterdam, Netherlandsadidas International Property Holding B.V.,
Amsterdam, Netherlandsadidas International Re Limited, Dublin, Irelandadidas International Trading B.V.,
Amsterdam, Netherlandsadidas International, Inc., Portland, Oregon, USAadidas Italy S.p.A, Monza, Italyadidas Japan K.K., Tokyo, Japanadidas Korea Ltd., Seoul, Koreaadidas Latin America, S.A., Panama City, Panamaadidas Levant Limited – Jordan, Amman, Jordanadidas LLP, Almaty, Republic of Kazakhstanadidas Logistics (Tianjin) Co., Ltd., Tianjin, Chinaadidas New Zealand Limited, Auckland,
New Zealandadidas Norge AS, Lillestrom, Norwayadidas North America, Inc., Portland, Oregon, USAadidas Peru S.A.C., Lima, Peruadidas Philippines Inc., Pasig City, Philippinesadidas Poland Sp.z o.o., Warsaw, Polandadidas Portugal – Artigos de Desporto, S.A.,
Lisbon, Portugaladidas Romania S.R.L., Bucharest, Romaniaadidas Serbia d.o.o., New Belgrade, Serbiaadidas Services Limited, Hong Kong, Chinaadidas Singapore Pte. Ltd., Singapore, Singaporeadidas Slovakia s.r.o., Bratislava, Slovak Republicadidas Sourcing Limited, Hong Kong, Chinaadidas Spor Malzemeleri Satis ve Pazarlama A.S.,
Istanbul, Turkeyadidas sport gmbh, Cham, Switzerlandadidas Sporting Goods Ltd., Cairo, Egyptadidas Sports (China) Co. Ltd., Suzhou, Chinaadidas Suomi Oy, Helsinki, Finland
adidas Sverige AB, Solna, Swedenadidas Taiwan Limited, Taipei, Taiwanadidas Team, Inc., Portland, Oregon, USAadidas Trgovina d.o.o., Ljubljana, Sloveniaadidas Vietnam Company Limited,
Ho Chi Minh City, Vietnamadisport Corporation, San Juan, Puerto RicoConcept Sport, S.A., Panama City, PanamaGlobal Merchandising, S.L., Madrid, SpainHydra Ventures B.V., Amsterdam, NetherlandsLLC ‘adidas, Ltd.’, Moscow, RussiaPT adidas Indonesia, Jakarta, IndonesiaRaelit S.A., Montevideo, UruguayReebok International Limited, London,
Great BritainReebok International Ltd., Canton,
Massachusetts, USAReebok-CCM Hockey AB, Solna, SwedenReebok-CCM Hockey AS, Gressvik, NorwayReebok-CCM Hockey Oy, Espoo, FinlandReebok-CCM Hockey U.S. Inc., Montpelier,
Vermont, USAReebok Israel Ltd., Holon, IsraelSC ‘adidas-Ukraine’, Kiev, UkraineSpartanburg DC, Inc., Spartanburg, South Carolina,
USASport Maska Inc., New Brunswick, CanadaSports Licensed Division of the adidas Group, LLC,
Boston, Massachusetts, USAStone Age Equipment, Inc., Redlands, California,
USATafibal S.A., Montevideo, UruguayTaylor Made Golf Co., Inc., Carlsbad, California,
USATaylor Made Golf Co., Ltd., Tokyo, JapanTaylor Made Golf Limited, Basingstoke,
Great BritainTaylor Made Korea Ltd., Seoul, KoreaTextronics, Inc., Wilmington, Delaware, USATrafford Park DC Limited (formerly Reebok Finance
Limited), London, Great Britain
adidas AG declares support, except in the case of political risk, that the below-mentioned companies are able to meet their contractual liabilities. This declaration replaces the declaration dated February 14, 2014. The
2014 Declaration of Support is no longer valid.

4
adidas Group / 2014 Annual Report
2622 0 1 4
Additional InformationFinancial Calendar
/ 05.4 /
FINANCIAL CALENDAR2 0 15
MAR
MAY
AUG NOV
05Full Year 2014 Results
Press release, conference call and webcastPublication of 2014 Annual Report
07Annual General Meeting
F U E R T H ( B A V A R I A ) , G E R M A N Y
Webcast
06First Half 2015 Results
Press release, conference call and webcastPublication of First Half 2015 Report
08Dividend payment
(Subject to Annual General Meeting approval)
05Nine Months 2015 Results
Press release, conference call and webcastPublication of Nine Months 2015 Report
26Investor Day
Press release, management presentations and webcast
05First Quarter 2015 Results
Press release, conference call and webcastPublication of First Quarter 2015 Report

adidas AGAdi-Dassler-Str. 191074 HerzogenaurachGermany
TEL: + 49 (0) 91 32 84 - 0FAX: + 49 (0) 91 32 84 - 22 41
WWW.ADIDAS-GROUP.COM
Investor RelationsTEL: + 49 (0) 91 32 84 - 32 96FAX: + 49 (0) 91 32 84 - 31 27EMAIL: [email protected]
WWW.ADIDAS-GROUP.COM/INVESTORS
adidas Group is a member of DIRK (German Investor Relations Association).
This report is also available in German. For further adidas Group publications, please see our corporate website or download our Investor Relations and Media App from the App Store.
To improve readability, registered trademarks are omitted in this Annual Report.
Concept and DesignStrichpunkt, Stuttgart / Berlin
Printed byEberl Print, Immenstadt

adidas AGAdi-Dassler-Str. 1
91074 Herzogenaurach
Germany
©2015 adidas AG
20
14
AN
NU
AL
RE
PO
RT
220,5 mm