Lysosomal Stress in Obese Adipose Tissue Macrophages...
14
Tanit L. Gabriel, 1 Marc J. Tol, 1 Roelof Ottenhof, 1 Cindy van Roomen, 1 Jan Aten, 2 Nike Claessen, 2 Berend Hooibrink, 3 Barbara de Weijer, 4 Mireille J. Serlie, 4 Carmen Argmann, 5 Leonie van Elsenburg, 1 Johannes M.F.G. Aerts, 1 and Marco van Eijk 1 Lysosomal Stress in Obese Adipose Tissue Macrophages Contributes to MITF-Dependent Gpnmb Induction Diabetes 2014;63:3310–3323 | DOI: 10.2337/db13-1720 In obesity, adipose tissue (AT) contains crown-like structures where macrophages surround nonviable adi- pocytes. To understand how AT macrophages (ATMs) contribute to development of insulin resistance, we examined their character in more detail. In silico anal- ysis of F2 mouse populations revealed significant cor- relation between adipose glycoprotein nonmetastatic melanoma protein B (Gpnmb) expression and body weight. In obese mice and obese individuals, Gpnmb expression was induced in ATMs. Cultured RAW264.7 cells were used to obtain insight into the mechanism of Gpnmb regulation. Gpnmb was potently induced by lysosomal stress inducers, including palmitate and chloroquine, or Torin1, an inhibitor of mammalian target of rapamycin complex 1 (mTORC1). These stimuli also provoked microphthalmia transcription factor (MITF) translocation to the nucleus, and knockdown of MITF by short hairpin RNA indicated its absolute requirement for Gpnmb induction. In agreement with our in vitro data, reduced mTORC1 activity was observed in isolated ATMs from obese mice, which coincided with increased nuclear MITF localization and Gpnmb transcription. Aberrant nutrient sensing provokes lysosomal stress, resulting in attenuated mTORC1 activity and enhanced MITF-dependent Gpnmb induction. Our data identify Gpnmb as a novel marker for obesity-induced ATM infiltration and potentiator of interleukin-4 responses and point toward a crucial role for MITF in driving part of the ATM phenotype. Obesity is characterized by a state of low-grade inflam- mation, which is an essential contributing factor to insulin resistance (IR) (1). Both adaptive and innate im- munity contribute to this inflammatory response. Approx- imately a decade ago, increased macrophage numbers were first described in obese adipose tissue (AT) (2). In recent years, virtually all cells of the immune system have been described in AT. In lean AT, a crucial role is played by eosinophils, innate lymphoid type 2 cells, invari- ant natural killer T cells, and regulatory T cells, which pro- mote an anti-inflammatory environment that warrants insulin sensitivity (3–6). During obesity, AT becomes populated by proinflammatory Th1 T cells (both CD4 + and CD8 + ), neutrophils, mast cells, and B cells, promot- ing IR (7–11). During diet-induced obesity (DIO), a phe- notypical change occurs in AT macrophages (ATMs) characterized by a shift toward a more proinflammatory state (12,13). One typical characteristic of inflamed obese AT is the presence of crown-like structures (CLSs), which consist, in part, of actively recruited proinflammatory ATMs, surrounding dead adipocytes (2,14). Another characteristic of inflamed obese ATMs 1 Department of Medical Biochemistry, Academic Medical Center, University of Amsterdam, Amsterdam, the Netherlands 2 Department of Pathology, Academic Medical Center, University of Amsterdam, Amsterdam, the Netherlands 3 Department of Cell Biology, Academic Medical Center, University of Amsterdam, Amsterdam, the Netherlands 4 Department of Endocrinology and Metabolism, Academic Medical Center, Uni- versity of Amsterdam, Amsterdam, the Netherlands 5 Department of Genetics and Genomic Sciences, Icahn Institute for Genomics and Multiscale Biology, Icahn School of Medicine at Mount Sinai, New York, NY Corresponding author: Marco van Eijk, [email protected]. Received 9 November 2013 and accepted 21 April 2014. This article contains Supplementary Data online at http://diabetes .diabetesjournals.org/lookup/suppl/doi:10.2337/db13-1720/-/DC1. © 2014 by the American Diabetes Association. Readers may use this article as long as the work is properly cited, the use is educational and not for profit, and the work is not altered. 3310 Diabetes Volume 63, October 2014 OBESITY STUDIES
Transcript of Lysosomal Stress in Obese Adipose Tissue Macrophages...

Tanit L. Gabriel,1 Marc J. Tol,1 Roelof Ottenhof,1 Cindy van Roomen,1 Jan Aten,2 Nike Claessen,2
Berend Hooibrink,3 Barbara de Weijer,4 Mireille J. Serlie,4 Carmen Argmann,5 Leonie van Elsenburg,1
Johannes M.F.G. Aerts,1 and Marco van Eijk1
Lysosomal Stress in ObeseAdipose Tissue MacrophagesContributes to MITF-DependentGpnmb InductionDiabetes 2014;63:3310–3323 | DOI: 10.2337/db13-1720
In obesity, adipose tissue (AT) contains crown-likestructures where macrophages surround nonviable adi-pocytes. To understand how AT macrophages (ATMs)contribute to development of insulin resistance, weexamined their character in more detail. In silico anal-ysis of F2 mouse populations revealed significant cor-relation between adipose glycoprotein nonmetastaticmelanoma protein B (Gpnmb) expression and bodyweight. In obese mice and obese individuals, Gpnmbexpression was induced in ATMs. Cultured RAW264.7cells were used to obtain insight into the mechanismof Gpnmb regulation. Gpnmb was potently inducedby lysosomal stress inducers, including palmitate andchloroquine, or Torin1, an inhibitor of mammalian targetof rapamycin complex 1 (mTORC1). These stimuli alsoprovoked microphthalmia transcription factor (MITF)translocation to the nucleus, and knockdown of MITFby short hairpin RNA indicated its absolute requirementfor Gpnmb induction. In agreement with our in vitro data,reduced mTORC1 activity was observed in isolatedATMs from obese mice, which coincided with increasednuclear MITF localization and Gpnmb transcription.Aberrant nutrient sensing provokes lysosomal stress,resulting in attenuated mTORC1 activity and enhancedMITF-dependent Gpnmb induction. Our data identifyGpnmb as a novel marker for obesity-induced ATMinfiltration and potentiator of interleukin-4 responses
and point toward a crucial role for MITF in driving part ofthe ATM phenotype.
Obesity is characterized by a state of low-grade inflam-mation, which is an essential contributing factor toinsulin resistance (IR) (1). Both adaptive and innate im-munity contribute to this inflammatory response. Approx-imately a decade ago, increased macrophage numberswere first described in obese adipose tissue (AT) (2). Inrecent years, virtually all cells of the immune systemhave been described in AT. In lean AT, a crucial role isplayed by eosinophils, innate lymphoid type 2 cells, invari-ant natural killer T cells, and regulatory T cells, which pro-mote an anti-inflammatory environment that warrantsinsulin sensitivity (3–6). During obesity, AT becomespopulated by proinflammatory Th1 T cells (both CD4+
and CD8+), neutrophils, mast cells, and B cells, promot-ing IR (7–11). During diet-induced obesity (DIO), a phe-notypical change occurs in AT macrophages (ATMs)characterized by a shift toward a more proinflammatorystate (12,13). One typical characteristic of inflamedobese AT is the presence of crown-like structures(CLSs), which consist, in part, of actively recruitedproinflammatory ATMs, surrounding dead adipocytes(2,14). Another characteristic of inflamed obese ATMs
1Department of Medical Biochemistry, Academic Medical Center, University ofAmsterdam, Amsterdam, the Netherlands2Department of Pathology, Academic Medical Center, University of Amsterdam,Amsterdam, the Netherlands3Department of Cell Biology, Academic Medical Center, University of Amsterdam,Amsterdam, the Netherlands4Department of Endocrinology and Metabolism, Academic Medical Center, Uni-versity of Amsterdam, Amsterdam, the Netherlands5Department of Genetics and Genomic Sciences, Icahn Institute for Genomics andMultiscale Biology, Icahn School of Medicine at Mount Sinai, New York, NY
Corresponding author: Marco van Eijk, [email protected].
Received 9 November 2013 and accepted 21 April 2014.
This article contains Supplementary Data online at http://diabetes.diabetesjournals.org/lookup/suppl/doi:10.2337/db13-1720/-/DC1.
© 2014 by the American Diabetes Association. Readers may use this article aslong as the work is properly cited, the use is educational and not for profit, andthe work is not altered.
3310 Diabetes Volume 63, October 2014
OBESITY
STUDIES
is lipid accumulation, as these cells must buffer the fatspillover from dying adipocytes (15,16).
Glycoprotein nonmetastatic melanoma protein B(Gpnmb) is a transmembrane protein expressed by severalcell types, including macrophages (17). It is also referredto as osteoactivin, hematopoietic growth factor–inducibleneurokinin 1, and the dendritic cell–associated heparinsulfate proteoglycan–dependent integrin ligand (18–21).Gpnmb has been implicated in regulation of both adap-tive and innate immunity (22–24). Interestingly, Gpnmbinduction has also been observed in a mouse model ofGaucher disease, a macrophage lipid–storage disease char-acterized by deficient lysosomal acid b-glucosidase and IRin humans (25,26). Presumably, in this case, Gpnmb in-duction is triggered by the lysosomal accumulation ofnondegradable glycosphingolipids in macrophages. Re-cently, the lysosome regained scientific interest as it wasdiscovered that the transcription factor EB (TFEB) playsa crucial role in driving lysosomal biogenesis (27). TFEBbelongs to the microphthalmia transcription factor(MITF) E subfamily of basic helix-loop-helix leucine zippertranscription factors to which MITF, transcription factorE3, and transcription factor EC also belong (28).
Given the insight that Gpnmb seemingly tracts withtwo key characteristics of obese settings, immune func-tion and lipid exposure, we first investigated a possiblelink between Gpnmb expression and metabolic-relatedtraits using an in silico approach. Next, we analyzedGpnmb expression in AT of lean versus obese mice(genetically induced and high-fat diet [HFD]–inducedmodels for murine obesity) as well as in human AT com-partments. Finally, we addressed the mechanism of tran-scriptional regulation for Gpnmb expression in ATMs. Wereport Gpnmb as a novel marker for obesity-induced ATMinfiltration and point toward a crucial role for lysosomalstress and MITF in driving part of the ATM phenotype. Inaddition, we provide evidence that Gpnmb potentiatesinterleukin (IL)-4–mediated arginase-1 induction.
RESEARCH DESIGN AND METHODS
In Silico AnalysisWe investigated two independently generated mouse F2populations: an F2 intercross between CAST/Ei3 C57BL/6J(CTB6F2; n = 408; males and females combined) and anF2 intercross between C57BL/6J 3 C3H/HeJ both on anapolipoprotein E–null background (BHF2; n = 135;females only) (29,30). We queried GeneNetwork (http://www.genenetwork.org/webqtl/main.py), which is a web-based program archiving these data sets (31), using thefollowing microarray and phenotype data sets: 1) UCLACTB6/B6CTF2 adipose (2005) mlratio, 2) UCLA BHF2adipose female mlratio, and 3) CTB6F2 published pheno-types. Published phenotypes from the BHF2 were im-ported into the database ([30] and http://www.sagebase.org/index.php). The sole Gpnmb probe on each of theadipose databases (record 10024406500) was selected,and either the top ;500 Gpnmb covariates from each
experiment or the correlation to all scored phenotypeswere determined. To reduce trait redundancy whereverpossible only trait:gene correlations using the normalizedor transformed trait expression values are shown.Heatmap transformations of trait:gene correlations wereperformed using the gplots package available from http://www.r-project.org/.
AnimalsC57BL/6J control mice and leptin-deficient obese (Ob/Ob)mice (C57BL/6J background) were obtained from Harlan.Animals (n = 6 per group unless stated otherwise) were feda commercial chow diet (AM-II). Studies were performedusing 12-week-old male mice.
For DIO studies, 6-week-old male C57Bl/6J mice werefed either an HFD (D12492, Research Diets Inc.; consist-ing of 20 kcal % protein, 20% carbohydrates, and 60% fat)or low-fat diet (LFD; D12450B, Research Diets Inc.;consisting of 20 kcal % protein, 70% carbohydrates, and10% fat) for 16 weeks. Principles of laboratory animal carewere followed, and approval for the study was obtainedfrom the local ethical committee for animal experiments.
Preparation of Stromal Vascular FractionsEpididymal white AT (EWAT) of lean, Ob/Ob, and LFD-and HFD-fed mice was dissected, minced, and exposed tocollagenase II (Sigma)/DNase I (Roche) treatment for 25min. The cell suspension was passed through a 70 mm(lean) or 100 mm (obese) cell strainer (BD Falcon) andwashed in Hanks’ balanced salt solution/2% FCS. Theobtained pellet is referred to as the stromal vascular frac-tion (SVF). Erythrocytes were removed from the SVF us-ing red cell erythrocyte lysis buffer (Sigma).
FACS Sorting and CD11b+ SelectionSVF were incubated with rat anti-mouse CD16/CD32mouse Fc–blocking reagent (BD Biosciences) for 10 minand subsequently double labeled with rat anti-mousemacrophage galactose–specific lectin/CD301 Alexa 647(Bio-Connect) and rat anti-mouse F4/80 fluorescein iso-thiocyanate (eBioscience). From lean and LFD SVFs,CD301+/F4/80+ cells were sorted, and from Ob/Ob andHFD-fed mice SVFs, CD301+/F4/80+ and CD301lo/F4/80+
cells were sorted using a FACSAria instrument (BD Bio-sciences). Positive selection of ATMs from SVF was per-formed with anti-CD11b conjugated magnetic microbeads(Miltenyi Biotec) using MACS according to the manufac-turer’s protocol.
Human ATTwenty obese (BMI ranging from 34.8 to 61.3 kg/m2)Caucasian women with a mean age of 40.5 (26–50) yearswho were scheduled for Roux-en-Y gastric bypass surgerywere included. Patients were eligible if they had no Di-agnostic and Statistical Manual of Mental Disorders IVdiagnosis, were older than 18 years, understood the ob-jective of the study, and gave informed consent. Biopsiesof the subcutaneous (SC), omental (OM), and mesenteric(MES) fat compartment were taken at the beginning of
diabetes.diabetesjournals.org Gabriel and Associates 3311

the surgical procedure after an overnight fast. The controlgroup consisted of age- and sex-matched female subjectsscheduled for elective cholecystectomy. They were lean(BMI 20–24.4 kg/m2) and had a normal glucose tolerancetest, HOMA-IR, and HbA1c. The samples were snap-frozenin liquid nitrogen and thereafter stored at 280°C for sub-sequent analysis. The women participated in a study onthe short-term metabolic effects of bariatric surgery. Thestudy was approved by the Medical Ethical Committee ofthe Academic Medical Center.
RNA Extraction and Real-time PCRTotal RNA was extracted from total fat-, SVF-, and FACS-sorted ATMs using TRIzol (Invitrogen) reagent and theNucleoSpin II extraction kit, which included an RNase-free DNase step (Macherey Nagel). RNA concentrationswere measured using the NanoDrop spectrophotometer(NanoDrop Technologies). Equal amounts of RNA wereused to synthesize cDNA according to the manufacturer’smethod (Invitrogen). Gene-specific analysis was done byreal-time RT-PCR using an iCycler MyiQ system (Bio-Rad).Expression levels in mouse and human were normalizedto those of acidic ribosomal phosphoprotein 36B4, alsoreferred to as P0.
Cell Culture ExperimentsRAW264.7 from American Type Culture Collection werecultured in DMEM/10% FCS supplemented with penicillin-streptomycin. Palmitate and oleate (Sigma) were coupledto BSA Fraction V fatty acid–free (Roche) as describedpreviously (32). IL-4 (R&D Systems), IL-10 (PeproTech),and interferon-g (IFN-g; PeproTech) were used at50 ng/mL, and lipopolysaccharide (LPS) from Sal-monella minnesota R 595 (Alexa) was used at 100 ng/mL.BSA-coupled lipids were used at 500 mmol/L; chloroquine(CQ) at 40 mmol/L; bafilomycin at 50 nmol/L; concanamycinA at 2 nmol/L; tunicamycin at 1, 5, and 10 mg/mL;thapsigargin at 1, 10, and 100 nmol/L; and Torin at250 nmol/L. b-Hexosaminidase activity was determinedin cell-free supernatant using 4MU-b-D-6-sulpho-2-acetamido-2-deoxy-glucopyranoside as substrate (Sigma).MITF knockdown in RAW264.7 cells was achieved usinga lentiviral approach. The short hairpin RNA (shRNA)containing pKLO.1 puro lentiviral vectors were derivedfrom the Department of Human Genetics of the AcademicMedical Center. High-titer lentiviral stocks were gener-ated by calcium phosphate–mediated transfection of thepurified plasmids and packaging vectors pMDL/pRRE,pRSV-Rev, and pMD2.VSVG into HEK-293T cells. Super-natants were collected 48 and 72 h posttransfection andsubjected to ultracentrifugation to obtain concentratedviral stocks. Titers were determined with p24 ELISA andby means of real-time PCR using primers directed at pro-viral DNA in genomic host-cell DNA. The followingshRNA-encoding sequences targeting murine Mitf wereused in this study: Mitf shRNA#1 TRCN0000095285(59-GCAGTACCTTTCTACCACTTT-39); Mitf shRNA#2TRCN0000095288 (59-GCAAATACGTTACCCGTCTCT-39);
and Gpnmb shRNA TRCN0000011929 (59-CCGAATAAACAGATATGGCTA-39). The noncoding MISSION Non-Target Control Vector (SHC002, 59-CAACAAGATGAAGAGCACCAA-39) served as an internal control in ourexperiments. Raw264.7 cells were seeded at 40% con-fluency and the following day exposed to optimizedlentiviral titers for 4 h. After 24 h, transduced cellswere selected with 5 mg/mL puromycin for 2 days,and experiments were performed immediately thereaf-ter. Mouse plasma Gpnmb levels were determined byELISA (R&D Systems).
ImmunohistochemistryEWAT was fixed in 4% formaldehyde, phosphate-bufferedat pH 7.0, and embedded in paraffin. Deparaffinizedtissue sections (4 mm) were blocked for endogenous per-oxidase activity by immersion in 0.3% H2O2 in methanolfor 20 min. For immunostaining, sections were incubatedwith primary goat IgG anti-mouse Gpnmb antigen affinity-purified polyclonal antibody (AF2330; R&D Systems) di-luted in phosphate-buffered primary antibody diluent(ScyTek Laboratories) followed by rabbit anti-goat IgG(Dako) and horseradish peroxidase–conjugated swineanti-rabbit IgG (Dako). Bound horseradish peroxidase ac-tivity was visualized using diaminobenzidine as substrate.Sections were counterstained with either hematoxylin ormethyl green and were mounted in Pertex. RAW264.7were fixed in 4% formaldehyde and permeabilized in0.2% Tween/PBS followed by endogenous peroxidase in-activation and staining with anti-MITF antibody (ExalphaBiologicals Inc.).
Western Blot AnalysisCell lysates were prepared in radioimmunoprecipitationassay buffer (150 mmol/L NaCl, 50 mmol/L Tris-HCl pH7.4, 2 mmol/L EDTA, 0.5% deoxycholaat, 1 mmol/LNa3VO4, 20 mmol/L NaF, and 0.5% Triton X-100) supple-mented with protease inhibitor cocktail (Roche) and phe-nylmethylsulfonyl fluoride (PMSF). Primary antibodiesused were anti-Gpnmb (R&D Systems), anti-tubulin-a(Cedarlane Laboratories Limited), anti-MITF (ExalphaBiologicals Inc.), anti-lamin A/B (Santa Cruz Biotechnol-ogy Inc.), anti-4E-BP1 (Cell Signaling Technology Inc.),anti-phospho-4E-BP-1 (thr37/46) (Cell Signaling Tech-nology Inc.), anti-gapdh (Cell Signaling Technology Inc.),and matching secondary IRDye-conjugated antibodies(Westburg BV) were used for detection in an Odysseyversion 3.0 (LI-COR Inc.).
Cytosolic and nuclear fractions were prepared asfollows. Cells pellets were washed in PBS and taken upin 500 mL buffer (25 mmol/L HEPES, 5 mmol/L KCl,0.5 mmol/L MgCl2, 1 mmol/L dithiothreitol, and 1 mmol/LPMSF) and allowed to swell on ice for 15 min. Next,200 mL buffer containing 0.35% Triton X-100 was addedand after 15 min rotation centrifuged for 30 s at maxi-mum speed. Supernatant contains cytosolic fraction. Pelletswere resuspended in 25 mmol/L HEPES, 350 mmol/L NaCl,10% sucrose, 0.1% Triton X-100, 1 mmol/L dithiothreitol,
3312 Lysosomal Stress, Obese ATM Phenotype, and MITF Diabetes Volume 63, October 2014

and 1 mmol/L PMSF and rotated for 1 h; centrifuge andsupernatant contains nuclear proteins.
Statistical AnalysisValues presented in figures represent means 6 SEM. Sta-tistical analysis of the two groups was assessed by Studentt test (two tailed). Level of significance is depicted in thefigures with the actual P values. P values ,0.05 wereconsidered significant unless otherwise stated.
RESULTS
Adipose Gpnmb mRNA Expression Correlates WithMetabolic Traits in Mouse F2 PopulationsInbred mouse strains display significant inherent geneticdiversity affecting their susceptibility to various diseases,including aspects of metabolic syndrome. F2 intercrosses ofsuch inbred mice consequently produce genotypically dis-tinct offspring randomly segregating for these genetic andvarying disease susceptibilities. As a result, these popula-tions of mice provide an experimental model for correlatingphenotypic trait expression to generate biological insight. Inour in silico analysis, we used data from two independent F2intercrosses, namely, the CTB6F2 and the BHF2 (29,30,33).
We determined the relationship between the adiposeGpnmb gene expression levels and that of various metabolic
traits scored in the F2 individuals. A Heatmap transforma-tion of the correlation coefficients is shown in Fig. 1A. Themost striking observation was the positive correlation ofGpnmb to body weight (r = 0.66 and r = 0.43; P value,5.0 3 10210) in both the BHF2 and CTB6F2 crosses, re-spectively. In contrast, Gpnmb expression was most signif-icantly inversely correlated to the ratio of glucose to insulin(r =20.47 and r =20.25; P value,5.03 1025) in both theBHF2 and CTB6F2 crosses, respectively. An example of thecorrelation plot for the BHF2 cross is shown in Fig. 1B.The results of this correlation analysis strongly suggesta link between the expression of Gpnmb in AT and markersof insulin sensitivity.
Gpnmb Is Highly Expressed in Macrophages in AT ofObese Mice and HumansTo extend and validate the observations of Gpnmb in themouse F2 populations, we investigated Gpnmb expressionin two independent models for murine obesity, namely,the high-fat DIO model and the genetically obese mousemodel (Ob/Ob). By using quantitative PCR (qPCR),a dramatic increase of Gpnmb mRNA was observed inEWAT of 12-week-old Ob/Ob mice and 16-week-old HFD-fed DIO mice when compared with lean or LFD controlgroups (all n = 6 per group) (Fig. 2A). Active recruitment
Figure 1—In silico analysis of Gpnmb expression reveals positive correlation with body weight and negative correlation with insulinsensitivity measures. A: A Heatmap transformation of the correlation coefficients (P, Pearson; Rho; Spearman) of adipose Gpnmb expres-sion to various metabolic traits scored in individuals from two independent mouse F2 intercrosses (BHF2 and CTB6F2). B: Example ofcorrelation plot between adipose Gpnmb expression and body weight scored in BHF2 individuals. BMD, bone mineral density; FFA,free fatty acid; Glu, glucose; Ins, insulin; TC, total cholesterol; TG, triglyceride; UC, unesterified cholesterol.
diabetes.diabetesjournals.org Gabriel and Associates 3313

of inflammatory macrophages into AT results in the for-mation of CLSs, a hallmark of AT inflammation (2,14). Asexpected, the macrophage content, which was analyzed byqPCR as F4/80 expression, increased in DIO and Ob/ObAT when compared with lean and LFD-fed AT (Fig. 2B).Interestingly, Gpnmb expression correlated well with F4/80 expression in total AT (r2 = 0.94; P, 0.0001) (Fig. 2C).
Next, we prepared SVF of EWAT to narrow down thecells possibly expressing Gpnmb. A clear enrichment ofGpnmb and F4/80 expression in the SVF of both obesemouse models was observed (n = 6 per group) (Fig. 2D andE). By using anti-Gpnmb antibodies, we demonstratedhighly Gpnmb-positive CLSs (Fig. 2F). In male mice, high-est expression of both F4/80 and Gpnmb was observed in
Figure 2—Gpnmb is induced in obese AT. A: Gpnmb expression in obese EWAT of leptin-deficient Ob/Ob mice and mice fed an HFD for 16weeks (n = 6 per group; depicted are mean 6 SEM). B: F4/80 induction in obese EWAT. C: F4/80 correlates significantly with Gpnmb inEWAT. D: Gpnmb is enriched in SVF of obese mice. E: F4/80 induction in obese SVF. White bars refer to lean and LFD control groups; thegray bars refer to Ob/Ob and HFD groups. F: Immunohistochemical analysis reveals Gpnmb-positive CLSs in EWAT of Ob/Ob mice but notin lean control mice; bar size = 200 mm. (G) F4/80 and (H) Gpnmb are highly induced in EWAT. The white bars refer to the LFD group, andthe gray bars refer to the HFD group. I: Gpnmb is not induced in matured 3T3-L1 adipocytes, whereas peroxisome proliferator–activatedreceptor g2 and adiponectin are. (J) CD68 and (K) Gpnmb expression is induced in human AT compartments (lean AT, n = 6; obese AT, n =20; depicted are mean 6 SEM). *P < 0.05; **P < 0.01. White bars refer to the SC, light gray bars refer to the MES, and dark gray bars referto the OM adipose compartments. BAT, brown AT; Pparg2, peroxisome proliferator–activated receptor g2.
3314 Lysosomal Stress, Obese ATM Phenotype, and MITF Diabetes Volume 63, October 2014

the EWAT compartment (Fig. 2G and H). We also ana-lyzed other macrophage-rich tissues and only founda modest 10-fold induction in liver on HFD feeding, butnot in lung and spleen (Supplementary Fig. 1). In cultured3T3-L1 adipocytes, Gpnmb was virtually absent and notinduced during maturation, whereas both peroxisomeproliferator–activated receptor g2 and adiponectin wereinduced as anticipated (Fig. 2I). In plasma, Gpnmb levelswere not different between the LFD (13 6 4.6 ng/mL)and HFD (12 6 3.7 ng/mL), despite the striking increasein EWAT.
Analysis of human lean and obese AT samples, in-cluding SC, MES, and OM AT compartments, revealeda significant increase of both CD68 (as a marker ofmacrophages) and Gpnmb expression in the SC and MESfat of the obese subjects compared with the lean controls(Fig. 2J and K). When combining all AT compartments, weobserved a strong correlation between CD68 and Gpnmb(r = 0.68; P , 0.0001). Interestingly, in both SC AT andMES AT, Gpnmb significantly correlated with BMI (r =0.46 [P = 0.021] and r = 0.44 [P = 0.044], respectively).
During obesity, a shift toward a more proinflammatoryphenotype is observed in ATMs (13). Murine ATM pop-ulations can for instance be defined by differences inmacrophage galactose N-acetyl-galactosamine–specific lec-tin 1 (MGL1) expression (12). By FACS sorting, F4/80+MGL1+ fractions were isolated from lean and LFDSVF, representing alternatively activated resident M2macrophages (Fig. 3A and B). From Ob/Ob and HFD-fedSVF, F4/80+MGL1+ (M2) macrophages were sorted aswell as inflammatory-recruited (M1) macrophages F4/80+MGL1lo (Fig. 3C and D). Using qPCR, we reconfirmedthat the sorted cells were indeed F4/80+, either positive ornegative for MGL1 expression (Fig. 3E and F) and that theinflammatory-recruited (M1) macrophages F4/80+MGL1lo
expressed high levels of CD11c (Fig. 3G).A striking induction of Gpnmb was observed in obese
ATMs, both the F4/80+MGL1+ and F4/80+MGL1lo sortedpopulation (Fig. 3H). Of interest, no correlation was ob-served with FIZZ1, an alternatively activated macrophagemarker, which was highly present in lean ATMs but re-duced to a large extent in both ATM populations isolatedfrom Ob/Ob and HFD mice (Fig. 3I). The latter is in linewith the lean Th2 adipose environment (eosinophil-derived IL-4), which is lost in obese AT (3). The Gpnmbexpression pattern in obese ATMs showed a remarkablesimilarity with osteopontin expression, a marker pre-viously reported to be induced in ATMs in obese AT(Fig. 3J) (34).
Gpnmb Is Induced in Macrophages by Palmitate and CQIt is known that the development of obesity is associatedwithboth immunological and metabolic changes such as hypoxiaand lipotoxicity. To get more insight in the regulation ofGpnmb expression in obese ATMs, several experiments wereperformed using macrophage-like RAW264.7 cells. Duringobesity, the inflammatory status of AT switches from a Th2-
prone environment (eosinophil-derived IL-4 and regulatoryT cell–derived IL-10) toward a Th1 environment (T cell–derived IFN-g). It was observed that Gpnmb was neitherinduced by the Th2 cytokines IL-4 and IL-10 nor theTh1-driving factors IFN-g, LPS, or a combination of IFN-gwith LPS. Analysis of macrophage polarization markerssuch as arginase-1 (Th2) and nitric oxide synthase (Th1)confirmed that the stimuli worked (Fig. 4A–C). The role ofhypoxia as a possible inducer of Gpnmb expression wasstudied by using the hypoxia mimetic cobalt chloride(CoCl2) at 100mmol/L. As a reflection of the hypoxic statusof the cells, an increase of GLUT-1 (fourfold) was observed.In contrast, we observed that Gpnmb expression was re-duced, suggesting hypoxia does not control Gpnmb expres-sion (Fig. 4D). Acute endoplasmic reticulum (ER) stress asa possible Gpnmb inducer was explored by using thapsigar-gin (1–100 nmol/L) and tunicamycin (1–10 mg/mL), butneither induced Gpnmb, whereas the ER stress markerCHOP was clearly dose-dependently induced (Fig. 4E).
During the development of obesity, adipocyte dysfunc-tion occurs and macrophages, among others, increasinglyscavenge the adipocyte-derived lipids. This lipotoxicenvironment was mimicked by loading RAW cells withBSA-coupled palmitate. Palmitate condensation to serinevia the action of serine palmitoyltransferase initiatessphingolipid synthesis. Indeed after 7 h of lipid challenge,increased formation of dihydroceramide (10-fold) wasdetected when compared with BSA alone or oleate(Fig. 5A). Interestingly, Gpnmb was strongly induced bythe palmitate treatment, whereas oleate did not affectGpnmb expression. At the level of protein, the effect ofpalmitate was confirmed by immunoblot analysis (Fig. 5Band C). To address if the effect was caused by palmitateitself or a newly synthesized sphingolipid, we usedmyriocin, which inhibits serine palmitoyltransferase. Weobserved that myriocin reduced de novo synthesis ofsphingolipids, whereas it did not lower Gpnmb protein,suggesting that Gpnmb induction was not caused bya newly derived sphingolipid (Fig. 5D and E). Given theoverexpression of Gpnmb in mouse models of Gaucherdisease, a lysosomal storage disorder, we studied the po-tential impact of lysosomal stress on Gpnmb expression(25). To address if lysosomal dysfunction could accountfor adipose Gpnmb induction, RAW cells were treated for24 h with the lysosomotropic agent CQ. Targeting oflysosomes was confirmed by analysis of b-hexosaminidaseactivity in the medium of cells, which increased fourfold.Interestingly, we observed a striking induction of Gpnmbat both the mRNA and the protein level (Fig. 5F–H).When using the lysosomal vacuolar-type H+-ATPase inhib-itors bafilomycin and concanamycin A, we also observeda potent induction of Gpnmb (Supplementary Fig. 2).
MITF Is Required for the Induction of GpnmbWhat regulates Gpnmb expression in ATMs is unknown.The association with lysosomal stress—which we defineas a dysfunction of lysosomes, which can be reached by
diabetes.diabetesjournals.org Gabriel and Associates 3315

impairment of lysosomal pH regulation or through subtleoverloading with lipids—and suggested connections inliterature prompted us to address if MITF controlledGpnmb induction in obese ATMs. Interestingly, MITFgene expression was increased in total EWAT of obesemice when compared with lean EWAT (Fig. 6A). Itsmacrophage-derived origin in total EWAT was strength-ened, as MITF expression correlated significantly with themacrophage marker F4/80 (r2 = 0.90; P , 0.0001) andwith Gpnmb (r2 = 0.88; P , 0.0001), hence reflectingATM load. In obese SVF, MITF was increased at themRNA and protein level (Fig. 6B and C). In sortedATMs, MITF mRNA expression levels were not differentbetween studied populations (Fig. 6D). In other words,per macrophage, MITF is not different, but it reflects in-creased macrophage load in total EWAT during obese con-ditions. Increased Gpnmb protein in obese ATMs seemsnot to be accompanied by increased MITF, suggesting thatposttranscriptional regulation of MITF can occur duringobesity. Recent evidence suggests active regulation ofMITF localization from cytosol to the nucleus (35,36).This prompted us to study if palmitate and CQ-mediatedinduction of Gpnmb also required translocation of MITFto the nucleus. Therefore, RAW264.7 cells were incubatedwith CQ (40 mmol/L), BSA, or BSA-coupled palmitate.Next, MITF protein was analyzed by immunoblot inwhole-cell extracts, cytosol, or nuclear-enriched fractions.A clear shift from the cytosol to nuclei of MITF proteinwas observed in CQ-pulsed and palmitate-loaded cells(Fig. 6E). This was further confirmed by immunocyto-chemistry (Fig. 6F).
To ensure that Gpnmb indeed was solely induced ina MITF-dependent manner, we used a lentiviral knockdownstrategy targeting MITF. We confirmed efficient MITFknockdown on protein level compared with cells exposedto control virus. Importantly, MITF depletion completelyabrogated the induction of Gpnmb following palmitateloading and CQ stimulation (Fig. 6G and H). Interestingly,MITF knockdown also prevented CQ-mediated induction ofCcl3 and osteopontin gene expression (Fig. 6I). Osteopontinwas already found to behave as Gpnmb in sorted ATMs (Fig.3J). The important ATM defining marker CD11c, but alsotumor necrosis factor, was not induced by CQ in a MITF-dependent manner (data not shown).
Mammalian Target of Rapamycin Complex 1–DerivedSignals Control Gpnmb ExpressionVery recently, it became clear that active mammaliantarget of rapamycin complex 1 (mTORC1) at the site of
Figure 3—Sorting of ATM populations from lean and obese adi-pose EWAT. SVF labeled with anti-F4/80 and anti-MGL1/CD301antibodies were FACS sorted. Representative FACS profiles aredepicted. A: Lean ATMs (F4/80-Mgl1+ [M2]). B: LFD control ATMs(F4/80-Mgl1+ [M2]). C: Ob/Ob ATMs (both F4/80-Mgl1+ [M2] andF4/80-Mgllo [M1]). D: HFD ATMs (both F4/80-Mgl1+ [M2] and F4/80-Mgllo [M1]). By qPCR, the sorted ATM populations were reanalyzed.
E: F4/80 expression. F: MGL1 expression. G: CD11c expression.H: Gpnmb expression. I: FIZZ1 expression. J: Osteopontin ex-pression. Data are depicted as mean 6 SEM. n = 6 per group.White bars refer to lean and LFD M2 ATMs, gray bars refer to Ob/Oband HFD M2 ATMs, and black bars refer to Ob/Ob and HFD M1ATMs. OPN, osteopontin.
3316 Lysosomal Stress, Obese ATM Phenotype, and MITF Diabetes Volume 63, October 2014

the lysosomal membrane sequesters MITF in the cytosolby means of phosphorylation and that inhibition of thekinase activity of mTORC1 resulted in the nuclearlocalization of MITF (35). mTORC1 is widely consideredas the master regulator of metabolism (37). To address ifmTORC1 activity regulated Gpnmb induction in RAWcells, we made use of the inhibitor Torin1. Inhibition ofthe kinase activity of mTORC1 was confirmed by analyz-ing the phosphorylation of its substrate 4E bindingprotein-1 (Fig. 7A). At the level of gene expression, a clearinduction of Gpnmb was detected, which also occurred atthe level of protein (Fig. 7B and C). In agreement, MITFrapidly translocated from the cytosol to the nucleus uponincubation with Torin1 (Fig. 7D and E). Importantly,MITF knockdown also prevented induction of Gpnmbby Torin1 (Fig. 7F). Of note, rapamycin failed to induceGpnmb, suggesting autophagy is not the driving factor ofGpnmb induction.
Lastly, we analyzed if CD11b+-selected obese ATMsalso showed alterations in the mTORC1 pathway. We ob-served that 4E binding protein-1 phosphorylation wasattenuated in obese versus lean ATMs (Fig. 7G and H).Importantly, Gpnmb was strongly induced in obese ATMs,whereas MITF protein levels were unchanged, reflectinga similar amount of both lean and obese macrophages inour analysis.
Gpnmb Potentiates Alternative Macrophage ActivationWe earlier (Fig. 4) demonstrated that Gpnmb was not in-duced by cytokines or LPS. Here we addressed the questionif Gpnmb itself could play a functional role in polarizingRAW264.7 cells. To this end, Gpnmb-directed shRNA wasused, which efficiently knocked down Gpnmb in RAW cells,both at the level of RNA and protein (Fig. 8A). When basallevels of Gpnmb were knocked down, no difference wasobserved in the capacity of LPS (6-h stimulation) to induceiNOS when compared with scrambled control cells (Fig.8A). Interestingly, the response to IL-4, analyzed asarginase-1 expression, was reduced by ;80% whenGpnmb was knocked down. To address if Gpnmb proteininduction could potentiate the IL-4 response, RAW cellswere first cultured with CQ or Torin to induce Gpnmb(Fig. 8B) and subsequently pulsed with IL-4 for 6 h. Astriking sevenfold to eightfold induction of arginase-1was observed, which again was suppressed when Gpnmbwas targeted by shRNA.
DISCUSSION
It is well established that the low-grade inflammation thatdevelops during obesity can be attributed to both innateand adaptive immune cells. In lean AT, a crucial role isplayed by eosinophils, innate lymphoid type 2 cells,invariant natural killer T cells, and regulatory T cells all
Figure 4—Gpnmb expression is not induced in RAW264.7 cells by Th1, Th2 polarizing factors, or hypoxia induced by CoCl2. A: Th2- andTh1-skewing cytokines do not induce Gpnmb expression. B: Arginase-1 induction by IL-4. C: NOS induction by Th1-skewing factors.D: Hypoxic conditions induce GLUT-1 but not Gpnmb. E: Acute ER stress stimuli induce CHOP but fail to induce Gpnmb. Data are depictedas mean 6 SEM. n = 3 per group. **P < 0.01; ***P < 0.001.
diabetes.diabetesjournals.org Gabriel and Associates 3317

involved in promoting an anti-inflammatory environmentand insulin sensitivity (3–6). Obese AT becomes invadedby inflammation-promoting Th1 T cells (both CD4+ andCD8+), neutrophils, mast cells, and B cells, which leads toIR (7–11). A hallmark of inflamed obese AT is the in-creased recruitment of macrophages, which are organizedin so-called CLSs, consisting of inflammatory macro-phages surrounding dysfunctional adipocytes (2,14).Given their pathophysiological role in metabolic disease,characterization of these macrophages and identificationof markers is important. Here we report the exclusive andmassive expression of Gpnmb in obese ATMs. Gpnmb
expression was shown to reflect MITF activation as a re-sponse to lipid and lysosomal stress.
The evidence for this was obtained by experimentswith cultured RAW264.7 cells. Increased lipid pressure onmacrophages, caused by spillover from adipocytes occur-ring during the development of obesity, could be mim-icked by loading RAW cells with palmitate. Importantly,we found that Gpnmb was induced by palmitate. In-creased lipid load in lysosomes has already been con-nected to Gpnmb induction in a mouse model of Gaucherdisease (25). In these studies, it has been postulated thatGpnmb may serve as a biomarker for Gaucher disease. In
Figure 5—Gpnmb is induced by palmitate and CQ. A: Dihydroceramide induction following loading of cells with palmitate. B: Palmitate, butnot oleate, induces Gpnmb gene expression. C: Induction of Gpnmb protein by palmitate. D: The serine palmitoyltransferase inhibitormyriocin inhibits de novo sphingolipid synthesis as ceramide levels are reduced. E: Myriocin does not prevent induction of Gpnmb. F: Thelysosomotropic agent CQ causes increased levels of b-hexosaminidase. CQ induces (G) Gpnmb mRNA and (H) protein. Data are depictedas mean 6 SEM. n = 3 per group. ***P < 0.001. CER, ceramide; DihydroCer, dihydroceramide; hex, hexosaminidase; Myr, myriocin.
3318 Lysosomal Stress, Obese ATM Phenotype, and MITF Diabetes Volume 63, October 2014
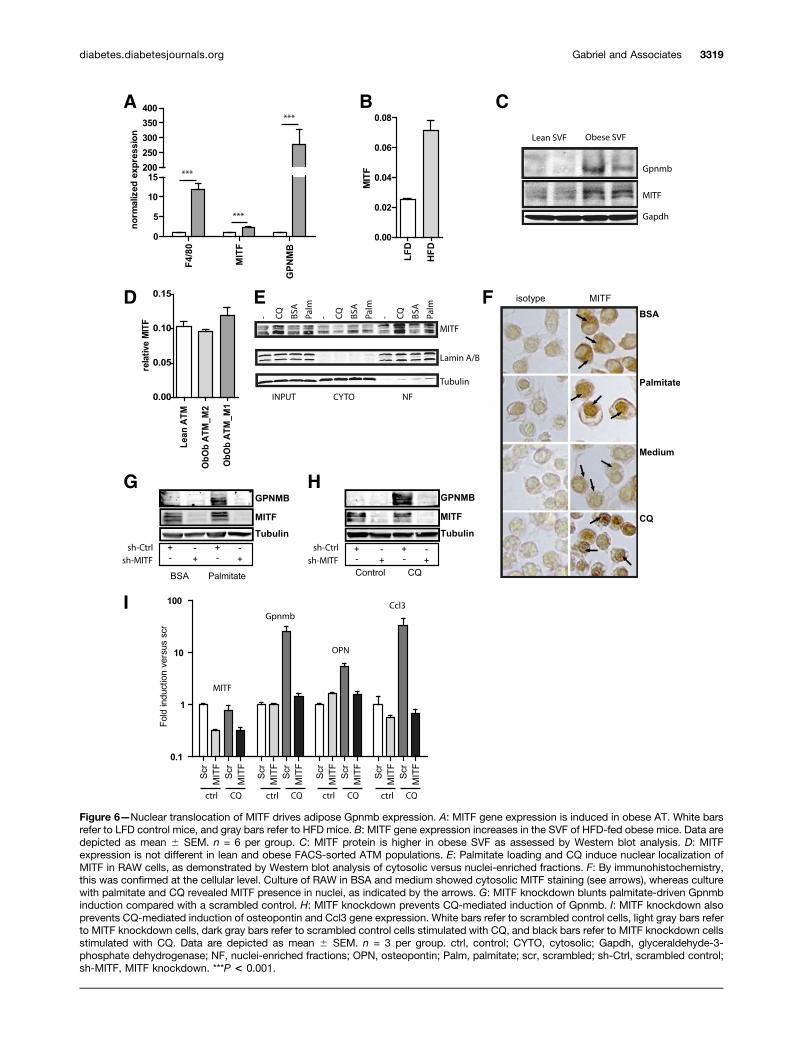
Figure 6—Nuclear translocation of MITF drives adipose Gpnmb expression. A: MITF gene expression is induced in obese AT. White barsrefer to LFD control mice, and gray bars refer to HFD mice. B: MITF gene expression increases in the SVF of HFD-fed obese mice. Data aredepicted as mean 6 SEM. n = 6 per group. C: MITF protein is higher in obese SVF as assessed by Western blot analysis. D: MITFexpression is not different in lean and obese FACS-sorted ATM populations. E: Palmitate loading and CQ induce nuclear localization ofMITF in RAW cells, as demonstrated by Western blot analysis of cytosolic versus nuclei-enriched fractions. F: By immunohistochemistry,this was confirmed at the cellular level. Culture of RAW in BSA and medium showed cytosolic MITF staining (see arrows), whereas culturewith palmitate and CQ revealed MITF presence in nuclei, as indicated by the arrows. G: MITF knockdown blunts palmitate-driven Gpnmbinduction compared with a scrambled control. H: MITF knockdown prevents CQ-mediated induction of Gpnmb. I: MITF knockdown alsoprevents CQ-mediated induction of osteopontin and Ccl3 gene expression. White bars refer to scrambled control cells, light gray bars referto MITF knockdown cells, dark gray bars refer to scrambled control cells stimulated with CQ, and black bars refer to MITF knockdown cellsstimulated with CQ. Data are depicted as mean 6 SEM. n = 3 per group. ctrl, control; CYTO, cytosolic; Gapdh, glyceraldehyde-3-phosphate dehydrogenase; NF, nuclei-enriched fractions; OPN, osteopontin; Palm, palmitate; scr, scrambled; sh-Ctrl, scrambled control;sh-MITF, MITF knockdown. ***P < 0.001.
diabetes.diabetesjournals.org Gabriel and Associates 3319

obese mice, we were not able to demonstrate increasedlevels of Gpnmb in the circulation, despite the severalhundred–fold induction in EWAT. Additional studies inhuman obese subjects are still worthwhile, as in our hu-man cohort, only a modest induction of Gpnmb wasdetected and CLSs were only found in limited numbers.A possible role for lysosomal dysfunction was furtherdemonstrated, as it was found that CQ very potentlytriggered Gpnmb induction. Our lysosome-centered viewwas further strengthened, as neither mimicking of a hyp-oxic environment nor culture with cytokines nor acuteinduction of ER stress induced Gpnmb. We realize thatchronic lysosomal stress also impacts on other cellularcompartments. It therefore cannot be excluded thatsuch later events sustain Gpnmb expression. We postulatea role for the lysosome in driving part of the ATM phe-notype. In this context, it is important to note that obe-sity activates a program of lysosomal-dependent lipidmetabolism in ATMs independently of classic activation(38). Interestingly, in our in silico KEGG pathway enrich-ment analysis, it was also found that Gpnmb expression
was linked to the lysosome in both the BHF2 and theCTB6F2 crosses (data not shown).
Recently, it was demonstrated that lysosomal genesdisplay coordinated transcriptional regulation with animportant role for TFEB in lysosomal biogeneses(27,39,40). MITF belongs to the same family of transcrip-tion factors as TFEB, and we found MITF to be essentialfor Gpnmb induction in the macrophage cell lineRAW264.7, as MITF knockdown blunted induction bythe tested stimuli. Importantly, osteopontin and Ccl3,but not tumor necrosis factor and CD11c, were inducedby CQ in an MITF-dependent manner, pointing toward acrucial role of MITF in driving the ATM phenotype underobese conditions. In FACS-sorted ATMs, Gpnmb followedosteopontin expression, which has been described to beinvolved in potentiating Mcp1/Ccl2-mediated monocytechemoattraction (34).
Finally, we found that mTORC1 inhibition also inducedGpnmb expression in an MITF-dependent manner.mTORC1 is a central regulator of cellular metabolism,and it has been shown recently that its activation occurs
Figure 7—In vitro inhibition of mTORC1 kinase activity with Torin1 induces Gpnmb expression in a MITF-dependent manner. A: Torin1inhibits TORC1 kinase activity, as evidenced by reduced phosphorylation of 4E binding protein-1. (B) Gpnmb mRNA and (C) protein areinduced following mTORC1 inhibition. D: Torin1 induces nuclear localization of MITF, as demonstrated by Western blot analysis of cytosolicversus nuclei-enriched fractions. E: By immunohistochemistry, this was confirmed at the cellular level. In DMSO-treated cells, MITF iscytosolic (see arrows) and Torin1 stimulation results in nuclear presence (see arrows). F: Knockdown of MITF prevents Torin1-mediatedinduction of Gpnmb. mTORC1 activity is reduced in vivo in obese ATMs. G. Western blot analysis revealed that CD11b+ selected ATMsfrom obese mice show increased levels of Gpnmb compared with lean ATMs and reduced mTORC1 activity as phosphorylation of 4Ebinding protein-1 is reduced. H: Quantification of phosphorylation status of 4E binding protein-1. Data are depicted as mean 6 SEM. n = 4per group. ***P < 0.0001. CYTO, cytosolic; GAPDH, glyceraldehyde-3-phosphate dehydrogenase; NF, nuclei-enriched fractions; phospho,phosphorylation; sh-Ctrl, scrambled control; sh-MITF, MITF knockdown.
3320 Lysosomal Stress, Obese ATM Phenotype, and MITF Diabetes Volume 63, October 2014

at the site of the lysosomal membrane (37,41). Our datapropose a unifying model in which lysosomal stress(palmitate and CQ treatment) and perturbed signalingcascades (mTORC1 inhibition) could lead to MITF trans-location to the nucleus with subsequent induction ofGpnmb. The observations that in RAW264.7 cells, en-dogenous MITF shifts from the cytosol to nucleus uponmTORC1 inhibition and CQ treatment is in agreementwith recent MITF overexpression studies (35,36). Impor-tantly, our in vitro studies on MITF and Gpnmb inductionwere confirmed in vivo. It was found that during obesity,phosphorylation of the downstream target of mTORC1,4E-BP-1, was reduced. This causes MITF to shift from thecytosol to nuclei in ATMs, and consequently, Gpnmb in-duction occurred. Similar MITF-dependent regulation of
Gpnmb was recently reported in other cell types like mel-anoblasts and osteoclasts (42–45).
Thus far, it is unknown what the function of Gpnmb isin obesity. It has been suggested that Gpnmb is involvedin controlling immune responses. In the context ofadaptive immunity, Gpnmb has been described to repressT-cell activation (22). Additional evidence comes fromstudies in mice homozygous for a spontaneous mutationwithin the Gpnmb locus causing a truncated form ofGpnmb. These mice exhibit autoimmune pigmentaryglaucoma and compromising ocular immunosuppression,which is manifested by deficient anterior chamber–associated immune deviation (18,46). In the context of in-nate immunity, Gpnmb was demonstrated to be involved inrecognition of dermatophytic fungi (24). Overexpression of
Figure 8—Gpnmb potentiates IL-4–mediated arginase-1 induction. A: shRNA directed against Gpnmb lowers basal Gpnmb expressionand hampers IL-4–mediated arginase-1 expression but not LPS-mediated iNOS induction. B: Induction of Gpnmb potentiates IL-4–mediated arginase-1 increment. Data are depicted as mean 6 SEM. n = 3 per group. Arg1, arginase-1; KD, knockdown; scr, scrambled.
diabetes.diabetesjournals.org Gabriel and Associates 3321

Gpnmb dampens LPS responses, suggesting that Gpnmbnegatively regulates inflammatory macrophage responses(17). We now provide evidence that Gpnmb potentiatesIL-4–mediated induction of the alternative macrophagemarker arginase-1. Ablation of Gpnmb drastically reducesIL-4–driven arginase-1 induction. Possibly, adipose Gpnmbis involved in preventing inflammation from derailing com-pletely, thus contributing to the counterinflammationphase, which was recently proposed (47). Alternatively,Gpnmb is involved in enhancing the phagocytic/remodelingcapacity of local ATMs. Recently, a connection was madewith repair after kidney tissue damage and regulation ofrequired phagocytosis (48). It is important to note in thiscontext that arginase-1 is an important mediator of tissuerepair and wound healing (49). In follow-up experiments,we plan to study in mice with macrophage-specific inacti-vation of Gpnmb the physiological impact in these macro-phages. At present, these appropriate animals are notavailable. These are required to elucidate whether Gpnmbhas a causal role in lipid handling in macrophages andwhether this protein controls the inflammatory status ofmacrophages upon lysosomal overload.
Gpnmb has been implicated in several disease processes,including cancer, glaucoma, and renal damage and repair(18,44,46,48,50). Here we have provided evidence thatGpnmb is linked to obesity-driven AT inflammation as well.
In conclusion, we propose that adipose lipid spilloverprovokes continuous pressure on the lysosomal compart-ment of resident macrophages, with consequential aberra-tions in signaling cascades closely linked to lysosomefunction, such as mTORC1. Active mTORC1 normallysequesters MITF in the cytosol, but as a result of mTORC1inhibition, MITF translocates to the nucleus where itinitiates a transcriptional program including Gpnmb andhence impacts on the ATM phenotype.
Acknowledgments. The authors thank Dr. N. Zelcer from the Department ofMedical Biochemistry, University of Amsterdam, for critical reading of the manuscript.Funding. This work was supported by the Dutch Diabetes Foundation (grantnumber 2009.80.016).Duality of Interest. No potential conflicts of interest relevant to this articlewere reported.Author Contributions. T.L.G. and M.J.T. researched data and reviewed/edited the manuscript. R.O., C.v.R., J.A., N.C., B.H., B.d.W., M.J.S., C.A., andL.v.E. researched data. J.M.F.G.A. contributed to discussion and reviewed/edited themanuscript. M.v.E. wrote the manuscript and researched data. M.v.E. is theguarantor of this work and, as such, had full access to all the data in the study andtakes responsibility for the integrity of the data and the accuracy of the data analysis.
References1. Hotamisligil GS. Inflammation and metabolic disorders. Nature 2006;444:860–8672. Weisberg SP, McCann D, Desai M, Rosenbaum M, Leibel RL, Ferrante AWJr. Obesity is associated with macrophage accumulation in adipose tissue. J ClinInvest 2003;112:1796–18083. Wu D, Molofsky AB, Liang HE, et al. Eosinophils sustain adipose alterna-tively activated macrophages associated with glucose homeostasis. Science2011;332:243–247
4. Molofsky AB, Nussbaum JC, Liang HE, et al. Innate lymphoid type 2 cellssustain visceral adipose tissue eosinophils and alternatively activated macro-phages. J Exp Med 2013;210:535–5495. Schipper HS, Rakhshandehroo M, van de Graaf SF, et al. Natural killer T cellsin adipose tissue prevent insulin resistance. J Clin Invest 2012;122:3343–33546. Feuerer M, Herrero L, Cipolletta D, et al. Lean, but not obese, fat is enrichedfor a unique population of regulatory T cells that affect metabolic parameters. NatMed 2009;15:930–9397. Elgazar-Carmon V, Rudich A, Hadad N, Levy R. Neutrophils transiently in-filtrate intra-abdominal fat early in the course of high-fat feeding. J Lipid Res2008;49:1894–19038. Nishimura S, Manabe I, Nagasaki M, et al. CD8+ effector T cells contributeto macrophage recruitment and adipose tissue inflammation in obesity. Nat Med2009;15:914–9209. Winer S, Chan Y, Paltser G, et al. Normalization of obesity-associated insulinresistance through immunotherapy. Nat Med 2009;15:921–92910. Liu J, Divoux A, Sun J, et al. Genetic deficiency and pharmacological sta-bilization of mast cells reduce diet-induced obesity and diabetes in mice. NatMed 2009;15:940–94511. Winer DA, Winer S, Shen L, et al. B cells promote insulin resistance throughmodulation of T cells and production of pathogenic IgG antibodies. Nat Med 2011;17:610–61712. Lumeng CN, DelProposto JB, Westcott DJ, Saltiel AR. Phenotypic switchingof adipose tissue macrophages with obesity is generated by spatiotemporaldifferences in macrophage subtypes. Diabetes 2008;57:3239–324613. Lumeng CN, Bodzin JL, Saltiel AR. Obesity induces a phenotypic switch inadipose tissue macrophage polarization. J Clin Invest 2007;117:175–18414. Cinti S, Mitchell G, Barbatelli G, et al. Adipocyte death defines macrophagelocalization and function in adipose tissue of obese mice and humans. J Lipid Res2005;46:2347–235515. Kosteli A, Sugaru E, Haemmerle G, et al. Weight loss and lipolysis promotea dynamic immune response in murine adipose tissue. J Clin Invest 2010;120:3466–347916. Prieur X, Mok CY, Velagapudi VR, et al. Differential lipid partitioning betweenadipocytes and tissue macrophages modulates macrophage lipotoxicity and M2/M1 polarization in obese mice. Diabetes 2011;60:797–80917. Ripoll VM, Irvine KM, Ravasi T, Sweet MJ, Hume DA. Gpnmb is induced inmacrophages by IFN-gamma and lipopolysaccharide and acts as a feedbackregulator of proinflammatory responses. J Immunol 2007;178:6557–656618. Anderson MG, Smith RS, Hawes NL, et al. Mutations in genes encodingmelanosomal proteins cause pigmentary glaucoma in DBA/2J mice. Nat Genet2002;30:81–8519. Safadi FF, Xu J, Smock SL, Rico MC, Owen TA, Popoff SN. Cloning andcharacterization of osteoactivin, a novel cDNA expressed in osteoblasts. J CellBiochem 2001;84:12–2620. Shikano S, Bonkobara M, Zukas PK, Ariizumi K. Molecular cloning ofa dendritic cell-associated transmembrane protein, DC-HIL, that promotes RGD-dependent adhesion of endothelial cells through recognition of heparan sulfateproteoglycans. J Biol Chem 2001;276:8125–813421. Bandari PS, Qian J, Yehia G, et al. Hematopoietic growth factor inducibleneurokinin-1 type: a transmembrane protein that is similar to neurokinin 1 in-teracts with substance P. Regul Pept 2003;111:169–17822. Chung JS, Sato K, Dougherty II, Cruz PD Jr, Ariizumi K. DC-HIL is a negativeregulator of T lymphocyte activation. Blood 2007;109:4320–432723. Chung JS, Dougherty I, Cruz PD Jr, Ariizumi K. Syndecan-4 mediates thecoinhibitory function of DC-HIL on T cell activation. J Immunol 2007;179:5778–578424. Chung JS, Yudate T, Tomihari M, Akiyoshi H, Cruz PD Jr, Ariizumi K. Bindingof DC-HIL to dermatophytic fungi induces tyrosine phosphorylation and poten-tiates antigen presenting cell function. J Immunol 2009;183:5190–519825. Mistry PK, Liu J, Yang M, et al. Glucocerebrosidase gene-deficient mouserecapitulates Gaucher disease displaying cellular and molecular dysregulationbeyond the macrophage. Proc Natl Acad Sci U S A 2010;107:19473–19478
3322 Lysosomal Stress, Obese ATM Phenotype, and MITF Diabetes Volume 63, October 2014

26. Langeveld M, Ghauharali KJ, Sauerwein HP, et al. Type I Gaucher disease,a glycosphingolipid storage disorder, is associated with insulin resistance. J ClinEndocrinol Metab 2008;93:845–85127. Sardiello M, Palmieri M, di Ronza A, et al. A gene network regulating ly-sosomal biogenesis and function. Science 2009;325:473–47728. Rehli M, Lichanska A, Cassady AI, Ostrowski MC, Hume DA. TFEC is a mac-rophage-restricted member of the microphthalmia-TFE subfamily of basic helix-loop-helix leucine zipper transcription factors. J Immunol 1999;162:1559–156529. Yang X, Schadt EE, Wang S, et al. Tissue-specific expression and regulationof sexually dimorphic genes in mice. Genome Res 2006;16:995–100430. Ghazalpour A, Doss S, Zhang B, et al. Integrating genetic and networkanalysis to characterize genes related to mouse weight. PLoS Genet 2006;2:e13031. Wang J, Williams RW, Manly KF. WebQTL: web-based complex trait anal-ysis. Neuroinformatics 2003;1:299–30832. Cousin SP, Hügl SR, Wrede CE, Kajio H, Myers MG Jr, Rhodes CJ. Free fattyacid-induced inhibition of glucose and insulin-like growth factor I-induced de-oxyribonucleic acid synthesis in the pancreatic beta-cell line INS-1. Endocrinology2001;142:229–24033. Schadt EE, Molony C, Chudin E, et al. Mapping the genetic architecture ofgene expression in human liver. PLoS Biol 2008;6:e10734. Nomiyama T, Perez-Tilve D, Ogawa D, et al. Osteopontin mediates obesity-induced adipose tissue macrophage infiltration and insulin resistance in mice.J Clin Invest 2007;117:2877–288835. Martina JA, Puertollano R. Rag GTPases mediate amino acid-dependentrecruitment of TFEB and MITF to lysosomes. J Cell Biol 2013;200:475–49136. Roczniak-Ferguson A, Petit CS, Froehlich F, et al. The transcription factorTFEB links mTORC1 signaling to transcriptional control of lysosome homeostasis.Sci Signal 2012;5:ra4237. Sarbassov DD, Ali SM, Sabatini DM. Growing roles for the mTOR pathway.Curr Opin Cell Biol 2005;17:596–60338. Xu X, Grijalva A, Skowronski A, van Eijk M, Serlie MJ, Ferrante AW Jr. Obesityactivates a program of lysosomal-dependent lipid metabolism in adipose tissuemacrophages independently of classic activation. Cell Metab 2013;18:816–830
39. Settembre C, Zoncu R, Medina DL, et al. A lysosome-to-nucleus signallingmechanism senses and regulates the lysosome via mTOR and TFEB. EMBO J2012;31:1095–110840. Settembre C, Fraldi A, Medina DL, Ballabio A. Signals from the lysosome:a control centre for cellular clearance and energy metabolism. Nat Rev Mol CellBiol 2013;14:283–29641. Sancak Y, Bar-Peled L, Zoncu R, Markhard AL, Nada S, Sabatini DM. Ra-gulator-Rag complex targets mTORC1 to the lysosomal surface and is necessaryfor its activation by amino acids. Cell 2010;141:290–30342. Ripoll VM, Meadows NA, Raggatt LJ, et al. Microphthalmia transcriptionfactor regulates the expression of the novel osteoclast factor GPNMB. Gene 2008;413:32–4143. Loftus SK, Antonellis A, Matera I, et al.; NISC Comparative SequencingProgram. Gpnmb is a melanoblast-expressed, MITF-dependent gene. PigmentCell Melanoma Res 2009;22:99–11044. Haq R, Fisher DE. Biology and clinical relevance of the micropthalmia familyof transcription factors in human cancer. J Clin Oncol 2011;29:3474–348245. Qian X, Mills E, Torgov M, LaRochelle WJ, Jeffers M. Pharmacologicallyenhanced expression of GPNMB increases the sensitivity of melanoma cells tothe CR011-vcMMAE antibody-drug conjugate. Mol Oncol 2008;2:81–9346. Mo JS, Anderson MG, Gregory M, et al. By altering ocular immune privilege,bone marrow-derived cells pathogenically contribute to DBA/2J pigmentaryglaucoma. J Exp Med 2003;197:1335–134447. Saltiel AR. Insulin resistance in the defense against obesity. Cell Metab2012;15:798–80448. Li B, Castano AP, Hudson TE, et al. The melanoma-associated trans-membrane glycoprotein Gpnmb controls trafficking of cellular debris for degra-dation and is essential for tissue repair. FASEB J 2010;24:4767–478149. Martinez FO, Helming L, Gordon S. Alternative activation of macrophages:an immunologic functional perspective. Annu Rev Immunol 2009;27:451–48350. Nakamura A, Ishii A, Ohata C, Komurasaki T. Early induction of osteoactivinexpression in rat renal tubular epithelial cells after unilateral ureteral obstruction.Exp Toxicol Pathol 2007;59:53–59
diabetes.diabetesjournals.org Gabriel and Associates 3323