LYRA Response and Calibration
17
LYRA Response and Calibration LYRA Response and Calibration SCSL Meeting Bern 29 Nov - 01 Dec 2006 LYRA the Lyman-alpha Radiometer onboard PROBA-2
-
Upload
colt-davidson -
Category
Documents
-
view
43 -
download
0
description
LYRA Response and Calibration. SCSL Meeting Bern 29 Nov - 01 Dec 2006. Contents. I. Cadence, Response Time II. Calibration Software. I. Cadence, Response Time. Instrumental or Source Noise?. Channel 2-3 (Al + MSM15): Beam trend plus sinus (approx. 20 s) - PowerPoint PPT Presentation
Transcript of LYRA Response and Calibration

LYRA Response and CalibrationLYRA Response and Calibration
SCSL Meeting Bern 29 Nov - 01 Dec 2006
LYRAthe Lyman-alpha Radiometer onboard PROBA-2

I. Cadence, Response Time
II. Calibration Software
Contents

I. Cadence, Response TimeI. Cadence, Response Time


Instrumental or Source Noise?
Channel 2-3 (Al + MSM15): Beam trend plus sinus (approx. 20 s)
Channel 3-3 (Al + AXUV20B): Beam trend plus irregular fluctuations
Confirmed by other observations with these channels (but no sinus in pure LED signal and dark)
Exposure time < 200 ms: A different kind of noise takes over
Almost Gaussian distribution, width depends on count level
Conclusions for integration time?
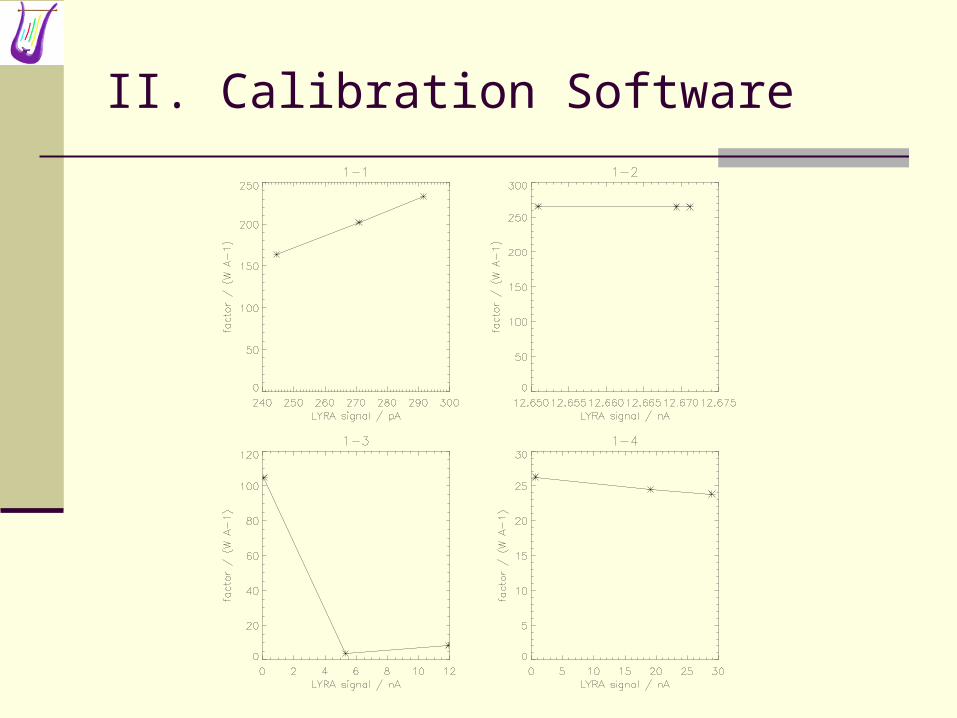
II. Calibration Software

1-1: Ly XN + MSM12 (121.5 +/- nm)
sample total pure rest solar------ ----------- -------------------- ----------- ---------------min 0.244548 nA 0.0578922 nA (23.7%) 0.186656 nA 0.00564762 Wm-2high 0.270879 nA 0.0794356 nA (29.3%) 0.191444 nA 0.00774904 Wm-2max 0.291520 nA 0.0985021 nA (33.8%) 0.193018 nA 0.00960818 Wm-2

[LYRA 1-1 rest signal / nA] = 0.015 * [LYRA 1-2 total signal / nA]
[LYRA 1-1 pure signal / nA] = [LYRA 1-1 total signal / nA] - [LYRA 1-1 rest signal / nA]
["Lyman-alpha" solar signal / (W m-2)] = 0.0975 * [LYRA 1-1 pure signal / nA]

1-2: Herzberg + PIN10 (200-220 nm)
sample total pure rest solar------ ---------- ------------------ ---------- -------------min 12.6509 nA 10.6056 nA (83.8%) 2.04531 nA 0.474210 Wm-2high 12.6712 nA 10.6056 nA (83.7%) 2.06564 nA 0.474210 Wm-2max 12.6694 nA 10.6056 nA (83.7%) 2.06385 nA 0.474210 Wm-2

[LYRA 1-2 pure signal / nA] = 0.837 * [LYRA 1-2 total signal / nA]
["Herzberg" solar signal / (W m-2)] = 0.0447 * [LYRA 1-2 pure signal / nA]

1-3: Aluminium + MSM11 (17-80 nm)
sample total pure rest solar------ ------------ -------------------- ------------ ---------------min 0.0884238 nA 0.0540079 nA (61.1%) 0.0344159 nA 0.00131051 Wm-2high 5.31929 nA 0.134685 nA ( 2.5%) 5.18460 nA 0.00340476 Wm-2max 11.9076 nA 0.563424 nA ( 4.7%) 11.3442 nA 0.0111131 Wm-2

[LYRA 1-3 rest signal / nA] = interp[LYRA 1-4 total signal / nA]
[LYRA 1-3 pure signal / nA] = [LYRA 1-3 total signal / nA] - [LYRA 1-3 rest signal / nA]
["Aluminium" solar signal / (W m-2)] = interp[LYRA 1-3 pure signal / nA]

1-4: Zr(300nm) + AXUV20D (1-20 nm)
sample total pure rest solar------ ----------- ------------------ -------------- ---------------min 0.720131 nA 0.720074 nA (100.%) 0.000057676 nA 0.00267627 Wm-2high 19.0501 nA 19.0500 nA (100.%) 0.000131450 nA 0.0659849 Wm-2max 28.9357 nA 28.9349 nA (100.%) 0.000804690 nA 0.0975310 Wm-2
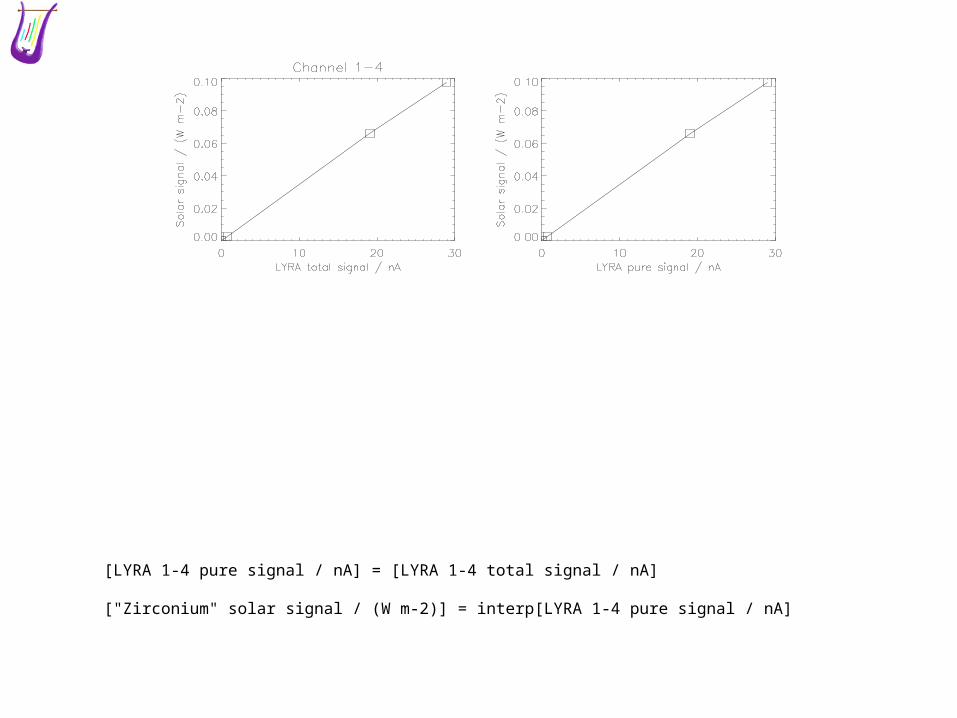
[LYRA 1-4 pure signal / nA] = [LYRA 1-4 total signal / nA]
["Zirconium" solar signal / (W m-2)] = interp[LYRA 1-4 pure signal / nA]

Status and Future Work
From LYRA current to solar flux; flatfield (off-pointing) TBD: From LYRA counts to LYRA current 3 TIMED/SEE data sets (“min” = Solar Minimum 24 Feb 2005,
“high” = High Solar Flux 11 Nov 2003, “max” = Solar Maximum 28 Oct 2003)
TBD: Confirm approach with more examples TBD: Simulate special events Inflight: Cross-calibration within LYRA heads during
commissioning phase before release of calibrated data