LéXPLORE platform Scientific Report 2021
61
LéXPLORE platform Scientific Report 2021 Reporting from 29 projects until July 2021 Compiled by Natacha Tofield-Pasche and the project leaders 1
Transcript of LéXPLORE platform Scientific Report 2021

LéXPLORE platform
Scientific Report 2021
Reporting from 29 projects until July 2021
Compiled by Natacha Tofield-Pasche and the project leaders
1

Annual reporting from the current projects
1. Wüest Johny, Fernandez Castro Bieito, Ulloa Hugo, Minaudo Camille, Lavanchy Sébastien,Shubham Krishna, Piccolroaz Sebastiano, Chmiel Hannah: Primary production underoligotrophication in lakes
2. Odermatt Daniel, Runnals James, Abolfazl Irani Rahaghi, Remika Gupana, Anita Schlatter,Camille Minaudo: Whitening detection and optical characterization (W-DOC)
3. Mridul Thomas, Pomati Francesco, Suarez Ena, Fillion Roxane, Ibelings Bastiaan,: Plankton inLake Geneva : you can’t have it both ways
4. Perga Marie-Elodie, Perolo Pascal, Lambert Thibault, Escoffier Nicolas, Chmiel Hannah, FernandezCastro Bieito, Bouffard Damien : CARBOGEN: carbon cycling in Lake Geneva
5. Piccolroaz Sebastiano, Fernandez Castro Bieito, Alfred Wüest, Chmiel Hannah, Minaudo Camille,Pascal Perolo, Troy Cary: Surface Turbulence and CO2 Lake Exchange Experiment (CO2LEX)
6. Guillard Jean, Rautureau Clément, Tran-Khac Viet, Goulon Chloé: LéXfish: monitoring fishpresence below LéXPLORE
7. Haltiner Linda, Piet Spaak, Dennis Stuart: Life in the deep: colonisation by Dreissena along adepth gradient
8. Breider Florian, Hanahan Jonathan, Vernez Karine, Coudret Sylvain, Loizeau Jean-Luc: Depositionand Accumulation of Microplastics in Lake Sediments (Microsed)
9. Bouffard Damien, Sebastiano Piccolroaz, , Gil Coto Miguel, Lavanchy Sébastien, CunilleraGuillaume, Dinkel Christian, Fernandez Castro Bieito: LéWalk: autonomous turbulence profiling
10. Gallorini Andrea, Arpagaus Philippe, Loizeau Jean-Luc: MetOxiC : Methylmercury in Oxic waterColumn
11. Lattaud Julie: Seasonal isotopic variation of long-chain diols as a proxy for environmentalconditions in lakes
12. Maner Jenny, Drieschner Carolin, Ebi Christian, Schönenberger René, Angst Levin, Bloem Simon,Solsona Miguel, Renaud Philippe, Schirmer Kristin: Rainbowflow chiponline: Fishcell biosensor forautomated water quality testing
13. Jézéquel Didier, Moiron Marthe, Perga Marie-Elodie, Escoffier Nicolas: DynaMeth - Dynamicsand origin of methane in the water column of Lake Geneva
14. Bouffard Damien, Bieito Fernandez Castro, Piccolroaz Sebastiano, Michäel Plüss, SebastienLavanchy, Wüest Alfred: Skin2Bulk: investigating the surface boundary layer
15. Ibelings Bastiaan, Thomas Mridul, Fillion Roxane, Mesman Jorrit, Devanthery Matthieu, de LoesSebastien, MUSE-Master students, Müller Beat: POETICS - PlanktOn vErTICal Structure
2

16. Carratalà Anna, Chmiel Hannah, Joost Stéphane, Janssen Elisabeth, Kohn Tamar: Unravelling the diversity, functioning and toxin production of cyanobacteria populations in lake Geneva(CYANOFUN)
17. Beauvais Rébecca, Casado-Martinez Carmen, Lüthi Christina, Ferrari Benoît: LéXPOCHIRO: Effects of lake suspended matter quality on growth, emergence and molecular endpoints in Chironomus riparius
18. Piccolroaz Sebastiano, Cunillera Guillaume, Chmiel Hannah, Perolo Pascal, Lavanchy Sébastien: caGAStrophic: designing a low-cost, automated, floating chamber for gas flux measurements at the air-water interface of water bodies
19. Adam Nicolas, Selz Jonathan, Lecine Sofian, Hirt Timothée, Deloose Christophe, Bernier-Latmani Rizlan, Maerkl Sebastian: GenoRobotics CoWaS - Continuous Water Sampling
20. Bellouard Yves, Rey Samuel, Ayer Baptiste, Sala Federico, Ibelings Bastiaan, Pomati Francesco: PhytoWaveTaxa: all glass sensors for algae population monitoring
21. Violaine Piton, Wynn Htet Kyi, Barry Andrew, Reiss Rafael: Test measurements for Long-Range ADCP parametrization
22. Maxime Hedou, Jeremy Luterbacher, Lorenz Manker: Biodegradability assessment of PBX, a sustainable bio-polyester developed at EPFL
23. Bahr Alexander, Schill Felix, Lavanchy Sébastien, Cunillera Guillaume: SUBMULE – easy access to submerged data
24. Ibelings Bastiaan, Alegre Stelzer Julio, Mesman Jorrit, Fillion Roxane, Suarez Ena: Winter Blitz Cancelled.
Final report for completed projects
25. Bouffard Damien, Fotis Georgatos, Bouillet Eric, Perez Cruz Fernando, Minaudo Camille, LavanchySébastien, Sukys Jonas, Safin Artur, Tran-Khac Viet, Runnalls James: DATALAKES - Heterogeneousdata platform for operational modelling and forecasting of Swiss lakes
26. Doda Tomy, Bieito Fernández Castro, Ulloa Hugo, Ramon Casanas Cintia, Damien Bouffard:Buoyancy driven nearshore flows in lakes (HYPOTHESYS, experiments on LéXPLORE)
27. Müller Beat, Kathriner Patrick: In-situ pursuit of whitening events applying a micro-titrator foralkalinity
28. Joost Stéphane, Carratalà Anna, Charlotte Weil, Vajana Elia, Guillaume Annie, Kohn Tamar: Localadaptation of bacteria communities to environmental conditions (LAC)
29. Barry Andrew, Foroughan Mehrshad, Porté-Agel Fernando: Spatio-temporal analysis of windfield characteristics over Lake Geneva
30. Torsten Vennemann and Cotte Gabriel, Mixing of Rhône River in Lake Geneva. No report.
3

Project report from October 2018 until June 2021
Primary production under oligotrophication in lakes
Alfred Wüest, Hannah Chmiel, Bieito Fernández Castro, Camille Minaudo, Shubham Krishna, Sebastiano Piccolroaz
This SNF-funded project is targeting the quantification of primary production (PP) rates from new observation approaches with the overall goal to better understand the dynamics of PP in stratified lakes under simultaneous climate warming and oligotrophication. The project consists of several parts, which focus on i) the improvement and application of the diel oxygen method for daily-scale PP and net ecosystem production (NEP) estimates, ii) the development of new tools to quantify PP from bio-optical measurements and remote sensing, and iii) the investigation of physical processes (energy transfer, vertical diffusion, gas exchange), which shape the environment for primary producers and impact PP quantification. The LéXPLORE platform serves as primary study site for these projects playing a crucial role for fieldwork realization, secured on-line sampling and automatic data transmission.
1) Diel method for PP quantification
The automated monitoring of oxygen (O2), carbon dioxide (CO2), photosynthetically active radiation (PAR) and water temperature from moored instruments (multiple depths from 0-30/50m) started in October 2018 within the protective circle of the LéXPLORE platform and the minimum requirement of two complete years of measurements was achieved by the end of 2020. This high-frequency dataset serves to trace the curse of O2 and CO2, during hours of light and darkness from which PP and NEP can be deducted. However, the temporal course of these variables at different depths was shown to be strongly affected by high-amplitude vertical motions hindering the direct calculation of metabolic rates. To overcome these difficulties, we developed two correction routines allowing to estimate NEP from a fortnight-scale DO budget and daily PP rates with a spectral approach. These methods and the results of a complete summer NEP and PP rates in Lake Geneva (Fig. 1) were published in the journal of Water Resources Research in 2021. Using these new approaches, we are currently working on an inter-seasonal and -annual comparison of PP and NEP rates linked to their environmental drivers.
Figure 1: Primary and net ecosystem production estimates over summer 2019 derived from the diel DO method using in-situ data of moored instruments at the LéXPLORE platform.
4

Project report from October 2018 until June 2021
Published article: Fernández Castro, B., Chmiel, H. E., Minaudo, C., Krishna, K., Perolo, P., Rasconi, S. & A. Wüest (2021). Primary and net ecosystem production in a large lake diagnosed from high-resolution oxygen measurements. Water Resources Research, 57(5), e2020WR029283. https://doi.org/10.1029/2020WR029283
Article in preparation: Chmiel, H. E., Perolo, P., Fernández Castro, B., Minaudo, C., Krishna, K., Rasconi, S. & A. Wüest. Drivers and role of metabolism for carbon and nutrient cycling in Lake Geneva. In preparation for Ecosystems.
2) In-situ optical properties
The WetLabs Thetis multiparameter autonomous profiler (Fig. 2) was operated on LéXPLORE since October 2018. The profiler consists of a suite of bio-optical and classical CTD sensors mounted on a positively buoyant frame equipped with an onboard electric winch. The profiler holds instruments that measure hyperspectral absorption and attenuation (WetLabs AC-S), backscattering (at 440, 532, 630, 700 nm at 117°) and fluorescence by chlorophyll-a (CHLa, EX/EM: 470/695 nm), colored dissolved organic matter (CDOM; EX/EM: 370/460 nm) with WetLabs ECO Triplets BBFL2W and BB3W, hyperspectral downwelling irradiance and upwelling radiance (Satlantic HOCRs), PAR radiation (WetLabs ECO PARS), conductivity, temperature, pressure (Sea-Bird CTD SBE49) and dissolved oxygen (Sea-Bird SBE63). From October 2018 to June 2021, we have collected 2200 Thetis profiles of the top 50 m of the water column, with an ~8 cm s-1 ascending rate every 3 hours from October 2018 to June 2020, and every 6 hours afterwards.
Our objectives were to i) characterize the temporal and vertical patterns in lake optical properties, ii) evidence the link with the dynamics of primary production, and iii) to connect underwater hyperspectral reflectance measured with the Thetis to remotely sensed reflectance retrieved from sentinel-3 OLCI products.
Figure 2: Left and central panels: detailed view of the WetLabs Thetis profiler operated from the LéXPLORE platform. Right panel: timeseries of aLH676, c630 and O2-based GPP estimates during the period March-May 2020, normalized by the overall observed average values. After Minaudo et al., under review in Environmental Science & Technology.
5

Project report from October 2018 until June 2021
From the unparalleled density of Inherent Optical Properties (absorption, attenuation, backscattering) profiles in Lake Geneva, we identified within the photic layer systematic diel patterns in absorption line height at 676 nm (aLH676, known as a good proxy for Chlorophyll-a) and in attenuation at 630 nm (c630), that we successfully connected to the lake PP (Figure 2). Diel amplitudes in these IOPs were compared to GPP estimates based on the diel O2-method (see section 1 above). Although direct comparison of daily values leads to weak correlations between IOPs diel amplitudes and O2-derived GPP, temporal dynamics were comparable. These results prove the usefulness of high-frequency IOP measurements in lakes to better quantify lake carbon budgets.
The database is currently being analysed to characterize the short-term variations in the vertical patterns of lake IOPs and how the relate to the lake thermal and chemical stratification. The Thetis dataset already serves as data example in several other publications related to environmental monitoring of surface waters, see below.
Submitted article: Minaudo C., D. Odermatt, D. Bouffard, A. Irani Rahaghi, S. Lavanchy. & A. Wüest. The imprint of primary production on high-frequency profiles of lake optical properties. Submitted to Environmental Science & technology (major revision)
Submitted article: Russo S., M. Besmer, F. Blumensaat, D. Bouffard, A. Disch, F. Hammes, A. Hess, M. Lürig, B. Matthews, C. Minaudo, E. Morgenroth, and K. Villez. The value of human data annotation for machine learning based anomaly detection in environmental systems. Submitted to Water Research.
Submitted article: El Serafyi G.Y., B.A. Schaeffer, K.C. Weathers, C. Minaudo and others. Integrating inland and coastal water quality measures: merging data for actionable knowledge. Submitted to Remote Sensing.
Article under preparation: Irani Rahaghi A., C. Minaudo, A. Damm, D. Odermatt. The imprint of primary production on high-frequency profiles of lake optical properties. Under preparation for Remote Sensing. Article under preparation: Bouffard D., J. Runnalls, C. Minaudo and others. Datalakes, a collaborative web-based platform to facilitate visualisation and dissemination of reproducible dataset for freshwater systems. Under preparation for Earth System Science Data.
3) Energy budget, turbulent mixing and gas exchange
Turbulent mixing, convection, and advective transport are key physical processes contributing to shape the PP and ecological dynamics in a water body. For this reason, parallel to the moored measurements of temperature, O2, CO2, and PAR, velocity and turbulence measurements have also been acquired. Specifically, i) in-continuous velocity profiles in the range 0-100 m depth have been recorded through two Acoustic Doppler Current Profilers (ADCPs; April 2019 - ongoing), ii) near-bed temperature, current velocities and turbulence have been measured with a bottom-mounted high-resolution ADCP including a series of thermistors (August 2019 – ongoing), and iii) regular microstructure profiles of temperature and shear have been collected with the micro-profilers MicroCTD and VMP on approximately a weekly basis (March 2019 - ongoing). This unique dataset is completed by continuous records of meteorological variables measured directly at the platform, from which the main (heat and mechanical) energy fluxes between the lake and overlying atmosphere are estimated. The analysis of these data was aimed at addressing two main aspects: i) the characterization of the energy pathways across seasons and ii) the understanding of CO2 turbulent fluxes at the lake-atmosphere interface at various temporal and spatial scales. As for the first aspect, the results have been summarized in a
6

Project report from October 2018 until June 2021
manuscript currently under review in Nature Communications Earth & Environment, which provides a complete picture of lake mechanical energy pathways, showing that they are strongly modulated by temperature stratification and wind intensity and contributing to improving our understanding of the sensitivity of such ecosystems to changes in the external forcing (Fig. 3). The latter activity is still ongoing, and a manuscript is in preparation for Environmental Fluid Mechanics. The combination of high resolution microstructure profiles acquired in upward mode (to allow measuring close-to-the-surface turbulence) and CO2 fluxes at the lake-atmosphere interface measured with low-cost floating chambers shows that both fine-scale near-surface stratification and long-lasting large-scale motions are relevant in affecting CO2 fluxes, thus challenging the application of existing gas flux models, which typically do not consider these aspects. More details are explained in the subproject CO2LEX: surface turbulence and CO2 Lake Exchange Experiments.
Figure 3: Energy sources and sinks: Annual and seasonal averaged energy sources and sinks in Lake Geneva for the period April 2019 – April 2020. Energy input: wind energy flux at 10 m and rate of wind work on surface currents. Dissipation: depth-integrated water-column interior TKE dissipation, depth-integrated bottom boundary layer TKE dissipation and laminar dissipation in the viscous bottom boundary layer. Mixing: water-column interior buoyancy flux. Energy residence time (days). Energy fluxes are in mW/m2 and mechanical energy (ME = KE + PE) in J/m2.
Submitted article: Fernández Castro, B., Bouffard, D., Troy, C., Ulloa, H.N., Piccolroaz, S., Sepúlveda Steiner, Chmiel, H. E., Serra Moncadas, L., Lavanchy, S. & A. Wüest. Seasonal pathways of mechanical energy in a large lake. Submitted to Nature Communications Earth & Environment In preparation article: Piccolroaz, S., Fernández Castro, B., Chmiel, H. E., Perolo, P., Perga, M.-E. & A. Wüest. and Alfred Wüest. CO2 flux in a large perialpine lake governed by near-surface stratification and internal motions. In preparation for Environmental Fluid Mechanics
7

Project report from January 2021 until June 2021
Whiting detection and optical characterization (w-doc)
Daniel Odermatt, Abolfazl Irani Rahaghi, Remika Gupana, Anita Schlatter, James Runnals and Camille Minaudo
Whitings have a very prominent visual appearance, but their assessment using optical remote sensing is limited to a few empirical studies because dedicated measurements are hard to plan ahead. We previously investigated two major whiting events in Lake Geneva using optical Earth observation satellite imagery, one occurring in mid-June 2014 [1] and in mid-June to mid-July 2019 [2]. In both cases only retrospective image analyses were available. In the w-doc project, we monitor satellite imagery available in http://www.datalakes-eawag.ch/ and LéXPLORE optical measurements in near-real time in order to coordinate further in situ measurements of inherent and apparent optical properties in the vicinity of the platform. In addition, we acquire hyperspectral data with the airborne AVIRIS-NG imaging spectrometer operated by NASA and ESA in collaboration with the University of Zurich.
In early summer 2021 we carried out three AVIRIS-NG campaigns with concurrent in situ measurement campaigns. A Sentinel-2 image of the whiting occurring during this period and some campaign planning information is given in Figure 1. The flight patterns were chosen in north-south direction in order to minimize sun-glint for overflight times around noon. They cover the central part of the lake including the location of the LéXPLORE station and the main monitoring station SHL2. The flights were carried during almost perfectly cloud-free conditions on May 20, June 11 and June 16, 2021. Technical issues with the AVIRIS-NG sensor occurred during the first flight, therefore we aim for a third flight campaign in the end of June. A team of Eawag researchers performed in situ measurements in six locations during all flights. The parameters we measured comprise of water-leaving reflectance, bulk absorption, scattering and backscattering, as well as the spectral absorption of dissolved organic carbon, particles and phytoplankton pigments. The same parameters were acquired several times a day by the automated Thetis profiler at LéXPLORE, in particular in early June when persistent cloud coverage prevented air- or spaceborne observations.
We will complement this uniquely comprehensive dataset of optical measurements acquired during a whiting event with another AVIRIS-NG and ground sampling campaign in the end of June. The next step will be to generalize a bio-optical model that reproduces the change in bio-optical properties during the course of a whiting event. Based on this model, we will be able to distinguish spatially concurring whiting stages in AVIRIS-NG data, and to evaluate to what degree daily observations by the Sentinel-2 and Sentinel-3 satellites can provide the same information on a continuous basis.
[1] V. Nouchi et al., “Resolving biogeochemical processes in lakes using remote sensing,” Aquatic Sciences, vol. 81(2), no. 2, p. 27, 2019, doi: https://doi.org/10.1007/s00027-019-0626-3.
[2] N. Escoffier et al., “Whiting events in a large peri-alpine lake: Evidence of a catchment-scale process,” Journal of Geophysical Research: Biogeosciences, submitted.
8

Project report from January 2021 until June 2021
Figure 1 : Sentinel-2 true colour image of Lake Geneva, 18 June 2021, showing a whiting extending from the
Rhone estuary along the north-eastern shore. AVIRIS-NG data coverage is indicated by dashed flight paths and
white outlines, locations of the LéXPLORE platform and SHL2 are shown as red triangle outlines, in situ matchup
measurement locations are shown as small, green triangles.
9

Upcoming project
Plankton in Lake Geneva: you can’t have it both ways
Mridul Thomas, Bastiaan Ibelings, Ena Suarez, Roxane Fillion, and Francesco Pomati
Organisms face trade-offs in how they use energy and resources to grow, acquire resources, and defend themselves. The existence of these trade-offs helps maintain a diversity of species in natural communities, because no one species can be best at everything. This governs which species are present at any particular time, how communities change over time, and consequently they shape ecosystems. Despite this, we don’t really know what the trade-offs that phytoplankton communities face are, even though they are responsible for nearly half of all photosynthesis. We are using high-frequency monitoring data from Lac Leman and machine learning techniques to try to uncover what these trade-offs are. Once we understand this, we will be better placed to forecast how communities and ecosystems will change in the future.
Goals
Our goal is to understand the determinants of community assembly in the phytoplankton of Lake Geneva, and how environmental variation shapes coexistence and biodiversity patterns in the lake.
Expected results
1) quantify the response surfaces that characterize how phytoplankton growth changes in response to their environmental conditions. We will repeat this for all the taxa in the community that we detect more than 100 times across the time series.
2) estimate the maximum growth rate of each taxon under a wide range of environmental conditions (low and high phosphorus, light, temperature, and grazing pressure).
3) identify correlations in these performance ‘traits’ that indicate underlying ecophysiological trade-offs.
4) model how environmental variation and directional environmental change will affect the composition and diversity of the phytoplankton community, especially of species that form harmful algal blooms.
Next steps
1) installation of the automated sampling system for regular Cytobuoy measurements across depths (June / July 2021)
2) acquisition and installation of nutrient sensors to complement the existing physical, chemical, and biological measurements.
3) continuous monitoring of phytoplankton and nutrients alongside existing physical and chemical variables.
4) development of machine learning model to identify taxa from the Cytobuoy measurements, based on the images obtained for a subset of individuals (initial model developed, further validation required).
5) quantification of dynamics of all taxa in the community using trained machine learning model 6) quantify the response of each taxon to environmental variation using machine learning
techniques. 7) identify trade-offs by comparing species’ partial responses to multiple environmental axes.
10

Upcoming project
An example response surface indicating how growth rate changes across 4 interacting environmental dimensions for a single phytoplankton species. This surface was extracted using machine learning techniques (specifically gradient boosting machines) applied to a low-resolution time series (the lake was sampled once per 2 weeks). With our anticipated high-resolution time series from LéXPLORE, we will be able to capture a higher resolution response surface for most species in the community.
The estimated growth rates (µ) under high and low phosphorus
conditions for every phytoplankton species in a lake community,
extracted from species’ response surfaces such as that shown in the
previous figure. The expected trade-off based on decades of ecological
research implies a negative slope, but our analysis shows this trade-
off does not exist. Species that grow fastest (high µ) at low resources
also grow fastest at high resources. Other trade-offs remain to be
discovered. With the high-resolution time series from LéXPLORE, we
expect to uncover the true trade-off that operates in the Lake Geneva
phytoplankton community.
11
Project report from June 2020 until June 2021
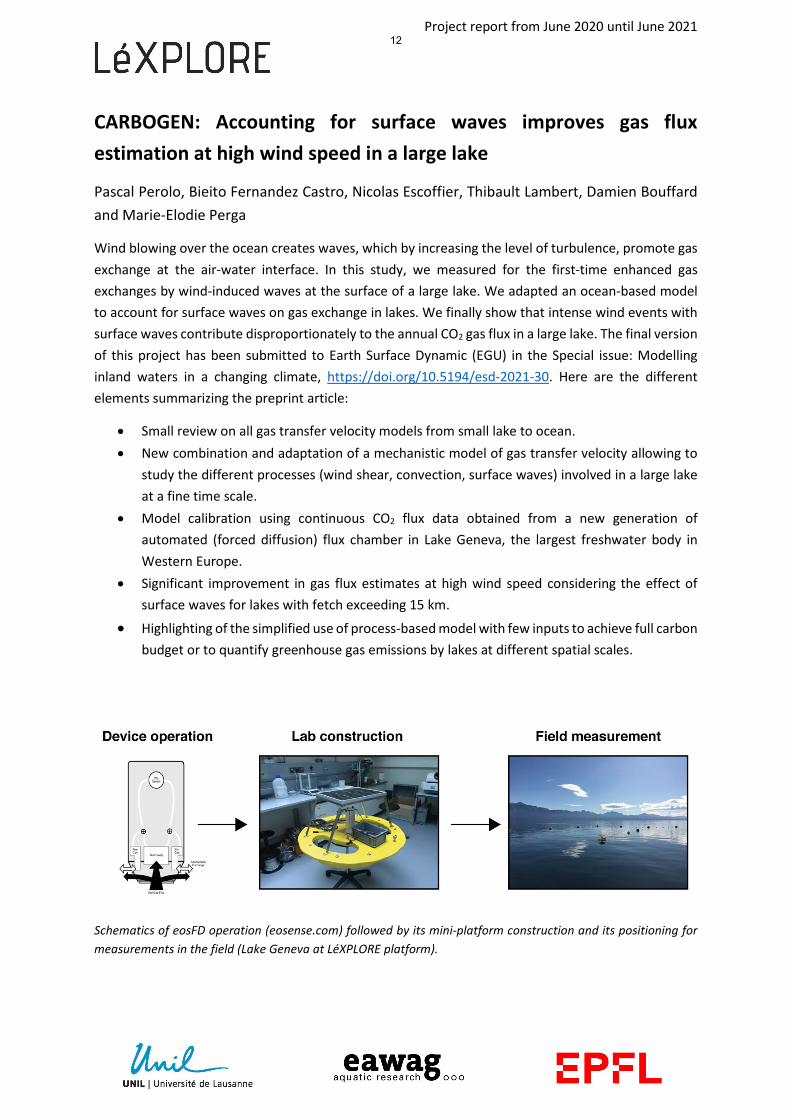
CARBOGEN: Accounting for surface waves improves gas flux estimation at high wind speed in a large lake
Pascal Perolo, Bieito Fernandez Castro, Nicolas Escoffier, Thibault Lambert, Damien Bouffard and Marie-Elodie Perga
Wind blowing over the ocean creates waves, which by increasing the level of turbulence, promote gas exchange at the air-water interface. In this study, we measured for the first-time enhanced gas exchanges by wind-induced waves at the surface of a large lake. We adapted an ocean-based model to account for surface waves on gas exchange in lakes. We finally show that intense wind events with surface waves contribute disproportionately to the annual CO2 gas flux in a large lake. The final version of this project has been submitted to Earth Surface Dynamic (EGU) in the Special issue: Modelling inland waters in a changing climate, https://doi.org/10.5194/esd-2021-30. Here are the different elements summarizing the preprint article:
• Small review on all gas transfer velocity models from small lake to ocean. • New combination and adaptation of a mechanistic model of gas transfer velocity allowing to
study the different processes (wind shear, convection, surface waves) involved in a large lake at a fine time scale.
• Model calibration using continuous CO2 flux data obtained from a new generation of automated (forced diffusion) flux chamber in Lake Geneva, the largest freshwater body in Western Europe.
• Significant improvement in gas flux estimates at high wind speed considering the effect of surface waves for lakes with fetch exceeding 15 km.
• Highlighting of the simplified use of process-based model with few inputs to achieve full carbon budget or to quantify greenhouse gas emissions by lakes at different spatial scales.
Schematics of eosFD operation (eosense.com) followed by its mini-platform construction and its positioning for measurements in the field (Lake Geneva at LéXPLORE platform).
12

Project report from June 2020 until June 2021
CARBOGEN: O2-CO2 surface gas dynamics in littoral and pelagic areas of Lake Geneva
Pascal Perolo, Hannah Chmiel, Nicolas Escoffier, Damien Bouffard and Marie-Elodie Perga
Surface gas dynamics between dissolved oxygen (O2) and carbon dioxide (CO2) should covary inversely in aquatic ecosystems following the metabolic stoichiometry. However, this biological relationship can be influenced simultaneously by chemical and physical forcing leading to pattern divergences. As a result, the high-frequency analysis of an annual cycle of O2 and CO2 in littoral and pelagic areas will allow to extract the different metabolic behaviors considering the temporal and spatial scale as well as the physical and biogeochemical processes involved.
Furthermore, we expect differences in shaping ecosystem processes from seasonal scale to intra-daily scale in both areas studied. We believe that the proximity of sediments and macrophytes in the coastal area could strongly affect these dynamics. In the other hand, the physical processes could have varying intensities depending on the depth of the water column.
This project started in May 2021 and will end in early 2022. Preliminary results will come to an end in June 2021, while the approach and methodology applied for this study have yet to be discussed with co-authors.
Pictures of both study sites, Buchillon antenna (littoral: 4 m of depth) and LéXPLORE platform (pelagic: 110 m of depth); followed by the potential processes impacting the dynamics of the gases studied for each site.
13

Project report from June 2019 until June 2021
CARBOGEN: Tracing calcite precipitation at fine scale using high-frequency sensor data
Nicolas Escoffier, Pascal Perolo, Thibault Lambert and Marie-Elodie Perga
The overall goal of this section of the CarboGen project is to use the high frequency data from sensors deployed at the LéXPLORE platform in order to trace the dynamics of calcite precipitation at fine temporal and spatial scales. Calcite precipitation is indeed a pivotal process in hardwater lakes as Lake Geneva, yet little is known about the conditions driving its variability.
The described project relies upon conductivity sensor data to trace calcite precipitation, associated with pH high frequency measurements to constrain the corresponding geochemical conditions. The sensors have been deployed at 6 depths ( 0 -30 m) since June 2019 and a total of 14 field campaigns were realized to retrieve the sensors, clean them, download their data and verify their metrology. Until now, the sensors have provided highly satisfying covering rates of the spatio-temporal dynamics of the measured parameters and, while some windows of the dataset still require more time for qualification, an example of the obtained timeseries is shown in Fig. 1. Specific conductance data also showed highly significant correlations with the concentrations of Ca2+ or total alkalinity (TA) measured analytically from discrete samples of the water column. These relations allow to trace the temporal dynamics of the TA stock between 0 and 30 m depth and to relate the observed depletion to the amount of calcite precipitated.
An example is provided in Fig. 2 and the global rate estimated in 2020 (i.e. 160 g Ca m-2) is consistent with the annual rate obtained from sediment traps. These global estimates are nevertheless influenced by specific hydrological mixing- and biogeochemical processes occurring in distinct layers of the water column. Current (and future) work therefore aims at refining the geochemical conditions driving calcite precipitation during specific time-windows and at particular depth layers, as well as the corresponding rates. This work is expected to continue during the next year and should be additionally coupled with the sediment traps in order to validate and complement interpretations.
14

Project report from June 2019 until June 2021
Figure 1: Timeseries of Temperature, Specific conductance (C25) and pH measured at LéXPLORE since June 2019, and below correlations with Ca2+ and TA concentrations.
Figure 2. Daily stock of TA integrated between 0 and 30 m depth and specific periods of depletion in blue (2019) or red (2020) corresponding to calcite precipitation.
15

Project report from April 2019 until June 2021
CO2LEX: Surface Turbulence and CO2 Lake Exchange Experiments
Sebastiano Piccolroaz, Bieito Fernández Castro, Alfred Wüest, Hannah Chmiel, Camille Minaudo, Pascal Perolo, and Cary Troy
The CO2LEX project is focused on the quantification of the CO2 fluxes at the lake-atmosphere interface with the objective to develop quantitative linkages between near-surface turbulence, meteorological conditions and the measured CO2 exchange. The project is a side-activity of the SNF-funded project “Primary production under oligotrophication in lakes”, to which we refer the interested reader for details.
The original project started on April 2019 and continued until June 2020. Within this period, near-surface water column turbulence have been measured simultaneously with an Acoustic Doppler Current Profiler (ADCP) and periodically with the MicroCTD microstructure profiler. In addition, in-situ CO2 fluxes were measured using low-cost, homemade floating chambers, operated simultaneously with the MicroCTD. After June 2020, the project continued and the fieldwork activity has been concluded in June 2021. During this last year, the fieldwork operational protocol has been improved and standardized. Upward MicroCTD profiles have been acquired with higher frequency (nearly once every 10 minutes), following a weekly/biweekly schedule. Concurrently, in-situ CO2 fluxes have been measured using the same low-cost, homemade floating chambers. A systematic seasonal dataset of near-surface turbulence and CO2 fluxes is now available (including two 24-h campaigns) and will be used to characterize the CO2 exchanges with the atmosphere across seasons and in presence of different meteorological and stratification conditions. Preliminary results show that both fine-scale near-surface stratification and basin-scale internal motions (Fig. 1) are relevant in affecting CO2 fluxes, thus challenging the application of existing gas flux models, which typically do not consider these aspects. A manuscript is in preparation for Environmental Fluid Mechanics.
16

Project report from April 2019 until June 2021
Figure 1: The effect of residual currents on air-water CO2 fluxes. Besides similar concurrent weather conditions (a-b) and air-water CO2 gradients (c), the effect of an antecedent strong wind event determines larger turbulence on the 8th than on the 3rd of September 2020 (d) thus resulting in larger air-water CO2 fluxes (e).
Article in preparation: Piccolroaz, S., Fernández Castro, B., Chmiel, H. E., Perolo, P., Perga, M.-E. and A. Wüest. CO2 flux in a large perialpine lake governed by near-surface stratification and internal motions. In preparation for Environmental Fluid Mechanics
17

Project report from March until June 2021
LéXFish : monitoring fish presence below LéXPLORE
Jean Guillard, Clément Rautureau, Viet Tran-Khac, Chloé Goulon
Two split-beam echosounders (Simrad Kongsberg Maritime AS, Horten, Norway), 70 and 200 kHz, have been set in early March on LéXPLORE. The two transducers have been installed in the indoor moonpool, at a depth of around 0.70 m below the surface. The two echo-sounders are inside the platform to be in a safe place, connected to HD to store data. The pulse length were fixed to 0.256 ms, with a frequency of 2 pings by second. Sounder calibrations were performed before the installation according to the standard protocol. Acquisition began the same day than the installation, pinging permanently day-time and night-time. A remote connection is available to check if the sounders emit, to control the capacity of the HD, and to check possible interferences with other devices. A few breakdown occurred at the beginning of the project, due to bad remote connection with GSM, various maintenances on the platform, leading to miss a few hours of recording. Now the system is stable, the remote connection changed to LéXPLORE Wi-Fi and emissions and recording are good.
The main goal is to get data on fish population and scattering layers below the platform. Data will be acquired all over the year allowing to first describe the presence of fish below the platform. These data are of main importance when abiotic and biotic parameters are measured: for example level of NH3, O2 and density of zooplankton can be highly impacted by presence of fish schools. The second goal is to get information on fish behaviour: vertical fish distribution and vertical migration; vertical fish distribution as a proxy of the abiotic parameters; fish aggregation vs abiotic parameters (mainly temperature and light).
Figure 1: Example of remote echograms recorded the 29th June 2021. Many fish schools are detected below the platform.

Project report from June 2020 until June 2021
Life in the deep: colonisation by Dreissena along a depth gradient
Linda Haltiner, Stuart Dennis, Piet Spaak
In this project, the aim is to understand how quagga mussels colonize substrates in deeper areas of a lake where temperature is low, no light is available and water pressure is high. We want to know A) how fast quagga mussels colonize and grow on new substrates on varying depths and B) whether they adapt to different depths. After the corona lock down in June 2020 we could finally install the experiment consisting of three replicated ropes in the perimeter of the LéXPLORE platform.
In experiment A) we measured colonisation of quagga mussels on PVC plates every three months (September, December 2020, and March 2021) between 0-100m depths along the ropes. The last sampling and also the end of the experiment will be in June 2021. Currently the samples are processed but from the pictures (see Figure 1) we already see a trend to a faster colonisation on the shallower plates. It is unclear yet if larvae settle also on deeper plates.
In the second experiment B) adaptation to different depths is tested with a reciprocal transplant experiment, in which mussels are collected from two depths (10m and 60m) and then mounted to 10 and 60m on the ropes. In time intervals of 2-4 weeks, we measured growth and survival. At the end of the experiment also shell thickness was measured. The experiment started in August and ended in November 2020. At the moment we are analysing the data. Preliminary results show a higher survival after 2 weeks in 60m irrespective of their origin. This result would not indicate an adaptation to the depth of their origin. With further data analysis we will try to proof or reject this first finding.
We are planning to write a manuscript for experiment A, together with Hui Zhang and Karl-Otto Rothhaupt (Uni Konstanz, Germany), because the experiment was replicated in Lake Constance. Experiment B will probably be included in a manuscript with population genetics data of quagga mussels across a depth gradient.
Figure 1: shows the colonisation between June and September 2020. The left panel shows a plate from 9m depth
including a lot of quagga mussels and biofilm. On the right, the plates is retrieved from 60m and does not show
any visible biofilm nor mussel settlement.
19
Project report from Sept. 2020 until June 2021
Microsed project - Deposition and Accumulation of Microplastics in Lake Sediment
Florian Breider, Jonathan Hanahan, Karine Vernez, Sylvain Coudret, Jean-Luc Loizeau
The full extent of the disruptive effective of plastics on the environment, and particularly aquatic environments, is still uncertain. In order to better understand the fate of aquatic plastics, LeXPLORE Platform located on Lake Geneva, provides a unique opportunity to study a critical freshwater lake, supplied by one of the biggest rivers in Europe, the Rhône. The goal of this study is to quantify the microplastic fluxes in the water column by studying (i) the size and quantity variation of plastics collected from the photic (2 m) and benthic zone (30 m) of the lake and (ii) the sedimentation of plastics at different depths.
To collect the microplastic samples, pumps pull water from 2 and 30 m depth successively through filters of 500 and 150 µm pore size every 12 hours. The filters are processed in the lab, dyed with Nile Red, and analysed under a fluorescent microscope. Additionally, samples are collected every month using cylindrical sediment traps deployed beneath The LéXPLORE platform at four depths (12, 27, 47, 87 ± 0.5 m). Finally, a portion of the samples collected will also be processed and characterized by infrared quantum cascade laser spectroscopy to establish the abundance of polymers in the samples. The sediment trap data and the infrared spectroscopy have yet to be completed and will be added to more detailed reports in the future.
The analysis of the data collected (Figure 1a) shows a decreasing trend in number of microplastics within the current period of study. Drawing any robust conclusions about the yearly or seasonal trend can only be established with data on a larger temporal scale than the sample size from the last 9 months.
Instead, it can be observed that there is a slightly greater abundance of plastics retained by the 150 µm filter (Figure 1a). This may be simply attributed to the sequential pumping of water through the 500 µm filter before the 150 µm filter and the tendency for plastic fragmentation to occur.
Over the coming months, a greater quantity and variety of data will be collected in order to better observe the goals outlined, with the eventual goal of publishing a paper.
20

Project report from Sept. 2020 until June 2021
Figure 1: a. Total Microplastics/m3 in pumped water separated by depth. b. The pump apparatus on LeXPLORE.
21

Project report from April 2021 until June 2021
LéWALK: autonomous turbulence profiling
Damien Bouffard, Sebastiano Piccolroaz, Miguel Gil Coto, Sébastien Lavanchy, Guillaume Cunillera, Christian Dinkel and Bieito Fernandez Castro
The goal of this project is to (i) develop an autonomous turbulence profiling system for lakes and (ii) to collect one year of turbulence profile especially under windy conditions, which are conditions typically challenging to monitor with classical methods.
With the Covid situation, the project has been delayed and has only started in April 2021. We are currently testing the autonomous profiler. While the profiler seems to work efficiently, the datalogger is currently permanently on which lead to a massive amount of unrequired data and a rapid drainage of the data. The next update will consist in adding a smart trigger that will wake up and stop the logger based on rising and following speed and pressure.
We expect to start with the step (ii) by September and provide a unique dataset of turbulence estimates under all ranges of wind and heat flux.
Photo of the autonomous turbulence profiler used on the LéXPLORE platform
22

Project report from July 2020 until June 2021
MetOxiC: Methylmercury in Oxic water Column
Andrea Gallorini, Philippe Arpagaus Jean-Luc Loizeau
The MetOxiC project aims to demonstrate the presence of anoxic or hypoxic layers inside suspended and settling particles present in the oxic water column of Lake Geneva. These low oxygen sites could represent important micro niches for the methylation of mercury in the oxic water column, mainly mediated by anaerobic microorganisms. We collaborated with the Léxplore team to collect samples during the summer of 2020. We conducted two sampling campaigns in July 2020 and in September 2020 using polyacrylamide gel coated sediment traps to collect undisturbed settling particles from three depths (13 m, 23 m and 100 m). The polyacrylamide gel at the bottom of each sediment trap plays two important roles: i) to help incorporating the particles as undisturbed as possible, maintaining their shape and structure; ii) to act as a bio-preserver blocking any biological activities and maintaining chemical gradient that may exists inside the samples.
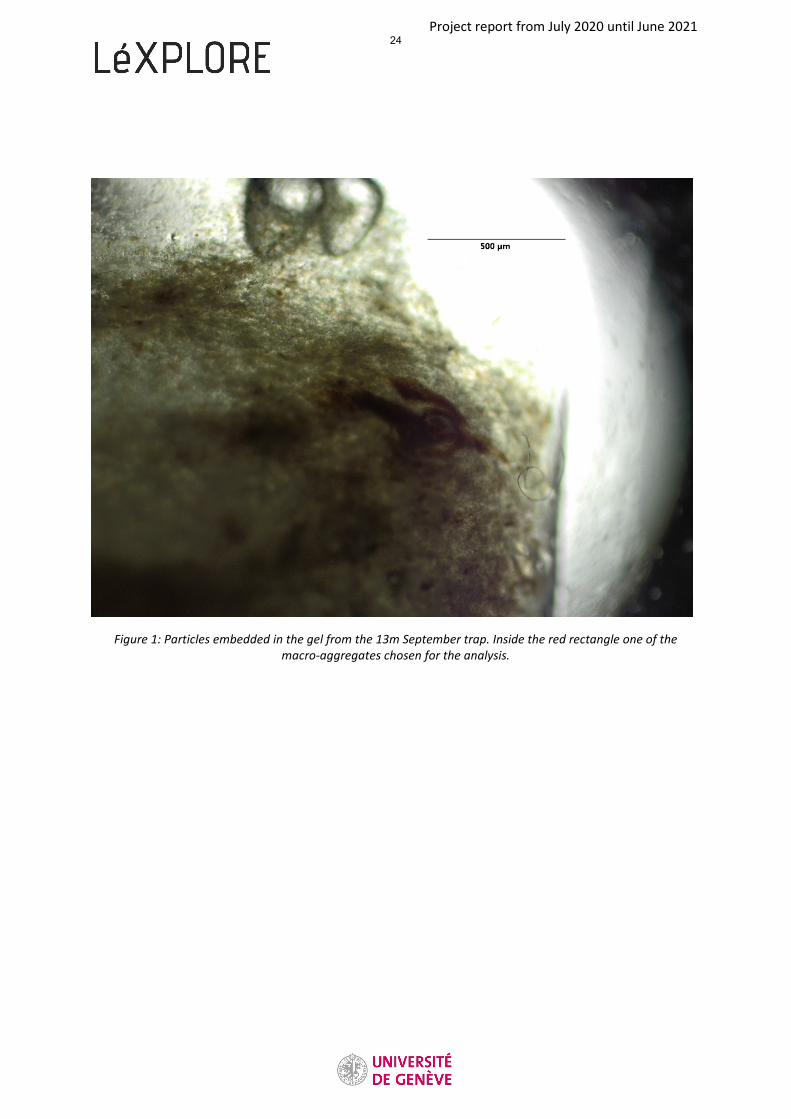
The analyses have been carried out with an oxygen microprobe with a resolution of ≈50 µm, in order to determine if oxygen gradients exist inside these particles. Unfortunately, due to the size of the probe, it was only possible to inspect the macro-aggregates inside the gel. Thanks to the gel being transparent, it was possible to get several images of the particles via microscope and to easily pinpoint macro-aggregates suitable for the analysis (Figure 1). Preliminary results show oxygen concentrations ranging from 2 to 8 mg/L with the exception of an aggregate from 13m depth collected in September that shows an oxygen concentrations of 0.2 mg/L. These results are very promising because they show the presence of an anoxic layer inside a macro-aggregate in a zone of the water column which is always oxic. Further analyses are needed to better understand the requirements for aggregates to develop internal anoxic conditions. First of all we need more observations of macro-aggregate and we are going to sample again in the same period (July 2021 and September 2021) from the LéXPLORE platform to obtain a second series of data. We are also planning on using a Scanning Electron Microscope to examine the outer structure of the particles to get a detailed imaging of the particle textures. Moreover, we would like to get information about the particles organic matter which is an important factor in the development of anoxic conditions.
23
Project report from July 2020 until June 2021
Figure 1: Particles embedded in the gel from the 13m September trap. Inside the red rectangle one of the macro-aggregates chosen for the analysis.
24

Project report from July 2020 until June 2021
Seasonal isotopic variation of long-chain diols as a proxy for environmental conditions in lakes
Julie Lattaud
The stable isotopic composition of environmental water (i.e., δ2H value) is an important tracer of the hydrological cycle. In the last decades, lipid biomarker δ2H compositions have become particularly effective tools in lacustrine and marine archives to reconstruct paleohydrologcial changes throughout Earth history. This is because δ2H values of environmental water are recorded in the δ2H values of lipids from photosynthesizing organisms and δ2H values of leaf wax n-fatty acids, biomarkers of higher terrestrial plants are often used to reconstruct changes in rainfall and aridity on the continents. Long-chain diols are biomolecules commonly found in sedimentary archives from freshwater environments and are produced by eustigmatophytes (phototrophic microorganisms). As such they are the perfect candidate to be studied over long time-scale and give insight into paleo-precipitation regime. By comparing them with long-chain fatty acids the ratio of precipitation over evaporation could be determined.
Sampling
Lake Geneva has been sampled from July until November 2020 every two week in average at the surface and the deep chlorophyll maximum (see table below for depth of DCM). About 100 L of water has been filtered onto GF/F (pre-combusted) filters (0.7 µm pore size). Water and dissolved inorganic carbon (DIC) have also been sampled (in 12 mL exeiteners) for isotope (stable and radiocarbon) analysis. So far the filters have been measured for bulk δ13C and the water isotope for δ2H and δ18O. One test extraction using an EDGE method has yield no lipids, but a new sonication method seems to yield enough lipids for measurements.
Figure 1: Bulk δ13C and water δ2H of the surface and deep chlorophyll maximum
-90
-88
-86
-84
-82
-80
-35
-30
-25
-20
δ2H
(‰vs
VSM
OW
)
δ13 C
(‰vs
VPD
B)
DCM-13C
Surface-13C
DCM-2H
Surface-2H
25

Project report from July 2020 until June 2021
Results/Discussion
The water isotopes are similar to those of the GNIR station at the Rhone Delta (-101‰ over the 1994-2016 period), the ~20‰ difference can be explained by the addition of 2H-enriched rainwater in Lake Geneva compared with the upper Rhone catchment (2H-depleted glacier-fed). The water isotopes indicate a stratification (also seen in the temperature profile) from July until beginning of September. The bulk 13C values indicate similar primary production at the surface and DCM, except beginning of July and end of August (difference of ~ 3‰). The latter might indicate input of terrestrial organic matter (13C-depleted) to the DCM, maybe via a current (sampled at 24 m depth and 6 m depth). These isotopic signatures will be compared to those of the lipids, so far only one sample has been tested (surface from 28/09), the short-chain fatty acid δ2H (C14-C16-C18) representing primary production (no long-chain fatty acids are detected indicating no major influence of vegetation from the catchment) has an average value of -293 ± 2‰, -269± 2‰, and -273 ± 2‰, respectively. Indicating a fractionation of ~ -190‰ from the original water, which is similar to the ~ 180‰ reported by Chikaraishi and Naraoka (2005).
Future work
It includes the extraction and analysis of the rest of the filters, and the measurement of the long-chain diols δ2H. These values will be compared with filters obtained from a small lake (Lake Seelisberg) and sediments from Lake Zurich and Lake Seelisberg.
Table 1: Sampling depth of the deep chlorophyll maximum (DCM) depending on the date. DCM was chosen as the highest chlorophyll concentration as indicated by the CTD measurements.
Date 20/07 03/08 20/08 31/08 14/09 28/09 26/10 23/11
Depth DCM 24 m 13 m 12 m 6 m 8.5 m 1.5 m surface 17.5 m
26
Project report from June 2020 until June 2021
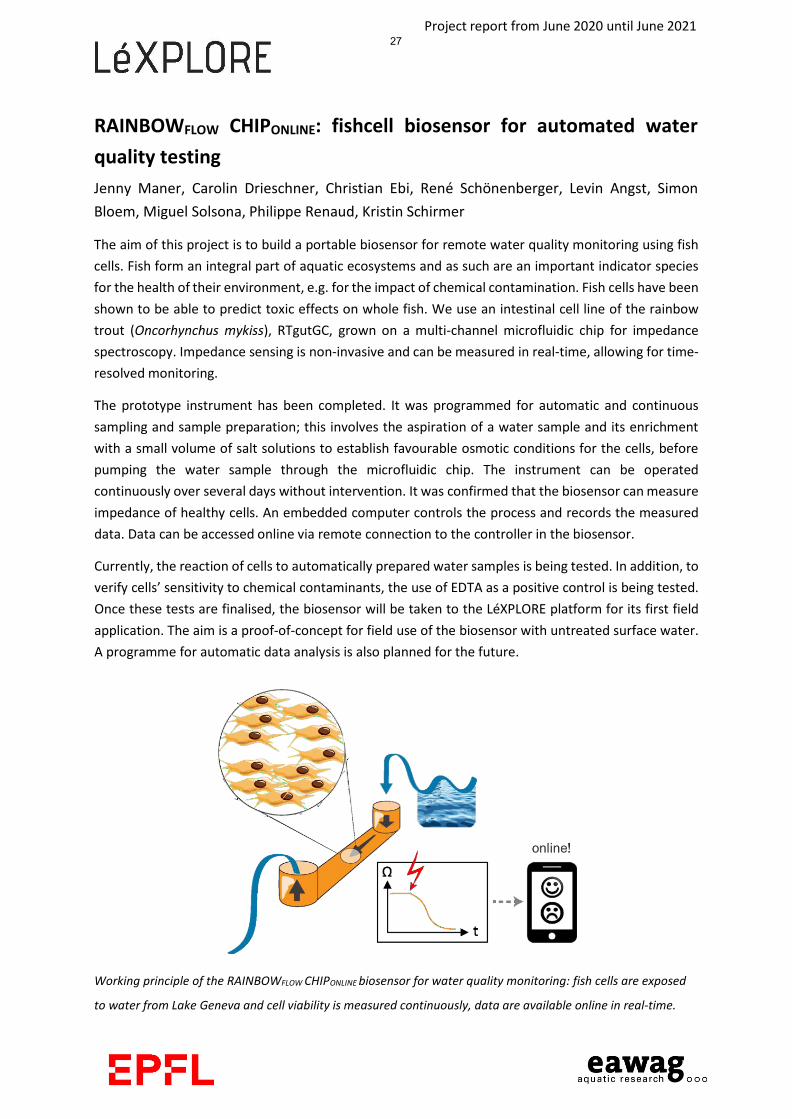
RAINBOWFLOW CHIPONLINE: fishcell biosensor for automated water quality testing Jenny Maner, Carolin Drieschner, Christian Ebi, René Schönenberger, Levin Angst, Simon Bloem, Miguel Solsona, Philippe Renaud, Kristin Schirmer
The aim of this project is to build a portable biosensor for remote water quality monitoring using fish cells. Fish form an integral part of aquatic ecosystems and as such are an important indicator species for the health of their environment, e.g. for the impact of chemical contamination. Fish cells have been shown to be able to predict toxic effects on whole fish. We use an intestinal cell line of the rainbow trout (Oncorhynchus mykiss), RTgutGC, grown on a multi-channel microfluidic chip for impedance spectroscopy. Impedance sensing is non-invasive and can be measured in real-time, allowing for time- resolved monitoring.
The prototype instrument has been completed. It was programmed for automatic and continuous sampling and sample preparation; this involves the aspiration of a water sample and its enrichment with a small volume of salt solutions to establish favourable osmotic conditions for the cells, before pumping the water sample through the microfluidic chip. The instrument can be operated continuously over several days without intervention. It was confirmed that the biosensor can measure impedance of healthy cells. An embedded computer controls the process and records the measured data. Data can be accessed online via remote connection to the controller in the biosensor.
Currently, the reaction of cells to automatically prepared water samples is being tested. In addition, to verify cells’ sensitivity to chemical contaminants, the use of EDTA as a positive control is being tested. Once these tests are finalised, the biosensor will be taken to the LéXPLORE platform for its first field application. The aim is a proof-of-concept for field use of the biosensor with untreated surface water. A programme for automatic data analysis is also planned for the future.
Working principle of the RAINBOWFLOW CHIPONLINE biosensor for water quality monitoring: fish cells are exposed
to water from Lake Geneva and cell viability is measured continuously, data are available online in real-time.
27

Project report from February until June 2021
DynaMeth: Dynamics and origin of methane in the water column of Lake Geneva.
Didier Jézéquel, Marthe Moiron, Nicolas Escoffier and Marie-Elodie Perga
The presence of abnormally high methane concentration in aerobic parts of aquatic systems is known as the “methane paradox”. Indeed, the classic paradigm of the biological formation of CH4 is that this methanogenesis is carried out by Archaea, which need anaerobic conditions to live. CH4 peaks have been observed in the Lake Geneva water column (Donis et al. 2017, fig. 6 of supp., and preliminary work in July 2020 performed at LéXPLORE station) but are not well understood. Our goal is to follow the dynamics of CH4 every month for a year, through in situ profiling with CH4 probes and multiparameter probes. In addition, CH4 flux at the water-atmosphere interface will be determined as well as isotopic analyses and metagenomic determinations on water samples.
To now, 6 field campaigns were performed at LéXPLORE station (04/02, 03/03, 31/03, 07/04, 10/05 and 31/05 2021). For each date, multiparameters probes (Exo2, Aquatec, SPAR nke) were deployed to obtain vertical profiles on the whole water column (108 m depth) for temperature, conductivity, O2, pH, redox, turbidity, fDOM, chlorophyll (and other pigments with a BBE probe on 31/05) and PAR. In addition, water sampling in Rhône River were performed at Porte du Scex station, i.e. about 6.2 km upstream from the mouth of the Rhône at 3 dates (29/03/21, 10/05/21 and 31/05/21). Two determinations of air-water CO2 and CH4 fluxes were performed by the floating chamber method (03/03 and 02/06). Finally, a sediment core has been sampled on 2nd June from the LéXPLORE station to determine CH4 concentration in pore waters.
The vertical profiles at LéXPLORE were checked on bord in order to adapt the Niskin sampling depths for methane determination. Preliminary data obtained in July 2020 seeming to indicate a link between the presence of methane and the Rhône interflow, the depths of sampling were chosen more closely around and in the plume. Methane was quantified by a Contros CH4 HISEM probe (TDLAS), ±0.1 ppm resolution, ±0.5 ppm accuracy, using an equilibration technique on 2 L samples. Probe was calibrated using two CH4 standard from GazDetect and N2 AlphaGas as zero standard.
Methane profiles are given in Fig. 1: in all cases, concentrations are lower in the lower part of the water column (ca. 9-36 nM) than in the upper part. Surface water (0.5 m depth) concentration ranged from 48 nM (31/05/21 and 14/07/20) to 136 nM (10/05/21), i.e. clearly above the equilibrium concentration vs. atmosphere (ca. 3 nM). In addition, a CH4 peak was present on 10/05 and 31/05 2021 at 45 m and 15-20 m depth respectively, as it was the case in July 2020. These depths are clearly associated withthe Rhône interflow, highlighted by turbidity and conductivity peaks (Fig 2 and 3). Chlorophyll profilesshowed peaks at the same depth on 10/05 but shallower on 31/05 (10 m depth), indicating thatphytoplankton biomass is not systematically correlated with the CH4 peak. The hypothesis of lateraltransport by the Rhône plume is then reinforced. As the concentration of CH4 in the Rhône just beforethe mouth is in the 22-51 nM range, i.e. lower than within the interflow at LéXPLORE station, it meansthat the plume would acquire additional CH4 between these two points, probably during its circulationnear the bottom in the first km. This hypothesis will be tested next July by taking samples from severalstations located between the mouth and LéXPLORE.
28

Project report from February until June 2021
Figure 1: CH4 profiles at LéXPLORE station.
Figure 2: CH4, chlorophyll, turbidity, temperature, pH, oxygen and conductivity (C25) profiles at LéXPLORE station on 10/05/2021.
Figure 3: CH4, chlorophyll, turbidity, temperature, pH, oxygen and conductivity (C25) profiles at LéXPLORE station on 31/05/2021.
Donis, Daphné, Sabine Flury, A. Stöckli, Jorge Enrique Spangenberg, Dominic Vachon, and Daniel Frank McGinnis. « Full-scale evaluation of methane production under oxic conditions in a mesotrophic lake ». Nature communications 8, nᵒ 1 (2017): 1‑12.
29

Project report from April 2021 until June 2021
Skin2Bulk : Investigating the surface boundary layer
Damien Bouffard, Sebastiano Piccolroaz, Sébastien Lavanchy, Michael Plüss, Johny Wüest and Bieito Fernandez Castro
Infrared satellite provide information of the temperature at the surface over the first micrometers in a layer called “skin layer”. This temperature slightly differ from what is observed by in-situ sensors in the top layer (a few cm below the surface) called “bulk layer”. The aim of this project is to measure both skin and bulk temperature over a long period with radiometers and a thermistor chain and finally provide a robust lake-base parameterization of the skin to bulk conversion.
The project started in April and only a first quality check of the collected data has been done. The next step is to push in near real time the collected data to Datalakes.
Photo of the radiometers installed on LéXPLORE
30

Project report from January 2021 until June 2021
POETICS - PlanktOn vErTICal Structure
Fabio Correia, Roxane Fillion, Jorrit Mesman, Matthieu Devanthery, Sebastien de Loes, Mridul Thomas, MUSE-Master students, Beat Müller and Bastiaan Ibelings
Introduction - aims of POETICS
The aim of POETICS is to carry out weekly sampling of both phyto- and zooplankton, to collect discrete samples across lake depth (0 – 40 m) and build a long-term dataset. The Idronaut profiler on LéXPLORE delivers continuous recordings of fluorescence (biomass) of green algae, diatoms and cyanobacteria. The weekly sampling in POETICS, which started in January 2021, aims to start populating a database with recurrent profiles – providing backbone information on plankton dynamics at LéXPLORE. Samples are fixed and later analysed using instruments like CytoBuoy or Flowcam. Diversity is scored and entered in a database at a broad taxonomic and functional – trait based – level for both phyto- and zooplankton. Classifications to be applied are in preparation on basis of literature review by two UNIGE MUSE Master students. The specific interest to use the POETICS database is to investigate the effects of re-oliogotrophication, (in)direct effects of climate warming and extreme events on the structure of plankton in the lake, as well as resistance and resilience of the plankton community after disturbance.
With respect to the long-term environmental changes in Lake Geneva, POETICS also follows the seasonal – week-to-week changes in the C:P stoichiometry of the lake seston. This provides background information for the Daphnia studies in the UniGe lab, seeking to answer why larger cladocerans in Lake Geneva are decreasing when the quantity of their food, the phytoplankton, seems stable for the moment. In this line of work the possibility of a so-called stoichiometric bottleneck is investigated, where a gradual increase in C:P has resulted in a lower food-quality of the seston for life-history (growth and reproduction) of Daphnia in Lake Geneva. This part of the work is carried out in collaboration with Eawag. All the work in POETICS is ongoing and will continue in years to come.
Preliminary results - data
The POETICS data from the weekly samples are still being analysed. A few cursory observations are mentioned in the Figure legends below. The “real” use of these data will come in the framework of ongoing LéXPLORE projects, as POETICS aims to gradually fill the long-term database and provide background info for others.
31
Project report from January 2021 until June 2021
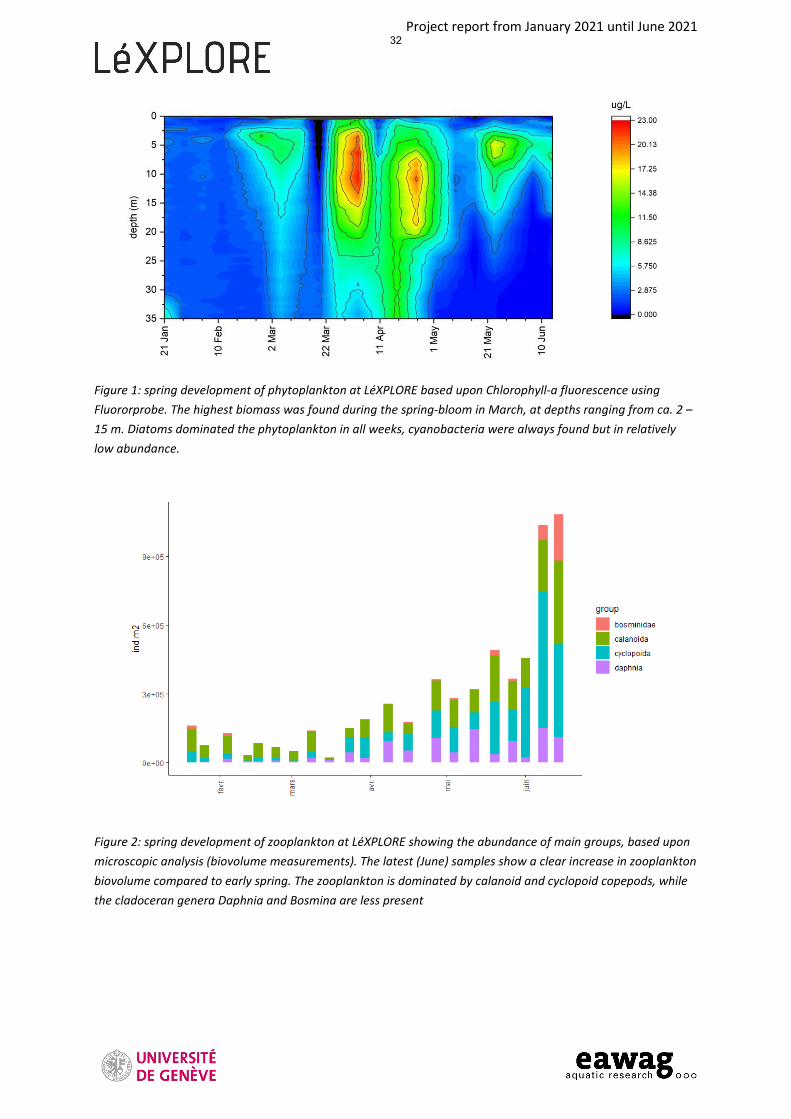
Figure 1: spring development of phytoplankton at LéXPLORE based upon Chlorophyll-a fluorescence using Fluororprobe. The highest biomass was found during the spring-bloom in March, at depths ranging from ca. 2 – 15 m. Diatoms dominated the phytoplankton in all weeks, cyanobacteria were always found but in relatively low abundance.
Figure 2: spring development of zooplankton at LéXPLORE showing the abundance of main groups, based upon microscopic analysis (biovolume measurements). The latest (June) samples show a clear increase in zooplankton biovolume compared to early spring. The zooplankton is dominated by calanoid and cyclopoid copepods, while the cladoceran genera Daphnia and Bosmina are less present
32

Project report from January until June 2021
Unravelling the diversity, functioning and toxin production of cyanobacteria populations in lake Geneva
Anna Carratalà, Hannah Chmiel, Stéphane Joost, Elisabeth Janssen, Tamar Kohn.
Project progress
During the first six months of the CYANOFUN project, our work has mainly focused on collecting the water samples and measuring the corresponding environmental information for each sampling date. In total, we have now collected a total of 55 water samples. Prior to sampling, we used CTD sensor data from 2020 to run PCA-typology analyses as previously described (Selmoni et al. 2020) to select the most representative depths in the water column. According to this analysis and based on our CTD data, the depths of the water column under the LéXPLORE platform can be split in 10 clusters (cluster 1 "0-7 m", cluster 2 "7-9 m", cluster 3 "9-13 m", cluster 4 "13-16 m", cluster 5 "16-21 m", cluster 6 “21-25 m", cluster 7 "25-31 m", cluster 8 31-48 m", cluster 9 "48-64 m" and cluster 10 "64-100 m"). Following these results, we are sampling at the midpoint depth within each cluster. We are also collecting an additional sample at the depth corresponding to the maximum chlorophyll concentration which is considered as a proxy for phytoplankton abundance in the water.
During these months, we have also established different protocols in the laboratory to be able to analyse the concentration of total Cyanobacteria, Planktothrix cells as well as the proportion of Planktothrix containing microcystin genes and cyanophages by quantitative PCR, and every collected sample is currently being analysed for these target organisms. In addition, we have also been working on the isolation of Cyanobacteria species from Lake Geneva, establishing cultures composed by one Cyanobacteria species and their associated heterotrophic bacteria. We now have established 8 Cyanobacteria cultures which will be taxonomically identified by sequencing shortly.
33

Project report from January until June 2021
Main objectives for the months to come:
The total number of samples collected within the project will be split in two badges for sequencing. The first badge will be sequenced in July 2021 and the second badge will be sequenced at the end of the project (January 2022). Regarding the quantification of toxins in Lake Geneva, we are using qPCR (as described above) and we will use ELISA on certain water samples. In addition, we will characterize the cyanometabolites produced by the Cyanobacteria cultures that are currently being maintained in the laboratory by high resolution tandem mass spectrometry suspect-screening against the CyanoMetDB. This work will be performed by Anna Carratalà in collaboration with Dr. Elisabeth Janssen at EAWAG in September 2021.
Figure 1. Cyanobacteria cultures established and maintained in the Environmental Chemistry Laboratory.
34

Project report from February until June 2021
LéXPOCHIRO: Effects of lake suspended matter quality on growth, emergence and molecular endpoints in Chironomus riparius
Rébecca Beauvais, Carmen Casado-Martinez, Christina Lüthi, and Benoît Ferrari
On 19th February 2021, we visited the platform and installed two sampling devices consisting each of 12 tubes (9 cm diameter – 37 cm height) at a depth of 30 meters. After 4.5 months of presence in the lake, the samplers will soon be recovered to be replaced by 2 identical newly prepared systems. The 24 tubes containing collected suspended matter and lake water will be brought in the lab for several chemical and biological assessments. Namely, our goal is to evaluate the quality of the collected matters in terms of contaminants concentrations (e.g. metals, Hg, plant protection products…) and the responses of the model organism Chironomus riparius, an insect living in the sediment during its larval stages. For this, 4th instar larvae (about 7-day old) will be exposed to the collected matter or to a control (food-enriched sand and lake water). After 2 and 4 days, larvae will be weighted to assess their growth, and kept for further analyses (e.g. gene expression, proteins/lipids/carbohydrates contents…). In addition, we will expose larvae to the collected matter for 4 days, after which they will be transferred to clean sand and lake water for a depuration phase, to measure the bioaccumulation of certain contaminants (e.g. plant protection products, metals…). New suspended matter will be sampled during 4-5 months from July to October 2021 and the above analyses repeated and/or adapted if needed. Weexpect to see a difference in the response of the chironomids to the suspended matter that may beaffected by the lake dynamics during the different seasons of collection.
Filling the tubes with a bottom of clean sand before the ExpoSET systems disappear for 4 months at a depth of
30 m depth in the LéXPLORE protection perimeter
35

Project report from January 2021 until June 2021
caGAStrophic: low-cost, automated, floating chamber for gas flux measurements
Sebastiano Piccolroaz, Guillaume Cunillera, Hannah Chmiel, Pascal Perolo, Sébastien Lavanchy
Carbon dioxide (CO2) fluxes between inland water bodies and the atmosphere largely contribute to the global carbon budget, hence influencing climate at global scale. Owing to this important role and further stimulated by the ongoing change in climate, large efforts have been devoted in the last decades to the direct measurement of such fluxes and the definition of empirical parameterizations for their quantification based on more widely available measurements of pCO2 and atmospheric energy fluxes (i.e. wind speed). Despite the significant advancements on the topic, there is still margin for improving the direct measurement of CO2 fluxes with in-situ floating chambers, in terms of both accuracy and operational efficiency.
The caGAStrophic project started on January 2021 and is intended at improving the ability of acquiring reliable measurements of CO2 fluxes in inland water bodies, through designing a new concept of low-cost, homemade floating chamber able to acquire good quality gas flux measurements through automated flushing of the sampling volume. In this way, we aim at overcoming the main limitations of using homemade floating chambers for gas flux measurements at the air-water interface of water bodies. These limitations include i) the operational burden and ii) the easy contamination of the sample volume during deployment.
In this first half of the project, we worked i) on the conceptual scheme of the new chamber, identifying different designing alternatives to deal with the automated flushing of the sample volume, and ii) on the scripts required to control the main electronic components of the new chamber (CO2 sensors, pump/fan for automated flushing, opening door/solenoid valve etc., see Fig. 1). In the coming months, we plan to i) realize a first prototype of the chamber and ii) test it at the LéXPLORE and in other lakes, possibly including some laboratory experiments to quantify the disturbance (turbulence) generated during the automated flushing of the sample volume.
Figure 1: Testing of the electronic components that will be used in the designing of the new floating chamber.
36

Project report from March 2021 until June 2021
GenoRobotics CoWaS – Continuous Water Sampling
Sofian Lecine, Timothée Hirt, Christophe Deloose, Nicolas Adam, Jonathan Selz, Bernier-Latmani Rizlan and Maerkl Sebastian
During the first months of the CoWaS project, our team was able to develop a first design of the autonomous water sampler (cf. figure 1) and design a protocol for the automatic extraction of DNA from these samples.
After this preliminary design phase, we now enter a prototyping phase during which we will iterate on the designs and start the manufacturing of the subsystems.
The next steps will be to start installing equipment on the platform to test it over the summer and finalize the full system during the beginning of the fall semester of 2021. Following this, we will start a test and measurement campaign that will last until the end of January 2022.
The expected results are:
1. Autonomous sampling and filtration of water2. Autonomous DNA extraction from the filters3. Processing of the extracted DNA in a laboratory environment at EPFL
a. 16S amplification with PCR in a first instanceb. Sequencing of the samples if the previous step yields promising results.
In case of success of the DNA extraction, we could plan a potential publication.
Figure 1: Left: Preliminary design of the DNA extractor for the LéXPLORE Platform Right: Preliminary design of the automatic sampler based on Ribeiro, Hugo, et al. "Development of an
autonomous biosampler to capture in situ aquatic microbiomes." PloS one 14.5 (2019)
37

Project report from Feb. 2020 until June 2021
PhytoWaveTaxa: All-glass sensors for algae population monitoring
Samuel Rey, Baptiste Ayer, Federico Sala, Baastian Ibelings, Francesco Pomati, Yves Bellouard
Over the last year, the Galatea team has been working on the automated instruments integration prior
to its deployment on the platform. The system is operational in the lab and collecting data in an
automatic fashion, including the filtering and the fluid sampling procedures. An actual illustration of
data collected are shown in the Figure above. The setup has been scaled and ruggedized for installation
in a cubic enclosure (about 0.75 m3). The overall assembly includes the complete fluidic sampling
automat, the optical detection, and a miniature computer for acquiring data. After much delays due in
part from the COVID situation, the system is currently going through the last endurance tests (days of
continuous, autonomous measurement) in outdoor environment before its transport to LéXPLORE in
the last week of August 2021.
a)b) c)
d)
e)
Figure. (a) Close-up view of the glass biochip with the microscope and waveguide on the side. (b) fully
autonomous instrument front view and (c) rear view (shown in open-configuration). The automat handling the
fluidic processing is embedded in the instrument. (d) Example of wavelet acquired for one type of algae. (e)
Training algorithm, showing the accuracy of the detection achieved for three species mixed randomly
(specimens provided by EAWAG).
38
Project report from April 2021 until June 2021
Test measurements for Long-Range ADCP parameterization
Violaine Piton, Htet Kyi Wynn, Rafael Reiss, Andrew Barry
Long-term deployment of a Long-Range ADCP (150 khz) at the deepest point of Lake Geneva (309 m) can provide valuable velocity and backscattering data of the whole lake water column, and might help solving the mystery of the deep lake circulation.
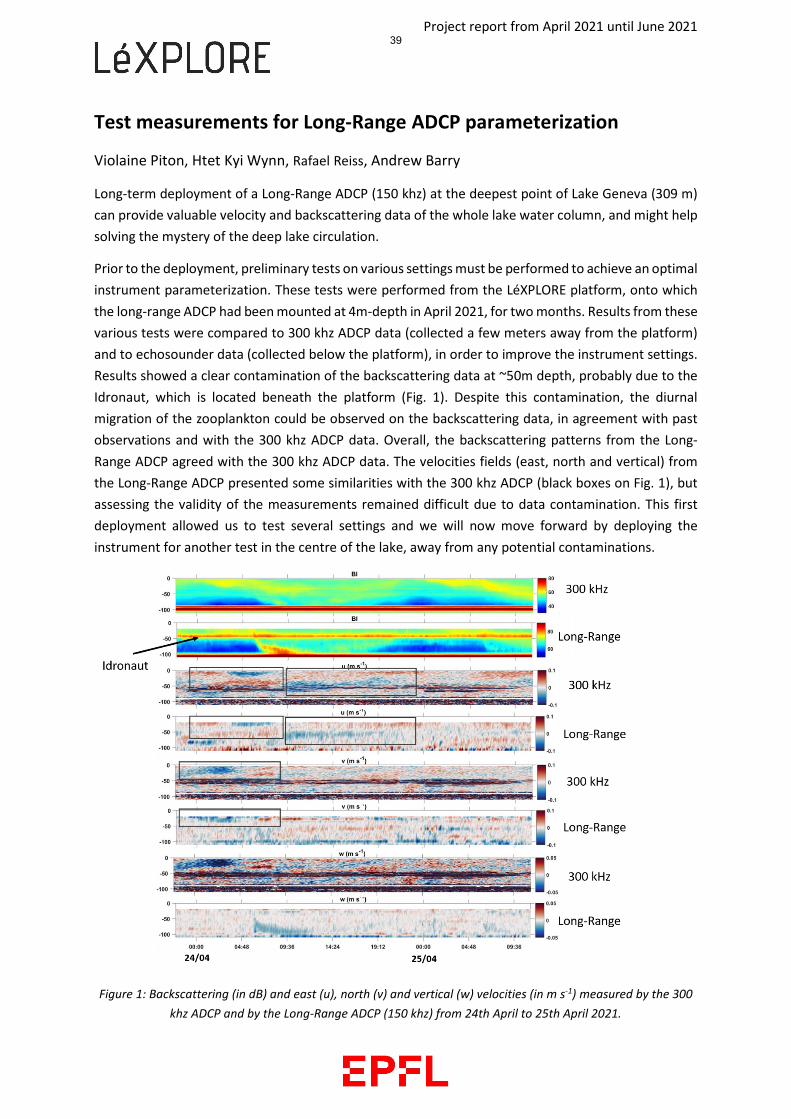
Prior to the deployment, preliminary tests on various settings must be performed to achieve an optimal instrument parameterization. These tests were performed from the LéXPLORE platform, onto which the long-range ADCP had been mounted at 4m-depth in April 2021, for two months. Results from these various tests were compared to 300 khz ADCP data (collected a few meters away from the platform) and to echosounder data (collected below the platform), in order to improve the instrument settings. Results showed a clear contamination of the backscattering data at ~50m depth, probably due to the Idronaut, which is located beneath the platform (Fig. 1). Despite this contamination, the diurnal migration of the zooplankton could be observed on the backscattering data, in agreement with past observations and with the 300 khz ADCP data. Overall, the backscattering patterns from the Long-Range ADCP agreed with the 300 khz ADCP data. The velocities fields (east, north and vertical) from the Long-Range ADCP presented some similarities with the 300 khz ADCP (black boxes on Fig. 1), but assessing the validity of the measurements remained difficult due to data contamination. This first deployment allowed us to test several settings and we will now move forward by deploying the instrument for another test in the centre of the lake, away from any potential contaminations.
Figure 1: Backscattering (in dB) and east (u), north (v) and vertical (w) velocities (in m s-1) measured by the 300 khz ADCP and by the Long-Range ADCP (150 khz) from 24th April to 25th April 2021.
39

Project report from May 2021 until June 2021
Biodegradability assessment of PBX, a sustainable bio-polyester developed at EPFL
Maxime Hedou, Lorenz Manker, Jeremy S. Luterbacher
The Laboratory of Sustainable and Catalytic Processing (LPDC) at EPFL developed and patented a new polyester (PBX) derived from lignocellulosic biomass. A novel diacid can be produced in only two steps from hemicellulosic sugars contained in beechwood and copolymerized with a diol to form a polyester with properties analogous to PET, the main difference being bio-sourcing and bio-degradability. Preliminary data demonstrated that the material is hydro soluble with complete dissolution duration depending on pH and temperature.
In order to demonstrate marine bio-degradability, the project aims at performing hydro solubility tests in Lake Geneva. Three PBX samples of 1x1 cm have been trapped in a zooplankton net (100 microns mesh) to prevent any materials release and secured in a drilled plastic container (Fig. 1). The samples have been immerged next to LéXPLORE on 31.05.2021 with the help of Sébastien Lavanchy and Guillaume Cunillera (Fig. 1). The three immerged pieces of PBX will be collected after 1, 3 and 6 months. Residual materials (if any) will be characterized to determine residual mass and molecular weight. Water temperature and pH will be reported with the results. According to the preliminary results obtained in the laboratory, the team expects full dissolution of the plastic within the 6 months period.
40
Figure 1: Picture of the set-up and of the installation on LéXPLORE.

Project report from June 2020 until June 2021
Fast data download from submerged landers using wireless optical communication
Alexander Bahr, Felix Schill, Sébastien Lavanchy, Guillaume Cunillera
In order to collect long-term data from the lake bed or the water column right above it, limnologists typically deploy landers which consist of a set of sensors collecting physical-chemical water or sediment parameters. These data are locally stored in a logger attached to the sensors. For similar terrestrial loggers, data can be offloaded using LoRaWAN or 4G networks. As radio communication cannot be used underwater, downloading the data from submerged landers typically requires bringing the entire lander to the surface and redeploying it after data has been off-loaded. The process of retrieving, downloading and redeploying a lander is very costly and time-consuming and every redeployment carries a high risk of damaging the setup.
Hydromea, an EPFL-spin off, developed LUMA, a series of small optical modems which allow for the fast wireless transfer of data through water over distances of up to 50m. By outfitting a lander with an optical modem, data can now be offloaded through a “data mule” which consists of a low-end Remotely Operated Vehicle (ROV), such as the BlueROV, fitted with an additional LUMA modem. The BlueROV can be deployed from a small boat and after navigating it close to the submerged lander, it can offload the data wirelessly while leaving the lander in place. This drastically reduces the time and cost involved in recovering subsea data.
While the LUMA technology has been successfully used in numerous off-shore construction operations and scientific deployments in the ocean, the LéXPLORE platform provided an opportunity to test and demonstrate this technology for limnology applications. For this, a lander was suspended in mid-water from one of the buoys near the platform and a data-mule-BlueROV was deployed from LéXPLORE. It successfully offloaded data from the data logger, thereby demonstrating the feasibility of the approach and showcasing optical communication as a viable tool for limnology.
As we made use of pre-deployed buoys and LéXPLORE provided a stable platform for our deployment, we were able to mobilize for the experiment and carry it out within a very short amount of time. In the year since the experiment in September 2020, Hydromea has significantly improved the LUMA technology and future deployments from LéXPLORE will see data downloads from landers on the lake bed deployed for several months.
Figure 1: BlueROV with LUMA modem (right) downloading data from logger (left)
41

Final reports for completed projects
Rainbow on the platform, from Edouard Mercier on 2nd June 2021
Lightening close to LéXPLORE, from Marc Favre on 5th June 2021
42

Final report
Datalakes: heterogeneous data platform for operational modelling and forecasting of Swiss lakes
Damien Bouffard, Jonas Sukys, Firat Ozdemir, Fotis Georgatos, Eric Bouillet, Fernando Perez Cruz, Camille Minaudo, Lavanchy Sébastien, Sukys Jonas, Safin Artur, Tran-Khac Viet, Runnalls James
Abstract
Predicting the evolution of freshwater systems is the impetus of many limnologists. Technological developments have opened countless ways to investigate these systems, with the drawback that scientists are today overwhelmed by data. Efficiently utilizing the benefits of present-day data and technology requires optimizing the way data is shared and reused. The means of acquisition and computational processing of third-party data are often non transparent, and hence irreproducible after the end of the project’s timeframe.
With the recent development of an operational interdisciplinary in-situ floating laboratory (LéXPLORE, https://lexplore.info/) on Lake Geneva, we identified the need for a user-friendly web based open access data platform to foster scientific data exchange: https://www.datalakes-eawag.ch/. The main objective was to provide a fully open access sensor-to-front end platform for scientific data in Swiss lakes. The Datalakes platform (Figure 1) incorporates continuous in-situ acquisition, storage, curation, patching, visualization, and extraction frameworks of environmental data and model output, together with an accessible online interface for visualization of historical data, future predictions, and user-friendly online data extraction.
We invite interested scientists to use Datalakes, and to visualize and download our initial datasets. We also welcome feedback and the inclusion of new data, products or models that will be of use to the Swiss freshwater community via this newly developed open access data infrastructure.
43

Final report
Figure 1: Overview of the Datalakes platform https://www.datalakes-eawag.ch. Heat map for Lake Geneva representing the total suspended matter estimated from Sentinel 3 satellite and white lines the lake surface current estimated from meteolakes.ch.
Main results
Determining a suitable data pipeline was one of the key challenges for the Datalakes project. Competing requirements of reproducibility, flexibility, speed, cost, visualization, and simplicity meant that careful selection of the technologies and architecture was essential. Several experimental setups were tested during the initial phase of the project before the architecture described below was implemented.
To ensure reproducibility and longevity two key technologies were defined with regards to the storage of the data. The data would be formatted in the scientific format NetCDF, such that any single file would be useful without any wider context due to the included metadata, and the data would be stored in git repositories. Storing the data in git repositories facilitated the use of Renku for tracking reproducibility and is a data storage type that is likely to persist in the long term.
These technologies form the basis of the Datalakes data pipeline. Raw data is retrieved from in situ sensors, it is then processed into higher ‘data levels’, as is common practice for environmental data, and stored in the NetCDF format. This data processing can be made fully reproducible by running the computation within a Docker environment and by tracking the inputs and outputs using the Renku CLI. The output data, raw data, scripts, docker files, and knowledge graph are all then pushed to a remote repository for wider access. This can be a one-off process done manually, a semi-regular manual process, or can be fully automated.
The Datalakes project then has three options for accessing the data stored in these git repositories; direct from the remote repo, the Datalakes web application, and ERIC Open. Each of these options serves a different use case, users looking to reproduce the datasets or access the raw data files and scripts are likely to clone the repository, users looking to find data and visualize it are likely to use the web application and researchers looking to publish there datasets are likely to use ERIC open.
44

Final report
The Datalakes web application consists of a Node.js API hosted on AWS EC2, a PostgreSQL database, and a React.js front end hosted on AWS Amplify. The back end works by cloning the git repositories, converting the NetCDF files to JSON, and then making these files available through the API. Git webhooks allow the API to detect changes to the repositories, making it possible for any changes in the repositories to be automatically reflected in the data available on Datalakes. The front end is made up of four main sections; Map Viewer – for comparing multiple datasets, Data Portal – for searching and finding datasets, API – documentation for using the API directly, and Data Details. The data details pages (one for each dataset) allow the user to visualize the dataset, download subsets, quickly view the processing scripts and metadata. Data from the Renku knowledge graph, where available, is also collected and displayed.
ERIC Open is a central storage location where Eawag scientists can publish their research data and have it persist in the long term. An automatic connection between ERIC and Datalakes is still under construction, however, the connection will work by taking a snapshot of the git repository at a given time and using the metadata in the Datalakes database to upload the dataset to ERIC where it will receive a DOI number that can be used for publication.
Publications
• Bouffard D. et al. (2021). Datalakes, a data platform for Swiss lakes. In prep for Earth SystemData Science
• Safin A. et al. (2021) A comprehensive Bayesian data assimilation platform for a 3Dhydrodynamic model of Lake Geneva. Submitted to GMD (Copernicus)
Conferences
• Bouffard D. et al. (2020). Datalakes, a data platform for Swiss lakes. Swiss GeosciencesMeeting.
• Bouffard D. (2020). Datalakes, a data platform for Swiss lakes. GLEON (invited talk)• Safin A. et al. (2020) A comprehensive Bayesian data assimilation platform for a 3D
hydrodynamic model of Lake Geneva. Swiss Geosciences Meeting.
Collected data
www.datalakes-eawag.ch
Lake Temperature
https://www.datalakes-eawag.ch/datadetail/448 live, LéXPLORE temperature chain, 0-90 m since 17.04.2020
https://www.datalakes-eawag.ch/datadetail/445 LéXPLORE temperature chain 0-18 m, 20.06.2019 to 15.01.2020
https://www.datalakes-eawag.ch/datadetail/446 LéXPLORE temperature chain 21-90m, 20.06.2019 to 01.08.2020
https://www.datalakes-eawag.ch/datadetail/327 LéXPLORE mooring temperature at various depths, 08.10.2018 to 12.12.2019
45

Final report
Meteorological station
https://www.datalakes-eawag.ch/datadetail/459 live
Dissolved oxygen
https://www.datalakes-eawag.ch/datadetail/473 live, LéXPLORE Thetis DO profiles
https://www.datalakes-eawag.ch/datadetail/484 live, LéXPLORE Thetis DO Depth Time Grid
https://www.datalakes-eawag.ch/datadetail/402 LéXPLORE PP mooring DO at various depths, 08.10.2018 to 12.12.2019
PAR
https://www.datalakes-eawag.ch/datadetail/329 LéXPLORE PP Mooring PAR at Various Depths
CTD (multiparameter profiler)
https://www.datalakes-eawag.ch/datadetail/461 live, LéXPLORE Thetis CTD profiles
https://www.datalakes-eawag.ch/datadetail/464 live, LéXPLORE Thetis CTD profiles Depth Time Grid
https://www.datalakes-eawag.ch/datadetail/674 LéXPLORE CTD profiles, manual on entire depth
https://www.datalakes-eawag.ch/datadetail/667 live, LéXPLORE Idronaut profiles
https://www.datalakes-eawag.ch/datadetail/666 live, LéXPLORE Idronaut profiles Depth Time Grid
Heat fluxes
https://www.datalakes-eawag.ch/datadetail/452 live
ADCPs
https://www.datalakes-eawag.ch/datadetail/600 live, LéXPLORE ADCP Near Surface Velocities
https://www.datalakes-eawag.ch/datadetail/602 live, LéXPLORE ADCP Upward Looking Flow Magnitude and Direction
https://www.datalakes-eawag.ch/datadetail/601 live, LéXPLORE ADCP Downward Looking Flow Magnitude and Direction
https://www.datalakes-eawag.ch/datadetail/599 live, LéXPLORE Deep ADCP Velocities
https://www.datalakes-eawag.ch/datadetail/375 LéXPLORE ADCP Near Surface Velocities, 12.06-27.08.2019
https://www.datalakes-eawag.ch/datadetail/287 LéXPLORE ADCP Upward Looking Flow Magnitude and Direction, 12.06-27.08.2019
46

Final report
Buoyancy driven nearshore flows in lakes (HYPOTHESYS) – Experiments on LéXPLORE
Tomy Doda, Bieito Fernández Castro, Cintia Ramón Casañas, Hugo Ulloa, Damien Bouffard
Abstract
The HYPOTHESYS project aims at better quantifying density currents induced by differential cooling in lakes. When lakes experience surface cooling, the shallow littoral region cools faster than the deep pelagic waters. The lateral density gradient resulting from this differential cooling can trigger cold downslope density currents, also called "thermal siphons" (TS), which intrude at the base of the mixed layer during stratified conditions. At the surface, a return flow directed towards the shore balances the bottom underflow. TS increases water exchange between nearshore and pelagic zones, with possible implications on the lake ecosystem.
One part of the project consists in resolving the fine-scale processes associated with TS to determine the effects of the density current on turbulent mixing and its interaction with penetrative convection. Turbulence measurements were collected in Lake Geneva during a 24 h experiment (27-28th August 2019) to compare the energetics of the process with observations from Lake Rotsee (Luzern), the main study site of the project. The main objectives of this experiment was to monitor over an entire night the turbulent mixing due to penetrative convection and to quantify the cross-shore heterogeneity of turbulent mixing due to differential cooling. Turbulence estimates were obtained from two microCTD profilers (Rockland Scientific) equipped with microstructure temperature, shear and conductivity sensors. One microCTD was used at the LéXPLORE platform for continuous profiling and the other was used on a boat along cross-shore transects, to resolve the temporal and spatial variability of turbulent mixing, respectively. In addition, CTD profiles were collected both at the platform and on the boat.
Figure 1 – Schematic of the thermal siphon induced by differential cooling. The density current and the surface return flow are depicted by white and black arrows, respectively.
47

Final report
Main results
The 24 h cycle of the experiment was characterized by a net cooling phase from 6 pm to 6 am (positive heat flux) (Fig. 2.A). Winds were generally weak (<2 m s-1), except between 23 pm and 3 am where the wind speed reached 5 m s-1 (Figure 2.A), in coincidence with the strongest heat flux. A cycle of daily stratification, de-stratification and re-stratification was observed in the upper 5 m, following the evolution of the net heat flux (Fig. 2B). The development of a well-mixed layer was observed clearly from 2 am on the second day, when wind and buoyancy forcing were maximum, and reached its maximum depth of ~6 m at 6 am, when the net heat flux changed sign. The Monin-Obukov length represented a small fraction of the mixed-layer during the deepening period (2am – 6am), suggesting that, despite relatively enhanced winds, the deepening was dominated by convection.
The rates of dissipation of turbulent kinetic energy εT were larger in the upper 20 m due to convective cooling and wind mixing. Near-surface εT was relatively low (<10-8 W kg-1) between 7pm and 1am, but increased up to 10-7 W kg-1 during the windy period and initial deepening of the mixed layer. After the re-stratification, εT decreased below 10-8 W kg-1 (Fig. 2.A).
In the morning, the mixed layer was deeper than the littoral region (around 4 m, Fig. 2.C). Thus, we would expect the littoral region to be entirely mixed but a bottom stratification of ~0.35 °C/m was instead observed from the CTD profiles (isotherms following the bottom of the littoral region in Fig. 2.C). This could possibly be the signature of TS, even if more littoral profiles and velocity data wouldbe needed to confirm this hypothesis.
εT was larger close to the shore (profiles P05 and P06), especially for the bottom 10-20 m of the profiles. Values reached 10-8-10-7 W/kg, compared to 10-10-10-9 W/kg offshore, for the same depths. Although the intrusion of TS at the base of the mixed layer could increase εT nearshore, the observed differences of εT are more likely due to the bottom boundary layer, with the contribution of internal waves shoaling nearshore (note that the vertical increase of εT matches zones with stronger stratification).
Overall, this 24 h experiment allowed us to quantify the deepening of the mixed layer and the turbulence associated with convective cooling and wind mixing. Cross-shore transects showed that turbulent mixing is larger nearshore than offshore. It was however not possible to relate this heterogeneity to TS, due to the lack of velocity measurements in the littoral region.
48

Final report
Figure 2 – Temporal and spatial variability of turbulent mixing during the 24 h experiment in Lake Geneva. A. Time series of net heat flux (shaded areas), wind speed (black curve) and log-averaged turbulent energy
dissipation rate εT (orange bars, derived from microCTD profiles at the plaform) in the upper 5 m. B. Temperature vertical profiles collected at the platform over time (separated by an offset of 1°C). The black dashed line indicates the mixed layer depth. C. Cross-shore transect of turbulent energy dissipation rate εT
(derived from microCTD profiles on the boat), between 08:10 (P05) and 09:40 (P12). Black lines are 0.5°C isotherms.
49

Final report
Publications
The data from the 24 h experiment has not yet been published but will be included in a future study about turbulence in peri-alpine lakes.
Two publications related to the dynamics of TS in Lake Rotsee are also planned: • Doda, T., Ramón, C. L., Ulloa, H. N., Wüest, A. and Bouffard, D. (2021). Seasonality of density
currents induced by differential cooling. In review in Hydrology and Earth System Sciences.• Doda, T., Ulloa, H. N., Ramón, C. L., Wüest, A. and Bouffard, D. (2021). Competition between
penetrative convection and cooling-driven density currents. In preparation.
Conferences
Presentations about the dynamics of TS in Lake Rotsee:
• Doda, T., Ramón, C. L., Ulloa, H. N., Wüest, A. and Bouffard, D. Density currents induced bydifferential cooling in a small temperate lake: seasonality in their occurrence and magnitude.16th Swiss Geoscience Meeting, Bern, 23 November 2019.
• Bouffard, D., Ramón, C. L., Doda, T., Ulloa H. N. Density currents induced by differential coolingin lake. 22nd EGU General Assembly, held online on 4-8 May 2020.
• Doda, T., Ramón, C. L., Ulloa, H. N., Wüest, A. and Bouffard, D. Density currents induced bydifferential cooling in a small temperate lake: seasonality in their occurrence and magnitude.22nd International Workshop on Physical Processes in Natural Waters (PPNW), held online on15-18 June 2020.
Collected data
The data will be uploaded to www.datalakes-eawag.ch. Example of a microCTD profile from Lake Geneva: https://www.datalakes-eawag.ch/datadetail/752.
50

Final report
• Metadata of the microCTD profiles from the platform:
General information Date 27-29 August 2019, 24h experiment Location Lexplore Operators Bieito and Hugo Microstructure sensors S1:M1973, T1:T1550, T2:T1552 (C276) , instrument is SN158 General Comments Instrument rented with microCTD SN158
Prof. Up/Down Start/end time Comments File Numb. 1 D1 1148 Downward Test VMP002 2 D1 1444-1451 VMP003 3 D2 1456-1504 VMP003 4 D3 1504-1516 VMP003 5 U1 1555-1600 Upward VMP005 6 U2 1606-1616 VMP005 7 U3 1622-1632 Tangled, failed VMP005 8 U4 1638-1648 VMP005 9 U5 1653-1704 Chamber 1 17h08-1800 // They are doing water samples VMP005
10 U6 1722-1730 VMP005 11 D1 1814-1825 Chamber 2 1830-1925 VMP008 12 D2 1832-1841 Fake VMP008 13 D3 1843-1853 VMP008 14 U1 1906-1918 VMP009 15 U2 1922-1932 VMP009 16 U3 1940-1951 We added some lead, tangled ? VMP009 17 U4 2002 Tangled (2002 up),. Data looks good VMP009 18 U5 2008-2024 Chambers 3 (2015) // Trouble to release VMP009 19 D1 2113-2118 VMP011 20 D2 2123-2134 VMP011 21 D3 2141-2148 VMP011 22 U1 2152-? VMP012 23 U2 2212-2222 Disturbing by bottle sampling ? VMP012 24 U3 2227-2237 Chambers 2228 VMP012 25 U4 2248-2255 VMP012 26 U5 2302-2312 VMP012 27 U6 2316-2326 VMP012
2351 Chambers 28 D1 1205-1218 VMP014 29 D2 1227-1236 VMP014 30 D3 1246-1258 VMP014 31 D4 0115-0125 (No profile was performed before because of the wind and current) VMP014 32 D5 0136-0146 VMP014 33 D6 0156-0206 Chambers 0150-0340 VMP014 34 D7 0127-? VMP014 35 D1 0308-0319 VMP016 36 D2 0326-0336 VMP016 37 D3 0342-0350 VMP016 38 U1 0402-0412 Upward, no lead VMP017 39 U2 0418-0428 VMP017 40 U3 0433-0438 Chambers 4h35-6h10, wind changed direction VMP017 41 U4 0441-0450 VMP017 42 U5 0455-0505 VMP017 43 U6 0510-0521 Wind is gone VMP017 44 D1 0605-0615 VMP018 45 D2 0625-0635 VMP018 46 D3 0645-0653 Chambers 0649 VMP018 47 U1 0707-0716 Tangled, but looks good ? X
Released on the way down X FILE IS THE SAME AS FOR DOWNWARD
VMP018
48 U2 0720-0730 Chamber 1 Failed VMP018 49 U3 733-745 Chamber off 740, bit bumpy! VMP018 50 U4 747-757 Bit Bumpy VMP018 51 U5 800-810 VMP018 52 U6 812-825 Chambers on 825-940 VMP018 53 U7 830-840 VMP018 54 D1 922-935 VMP019 55 D2 940-948 VMP019 56 D3 953 Chambers 958-1114 VMP019 57 U1 1010-1019 VMP020 58 U2 1021-1031 VMP020
51

Final report
59 U3 1038-1046 VMP020 60 U4 1050-1102 Tangled VMP020 61 U5 1107-1115 VMP020 62 U6 1123-1130 VMP020 63 U7 Fake, chambers 1153 (Are they blinking ?) VMP020 64 D1 1217-1226 VMP022 65 D2 1232-1240 VMP022 66 D3 1247 VMP022 67 U1 1317-1320 VMP023 68 U2 1325-1340 VMP023 69 U3 1345-1356 VMP023 70 U4 1402-1412 VMP023 71 D1 1430-1436 Simultaneous with the 2 instruments VMP024 72 D2 1445-1454 We did not wait enough, contamination problem? Not for this instrument
apparently VMP024
73 D3 1504-1511 VMP024
• Metadata of the CTD and microCTD profiles from the boat:
General information Date 27-28 August 2019, 24h experiment Location Boat (cf coordinates of the points) Operators Damien, Sébastien, Tomy Microstructure sensors S1:M1731, T1:T1465, T2:T1680 , instrument is SN310 CTD profiler Sea&Sun, SN281 General Comments microCTD from Eawag/EPFL, always used in downward mode.
Configuration file updated with correct parameters for M1731.
Trans. Prof. Coordinates (CH1903/LV03) Type Time Depth*
[m] Comments File Name
T1 P01 539117/150709 CTD 1700 2.2 Macrophytes D8290828_2.TOB T1 P02 539133/150587 CTD 1702 3.6 Macrophytes D8290828_3.TOB T1 P03 539146/150479 CTD 1708 4.5 Macrophytes D8290828_5.TOB T1 P04 539153/150456 CTD 1712 12.5 Slope increases D8290828_6.TOB T1 P05 539153 /150430 CTD 1716 25 D8290828_7.TOB T1 P05 uCTD 1726 23 DAT_128.P T1 P05 539164/150431 CTD 1803 18 D8290828_10.TOB T1 P05 uCTD 1813 23 DAT_129.P T1 P06 539163/150394 CTD 1817 30 D8290828_11.TOB T1 P06 uCTD 1824 26 DAT_130.P T1 P07 539162/150356 CTD 1829 31 D8290828_12.TOB T1 P07 uCTD 1836 26 DAT_130.P T1 P08 539170/150314 CTD 1840 40 D8290828_13.TOB T1 P08 uCTD 1848 38 DAT_130.P T1 P09 539179/150261 CTD 1853 44 D8290828_14.TOB T1 P09 uCTD 1900 49 DAT_130.P T1 P10 539166/150186 CTD 1907 58 D8290828_15.TOB T1 P10 uCTD 1915 57 DAT_130.P T1 P11 539197/150114 CTD 1923 70 Drift by ~20 m D8290828_16.TOB T1 P11 uCTD 1935 70 DAT_130.P T1 P12 539221/149947 CTD 1943 115 D8290828_17.TOB T1 P12 539211/149961 uCTD 1956 100 DAT_130.P T1 P13 539340/148984 uCTD 2009 300 DAT_130.P T2 P01 539130/150700 CTD 2217 2.4 D8290828_19.TOB T2 P02 539142/150575 CTD 2221 3.3 D8290828_20.TOB T2 P03 539154/150477 CTD 2225 4.3 D8290828_21.TOB T2 P04 539157/150459 CTD 2230 10.6 D8290828_22.TOB
T2 P05 539161/150431 CTD 2235 16 Depth varying between 15 and 20 m D8290828_23.TOB
T2 P05 uCTD 2240 DAT_132.P T2 P06 539164/150396 CTD 2246 26 D8290828_24.TOB T2 P06 uCTD 2256 DAT_132.P T2 P07 539172/150356 CTD 2300 38 D8290828_25.TOB T2 P07 539173/150360 uCTD 2306 31 DAT_132.P T2 P08 539174/150307 CTD 2311 47 D8290828_26.TOB T2 P08 uCTD 2317 DAT_132.P T2 P09 539172/150259 CTD 2322 52 D8290828_27.TOB T2 P09 uCTD 2328 DAT_132.P T2 P10 539166/150188 CTD 2335 65 Light wind D8290828_28.TOB T2 P10 539166/150182 uCTD 2341 57 Wind DAT_132.P
52

Final report
T2 P11 539206/150113 CTD 2348 67 Wind , drift towards the shore (25m) D8290828_29.TOB
T2 P11 uCTD 2357 Wind DAT_132.P T2 P12 539211/149957 CTD 0004 111 Wind D8290828_30.TOB T2 P12 uCTD 0015 Wind DAT_132.P T2 P13 539288/148978 uCTD 0029 300 Wind DAT_132.P T3 P01 539124/150701 CTD 0750 2.4 D8290828_31.TOB T3 P02 539146/150573 CTD 0755 3.3 D8290828_32.TOB T3 P03 539124/150475 CTD 0757 7.9 D8290828_33.TOB T3 P04 539124/150456 CTD 0800 15 D8290828_34.TOB T3 P05 539161/150430 CTD 0803 18 D8290828_35.TOB T3 P05 uCTD 0810 21 DAT_134.P T3 P06 539171/150393 CTD 0813 29 D8290828_36.TOB
T3 P06 uCTD 0818 First profile stopped, second profile OK DAT_134.P
T3 P07 539173/150359 CTD 0823 37 D8290828_37.TOB T3 P07 uCTD 0827 DAT_134.P T3 P08 539180/150300 CTD 0831 49 D8290828_39.TOB T3 P08 uCTD 0837 DAT_134.P T3 P09 539174/150257 CTD 0843 50 D8290828_40.TOB T3 P09 uCTD 0847 DAT_134.P T3 P10 539173/150175 CTD 0853 57 D8290828_41.TOB T3 P10 uCTD 0900 DAT_134.P T3 P11 539201/150107 CTD 0904 75 D8290828_42.TOB T3 P11 uCTD 0914 DAT_134.P T3 P12 539211/149961 CTD 0924 100 Drift D8290828_44.TOB T3 P12 uCTD 0937 DAT_134.P T3 P13 539371/148991 uCTD 0949 DAT_134.P T4 P01 539139/150695 CTD 1213 2 D8290828_46.TOB T4 P02 539147/150583 CTD 1218 3.5 D8290828_47.TOB T4 P03 539161/150486 CTD 1221 4.2 D8290828_48.TOB T4 P05 539169/150428 CTD 1225 22 D8290828_49.TOB T4 P05 uCTD 1233 18 DAT_136.P T4 P07 539170/150363 CTD 1238 33 D8290828_50.TOB T4 P07 uCTD 1244 32 DAT_136.P T4 P09 539173/150266 CTD 1248 45 D8290828_51.TOB T4 P09 uCTD 1255 DAT_136.P T4 P10 539181/150186 CTD 1301 53 D8290828_52.TOB T4 P10 uCTD 1307 DAT_136.P T4 P11 539193/150114 CTD 1313 68 D8290828_53.TOB T4 P11 uCTD 1321 DAT_136.P T4 P12 539204/149964 CTD 1328 100 D8290828_54.TOB T4 P12 uCTD 1339 DAT_136.P T4 P13 uCTD 1349 DAT_136.P
*measured with the echosounder
53
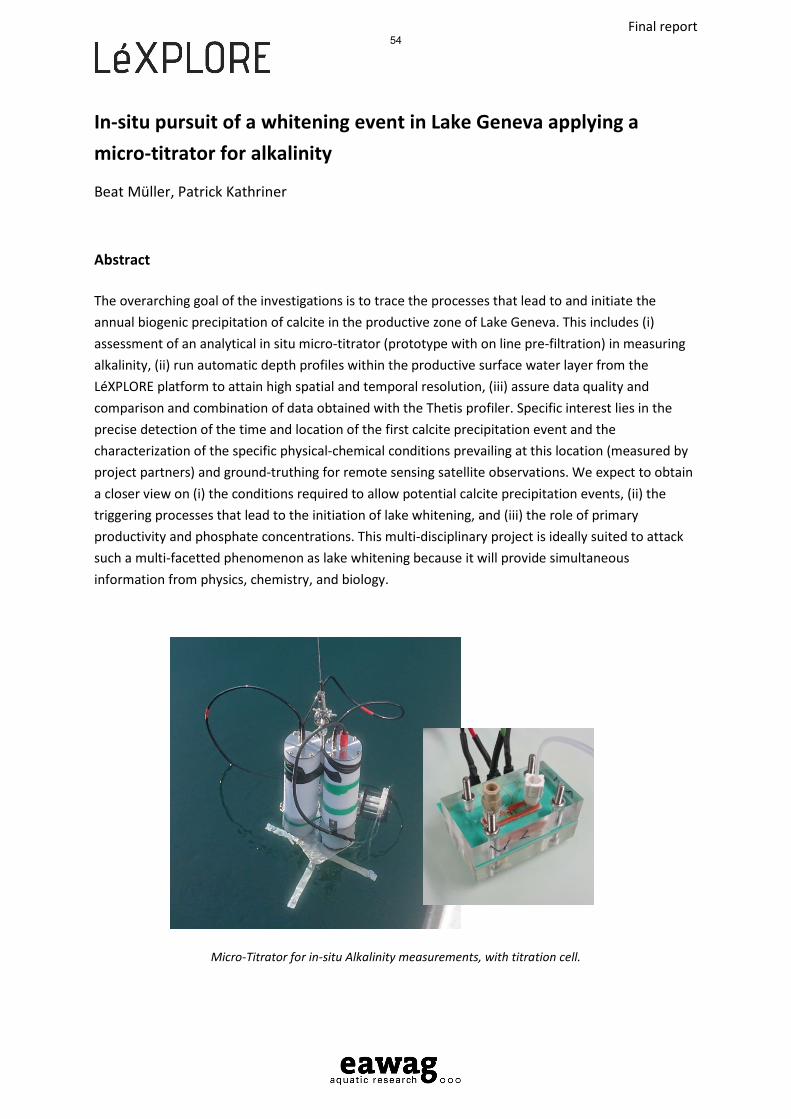
Final report
In-situ pursuit of a whitening event in Lake Geneva applying a micro-titrator for alkalinity
Beat Müller, Patrick Kathriner
Abstract
The overarching goal of the investigations is to trace the processes that lead to and initiate the annual biogenic precipitation of calcite in the productive zone of Lake Geneva. This includes (i) assessment of an analytical in situ micro-titrator (prototype with on line pre-filtration) in measuring alkalinity, (ii) run automatic depth profiles within the productive surface water layer from the LéXPLORE platform to attain high spatial and temporal resolution, (iii) assure data quality and comparison and combination of data obtained with the Thetis profiler. Specific interest lies in the precise detection of the time and location of the first calcite precipitation event and the characterization of the specific physical-chemical conditions prevailing at this location (measured by project partners) and ground-truthing for remote sensing satellite observations. We expect to obtain a closer view on (i) the conditions required to allow potential calcite precipitation events, (ii) the triggering processes that lead to the initiation of lake whitening, and (iii) the role of primary productivity and phosphate concentrations. This multi-disciplinary project is ideally suited to attack such a multi-facetted phenomenon as lake whitening because it will provide simultaneous information from physics, chemistry, and biology.
Micro-Titrator for in-situ Alkalinity measurements, with titration cell.
54

Final report
Main results
Unforeseeable technical and electronic issues delayed proper functioning of the micro-titrator until the time of the calcite precipitation event in Lake Geneva. A major obstacle to act on short notice was our location at Eawag in Kastanienbaum (near Lucerne). The long travelling distance and time involved made it very cumbersome to adjust and optimize the system.
Deployment of the micro-Titrator on LéXPLORE platform
55

Final report
Local Adaptation of freshwater bacteria Communities to environmental conditions (LAC)
Anna Carratalà (LCE), Coralie Chappelier (LCE), Charlotte Weil (ENAC-IT4R), Annie Guillaume (LASIG), Elia Vajana (LASIG), Tamar Kohn (LCE), Stéphane Joost (LASIG)
Abstract
Bacteria communities play major roles in freshwater ecosystems such as contributing to the primary production of lakes and to the biogeochemical cycles of many key elements. Because of their fast life cycles, bacteria are readily responsive to environmental variations. However, predicting how prokaryotic communities may adapt to climate change and how their response may influence ecosystem functioning is currently difficult, partly because the ecology of many bacteria groups is largely unknown. Since August 2019, we are conducting a monitoring project in the experimental floating platform LéXPLORE in Lake Geneva. To date we have collected more than 200 water samples at different depths, from the lake’s surface to 100 meters deep, and analyzed them by 16S amplicon high throughput sequencing. Simultaneously, we have compiled a dataset of the environmental conditions using CTD sensors, and measured the concentration of nutrients in the water column. This project has allowed us to obtain about 25 million bacteria sequences, classified in more than 17,000 different species. Our results show interesting spatio-temporal patterns in the bacteria communities of Lake Geneva and their predicted functions, and allow us to characterize cyanobacteria blooms caused by Planktothrix rubescens, a toxic cyanobacteria that is favored by global warming. In addition, combined with our environmental dataset our taxonomic data represent a unique opportunity to use ecological distribution modelling to predict community assemblage under future climate change scenarios.
Figure 1: Heatmap showing the relative abundance of the main classes found in the water column in two different seasons (August 2019 and January 2020).
Main 15 classes 0 2,5 5 10 15 20 25 30 50 100 0 2,5 5 10 15 20 25 30 50 100Betaproteobacteria
AcidimicrobiiaAlphaproteobacteria
OPB35 soil groupCyanobacteria
GammaproteobacteriaPhycisphaeraeActinobacteriaFlavobacteria
PlanctomycetaciaSphingobacteriia
AnaerolineaeOpitutae
VerrucomicrobiaeDeltaproteobacteria
BacteroidiaKryptonia
BaciliOligoflexia
ChlamydiaeClostridiae
CampylobacteriaBdellovibrionia
Negativicutes
Summer 2019 Winter 2020
56

Final report
Main results
During 2019 and 2020, we have constructed a valuable dataset collecting more than 200 water samples and their corresponding environmental variables. The composition of the bacteria communities present in the samples has been identified by 16S amplicon sequencing and the total abundance of bacteria, eukaryotes and bacteriophages has been determined in each sample. The average abundance of bacteria in our samples during the study period is 108 cells/l, however we have observed differences in the bacteria concentration of the epilimnion compare to those observe in the hypolimnion.
Our results have shown that the main phyla of bacteria present in the epilimnion (above 30m deep) throughout the year are Proteobacteria, Cyanobacteria, Actinobacteria, Verrucomicrobia, Bacteroidetes and Planctomycetes. Conversely, in the hypolimnion (50-100 m deep), Cyanobacteria show very low relative abundances, but we observed a remarkable increase in the abundance of Chlorobi and Chloroflex. We can highlight interesting distribution patterns when we compare the main bacteria classes identified in different seasons (See Figure below). In particular, our dataset indicates the existence of seasonal, depth and ecology –related differences in the relative abundance of certain classes. For example, while Cyanobacteria were very abundant in Winter, they were much less numerous in Summer. It is worthwhile mentioning that we have observed an unexpectedly high abundance of Cyanobacteria belonging to the Planktothrix genus. This genus is known to comprise toxic species, and thus our finding rises the alarm about the potential presence of cyanotoxins in the lake.
The combined analyses of our community dataset and the environmental measures by regression analyses will allow us to make hypothesis about the main environmental mechanisms influencing the taxonomic patterns observed in our study. In addition, in the forthcoming months we apply species distribution modelling in order to determine the ecological niche for the bacteria communities identified in our work.
57

Final report
Publications
The results obtained in this project will be published in at least two publications. The first publication will be focused on our abundance results, whereas the second publication will be dedicated to our taxonomical description and regression analysis using taxonomic and environmental data. It is possible that our results involving the species distribution models could be part of the second publication, or represent a third publication on their own.
Conferences
• Carratalà A, Chappelier C, Guillaume A, Vajana E, Kohn T, Joost S. Spatiotemporal dynamics ofbacteria communities in Lake Geneva by Next-Gen amplicon sequencing. Oral presentation.Symposium for European Freshwater Sciences (SEFS12), July 25th-30th 2021 (Virtual).
Collected data
• Environmental dataset composed by CTD sensor data.• Taxonomic dataset for 218 samples collected during the whole duration of the project based
on 16s high throughput sequencing using Illumina platform.• Bacteria abundance dataset for 218 samples collected during the whole duration of the
project.• Bacteriophage abundance dataset for 218 samples collected during the whole duration of the
project.• Dataset on the abundance of eukaryotic cells for 218 samples collected during the whole
duration of the project.• Functionality dataset derived by applying PICRUSt (Phylogenetic Investigation of Communities
by Reconstruction of Unobserved States) to the taxonomic dataset mentioned above.
The data is currently stored in a server of the ENAC School at EPFL. After publication, we are willing to share our data to become part of the Datalakes platform.
58
Final report
Spatio-temporal analysis of wind field characteristics over Lake Geneva
Mehrshad Foroughan, Andrew Barry and Fernando Porté-Agel
Abstract
Reliable estimates of air-water exchange of momentum, heat, and gas are vital for understanding boundary layer dynamics and developing accurate global and regional climate and weather forecasting models. However, spatiotemporal variability of physical processes, below and above the water surface and at the interface, contribute to the uncertainty of these estimates. Air-side exchange processes are closely related to various phenomena in the Atmospheric Boundary Layer (ABL), which frequently manifest as coherent structures in turbulent flow fields. Identifying such structures and their dynamics is essential for determining their role in the variability of air-water fluxes. A Doppler wind LiDAR (Light Detection And Ranging) was deployed on the south side of the LéXPLORE platform in Lake Geneva, two meters above the lake surface water. It provided the line-of-sight (radial) wind velocity component (spatial resolution of 18 m, Fig.1). The LiDAR was configured for both horizontal arc sector and staring scans, i.e., sequential sweeps and a fixed direction of the laser, respectively, aligned with the mean wind direction. Empirical Orthogonal Function and Continuous Wavelet Transform analyses were used for data post-processing. These techniques allowed decomposition of the time series of radial wind data into modes of spatial variability of the fluctuations and temporal variations of the different time scales embedded in the flow field, thereby providing the dimensions of structures coexisting in the wind field and their corresponding time-scales. The primary objective of this project was to link between wind field structures in the atmospheric surface layer and the patchiness of the wavefield under low wind conditions (U10 < 5 m s-1). However, since such coherent structures are easier to identify in higher winds, we tested our methodology in those conditions first. In particular, we preliminary focused on the measurements taken during a Bise event, a regularly occurring strong wind (U10 > 5 m s-1) blowing from the northeast over most of the lake surface. It was found that the horizontal radial wind field over Lake Geneva is “patchy” and can be decomposed into large-scale horizontal coherent structures (Fig. 1). In particular, coherent structures of high velocity are evident. They were always elongated in the wind direction, extending several hundred meters in length. The shape and the spatial distribution of these structures changed continuously in time. The radial velocity magnitude in any scan varied by a factor of two or more. This indicates that macro turbulence in the ABL, as documented by these coherent structures, is well developed and is the dominant feature of the near-surface boundary layer of the wind field. Even though the three-dimensional nature of the ABL wind vector cannot be determined from these measurements, it is clear that the strong spatio-temporal variability observed here will have important consequences for the dynamics of the air-water exchange of momentum, heat and gas. This variability will affect surface shear stress and thus surface renewal and the production of turbulence in the near-surface water boundary layer. Furthermore, it will affect the surfactant distribution in the surface micro layer, which in turn will again modify the exchange processes.
59

Final report
Figure 1. (left panel) A schematic of the LiDAR configuration on the LéXPLORE platform showing the Field of View (FOV; red triangle), Red arrows indicate the Bise wind. (right panel) An example of the 600-m horizontal
arc sector LiDAR measurements of the wind field (taken at 20:50:24 on 14.04.2020) degrees are measured from the East). The color bar indicates the range of the velocities.
Main results
This project was a preliminary deployment of the LiDAR to investigate wind field structures just above the lake's surface water and the potential interplay between coherent structures in the atmospheric surface layer and surface roughness (i.e., wavefield) variability, particularly under low wind conditions. In order to test the methodology, we analyzed episodes with high wind speeds (U10 > 5 m s-1). Coherent structures are easier to detect under such conditions; therefore, they are more extensively studied in the literature, allowing us to compare our results to previous studies. They agree with similar studies on coherent structures in the atmospheric surface layer under near-neutral stability conditions (Hutchins & Marusic, 2007). However, here we document for the first time in the open lake the presence of large-scale near-surface wind structures whose shape and pattern continuously change in time and space. This was not reported in a previous near-shore LiDAR study on Lake Geneva. The summary of the results can be found in the poster presented during the Swiss Geoscience Meeting 2020.
However, the extension of the methodology for low wind conditions and further analysis of the data, which is the primary objective of this project, has been put on hold since applying the same method for the low wind episodes was not as promising. Moreover, we were not able to produce a systematic solution to measure the relationship between the surface roughness distribution and the atmospheric surface layer coherent structures. A few simultaneous field campaigns were conducted with the ECOL lab research catamaran in the field of view of the LiDAR; however, we have not been satisfied with the results yet. Therefore, at the moment, I am prioritizing my other field measurements at the moment that are more directly related to my research.
60

Final report
Publications
-
Conferences
Poster presentation in 18th Swiss Geoscience Meeting, Zurich 2020. “Signatures of coherent flow structures in the atmospheric surface layer over Lake Geneva”
Collected data
1. LiDAR measurements:
Period of measurement: 07/02/2020-30/07/2020
Data type: *.hpl files. Each file containing header information and measured data with thefollowing arrangement:
Data line 1: Decimal time (hours) | Azimuth (degrees) | Elevation (degrees) | Pitch (degrees) | Roll (degrees)Data line 2: Range Gate Doppler (m/s) | Intensity (SNR + 1) | Beta (m-1 sr-1)
Data import and preliminary analysis: python scripts can be provided upon requests.
2. Sonic anemometer measurements (complementary to LiDAR measurement)
This sonic anemometer measures the 3D wind vector, water vapor, and carbon dioxideconcentrations with 20Hz frequency. The instrument installed on the southwest corner of theplatform at about 4m height above the surface water.
Period of measurement: 25/06/2020-26/08/2020
Data type: *.csv files. Each file has the following columns:
timestamp / s; ux / m/s; uy / m/s; uz / m/s; sonic_temperature / degC; sonic_diag_flag / no_units; CO2_density /mg/m^3; H2O_density / g/m^3; gas_diag_flag / m/s; air_temperature / degC; air_pressure / kPa; CO2_sig_strength / no_units; H2O_sig_strength / no_units; CO2_density_fast / mg/m^3; source_housing_temperature / degC;detector_housing_temperature / degC; counter / no_units
All the data will be available after this PhD study (provisional date: August 2022).
61