Luthfi Muhammad Mauludin - Advanced Masters in · PDF fileLuthfi Muhammad Mauludin ... Hasil...
109
Transcript of Luthfi Muhammad Mauludin - Advanced Masters in · PDF fileLuthfi Muhammad Mauludin ... Hasil...
Luthfi Muhammad Mauludin
Numerical Modeling of
Reinforced Concrete Beams
Repaired with Polymer
Modified Mortar
Italy 2009
i
DECLARATION
Name: Luthfi Muhammad Mauludin
Email: [email protected], [email protected]
Title of the
Msc Dissertation:
Numerical Modeling of Reinforced Concrete Beams Repaired with Polymer
Modified Mortar
Supervisor(s): Dr. Francesca da Porto
Eng. Giovanni Guidi (co-supervisor)
Year: 2009
I hereby declare that all information in this document has been obtained and presented in accordance
with academic rules and ethical conduct. I also declare that, as required by these rules and conduct, I
have fully cited and referenced all material and results that are not original to this work.
I hereby declare that the MSc Consortium responsible for the Advanced Masters in Structural Analysis
of Monuments and Historical Constructions is allowed to store and make available electronically the
present MSc Dissertation.
University: University of Padova, Italy
Date: July 23, 2009
Signature:
________________________

ii
This Thesis is dedicated
to my beloved parents, brothers, sisters, wife, daughter
and to those who do good deeds
for the sake of ALLAH
iii
ACKNOWLEDGEMENTS
In the name of ALLAH, the most Gracious, the Dispenser of Grace, Salam to our prophet Muhammad
SAW, His companion and friends as well as to all the people who follow his path. All praise, thanks,
and gratitude first and last be to Almighty ALLAH for His limitless helping and guidance, who provided
the human being the basic tools for education and learning. Without these tools which are hearing,
sight, intelligence and affections no one can achieve any knowledge (It is He Who brought you forth
from the wombs of your mothers when ye knew nothing; and He gave you hearing and sight and
intelligence and affections: that ye may give thanks (to Allah), An-Nahl:78).
Acknowledgment is due to European Commissions for supported this study through Erasmus Mundus
scholarships in Advanced Masters in Structural Analysis on Monuments and Historical Constructions
(SAMHC).
I would like to express my highest appreciation to my supervisor Dr. Francesca da Porto and co-
supervisor Eng. Giovanni Guidi, for their advice and guidance during the thesis. Their precious
assistance, a constant source of help, encouragement and the constructive criticisms offered have
resulted in the completion of this thesis. Also I greatly appreciate and thank the invaluable
cooperation, frequent attention and encouragement provided by Prof. Claudio Modena and Assoc Prof
Carlo Pellegrino, PhD who served as Master SAMHC Local Coordinator. I am obliged and grateful to
Enrico Garbin, PhD and Eng. Elena Stievanin who helped me throughout this thesis with open heart
and sincere feelings without any time and potential limitations.
Last but not least, I would like to express special gratitude to my family, Nunuk mas’ulah and Hilwa
Taffanina for their persistent support and pray during my study at Padova even though from far away.
Unforgettable I would like to express my thanks and appreciation to all my friends and colleagues.
Your helps and supports are really appreciated and will be remembered forever.
iv
ABSTRACT
This study presents the numerical evaluation of reinforced concrete beam which is repaired with
polymer modified mortars. In this study, a series of reinforced concrete beams model were built for the
analysis. All those beams model were made with rectangular cross section and equipped with
longitudinal reinforcement both in tension and compression region and also transversal reinforcement
(stirrups) in shear span extended to the entire length of the beam with uniform spacing. The repaired
beams are modeled by Finite Element Method (FEM) into half geometry due to the symmetric
geometry and loading conditions. The repaired beams were modeled by 2D elements in plane-stress
condition including the interface model between the parent concrete and the repaired layer. Finite
Element Method used to model simple support of the repaired beams with two loading points.
Furthermore, parametric study is carried out to evaluate the effectiveness and the behavior of repaired
beam with different concrete properties, repairing mortar properties and also with different thickness of
mortars as well. Finally, to evaluate fatigue behavior of the repaired beams, numerical modeling is
carried out to assess the behavior of the repaired beams when subjected to cyclic loading with
applying number of cycles of loading. The numerical results showed that thick repairs which the
longitudinal reinforcement included were found to be the most effective method for repairing when
subjected both to static and fatigue loading. The result from this numerical modeling would become
valuable reference for the experimental test which will be carried out in the future.
v
ESTRATTO
(MODELLAZIONE NUMERICA DI TRAVI IN CEMENTO ARMATO RIPRISTINATE CON MALTA
POLIMERO RINFORZATA)
Questa tesi presenta la valutazione numerica di travi in cemento armato ripristinate con malte
polimero-modificate. In questo studio, le travi in cemento armato sono state modellate con un software
per l’esecuzione di analisi non lineari. Le travi hanno sezione rettangolare e sono armate con barre
longitudinali, sia superiormente che inferiormente, e con staffe aventi passo costante. I provini sono
stati modellati ad elementi finiti (FEM) sono per metà grazie alla condizione di simmetria geometrica e
di carico. Le travi ripristinate sono state modellate con elementi bi-dimensionali in condizioni di sforzo
piane compresa la modellazione dell’interfaccia tra il substrato in calcestruzzo e lo strato di ripristino. Il
metodo ad elementi finiti è stato utilizzato per modellare gli appoggi semplici delle travi ripristinate con
due punti di carico. Inoltre, uno studio parametrico è stato condotto per valutare l’efficacia e il
comportamento delle travi prodotte con calcestruzzo dotato di differenti caratteristiche e ripristinate
con malte aventi differenti proprietà e differenti spessori. Infine, per valutare il comportamento a fatica
delle travi ripristinate, è stata effettuata una modellazione numerica per stimare il comportamento delle
travi ripristinate quando sono soggette a carichi ciclici. I risultati numerici mostrano che il ripristino
migliore per carichi statici e ciclici di fatica si realizza quando le malte avvolgono interamente le barre
d’armatura. Il risultato di questa modellazione numerica rappresenta un valido punto di partenza per
sperimentazioni future.
vi
ABSTRAK
(Model Numerik dari Balok Beton Bertulang yang Direparasi Dengan Menggunakan Mortar dari
Bahan Polimer Hasil Modifikasi)
Kajian ini mengetengahkan evaluasi secara numerik dari balok beton bertulang yang direparasi
dengan menggunakan mortar dari bahan polimer hasil modifikasi. Dalam kajian ini, sejumlah model
dari balok beton bertulang dibuat untuk dianalisis. Semua model dari balok beton dibuat dengan
penampang empat persegi panjang lengkap dengan tulangan utama di daerah tarik dan tekan dan
juga tulangan geser (sengkang) yang disebar secara merata sepanjang balok. Balok beton ini hanya
dimodelkan setengah bentang dalam Metoda Elemen Hingga (FEM) karena geometri dan kondisi
pembebanannya yang simetris. Balok beton dimodelkan dengan jenis elemen plane-stress 2D
termasuk model untuk interface diantara lapisan beton lama dengan lapisan reparasi mortar. Metoda
Elemen Hingga digunakan untuk membuat model perletakan balok reparasi dengan empat titik
pembebanan. Setelah itu, kajian parametrik dilakukan untuk mengevaluasi tingkat efektifitas dan
perilaku dari balok beton reparasi dengan menggunakan properti material dari beton dan mortar yg
berbeda dengan ketebalan reparasi dari lapisan mortar yang juga berbeda. Akhirnya, untuk
mengevaluasi perilaku fatik dari balok beton reparasi, model numerik dari balok beton reparasi
dianalisa menggunakan beban siklik dengan sejumlah siklus pembebanan. Hasil analisa numerik
menunjukkan bahwa ketebalan reparasi dengan mengikutsertakan tulangan utama adalah metoda
yang paling efektif dalam proses reparasi beton bertulang baik dalam kondisi pembebanan statis atau
pun pembebanan fatik. Hasil dari analisa model secara numerik ini akan menjadi referensi yang cukup
berharga untuk kajian secara eksperimen yang akan dilaksanakan pada masa yang akan datang.
vii
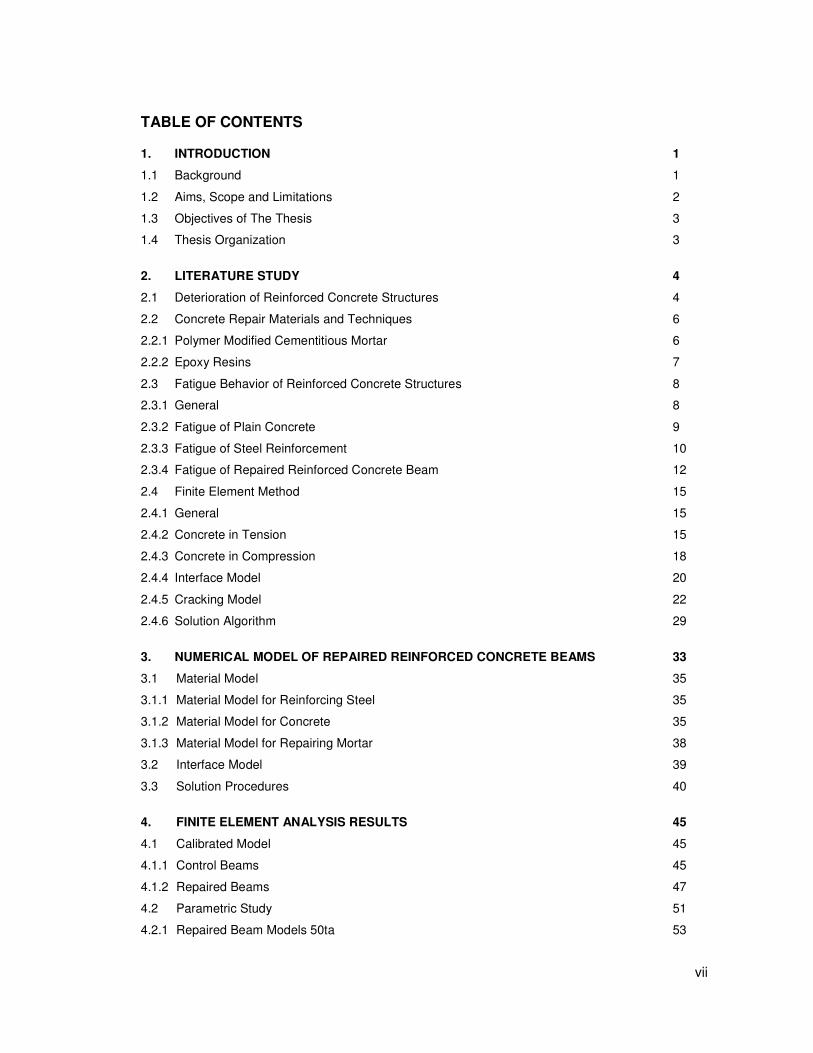
TABLE OF CONTENTS
1. INTRODUCTION 1
1.1 Background 1
1.2 Aims, Scope and Limitations 2
1.3 Objectives of The Thesis 3
1.4 Thesis Organization 3
2. LITERATURE STUDY 4
2.1 Deterioration of Reinforced Concrete Structures 4
2.2 Concrete Repair Materials and Techniques 6
2.2.1 Polymer Modified Cementitious Mortar 6
2.2.2 Epoxy Resins 7
2.3 Fatigue Behavior of Reinforced Concrete Structures 8
2.3.1 General 8
2.3.2 Fatigue of Plain Concrete 9
2.3.3 Fatigue of Steel Reinforcement 10
2.3.4 Fatigue of Repaired Reinforced Concrete Beam 12
2.4 Finite Element Method 15
2.4.1 General 15
2.4.2 Concrete in Tension 15
2.4.3 Concrete in Compression 18
2.4.4 Interface Model 20
2.4.5 Cracking Model 22
2.4.6 Solution Algorithm 29
3. NUMERICAL MODEL OF REPAIRED REINFORCED CONCRETE BEAMS 33
3.1 Material Model 35
3.1.1 Material Model for Reinforcing Steel 35
3.1.2 Material Model for Concrete 35
3.1.3 Material Model for Repairing Mortar 38
3.2 Interface Model 39
3.3 Solution Procedures 40
4. FINITE ELEMENT ANALYSIS RESULTS 45
4.1 Calibrated Model 45
4.1.1 Control Beams 45
4.1.2 Repaired Beams 47
4.2 Parametric Study 51
4.2.1 Repaired Beam Models 50ta 53
viii
4.2.2 Repaired Beam Models 20ta 54
4.2.3 Repaired Beam Models 50tb 55
4.2.4 Comparison of Repaired Beams Model 56
4.3 Cyclic Loading 71
4.3.1 Fatigue Life of Repaired Beam 50ta_8 72
4.3.2 Fatigue Life of Repaired Beam 20ta_8 76
4.4 Comparison of Fatigue Life of Repaired Beams 79
5. DISCUSSIONS AND CONCLUSIONS 89
5.1 Sensitivity of Analysis 89
5.2 Effect of Loading Steps on Results 90
REFERENCES 93
ix
LIST of FIGURES
1. Settlement Cracks Restrained by Formwork 1
2. Settlement Cracks Restrained by Reinforcing 1
3. Corrosion of Reinforcement of RC Structures 5
4. Modified Goodman Chart 9
5. Stress-Strain Relationships of Concrete Under Repeated Loads 10
6. Experimental Programme for Repaired RC Beams under Cyclic Loading 13
7. Central Deflection of Beams vs Number of Cycles 14
8. Schematic Representation of Final Cracks in the Beams 14
9. Eight nodes isoparametric elements for plane stress analysis 15
10. a) JSCE Tensile Model (b) JSCE Fracture Model 16
11. Hordijk Tensile Model (Left) Hordijk Fracture Model (Right) 17
12. JSCE Compressive Model for Concrete 18
13. Feenstra Compressive Model for Concrete 19
14. Two Dimensional Structural Interfaces in 2D Model 20
15. CL12I-Line Interface element in 2D Model 21
16. CL12I-Interface Model Example 22
17. An example of Automatic Generation of Discrete Cracks 23
18. Crack axes of the concrete and plane stress condition in concrete element 24
19. Relationships between traditional and secant crack parameters 27
20. Newton-Raphson, Secant, and Constant Stiffness Method 30
21. Load Control Method 31
22. Displacement Control Method 32
23. Arch-Length Method 32
24. Dimensions and Reinforcement Arrangement for Control Beams 33
25. Dimensions, Reinforcement and Repair Arrangement for Repaired Beams 34
26. Stress and Strain Relationships for Reinforcing Steel 35
27. Eight Node Quadrilateral Isoparametric Element CQ16M 36
x
28. Stress and Strain Relationships for Concrete 37
29. Eight Node Quadrilateral CQ16M for Repairing Mortar Model 38
30. CL12I-Interface Model Example 39
31. Coulomb Friction Criterion 40
32. Reinforcement Arrangement for Modeling 41
33. Numerical Model and FE Meshing for Control Beam (half geometry model) 41
34. Numerical Model for Repaired Beam 50t_a (half geometry model) 42
35. Mesh Discretization Model for Repaired Beam 50t_a (Shrink Mesh) 42
36. Interface and Reinforced Model for Repaired Beam 50t_a (Shrink Mesh) 43
37. Numerical Model for Repaired Beam 20t_a (half geometry model) 43
38. Mesh Discretization Model for Repaired Beam 20t_a (Shrink Mesh) 44
39. Interface and Reinforced Model for Repaired Beam 20t_a (Shrink Mesh) 44
40. Load and Displacement Relationship for Control Beam_a 45
41. Load and Displacement Relationship for Control Beam_b 46
42. Load and Displacement Relationship for Repaired Beam 50t_a 47
43. Load and Displacement Relationship for Repaired Beam 50t_b 48
44. Load and Displacement Relationship for Repaired Beam 20t_a 49
45. Load and Displacement Relationship for All Control Beams and Repaired Beams 50
46. Repaired Beams Speciments for Parametric study 51
47. The Ultimate Load of Repaired Beam Model 50ta 53
48. The Ultimate Load of Repaired Beam Model 20ta 54
49. The Ultimate Load of Repaired Beam Model 50tb 55
50. The Comparison of Ultimate Load between The Repaired Beam Model 50ta and 20ta 58
51. The Comparison of First Cracking Load and Displacement of Repaired Beam 8 Mpa 59
52. The Comparison of First Cracking Load and Displacement of Repaired Beam 12 Mpa 60
53. The Comparison of First Cracking Load and Displacement of Repaired Beam 16 Mpa 61
54. The Comparison of First Cracking Load and Displacement of Repaired Beam 20 Mpa 62
55. The Comparison of First Cracking Load and Displacement of Repaired Beam 25 Mpa 63
56. The Comparison of Ductility Index between Repaired Beams 50ta and 20ta 64
xi
57. The Failure Mode and Crack Patterns of Repaired Beams Model 50ta 68
58. The Failure Mode and Crack Patterns of Repaired Beams Model 50tb 69
59. The Failure Mode and Crack Patterns of Repaired Beams Model 20ta 70
60. The Cyclic Loading Model Which Used in Numerical Analysis 72
61. The Evolution of Midspan Deflection of 50ta_8 during 0.5 Fatigue Analyses 72
62. The Evolution of Midspan Deflection of 50ta_8 during 0.75 Fatigue Analyses 73
63. The Evolution of Midspan Deflection of 50ta_8 during 0.95 Fatigue Analyses 73
64. The Evolution of Midspan Deflection of 50ta_8 (Normalized) 74
65. The Evolution of Midspan Deflection at Different Fatigue Stress Level (Normalized) 74
66. The Evolution of Midspan Deflection of 20ta_8 during 0.5 Fatigue Analyses 76
67. The Evolution of Midspan Deflection of 20ta_8 during 0.75 Fatigue Analyses 76
68. The Evolution of Midspan Deflection of 20ta_8 during 0.95 Fatigue Analyses 77
69. The Evolution of Midspan Deflection of 20ta_8 (Normalized) 77
70. The Evolution of Midspan Deflection at Different Fatigue Stress Level (Normalized) 78
71. The Comparison of Fatigue Life at 0.5 Stress Level 8_8 (Normalized) 79
72. The Comparison of Fatigue Life at 0.75 Stress Level 8_8 (Normalized) 79
73. The Comparison of Fatigue Life at 0.95 Stress Level 8_8 (Normalized) 80
74. The Comparison of Fatigue Life at 0.5 Stress Level 8_12 (Normalized) 81
75. The Comparison of Fatigue Life at 0.75 Stress Level 8_12 (Normalized) 81
76. The Comparison of Fatigue Life at 0.95 Stress Level 8_12 (Normalized) 82
77. The Comparison of Fatigue Life at 0.5 Stress Level 8_16 (Normalized) 83
78. The Comparison of Fatigue Life at 0.75 Stress Level 8_16 (Normalized) 83
79. The Comparison of Fatigue Life at 0.95 Stress Level 8_16 (Normalized) 84
80. The Comparison of Fatigue Life at 0.5 Stress Level 8_20 (Normalized) 85
81. The Comparison of Fatigue Life at 0.75 Stress Level 8_20 (Normalized) 85
82. The Comparison of Fatigue Life at 0.95 Stress Level 8_20 (Normalized) 86
83. The Comparison of Fatigue Life at 0.5 Stress Level 8_25 (Normalized) 87
84. The Comparison of Fatigue Life at 0.75 Stress Level 8_25 (Normalized) 87
85. The Comparison of Fatigue Life at 0.95 Stress Level 8_25 (Normalized) 88
xii
LIST of TABLES
1. Mechanical Properties of Concrete and Repair Mortar 38
2. The constitutive models for nonlinear interface behavior from the various sections 39
3. The Properties of Concrete and Repairing Mortar (EC2-EN-1992-2003) 52
4. The Ductility Index of Repaired Beams 50ta 65
5. The Ductility Index of Repaired Beams 20ta 66
Numerical Modeling of Reinforced Concrete Beams Repaired with Polymer Modified Mortar
Erasmus Mundus Programme
ADVANCED MASTERS IN STRUCTURAL ANALYSIS OF MONUMENTS AND HISTORICAL CONSTRUCTIONS 1
1. INTRODUCTION 1.1 Background
Reinforced concrete is the most frequent of materials used for the construction application. In the 20th
century, it has established itself as one of the major building materials. Reinforced concrete structures
including buildings, bridges, power plants, dams, etc represent a large part of the modern civil
infrastructures.
For many decades concrete structures were regarded as almost eternal because of its durability, and
it was a maintenance-free materials. Therefore a maintenance or repair activity is not necessary to be
applied unless it has exposed in the severe conditions.
This commonly held view has changed significantly in the last decade. Several examples can be
shown where concrete structures did not perform as well as it was estimated. There are huge
numbers of concrete structures which are deteriorate or become unsafe due to inadequacy of
construction detailing, lack of maintenance, chemical attack, overloading, settlement of foundation,
corrosion of steel rebar, abrasion, fatigue loading effect, change in use, natural disaster (earthquake,
floods, volcano), etc. All those experiences could affect the durability of the concrete structures, and
need to pay attention to carry out some maintenance strategies such as rehabilitation and repairing of
deteriorated concrete structures.
Rehabilitation and repair of deteriorated concrete structures are very interesting tasks. Possibly one of
the most challenging tasks in the rehabilitation processes is to upgrade overall load bearing capacity
of deteriorated concrete structures. This process is not only to extend the remaining service life of the
existing structures but also to assure the safety and serviceability of particular components or
elements are satisfied with the requirements. In addition, the repairing methods should become
preferable both from environmentally and economically point of view rather than replacement all of the
elements of the concrete structures such as beam, column or wall.
One of the most interesting and challenging tasks in the field of rehabilitation of concrete elements is
to evaluate the repairing of reinforced concrete beam which is subjected to repeated loading or cyclic
loading condition. This type of loading condition could affect the fatigue behavior of reinforced
concrete beam. This assessment is required for the structures such as bridges, parking decks and
offshore structures. In order to obtain optimal long-term maintenance strategies, it is essential to
evaluate the fatigue life of the existing reinforced concrete structures.
Structures with high levels of deterioration are often repaired by removing loose concrete, providing
additional reinforcement and laying a fresh layer of concrete. This repair strategy leads to the
formation of an interface between the old concrete and the repaired layer.
Numerical Modeling of Reinforced Concrete Beams Repaired with Polymer Modified Mortar
Erasmus Mundus Programme
ADVANCED MASTERS IN STRUCTURAL ANALYSIS OF MONUMENTS AND HISTORICAL CONSTRUCTIONS 2
This interface behavior will determine the performance of the structures as a whole. The response of
interface when it is subjected to the repeated loading will be different than subjected to the monolithic
loading. The cyclic loading will cause the interface to disintegrate and affect the performance of
repaired beam. There are two factors which influenced the characteristics of the interface, selecting
the repair materials in terms of mechanical properties and to ensure a proper bond between the old
concrete and the repair materials.
1.2 Aims, Scope and Limitations
The principal aim of this thesis is to evaluate numerically the structural behavior of reinforced concrete
beam which is repaired with polymer modified mortars. In this study, a series of reinforced concrete
beams were manufactured for the test. All those beams were made with rectangular cross section and
equipped with longitudinal reinforcement both in tension and compression region and also transversal
reinforcement (stirrups) in shear span extended to the entire length of the beam with uniform spacing.
Those beams were made such that some parts of the beams were under artificial delamination and
spalling of the concrete in the tension zone to make the experimental conditions is similar to the actual
field conditions. The material used for repairing all the beams was premixed, tixotropic. This is
polymer-modified mortars with high-strength hydraulic binders and with maximum aggregate thickness
is 4 mm.
Regarding to its scope, numerical modeling and analysis applied to evaluate the behavior of the
repaired beams. The specimens are partly modeled by Finite Element Method (FEM) due to the
symmetric geometry and loading conditions. The repaired beams were modeled by 2D elements in
plane-stress condition including the interface model between the old concrete and the repaired layer.
Therefore Finite Element Method (FEM) used to model simple support of the repaired beams with four
loading points. The program was called DIANA 9.3 had been used.
This thesis has been limited to evaluate numerically the behavior of reinforced concrete beams
repaired with polymer-modified mortars within two loading conditions. First, the flexural behavior of the
repaired beams subjected to monolithic or static loading. Second, the fatigue behavior of the repaired
beams subjected to repeated or cyclic loading. For the first criteria, the numerical analysis result will
be compared with the experimental result which has already done. For the latter, the result from finite
element analysis would become the valuable reference and guidance for the experimental test which
will be carried out in the future.
Numerical Modeling of Reinforced Concrete Beams Repaired with Polymer Modified Mortar
Erasmus Mundus Programme
ADVANCED MASTERS IN STRUCTURAL ANALYSIS OF MONUMENTS AND HISTORICAL CONSTRUCTIONS 3
1.3 Objectives of The Thesis
The objective of this thesis is to build a numerical model with Finite Element Method (FEM) of the
repaired concrete beams in order to evaluate the structural behavior under different condition of
loadings. Flexural and fatigue behavior of the repaired beams would be examined when subjected to
static and cyclic loading respectively.
This numerical modeling would be analyzed based on the nonlinearity of the materials and loading
condition that input to the model. This analysis result will identify some parameters:
‐ Deflection behavior
‐ Stress and strain relationships
‐ Crack development
‐ Flexural performance (which respect to static loading), and
‐ Fatigue strength (which respect to cyclic loading)
1.4 Thesis Organization
This thesis consists of six chapters including an introductory part. The introductory part gives
comprehensive background to the subject explained in this study. A brief overview has been
presented in this chapter in relation to the deterioration of reinforced concrete structures. A discussion
has been made on how importance to evaluate the fatigue behavior of the repaired beams under
repeated loading besides its flexural performance.
Chapter 2 provides study of the literature based on the bibliographical researches. Deterioration of the
reinforced concrete structures is reviewed. Repairing materials and its maintenance strategy are
given, and the numerical modeling approach of the repaired beams is discussed.
Chapter 3 explains the numerical modeling strategy in Finite Element Method (FEM) with respect to
material properties, interface modeling and loading condition. Crack modeling, solution algorithm in
terms of iteration and incremental procedures are also presented.
Chapter 4 deals with the analysis of Finite Element Method (FEM) both for flexural and fatigue
behavior of the repaired beams under static and repeated loading respectively. In order to get
calibration model for parametric study, a comparison is made between an experimental result and the
analysis of numerical modeling approach (in case of flexural behavior of the repaired beams). The
output results such as deflection behavior, stress-strain relationships and crack propagation are also
presented and discussed.
Chapter 5 provides the major conclusion of the analysis. The sensitivity of the modeling and effect of
the loading steps are also discussed together with suggestion for the future researches.
Numerical Modeling of Reinforced Concrete Beams Repaired with Polymer Modified Mortar
Erasmus Mundus Programme
ADVANCED MASTERS IN STRUCTURAL ANALYSIS OF MONUMENTS AND HISTORICAL CONSTRUCTIONS 4
2. LITERATURE STUDY 2.1 Deterioration of Reinforced Concrete Structures
Deterioration of reinforced concrete structures is a serious problem in many countries. Reinforced
concrete is very high durable material if it is manufactured properly as well as a maintenance-free
constructional material. Nowadays, this concept has been changed. Many investigations have proved
that concrete structures do not perform as well as it was expected due to many factors. The use of
unsuitable specifications and designs, the poor construction practices caused by using unskilled labor,
use of unsuitable materials and equipments are the other factors which contributed to the deterioration
process.
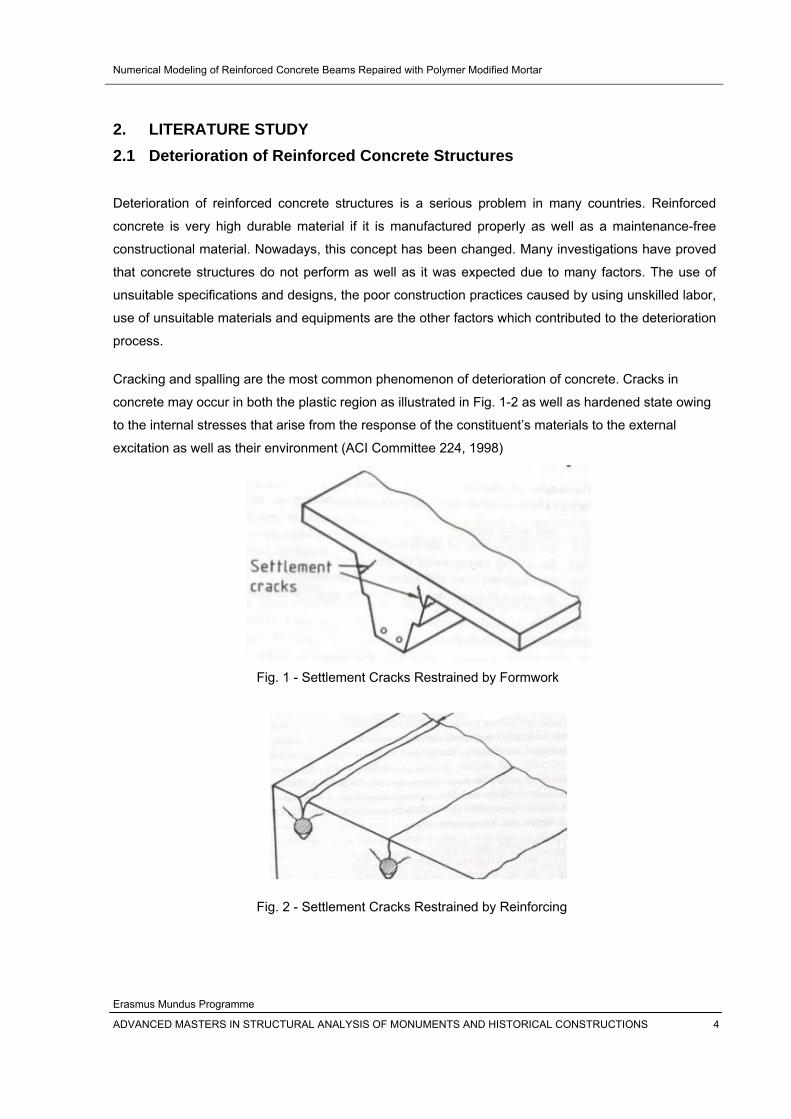
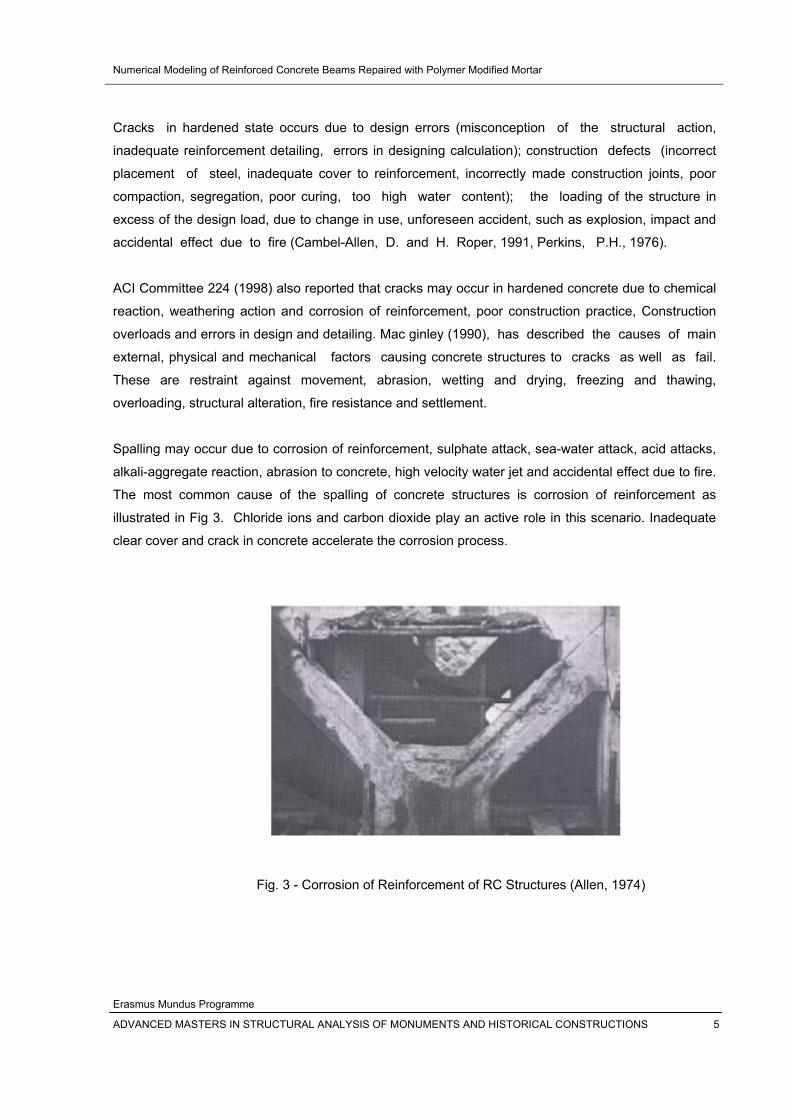
Cracking and spalling are the most common phenomenon of deterioration of concrete. Cracks in
concrete may occur in both the plastic region as illustrated in Fig. 1-2 as well as hardened state owing
to the internal stresses that arise from the response of the constituent’s materials to the external
excitation as well as their environment (ACI Committee 224, 1998)
Fig. 1 - Settlement Cracks Restrained by Formwork
Fig. 2 - Settlement Cracks Restrained by Reinforcing
Numerical Modeling of Reinforced Concrete Beams Repaired with Polymer Modified Mortar
Erasmus Mundus Programme
ADVANCED MASTERS IN STRUCTURAL ANALYSIS OF MONUMENTS AND HISTORICAL CONSTRUCTIONS 5
Cracks in hardened state occurs due to design errors (misconception of the structural action,
inadequate reinforcement detailing, errors in designing calculation); construction defects (incorrect
placement of steel, inadequate cover to reinforcement, incorrectly made construction joints, poor
compaction, segregation, poor curing, too high water content); the loading of the structure in
excess of the design load, due to change in use, unforeseen accident, such as explosion, impact and
accidental effect due to fire (Cambel-Allen, D. and H. Roper, 1991, Perkins, P.H., 1976).
ACI Committee 224 (1998) also reported that cracks may occur in hardened concrete due to chemical
reaction, weathering action and corrosion of reinforcement, poor construction practice, Construction
overloads and errors in design and detailing. Mac ginley (1990), has described the causes of main
external, physical and mechanical factors causing concrete structures to cracks as well as fail.
These are restraint against movement, abrasion, wetting and drying, freezing and thawing,
overloading, structural alteration, fire resistance and settlement.
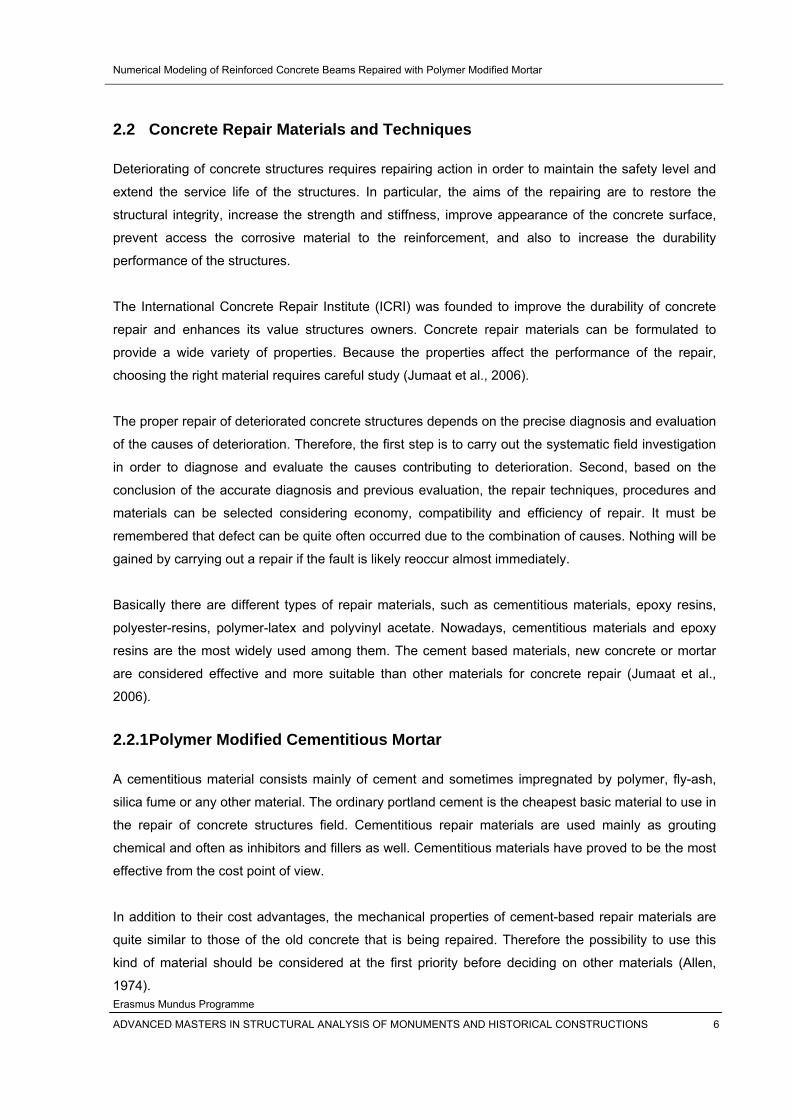
Spalling may occur due to corrosion of reinforcement, sulphate attack, sea-water attack, acid attacks,
alkali-aggregate reaction, abrasion to concrete, high velocity water jet and accidental effect due to fire.
The most common cause of the spalling of concrete structures is corrosion of reinforcement as
illustrated in Fig 3. Chloride ions and carbon dioxide play an active role in this scenario. Inadequate
clear cover and crack in concrete accelerate the corrosion process.
Fig. 3 - Corrosion of Reinforcement of RC Structures (Allen, 1974)
Numerical Modeling of Reinforced Concrete Beams Repaired with Polymer Modified Mortar
Erasmus Mundus Programme
ADVANCED MASTERS IN STRUCTURAL ANALYSIS OF MONUMENTS AND HISTORICAL CONSTRUCTIONS 6
2.2 Concrete Repair Materials and Techniques
Deteriorating of concrete structures requires repairing action in order to maintain the safety level and
extend the service life of the structures. In particular, the aims of the repairing are to restore the
structural integrity, increase the strength and stiffness, improve appearance of the concrete surface,
prevent access the corrosive material to the reinforcement, and also to increase the durability
performance of the structures.
The International Concrete Repair Institute (ICRI) was founded to improve the durability of concrete
repair and enhances its value structures owners. Concrete repair materials can be formulated to
provide a wide variety of properties. Because the properties affect the performance of the repair,
choosing the right material requires careful study (Jumaat et al., 2006).
The proper repair of deteriorated concrete structures depends on the precise diagnosis and evaluation
of the causes of deterioration. Therefore, the first step is to carry out the systematic field investigation
in order to diagnose and evaluate the causes contributing to deterioration. Second, based on the
conclusion of the accurate diagnosis and previous evaluation, the repair techniques, procedures and
materials can be selected considering economy, compatibility and efficiency of repair. It must be
remembered that defect can be quite often occurred due to the combination of causes. Nothing will be
gained by carrying out a repair if the fault is likely reoccur almost immediately.
Basically there are different types of repair materials, such as cementitious materials, epoxy resins,
polyester-resins, polymer-latex and polyvinyl acetate. Nowadays, cementitious materials and epoxy
resins are the most widely used among them. The cement based materials, new concrete or mortar
are considered effective and more suitable than other materials for concrete repair (Jumaat et al.,
2006).
2.2.1 Polymer Modified Cementitious Mortar
A cementitious material consists mainly of cement and sometimes impregnated by polymer, fly-ash,
silica fume or any other material. The ordinary portland cement is the cheapest basic material to use in
the repair of concrete structures field. Cementitious repair materials are used mainly as grouting
chemical and often as inhibitors and fillers as well. Cementitious materials have proved to be the most
effective from the cost point of view.
In addition to their cost advantages, the mechanical properties of cement-based repair materials are
quite similar to those of the old concrete that is being repaired. Therefore the possibility to use this
kind of material should be considered at the first priority before deciding on other materials (Allen,
1974).
Numerical Modeling of Reinforced Concrete Beams Repaired with Polymer Modified Mortar
Erasmus Mundus Programme
ADVANCED MASTERS IN STRUCTURAL ANALYSIS OF MONUMENTS AND HISTORICAL CONSTRUCTIONS 7
In 1950, it has been know that certain polymers could be the best alternative to overcome some
problems as concrete repair materials when it is added to cementitious mortar. More than twenty
years ago, the application of many different types of polymers have been widely used in the range of
repairing and maintenance of buildings and also the other structures. These polymer mortars provide
passive protection from alkaline to steel reinforcement as well as conventional cementitious materials,
and it can also readily be placed to give adequate cover protection in the application 40 – 50 mm of
thickness.
The polymers are usually used as admixtures as milky white dispersions in water and used to estimate
the cementitious mortar as a whole or as replacement partially regarding the mixing water. In the other
words, the polymers act as water reducing plasticizers which produce the good workability mortar with
low shrinkage at the lower ratio of water cement. It reduces the permeability of repair mortar to water,
carbon dioxide, and oils and also increases its resistance to some chemicals. It is not only improves
the bond between the old concrete and the repair layer, but also increases the tensile and flexural
strength of the mortar (Nielson, 1985).
There are different types of polymers which are usually used as a modifier for cementitious mortars.
Most of them are manufactured specifically as admixtures such as polyvinyl acetates (PVAC), Styrene
Butadiene (SBR), Polyvilidene dichloride (PVDC), acrylics and modified acrylics. Styrene Butadiene
(SBR), acrylics and modified acrylics latex are the most widely used in the field of concrete repair
mortars. When they are properly formulated with cement compatibility, they will not appear to be
different significantly in the long term behavior of the repair mortars. A recent development in the field
of polymer is a redispersible spray-dried polymer powders which could be factory blended with graded
sand, cement and the other additives to produce mortars and bonding coats simply by the addition of
water on site (Nielson, 1985).
2.2.2 Epoxy Resins
Cementitious materials should be considered at the first priority before deciding on any other
materials, but sometimes it is very difficult and often impossible to retain sufficient moisture in shallow
concrete repair to make sure the cement matrix is fully cured. Another case is for injecting crack, it is
very difficult and sometimes impossible to use cementitious repair materials. In such situations epoxy-
resins is very convenient to be used.
Epoxy-resin compounds are commonly used in the industrial concrete as a repair material, for
example: crack injection, coating, bonding agents, sealants, patching materials, general adhesives,
binders, water proofing and grouts.
Numerical Modeling of Reinforced Concrete Beams Repaired with Polymer Modified Mortar
Erasmus Mundus Programme
ADVANCED MASTERS IN STRUCTURAL ANALYSIS OF MONUMENTS AND HISTORICAL CONSTRUCTIONS 8
Several investigations have been carried out on the applications of the epoxy compounds with
concrete. For example, ACI Committee 503 published a report entitled “Use of Epoxy Compounds with
Concrete”. Chung (1975) used epoxy for repairing reinforced concrete beams. The results showed
that the repair process restored the structural integrity. The flexural strength of the repaired beams
was not less than the original beams, the repaired cracks do not reopen even at failure of the beam
and the repaired beams are stiffer than the original ones.
The investigation by Chung and Lui (1977) showed that the shear stress and deformation in the
repaired beams were not less than the original concrete. The further studies carried out by Chung
(1981) showed that the bond strength and bond stress of the repaired beams were similar to those in
the original concrete members. The investigation carried out by Mansur and Ong (1985) found that
cracks did not reopen at ultimate load in the epoxy repaired beams. The maximum crack widths in the
repaired beams were less than those in the original concrete, and the repaired beams were stronger
and stiffer than the original beams.
2.3 Fatigue Behavior of Reinforced Concrete Structures 2.3.1 General
Concrete elements such as bridges and marine structures are subjected to repeated loading during
their life. This type of loading may considerably reduce the capacity of the structure. Significant
deformations usually occur due to fatigue even if the loading peaks applied on the structure are less
than its ultimate capacity. This must be accounted for in the design of concrete members subjected to
fatigue.
The most common approach to relate the applied stress to the fatigue life of a material is the stress-
life (S-N) approach, in which the number of cycles to failure is plotted against the applied stress range.
Most S-N plots are based on testing a considerable number of samples made of the same material
under fatigue loading. The endurance limit of the material is defined as the stress range below which
no failure due to fatigue is likely to occur.
In order to assess the capability of the structure in resisting cyclic loading, the fatigue behavior of its
constituents should first be addressed. For externally post-tensioned beams, the effect of fatigue on
the concrete, steel, and external tendon materials should be considered and analyzed. The fatigue life
of the beam is usually governed by the shortest fatigue life of its component materials. If one
component fails to withstand the applied fatigue loading, the concrete element would fail.
Numerical Modeling of Reinforced Concrete Beams Repaired with Polymer Modified Mortar
Erasmus Mundus Programme
ADVANCED MASTERS IN STRUCTURAL ANALYSIS OF MONUMENTS AND HISTORICAL CONSTRUCTIONS 9
2.3.2 Fatigue of Plain Concrete
Concrete fails under fatigue loading at stress values well below its ultimate compressive capacity.
Many researchers have investigated the fatigue behavior of concrete under fatigue loading. ACI
Committee 215 (1997) provides a comprehensive review on the fatigue performance of plain concrete.
The committee defines the fatigue strength of concrete as a fraction of the static strength that it can
support repeatedly for a given number of cycles.
The stress range applied on concrete is the main factor affecting the fatigue strength of concrete.
Other factors such as the cement content, water cement ratio, stress gradient, and the rate of loading
also affect the fatigue concrete strength. A loading frequency between 1 to 15 Hz was reported to
have an insignificant effect on the strength provided that the maximum stress level is less than 75% of
the static strength (ACI 215, 1997).
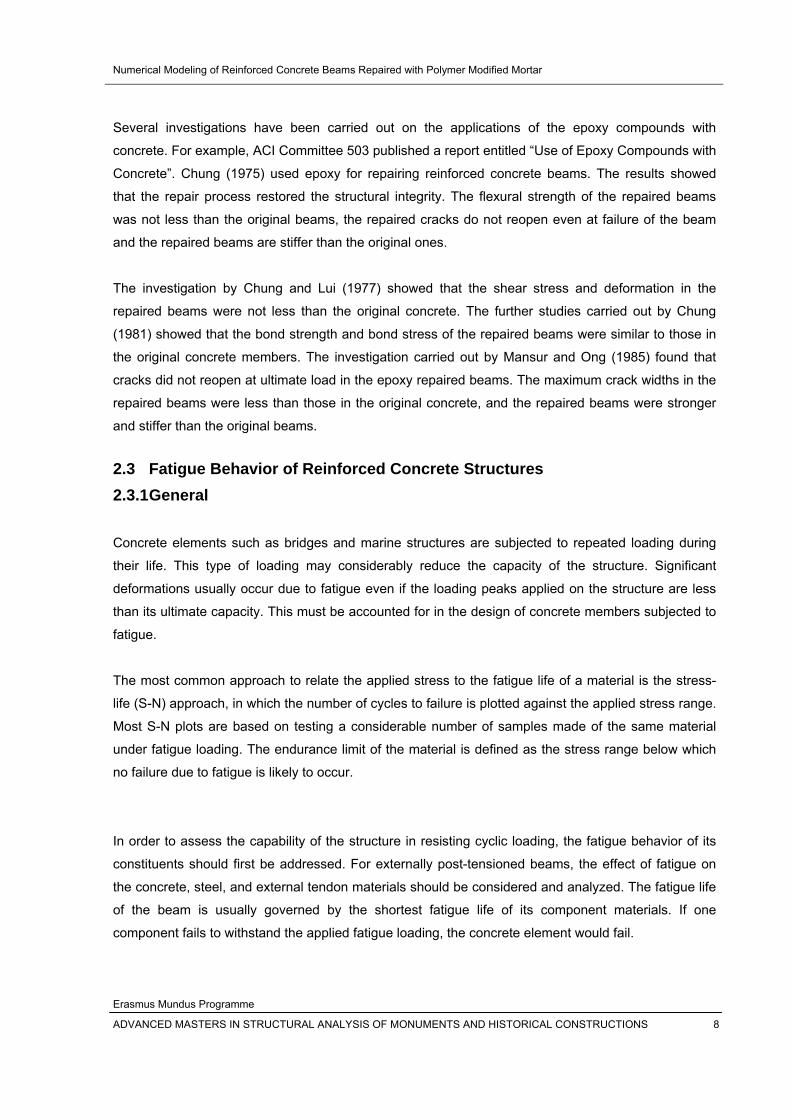
ACI 215 (1997) recommended the use of the modified Goodman chart shown in Figure 4 to estimate
the limiting stress range in concrete. The chart shows a relationship between the minimum and
maximum stresses applied to concrete for a fatigue life of one million cycles. Stresses are shown as
fraction of the static compressive strength of concrete. For a zero minimum stress, the concrete can
withstand one million cycles without failure, providing that a maximum stress of 50% of the concrete
static strength is not exceeded. For a given minimum stress, the chart can be used to get the
corresponding maximum stress for concrete to withstand one million cycles.
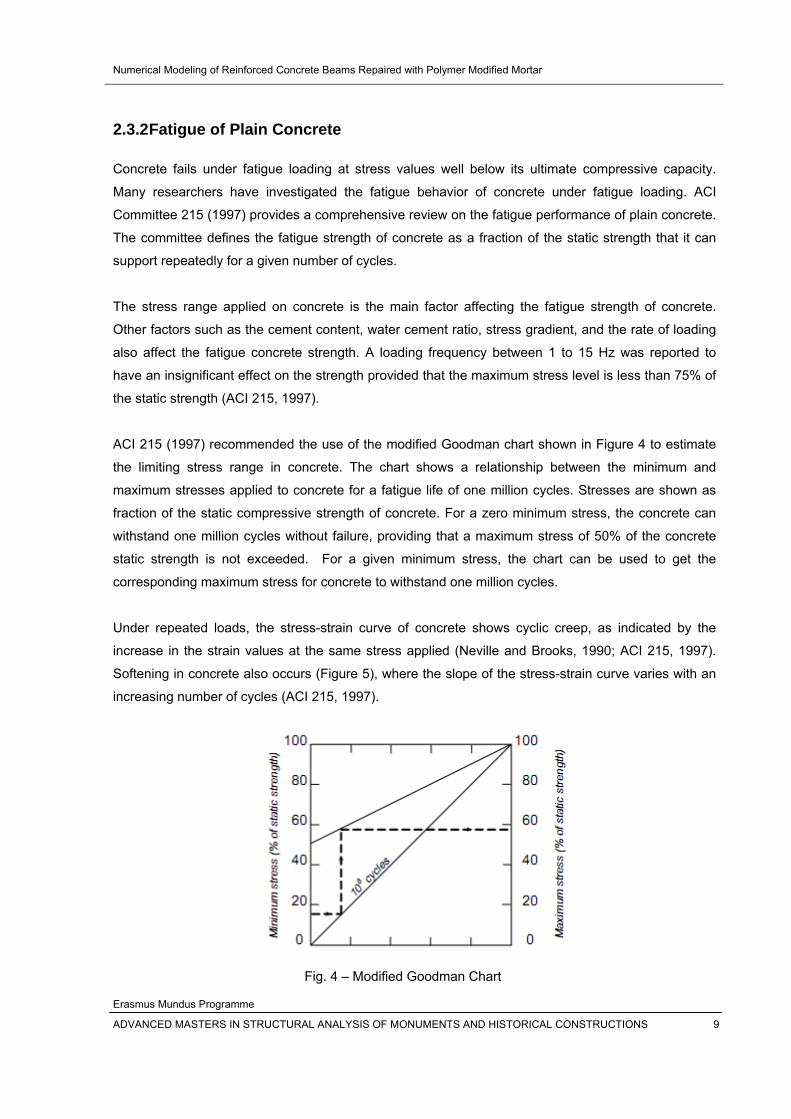
Under repeated loads, the stress-strain curve of concrete shows cyclic creep, as indicated by the
increase in the strain values at the same stress applied (Neville and Brooks, 1990; ACI 215, 1997).
Softening in concrete also occurs (Figure 5), where the slope of the stress-strain curve varies with an
increasing number of cycles (ACI 215, 1997).
Fig. 4 – Modified Goodman Chart
Numerical Modeling of Reinforced Concrete Beams Repaired with Polymer Modified Mortar
Erasmus Mundus Programme
ADVANCED MASTERS IN STRUCTURAL ANALYSIS OF MONUMENTS AND HISTORICAL CONSTRUCTIONS 10
Fig. 5 – Stress-Strain Relationships of Concrete Under Repeated Loads 2.3.3 Fatigue of Steel Reinforcement
The fatigue of reinforcing bars became a key component in design since the use of the ultimate
strength design procedures and the use of higher yield strength reinforcement (ACI 215, 1997).
Deformations on the bar in the form of ribs, manufacture markings, or any other form of raised
features, induce stress concentrations and thus decrease its fatigue life (Mac Gregor et al., 1971;
Bannantine et al., 1990; Dowling, 1998; among others). The width, height, angle of rise, and base
radius of the ribs affect the magnitude of the induced stress concentration (Tilly, 1979).
Decreasing the angle of inclination of the sides of the deformations with respect to the longitudinal axis
increases the fatigue strength of the deformed bars. In most deformed bars, ACI 215 (1997)
recommends the use of a stress concentration factor between 1.5 and 2.0 in fatigue analysis. As
reported by Tilly (1979), the increase in the stress range considerably decreases the fatigue strength
of the bar. For the same stress range, the increase in the tensile mean stress also decreases the
fatigue life of the bar. ACI Committee 215 (1997) provides a comprehensive review on the fatigue
performance of steel bars including the effect of other parameters on its fatigue life, such as the
minimum stress applied, the bar size, and its yield strength.
Numerical Modeling of Reinforced Concrete Beams Repaired with Polymer Modified Mortar
Erasmus Mundus Programme
ADVANCED MASTERS IN STRUCTURAL ANALYSIS OF MONUMENTS AND HISTORICAL CONSTRUCTIONS 11
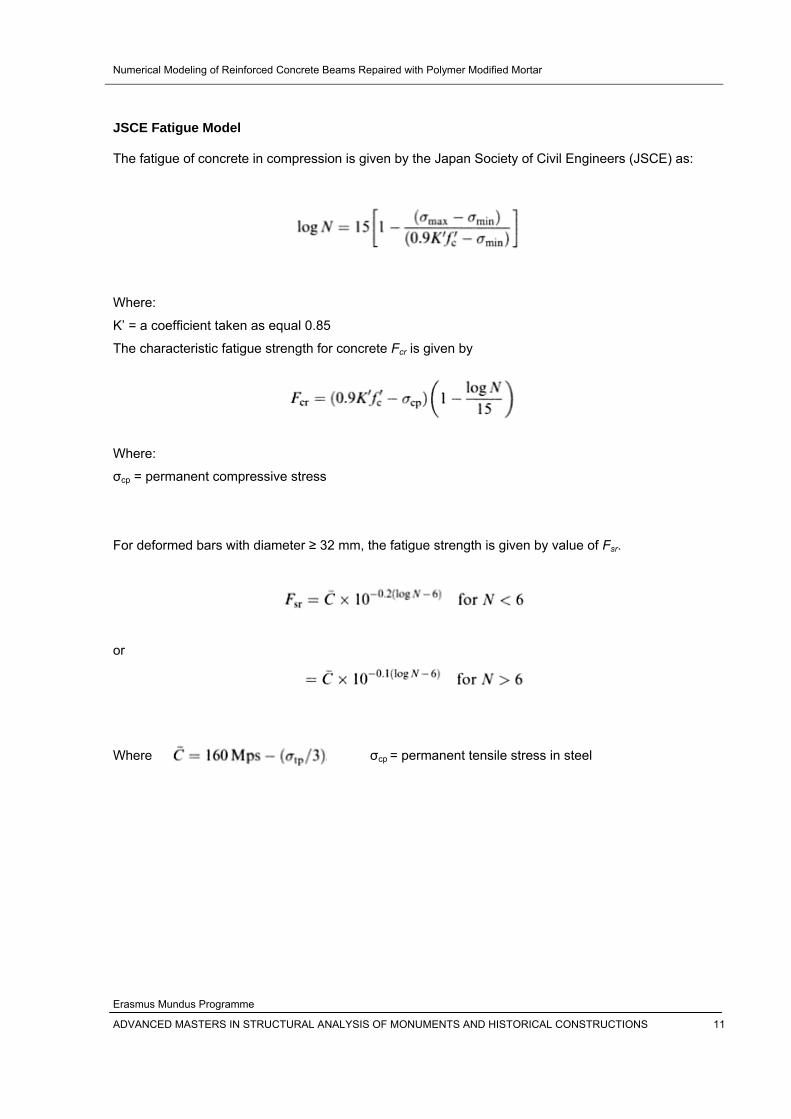
JSCE Fatigue Model
The fatigue of concrete in compression is given by the Japan Society of Civil Engineers (JSCE) as:
Where:
K’ = a coefficient taken as equal 0.85
The characteristic fatigue strength for concrete Fcr is given by
Where:
σcp = permanent compressive stress
For deformed bars with diameter ≥ 32 mm, the fatigue strength is given by value of Fsr.
or
Where σcp = permanent tensile stress in steel
Numerical Modeling of Reinforced Concrete Beams Repaired with Polymer Modified Mortar
Erasmus Mundus Programme
ADVANCED MASTERS IN STRUCTURAL ANALYSIS OF MONUMENTS AND HISTORICAL CONSTRUCTIONS 12
CEB-FIP Fatigue Model
According to CEB-FIP recommendations, the stress corresponding to fatigue strength must be
determined by elastic analysis in which provision should be made for dynamic effects, creep and
shrinkage, etc. the following conditions are checked:
(a)
Both σmax and σmin have maximum values corresponding to 2 x 10⁶ cycles. σrep = strength under
repeated loads; γfat = 1.25.
The fatigue strength of concrete is 50 % of the fractile value obtained from the series of the tests.
(b) Fatigue strength of reinforcement: for 2 x 10⁶ cycles, the characteristic strength of conventional
steel and prestressing steel are 10 % fractile and 50 % fractile respectively.
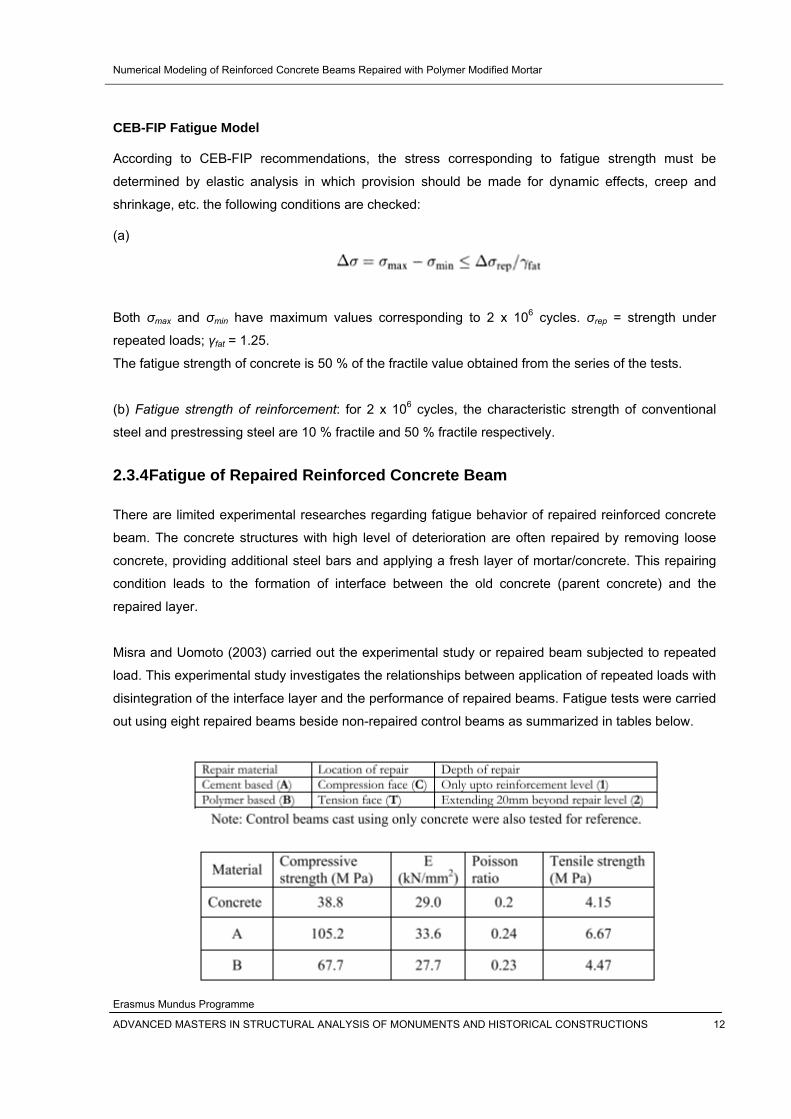
2.3.4 Fatigue of Repaired Reinforced Concrete Beam
There are limited experimental researches regarding fatigue behavior of repaired reinforced concrete
beam. The concrete structures with high level of deterioration are often repaired by removing loose
concrete, providing additional steel bars and applying a fresh layer of mortar/concrete. This repairing
condition leads to the formation of interface between the old concrete (parent concrete) and the
repaired layer.
Misra and Uomoto (2003) carried out the experimental study or repaired beam subjected to repeated
load. This experimental study investigates the relationships between application of repeated loads with
disintegration of the interface layer and the performance of repaired beams. Fatigue tests were carried
out using eight repaired beams beside non-repaired control beams as summarized in tables below.
Numerical Modeling of Reinforced Concrete Beams Repaired with Polymer Modified Mortar
Erasmus Mundus Programme
ADVANCED MASTERS IN STRUCTURAL ANALYSIS OF MONUMENTS AND HISTORICAL CONSTRUCTIONS 13
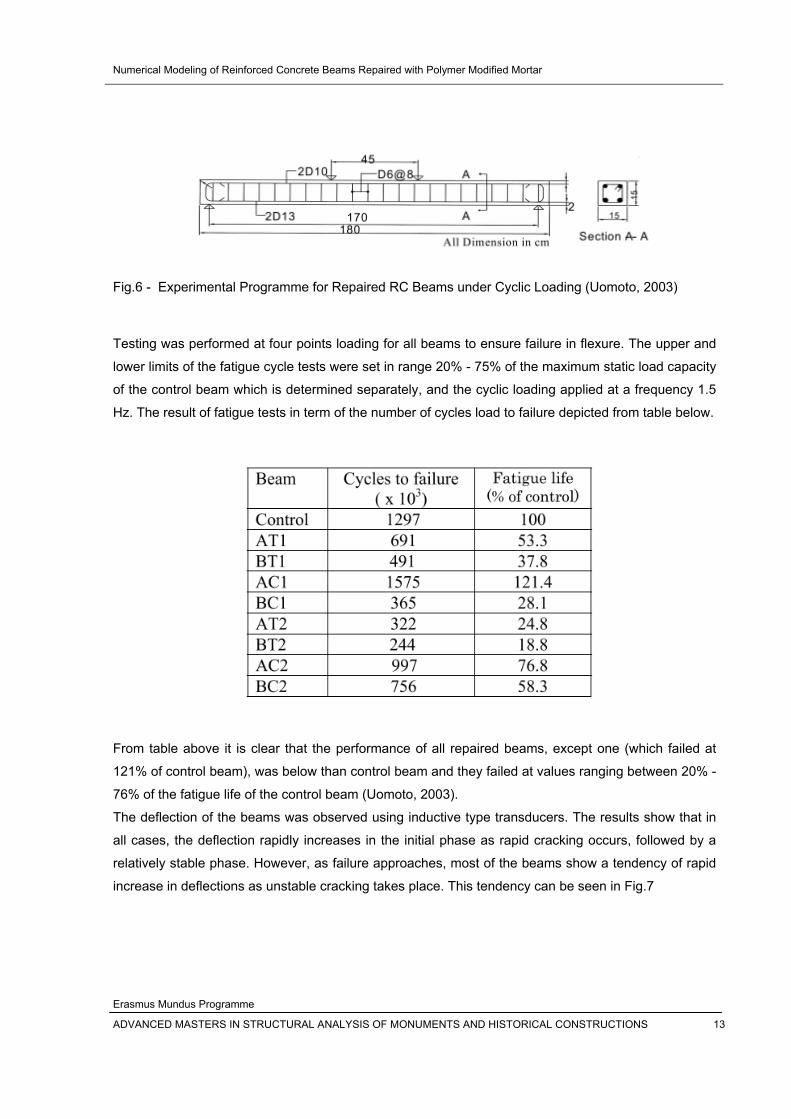
Fig.6 - Experimental Programme for Repaired RC Beams under Cyclic Loading (Uomoto, 2003)
Testing was performed at four points loading for all beams to ensure failure in flexure. The upper and
lower limits of the fatigue cycle tests were set in range 20% - 75% of the maximum static load capacity
of the control beam which is determined separately, and the cyclic loading applied at a frequency 1.5
Hz. The result of fatigue tests in term of the number of cycles load to failure depicted from table below.
From table above it is clear that the performance of all repaired beams, except one (which failed at
121% of control beam), was below than control beam and they failed at values ranging between 20% -
76% of the fatigue life of the control beam (Uomoto, 2003).
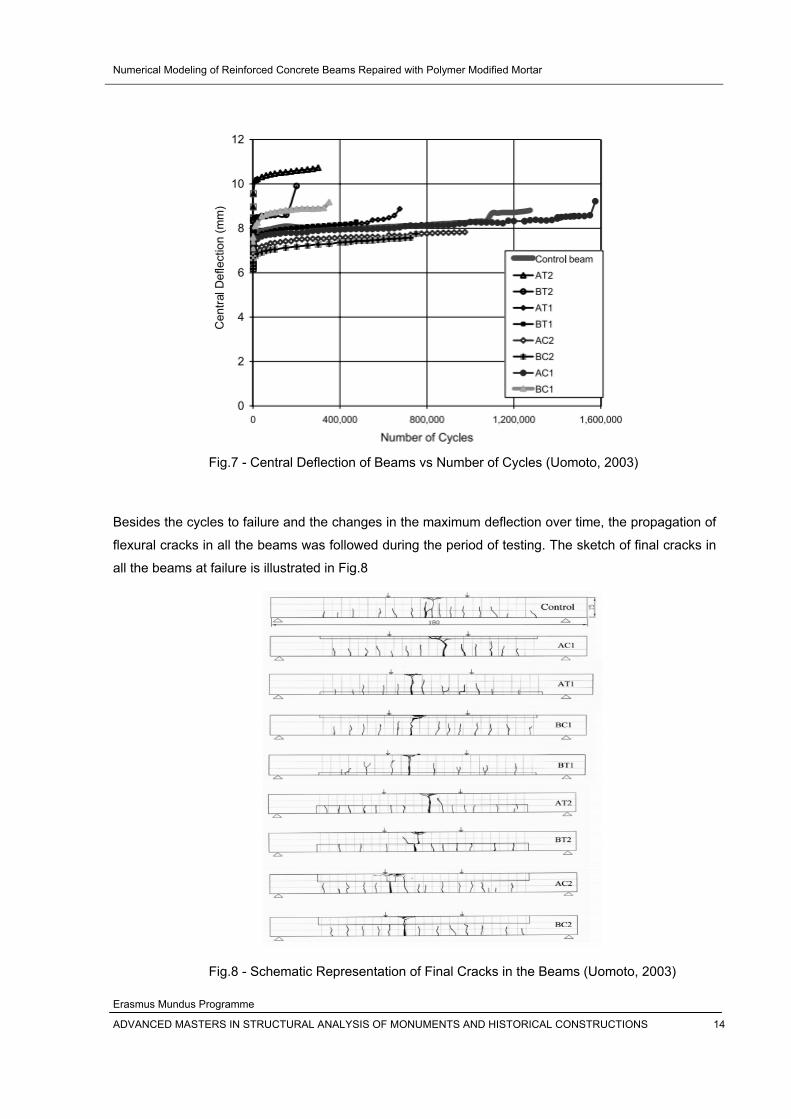
The deflection of the beams was observed using inductive type transducers. The results show that in
all cases, the deflection rapidly increases in the initial phase as rapid cracking occurs, followed by a
relatively stable phase. However, as failure approaches, most of the beams show a tendency of rapid
increase in deflections as unstable cracking takes place. This tendency can be seen in Fig.7
Numerical Modeling of Reinforced Concrete Beams Repaired with Polymer Modified Mortar
Erasmus Mundus Programme
ADVANCED MASTERS IN STRUCTURAL ANALYSIS OF MONUMENTS AND HISTORICAL CONSTRUCTIONS 14
Fig.7 - Central Deflection of Beams vs Number of Cycles (Uomoto, 2003) Besides the cycles to failure and the changes in the maximum deflection over time, the propagation of
flexural cracks in all the beams was followed during the period of testing. The sketch of final cracks in
all the beams at failure is illustrated in Fig.8
Fig.8 - Schematic Representation of Final Cracks in the Beams (Uomoto, 2003)
Numerical Modeling of Reinforced Concrete Beams Repaired with Polymer Modified Mortar
Erasmus Mundus Programme
ADVANCED MASTERS IN STRUCTURAL ANALYSIS OF MONUMENTS AND HISTORICAL CONSTRUCTIONS 15
2.4 Finite Element Method 2.4.1 General
Finite element method is a way to simulate tests that had been done in the laboratory. This method is
very powerful because it can be used to understand more about experiments. Finite element method
shows numerical results more detail for the inner part of the specimens.
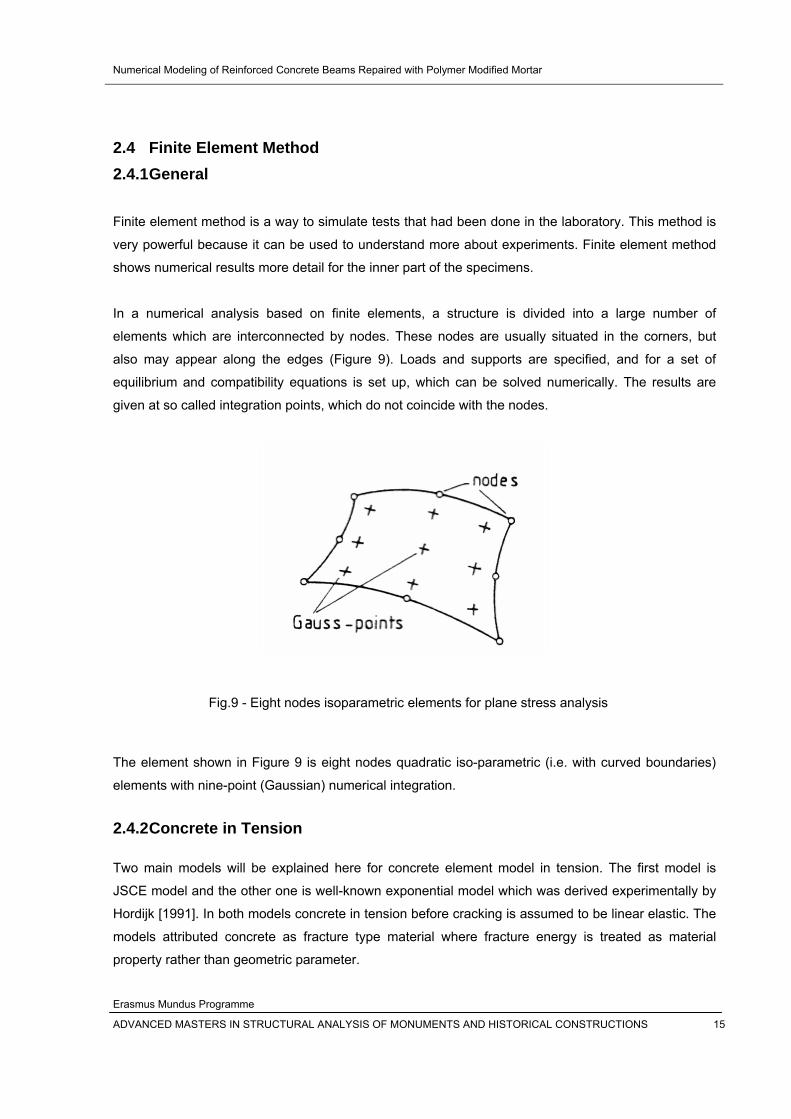
In a numerical analysis based on finite elements, a structure is divided into a large number of
elements which are interconnected by nodes. These nodes are usually situated in the corners, but
also may appear along the edges (Figure 9). Loads and supports are specified, and for a set of
equilibrium and compatibility equations is set up, which can be solved numerically. The results are
given at so called integration points, which do not coincide with the nodes.
Fig.9 - Eight nodes isoparametric elements for plane stress analysis
The element shown in Figure 9 is eight nodes quadratic iso-parametric (i.e. with curved boundaries)
elements with nine-point (Gaussian) numerical integration.
2.4.2 Concrete in Tension
Two main models will be explained here for concrete element model in tension. The first model is
JSCE model and the other one is well-known exponential model which was derived experimentally by
Hordijk [1991]. In both models concrete in tension before cracking is assumed to be linear elastic. The
models attributed concrete as fracture type material where fracture energy is treated as material
property rather than geometric parameter.
Numerical Modeling of Reinforced Concrete Beams Repaired with Polymer Modified Mortar
Erasmus Mundus Programme
ADVANCED MASTERS IN STRUCTURAL ANALYSIS OF MONUMENTS AND HISTORICAL CONSTRUCTIONS 16
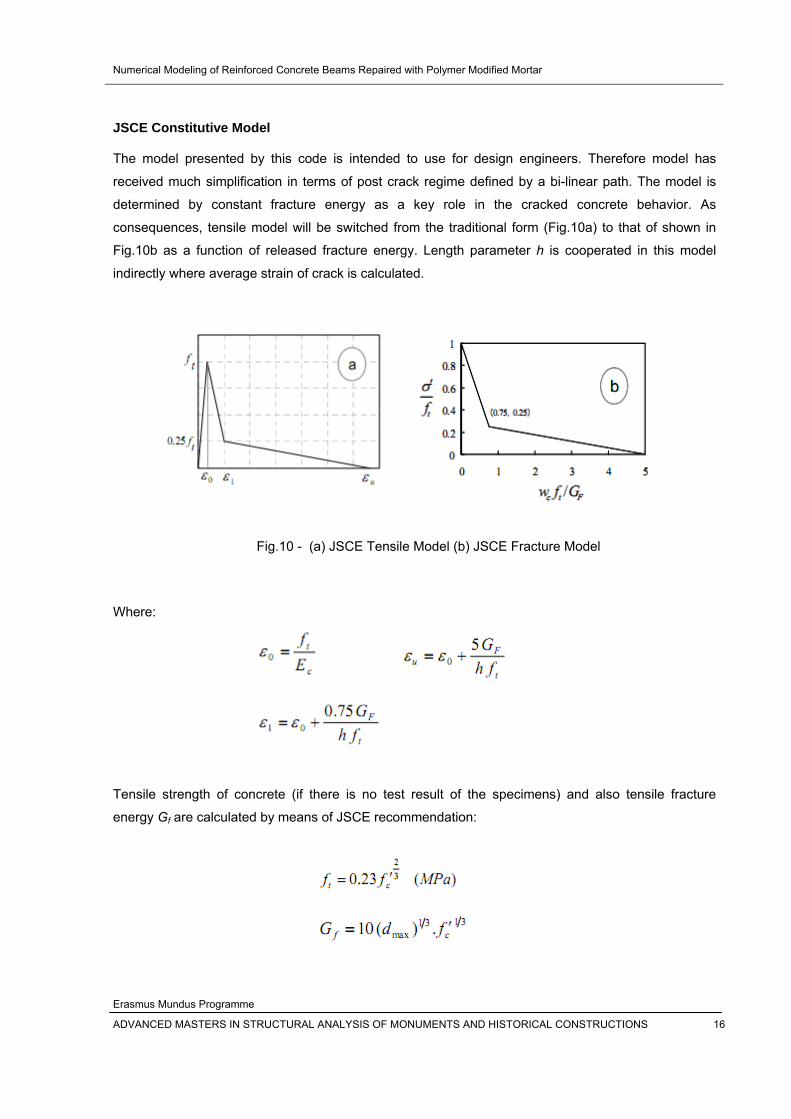
JSCE Constitutive Model
The model presented by this code is intended to use for design engineers. Therefore model has
received much simplification in terms of post crack regime defined by a bi-linear path. The model is
determined by constant fracture energy as a key role in the cracked concrete behavior. As
consequences, tensile model will be switched from the traditional form (Fig.10a) to that of shown in
Fig.10b as a function of released fracture energy. Length parameter h is cooperated in this model
indirectly where average strain of crack is calculated.
Fig.10 - (a) JSCE Tensile Model (b) JSCE Fracture Model
Where:
Tensile strength of concrete (if there is no test result of the specimens) and also tensile fracture
energy Gf are calculated by means of JSCE recommendation:
Numerical Modeling of Reinforced Concrete Beams Repaired with Polymer Modified Mortar
Erasmus Mundus Programme
ADVANCED MASTERS IN STRUCTURAL ANALYSIS OF MONUMENTS AND HISTORICAL CONSTRUCTIONS 17
Where:
dmax is maximum aggregate size in mm, f’c is concrete compressive strength in MPa and Gf is fracture
energy in N/mm.
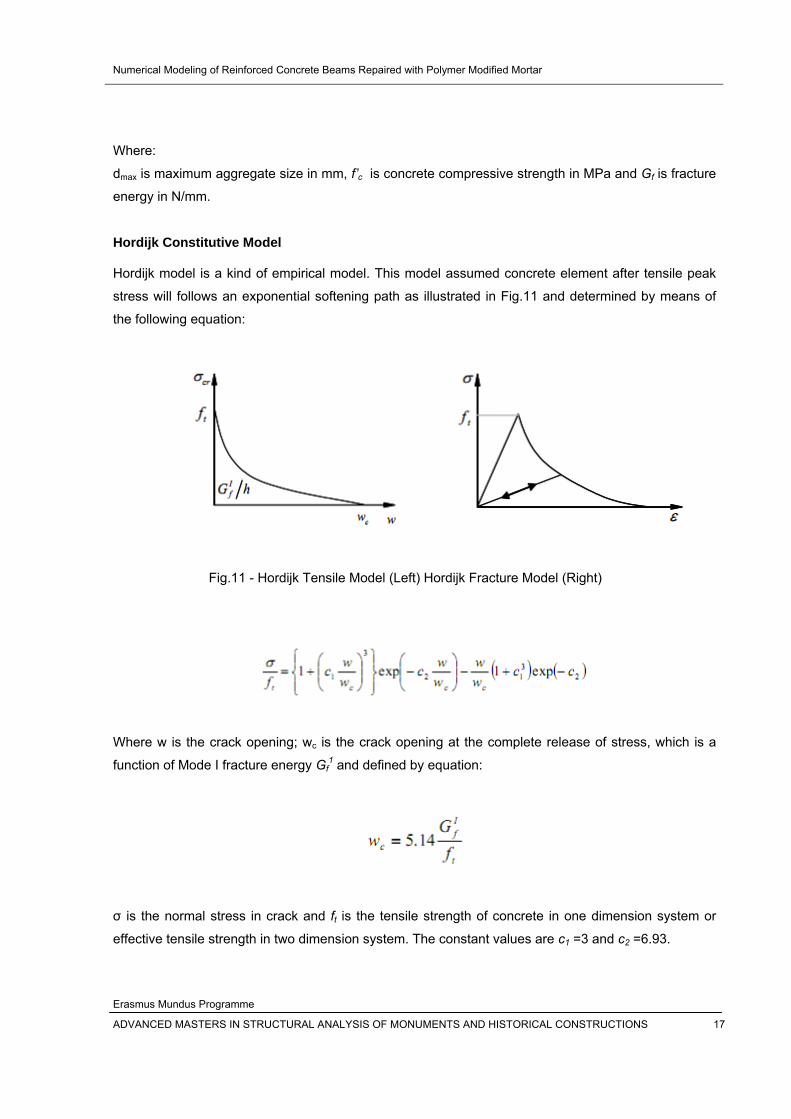
Hordijk Constitutive Model
Hordijk model is a kind of empirical model. This model assumed concrete element after tensile peak
stress will follows an exponential softening path as illustrated in Fig.11 and determined by means of
the following equation:
Fig.11 - Hordijk Tensile Model (Left) Hordijk Fracture Model (Right)
Where w is the crack opening; wc is the crack opening at the complete release of stress, which is a
function of Mode I fracture energy Gf1 and defined by equation:
σ is the normal stress in crack and ft is the tensile strength of concrete in one dimension system or
effective tensile strength in two dimension system. The constant values are c1 =3 and c2 =6.93.
Numerical Modeling of Reinforced Concrete Beams Repaired with Polymer Modified Mortar
Erasmus Mundus Programme
ADVANCED MASTERS IN STRUCTURAL ANALYSIS OF MONUMENTS AND HISTORICAL CONSTRUCTIONS 18
2.4.3 Concrete in Compression
Concrete in compression is also modeled through parabolic relationship between stress and strain.
First model is suggested by JSCE without association of fracture energy of concrete in compression.
Second model, modified version of parabolic model represented by Feenstra [1993], takes into
account fracture energy of concrete.
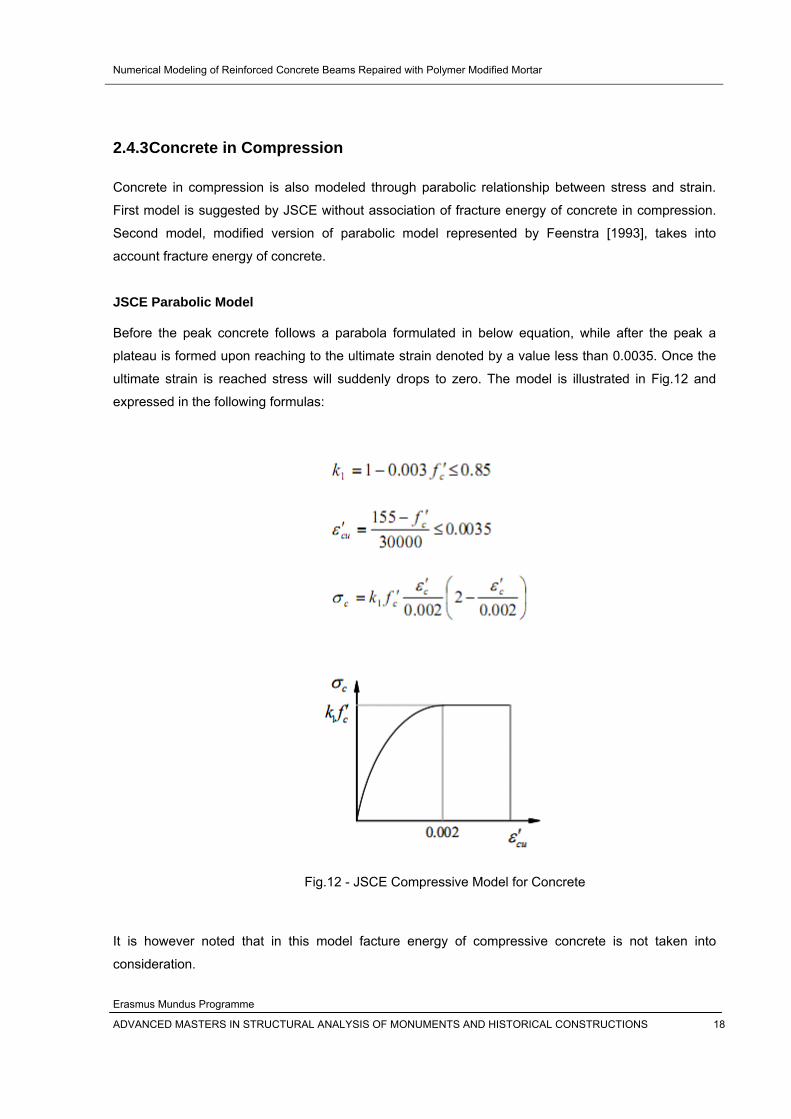
JSCE Parabolic Model
Before the peak concrete follows a parabola formulated in below equation, while after the peak a
plateau is formed upon reaching to the ultimate strain denoted by a value less than 0.0035. Once the
ultimate strain is reached stress will suddenly drops to zero. The model is illustrated in Fig.12 and
expressed in the following formulas:
Fig.12 - JSCE Compressive Model for Concrete
It is however noted that in this model facture energy of compressive concrete is not taken into
consideration.

Numerical Modeling of Reinforced Concrete Beams Repaired with Polymer Modified Mortar
Erasmus Mundus Programme
ADVANCED MASTERS IN STRUCTURAL ANALYSIS OF MONUMENTS AND HISTORICAL CONSTRUCTIONS 19
Feenstra Fracture Model
This model is a modified version of parabolic model which taking into account fracture energy of
concrete in compression. Concrete in this model is assumed to be elastic up to 1/3 f’c which
deformation can be totally exhausted after unloading. This model represented in Fig.13 with following
the equations which in equivalent stress is determined in terms of equivalent strain.
Where:
Fig.13 - Feenstra Compressive Model for Concrete
Numerical Modeling of Reinforced Concrete Beams Repaired with Polymer Modified Mortar
Erasmus Mundus Programme
ADVANCED MASTERS IN STRUCTURAL ANALYSIS OF MONUMENTS AND HISTORICAL CONSTRUCTIONS 20
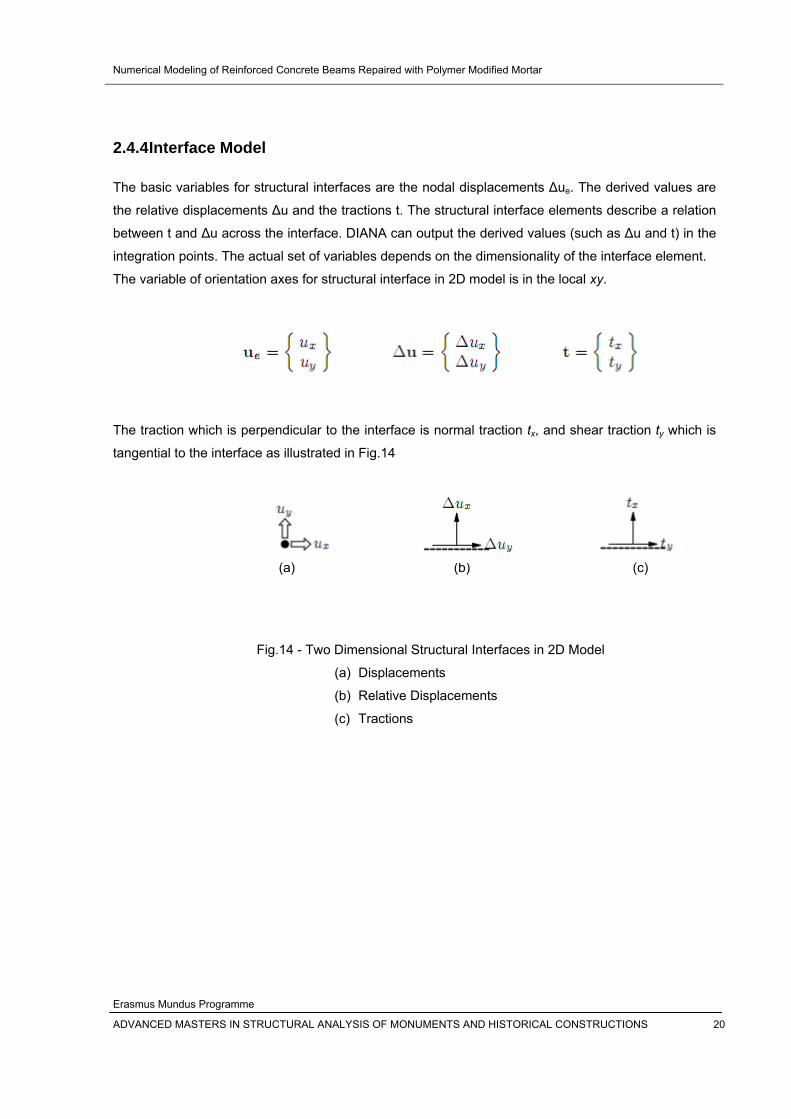
2.4.4 Interface Model
The basic variables for structural interfaces are the nodal displacements Δue. The derived values are
the relative displacements Δu and the tractions t. The structural interface elements describe a relation
between t and Δu across the interface. DIANA can output the derived values (such as Δu and t) in the
integration points. The actual set of variables depends on the dimensionality of the interface element.
The variable of orientation axes for structural interface in 2D model is in the local xy.
The traction which is perpendicular to the interface is normal traction tx, and shear traction ty which is
tangential to the interface as illustrated in Fig.14
(a) (b) (c)
Fig.14 - Two Dimensional Structural Interfaces in 2D Model
(a) Displacements
(b) Relative Displacements
(c) Tractions

Numerical Modeling of Reinforced Concrete Beams Repaired with Polymer Modified Mortar
Erasmus Mundus Programme
ADVANCED MASTERS IN STRUCTURAL ANALYSIS OF MONUMENTS AND HISTORICAL CONSTRUCTIONS 21
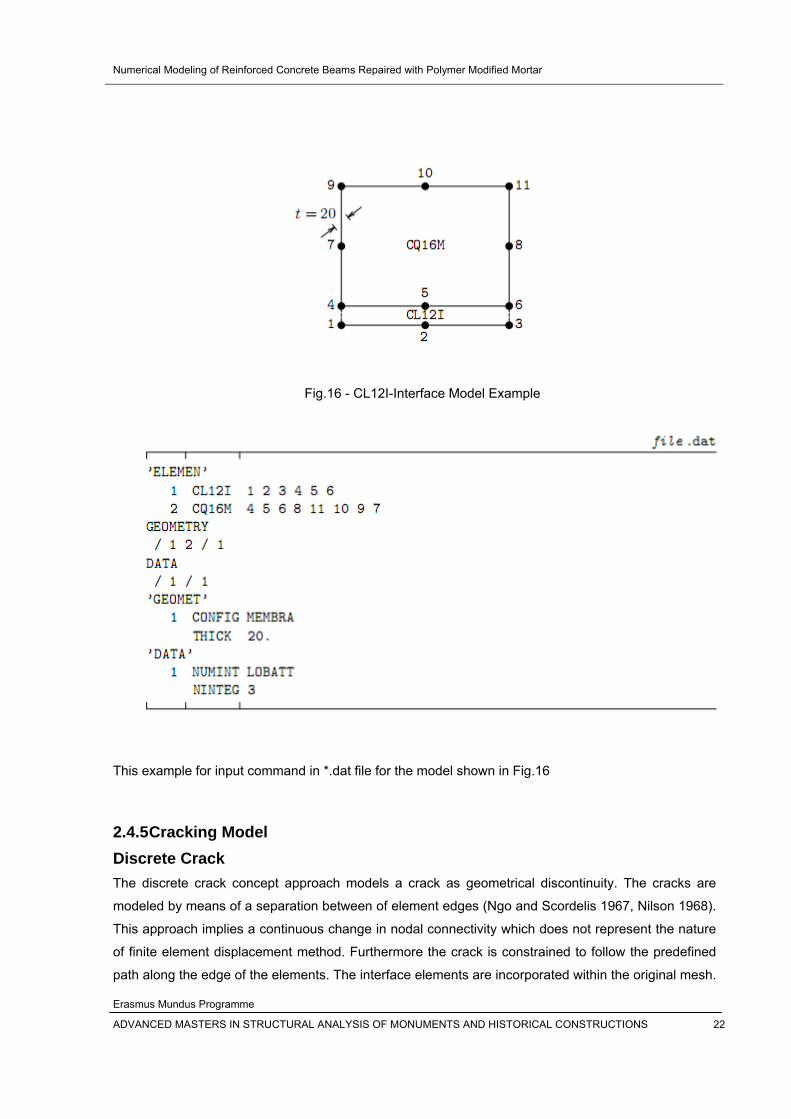
CL12I-Line, 3 + 3 nodes, 2D
(a) (b)
Fig.15 - CL12I-Line Interface element in 2D Model
(a) Topology
(b) Displacements
The CL12I element is an interface element between two lines in a two-dimensional configuration
(Fig.15). The local xy axes for the displacements are evaluated in the first node with x from node 1 to
node 2. Variables are oriented in the xy axes. The element is based on quadratic interpolation. By
default Diana applies a 4-point Newton-Cotes integration scheme. Suitable options are 3- and 5-point
Newton-Cotes, 2- and 3-point Gauss, 3-, 4- and 5-point Lobatto, and a nodal lumping scheme.
CL12I is the element type name, followed by the numbers of the six nodes no 1 to no 6 in sequence
from Figure 16 (not cyclic!). The opposite nodes may overlap: 1 and 4, 2 and 5, 3 and 6.
Numerical Modeling of Reinforced Concrete Beams Repaired with Polymer Modified Mortar
Erasmus Mundus Programme
ADVANCED MASTERS IN STRUCTURAL ANALYSIS OF MONUMENTS AND HISTORICAL CONSTRUCTIONS 22
Fig.16 - CL12I-Interface Model Example
This example for input command in *.dat file for the model shown in Fig….
This example for input command in *.dat file for the model shown in Fig.16
2.4.5 Cracking Model Discrete Crack The discrete crack concept approach models a crack as geometrical discontinuity. The cracks are
modeled by means of a separation between of element edges (Ngo and Scordelis 1967, Nilson 1968).
This approach implies a continuous change in nodal connectivity which does not represent the nature
of finite element displacement method. Furthermore the crack is constrained to follow the predefined
path along the edge of the elements. The interface elements are incorporated within the original mesh.
Numerical Modeling of Reinforced Concrete Beams Repaired with Polymer Modified Mortar
Erasmus Mundus Programme
ADVANCED MASTERS IN STRUCTURAL ANALYSIS OF MONUMENTS AND HISTORICAL CONSTRUCTIONS 23
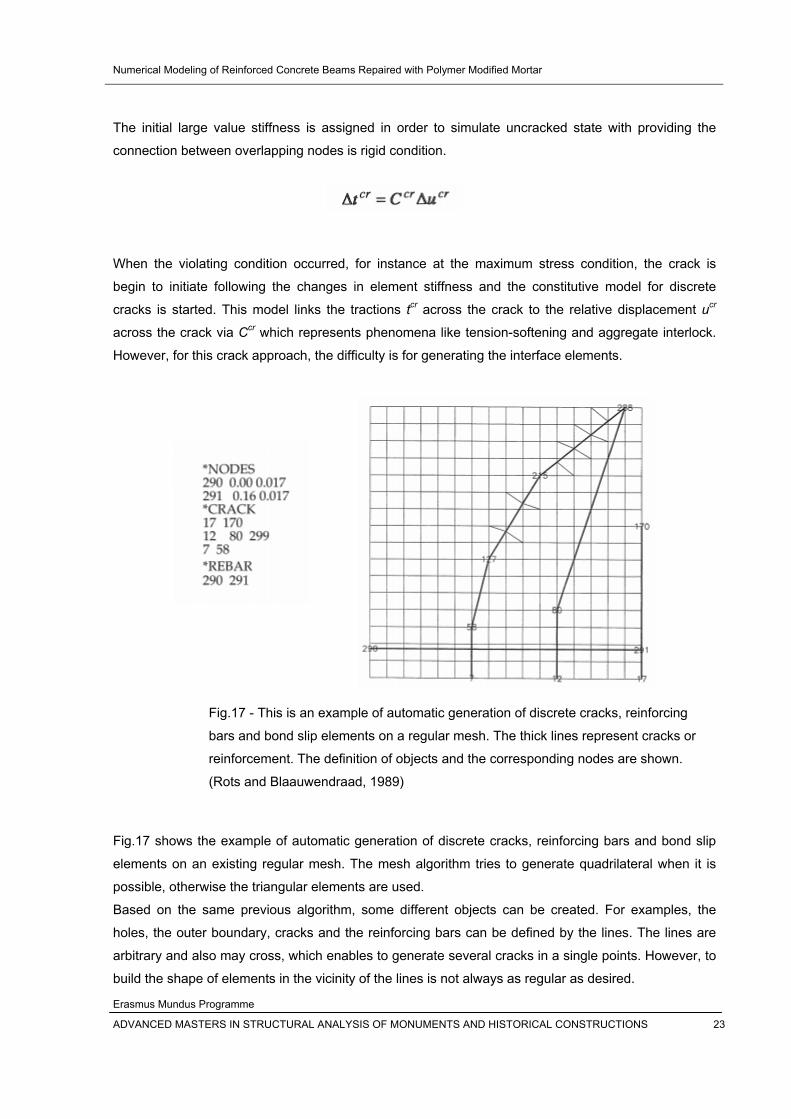
The initial large value stiffness is assigned in order to simulate uncracked state with providing the
connection between overlapping nodes is rigid condition.
When the violating condition occurred, for instance at the maximum stress condition, the crack is
begin to initiate following the changes in element stiffness and the constitutive model for discrete
cracks is started. This model links the tractions tcr across the crack to the relative displacement ucr
across the crack via Ccr which represents phenomena like tension-softening and aggregate interlock.
However, for this crack approach, the difficulty is for generating the interface elements.
Fig.17 - This is an example of automatic generation of discrete cracks, reinforcing
bars and bond slip elements on a regular mesh. The thick lines represent cracks or
reinforcement. The definition of objects and the corresponding nodes are shown.
(Rots and Blaauwendraad, 1989)
Fig.17 shows the example of automatic generation of discrete cracks, reinforcing bars and bond slip
elements on an existing regular mesh. The mesh algorithm tries to generate quadrilateral when it is
possible, otherwise the triangular elements are used.
Based on the same previous algorithm, some different objects can be created. For examples, the
holes, the outer boundary, cracks and the reinforcing bars can be defined by the lines. The lines are
arbitrary and also may cross, which enables to generate several cracks in a single points. However, to
build the shape of elements in the vicinity of the lines is not always as regular as desired.
Numerical Modeling of Reinforced Concrete Beams Repaired with Polymer Modified Mortar
Erasmus Mundus Programme
ADVANCED MASTERS IN STRUCTURAL ANALYSIS OF MONUMENTS AND HISTORICAL CONSTRUCTIONS 24
Smeared Crack The smeared crack concept models a cracked solid is imagined to be a continuum. The approach,
introduced by Rashid (1968) starts from the notion of the stress and strain and permits a description in
terms of stress and strain relations. It is sufficient to switch from the initial isotropic stress-strain law to
an orthotropic law upon crack formation, with the axes of orthotropy is being determined according to
a condition of crack initiation. In case of cracking, the most important behavior is in the direction
normal to the crack. The shear stiffness is modeled with shear retention factor. The normal and shear
stiffness of the cracks are usually assumed to be uncoupled. This concept is very attractive not only it
preserves the topology of the original finite element mesh, but also it does not impose restrictions with
respect to the orientation of the crack planes for example the axes of orthotropy.
Since the cracked concrete is an orthotropic material, axes of orthotropy (i and j) are parallel or
perpendicular to the induced smeared crack direction. Depend on the applied analytical method, axes
of orthotropy may be fixed or rotated during analysis procedure.
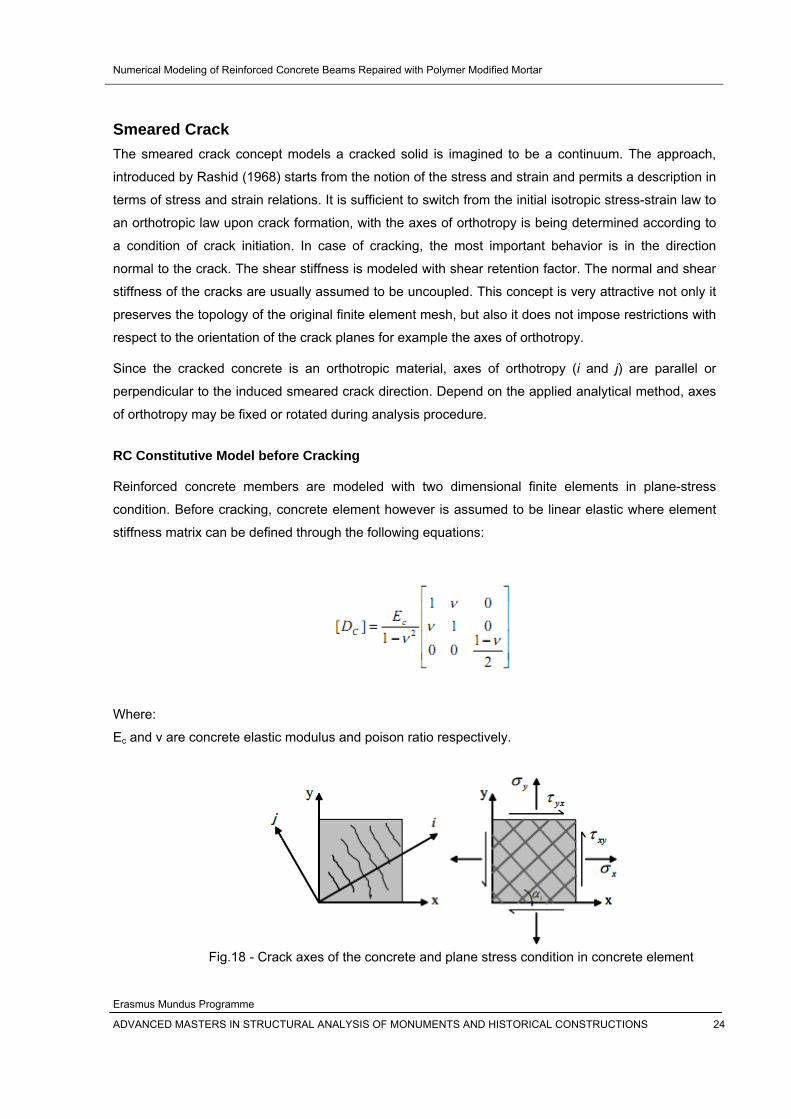
RC Constitutive Model before Cracking
Reinforced concrete members are modeled with two dimensional finite elements in plane-stress
condition. Before cracking, concrete element however is assumed to be linear elastic where element
stiffness matrix can be defined through the following equations:
Where:
Ec and ν are concrete elastic modulus and poison ratio respectively.
Fig.18 - Crack axes of the concrete and plane stress condition in concrete element
Numerical Modeling of Reinforced Concrete Beams Repaired with Polymer Modified Mortar
Erasmus Mundus Programme
ADVANCED MASTERS IN STRUCTURAL ANALYSIS OF MONUMENTS AND HISTORICAL CONSTRUCTIONS 25
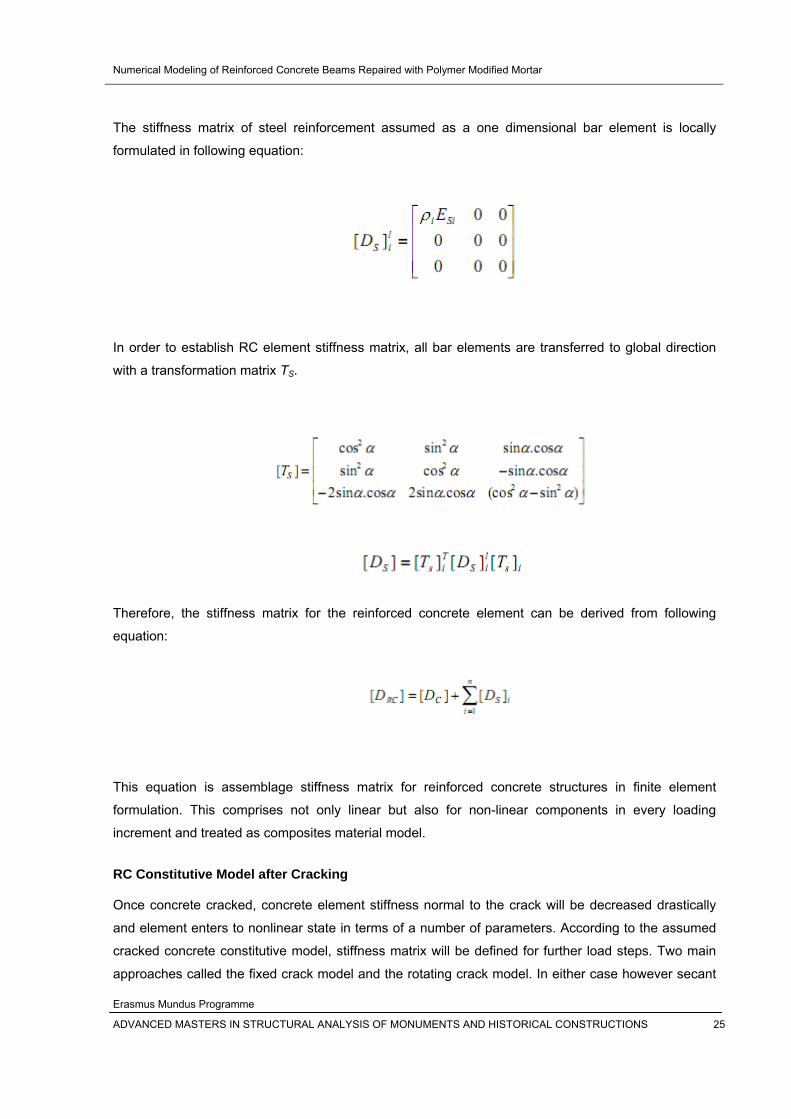
The stiffness matrix of steel reinforcement assumed as a one dimensional bar element is locally
formulated in following equation:
In order to establish RC element stiffness matrix, all bar elements are transferred to global direction
with a transformation matrix TS.
Therefore, the stiffness matrix for the reinforced concrete element can be derived from following
equation:
This equation is assemblage stiffness matrix for reinforced concrete structures in finite element
formulation. This comprises not only linear but also for non-linear components in every loading
increment and treated as composites material model.
RC Constitutive Model after Cracking
Once concrete cracked, concrete element stiffness normal to the crack will be decreased drastically
and element enters to nonlinear state in terms of a number of parameters. According to the assumed
cracked concrete constitutive model, stiffness matrix will be defined for further load steps. Two main
approaches called the fixed crack model and the rotating crack model. In either case however secant
Numerical Modeling of Reinforced Concrete Beams Repaired with Polymer Modified Mortar
Erasmus Mundus Programme
ADVANCED MASTERS IN STRUCTURAL ANALYSIS OF MONUMENTS AND HISTORICAL CONSTRUCTIONS 26
stiffness matrix is applied where in case of crack unloading, secant stiffness remains constant. For
such assumption after complete unloading of a crack, no residual strain will remain. This means that
upon crack closing, both normal stress and normal strain of the crack vanish. The concept of both
methods in incremental form can be expressed by following equations.
Due to the applied constitutive equation we have
For the consequences, stress and strain will be updated with simple equation:
Since the crack is already initiated, concrete stiffness matrix should be transferred to the global
direction through a transformation matrix similar to previous equation which in α = θc. Matrices Ds &
and Dc are calculated based on applied constitutive models for either materials.
Transformation matrix [Tc] for k+1 increment is based on crack direction θ of k increment which differs
for each method.
Numerical Modeling of Reinforced Concrete Beams Repaired with Polymer Modified Mortar
Erasmus Mundus Programme
ADVANCED MASTERS IN STRUCTURAL ANALYSIS OF MONUMENTS AND HISTORICAL CONSTRUCTIONS 27
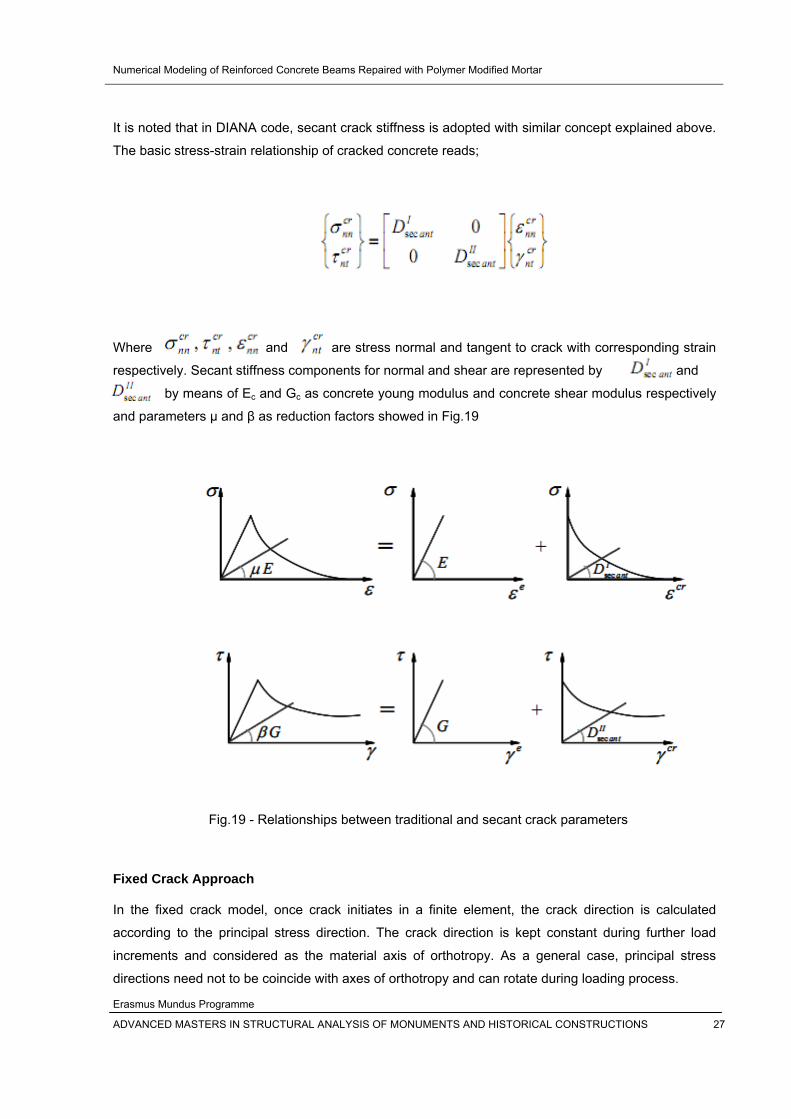
It is noted that in DIANA code, secant crack stiffness is adopted with similar concept explained above.
The basic stress-strain relationship of cracked concrete reads;
Where and are stress normal and tangent to crack with corresponding strain
respectively. Secant stiffness components for normal and shear are represented by and
by means of Ec and Gc as concrete young modulus and concrete shear modulus respectively
and parameters μ and β as reduction factors showed in Fig.19
Fig.19 - Relationships between traditional and secant crack parameters
Fixed Crack Approach
In the fixed crack model, once crack initiates in a finite element, the crack direction is calculated
according to the principal stress direction. The crack direction is kept constant during further load
increments and considered as the material axis of orthotropy. As a general case, principal stress
directions need not to be coincide with axes of orthotropy and can rotate during loading process.
Numerical Modeling of Reinforced Concrete Beams Repaired with Polymer Modified Mortar
Erasmus Mundus Programme
ADVANCED MASTERS IN STRUCTURAL ANALYSIS OF MONUMENTS AND HISTORICAL CONSTRUCTIONS 28
This assumption produces a shear stress in crack surface. In order to prevent the effects of this
artificially existed shear stress in the analysis, a shear retention factor (β in Fig.19) as a reduction
coefficient is always applied in this model. This factor can be either of a constant coefficient or varies
during analysis as a function of crack width. The procedures of calculation for this method can be
summarized as follow:
i) Once concrete tensile strength is violated, find crack direction by means of principal stress direction
in tension. This direction is fixed in whole analytical procedure.
ii) Determine shear retention factor β (function of crack strain or a constant value)
iii) Calculate Ds & and Dc & based on applied constitutive models in their local coordinates.
iv) Transfer all calculated matrices to the global coordinate system.
v) Construct DRC for composite element.
vi) Calculate corresponding incremental strains for the given incremental stress.
vii) Compute total stress and strain of the member.
It is obvious that is any steps, steel and concrete stress and strain state will be checked by adopted
constitutive models.
Rotating Crack Approach
Alternatively, rotating crack model is presented where the direction of the principal stress coincides to
the direction of the principal strain. Since crack direction rotates according to the principal stress
direction, no shear stress is generated on the crack surface and just two principal components need to
be defined. Due to this co-axiality assumption, rotating crack approach does not explicitly treat shear
slip or shear transfer due to aggregate interlock. On the other hand this assumption greatly simplifies
computation and reasonably accurate under both monotonic and cyclic loading paths where principal
stress does not rotate so much.
Therefore the concept of active crack as well as multi direction cracks is not applicable in this method.
Calculation procedure by this method is similar to that of fixed crack approach while no shear retention
factor is necessary to be defined. Crack direction is updated in each step and aligned with principal
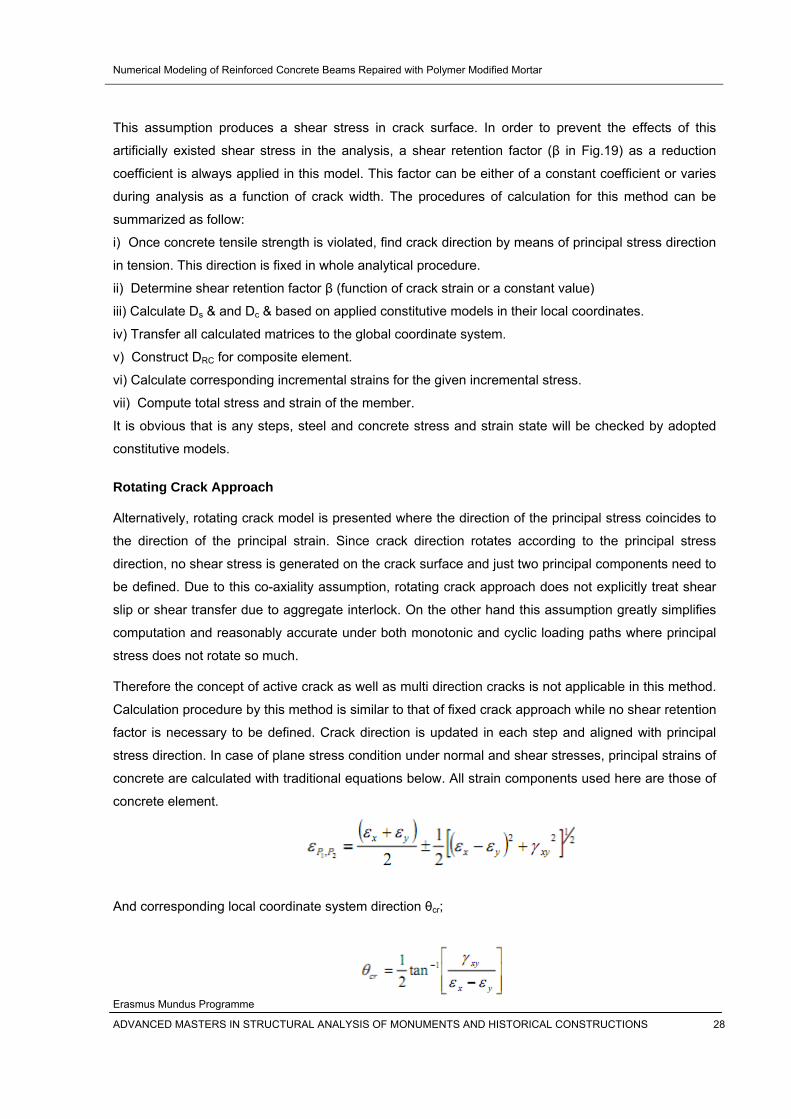
stress direction. In case of plane stress condition under normal and shear stresses, principal strains of
concrete are calculated with traditional equations below. All strain components used here are those of
concrete element.
And corresponding local coordinate system direction θcr;
Numerical Modeling of Reinforced Concrete Beams Repaired with Polymer Modified Mortar
Erasmus Mundus Programme
ADVANCED MASTERS IN STRUCTURAL ANALYSIS OF MONUMENTS AND HISTORICAL CONSTRUCTIONS 29
2.4.6 Solution Algorithm
In spite of linear Finite Element Analysis which in relation between force vector and displacement
vector can be explicitly expressed by a linear equation, displacements at current stage often depend
on the displacements at earlier stages. To achieve equilibrium between internal and external forces in
nonlinear equation, an incremental-iterative solution procedure should be preformed since the solution
vector could not be calculated explicitly as we have in linear equilibrium. The nonlinearity can be a
result of nonlinear elasticity, plasticity and path-dependent analysis which in the displacement is
depend on load history.
Iterative Procedure
The incremental-iterative solution procedures comprise of two parts: the increment part and the
iteration part. By using applied denotation in DIANA code, the equilibrium state in which the internal
force vector is equal to the external force vector, satisfying boundary conditions.
fint = fext
For each increment in nonlinear analysis, correction iteration is necessary to keep the error in analysis
in a certain acceptable level. The exact solution leads unbalanced or residual force which is generated
in each iteration converges to zero. The unbalanced force is difference between external and internal
loads or in other words, difference between applied load and resisting load. The equation can be
represented as follow:
g = fint = fext ≤ λ
Where:
g = residual force
λ = convergence rate
Depending on how the stiffness matrix K is updated, iterative method can be classified in three broad
categories with possible modification of each method: Tangent stiffness method (regular Newton-
Raphson and modified N-R method), Secant stiffness or Quasi Newton-Raphson method and initial or
constant stiffness method. Each method is schematically showed in Fig.20
Numerical Modeling of Reinforced Concrete Beams Repaired with Polymer Modified Mortar
Erasmus Mundus Programme
ADVANCED MASTERS IN STRUCTURAL ANALYSIS OF MONUMENTS AND HISTORICAL CONSTRUCTIONS 30
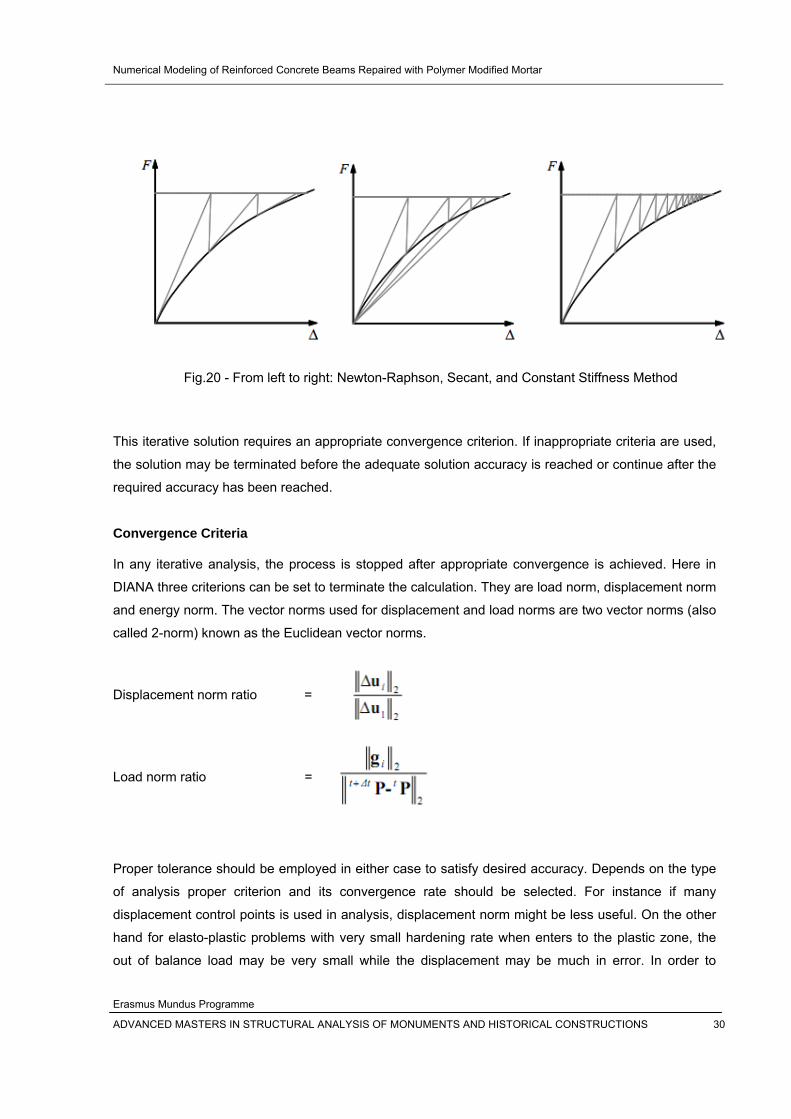
Fig.20 - From left to right: Newton-Raphson, Secant, and Constant Stiffness Method
This iterative solution requires an appropriate convergence criterion. If inappropriate criteria are used,
the solution may be terminated before the adequate solution accuracy is reached or continue after the
required accuracy has been reached.
Convergence Criteria
In any iterative analysis, the process is stopped after appropriate convergence is achieved. Here in
DIANA three criterions can be set to terminate the calculation. They are load norm, displacement norm
and energy norm. The vector norms used for displacement and load norms are two vector norms (also
called 2-norm) known as the Euclidean vector norms.
Displacement norm ratio =
Load norm ratio =
Proper tolerance should be employed in either case to satisfy desired accuracy. Depends on the type
of analysis proper criterion and its convergence rate should be selected. For instance if many
displacement control points is used in analysis, displacement norm might be less useful. On the other
hand for elasto-plastic problems with very small hardening rate when enters to the plastic zone, the
out of balance load may be very small while the displacement may be much in error. In order to
Numerical Modeling of Reinforced Concrete Beams Repaired with Polymer Modified Mortar
Erasmus Mundus Programme
ADVANCED MASTERS IN STRUCTURAL ANALYSIS OF MONUMENTS AND HISTORICAL CONSTRUCTIONS 31
provide an indication of when both displacement and load are near their equilibrium, values, a third
convergence criterion can be represented based on energy norm.
Energy norm ratio =
Where is internal force at the beginning of the increment.
Incremental procedure
The incremental procedure basically is divided into two types: load control and displacement control.
These two methods can handle most incremental procedures depend on the required solution. For
pre-peak analysis, load control scheme can be the choice of solution while for analysis of pre and post
peak regime, displacement control is the proper choice. The latter method can go beyond the peak
and capture snap-through phenomenon especially for softening material. However in some cases
such as Snap-back even displacement control fails where alternative method called Arc-length method
can handle this phenomenon.
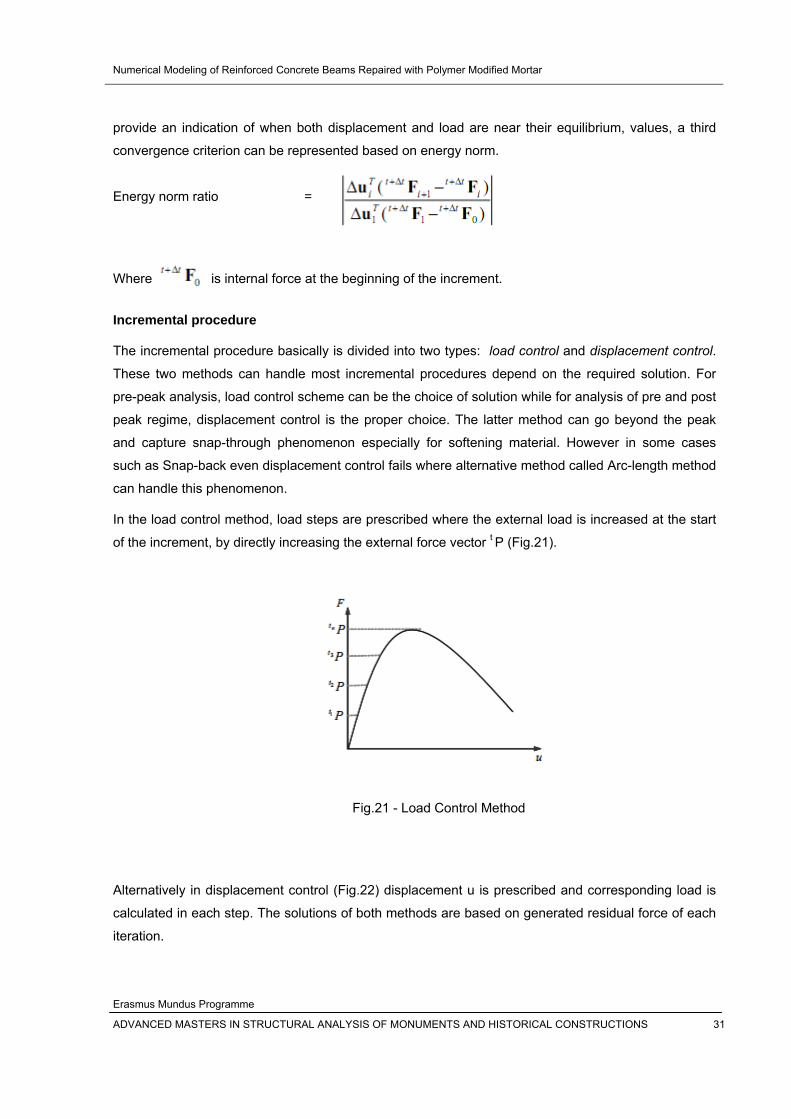
In the load control method, load steps are prescribed where the external load is increased at the start
of the increment, by directly increasing the external force vector t P (Fig.21).
Fig.21 - Load Control Method
Alternatively in displacement control (Fig.22) displacement u is prescribed and corresponding load is
calculated in each step. The solutions of both methods are based on generated residual force of each
iteration.
Numerical Modeling of Reinforced Concrete Beams Repaired with Polymer Modified Mortar
Erasmus Mundus Programme
ADVANCED MASTERS IN STRUCTURAL ANALYSIS OF MONUMENTS AND HISTORICAL CONSTRUCTIONS 32
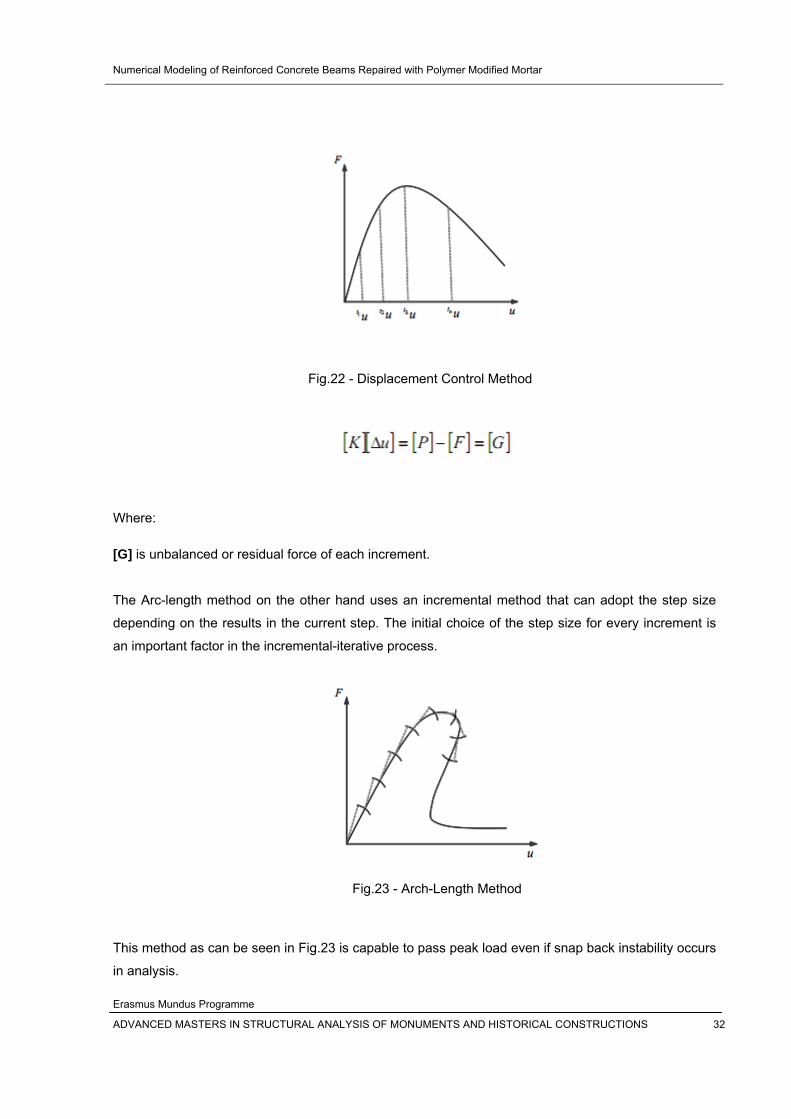
Fig.22 - Displacement Control Method
Where:
[G] is unbalanced or residual force of each increment.
The Arc-length method on the other hand uses an incremental method that can adopt the step size
depending on the results in the current step. The initial choice of the step size for every increment is
an important factor in the incremental-iterative process.
Fig.23 - Arch-Length Method
This method as can be seen in Fig.23 is capable to pass peak load even if snap back instability occurs
in analysis.
Numerical Modeling of Reinforced Concrete Beams Repaired with Polymer Modified Mortar
Erasmus Mundus Programme
ADVANCED MASTERS IN STRUCTURAL ANALYSIS OF MONUMENTS AND HISTORICAL CONSTRUCTIONS 33
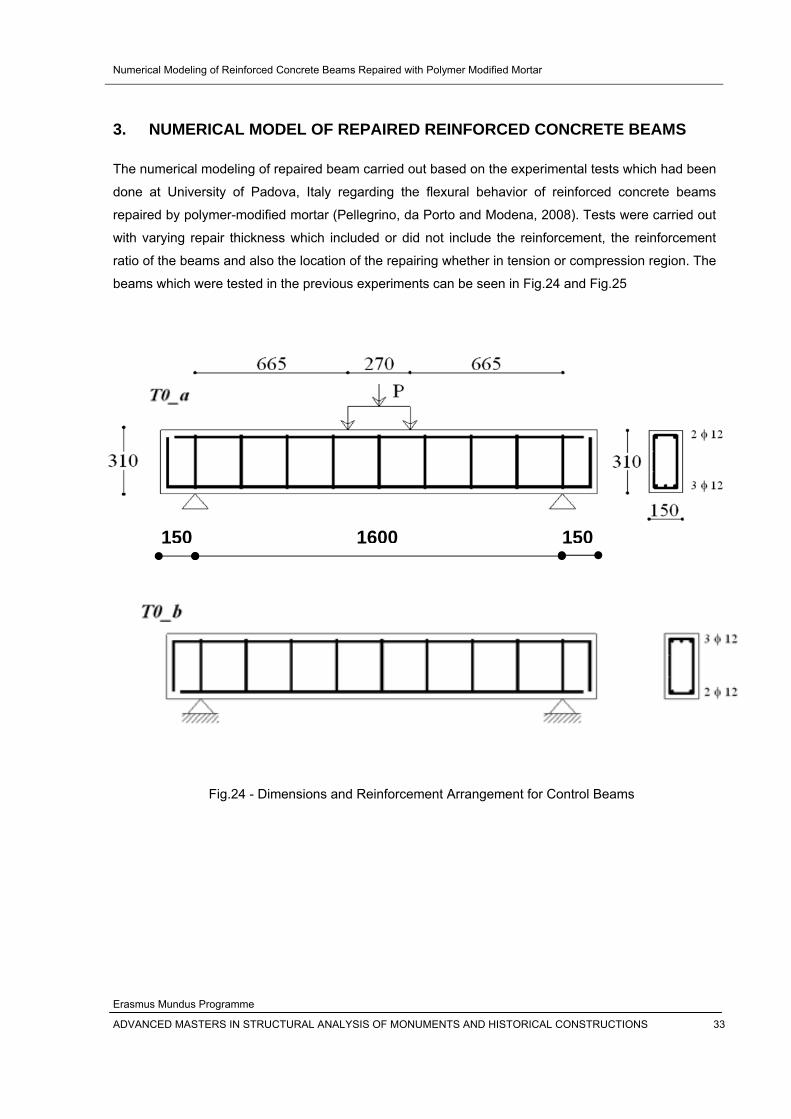
3. NUMERICAL MODEL OF REPAIRED REINFORCED CONCRETE BEAMS
The numerical modeling of repaired beam carried out based on the experimental tests which had been
done at University of Padova, Italy regarding the flexural behavior of reinforced concrete beams
repaired by polymer-modified mortar (Pellegrino, da Porto and Modena, 2008). Tests were carried out
with varying repair thickness which included or did not include the reinforcement, the reinforcement
ratio of the beams and also the location of the repairing whether in tension or compression region. The
beams which were tested in the previous experiments can be seen in Fig.24 and Fig.25
Fig.24 - Dimensions and Reinforcement Arrangement for Control Beams
150 1600 150
Numerical Modeling of Reinforced Concrete Beams Repaired with Polymer Modified Mortar
Erasmus Mundus Programme
ADVANCED MASTERS IN STRUCTURAL ANALYSIS OF MONUMENTS AND HISTORICAL CONSTRUCTIONS 34
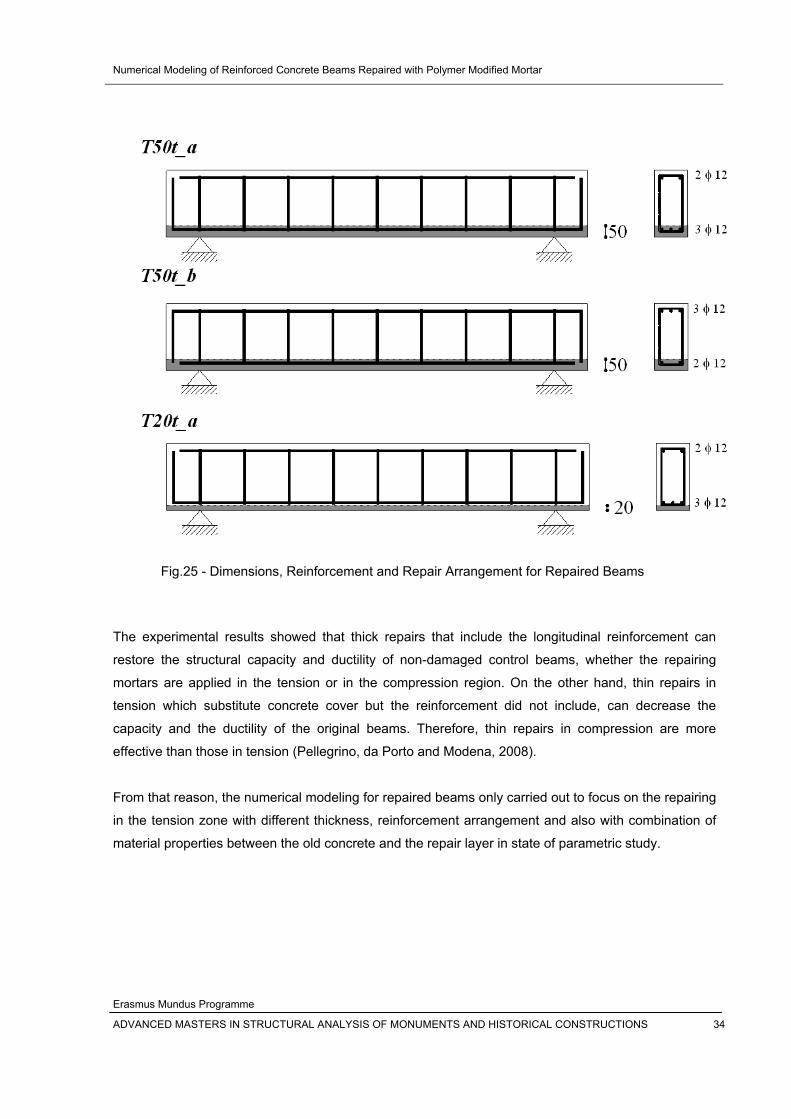
Fig.25 - Dimensions, Reinforcement and Repair Arrangement for Repaired Beams
The experimental results showed that thick repairs that include the longitudinal reinforcement can
restore the structural capacity and ductility of non-damaged control beams, whether the repairing
mortars are applied in the tension or in the compression region. On the other hand, thin repairs in
tension which substitute concrete cover but the reinforcement did not include, can decrease the
capacity and the ductility of the original beams. Therefore, thin repairs in compression are more
effective than those in tension (Pellegrino, da Porto and Modena, 2008).
From that reason, the numerical modeling for repaired beams only carried out to focus on the repairing
in the tension zone with different thickness, reinforcement arrangement and also with combination of
material properties between the old concrete and the repair layer in state of parametric study.
Numerical Modeling of Reinforced Concrete Beams Repaired with Polymer Modified Mortar
Erasmus Mundus Programme
ADVANCED MASTERS IN STRUCTURAL ANALYSIS OF MONUMENTS AND HISTORICAL CONSTRUCTIONS 35
3.1 Material Model 3.1.1 Material Model for Reinforcing Steel
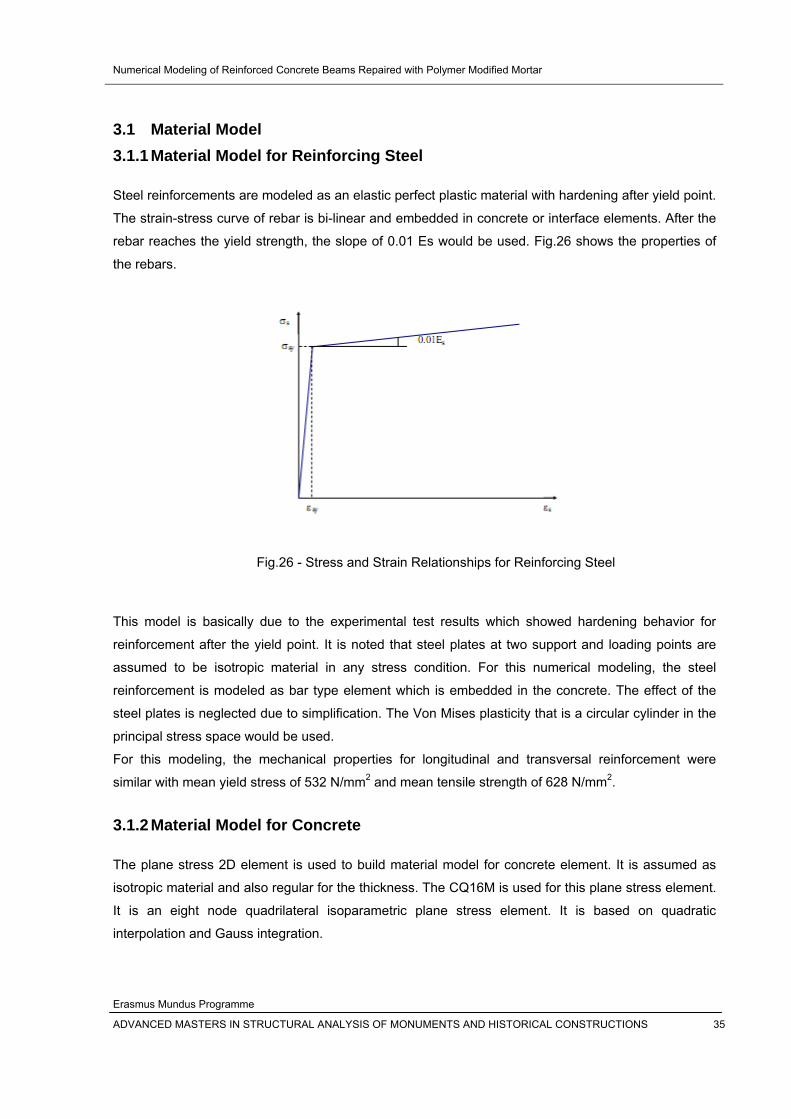
Steel reinforcements are modeled as an elastic perfect plastic material with hardening after yield point.
The strain-stress curve of rebar is bi-linear and embedded in concrete or interface elements. After the
rebar reaches the yield strength, the slope of 0.01 Es would be used. Fig.26 shows the properties of
the rebars.
Fig.26 - Stress and Strain Relationships for Reinforcing Steel
This model is basically due to the experimental test results which showed hardening behavior for
reinforcement after the yield point. It is noted that steel plates at two support and loading points are
assumed to be isotropic material in any stress condition. For this numerical modeling, the steel
reinforcement is modeled as bar type element which is embedded in the concrete. The effect of the
steel plates is neglected due to simplification. The Von Mises plasticity that is a circular cylinder in the
principal stress space would be used.
For this modeling, the mechanical properties for longitudinal and transversal reinforcement were
similar with mean yield stress of 532 N/mm2 and mean tensile strength of 628 N/mm2.
3.1.2 Material Model for Concrete
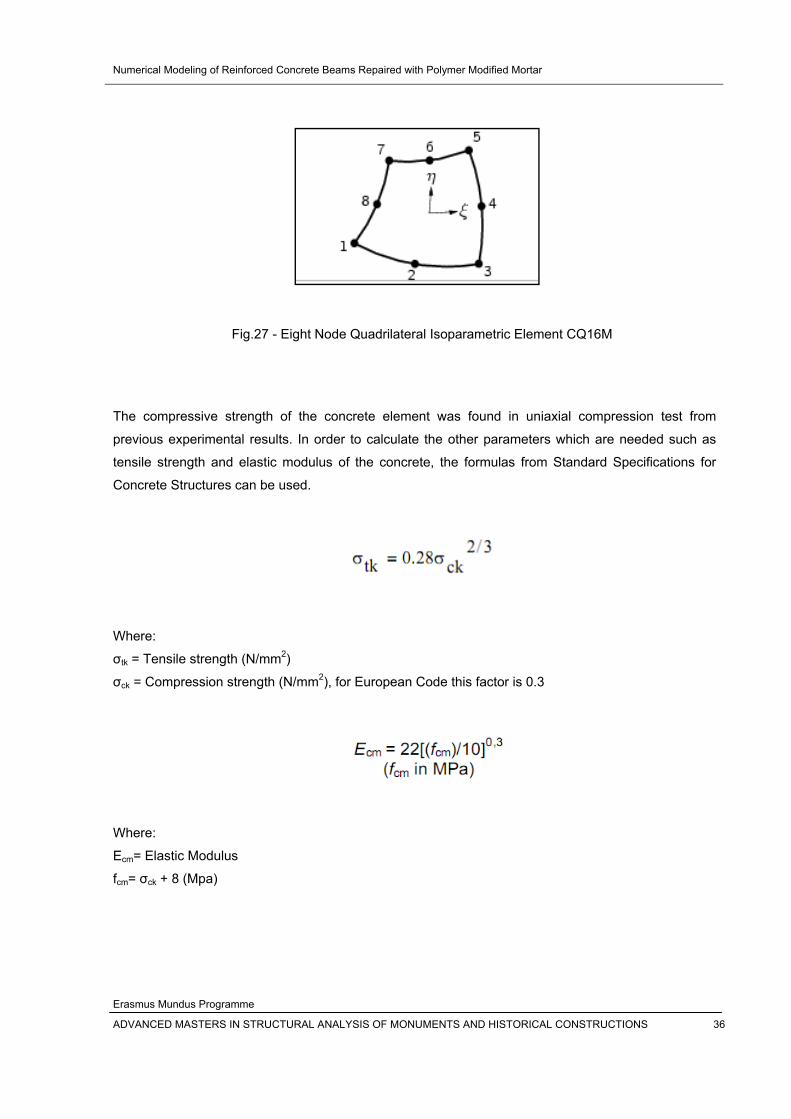
The plane stress 2D element is used to build material model for concrete element. It is assumed as
isotropic material and also regular for the thickness. The CQ16M is used for this plane stress element.
It is an eight node quadrilateral isoparametric plane stress element. It is based on quadratic
interpolation and Gauss integration.
Numerical Modeling of Reinforced Concrete Beams Repaired with Polymer Modified Mortar
Erasmus Mundus Programme
ADVANCED MASTERS IN STRUCTURAL ANALYSIS OF MONUMENTS AND HISTORICAL CONSTRUCTIONS 36
Fig.27 - Eight Node Quadrilateral Isoparametric Element CQ16M
The compressive strength of the concrete element was found in uniaxial compression test from
previous experimental results. In order to calculate the other parameters which are needed such as
tensile strength and elastic modulus of the concrete, the formulas from Standard Specifications for
Concrete Structures can be used.
Where:
σtk = Tensile strength (N/mm2)
σck = Compression strength (N/mm2), for European Code this factor is 0.3
Where:
Ecm= Elastic Modulus
fcm= σck + 8 (Mpa)
Numerical Modeling of Reinforced Concrete Beams Repaired with Polymer Modified Mortar
Erasmus Mundus Programme
ADVANCED MASTERS IN STRUCTURAL ANALYSIS OF MONUMENTS AND HISTORICAL CONSTRUCTIONS 37
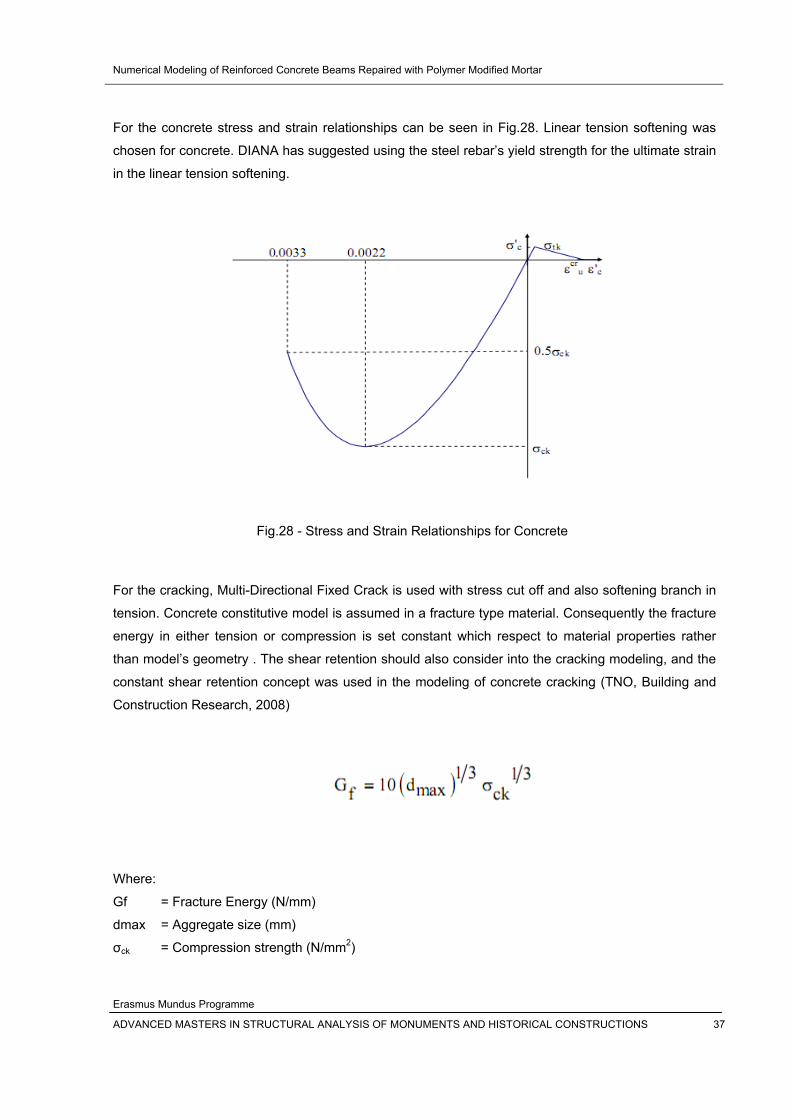
For the concrete stress and strain relationships can be seen in Fig.28. Linear tension softening was
chosen for concrete. DIANA has suggested using the steel rebar’s yield strength for the ultimate strain
in the linear tension softening.
Fig.28 - Stress and Strain Relationships for Concrete
For the cracking, Multi-Directional Fixed Crack is used with stress cut off and also softening branch in
tension. Concrete constitutive model is assumed in a fracture type material. Consequently the fracture
energy in either tension or compression is set constant which respect to material properties rather
than model’s geometry . The shear retention should also consider into the cracking modeling, and the
constant shear retention concept was used in the modeling of concrete cracking (TNO, Building and
Construction Research, 2008)
Where:
Gf = Fracture Energy (N/mm)
dmax = Aggregate size (mm)
σck = Compression strength (N/mm2)
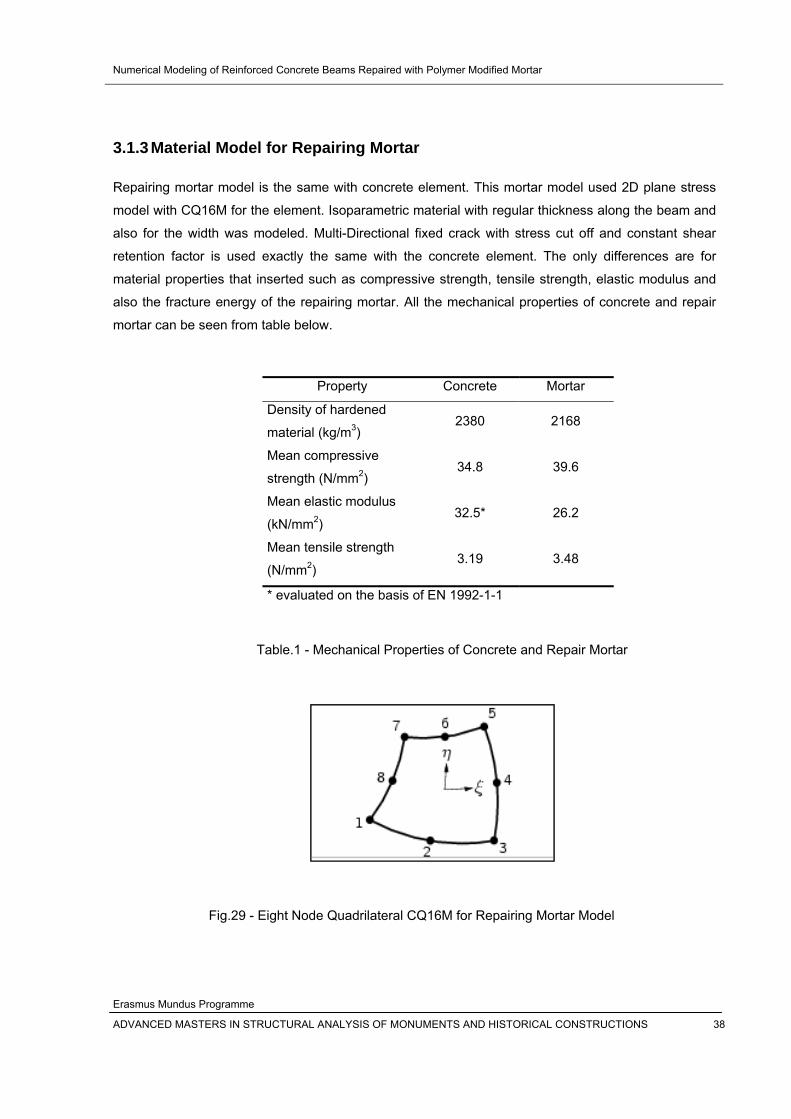
Numerical Modeling of Reinforced Concrete Beams Repaired with Polymer Modified Mortar
Erasmus Mundus Programme
ADVANCED MASTERS IN STRUCTURAL ANALYSIS OF MONUMENTS AND HISTORICAL CONSTRUCTIONS 38
3.1.3 Material Model for Repairing Mortar
Repairing mortar model is the same with concrete element. This mortar model used 2D plane stress
model with CQ16M for the element. Isoparametric material with regular thickness along the beam and
also for the width was modeled. Multi-Directional fixed crack with stress cut off and constant shear
retention factor is used exactly the same with the concrete element. The only differences are for
material properties that inserted such as compressive strength, tensile strength, elastic modulus and
also the fracture energy of the repairing mortar. All the mechanical properties of concrete and repair
mortar can be seen from table below.
Table.1 - Mechanical Properties of Concrete and Repair Mortar
Fig.29 - Eight Node Quadrilateral CQ16M for Repairing Mortar Model
Property Concrete Mortar
Density of hardened
material (kg/m3) 2380 2168
Mean compressive
strength (N/mm2) 34.8 39.6
Mean elastic modulus
(kN/mm2) 32.5* 26.2
Mean tensile strength
(N/mm2) 3.19 3.48
* evaluated on the basis of EN 1992-1-1
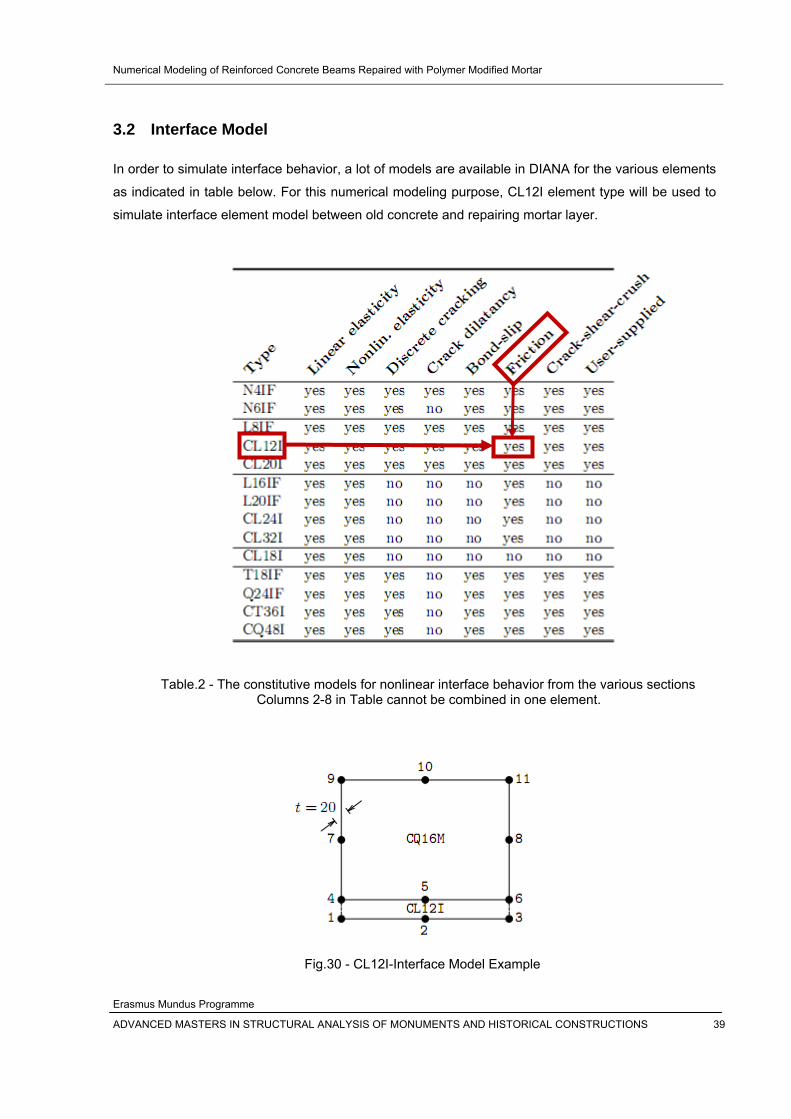
Numerical Modeling of Reinforced Concrete Beams Repaired with Polymer Modified Mortar
Erasmus Mundus Programme
ADVANCED MASTERS IN STRUCTURAL ANALYSIS OF MONUMENTS AND HISTORICAL CONSTRUCTIONS 39
3.2 Interface Model
In order to simulate interface behavior, a lot of models are available in DIANA for the various elements
as indicated in table below. For this numerical modeling purpose, CL12I element type will be used to
simulate interface element model between old concrete and repairing mortar layer.
Table.2 - The constitutive models for nonlinear interface behavior from the various sections
Columns 2-8 in Table cannot be combined in one element.
Fig.30 - CL12I-Interface Model Example
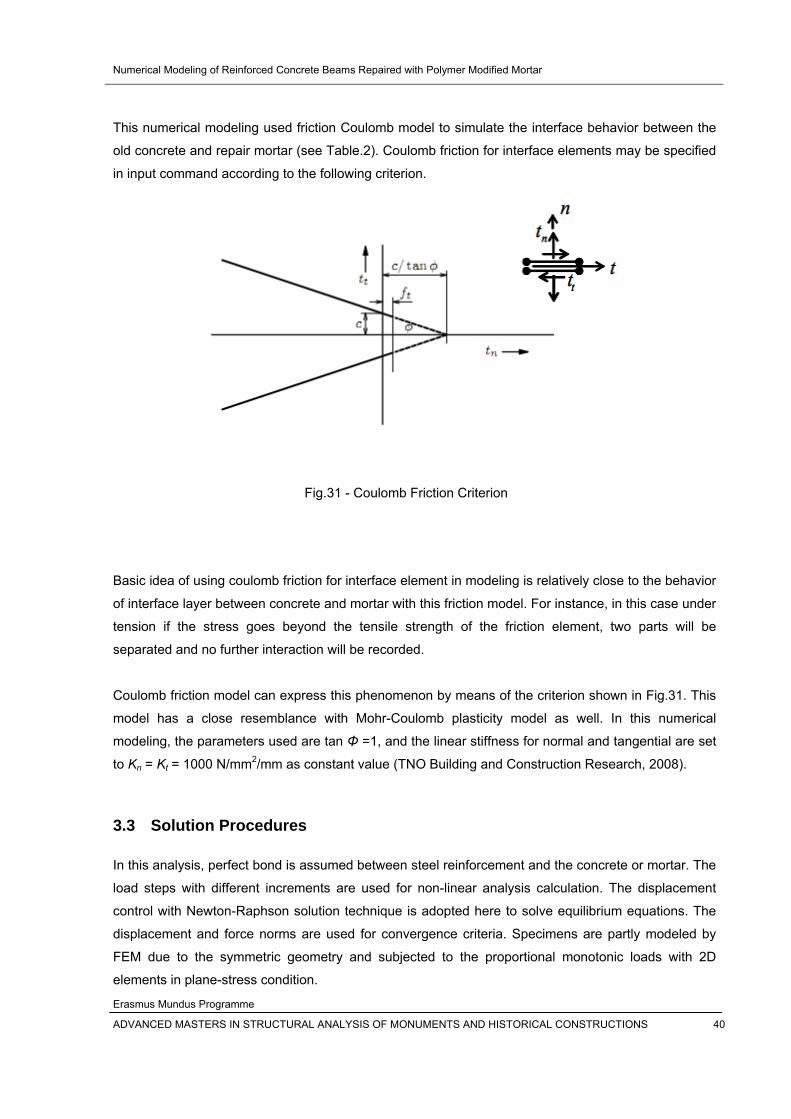
Numerical Modeling of Reinforced Concrete Beams Repaired with Polymer Modified Mortar
Erasmus Mundus Programme
ADVANCED MASTERS IN STRUCTURAL ANALYSIS OF MONUMENTS AND HISTORICAL CONSTRUCTIONS 40
This numerical modeling used friction Coulomb model to simulate the interface behavior between the
old concrete and repair mortar (see Table.2). Coulomb friction for interface elements may be specified
in input command according to the following criterion.
Fig.31 - Coulomb Friction Criterion
Basic idea of using coulomb friction for interface element in modeling is relatively close to the behavior
of interface layer between concrete and mortar with this friction model. For instance, in this case under
tension if the stress goes beyond the tensile strength of the friction element, two parts will be
separated and no further interaction will be recorded.
Coulomb friction model can express this phenomenon by means of the criterion shown in Fig.31. This
model has a close resemblance with Mohr-Coulomb plasticity model as well. In this numerical
modeling, the parameters used are tan Φ =1, and the linear stiffness for normal and tangential are set
to Kn = Kt = 1000 N/mm2/mm as constant value (TNO Building and Construction Research, 2008).
3.3 Solution Procedures
In this analysis, perfect bond is assumed between steel reinforcement and the concrete or mortar. The
load steps with different increments are used for non-linear analysis calculation. The displacement
control with Newton-Raphson solution technique is adopted here to solve equilibrium equations. The
displacement and force norms are used for convergence criteria. Specimens are partly modeled by
FEM due to the symmetric geometry and subjected to the proportional monotonic loads with 2D
elements in plane-stress condition.
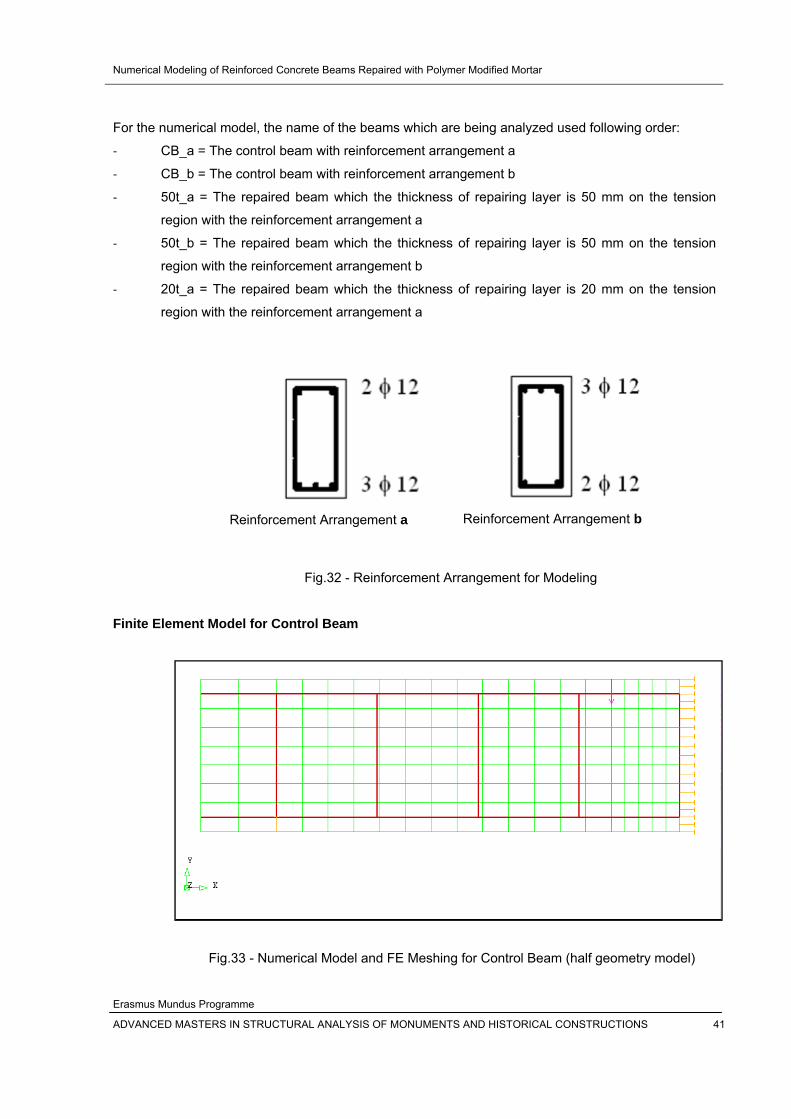
Numerical Modeling of Reinforced Concrete Beams Repaired with Polymer Modified Mortar
Erasmus Mundus Programme
ADVANCED MASTERS IN STRUCTURAL ANALYSIS OF MONUMENTS AND HISTORICAL CONSTRUCTIONS 41
For the numerical model, the name of the beams which are being analyzed used following order:
‐ CB_a = The control beam with reinforcement arrangement a
‐ CB_b = The control beam with reinforcement arrangement b
‐ 50t_a = The repaired beam which the thickness of repairing layer is 50 mm on the tension
region with the reinforcement arrangement a
‐ 50t_b = The repaired beam which the thickness of repairing layer is 50 mm on the tension
region with the reinforcement arrangement b
‐ 20t_a = The repaired beam which the thickness of repairing layer is 20 mm on the tension
region with the reinforcement arrangement a
Fig.32 - Reinforcement Arrangement for Modeling
Finite Element Model for Control Beam
Fig.33 - Numerical Model and FE Meshing for Control Beam (half geometry model)
Reinforcement Arrangement a Reinforcement Arrangement b
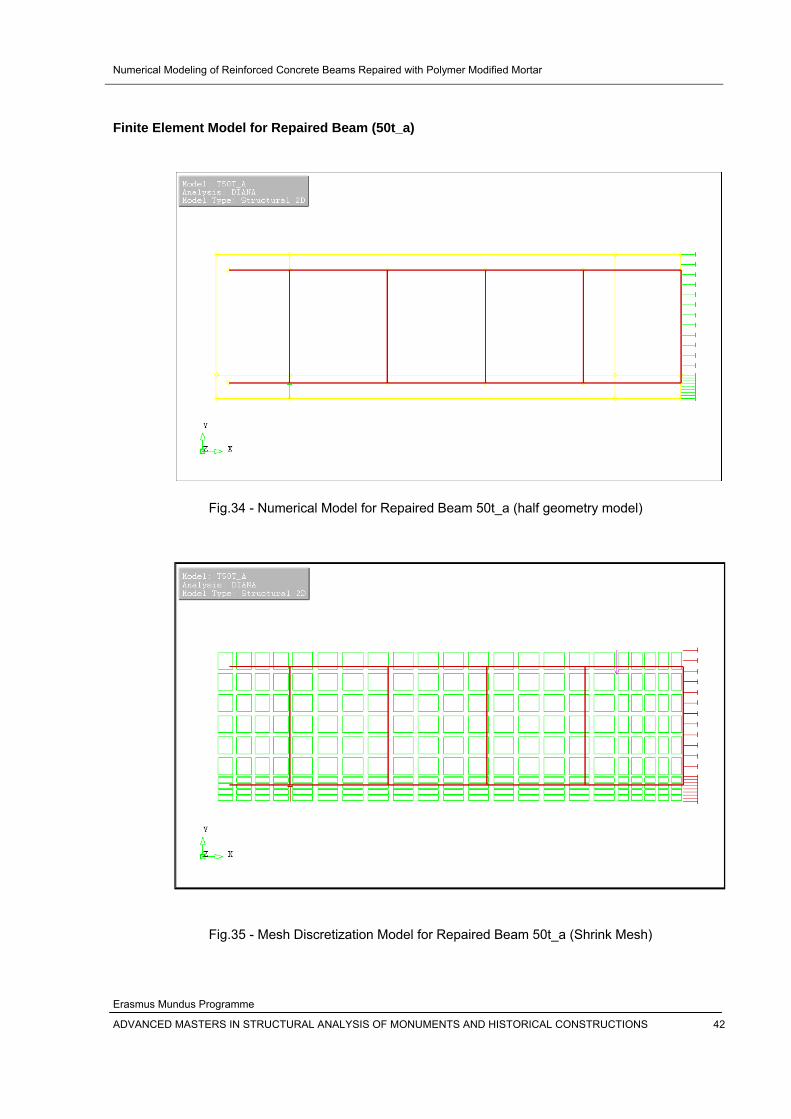
Numerical Modeling of Reinforced Concrete Beams Repaired with Polymer Modified Mortar
Erasmus Mundus Programme
ADVANCED MASTERS IN STRUCTURAL ANALYSIS OF MONUMENTS AND HISTORICAL CONSTRUCTIONS 42
Finite Element Model for Repaired Beam (50t_a)
Fig.34 - Numerical Model for Repaired Beam 50t_a (half geometry model)
Fig.35 - Mesh Discretization Model for Repaired Beam 50t_a (Shrink Mesh)
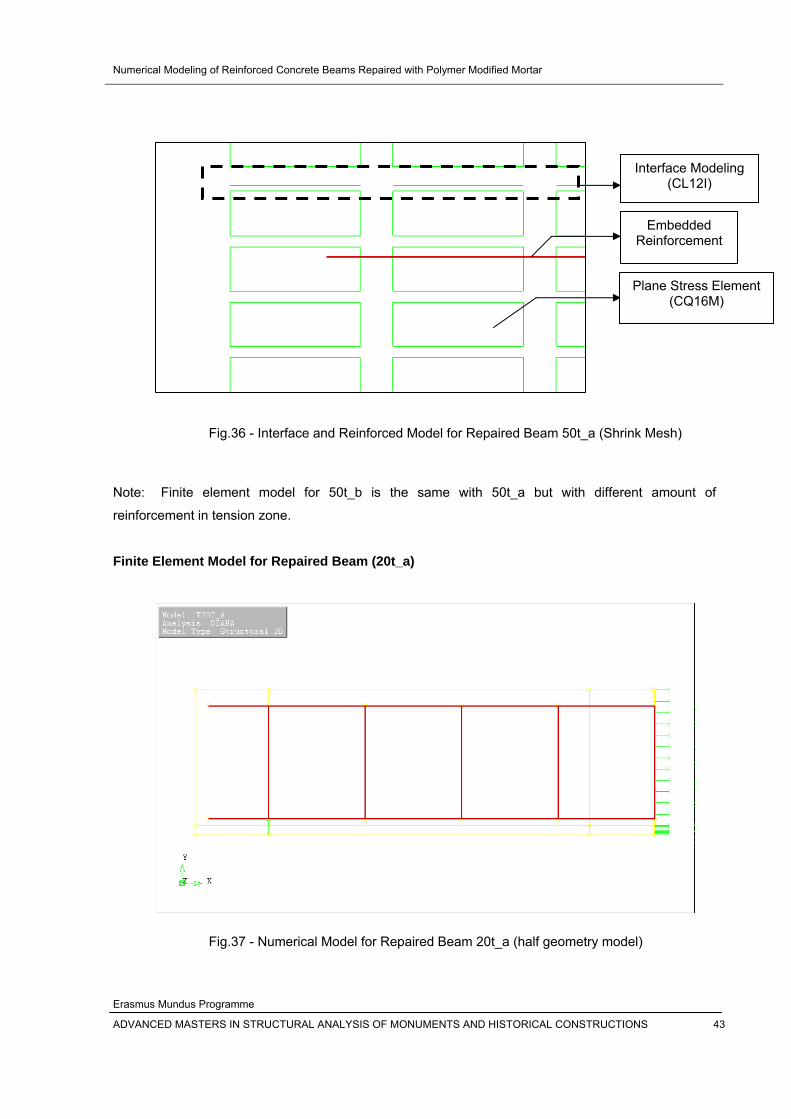
Numerical Modeling of Reinforced Concrete Beams Repaired with Polymer Modified Mortar
Erasmus Mundus Programme
ADVANCED MASTERS IN STRUCTURAL ANALYSIS OF MONUMENTS AND HISTORICAL CONSTRUCTIONS 43
Fig.36 - Interface and Reinforced Model for Repaired Beam 50t_a (Shrink Mesh)
Note: Finite element model for 50t_b is the same with 50t_a but with different amount of
reinforcement in tension zone.
Finite Element Model for Repaired Beam (20t_a)
Fig.37 - Numerical Model for Repaired Beam 20t_a (half geometry model)
Interface Modeling (CL12I)
Embedded Reinforcement
Plane Stress Element (CQ16M)
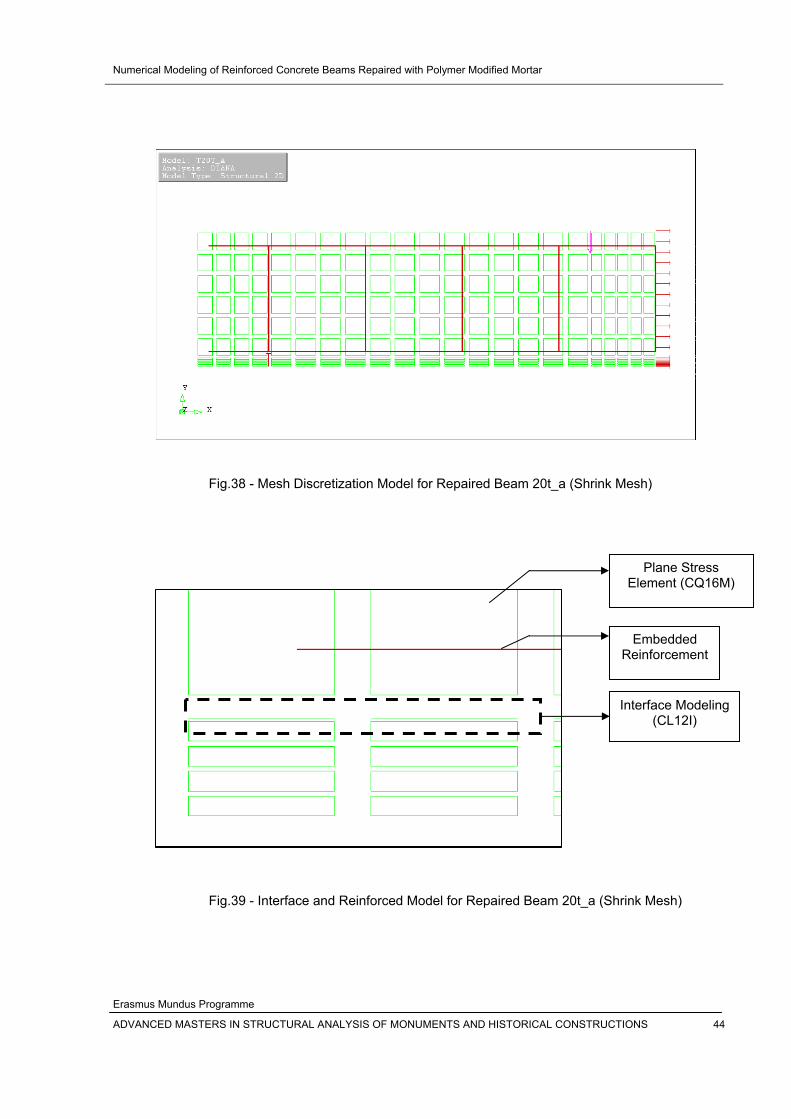
Numerical Modeling of Reinforced Concrete Beams Repaired with Polymer Modified Mortar
Erasmus Mundus Programme
ADVANCED MASTERS IN STRUCTURAL ANALYSIS OF MONUMENTS AND HISTORICAL CONSTRUCTIONS 44
Fig.38 - Mesh Discretization Model for Repaired Beam 20t_a (Shrink Mesh)
Fig.39 - Interface and Reinforced Model for Repaired Beam 20t_a (Shrink Mesh)
Interface Modeling (CL12I)
Embedded Reinforcement
Plane Stress Element (CQ16M)
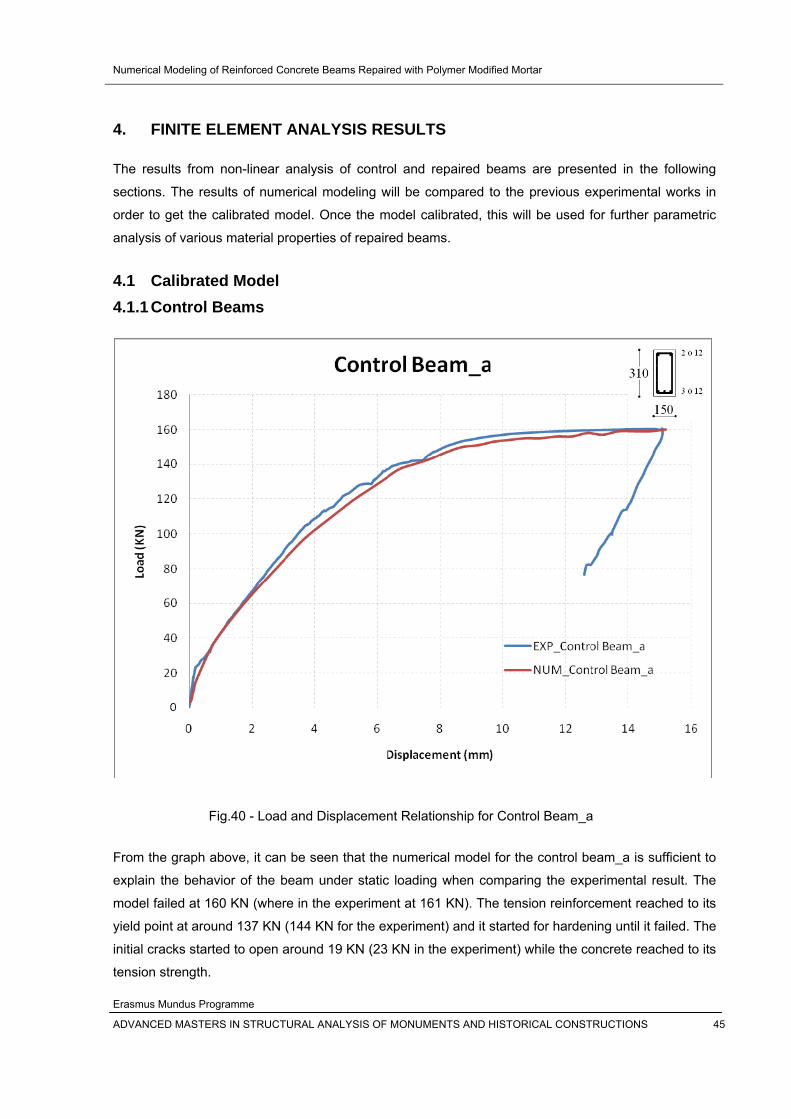
Numerical Modeling of Reinforced Concrete Beams Repaired with Polymer Modified Mortar
Erasmus Mundus Programme
ADVANCED MASTERS IN STRUCTURAL ANALYSIS OF MONUMENTS AND HISTORICAL CONSTRUCTIONS 45
4. FINITE ELEMENT ANALYSIS RESULTS
The results from non-linear analysis of control and repaired beams are presented in the following
sections. The results of numerical modeling will be compared to the previous experimental works in
order to get the calibrated model. Once the model calibrated, this will be used for further parametric
analysis of various material properties of repaired beams.
4.1 Calibrated Model 4.1.1 Control Beams
Fig.40 - Load and Displacement Relationship for Control Beam_a
From the graph above, it can be seen that the numerical model for the control beam_a is sufficient to
explain the behavior of the beam under static loading when comparing the experimental result. The
model failed at 160 KN (where in the experiment at 161 KN). The tension reinforcement reached to its
yield point at around 137 KN (144 KN for the experiment) and it started for hardening until it failed. The
initial cracks started to open around 19 KN (23 KN in the experiment) while the concrete reached to its
tension strength.
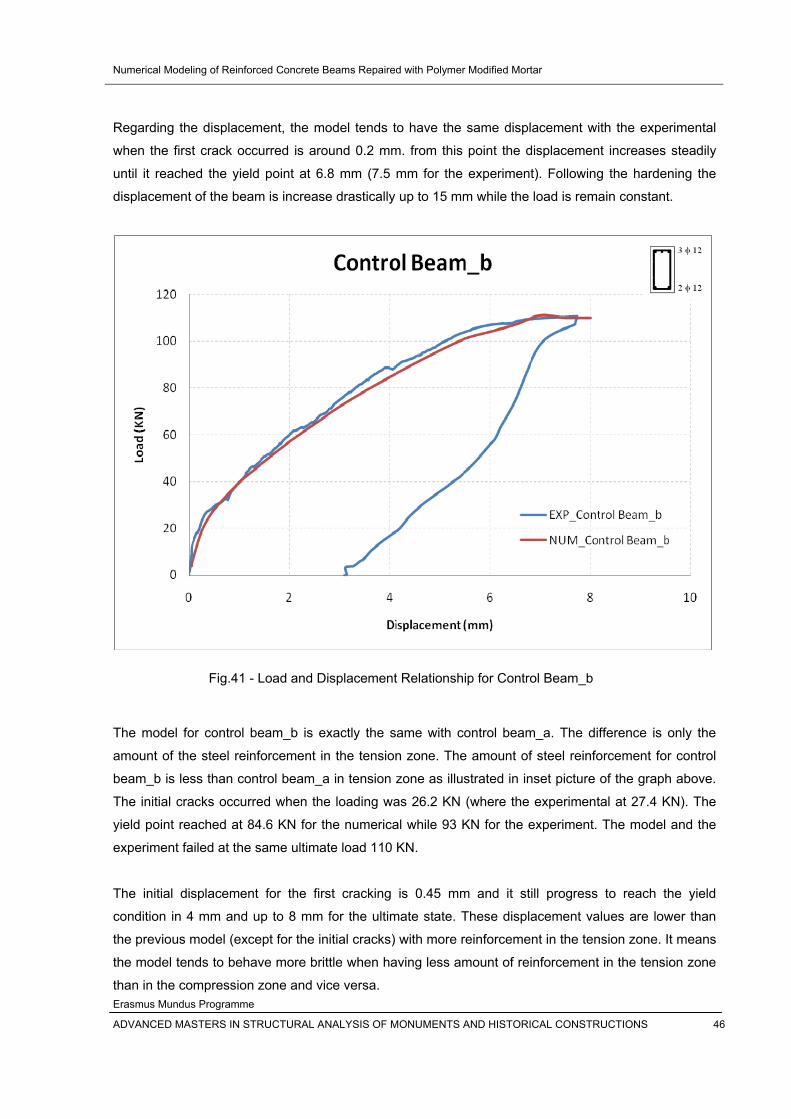
Numerical Modeling of Reinforced Concrete Beams Repaired with Polymer Modified Mortar
Erasmus Mundus Programme
ADVANCED MASTERS IN STRUCTURAL ANALYSIS OF MONUMENTS AND HISTORICAL CONSTRUCTIONS 46
Regarding the displacement, the model tends to have the same displacement with the experimental
when the first crack occurred is around 0.2 mm. from this point the displacement increases steadily
until it reached the yield point at 6.8 mm (7.5 mm for the experiment). Following the hardening the
displacement of the beam is increase drastically up to 15 mm while the load is remain constant.
Fig.41 - Load and Displacement Relationship for Control Beam_b
The model for control beam_b is exactly the same with control beam_a. The difference is only the
amount of the steel reinforcement in the tension zone. The amount of steel reinforcement for control
beam_b is less than control beam_a in tension zone as illustrated in inset picture of the graph above.
The initial cracks occurred when the loading was 26.2 KN (where the experimental at 27.4 KN). The
yield point reached at 84.6 KN for the numerical while 93 KN for the experiment. The model and the
experiment failed at the same ultimate load 110 KN.
The initial displacement for the first cracking is 0.45 mm and it still progress to reach the yield
condition in 4 mm and up to 8 mm for the ultimate state. These displacement values are lower than
the previous model (except for the initial cracks) with more reinforcement in the tension zone. It means
the model tends to behave more brittle when having less amount of reinforcement in the tension zone
than in the compression zone and vice versa.
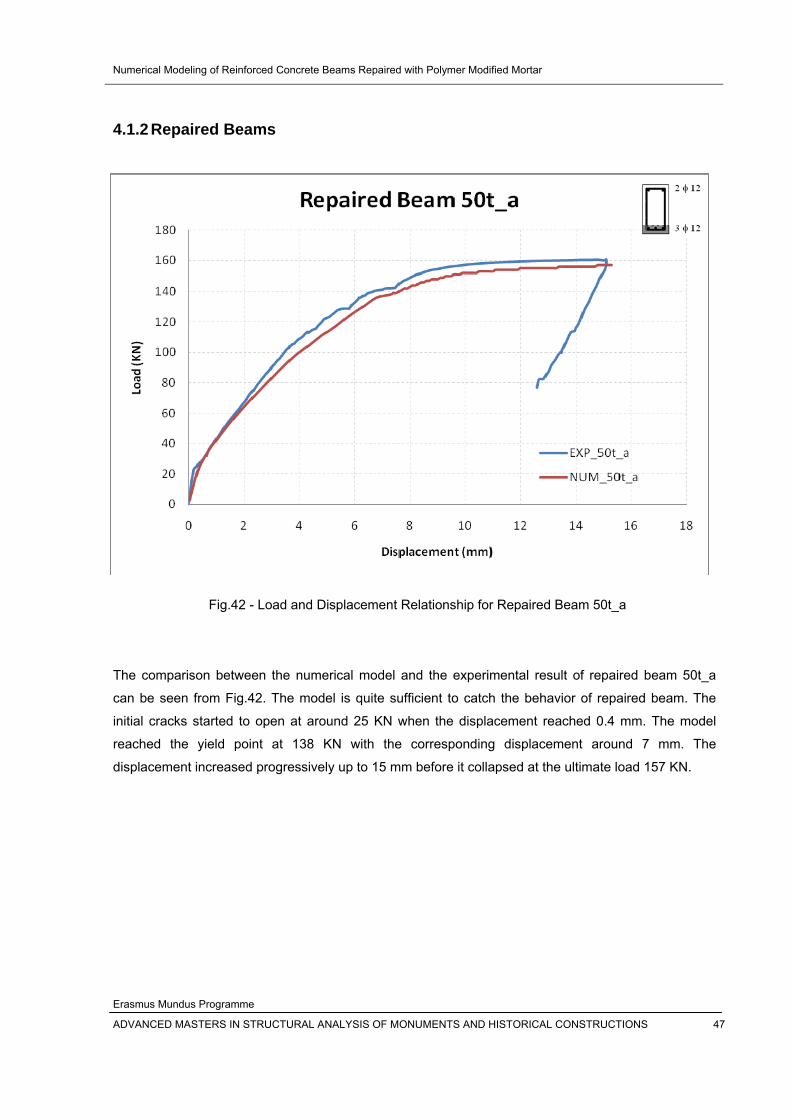
Numerical Modeling of Reinforced Concrete Beams Repaired with Polymer Modified Mortar
Erasmus Mundus Programme
ADVANCED MASTERS IN STRUCTURAL ANALYSIS OF MONUMENTS AND HISTORICAL CONSTRUCTIONS 47
4.1.2 Repaired Beams
Fig.42 - Load and Displacement Relationship for Repaired Beam 50t_a The comparison between the numerical model and the experimental result of repaired beam 50t_a
can be seen from Fig.42. The model is quite sufficient to catch the behavior of repaired beam. The
initial cracks started to open at around 25 KN when the displacement reached 0.4 mm. The model
reached the yield point at 138 KN with the corresponding displacement around 7 mm. The
displacement increased progressively up to 15 mm before it collapsed at the ultimate load 157 KN.
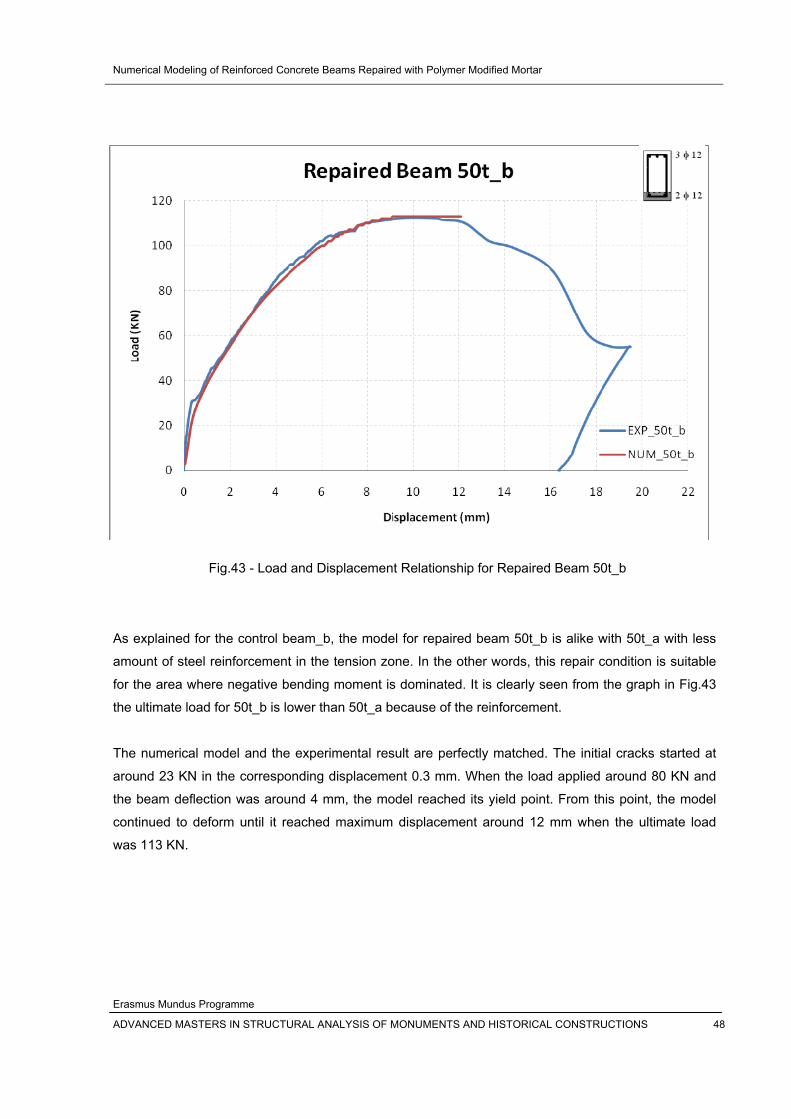
Numerical Modeling of Reinforced Concrete Beams Repaired with Polymer Modified Mortar
Erasmus Mundus Programme
ADVANCED MASTERS IN STRUCTURAL ANALYSIS OF MONUMENTS AND HISTORICAL CONSTRUCTIONS 48
Fig.43 - Load and Displacement Relationship for Repaired Beam 50t_b As explained for the control beam_b, the model for repaired beam 50t_b is alike with 50t_a with less
amount of steel reinforcement in the tension zone. In the other words, this repair condition is suitable
for the area where negative bending moment is dominated. It is clearly seen from the graph in Fig.43
the ultimate load for 50t_b is lower than 50t_a because of the reinforcement.
The numerical model and the experimental result are perfectly matched. The initial cracks started at
around 23 KN in the corresponding displacement 0.3 mm. When the load applied around 80 KN and
the beam deflection was around 4 mm, the model reached its yield point. From this point, the model
continued to deform until it reached maximum displacement around 12 mm when the ultimate load
was 113 KN.
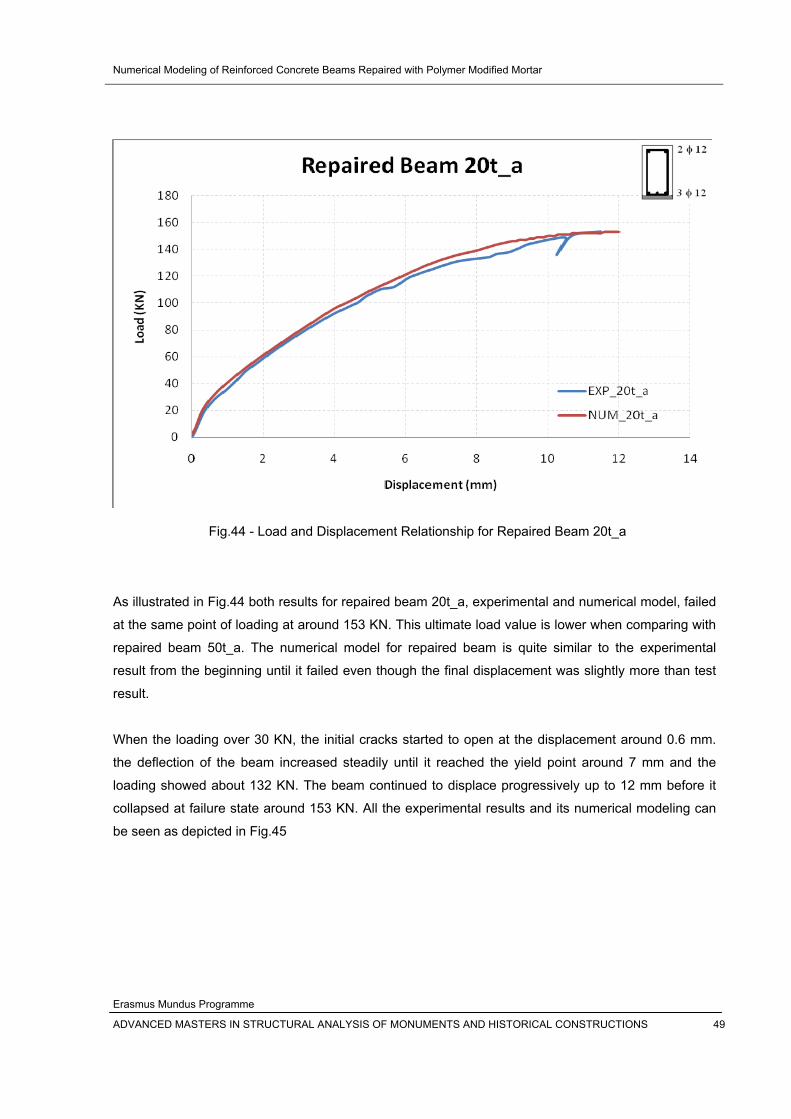
Numerical Modeling of Reinforced Concrete Beams Repaired with Polymer Modified Mortar
Erasmus Mundus Programme
ADVANCED MASTERS IN STRUCTURAL ANALYSIS OF MONUMENTS AND HISTORICAL CONSTRUCTIONS 49
Fig.44 - Load and Displacement Relationship for Repaired Beam 20t_a As illustrated in Fig.44 both results for repaired beam 20t_a, experimental and numerical model, failed
at the same point of loading at around 153 KN. This ultimate load value is lower when comparing with
repaired beam 50t_a. The numerical model for repaired beam is quite similar to the experimental
result from the beginning until it failed even though the final displacement was slightly more than test
result.
When the loading over 30 KN, the initial cracks started to open at the displacement around 0.6 mm.
the deflection of the beam increased steadily until it reached the yield point around 7 mm and the
loading showed about 132 KN. The beam continued to displace progressively up to 12 mm before it
collapsed at failure state around 153 KN. All the experimental results and its numerical modeling can
be seen as depicted in Fig.45
Numerical Modeling of Reinforced Concrete Beams Repaired with Polymer Modified Mortar
Erasmus Mundus Programme
ADVANCED MASTERS IN STRUCTURAL ANALYSIS OF MONUMENTS AND HISTORICAL CONSTRUCTIONS 50
Fig.45 - Load and Displacement Relationship for All Control Beams and Repaired Beams
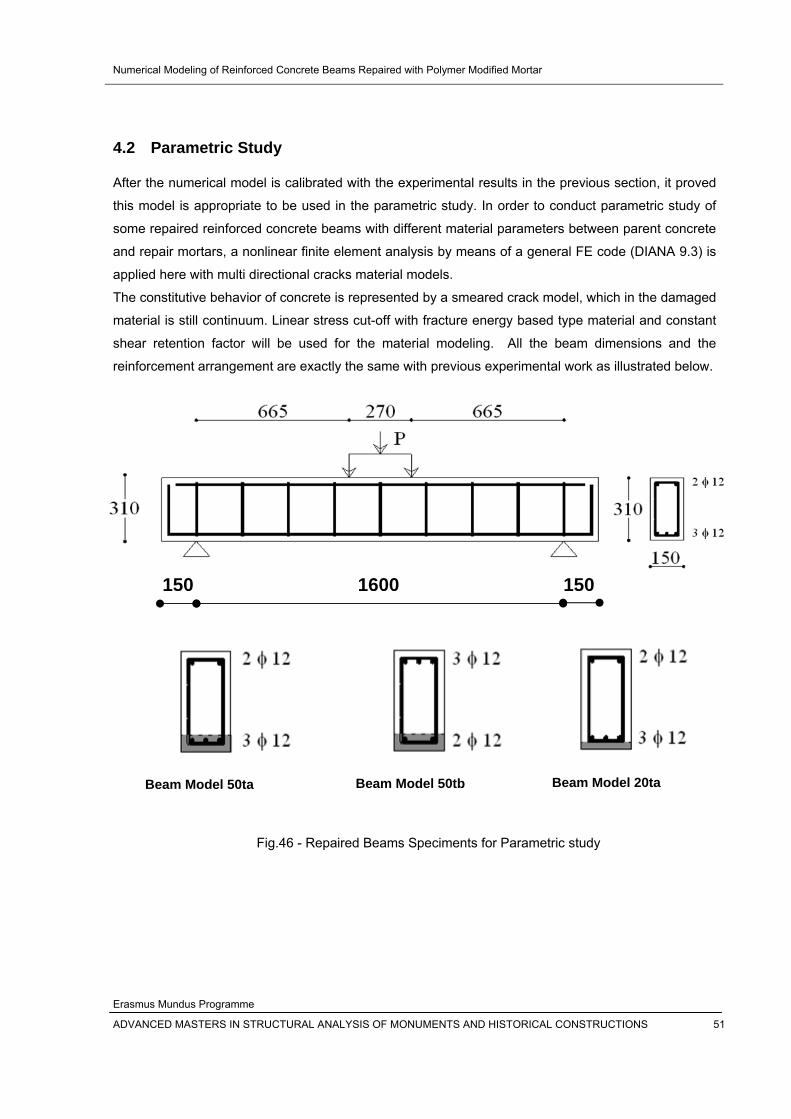
Numerical Modeling of Reinforced Concrete Beams Repaired with Polymer Modified Mortar
Erasmus Mundus Programme
ADVANCED MASTERS IN STRUCTURAL ANALYSIS OF MONUMENTS AND HISTORICAL CONSTRUCTIONS 51
4.2 Parametric Study After the numerical model is calibrated with the experimental results in the previous section, it proved
this model is appropriate to be used in the parametric study. In order to conduct parametric study of
some repaired reinforced concrete beams with different material parameters between parent concrete
and repair mortars, a nonlinear finite element analysis by means of a general FE code (DIANA 9.3) is
applied here with multi directional cracks material models.
The constitutive behavior of concrete is represented by a smeared crack model, which in the damaged
material is still continuum. Linear stress cut-off with fracture energy based type material and constant
shear retention factor will be used for the material modeling. All the beam dimensions and the
reinforcement arrangement are exactly the same with previous experimental work as illustrated below.
Fig.46 - Repaired Beams Speciments for Parametric study
150 1600 150
Beam Model 50ta Beam Model 50tb Beam Model 20ta
Numerical Modeling of Reinforced Concrete Beams Repaired with Polymer Modified Mortar
Erasmus Mundus Programme
ADVANCED MASTERS IN STRUCTURAL ANALYSIS OF MONUMENTS AND HISTORICAL CONSTRUCTIONS 52
This parametric study evaluates the relationships between concrete materials and repairing materials
as well. This study evaluates the behavior of repaired concrete beam with different concrete and
repairing mortar properties. The properties from concrete and repairing mortars which are used in the
analysis based on European Code (EC2-EN-1992-2003). Concrete and repairing mortar material
properties used the same values. These parameters combined each other to get the behavior
relationships between concrete and its repairing materials.
CONCRETE MATERIAL PROPERTIES
fck (MPa) 8 12 16 20 25
fctm (Mpa) 1.2 1.6 1.9 2.2 2.9
Ecm (Gpa) 25 27 29 30 31
REPAIRING MORTAR MATERIAL PROPERTIES
fck (MPa) 8 12 16 20 25
fctm (Mpa) 1.2 1.6 1.9 2.2 2.9
Ecm (Gpa) 25 27 29 30 31
Table.3 - The Properties of Concrete and Repairing Mortar (EC2-EN-1992-2003) PARAMETRIC STUDY RESULTS The non-linear analysis for each combination was carried out, and the result of the analysis is
presented in the following section. For this parametric study, the name of the models which are being
analyzed used the previous order (see section 3.3) with additional following order, first index is
compressive strength of the parent concrete and the second is compressive strength of repairing layer
as explained below.
50ta_8_8 ………………. Compressive strength of concrete is 8 MPa and also for repairing mortar
50ta_8_12 …………….. Compressive strength of concrete is 8 MPa and for repairing mortar is 12
MPa, and so on.
Numerical Modeling of Reinforced Concrete Beams Repaired with Polymer Modified Mortar
Erasmus Mundus Programme
ADVANCED MASTERS IN STRUCTURAL ANALYSIS OF MONUMENTS AND HISTORICAL CONSTRUCTIONS 53
4.2.1 Repaired Beam Models 50ta
Fig.47 - The Ultimate Load of Repaired Beam Model 50ta in Combination with Different Compressive Strength of Repairing Mortar
It can be seen in Fig.47. The ultimate load of repaired beam model 50ta tended to increase parallel
with increasing the compressive strength of the mortar. This graph indicates that all beams model 50ta
show the load raise significantly when using higher strength of the mortar. In the other words, higher
strength of mortar more high the ultimate load of the repaired beam. Above Figure shows the similar
tendency occurred for all repaired beam in state of the ultimate load when the higher compressive
strength of mortar applied.
Numerical Modeling of Reinforced Concrete Beams Repaired with Polymer Modified Mortar
Erasmus Mundus Programme
ADVANCED MASTERS IN STRUCTURAL ANALYSIS OF MONUMENTS AND HISTORICAL CONSTRUCTIONS 54
4.2.2 Repaired Beam Models 20ta
Fig.48 - The Ultimate Load of Repaired Beam Model 20ta in Combination with Different Compressive Strength of Repairing Mortar
Repaired beam models 20ta have different characteristics with 50ta. It shows very interesting results
regarding its ultimate load. The repaired beam 20ta_8 did not increase the capacity when it was
combined with the compressive strength of mortar between 12-20 MPa. For 20ta_12 is between 16-20
MPa, for 20ta_16 and 20ta_20 are between 8-12 MPa, and the last model 20ta_20 is between 8-16
MPa.
Numerical Modeling of Reinforced Concrete Beams Repaired with Polymer Modified Mortar
Erasmus Mundus Programme
ADVANCED MASTERS IN STRUCTURAL ANALYSIS OF MONUMENTS AND HISTORICAL CONSTRUCTIONS 55
4.2.3 Repaired Beam Models 50tb
Fig.49 - The Ultimate Load of Repaired Beam Model 50tb
in Combination with Different Compressive Strength of Repairing Mortar
As illustrated in Fig.49, the repaired beam models 50tb is quite similar with 50ta in the previous Figure.
Both of models exhibit a typical behavior in flexure. The only difference is the value of ultimate load
which was determined by the reinforcement ratio in the tension region. The ultimate load for 50ta is
136 KN and 50tb is 96 KN. This condition is obvious considering the different amount of reinforcement
in the tension zone.
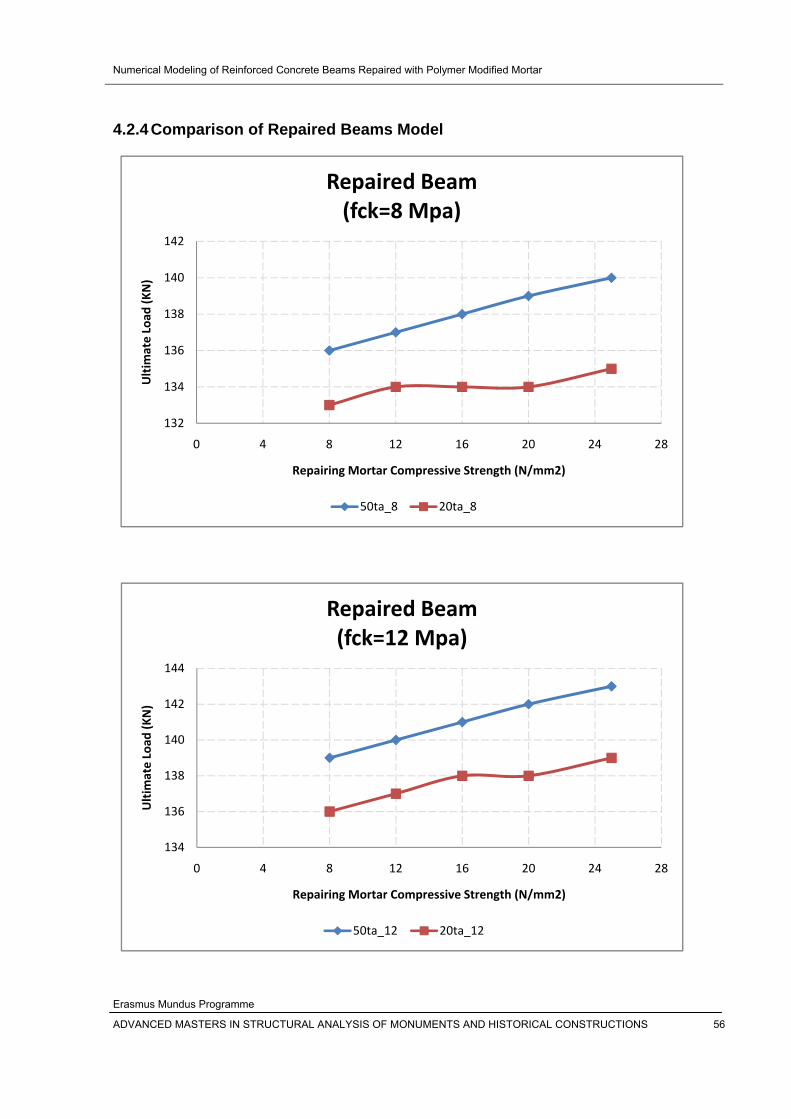
Numerical Modeling of Reinforced Concrete Beams Repaired with Polymer Modified Mortar
Erasmus Mundus Programme
ADVANCED MASTERS IN STRUCTURAL ANALYSIS OF MONUMENTS AND HISTORICAL CONSTRUCTIONS 56
4.2.4 Comparison of Repaired Beams Model
134
136
138
140
142
144
0 4 8 12 16 20 24 28
Ultim
ate Load
(KN)
Repairing Mortar Compressive Strength (N/mm2)
Repaired Beam(fck=12 Mpa)
50ta_12 20ta_12
132
134
136
138
0 4 8 12 16 20 24 28
Ultim
ate Load
(KN)
Repairing Mortar Compressive Strength (N/mm2)
Repaired Beam(fck=8 Mpa)
140
142
50ta_8 20ta_8
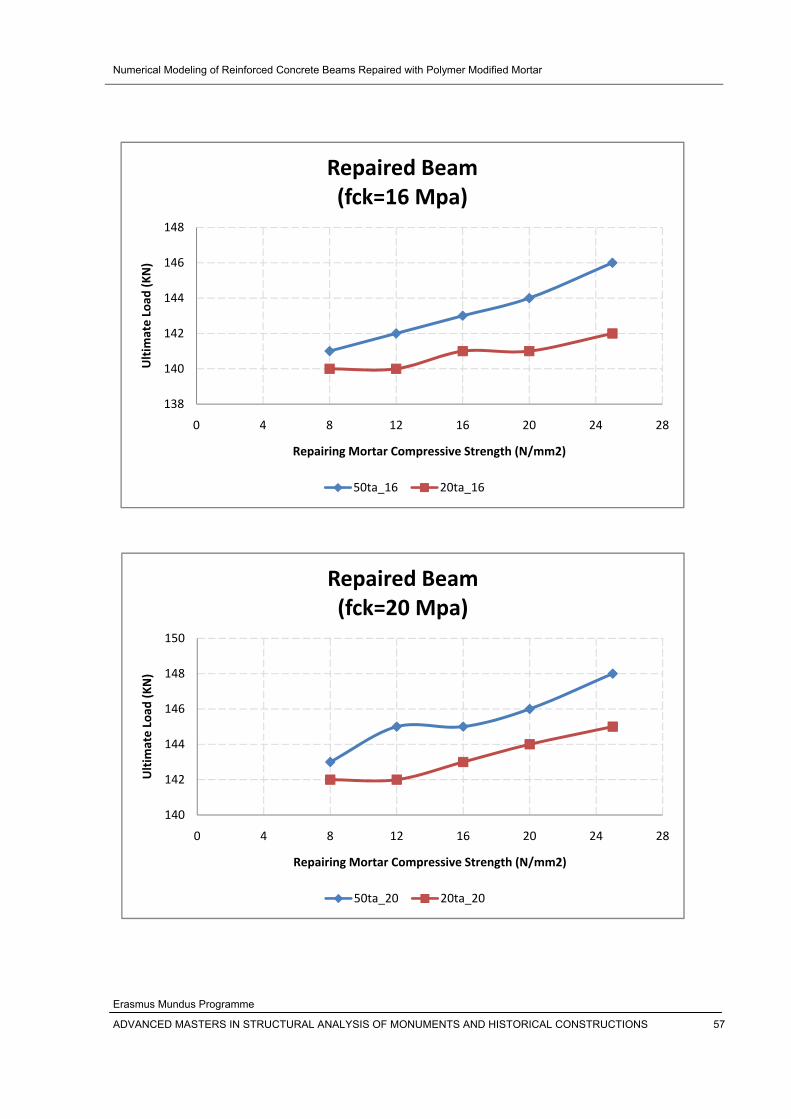
Numerical Modeling of Reinforced Concrete Beams Repaired with Polymer Modified Mortar
Erasmus Mundus Programme
ADVANCED MASTERS IN STRUCTURAL ANALYSIS OF MONUMENTS AND HISTORICAL CONSTRUCTIONS 57
138
140
142
144
146
148
0 4 8 12 16 20 24 28
Repairing Mortar Compressive Strength (N/mm2)
Repaired Beam(fck=16 Mpa)
Ultim
ate Load
(KN)
50ta_16 20ta_16
140
142
144
146
148
150
0 4 8 12 16 20 24 28
Ultim
ate Load
(KN)
Repairing Mortar Compressive Strength (N/mm2)
Repaired Beam(fck=20 Mpa)
50ta_20 20ta_20
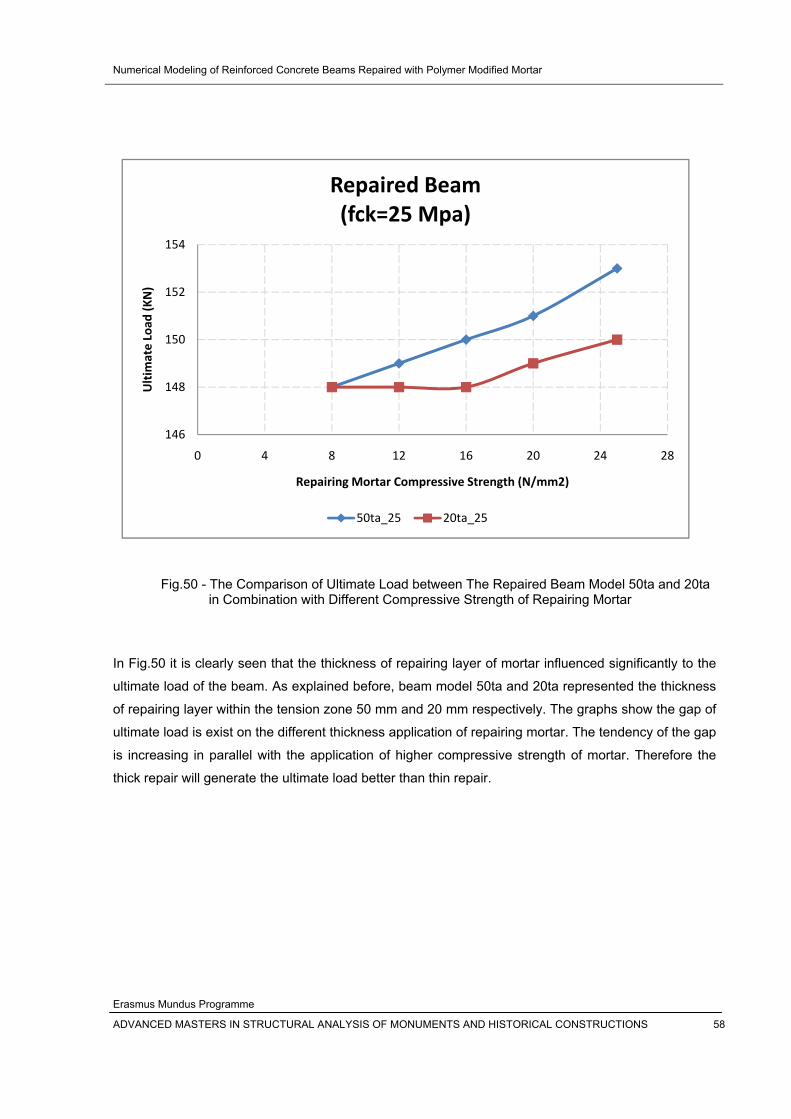
Numerical Modeling of Reinforced Concrete Beams Repaired with Polymer Modified Mortar
Erasmus Mundus Programme
ADVANCED MASTERS IN STRUCTURAL ANALYSIS OF MONUMENTS AND HISTORICAL CONSTRUCTIONS 58
Fig.50 - The Comparison of Ultimate Load between The Repaired Beam Model 50ta and 20ta in Combination with Different Compressive Strength of Repairing Mortar
In Fig.50 it is clearly seen that the thickness of repairing layer of mortar influenced significantly to the
ultimate load of the beam. As explained before, beam model 50ta and 20ta represented the thickness
of repairing layer within the tension zone 50 mm and 20 mm respectively. The graphs show the gap of
ultimate load is exist on the different thickness application of repairing mortar. The tendency of the gap
is increasing in parallel with the application of higher compressive strength of mortar. Therefore the
thick repair will generate the ultimate load better than thin repair.
146
148
150
152
154
0 4 8 12 16 20 24 28
Ultim
ate Load
(KN)
Repairing Mortar Compressive Strength (N/mm2)
Repaired Beam(fck=25 Mpa)
50ta_25 20ta_25
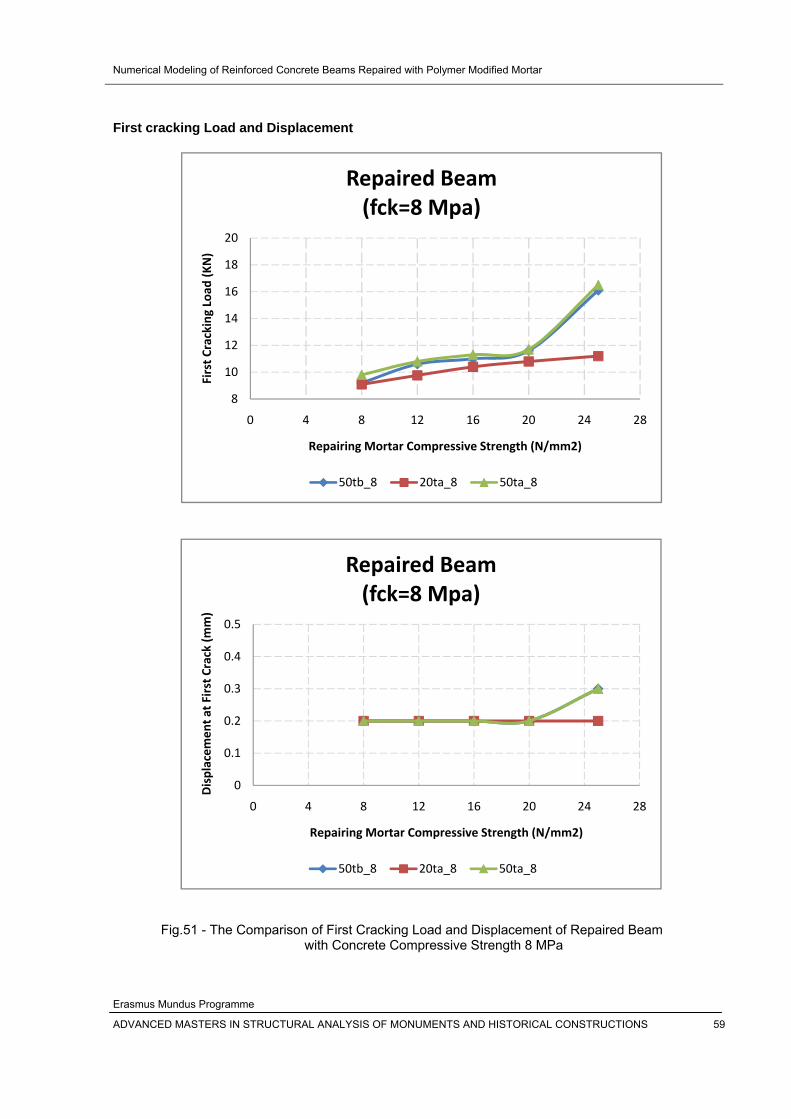
Numerical Modeling of Reinforced Concrete Beams Repaired with Polymer Modified Mortar
Erasmus Mundus Programme
ADVANCED MASTERS IN STRUCTURAL ANALYSIS OF MONUMENTS AND HISTORICAL CONSTRUCTIONS 59
First cracking Load and Displacement
Fig.51 - The Comparison of First Cracking Load and Displacement of Repaired Beam with Concrete Compressive Strength 8 MPa
8
10
12
14
16
18
20
0 4 8 12 16 20 24 2
First C
racking Load
(KN)
Repairing Mortar Compressive Strength (N/mm2)
Repaired Beam(fck=8 Mpa)
8
50tb_8 20ta_8 50ta_8
0
0.1
0.2
0.3
0.4
0.5
0 4 8 12 16 20 24 28
Displacem
ent a
t First C
rack (m
m)
Repairing Mortar Compressive Strength (N/mm2)
Repaired Beam(fck=8 Mpa)
50tb_8 20ta_8 50ta_8
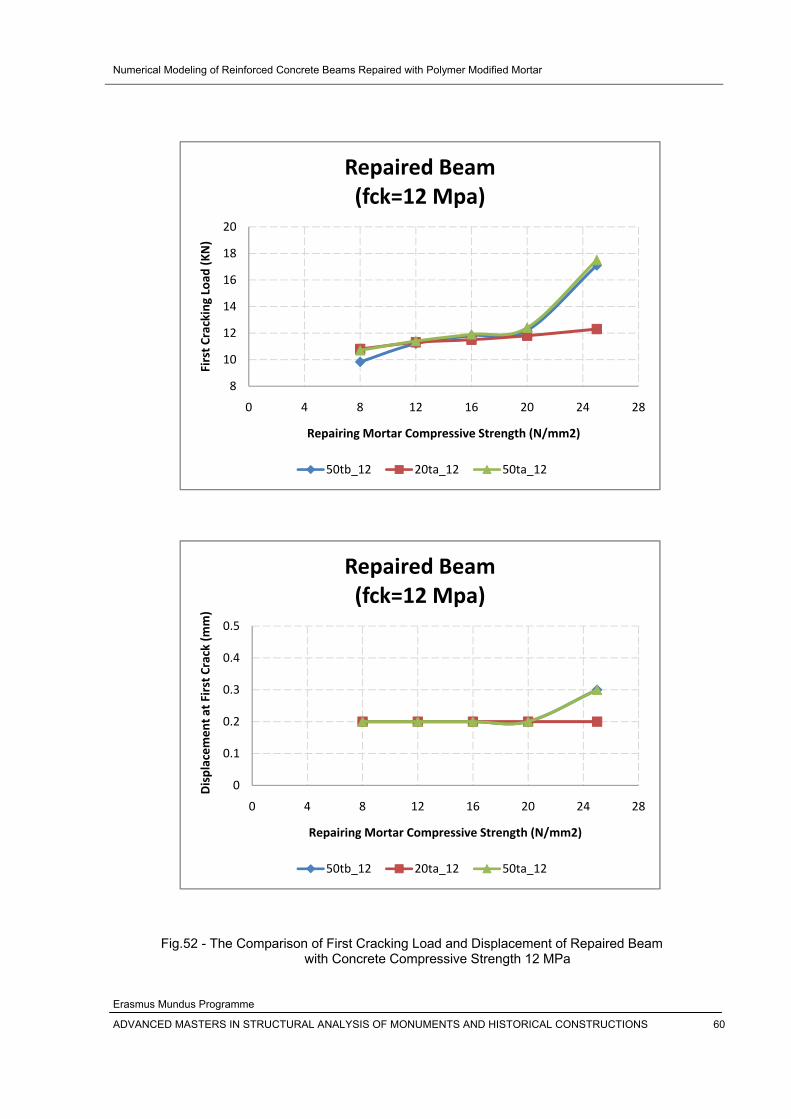
Numerical Modeling of Reinforced Concrete Beams Repaired with Polymer Modified Mortar
Erasmus Mundus Programme
ADVANCED MASTERS IN STRUCTURAL ANALYSIS OF MONUMENTS AND HISTORICAL CONSTRUCTIONS 60
Fig.52 - The Comparison of First Cracking Load and Displacement of Repaired Beam
with Concrete Compressive Strength 12 MPa
8
10
12
14
16
18
20
0 4 8 12 16 20 24 2
First C
racking Load
(KN)
Repairing Mortar Compressive Strength (N/mm2)
Repaired Beam(fck=12 Mpa)
8
50tb_12 20ta_12 50ta_12
0
0.1
0.2
0.3
0.4
0.5
0 4 8 12 16 20 24 28
Displacem
ent a
t First C
rack (m
m)
Repairing Mortar Compressive Strength (N/mm2)
Repaired Beam(fck=12 Mpa)
50tb_12 20ta_12 50ta_12
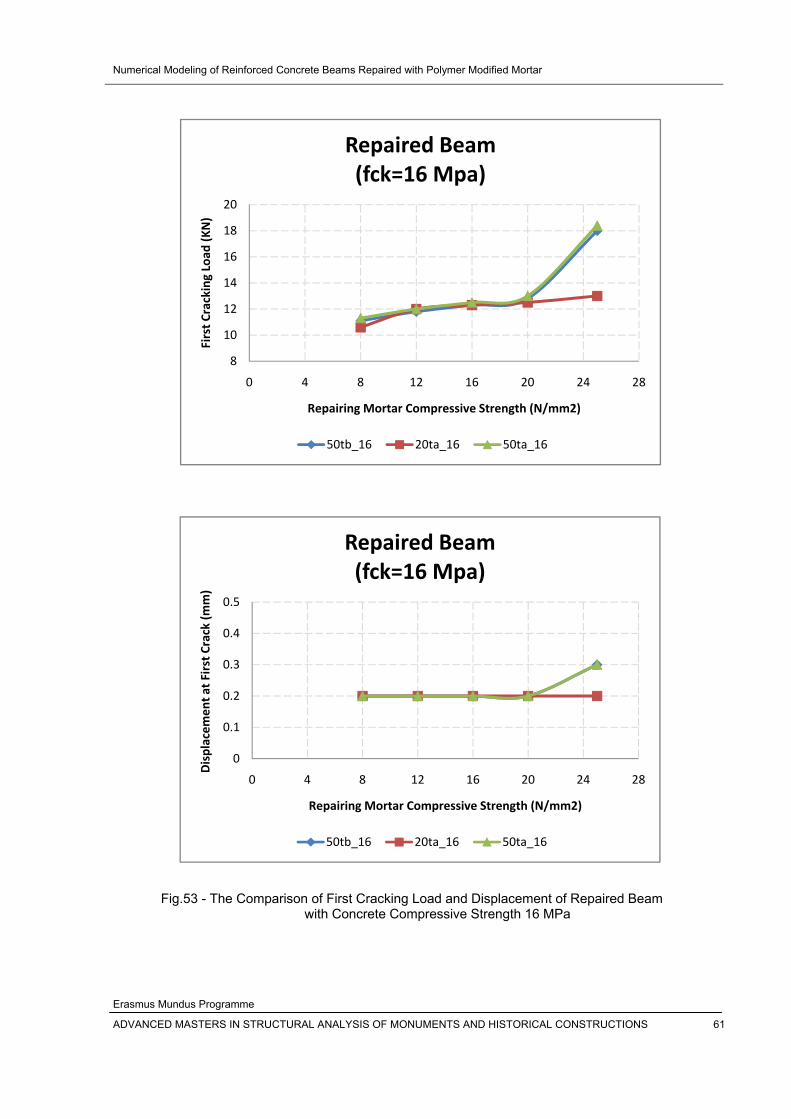
Numerical Modeling of Reinforced Concrete Beams Repaired with Polymer Modified Mortar
Erasmus Mundus Programme
ADVANCED MASTERS IN STRUCTURAL ANALYSIS OF MONUMENTS AND HISTORICAL CONSTRUCTIONS 61
Fig.53 - The Comparison of First Cracking Load and Displacement of Repaired Beam
with Concrete Compressive Strength 16 MPa
8
10
12
14
16
18
20
0 4 8 12 16 20 24 28
First C
racking Load
(KN)
Repairing Mortar Compressive Strength (N/mm2)
Repaired Beam(fck=16 Mpa)
50tb_16 20ta_16 50ta_16
0
0.1
0.2
0.3
0.4
0.5
0 4 8 12 16 20 24 2
Displacem
ent a
t First C
rack (m
m)
Repairing Mortar Compressive Strength (N/mm2)
Repaired Beam(fck=16 Mpa)
8
50tb_16 20ta_16 50ta_16
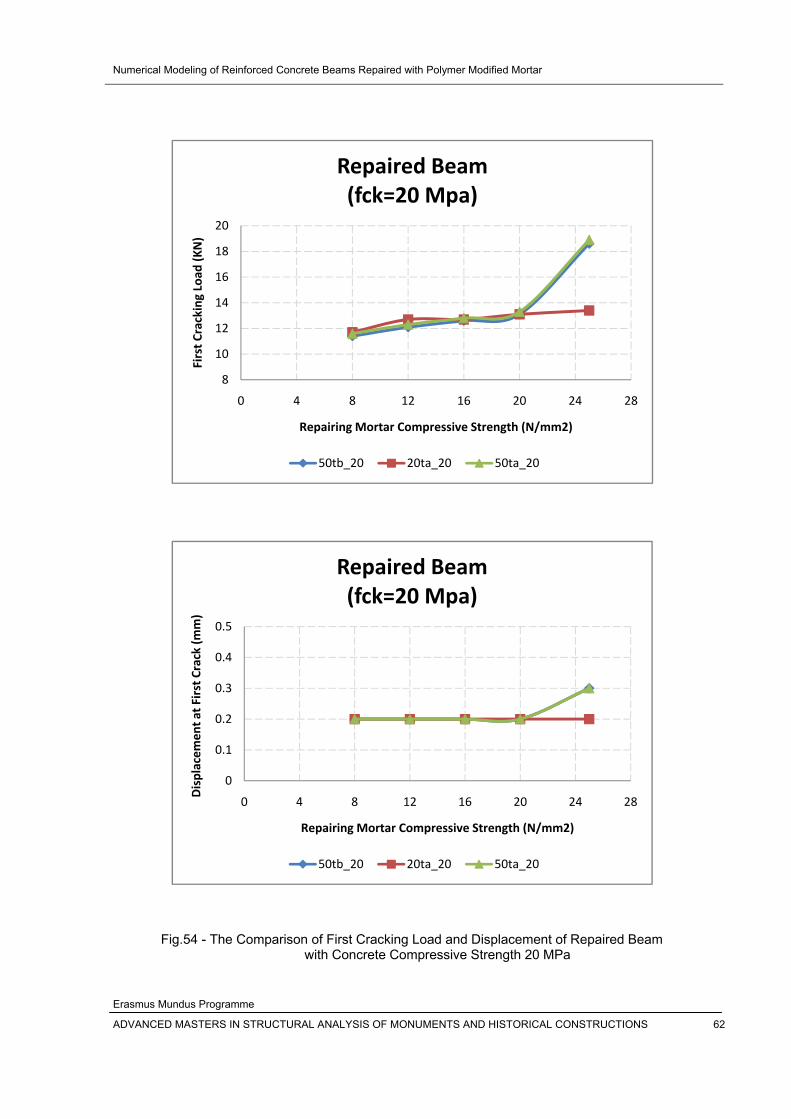
Numerical Modeling of Reinforced Concrete Beams Repaired with Polymer Modified Mortar
Erasmus Mundus Programme
ADVANCED MASTERS IN STRUCTURAL ANALYSIS OF MONUMENTS AND HISTORICAL CONSTRUCTIONS 62
Fig.54 - The Comparison of First Cracking Load and Displacement of Repaired Beam
with Concrete Compressive Strength 20 MPa
8
10
12
14
16
18
20
0 4 8 12 16 20 24
First C
racking Load
(KN)
Repairing Mortar Compressive Strength (N/mm2)
Repaired Beam(fck=20 Mpa)
28
50tb_20 20ta_20 50ta_20
0
0.1
0.2
0.3
0.4
0.5
0 4 8 12 16 20 24 28
Displacem
ent a
t First C
rack (m
m)
Repairing Mortar Compressive Strength (N/mm2)
Repaired Beam(fck=20 Mpa)
50tb_20 20ta_20 50ta_20
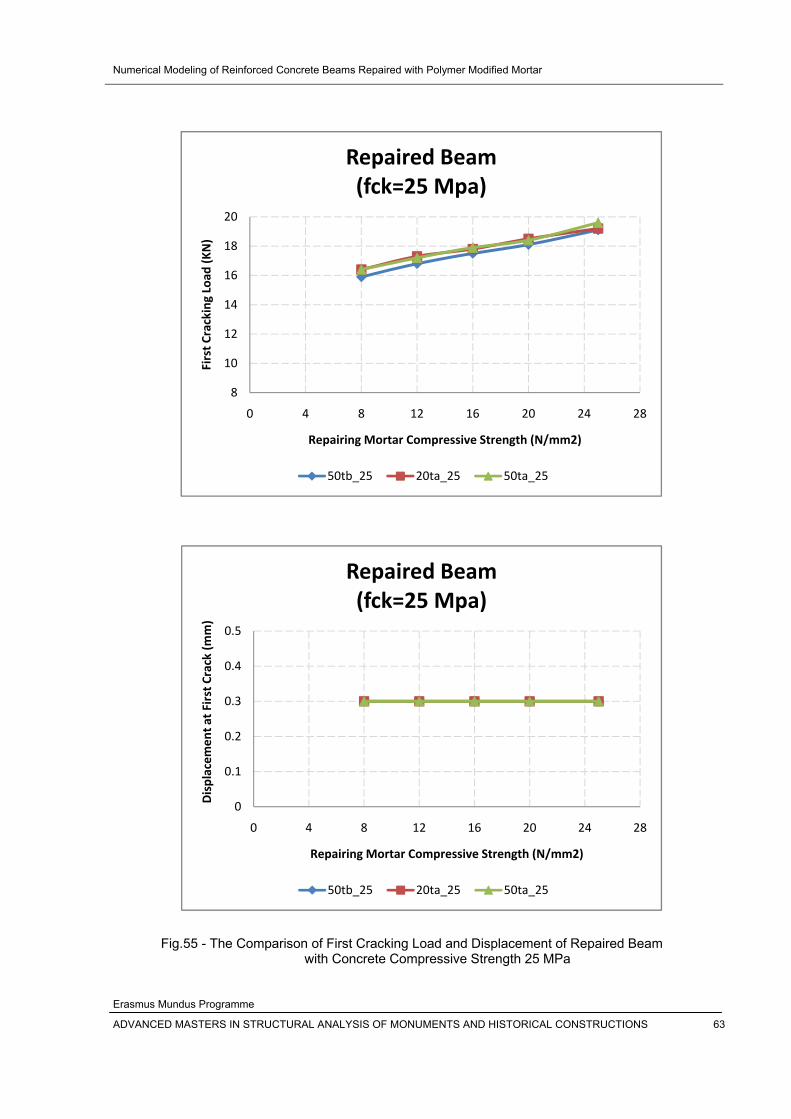
Numerical Modeling of Reinforced Concrete Beams Repaired with Polymer Modified Mortar
Erasmus Mundus Programme
ADVANCED MASTERS IN STRUCTURAL ANALYSIS OF MONUMENTS AND HISTORICAL CONSTRUCTIONS 63
Fig.55 - The Comparison of First Cracking Load and Displacement of Repaired Beam
with Concrete Compressive Strength 25 MPa
8
10
12
14
16
18
20
0 4 8 12 16 20 24 2
First C
racking Load
(KN)
Repairing Mortar Compressive Strength (N/mm2)
(fck=25 Mpa)
8
Repaired Beam
50tb_25 20ta_25 50ta_25
0
0.1
0.2
0.3
0.4
0.5
0 4 8 12 16 20 24 28
Displacem
ent a
t First C
rack (m
m)
Repairing Mortar Compressive Strength (N/mm2)
Repaired Beam(fck=25 Mpa)
50tb_25 20ta_25 50ta_25
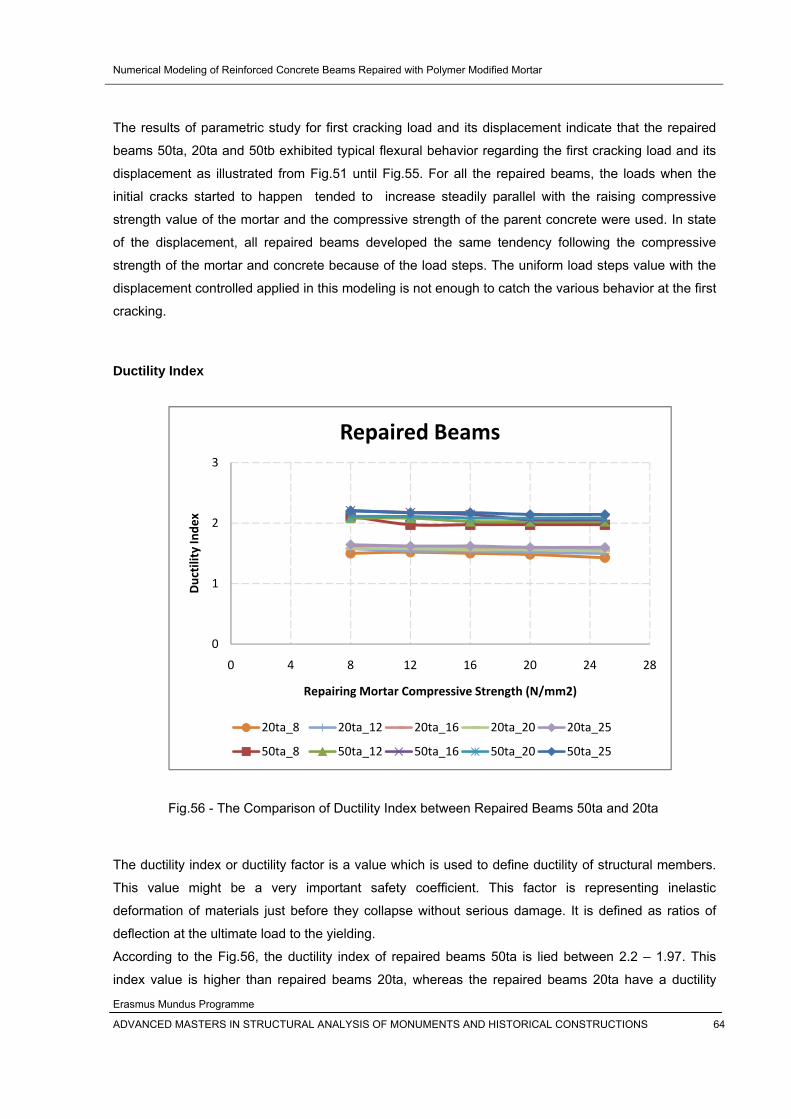
Numerical Modeling of Reinforced Concrete Beams Repaired with Polymer Modified Mortar
Erasmus Mundus Programme
ADVANCED MASTERS IN STRUCTURAL ANALYSIS OF MONUMENTS AND HISTORICAL CONSTRUCTIONS 64
The results of parametric study for first cracking load and its displacement indicate that the repaired
beams 50ta, 20ta and 50tb exhibited typical flexural behavior regarding the first cracking load and its
displacement as illustrated from Fig.51 until Fig.55. For all the repaired beams, the loads when the
initial cracks started to happen tended to increase steadily parallel with the raising compressive
strength value of the mortar and the compressive strength of the parent concrete were used. In state
of the displacement, all repaired beams developed the same tendency following the compressive
strength of the mortar and concrete because of the load steps. The uniform load steps value with the
displacement controlled applied in this modeling is not enough to catch the various behavior at the first
cracking.
Ductility Index
Fig.56 - The Comparison of Ductility Index between Repaired Beams 50ta and 20ta
The ductility index or ductility factor is a value which is used to define ductility of structural members.
This value might be a very important safety coefficient. This factor is representing inelastic
deformation of materials just before they collapse without serious damage. It is defined as ratios of
deflection at the ultimate load to the yielding.
According to the Fig.56, the ductility index of repaired beams 50ta is lied between 2.2 – 1.97. This
index value is higher than repaired beams 20ta, whereas the repaired beams 20ta have a ductility
0
1
2
3
0 4 8 12 16 20 24 28
Ductility Inde
x
Repairing Mortar Compressive Strength (N/mm2)
Repaired Beams
20ta_8 20ta_12 20ta_16 20ta_20 20ta_25
50ta_8 50ta_12 50ta_16 50ta_20 50ta_25
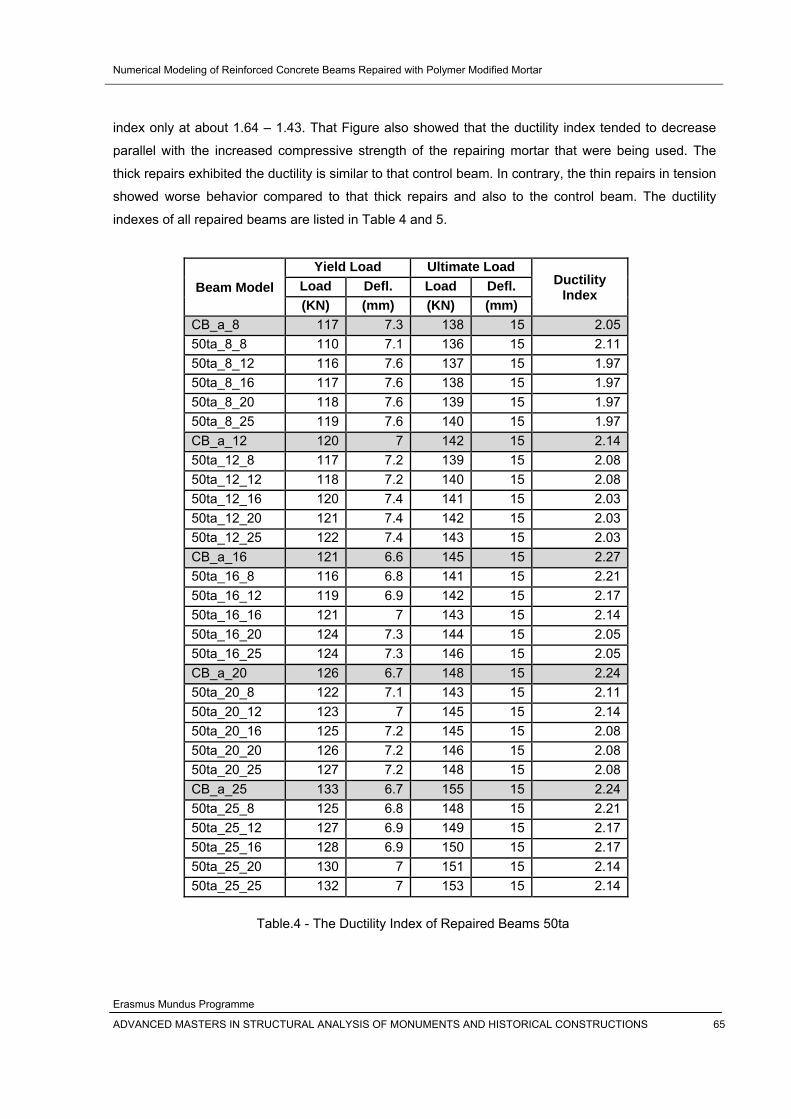
Numerical Modeling of Reinforced Concrete Beams Repaired with Polymer Modified Mortar
Erasmus Mundus Programme
ADVANCED MASTERS IN STRUCTURAL ANALYSIS OF MONUMENTS AND HISTORICAL CONSTRUCTIONS 65
index only at about 1.64 – 1.43. That Figure also showed that the ductility index tended to decrease
parallel with the increased compressive strength of the repairing mortar that were being used. The
thick repairs exhibited the ductility is similar to that control beam. In contrary, the thin repairs in tension
showed worse behavior compared to that thick repairs and also to the control beam. The ductility
indexes of all repaired beams are listed in Table 4 and 5.
Beam Model Yield Load Ultimate Load
Ductility Index Load Defl. Load Defl.
(KN) (mm) (KN) (mm) CB_a_8 117 7.3 138 15 2.05 50ta_8_8 110 7.1 136 15 2.11 50ta_8_12 116 7.6 137 15 1.97 50ta_8_16 117 7.6 138 15 1.97 50ta_8_20 118 7.6 139 15 1.97 50ta_8_25 119 7.6 140 15 1.97 CB_a_12 120 7 142 15 2.14 50ta_12_8 117 7.2 139 15 2.08 50ta_12_12 118 7.2 140 15 2.08 50ta_12_16 120 7.4 141 15 2.03 50ta_12_20 121 7.4 142 15 2.03 50ta_12_25 122 7.4 143 15 2.03 CB_a_16 121 6.6 145 15 2.27 50ta_16_8 116 6.8 141 15 2.21 50ta_16_12 119 6.9 142 15 2.17 50ta_16_16 121 7 143 15 2.14 50ta_16_20 124 7.3 144 15 2.05 50ta_16_25 124 7.3 146 15 2.05 CB_a_20 126 6.7 148 15 2.24 50ta_20_8 122 7.1 143 15 2.11 50ta_20_12 123 7 145 15 2.14 50ta_20_16 125 7.2 145 15 2.08 50ta_20_20 126 7.2 146 15 2.08 50ta_20_25 127 7.2 148 15 2.08 CB_a_25 133 6.7 155 15 2.24 50ta_25_8 125 6.8 148 15 2.21 50ta_25_12 127 6.9 149 15 2.17 50ta_25_16 128 6.9 150 15 2.17 50ta_25_20 130 7 151 15 2.14 50ta_25_25 132 7 153 15 2.14
Table.4 - The Ductility Index of Repaired Beams 50ta
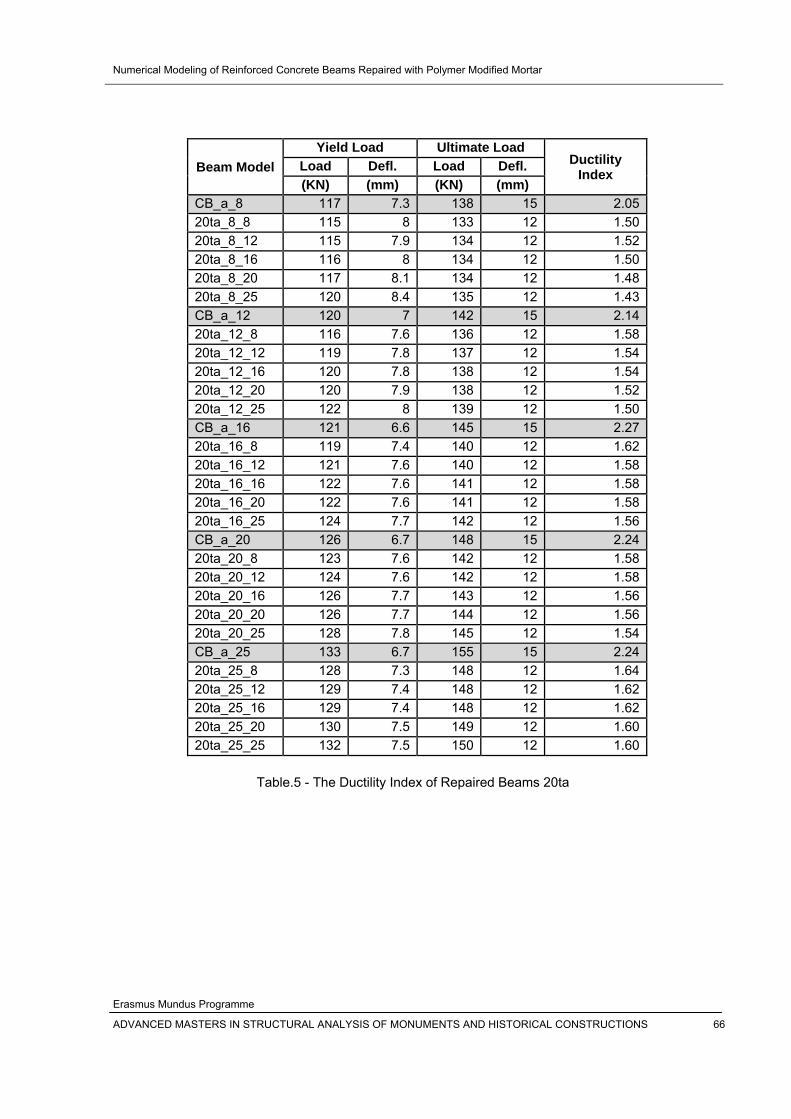
Numerical Modeling of Reinforced Concrete Beams Repaired with Polymer Modified Mortar
Erasmus Mundus Programme
ADVANCED MASTERS IN STRUCTURAL ANALYSIS OF MONUMENTS AND HISTORICAL CONSTRUCTIONS 66
Beam Model Yield Load Ultimate Load
Ductility Index Load Defl. Load Defl.
(KN) (mm) (KN) (mm) CB_a_8 117 7.3 138 15 2.05 20ta_8_8 115 8 133 12 1.50 20ta_8_12 115 7.9 134 12 1.52 20ta_8_16 116 8 134 12 1.50 20ta_8_20 117 8.1 134 12 1.48 20ta_8_25 120 8.4 135 12 1.43 CB_a_12 120 7 142 15 2.14 20ta_12_8 116 7.6 136 12 1.58 20ta_12_12 119 7.8 137 12 1.54 20ta_12_16 120 7.8 138 12 1.54 20ta_12_20 120 7.9 138 12 1.52 20ta_12_25 122 8 139 12 1.50 CB_a_16 121 6.6 145 15 2.27 20ta_16_8 119 7.4 140 12 1.62 20ta_16_12 121 7.6 140 12 1.58 20ta_16_16 122 7.6 141 12 1.58 20ta_16_20 122 7.6 141 12 1.58 20ta_16_25 124 7.7 142 12 1.56 CB_a_20 126 6.7 148 15 2.24 20ta_20_8 123 7.6 142 12 1.58 20ta_20_12 124 7.6 142 12 1.58 20ta_20_16 126 7.7 143 12 1.56 20ta_20_20 126 7.7 144 12 1.56 20ta_20_25 128 7.8 145 12 1.54 CB_a_25 133 6.7 155 15 2.24 20ta_25_8 128 7.3 148 12 1.64 20ta_25_12 129 7.4 148 12 1.62 20ta_25_16 129 7.4 148 12 1.62 20ta_25_20 130 7.5 149 12 1.60 20ta_25_25 132 7.5 150 12 1.60
Table.5 - The Ductility Index of Repaired Beams 20ta
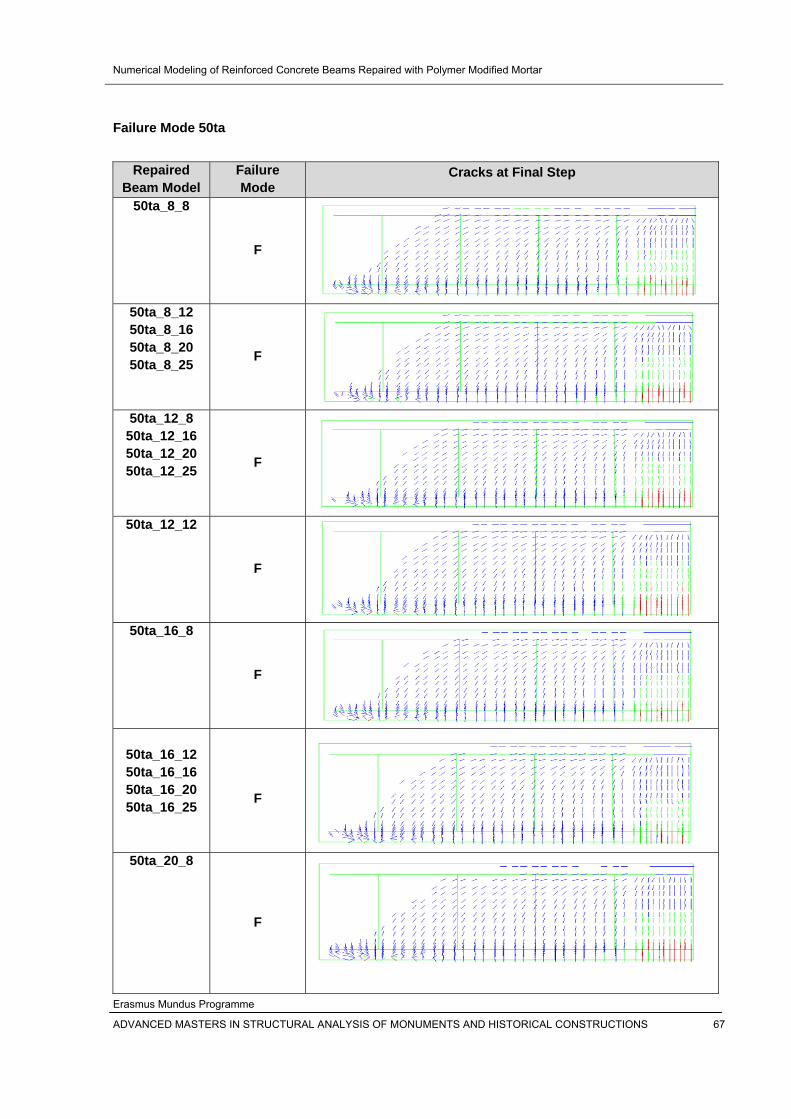
Numerical Modeling of Reinforced Concrete Beams Repaired with Polymer Modified Mortar
Erasmus Mundus Programme
ADVANCED MASTERS IN STRUCTURAL ANALYSIS OF MONUMENTS AND HISTORICAL CONSTRUCTIONS 67
Failure Mode 50ta
Repaired Beam Model
Failure Mode
Cracks at Final Step
50ta_8_8
F
50ta_8_12 50ta_8_16 50ta_8_20 50ta_8_25
F
50ta_12_8
50ta_12_20 F
50ta_12_16
50ta_12_25
50ta_12_12
F
50ta_16_8
F
50ta_16_12
50ta_16_25
F
50ta_16_16 50ta_16_20
50ta_20_8
F
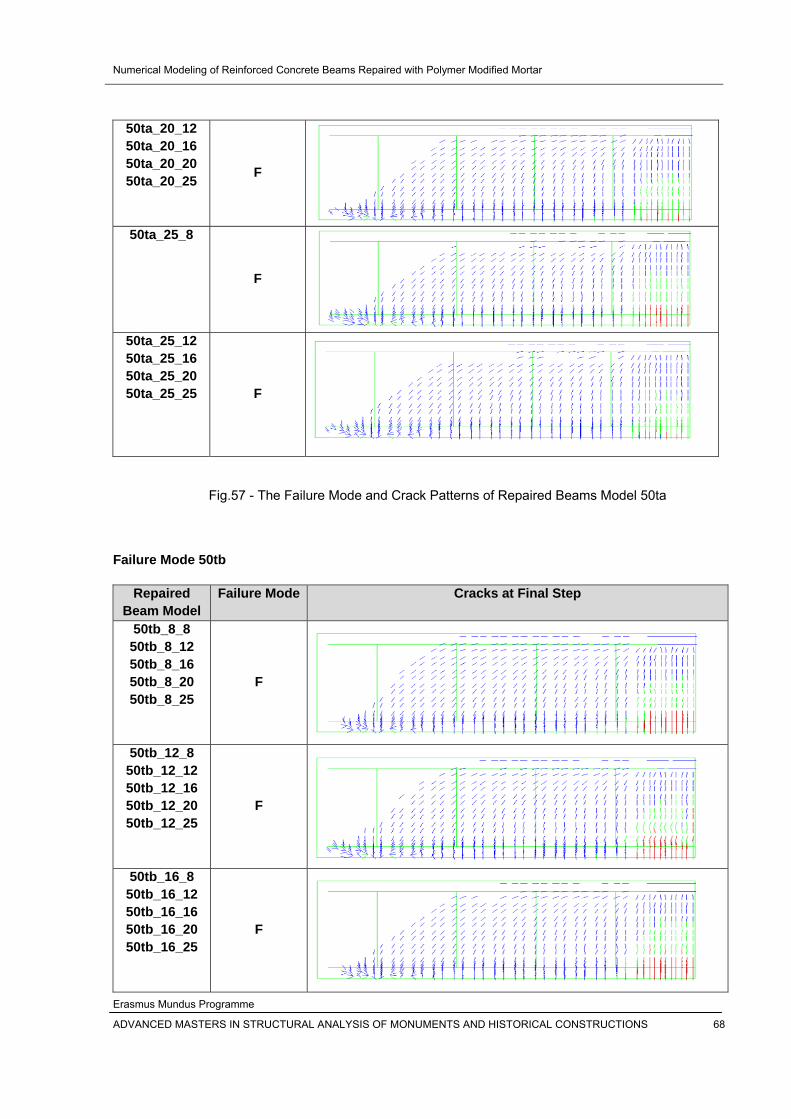
Numerical Modeling of Reinforced Concrete Beams Repaired with Polymer Modified Mortar
Erasmus Mundus Programme
ADVANCED MASTERS IN STRUCTURAL ANALYSIS OF MONUMENTS AND HISTORICAL CONSTRUCTIONS 68
Fig.57 - The Failure Mode and Crack Patterns of Repaired Beams Model 50ta Failure Mode 50tb
Repaired
Beam Model Failure Mode Cracks at Final Step
50tb 8_8 50tb 12 50tb 16 50tb 20 50tb_8_25
F
__8__8__8_
50tb_12_8 50tb_12_12 50tb_12_16 50tb_12_20 50tb_12_25
F
50tb _8 _16_12 _16_16
50tb
F
_1650tb50tb50tb_16_20
_16_25
50ta_20_12 50ta_20_16 50ta_20_20 50ta_20_25
F
50ta_25_8
F
50ta_25_12 50ta_25_16
50ta_25_25
50ta_25_20
F
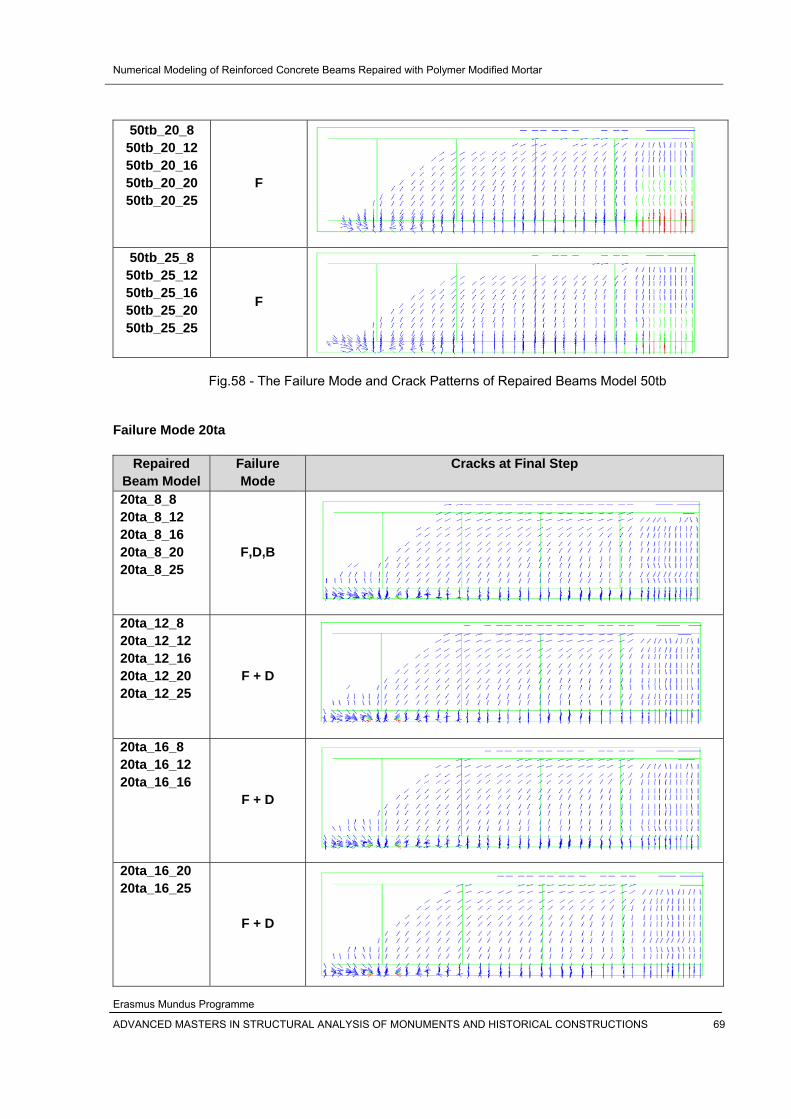
Numerical Modeling of Reinforced Concrete Beams Repaired with Polymer Modified Mortar
Erasmus Mundus Programme
ADVANCED MASTERS IN STRUCTURAL ANALYSIS OF MONUMENTS AND HISTORICAL CONSTRUCTIONS 69
50tb _8 50tb_20_12 50tb_20_16 50tb_20_20 50tb_20_25
F
_20
50tb_25_8 50tb_25_12 50tb_25_16 50tb_25_20 50tb_25_25
F
Fig.58 - The Failure Mode and Crack Patterns of Repaired Beams Model 50tb
Failure Mode 20ta
Repaired
Beam Model Failure Mode
Cracks at Final Step
20ta_8_8 20ta_8_12 20ta_8_16 20ta_8_20
F,D,B
20ta_8_25
20ta_12_8 2020ta220ta_12_25
F + D
ta_12_12
_12_16 0ta_12_20
2220ta
F + D
0ta_16_8 0ta_16_12
_16_16
22
F + D
0ta_16_20 0ta_16_25
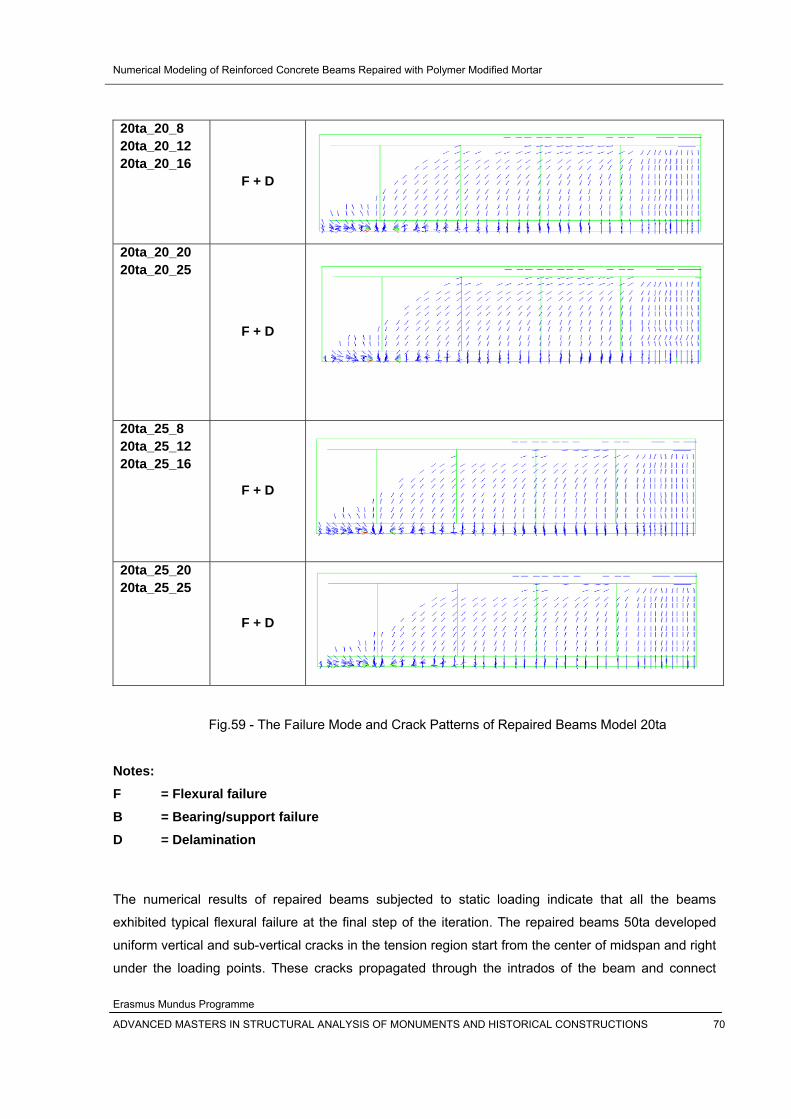
Numerical Modeling of Reinforced Concrete Beams Repaired with Polymer Modified Mortar
Erasmus Mundus Programme
ADVANCED MASTERS IN STRUCTURAL ANALYSIS OF MONUMENTS AND HISTORICAL CONSTRUCTIONS 70
220ta_20_12
0ta_20_16
F + D
0ta_20_8
2
220ta_20_25
F + D
0ta_20_20
222
F + D
0ta_25_8 0ta_25_12 0ta_25_16
220ta_25_25
F + D
0ta_25_20
Fig.59 - The Failure Mode and Crack Patterns of Repaired Beams Model 20ta
NF = Flexural failure B = Bearing/support failure
= Delamination
lts of repaired beams subjected to static loading indicate that all the beams
exhibited typical flexural failure at the final step of the iteration. The repaired beams 50ta developed
u d al cracks in the tension reg r of midspan and right
unde poi se cracks propagated through the intrados of the beam and connect
otes:
D
The numerical resu
niform vertical an
r the loading
sub-vertic
nts. The
ion start from the cente
Numerical Modeling of Reinforced Concrete Beams Repaired with Polymer Modified Mortar
Erasmus Mundus Programme
ADVANCED MASTERS IN STRUCTURAL ANALYSIS OF MONUMENTS AND HISTORICAL CONSTRUCTIONS 71
each other to the different face of the beam. These passed away the interface layer between concrete
a nd did not propagate along the horizontal direction of the interface, because of this
reason the delamination of the repairing layer did not occur. The stress concentration of the bearing
o e to numerical limitation modeling at the beams support when the lowest compressive
s e morta for pairing.
For beams 50tb, however, developed the cracks at the same pattern and location with 50ta. These
vertical and sub-vertical cracks propagated uniformly through intrados of the beams to find the new
equilibrium until it connected each other on the opposite side of the beam. The delamination and the
failure ring did not occur even though using the lowest compressive strength of the repairing
mortar. Thi e number of the cracks appeared at midspan of the beam before the stress
c zed at the support.
T eam 20ta had different behavior from the previous models. The cracks developed at
midspan and under two loading points. These cracks propagated through the beam intrados in the
t . When cros d the interface layer, the cracks propagated along the horizontal
d interface and split the mortar layer progressively until these localized at the support.
Consequently, both delamination and flexural failure occurred. For some repaired beams, the
delamination failure occured followed by the bearing failure due to stress concentration at the support.
This condition is due to numerical limitation modeling at the beams support when the lowest
c strength of the concrete and mortar were used for repairing. These caused bearing
f upporting point. All the failure modes and its crack patterns depicted from Fig.57 until
Fig.59.
4.3 Cyclic Load
In order to predict the fatigue life of repaired beams, the cyclic loading with number of cycles is
applied. Four loading points was carried out for all beams to ensure failure in the flexure. The upper
and lower limits of the cyclic loads were set at 50%, 75% and 95% of the maximum static capacity
load of the control beam which was determined separately. The repaired beam models which had
b re 50ta_8 and 0ta_8. In this numerical modeling the maximum number of cycles
a model was 100 cy es. The non-linear analysis was carried out under load controlled
with secant loading-unloading iteration method. All the results of cyclic loading analysis are presented
in the following section.
nd mortar a
ccurred du
trength of th r is used re
of bea
s caused by larg
oncentration locali
he repaired b
ension region these se
irection of the
ompressive
ailure on the s
ing
een analyzed we 2
pplied to the cl
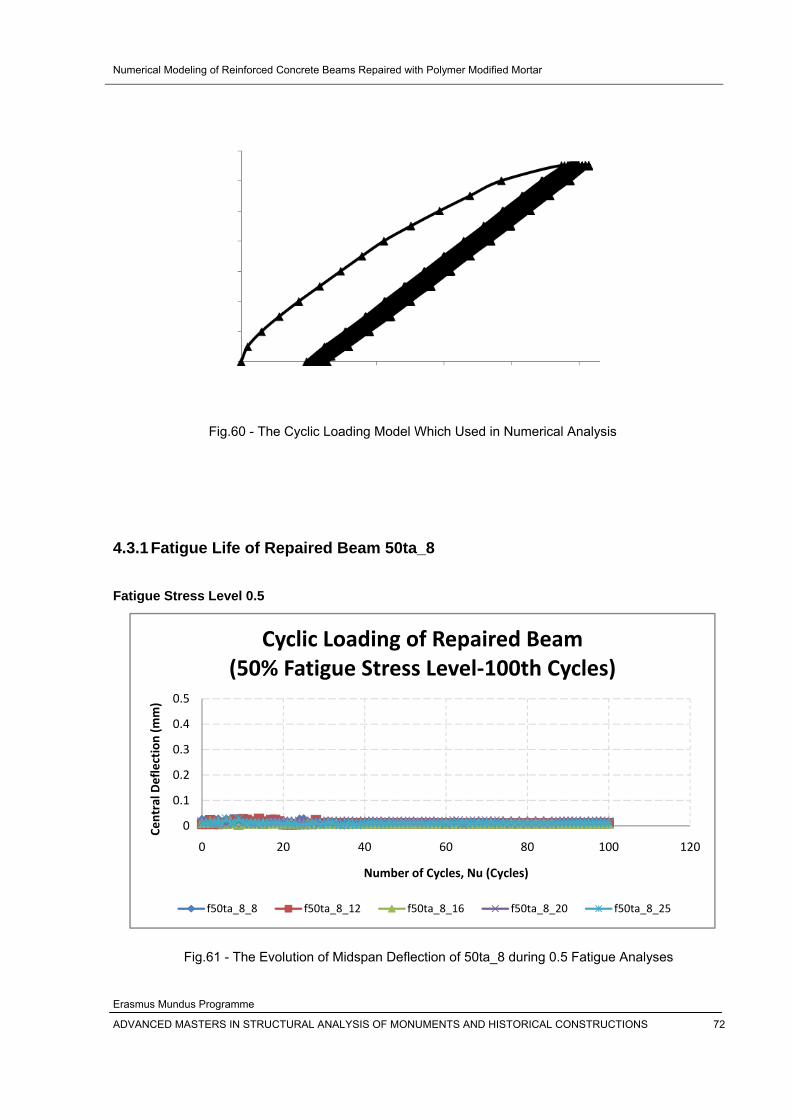
Numerical Modeling of Reinforced Concrete Beams Repaired with Polymer Modified Mortar
Erasmus Mundus Programme
ADVANCED MASTERS IN STRUCTURAL ANALYSIS OF MONUMENTS AND HISTORICAL CONSTRUCTIONS 72
4.3.1
Fatigue Stre
Fig.61 - The Evolution of Midspan Deflection of 50ta_8 during 0.5 Fatigue Analyses
Fig.60 - The Cycli Loading Model Which Used in Numerical Analysis
Fatigue Life of Repaired Beam 50ta_8
ss Level 0.5
c
0
0.1
0.2
0.3
0 20 40 60 80 100 120
Central D
eflection
Number of Cycles, Nu (Cycles)
Cyclic Loading of Repaired Beam(50% Fatigue Stress Level‐100th Cycles)
0.4(mm) 0.5
f50ta_8_8 f50ta_8_12 f50ta_8_16 f50ta_8_20 f50ta_8_25
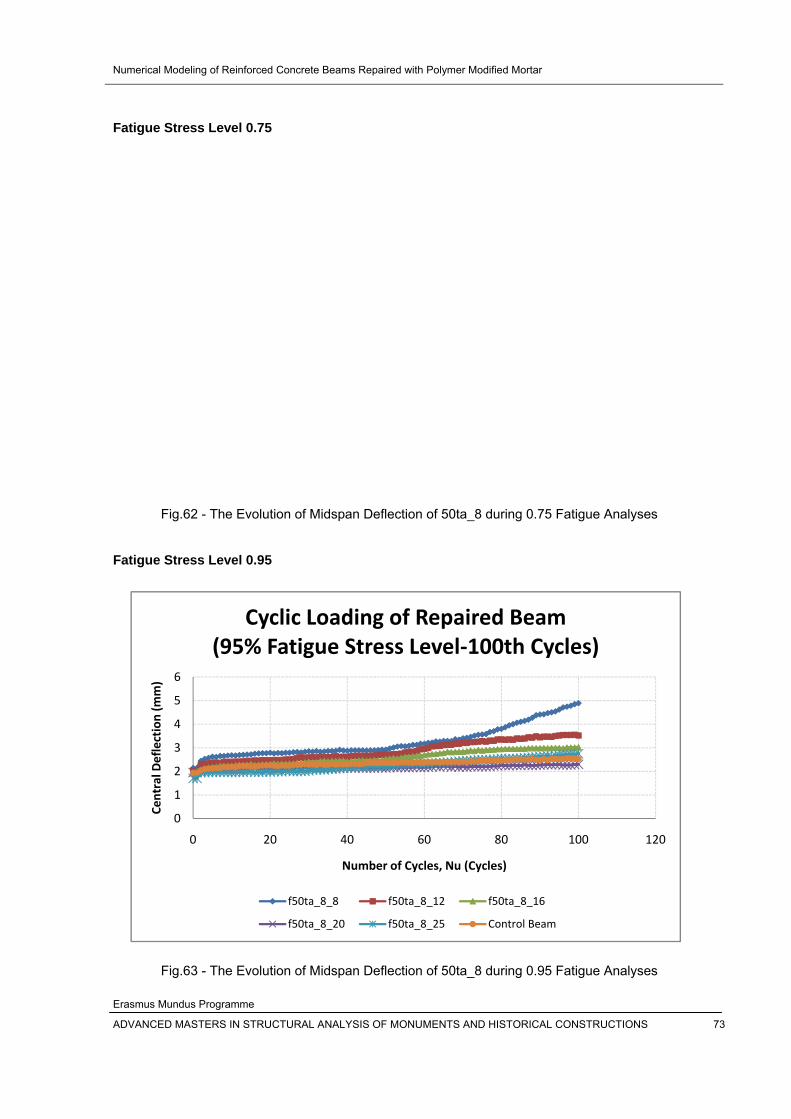
Numerical Modeling of Reinforced Concrete Beams Repaired with Polymer Modified Mortar
Erasmus Mundus Programme
ADVANCED MASTERS IN STRUCTURAL ANALYSIS OF MONUMENTS AND HISTORICAL CONSTRUCTIONS 73
Fatigue Stress Level 0.75
Fig.62 - The Evolution of Midspan Deflection of 50ta_8 during 0.75 Fatigue Analyses Fatigue Stress Level 0.95
Fig.63 - The Evolution of Midspan Deflection of 50ta_8 during 0.95 Fatigue Analyses
0
0 20 40 60 80 100 120
Number of Cycles, Nu (Cycles)
1
2
3
4
5
6
Central D
eflection (m
m)
Cyclic Loading of Repaired Beam(95% Fatigue Stress Level‐100th Cycles)
f50ta_8_8 f50ta_8_12 f50ta_8_16
f50ta_8_20 f50ta_8_25 Control Beam
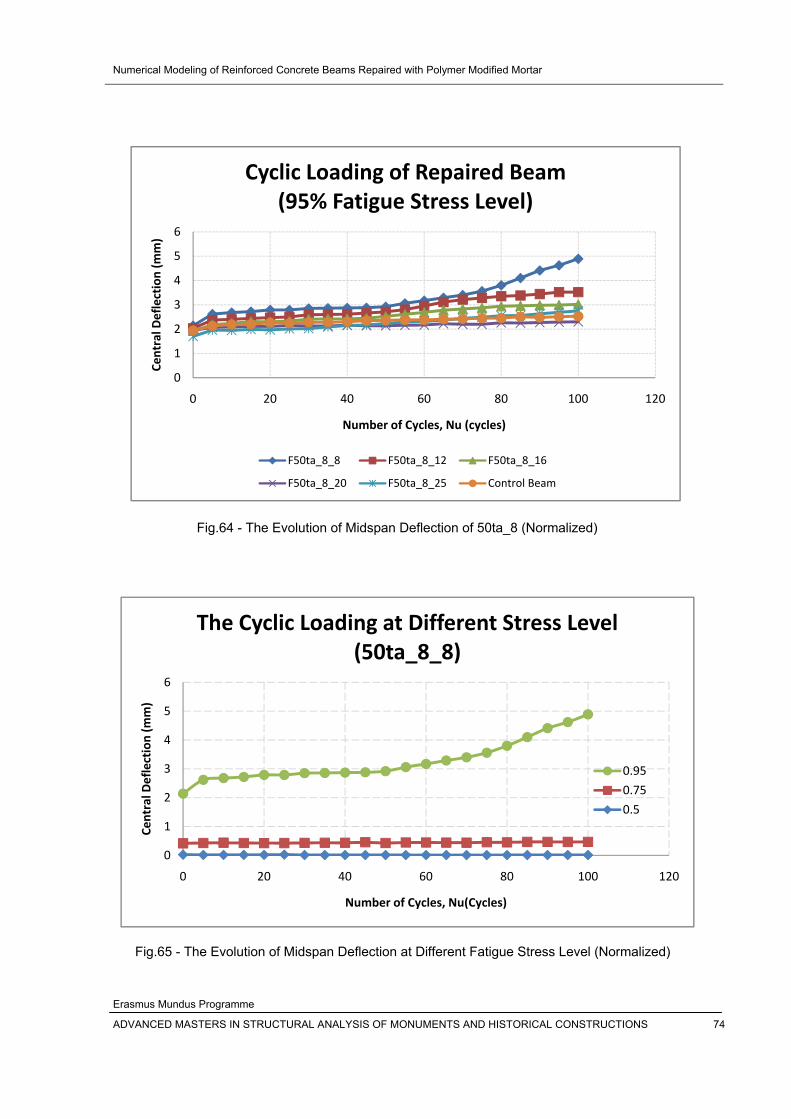
Numerical Modeling of Reinforced Concrete Beams Repaired with Polymer Modified Mortar
Erasmus Mundus Programme
ADVANCED MASTERS IN STRUCTURAL ANALYSIS OF MONUMENTS AND HISTORICAL CONSTRUCTIONS 74
Fig.64 - The Evolution of Midspan Deflection of 50ta_8 (Normalized)
rent Fatigue Stress Level (Normalized)
Fig.65 - The Evolution of Midspan Deflection at Diffe
0
1
2
3
4
5
6
0
Central D
eflection (m
m)
20 40 60 80 100 120
Number of Cycles, Nu (cycles)
Cyclic Loading of Repaired Beam95% Fatigue Stress Level)(
F50ta_8_8 F50ta_8_12 F50ta_8_16
F50ta_8_20 F50ta_8_25 Control Beam
0
1
2
0 20 40 60 80 100 120
Central D
eflection (m
m)
Number of Cycles, Nu(Cycles)
The Cyclic Loading at Different Stress Level (50ta_8_8)
3
4
5
6
0.95
0.75
0.5
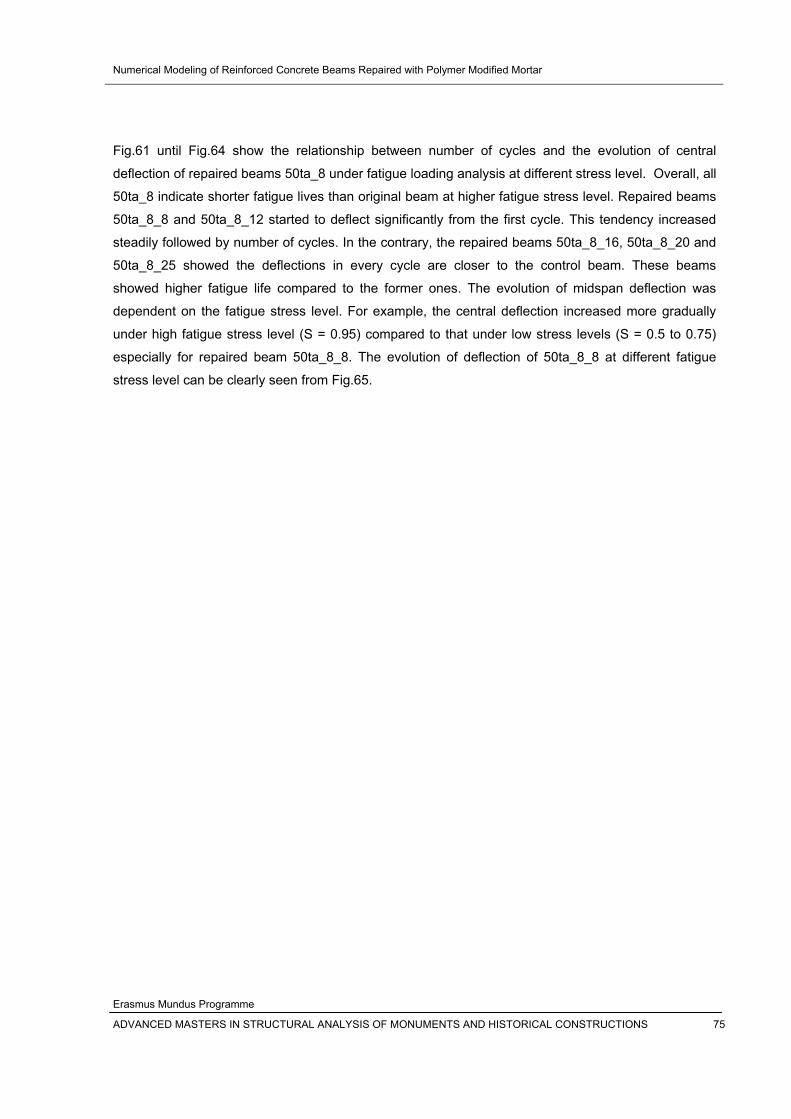
Numerical Modeling of Reinforced Concrete Beams Repaired with Polymer Modified Mortar
Erasmus Mundus Programme
ADVANCED MASTERS IN STRUCTURAL ANALYSIS OF MONUMENTS AND HISTORICAL CONSTRUCTIONS 75
Fig.61 until Fig.64 show the relationship between number of cycles and the evolution of central
deflection of repaired beams 50ta_8 under fatigue loading analysis at different stress level. Overall, all
50ta_8 indicate shorter fatigue lives than original beam at higher fatigue stress level. Repaired beams
50ta_8_8 a _12 started to deflect significantly from the first cycle. This tendency increased
steadily follo umber of cycles. In the contrary, the repaired beams 50ta_8_16, 50ta_8_20 and
50ta_8_25 showed the deflections in every cycle are closer to the control beam. These beams
showed hig e life compared to the former ones. The evolution of midspan deflection was
dependent the fatigue stress level. For example, the central deflection increased more gradually
under high fatigue stress level (S = 0.95) compared to that under low stress levels (S = 0.5 to 0.75)
especially for repaired beam 50ta_8_8. The evolution of deflection of 50ta_8_8 at different fatigue
stress level can be clearly seen from Fig.65.
nd 50ta_8
wed by n
her fatigu
on
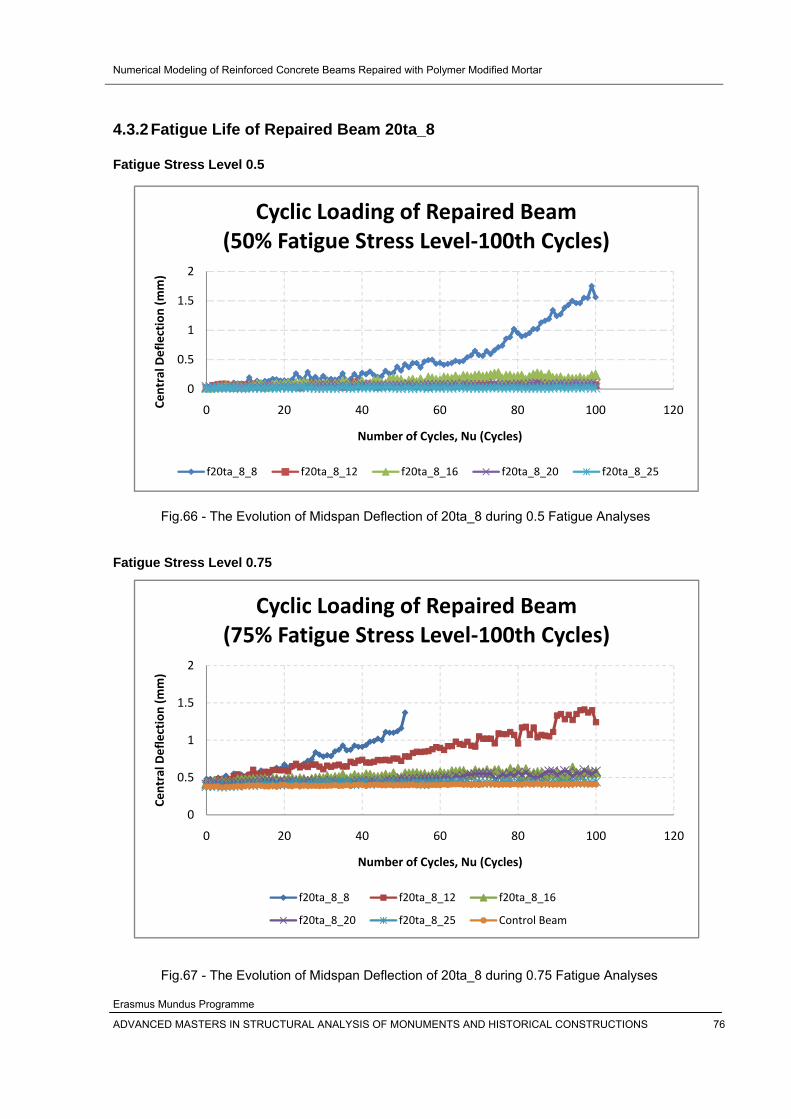
Numerical Modeling of Reinforced Concrete Beams Repaired with Polymer Modified Mortar
Erasmus Mundus Programme
ADVANCED MASTERS IN STRUCTURAL ANALYSIS OF MONUMENTS AND HISTORICAL CONSTRUCTIONS 76
4.3.2 Fatigue Life of Repaired Beam 20ta_8 Fatigue Str el 0.5
Fig.67 - The Evolution of Midspan Deflection of 20ta_8 during 0.75 Fatigue Analyses
ess Lev
Fig.66 - The Evolution of Midspan Deflection of 20ta_8 during 0.5 Fatigue Analyses
Fatigue Str el 0.75 ess Lev
0
0.5
1.5
0 20 40 60 80 100Central D
eflection (m
m)
Number of Cycles, Nu (Cycles)
Cyclic Loading of Repaired Beam(50% Fatigue Stress Level‐100th Cycles)
1
2
120
f20ta_8_8 f20ta_8_12 f20ta_8_16 f20ta_8_20 f20ta_8_25
0
0.5
1.5
0 20 40 60 80 100 120
Central D
eflection (m
m)
Number of Cycles, Nu (Cycles)
Cyclic Loading of Repaired Beam(75% Fatigue Stress Level‐100th Cycles)
1
2
f20ta_8_8 f20ta_8_12 f20ta_8_16
f20ta_8_20 f20ta_8_25 Control Beam
Numerical Modeling of Reinforced Concrete Beams Repaired with Polymer Modified Mortar
Erasmus Mundus Programme
ADVANCED MASTERS IN STRUCTURAL ANALYSIS OF MONUMENTS AND HISTORICAL CONSTRUCTIONS 77
Fatigue Stress Level 0.95
Fig.69 - The Evolution of Midspan Deflection of 20ta_8 (Normalized)
Fig.68 - The Evolution of Midspan Deflection of 20ta_8 during 0.95 Fatigue Analyses
0
1
2
3
4
5
6
7
0 20 40 60 80 100 120
Central D
eflection (m
m)
Number of Cycles, Nu (Cycles)
Cyclic Loading of Repaired Beam(95% Fatigue Stress Level‐100th Cycles)
f20ta_8_8 f20ta_8_12 f20ta_8_16
f20ta_8_20 f20ta_8_25 Control Beam
Numerical Modeling of Reinforced Concrete Beams Repaired with Polymer Modified Mortar
Erasmus Mundus Programme
ADVANCED MASTERS IN STRUCTURAL ANALYSIS OF MONUMENTS AND HISTORICAL CONSTRUCTIONS 78
ion of Midspan Deflection at Different Fatigue Stress Level (Normalized)
he performance of all repaired beams 20ta_8 at different fatigue stress level can be seen from Fig.66 ntil Fig.70. From these figures, it is clear to see that all repaired beams performed the fatigue
ehavior were below that of the control beam. The repaired beam 20ta_8_8 failed at values ranging
etween about 75% and 95% of the fatigue life of the control beam. At the medium fatigue stage level
= 0.75), the deflection of this beam increased significantly at the first cycle of loading followed the
creasing number of cycles, until it collapsed at around 51 cycles with 1028 load steps. When the
tigue stress level increased up to the high level (S = 0.95), the deflection was extremely enlarged
ore than 5 times compared to that medium level before it failed at 31 cycles with 838 load steps.
Fig.70 - The Evolut
T
u
b
b
(S
in
fa
m
Numerical Modeling of Reinforced Concrete Beams Repaired with Polymer Modified Mortar
Erasmus Mundus Programme
ADVANCED MASTERS IN STRUCTURAL ANALYSIS OF MONUMENTS AND HISTORICAL CONSTRUCTIONS 79
4.4 Comparison of Fatigue Life of Repaired Beams
0ta_8_8 and 20ta_8_8)
Fig.71 - The Comparison of Fatigue Life at 0.5 Stress Level (Normalized)
(5
Fig.72 - The Comparison of Fatigue Life at 0.75 Stress Level (Normalized)
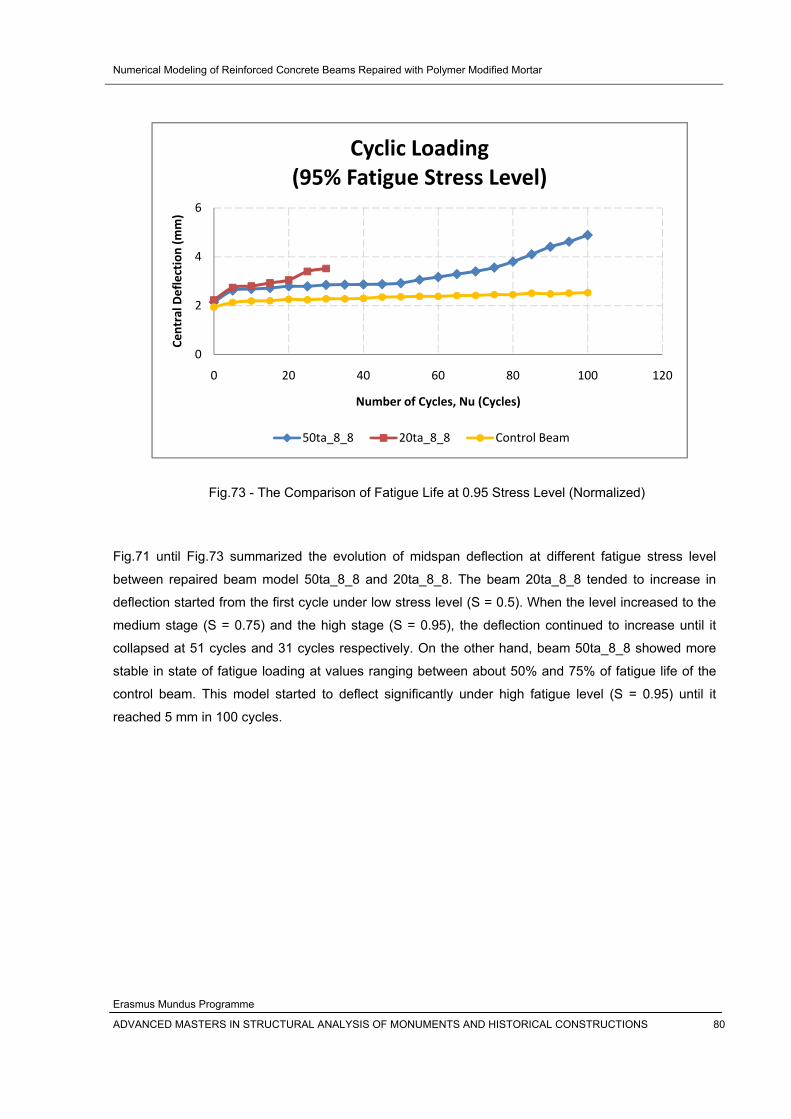
Numerical Modeling of Reinforced Concrete Beams Repaired with Polymer Modified Mortar
Erasmus Mundus Programme
ADVANCED MASTERS IN STRUCTURAL ANALYSIS OF MONUMENTS AND HISTORICAL CONSTRUCTIONS 80
Fig.73 - The Comparison of Fatigue Life at 0.95 Stress Level (Normalized)
Fig.71 until Fig.73 summarized the evolution of midspan deflection at different fatigue stress level
between repaired beam model 50ta_8_8 and 20ta_8_8. The beam 20ta_8_8 tended to increase in
deflectio rted from the first cycle under low stress level (S = 0.5). When the level increased to the
medium tage (S = 0.75) and the high stage (S = 0.95), the deflection continued to increase until it
collapsed at 51 cycles and 31 cycles respectively. On the other hand, beam 50ta_8_8 showed more
stable in e of fatigue loading at values ranging between about 50% and 75% of fatigue life of the
control beam. This model started to deflect significantly under high fatigue level (S = 0.95) until it
reached 5 mm in 100 cycles.
n sta
s
stat
0
2
4
6
0 20 40 60 80 100 120
Central D
eflection (m
m)
Number of Cycles, Nu (Cycles)
Cyclic Loading(95% Fatigue Stress Level)
50ta_8_8 20ta_8_8 Control Beam
Numerical Modeling of Reinforced Concrete Beams Repaired with Polymer Modified Mortar
Erasmus Mundus Programme
ADVANCED MASTERS IN STRUCTURAL ANALYSIS OF MONUMENTS AND HISTORICAL CONSTRUCTIONS 81
(50ta_8_12 and 20ta_8_12)
s Level (Normalized)
Fig.75 - The Comparison of Fatigue Life at 0.75 Stress Level (Normalized)
Fig.74 - The Comparison of Fatigue Life at 0.5 Stres
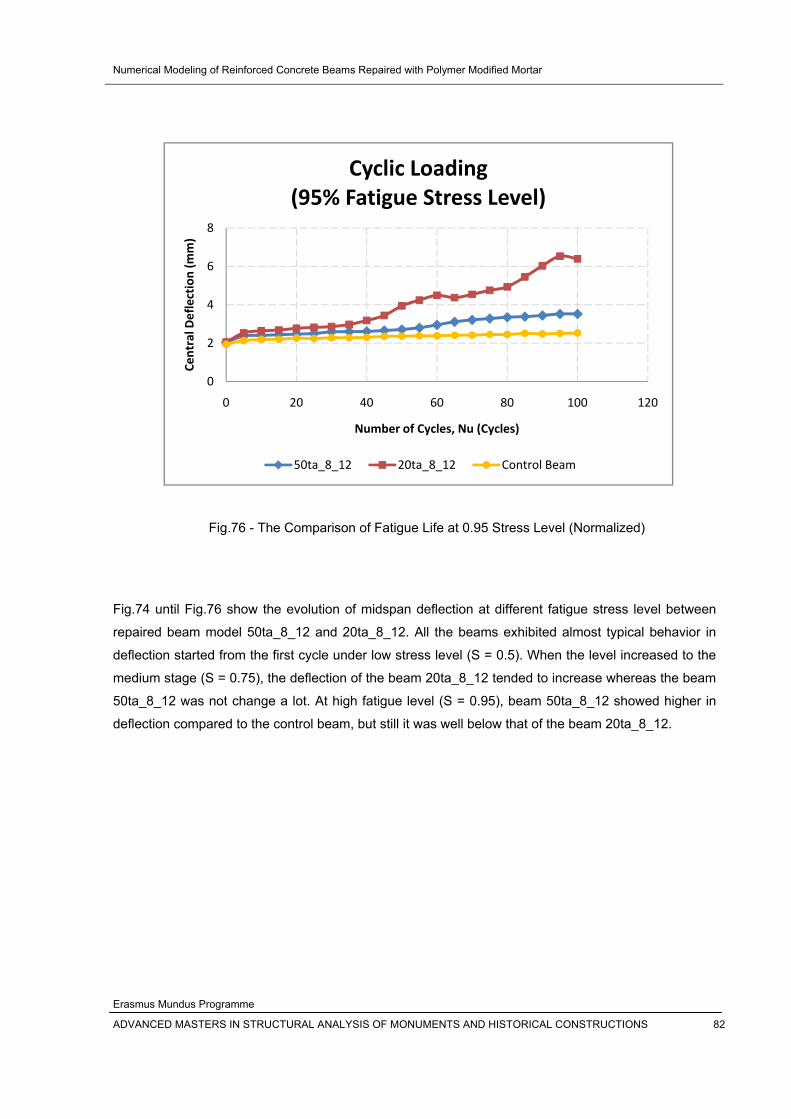
Numerical Modeling of Reinforced Concrete Beams Repaired with Polymer Modified Mortar
Erasmus Mundus Programme
ADVANCED MASTERS IN STRUCTURAL ANALYSIS OF MONUMENTS AND HISTORICAL CONSTRUCTIONS 82
Fig.76 - The Comparison of Fatigue Life at 0.95 Stress Level (Normalized)
Fig.74 until Fig.76 show the evolution of midspan deflection at different fatigue stress level between
repaired beam model 50ta_8_12 and 20ta_8_12. All the beams exhibited almost typical behavior in
deflectio rted from the first cycle under low stress level (S = 0.5). When the level increased to the
medium e (S = 0.75), the deflection of the beam 20ta_8_12 tended to increase whereas the beam
50ta_8_12 was not change a lot. At high fatigue level (S = 0.95), beam 50ta_8_12 showed higher in
deflectio mpared to the control beam, but still it was well below that of the beam 20ta_8_12.
n sta
stag
n co
0
2
4
6
8
0 20 40 60 80 100 1
Central D
eflection (m
m)
Number of Cycles, Nu (Cycles)
Cyclic Loading(95% Fatigue Stress Level)
20
50ta_8_12 20ta_8_12 Control Beam
Numerical Modeling of Reinforced Concrete Beams Repaired with Polymer Modified Mortar
Erasmus Mundus Programme
ADVANCED MASTERS IN STRUCTURAL ANALYSIS OF MONUMENTS AND HISTORICAL CONSTRUCTIONS 83
(50ta_8_16 and 20ta_8_16)
omparison of Fatigue Life at 0.5 Stress Level (Normalized)
Fig.78 - The Comparison of Fatigue Life at 0.75 Stress Level (Normalized)
Fig.77 - The C
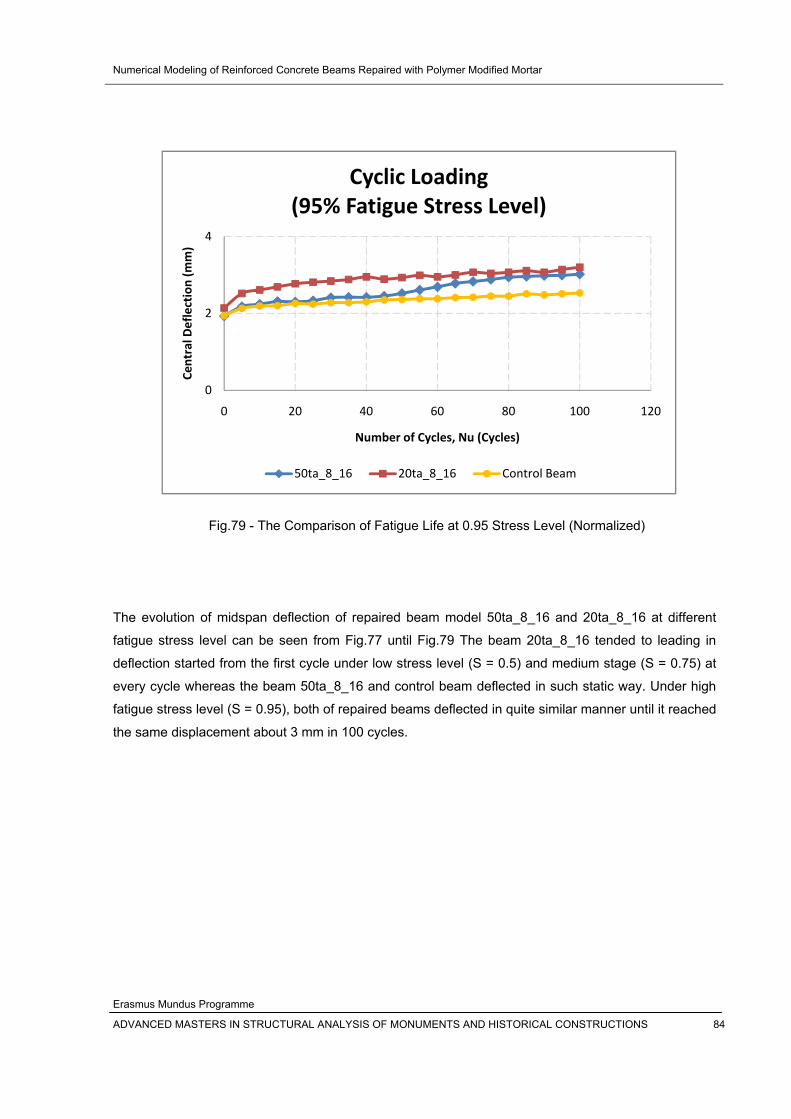
Numerical Modeling of Reinforced Concrete Beams Repaired with Polymer Modified Mortar
Erasmus Mundus Programme
ADVANCED MASTERS IN STRUCTURAL ANALYSIS OF MONUMENTS AND HISTORICAL CONSTRUCTIONS 84
Fig.79 - The Comparison of Fatigue Life at 0.95 Stress Level (Normalized) The ev different
fatigue eading in
deflectio = 0.75) at
every c high
reached
the same di
olution of midspan deflection of repaired beam model 50ta_8_16 and 20ta_8_16 at
ress level can be seen from Fig.77 until Fig.79 The beam 20ta_8_16 tended to l
rted from the first cycle under low stress level (S = 0.5) and medium stage (S
whereas the beam 50ta_8_16 and control beam deflected in such static way. Under
fatigue stress level (S = 0.95), both of repaired beams deflected in quite similar manner until it
splacement about 3 mm in 100 cycles.
st
n sta
ycle
0
2
4
0 20 40 60 80 100 120
Central D
eflection (m
m)
Number of Cycles, Nu (Cycles)
Cyclic Loading(95% Fatigue Stress Level)
50ta_8_16 20ta_8_16 Control Beam

Numerical Modeling of Reinforced Concrete Beams Repaired with Polymer Modified Mortar
(50ta_8_20 and 20ta_8_20)
Fig.80 - The Comparison of Fatigue Life at 0.5 Stress Level (Normalized)
Fig.81 - The Comparison of Fatigue Life at 0.75 Stress Level (Normalized)
Erasmus Mundu
ADVANCED MASTERS IN STRUCTURAL ANALYSIS OF MONUMENTS AND HISTORICAL CONSTRUCTIONS 85
s Programme
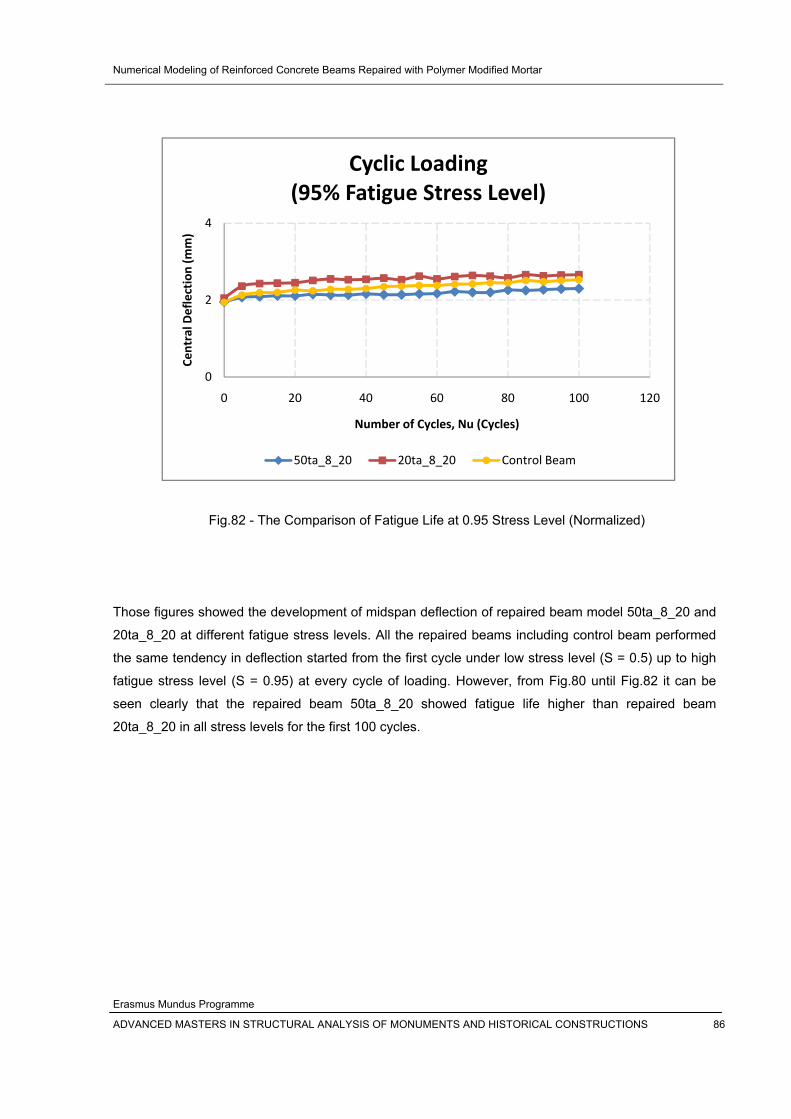
Numerical Modeling of Reinforced Concrete Beams Repaired with Polymer Modified Mortar
Erasmus Mundus Programme
ADVANCED MASTERS IN STRUCTURAL ANALYSIS OF MONUMENTS AND HISTORICAL CONSTRUCTIONS 86
Fig.82 - The Comparison of Fatigue Life at 0.95 Stress Level (Normalized)
hose f _20 and
0ta_8 rformed
e sa to high
tigue can be
een cl am
0ta_8
T igures showed the development of midspan deflection of repaired beam model 50ta_8
_20 at different fatigue stress levels. All the repaired beams including control beam pe
me tendency in deflection started from the first cycle under low stress level (S = 0.5) up
stress level (S = 0.95) at every cycle of loading. However, from Fig.80 until Fig.82 it
early that the repaired beam 50ta_8_20 showed fatigue life higher than repaired be
_20 in all stress levels for the first 100 cycles.
2
th
fa
s
2
0
2
4
0 20 40 60 80 100 120
Central D
eflection (m
m)
Number of Cycles, Nu (Cycles)
Cyclic Loading(95% Fatigue Stress Level)
50ta_8_20 20ta_8_20 Control Beam
Numerical Modeling of Reinforced Concrete Beams Repaired with Polymer Modified Mortar
(50ta_8_25 and 20ta_8_25)
Fig.83 - The Comparison of Fatigue Life at 0.5 Stress Level (Normalized)
Fig.84 - The Comparison of Fatigue Life at 0.75 Stress Level (Normalized)
Erasmus Mundu
ADVANCED MASTERS IN STRUCTURAL ANALYSIS OF MONUMENTS AND HISTORICAL CONSTRUCTIONS 87
s Programme
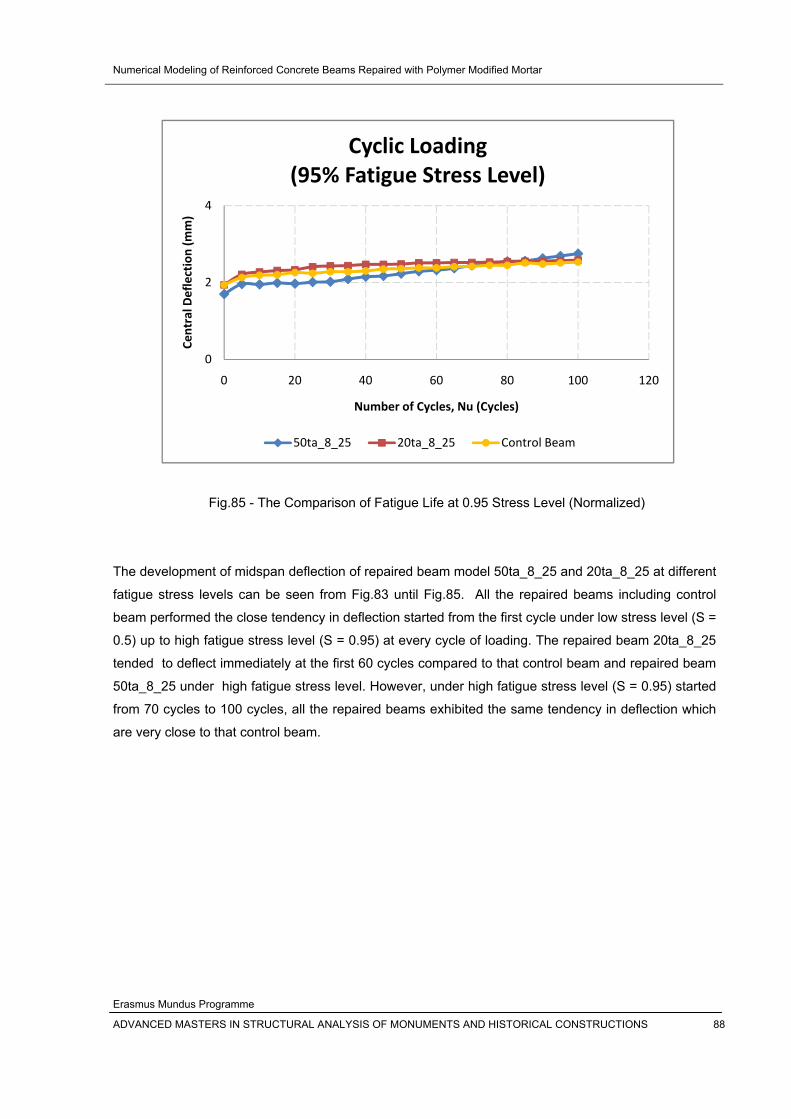
Numerical Modeling of Reinforced Concrete Beams Repaired with Polymer Modified Mortar
Erasmus Mundus Programme
ADVANCED MASTERS IN STRUCTURAL ANALYSIS OF MONUMENTS AND HISTORICAL CONSTRUCTIONS 88
Fig.85 - The Comparison of Fatigue Life at 0.95 Stress Level (Normalized)
he de at different
tigue ng control
eam pe (S =
.5) up ta_8_25
nded eam
0ta_8 started
om 70 ion which
re ver
T velopment of midspan deflection of repaired beam model 50ta_8_25 and 20ta_8_25
stress levels can be seen from Fig.83 until Fig.85. All the repaired beams includi
rformed the close tendency in deflection started from the first cycle under low stress level
to high fatigue stress level (S = 0.95) at every cycle of loading. The repaired beam 20
to deflect immediately at the first 60 cycles compared to that control beam and repaired b
_25 under high fatigue stress level. However, under high fatigue stress level (S = 0.95)
cycles to 100 cycles, all the repaired beams exhibited the same tendency in deflect
y close to that control beam.
fa
b
0
te
5
fr
a
0
2
4
0 20 40 60 80 100 120
Central D
eflection (m
m)
Number of Cycles, Nu (Cycles)
Cyclic Loading(95% Fatigue Stress Level)
50ta_8_25 20ta_8_25 Control Beam
Numerical Modeling of Reinforced Concrete Beams Repaired with Polymer Modified Mortar
Erasmus Mundus Programme
ADVANCED MASTERS IN STRUCTURAL ANALYSIS OF MONUMENTS AND HISTORICAL CONSTRUCTIONS 89
5. DISCUSSIONS AND CONCLUSIONS 5.1 Sensitivity of Analysis According to all of the results above, both of experimental and numerical results are similar but not
exactly the same regarding the flexure behavior of repaired beams when subjected to static loading.
The sensitivity of numerical analysis is depends on all information for the material model which were
putted to the finite element code. All these information will affect the calculation process of the finite
lement method and keeping in mind that finite element method’s results show more details about the
aterials. So for that reason, determining the material properties for the input data are very important
nd sensitive case, these will influence the final result of the analysis.
the numerical analysis, at least there are four factors in the input file that will affect the results after
e initial cracks started to happen, they are the shear retention factor, the plasticity, the property of
inforcements and the interface properties.
he shear retention factor (β) is related to cracks opening and this value will reduce the shear
odulus of elasticity of the concrete material. The range value of β is between zero and one. When
e value of β is zero, it means a crack is open and there is no aggregate interlocking within the open
s one, the crack is closed and it implies a perfect healing for a closed
crack. It could be assumed that a crack will close when the direct strain across the crack becomes
compre ive.
The pla is specified as yielding or hardening of material. The plasticity phase can be identified by
perman eformations or irreversible deformations within the structure. These deformations can be
related to the processes happened inside the material such as concrete. This value will determine the
behavio of the concrete beam after the initial cracks.
The property of reinforcements is dealing with the property pattern which is used in the reinforcement
model embedded in the concrete. Bi-linear property pattern is the standard pattern for the modeling of
reinforcements. This pattern determines both the elastic behavior of the steel and its plastic condition
after yielding without hardening. The other pattern is tri-linear property pattern. This pattern is
comple ern for modeling the embedded reinforcement in the concrete. This model is quite similar
with the former one but with hardening action after its yield point. The main difficulties are to determine
the exact value of hardening modulus of the steel after yielding and plotted to the stress and strain
relation ip. Both of those patterns will exhibit the different behavior of the structure once the property
pattern inserted into the model.
in
e
m
a
In
th
re
T
m
th
crack. When the value of β i
ss
sticity
ent d
r
te patt
sh
Numerical Modeling of Reinforced Concrete Beams Repaired with Polymer Modified Mortar
Erasmus Mundus Programme
ADVANCED MASTERS IN STRUCTURAL ANALYSIS OF MONUMENTS AND HISTORICAL CONSTRUCTIONS 90
Finally, the last factor is interface properties. The interface properties which were used in this
numerical modeling based on friction type module. DIANA has provided some modules inside friction
type that must be inserted into input file such as normal and shear stiffness for the linear stiffness
module, cohesion, friction and dilatancy angle for the non-linear module. All these values are very
sensitive cases once these inserted into the repaired model. The higher stiffness value would let the
interface elements more stiffens and vice versa. The cohesion, friction and dilatancy angle values will
affect the performance of the interface related to bonding and debonding behavior between the repair
layer and the concrete.
5.2 Effect of Loading Steps on Results
The solution procedures that used in this numerical analysis are iteration method which requires some
loading s to be applied. These loading steps are very sensitive cases whether the solution chosen
for the equilibrium equations is displacement controlled or load controlled. The size of these steps will
determine the b ample; the
initial cracks, yielding point and the ultimate load. The size of loading steps also affects to the
convergence criteria that required for solving the equilibrium in every step.
he effect of loading steps is also considered when the cyclic loading analysis is took place in state of
e fatigue analysis. This repeated loading used these loading steps during the analysis in every cycle
ntil the maximum number of cycles which is determined in the input file previously is reached or the
odel that is being analyzed is collapsed. The size of the steps will affect more significant to the
tigue behavior of the beam compared to the static one, because loading and unloading history of
yclic loading used these steps as many as number of cycles needed. The big load steps will not
present the exact fatigue behavior of the beam, because there are a lot of important steps are not
aptured with these steps during the analysis and the probability of the model to collapse early is very
igh because the displacement’s evolutions of the beam will not response in a suitable manner when
e high steps are applied. The smaller load steps are very suitable for this kind of analysis to capture
ll behaviors in very detail at each step, but this analysis is very expensive and time consuming. This
xplains why the loading rate on the experimental works is very sensitive and important case
specially for the cyclic loading.
step
ehavior of the structure from the beginning and affect whole result for ex
T
th
u
m
fa
c
re
c
h
th
a
e
e
Numerical Modeling of Reinforced Concrete Beams Repaired with Polymer Modified Mortar
Erasmus Mundus Programme
ADVANCED MASTERS IN STRUCTURAL ANALYSIS OF MONUMENTS AND HISTORICAL CONSTRUCTIONS 91
5.3 Concluding Remarks
In this study the numerical modeling of reinforced concrete beams repaired with polymer-modified
cementitious mortar were carried out. The behavior from combination of material properties between
concrete and repairing layer is evaluated when subjected to static loading and repeated loading. On
the basis of limited numerical modeling carried out with a lot of consideration which have been
previously discussed, the following conclusions can be drawn.
The repairing layer properties make great significant influence to increase or decrease the
overall capacity of deteriorated concrete structures. It is caused by the differences of the
compressive and tensile strength and also the elastic modulus between repair layer and the
concrete substrate.
In case of ultimate load, the polymer modified cementitious mortar can be sufficient for the
repairing material when it used mechanical properties similar or over to those of the parent
concrete.
The effectiveness of the repairing layer is not only depends on its mechanical properties but
also the thickness of layer and the amount of reinforcement ratio. In some previous
n of the repairing layer whether in tension or
nt to the final result.
e the steel reinforcement can restore the load bearing capacity of
sed.
avior with the lowest index.
The thick repairs which include the steel reinforcement exhibited typical flexural failure for all
of cyclic loading, in general the load bearing capacity of the repaired beams would be
reduced significantly when subjected to fatigue loading compared to static loading. The
repaired beams are more vulnerable in cyclic loading than monotonic loading.
‐
‐
‐
experimental studies proved that the locatio
compression zone also influenced very significa
‐ The thick repairs which includ
the original beam about 98% - 102% of the ultimate load of the control beam. In contrary, thin
repairs that applied in tension zone without steel reinforcement included, just only to substitute
the concrete cover, can only reach the capacity of load about 90% - 95% of the ultimate load of
the control beam.
‐ In case of thin repairs (reinforcement not included), using higher material properties for
repairing layer compared to the parent concrete did not upgrade significantly to the ultimate
load especially if lower compressive strength of the concrete is u
‐ Regarding the ductility index, the thick repairs indicated better performance than thin repairs.
The ductility index of thick repairs is close to that original beam and higher than thin repairs,
whereas thin repairs showed worse beh
‐
the repaired beam models. The stress concentration occurred on the supporting point of the
beams is due to numerical limitation modeling when using the lowest compressive strength of
repair layer. This numerical limitation would likely generate the bearing failure besides the
flexure. On the other hand, thin repairs developed flexure and delamination/debonding failure
at the final steps of the analysis.
‐ In case
Numerical Modeling of Reinforced Concrete Beams Repaired with Polymer Modified Mortar
Erasmus Mundus Programme
ADVANCED MASTERS IN STRUCTURAL ANALYSIS OF MONUMENTS AND HISTORICAL CONSTRUCTIONS 92
‐ There could be a considerable reduction in the fatigue life of the repaired beam compared to
that control beam. In particular, the reduction of fatigue life of repaired beam is parallel with the
reduction of the compressive strength of repair mortar is being used.
‐ The thick repairs which steel reinforcement included showed relatively longer fatigue lives at all
different fatigue stress level compared to thin repairs. The thick repairs had higher resistant
ading. Those predictions are not exactly represented the real behavior
of the fatigue lives of the repaired beams, but at least this numerical analysis helps to predict
and to understand the experimental more detail and could predict the experimental before
capacity under fatigue loading than thin repairs.
‐ According to the evolution of central deflection of the repaired beams, the rough estimation of
fatigue lives of the repaired beams could be predicted. The thick repairs have fatigue lives at
10% - 30% higher than thin repairs depending on the compressive strength of the mortar is
being used. The thick repairs have fatigue lives at about 80% of the control beam at high
fatigue stress level, whereas thin repairs just only have fatigue lives at about 50% - 70% of the
control beam.
‐ All those conclusions from the fatigue loading are based on the prediction possibly occurred in
100 cycles of repeated lo
hand. This could become valuable reference for future experimental works or researches.
Numerical Modeling of Reinforced Concrete Beams Repaired with Polymer Modified Mortar
Erasmus Mundus Programme
ADVANCED MASTERS IN STRUCTURAL ANALYSIS OF MONUMENTS AND HISTORICAL CONSTRUCTIONS 93
REFERENCES 1. A.J.M. Siemes, Fatigue Evaluation of Concrete Structures, Preliminary Studies, Procedure and
Examples, Heron, Vol. 33 (1988) No. 3, pp. 1-75.
2. Allen, R.T.L., 1974. The repair of concrete structures. Cement and Concrete Association,
London SWIW 0AQ.
3. Cambel-Allen, D. and H. Roper, 1991. Concrete structures: Material, Maintenance and
Repair. Concrete Design and Construction Series. 1st edn. New York: John Wiley and Sons
pp: 58-101, 118-120, 139-151, 243-285.
. DIANA Finite Element Analysis User’s Manual, TNO Building and Construction Research,
2008.
. H.A. Dehwah (1990). Durability of Reinforced Concrete Beams Repaired with Various Repair
Materials. M.Sc Thesis, King Fahd University of Petroleum and Minerals.
raad, Crack Models for Concrete, Discrete or Smeared? Fixed,
8. Jumaat MZ, Kabir MH, Obaydullah M (2006) A Review of the Repair of Reinforced Concrete
N, UK. E & FN Spon, an imprint of Chapman and Hall.
f DFRCC under Fatigue Flexure. Journal of Advanced Concrete Technology Vol.1,
ng of the first conference,
4
5
6. J.G. Rots and J. Blaauwend
Multi-Directional or Rotating?, Heron, Vol. 34 (1989) No. 1, pp. 1-59.
7. J.M.J.M. Bijen, Maintenance and Repair of Concrete Structures, Heron, Vol. 34 (1989) No. 2,
pp. 1-82.
Beams. Journal of Applied Science Research, 2(6): 317-326.
9. Macginley, T.J. and B.S. Choo, 1990. Reinforced Concrete, Design Theory and Example, 2nd
Edn. London SE1 8H
10. Matsumoto., Suthiwarapirak, P and Kanda, T. (2003). Mechanism of Multiple Cracking and
Fracture o
No.3, 299-306.
11. Misra S, Uomoto T, 2003. Behavior of Repaired RC Beams under Cyclic Loading.
12. Nielson, N., M., Repair of Concrete, Types and Methods, Proceedi
Deterioration and Repair of Reinforced Concrete in the Arabian Gulf, BSE and CIRIA, Vol.1,
October 1985, Bahrain, pp. 117-125.
Numerical Modeling of Reinforced Concrete Beams Repaired with Polymer Modified Mortar
Erasmus Mundus Programme
ADVANCED MASTERS IN STRUCTURAL ANALYSIS OF MONUMENTS AND HISTORICAL CONSTRUCTIONS 94
13. Nounu, G. and Z. Chaudhary, 1999. Reinforced Concrete Repairs in Beams. Construction
and Building Materials, 13: 195-212
051
oncrete and Reinforcing Bars in RC Members.” Industrial
14. Park SK, Yang DS (2005) Flexural behaviour of reinforced concrete beams with cementitious
repair materials. Materials and Structures 38: 329-334; doi:10.1617/14
15. Pellegrino C., da Porto F., Modena. (2008). Experimental Behavior of Reinforced Concrete
Elements Repaired with Polymer-Modified Cementitious Mortar.
16. Tadashi ABE, Tetsukazu KIDA, Toshiaki SAWANO, Yoshitaka OZAWA, and Ming-Chien HSU,
“Fracture Analysis of RC Beam under Static Load by using FEM.” Industrial Technology of
Nihon University.
17. Tadashi ABE, Tetsukazu KIDA, Toshiaki SAWANO, Yoshitaka OZAWA, and Ming-Chien HSU,
“Interface Modeling Between C
Technology of Nihon University.


![INDEKS PEMBANGUNAN K M - perpustakaan.bappenas.go.idperpustakaan.bappenas.go.id/lontar/file?file=digital/156567-[_Konten_]-Konten D795.pdf · Pengembangan model IPKM 2013 mengikutsertakan](https://static.fdocuments.net/doc/165x107/5ce0b07c88c99390298e108e/indeks-pembangunan-k-m-d795pdf-pengembangan-model-ipkm-2013-mengikutsertakan.jpg)