LUND UNIVERSITY Atmospheric chemistry and physics Bachelor ...
40
LUND UNIVERSITY Atmospheric chemistry and physics Bachelor Thesis Atmospheric decomposition of cyclic ethers Ida Mexnell 2013-06-11 Supervisor: Elna Heimdal Nilsson Examiner: Carl-Erik Magnusson
Transcript of LUND UNIVERSITY Atmospheric chemistry and physics Bachelor ...

LUND UNIVERSITY
Atmospheric chemistry and physics
Bachelor Thesis
Atmospheric decomposition of cyclic ethers
Ida Mexnell
2013-06-11
Supervisor: Elna Heimdal Nilsson
Examiner: Carl-Erik Magnusson
i
Abstract
Renewable alternatives to fossil fuels are of importance nowadays since the use of fossil fuels
is considered to stand for the largest contribution to global warming. In recent years, a group
of cyclic ethers called furans have been proposed as potential renewable fuels. To enable
evaluation of the usefulness of these compounds as fuels, it is important to understand their
atmospheric chemistry since emission of fuel and its reaction products to the atmosphere is
inevitable. The aim of this project is to investigate the environmental impact of the saturated
compound tetrahydrofuran by determining its breakdown products and their approximate
lifetimes. The study is made by analyzing experimental data for the photoreaction of
tetrahydrofuran with the atmospheric oxidant Cl in a N2/O2 mixture and in pure N2,
respectively. The experimental data consist of sets of infrared spectra taken continuously
during the reaction. Identification of products was made by comparing reference spectra of
the products with the experimental spectra. Products identified in the N2/O2 experiment were
butyrolactone, propyl formate, succinaldehyde, propionaldehyde, succinic anhydride,
propionic acid, formic acid, hydrogen chloride, carbon monoxide and carbon dioxide. The
product studies in the N2 experiment were more speculative due to the absence of high-
resolution reference spectra. However, it is likely that a major part of the products are
chlorinated molecules. Further work is necessary to determine the complete product
distribution and reaction mechanisms.

ii
Table of contents
Abstract .................................................................................................................................................... i
Table of contents ......................................................................................................................................ii
1. Background ......................................................................................................................................... 1
1.1 Introduction ................................................................................................................................... 1
1.2 Biofuels ......................................................................................................................................... 2
1.3 Aim of the project .......................................................................................................................... 2
1.4 Previous studies ............................................................................................................................. 2
2. Theory ................................................................................................................................................. 4
2.1 Atmospheric lifetime ..................................................................................................................... 4
2.2 Molecules ...................................................................................................................................... 4
2.3 IR-spectroscopy ............................................................................................................................. 6
2.4 Functional groups .......................................................................................................................... 8
3. Method .............................................................................................................................................. 10
3.1 Experimental data ........................................................................................................................ 10
3.2 Analysis ....................................................................................................................................... 11
4. Results and Discussion ...................................................................................................................... 16
4.1 N2/O2 experiment ......................................................................................................................... 17
4.1.1 Primary products .................................................................................................................. 17
4.1.2 Secondary products .............................................................................................................. 20
4.1.3 Tertiary and later products.................................................................................................... 22
4.2 N2 experiment .............................................................................................................................. 25
5. Conclusion ......................................................................................................................................... 34
References ............................................................................................................................................. 35
1
1. Background
1.1 Introduction
Earth’s climate has always been fluctuating but recent increase in the global temperature can
most probably not be explained as a natural variability due to the short timescales. It is
believed that the rapid proceeding of the global warming is an effect of human activities, in
particular through the use of fossil fuels as one of our most important sources of energy.
Fossil fuel combustion is the primary cause of the increase in atmospheric carbon dioxide
during the past century [1]. By replacing fossil fuels with renewable alternatives, the amount
of carbon dioxide emitted into the atmosphere is generally considered to be reduced.
Renewable fuels, such as biofuels produced from biomass, are renewable in the sense that the
rate of production equals the rate of consumption and are therefore not expected to contribute
to global warming. But not only is the global perspective of importance, especially if the fuels
are to be used in vehicles. Also the environmental impact on the local air quality must be
considered since the combustion process results in a series of reactions and will probably
affect the local air composition. The investigation of the breakdown of the fuel includes
studies in what products that form and their lifetime. Determination of the lifetimes can tell if
they most likely affect the chemical composition close to the source or if they may reach the
stratosphere and affect the stratospheric chemistry, which respond to a shorter and longer
lifetime, respectively.
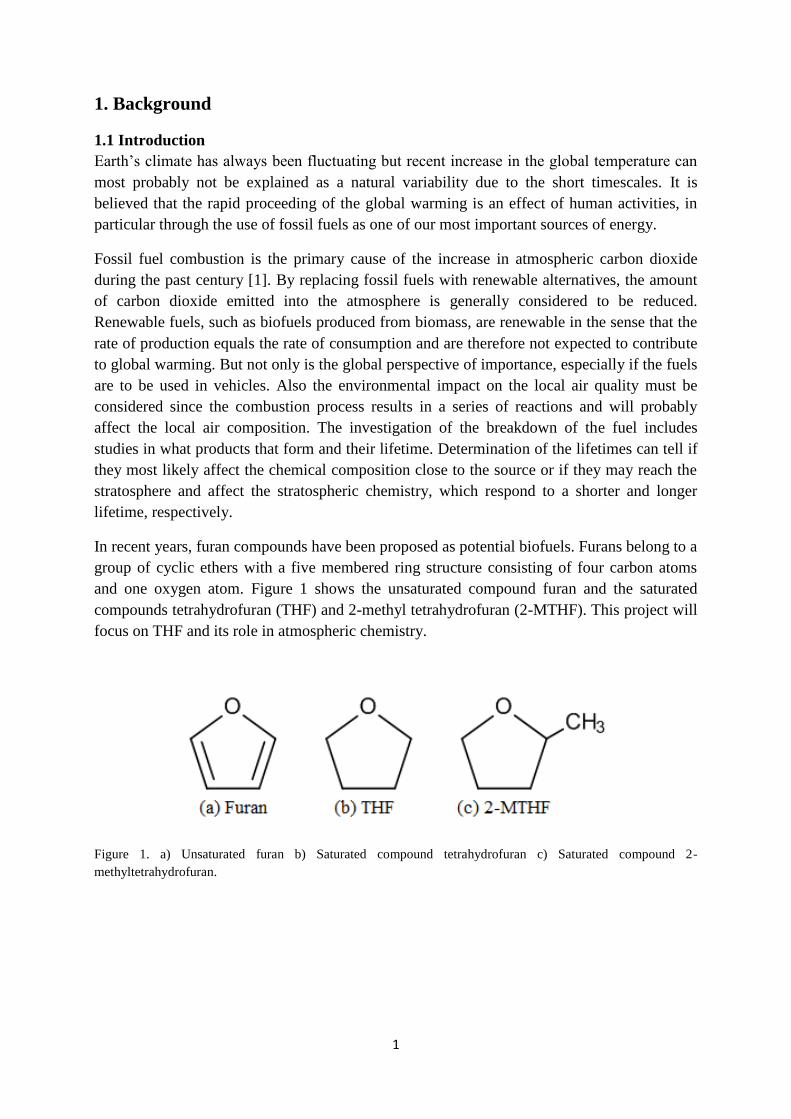
In recent years, furan compounds have been proposed as potential biofuels. Furans belong to a
group of cyclic ethers with a five membered ring structure consisting of four carbon atoms
and one oxygen atom. Figure 1 shows the unsaturated compound furan and the saturated
compounds tetrahydrofuran (THF) and 2-methyl tetrahydrofuran (2-MTHF). This project will
focus on THF and its role in atmospheric chemistry.
Figure 1. a) Unsaturated furan b) Saturated compound tetrahydrofuran c) Saturated compound 2-
methyltetrahydrofuran.

2
1.2 Biofuels
In many ways, the use of fossil fuels is not sustainable, in particular due to their finite nature
but also to the environmental impact on the global- as well on the local scale. These factors,
among others, motivate the search for biofuels produced from biomass. Since the
transportation sector is one of the main energy consumers, liquid biofuels are believed to play
a large role in the future as a substitute to fossil fuels used in vehicles, such as gasoline and
diesel. Two liquid biofuels used widely today are ethanol (C2H5OH) and biodiesel, produced
from sugars and vegetable oil respectively [2].
Both are in the category first generation biofuels, defined as those produced from food-based
crops, such as sugar cane, maize and corn, using conventional technology [3]. Although these
fuels show indications to reduce the greenhouse gas emissions they are associated with
several disadvantages. The production competes with food production and an increased use of
first generation biofuels may lead to escalated food prices and problems with the food supply.
Furthermore, an increased demand for agricultural crops may lead to larger problems
associated with agriculture such as deforestation, fertilizers and negative impact on the
biodiversity [3].
Many of the problems related to the first generation biofuels are believed to be avoided using
later generation biofuels produced from non-edible feedstock using more advanced
technology. At present, there are both technical and economic challenges to overcome before
these fuels can come into commercial use but they have potential to be economically
favourable in the long term [3].
Concerning the environmental impact on the local scale, studies have been made that show a
change in atmospheric composition if the fossil fuels were replaced by biofuels. Especially a
study is made showing increased levels of harmful tropospheric ozone for the widely used
biofuel ethanol compared to the fossil fuel case [4]. The formation of ozone can be explained
by a significant increase of formaldehyde and acetaldehyde, two important ozone precursors,
which also was shown in the study [4]. Hence, research on biofuel emissions is important for
prediction of future environmental issues.
1.3 Aim of the project
Use experimental results to determine the product distribution from the reaction of THF with
Cl in the presence and absence of O2.
1.4 Previous studies
Rate coefficients for THF, obtained with the relative rate method, have been investigated in
several studies, both in reaction with OH [5] and in reaction with Cl [6, 7]. The results from
the Cl-initiated reaction show a small difference but are in agreement within the reported
experimental uncertainty. THF shows a high reactivity towards both oxidizers, but the rate
coefficients for reaction with Cl are up to two orders of magnitude larger than for reaction
with OH, which is analogous for the majority of organic compounds [8]. The studies are in
agreement that OH is the major oxidizer of THF worldwide but in the marine boundary layer
and polluted industrial and urban areas where the Cl concentration can reach high values it
will contribute significantly to the degradation of THF.
3
No product distribution from either the OH-radical or the Cl-atom initiated degradation of
THF has been investigated experimentally, only a theoretical study has been presented this far
[9]. The theoretical study presents a couple of possible reaction paths with kinetic differences.
However, irrespective of the followed path, all final products are the same. Experimental
studies of the product distribution have been made for unsaturated furan, both the OH-
initiated- [10] and Cl-initiated [11] degradation. In the OH-initiated reaction, butenedial
(C4H4O2) is formed as a major primary product and glyoxal (C2H2O2), formic acid (HCOOH)
and carbon dioxide (CO2) as secondary products. The Cl-initiated degradation study presents
several chlorine-containing products in the major reaction pathway.

4
2. Theory
2.1 Atmospheric lifetime
The atmospheric lifetime of a chemical species is a measure of how long the species will
reside in the atmosphere before it is removed. By calculating the lifetime one can estimate the
distribution of the species since the lifetime is related to atmospheric mixing times. Mixing
times have strong directional- and layer dependences. Vertical mixing in the troposphere takes
about one week, whereas horizontal mixing takes about a year. Mixing between different
atmospheric layers, e. g. the troposphere and the stratosphere takes even longer due to the
temperature inversion in the stratosphere, hence only long lived species can be transported to
the stratosphere.
One of the most important removal processes in the troposphere is reaction with the hydroxyl
radical (OH) and OH is generally considered to be the main oxidant for hydrocarbons. The
concentration of OH is relatively high around the world but shows local variations depending
on the presence of reactants [1]. For example, the concentration is in general higher on the
southern hemisphere than on the northern due to the higher amount of anthropogenic
emissions on the northern hemisphere, with which the OH radical reacts. The local variation
is also dependent on the production, due to the high reactivity and relatively short lifetime of
OH. It is produced by photolysis of ozone and further reaction with H2O, favouring the
production in the tropics where the incoming solar radiation and humidity are high [12].
Another important oxidant, especially in marine regions, is the chlorine atom. Chlorine is
often in the form of NaCl, derived from sea-salt and must undergo a couple of reactions to be
available in the gas-phase chemistry. Chlorine oxidation may also play an important role in
polluted industrial areas, since the Cl atom is released by photolysis of several Cl-containing
substances derived from anthropogenic emissions [8]. The oxidation process of the Cl atom is
similar to OH but it shows a higher reactivity, with rate coefficients that are an order of
magnitude or more. Hence, the Cl atom contributes significantly to tropospheric oxidation
[13].
The Cl atom might be even more powerful in the stratospheric chemistry since many chlorine-
containing compounds, both from anthropogenic and natural sources, primarily degrade by
high energetic photodissociation, and thus have a sufficiently long lifetime to reach the
stratosphere. In the stratosphere, the Cl atom is highly reactive towards ozone and initiates an
effective destruction cycle [12].
2.2 Molecules
If nothing else is stated, the following section is obtained from Quantum Chemistry and
Spectroscopy by Tomas Engel (2013) [14].
Molecules are a certain number of atoms held together by chemical bonds. A chemical bond
is formed if the energy of the molecule is lower at an equilibrium distance, Re between the
atoms than the energy of the atoms separately, see Figure 2.

5
Figure 2. Molecular potential energy curve for a diatomic molecule.
The molecular potential energy curve shown in Figure 2 is obtained using the Born-
Oppenheimer approximation, in which it is assumed that the nucleus, which is much heavier
than the electron, will move with negligible speed relative the electron. Thus the nuclei may
be treated as stationary and the Schrödinger equation can be solved for the electrons at
different internuclear distances in a diatomic molecule. Close to the minimum of the potential
is the bond dissociation energy, which is simply the energy needed to dissociate the molecule
into free atoms.
A molecule has translational, vibrational and rotational motions, which all of them contribute
to the total energy of the molecule. Each of the motions is described by quantum mechanical
operators and thus has its own energy spectrum and energy eigenvalues.
The vibrational motion is based on the harmonic oscillator and the vibration can be thought of
as an oscillation around the equilibrium bond length of the molecule. However, harmonic
oscillations are given by a parabolic function, which is a good approximation only at the
bottom of the real molecule potential energy curve in Figure 2. In order to reproduce the
shape of the real potential more closely one uses the Morse potential, a mathematical function
for which the corresponding Schrödinger equation can be solved analytically. The energy
scale of the vibrations is much smaller than the electronic excitation energies and the
vibrational states can be seen as the fine structure of each electronic state. The rotational
motion is, to a large extent, well described by the rigid rotor model. The molecule is assumed
to be rotating around its central axis with a fixed bond length. The energy scale of the
rotations is much smaller than the vibrational energies and the rotational states can be seen as
the fine structure of each vibrational state.
Since the energy levels are quantized, transitions can be made between different levels if
certain selection rules are satisfied. Transitions are often made during absorption or emission
of a photon, whose energy corresponds to the energy difference between the two levels.

6
Electronic transitions correspond to energies in the ultraviolet or visible region of the
electromagnetic spectrum (1 10-8
-4 10-7
resp. 4 10-7
-7 10-7
m), vibrational transitions to
energies in the infrared region (7 10-7
-1 10-3
m) and pure rotational transitions to the
microwave region (0.001-0.1 m).
2.3 IR-spectroscopy
If nothing else is stated, the following section is obtained from Quantum Chemistry and
Spectroscopy by Tomas Engel (2013) [14].
Spectroscopy is a powerful tool for investigations on molecular level and the technique is
based on the light-matter interaction, namely the molecular transitions that occur between
allowed energy states in the interaction with electromagnetic radiation. As mentioned in the
previous section, the energy of molecular vibrations corresponds to the infrared region of the
electromagnetic spectrum, thus a common method to detect and measure these vibrations is
infrared absorption spectroscopy.
In general, the infrared spectrum of a sample is obtained by passing a beam of light through a
cell where the sample is confined, followed by detection of the transmitted light. The
relationship between the intensities of the incident and transmitted IR light, the molar
concentration of the sample and the absorption path length is given by Beer-Lamberts law.
and are the transmitted and incident light intensity, respectively, is the molar
absorption coefficient, is the molar concentration of the sample and is the path length.
From Beer-Lamberts law, expressions can be derived for the transmittance, and absorbance,
.
( )
A technique to obtain infrared spectra has been developed called Fourier Transform Infrared
Spectroscopy (FTIR). The principle for FTIR is that the light is split into two beams, one is
sent through the sample towards a fixed mirror at the end of the cell and the other is sent
towards a movable mirror. The reflected beams are recombined and sent to the detector. Due
to the movable mirror it is possible to determine which frequencies that have been absorbed
by the sample since the recombined waves give rise to an interference pattern, called an
interferogram. The interferogram is converted to a spectrum using Fourier transform
techniques and the spectrum is usually obtained by plotting transmittance or absorbance
versus wavenumber. The advantage using FTIR compared to the conventional method is
primarily the possibility to measure over the whole range of frequencies simultaneously thus
the spectra can be obtained much quicker.
Not every molecule can be seen in an IR-spectrum, i.e. is IR-active. The absorption of the
infrared radiation requires that the molecular vibration causes a change in the dipole moment

7
of the molecule. The result is that centrosymmetric molecules such as N2, O2 and Cl2 will not
be IR-active but HCl, CO and CO2 will.
The IR-spectrum for CO is shown in Figure 3. Smaller molecules, such as CO, show a more
detailed structure than larger molecules which often have a large number of vibrations
affecting each other. The characteristic pattern shown in Figure 3 is not only the vibrational
transition but also the change in rotational motion due to the vibrational change. A schematic
picture of the allowed transitions is shown in Figure 4. Vibrational- and rotational states are
denoted and , respectively. The region with =+1 transitions is called the R-branch and
the region with =-1 transitions is called the P-branch, corresponding to higher and lower
frequencies, respectively. Thus, in Figure 3 the R-branch is seen to the left in the spectrum
and the P-branch to the right.
Figure 3. IR-spectrum of CO [22].

8
Figure 4. Allowed transitions between different energy levels in a molecule with n as the vibrational state and J
as the rotational state.
2.4 Functional groups
If nothing else is stated, the following section is obtained from Spectroscopic methods in
organic chemistry by Dudley H. Williams and Ian Fleming (1995) [15].
Useful when determining the structure of a molecule using IR-spectroscopy is the presence of
functional group frequencies. It is vibrations of individual bonds or functional groups that
give rise to absorption in a relatively narrow frequency range. The vibrations can be of
different character, namely stretching, bending, rocking, twisting or wagging, see Figure 5.
These types of vibrations will be found in different frequency ranges even if they correspond
to the same functional group. The characteristic group frequencies are primarily seen in the
region above 1500 cm-1
but some are present also below 1500 cm-1
, in a region called the
fingerprint region; fingerprint in the sense that it is primarily the combined vibrations of
larger molecules, which are characteristic for that specific molecule that will be found there.
Figure 5. Vibrational types for the methylene group.
There are some general features that can be pointed out when it comes to vibrational
frequencies. Absorbing frequencies corresponding to stretching vibrations are in general
higher the greater the strength is between two similar atoms, i.e. triple bonds vibrate at higher
frequency than double bonds and double bonds at higher frequency than single bonds. This is
also true for larger molecules e.g. unsaturated hydrocarbon chains, which means that are
double bonds in the molecule, absorbing in a different region than the saturated counterparts,

9
which have only single bonds. The vibration frequency also depends on the weight of the
atoms. For example, stretching vibrations for single bonds to hydrogen give rise to absorption
at high frequencies as a result of its low mass. A couple of functional groups and their
characteristic frequencies at which they absorb are shown in Table 1.
Table 1. Absorption ranges for functional groups [15].
Functional group Name and vibrational type Absorption range
C-H stretch
C-H deformation
3050-2850 cm-1
1470-1430 cm-1
CH3 deformation 1390-1370 cm-1
1470-1430 cm-1
O-H bending
1410-1260 cm-1
C-O stretch 1300-1040 cm-1
Carbonyl stretch 1850-1700 cm-1
Alcohols 1150-1040 cm-1
1410-1260 cm-1
Saturated carboxylic acids 3000-2500 cm-1
1725-1700 cm-1
Saturated acid chlorides 1815-1790 cm-1
Saturated aldehydes 1740-1720 cm-1
Saturated ethers
1150-1070 cm-1
Saturated esters
1750-1735 cm-1
1300-1050 cm-1

10
3. Method
3.1 Experimental data
In this project, the reaction between THF and Cl was investigated in two different
environments, a N2/O2 mixture respectively in pure N2. The N2/O2 mixture was of air
composition i.e. 79 % N2 and 21 % O2. Even though the use of OH as a reactant would be
slightly more interesting in an atmospheric point of view, Cl is preferable since it reacts in a
similar way but gives cleaner spectra. The production of OH needs both O3 and H2O which
gives a lot of undesirable noise and complicates the product analysis. Reactions in both N2/O2
and N2 are performed in order to determine the role of O2 in the reaction mechanism. Since
there are fewer reactants in the N2 experiment, the product analysis is believed to be simpler.
The experimental work was not a part of this project and data was obtained from the Bachelor
Thesis report Furans – The potential atmospheric impact of a next-generation bio fuel by
Stina Ausmeel (2012) [16]. The experiments were performed in a photochemical reactor at
Copenhagen Center for Atmospheric Research in 2012 [17]. They were made under
atmospheric conditions at a temperature of 25 and a pressure of 980 mbar. In each
environment, two experiments were made with different initial concentrations in order to
ensure that all products were registered since their peaks have varying strength, see Table 2.
However, in both cases the partial pressure of initiated chlorine was ten times higher than of
THF. An excess of chlorine is desirable to avoid other reactions to take place than with the Cl
atoms. An UV-lamp emitting light in the wavelength range 325-380 nm was used in order to
dissociate Cl2 into reactive Cl atoms, required for the reaction to take place. The photolysis
was made in series of 10 photolysis intervals. The first intervals were approximately 1 second
and then successively increased from 2 seconds up to 10 seconds. These short intervals are
needed due to the high reactivity of THF and it is desirable if the reaction does not take place
at once but in several steps. After each photolysis interval, a pause of 2 minutes was made
before the spectrum was taken to allow the initiated chemistry to fully proceed. The spectra
have the resolution 0.5 cm-1
and were performed with 32 scans. The spectral interval is in the
mid-IR range from about 950 cm-1
to 3200 cm-1
.
Table 2. Experimental data [16].
Initial compounds Partial pressures [10-3
mbar] Total pressure [mbar]
THF
Cl2
N2/O2
4.3
150.8
985
THF
Cl2
N2/O2
9.9
169.7
980
THF
Cl2
N2
4.6
159.8
983
THF
Cl2
N2
9.6
242.2
978

11
3.2 Analysis
In the product analysis, the degradation mechanism and product distribution for THF in N2/O2
and N2 are determined. The product formation can be visualized in the photolysis series with
the computer program OPUS. In OPUS it is possible to subtract reference spectra for known
products to enhance the visualization of unknown products. Figure 6 shows spectra from the
N2/O2 and N2 experiment. The initial spectra show only the reactants while the last spectra
show only products. The intermediate steps show the formation and growth of products.
Figure 6. Spectra in the series for; Left: N2/O2 experiment Right: N2 experiment. Note the scale difference on the
y axis for the left and the right spectra.
By identification of functional groups one can get information of the molecular structure. A
certain molecule usually has many absorption frequencies, which further on are denoted
peaks. Since many products are formed in a reaction, it is difficult to know which peaks that
belong to which molecule. Some peaks may overlap which further complicates the
identification. To group the peaks one can study their growth rate. Figure 7 shows spectra
from the experiment with N2. To a first approximation, the 1143 cm-1
peak can be grouped
with the 1260 cm-1
peak since both grow until photolysis 6 and then start to decrease. Also,
peak 1165 cm-1
can be grouped with the 1210 cm-1
peak since they have a similar growth rate.

12
Figure 7. The fingerprint region for N2 experiment.
The procedure described above may result in qualified guesses of products and several
methods are used in order to verify them. The experimental spectra can be compared with
existing spectra obtained from NIST [18] and the EUROCHAMP database [19]. The
resolution of these spectra is varying but can in most cases be used for verification. The
undetermined products, to which no spectra were found in the databases, were computed with
the computer program Gaussian 09 [20]. The calculated spectra give only the major features
of the structure, see Figure 8.

13
Figure 8. Spectra of H2CO a) Calculated with Gaussian 09 [20] b) Experimental.
When a product is known, its change of concentration with photolysis time can be obtained
using MALT (Multi-Atmospheric Layer Transmission), a program for simulation and fitting
of infrared spectra [21]. The program takes a chosen region of the experimental spectrum as
input. With a spectral fitting procedure that takes several parameters, such as pressure
broadening and temperature into account a synthetic spectrum is obtained. The simulation of
the spectrum is made using either line parameters from the HITRAN database [22], or high-
resolution reference spectra. The output is the experimental spectrum, the synthetic spectrum
and the residual, which is simply the difference between the first two. Figure 9 shows the
fitting of CO in the N2/O2 experiment. Since the concentration of the substance is known in
the reference spectrum, the concentration in the experimental spectrum is obtained from the
program after the fitting procedure. The program is also able to distinguish overlapping peaks
from components of a gas mixture. Figure 10 shows the reference spectra for THF and HCl
used in the fitting procedure and Figure 11 shows the output components.

14
Figure 9. MALT components for the fitting of CO in N2/O2 experiment photolysis 5 [22]. The spectra are offset
vertically.
Figure 10. Reference spectra for a) HCl [22] and b) THF used in the fitting procedure.

15
Figure 11. MALT components for the fitting of THF and HCl in N2 experiment photolysis 4. The spectra are
offset vertically.

16
4. Results and Discussion
The results of product studies of the Cl-atom initiated oxidation of THF are presented in this
section, both in N2/O2 mixture and in N2. Initially, a general picture of the product distribution
for both environments is obtained by a rough analysis of Figure 6. Similarities in the two
spectra are the approximate same amount of HCl building up during the experiments and the
continuous decrease of absorption in the 3000 cm-1
region. In the intermediate region of the
spectra, N2/O2 shows a continuous increase of CO and CO2, which peaks are identified at
2150 cm-1
and 2350 cm-1
, respectively, while N2 shows a very small amount of CO and CO2
building up. A close inspection of the region showing the CO and CO2 is shown in Figure 12.
N2/O2 shows strong absorption in the carbonyl region (1850-1700 cm-1
) while there are only
indications of absorption in the same region of the N2 spectra. Both environments show
activity in the fingerprint region but there are fewer peaks in the N2/O2 spectra than in the N2
spectra. None of the spectra shows peaks in the 1700-1500 cm-1
region which indicates an
absence of alkenes, unsaturated compounds containing at least one carbon-carbon double
bond, which usually show absorption in that region [15]. Note that ethylene (C2H4), which is
the simplest alkene, does not absorb in that region due to the symmetry of that molecule.
Figure 12. The region showing the absorption of CO2 at 2350 cm-1
and CO at 2150 cm-1
in N2/O2 (upper panel)
and in N2 (lower panel). Note the scale difference on the y axes.

17
4.1 N2/O2 experiment
4.1.1 Primary products
The primary products observed in the N2/O2 experiment are butyrolactone (C4H6O2),
succinaldehyde (C4H6O2) and propyl formate (C4H8O2), the latter two as the primary ring-
opening products. Reactions are shown in 1a and 1b. Reaction 1a shows following steps: 1)
Hydrogen abstraction leads to formation of radical and HCl 2) Oxygen molecule (O2) binds to
radical position 3) Peroxy species (RO2), where R represents an alkyl group or H only,
abstracts an oxygen atom to form RO and O2 4.1) Hydrogen abstraction leads to the formation
of butyrolactone 4.2) Ring-opening of radical 4.2.1) Decomposition of radical leads to
formation of succinaldehyde. Reaction 1b shows the following steps: 1) Analogy to Reaction
1a (steps 1-3) 2) Ring-opening of radical 3) H binds to radical to form propyl formate. The
reaction mechanism leading to the formation of the products in Reaction 1a and 1b,
respectively, is consistent with the calculations made in the theoretical study, which shows
that the barriers for hydrogen abstraction from the ring is lower close to the heterocyclic
oxygen atom [9]. Step 4.1 and 4.2 are competing reaction ways which is shown in a similar
study for the gas-phase reaction of OH with cyclohexane [23]. Cyclohexane (C6H12) consists
of six carbon atoms in a ring structure and the results in the study apply for all cyclic
compositions, i.e. THF and radicals of THF are included. Butyrolactone and propyl formate
are identified by comparing their reference spectra [18] with the product spectra and the later
also by identification of absorbance in regions characteristic for the functional group of esters,
see Table 1. Figure 13 shows the reference spectra together with the product spectrum and
Figure 14 shows a close up inspection on the ester absorption regions. Reference spectrum for
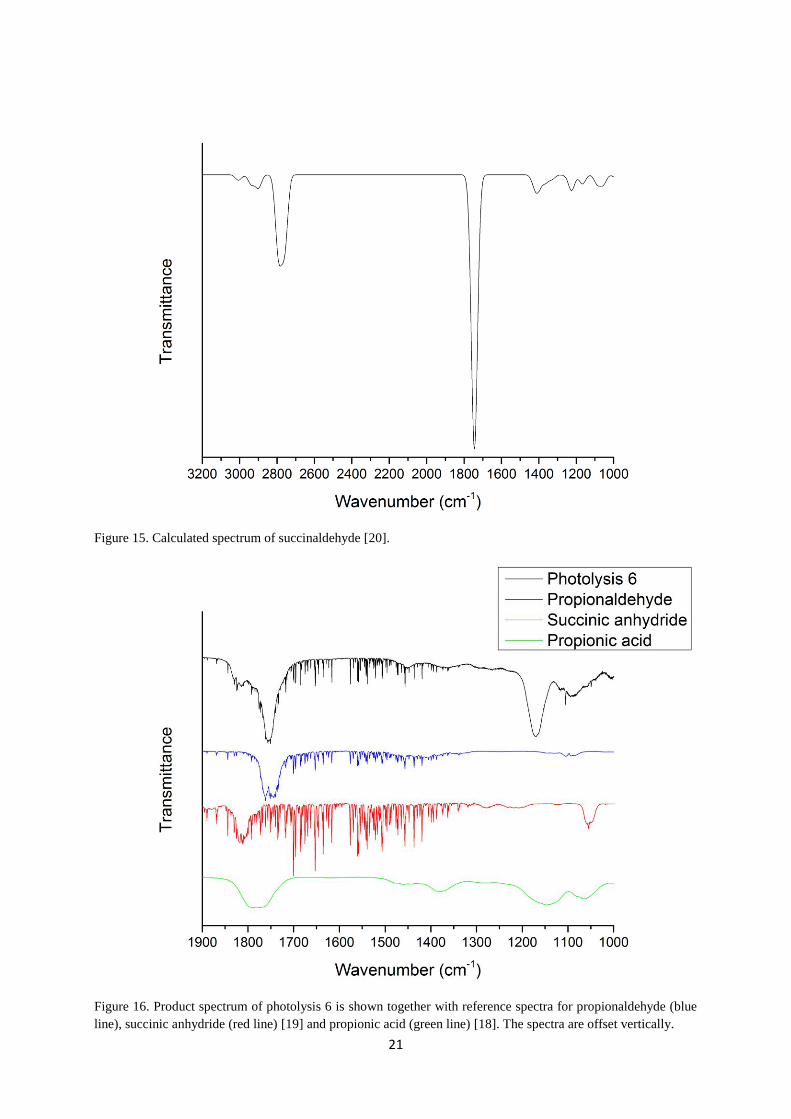
succinaldehyde is calculated with Gaussian 09 [20] and is shown in Figure 15.

18
Reaction 1a. THF reacts in several steps to form butyrolactone resp. succinaldehyde.
Reaction 1b. THF ring-opens to form propyl formate.

19
Figure 13. Product spectrum of photolysis 4 is shown together with reference spectra of propylformate (red line)
and butyrolactone (blue line) [18]. The spectra are offset vertically.
Figure 14. The initial spectrum and product spectrum of photolysis 2, 6 resp. 10 are shown in two different
regions. Peaks corresponding to identified products are marked in the figure.
20
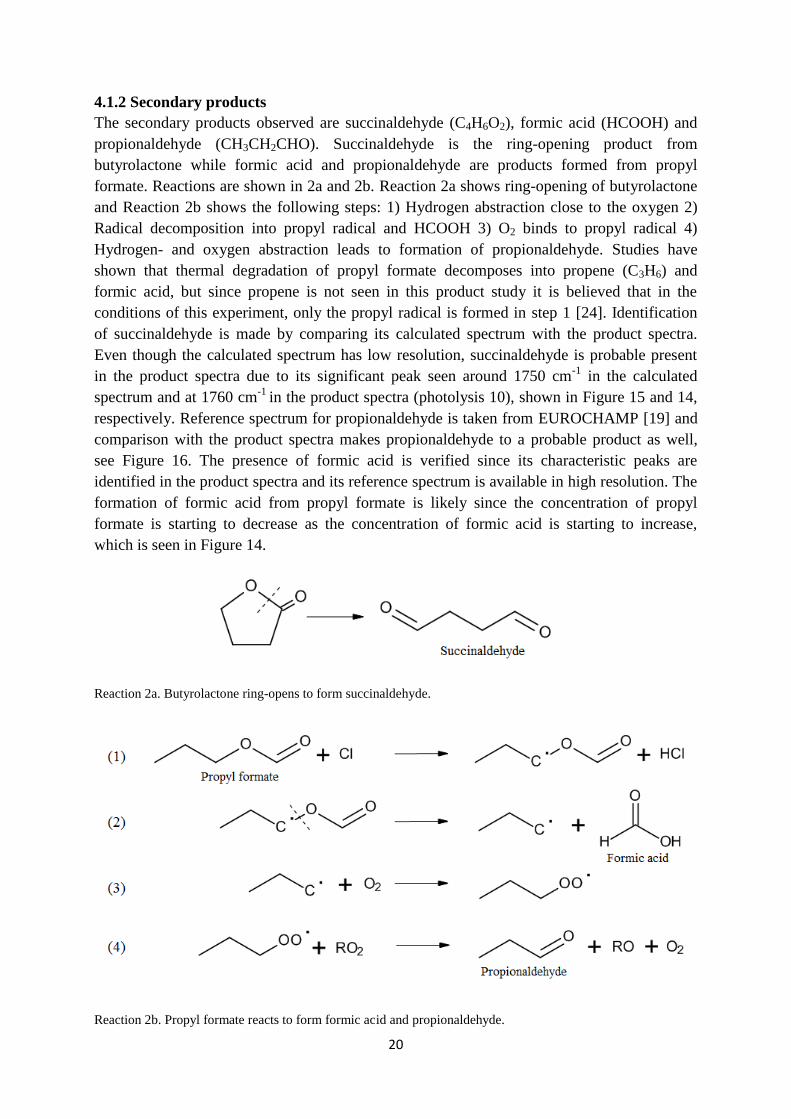
4.1.2 Secondary products
The secondary products observed are succinaldehyde (C4H6O2), formic acid (HCOOH) and
propionaldehyde (CH3CH2CHO). Succinaldehyde is the ring-opening product from
butyrolactone while formic acid and propionaldehyde are products formed from propyl
formate. Reactions are shown in 2a and 2b. Reaction 2a shows ring-opening of butyrolactone
and Reaction 2b shows the following steps: 1) Hydrogen abstraction close to the oxygen 2)
Radical decomposition into propyl radical and HCOOH 3) O2 binds to propyl radical 4)
Hydrogen- and oxygen abstraction leads to formation of propionaldehyde. Studies have
shown that thermal degradation of propyl formate decomposes into propene (C3H6) and
formic acid, but since propene is not seen in this product study it is believed that in the
conditions of this experiment, only the propyl radical is formed in step 1 [24]. Identification
of succinaldehyde is made by comparing its calculated spectrum with the product spectra.
Even though the calculated spectrum has low resolution, succinaldehyde is probable present
in the product spectra due to its significant peak seen around 1750 cm-1
in the calculated
spectrum and at 1760 cm-1
in the product spectra (photolysis 10), shown in Figure 15 and 14,
respectively. Reference spectrum for propionaldehyde is taken from EUROCHAMP [19] and
comparison with the product spectra makes propionaldehyde to a probable product as well,
see Figure 16. The presence of formic acid is verified since its characteristic peaks are
identified in the product spectra and its reference spectrum is available in high resolution. The
formation of formic acid from propyl formate is likely since the concentration of propyl
formate is starting to decrease as the concentration of formic acid is starting to increase,
which is seen in Figure 14.
Reaction 2a. Butyrolactone ring-opens to form succinaldehyde.
Reaction 2b. Propyl formate reacts to form formic acid and propionaldehyde.
21
Figure 15. Calculated spectrum of succinaldehyde [20].
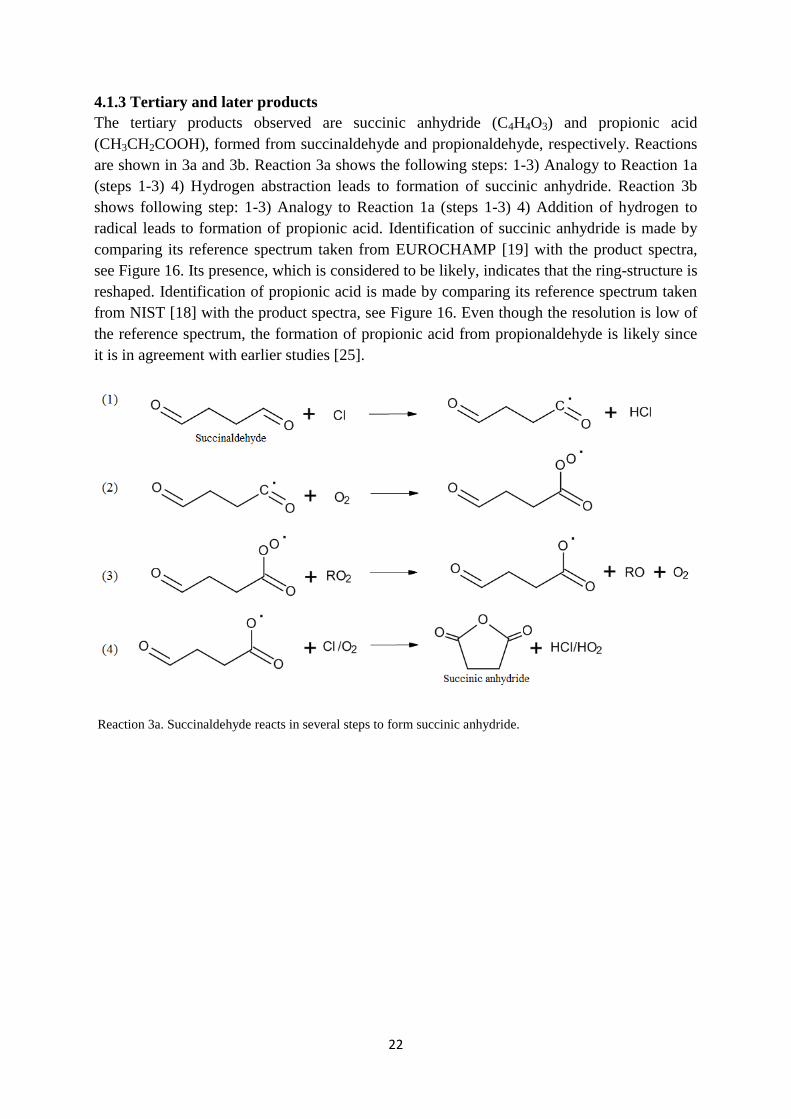
Figure 16. Product spectrum of photolysis 6 is shown together with reference spectra for propionaldehyde (blue
line), succinic anhydride (red line) [19] and propionic acid (green line) [18]. The spectra are offset vertically.
22
4.1.3 Tertiary and later products
The tertiary products observed are succinic anhydride (C4H4O3) and propionic acid
(CH3CH2COOH), formed from succinaldehyde and propionaldehyde, respectively. Reactions
are shown in 3a and 3b. Reaction 3a shows the following steps: 1-3) Analogy to Reaction 1a
(steps 1-3) 4) Hydrogen abstraction leads to formation of succinic anhydride. Reaction 3b
shows following step: 1-3) Analogy to Reaction 1a (steps 1-3) 4) Addition of hydrogen to
radical leads to formation of propionic acid. Identification of succinic anhydride is made by
comparing its reference spectrum taken from EUROCHAMP [19] with the product spectra,
see Figure 16. Its presence, which is considered to be likely, indicates that the ring-structure is
reshaped. Identification of propionic acid is made by comparing its reference spectrum taken
from NIST [18] with the product spectra, see Figure 16. Even though the resolution is low of
the reference spectrum, the formation of propionic acid from propionaldehyde is likely since
it is in agreement with earlier studies [25].
Reaction 3a. Succinaldehyde reacts in several steps to form succinic anhydride.
23
Reaction 3b. Propionaldehyde reacts in several steps to form propionic acid.
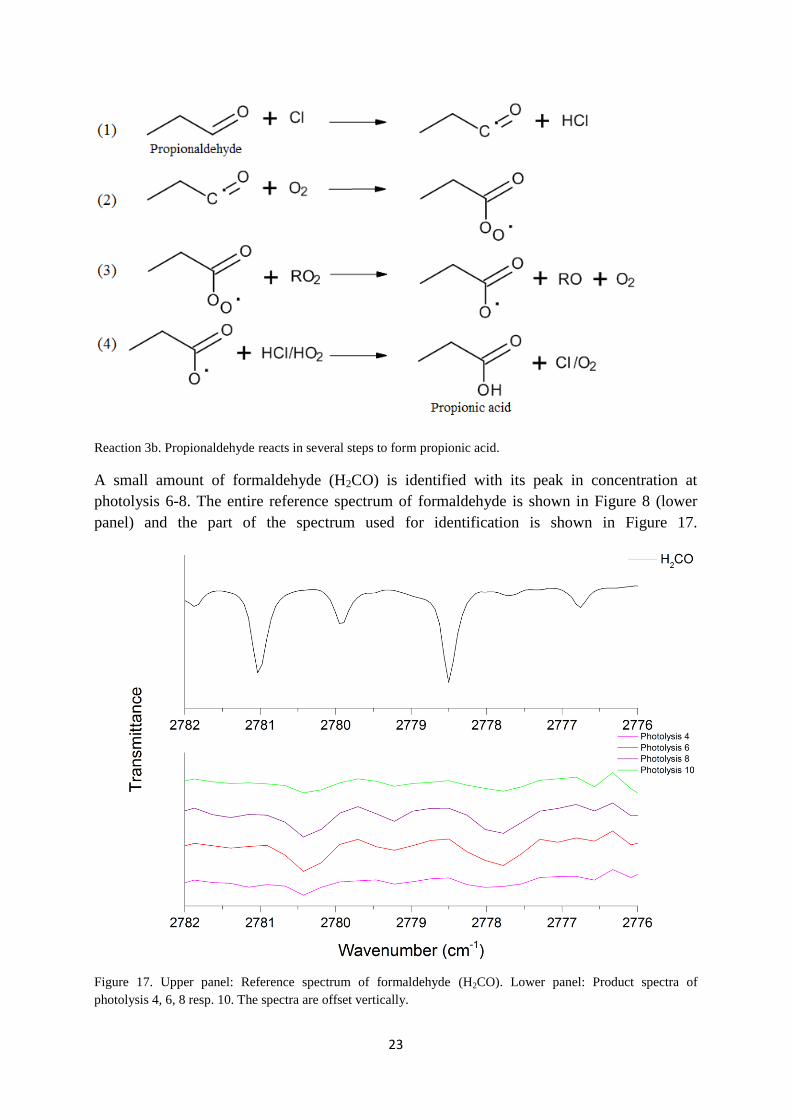
A small amount of formaldehyde (H2CO) is identified with its peak in concentration at
photolysis 6-8. The entire reference spectrum of formaldehyde is shown in Figure 8 (lower
panel) and the part of the spectrum used for identification is shown in Figure 17.
Figure 17. Upper panel: Reference spectrum of formaldehyde (H2CO). Lower panel: Product spectra of
photolysis 4, 6, 8 resp. 10. The spectra are offset vertically.
24
HCl is formed continuously during the experiment which is identified as the characteristic
structure in the region 3050-2700 cm-1
, shown in Figure 10 (upper panel). The formation of
HCl is probably a result of the hydrogen abstraction as a common mechanism in the reaction
series. CO and CO2 are also formed continuously during the experiment, CO as a precursor to
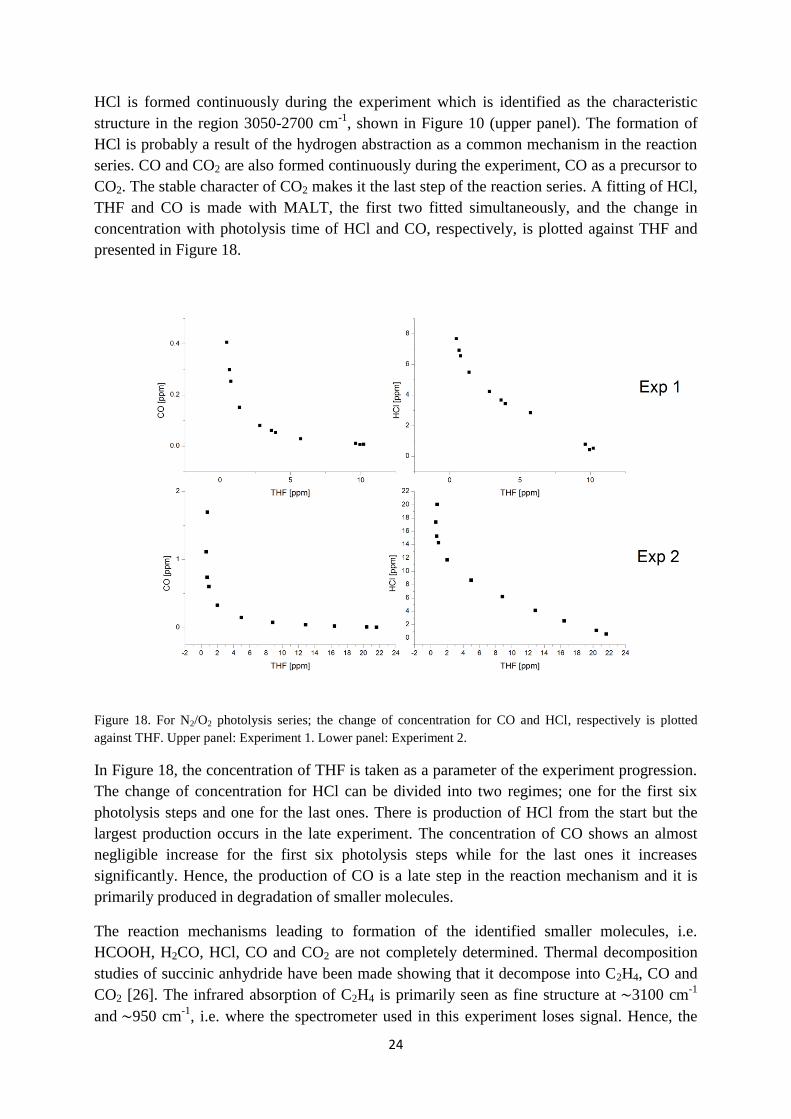
CO2. The stable character of CO2 makes it the last step of the reaction series. A fitting of HCl,
THF and CO is made with MALT, the first two fitted simultaneously, and the change in
concentration with photolysis time of HCl and CO, respectively, is plotted against THF and
presented in Figure 18.
Figure 18. For N2/O2 photolysis series; the change of concentration for CO and HCl, respectively is plotted
against THF. Upper panel: Experiment 1. Lower panel: Experiment 2.
In Figure 18, the concentration of THF is taken as a parameter of the experiment progression.
The change of concentration for HCl can be divided into two regimes; one for the first six
photolysis steps and one for the last ones. There is production of HCl from the start but the
largest production occurs in the late experiment. The concentration of CO shows an almost
negligible increase for the first six photolysis steps while for the last ones it increases
significantly. Hence, the production of CO is a late step in the reaction mechanism and it is
primarily produced in degradation of smaller molecules.
The reaction mechanisms leading to formation of the identified smaller molecules, i.e.
HCOOH, H2CO, HCl, CO and CO2 are not completely determined. Thermal decomposition
studies of succinic anhydride have been made showing that it decompose into C2H4, CO and
CO2 [26]. The infrared absorption of C2H4 is primarily seen as fine structure at 3100 cm-1
and 950 cm-1
, i.e. where the spectrometer used in this experiment loses signal. Hence, the
25
presence of C2H4 is possible but not verified and the consistency with the above mentioned
study is undetermined.
Finally, there are probably still unidentified products in the spectra; for example, it is unclear
what molecule the peak at 1000 cm-1
(Figure 14) corresponds to.
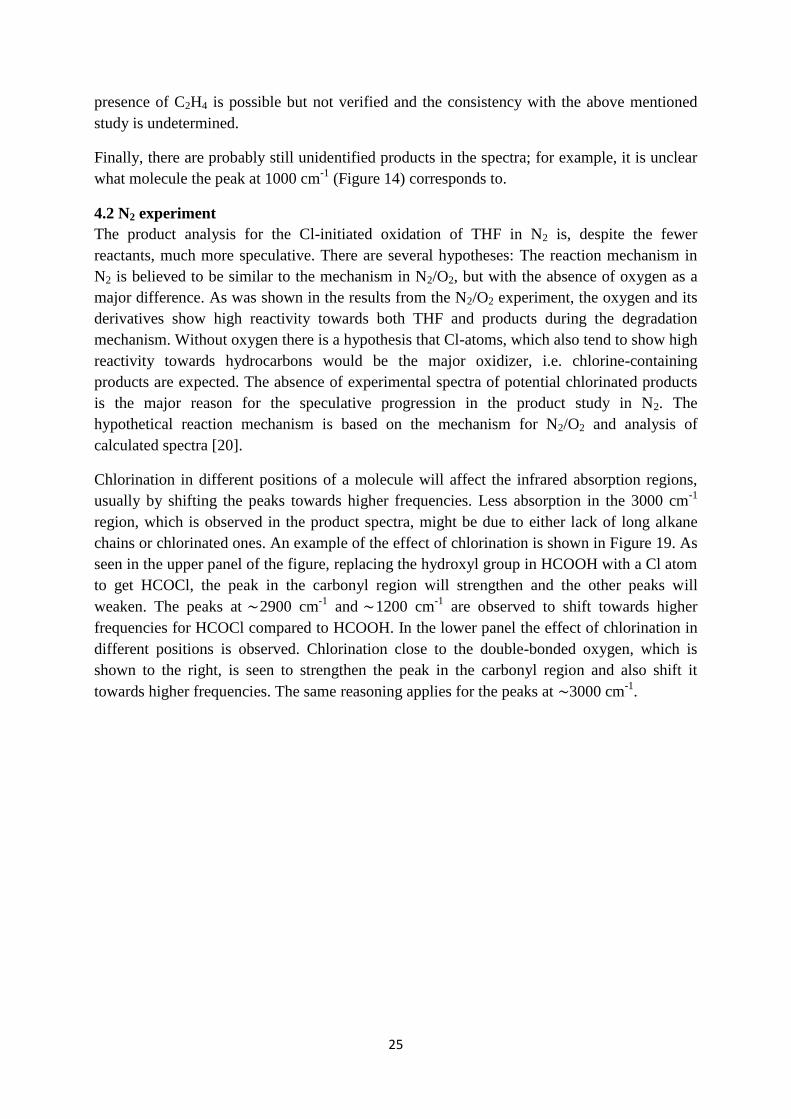
4.2 N2 experiment
The product analysis for the Cl-initiated oxidation of THF in N2 is, despite the fewer
reactants, much more speculative. There are several hypotheses: The reaction mechanism in
N2 is believed to be similar to the mechanism in N2/O2, but with the absence of oxygen as a
major difference. As was shown in the results from the N2/O2 experiment, the oxygen and its
derivatives show high reactivity towards both THF and products during the degradation
mechanism. Without oxygen there is a hypothesis that Cl-atoms, which also tend to show high
reactivity towards hydrocarbons would be the major oxidizer, i.e. chlorine-containing
products are expected. The absence of experimental spectra of potential chlorinated products
is the major reason for the speculative progression in the product study in N2. The
hypothetical reaction mechanism is based on the mechanism for N2/O2 and analysis of
calculated spectra [20].
Chlorination in different positions of a molecule will affect the infrared absorption regions,
usually by shifting the peaks towards higher frequencies. Less absorption in the 3000 cm-1
region, which is observed in the product spectra, might be due to either lack of long alkane
chains or chlorinated ones. An example of the effect of chlorination is shown in Figure 19. As
seen in the upper panel of the figure, replacing the hydroxyl group in HCOOH with a Cl atom
to get HCOCl, the peak in the carbonyl region will strengthen and the other peaks will
weaken. The peaks at 2900 cm-1
and 1200 cm-1
are observed to shift towards higher
frequencies for HCOCl compared to HCOOH. In the lower panel the effect of chlorination in
different positions is observed. Chlorination close to the double-bonded oxygen, which is
shown to the right, is seen to strengthen the peak in the carbonyl region and also shift it
towards higher frequencies. The same reasoning applies for the peaks at 3000 cm-1
.

26
Figure 19. Calculated spectra of HCOOH, HCOCl, CH2ClCHO and CH3COCl, respectively [20] and the
corresponding molecular structure.
In same manner as for N2/O2, the first step in the reaction chain is hydrogen abstraction from
the ring, most probably close to the heterocyclic oxygen atom. The absence of reactive
oxygen makes it more probable that Cl atoms add to the radical position. The two most
probable reactions are shown in 4a and 4b. Reaction 4a shows the following steps: 1)
Hydrogen abstraction leads to formation of radical and HCl 2) Cl atom binds to radical
position. Reaction 4b (step 1-2) is analogous to Reaction 4a (step 1-2). Calculated spectra for
THF and chlorinated compounds of THF are shown in Figure 20 together with the initial
experimental spectrum and the second spectrum in the photolysis series. Only the absorption
regions for the compounds are shown. When analysing the calculated spectra, primarily the
relative strength and position of the peaks are of interest and less the actual position of the
peak since they can involve a large shift. For a clearer figure visualisation, the calculated
spectrum of THF has been matched to the initial experimental spectrum, which only consists
of THF. Hence, the shift in the x-direction needed for matching the calculated THF with the
“experimental THF” also applies for the other calculated spectra to maintain the relative
positions.

27
Reaction 4a. THF reacts to form 2-Cl-THF.
Reaction 4b. THF reacts to form 3-Cl-THF.
Figure 20. The initial spectrum and the product spectrum of photolysis 2 are shown together with calculated
reference spectra of THF, 2-Cl-THF and 3-Cl-THF [20]. The spectra are offset vertically.

28
The difficulty in the type of analysis when the reference spectra do not show any detailed
structures is primarily the overlaps. Molecules absorbing at partly the same frequencies will
create a unique peak when they sum up, i.e. are present in the same spectrum. This reasoning
applies also for the peaks corresponding to THF which decrease, but remain until the last
photolysis steps in the experimental spectra.
However, analysis of Figure 20 motivates both 2-Cl-THF and 3-Cl-THF as potential products.
To the right in the figure, showing the lower frequency region, following observations can be
made: the peak corresponding to THF at 1100 cm-1
has not decreased at photolysis 2, rather it
has increased which motivates the formation of other products in the region, the peak at 1040
cm-1
corresponding to 3-Cl-THF can be seen as a weak peak building up in photolysis 2 and it
also supports the broadening of the 1100 cm-1
peak, 3-Cl-THF also builds up another weak
peak at 1300 cm-1
. Slightly to the right, at about 1260 cm-1
, there is an overlap for 3-Cl-THF
and 2-Cl-THF which probable accounts for the stronger peak seen at those frequencies in
photolysis 2. The peak at 1200 cm-1
in the spectrum of 2-Cl-THF is probably seen in
photolysis 2 at 1190 cm-1
, i.e. slightly shifted. 2-Cl-THF is also a product candidate due to its
strong and broad peak at 1100 cm-1
, which accounts for the strengthening and broadening of
the peak in that region. To the left in the figure, showing the higher frequency range there are
also several observations made. By comparing the initial spectrum with the one from
photolysis 2 something is seen building up in the region between the two strong peaks
corresponding to THF. That can probably be 2-Cl-THF which has a relatively strong peak at
2940 cm-1
. It is also observed that the left peak of THF seems broader in photolysis 2,
especially to the left (at 3025 cm-1
). This is probably due to the overlap of 2-Cl-THF and 3-
Cl-THF seen at those frequencies. Also, the left peak does not decrease as fast as the right
peak which gives indications of absorption by products in that region, which 2-Cl-THF
actually shows.
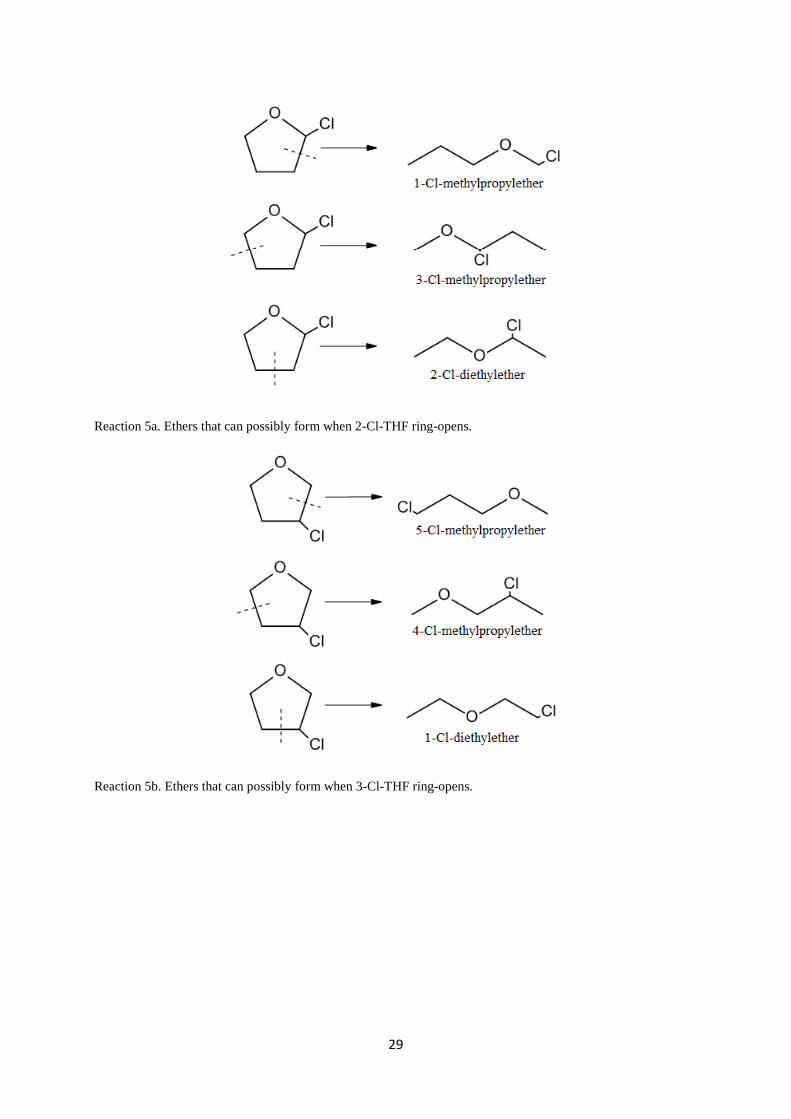
Applying the ring-opening mechanism in N2 motivates the formation of ethers. Reaction 5a
and 5b show ethers that can possibly form from 2-Cl-THF and 3-Cl-THF by different ring-
opening mechanisms. Identification of relatively strong absorption in the 1150-1070 cm-1
region, characteristic for the functional group of ethers supports the proposed mechanism, see
Figure 21.
29
Reaction 5a. Ethers that can possibly form when 2-Cl-THF ring-opens.
Reaction 5b. Ethers that can possibly form when 3-Cl-THF ring-opens.

30
Figure 21. The initial spectrum and the product spectra of photolysis 2, 6 resp. 10 are shown in the fingerprint
region.
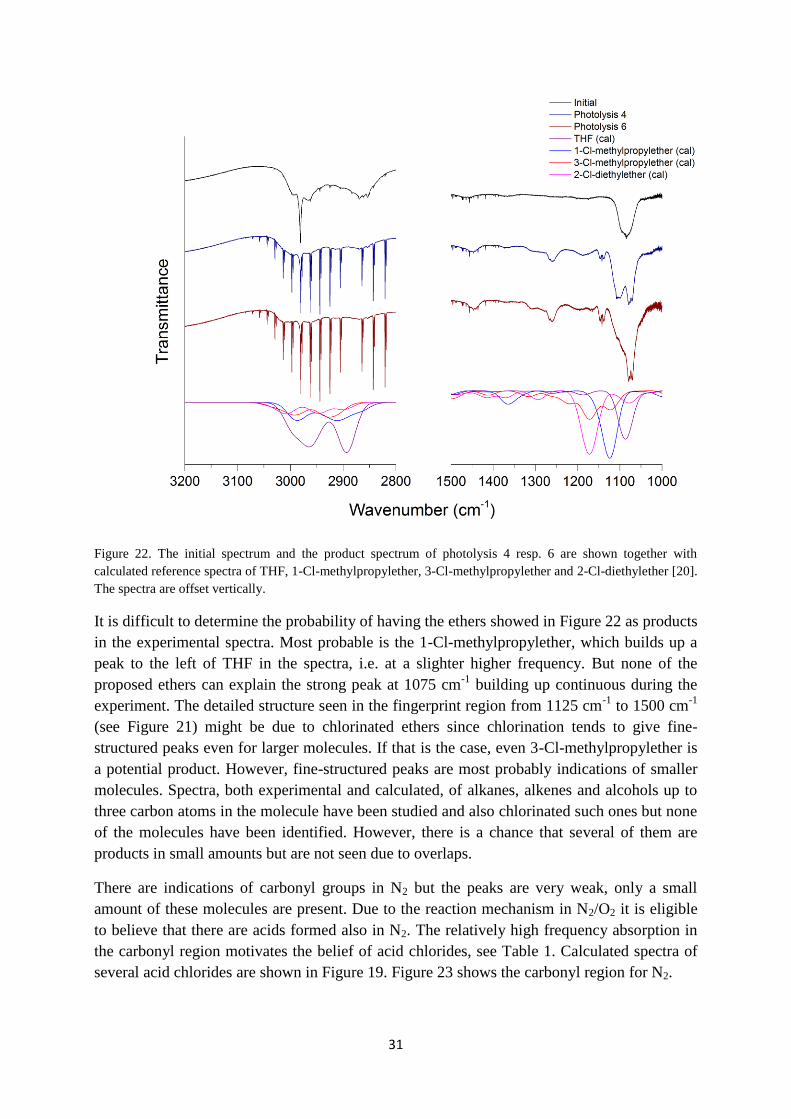
Figure 22 shows the calculated spectra for the chlorinated ethers proposed in reaction 5a
together with the initial experimental spectrum and several spectra from the photolysis series.
The calculated spectrum of THF is again used as reference to enhance the visualisation.
31
Figure 22. The initial spectrum and the product spectrum of photolysis 4 resp. 6 are shown together with
calculated reference spectra of THF, 1-Cl-methylpropylether, 3-Cl-methylpropylether and 2-Cl-diethylether [20].
The spectra are offset vertically.
It is difficult to determine the probability of having the ethers showed in Figure 22 as products
in the experimental spectra. Most probable is the 1-Cl-methylpropylether, which builds up a
peak to the left of THF in the spectra, i.e. at a slighter higher frequency. But none of the
proposed ethers can explain the strong peak at 1075 cm-1
building up continuous during the
experiment. The detailed structure seen in the fingerprint region from 1125 cm-1
to 1500 cm-1
(see Figure 21) might be due to chlorinated ethers since chlorination tends to give fine-
structured peaks even for larger molecules. If that is the case, even 3-Cl-methylpropylether is
a potential product. However, fine-structured peaks are most probably indications of smaller
molecules. Spectra, both experimental and calculated, of alkanes, alkenes and alcohols up to
three carbon atoms in the molecule have been studied and also chlorinated such ones but none
of the molecules have been identified. However, there is a chance that several of them are
products in small amounts but are not seen due to overlaps.
There are indications of carbonyl groups in N2 but the peaks are very weak, only a small
amount of these molecules are present. Due to the reaction mechanism in N2/O2 it is eligible
to believe that there are acids formed also in N2. The relatively high frequency absorption in
the carbonyl region motivates the belief of acid chlorides, see Table 1. Calculated spectra of
several acid chlorides are shown in Figure 19. Figure 23 shows the carbonyl region for N2.

32
Figure 23. The product spectra of photolysis 2, 6 resp. 10 are shown in the carbonyl region.
The absorption regions in Figure 23 at 1775 cm-1
, 1815 cm-1
and 1845 cm-1
can possibly
correspond to CH2ClCHO, HCOCl and CH3COCl, respectively, for which calculated spectra
are shown in Figure 19.
HCl is formed in approximately the same amount as in the N2/O2 experiment and probably for
the same reason, namely hydrogen abstraction. CO and CO2 are also formed continuously
during the experiment but in much smaller amounts than for the N2/O2 experiment. In the
same manner as for the N2/O2 experiment, a fitting of HCl, THF and CO is made with MALT
and the change in concentration with photolysis time of HCl and CO, respectively is plotted
against THF and is presented in Figure 24.

33
Figure 24. For N2 photolysis series; the change of concentration for CO and HCl are plotted against THF. Upper
panel: Experiment 1. Lower panel: Experiment 2.
The correlations show the same trend as for the N2/O2 experiment with the largest increase of
HCl and CO at the end of the experiment.
To summarize the product study in N2, all the THF has reacted in the end of the experiment,
i.e. only products are present in the last spectrum. However, these products might be
predominantly larger molecules, such as chlorinated ethers due to the unsuccessful attempts to
identify smaller molecules. If that is the case, the reaction in N2 is slower than in N2/O2,
which perhaps is due to the fewer reactants.

34
5. Conclusion
The majority of the products in the N2/O2 experiment have been determined but there are still
some peaks in the photolysis series corresponding to unknown products. A complete product
distribution is necessary to be able to determine the reaction mechanism.
None of the products in the N2 experiment are verified but there are indications of chlorinated
molecules. For further identification of products in the N2 photolysis series, high-resolution
reference spectra would be advantageous.
In both experimental spectra, there are many molecules overlapping which make the product
verification difficult. Many of the proposed products absorb at frequencies outside the region
of the experimental spectra and examination of these would give more information about the
molecules. Hence, an advantage would be to have signal from a broader infrared region,
which requires other spectrometer equipment. Additional information would be obtained if
other spectroscopy methods were used, such as mass spectroscopy and nuclear magnetic
resonance spectroscopy.
An advantage of the reaction mechanism would be to know the concentrations of each
product and the change of concentration with photolysis time. This information can be
obtained by analysis with MALT but require high-resolution reference spectra for the fitting
procedure.
Conclusions that can be drawn are that all THF have reacted in the end of the experiment for
both experiments, thus react fast with Cl-atoms. This knowledge is of great importance
especially in marine regions, industrial polluted- and urban areas where the Cl concentration
is usually high. Noteworthy is also the fact that a completed reaction would only consist of
CO2 since that is considered to be the most stable molecule formed during the experiment.
Since there are still other products than CO2 in the last spectra of the experiments, the
reactions are not completed.
Advantageous in order to investigate the environmental impact of THF would be to make a
similar study of the OH-initiated oxidation of THF since the OH radical is one of the most
important oxidizers around the world.

35
References
[1] Solomon, S., Qin, D., Manning, M., Chen, Z., Marquis, M., Averyt, K. B., Tignor, M. and
Miller, H. L. (eds.) (2007), IPCC, 2007: Summary for Policemakers: Climate change 2007:
The Physical Science Basis. Contribution of Working Group I to the Fourth Assessment
Report of the Intergovernmental Panel on Climate Change, Cambridge University Press,
Cambridge, United Kingdom and New York, NY, USA
[2] Demirbas, A. (2009), Biofuels – Securing the Planet’s Future Energy Needs, Green
Energy and Technology, Springer-Verlag London Limited
[3] Sims, R., Taylor, M., Saddler, J., Mabee, W. (2008), From 1st- To 2
nd- Generation Biofuel
Technologies – An overview of current industry and RD&D activities, IEA Bioenergy,
OECD/IEA
[4] Jacobson, M. Z. (2007), Effects of ethanol (E85) versus gasoline vehicles on cancer and
mortality in the United States, Environmental Science & Technology, Vol. 41, No. 11, pp.
4150-4157
[5] Moriarty, J., Sidebottom, H., Wenger, J., Mellouki, A. and Le Bras, G. (2003), Kinetic
Studies on the Reactions of Hydroxyl Radicals with Cyclic Ethers and Aliphatic Diethers, The
Journal of Physical Chemistry A, Vol. 107, No. 10, pp. 1499-1505
[6] Alwe, H. D., Walawalkar, M., Sharma, A., Pushpa, K. K., Dhanya, S. and Naik, P. D.
(2012), Rate Coefficients for the Gas-Phase Reactions of Chlorine Atoms with Cyclic Ethers
at 298 K, International Journal of Chemical Kinetics, Wiley Periodicals, Inc.
[7] Giri, B. R. and Roscoe, J. M. (2010), Kinetics of the Reactions of Cl Atoms with Several
Ethers, The Journal of Physical Chemistry A, Vol. 114, No. 32, pp. 8369-8375
[8] Young, C. J., Washenfelder, R. A., Edwards, P. M., Parrish, D. D., Gilman, J. B., Kuster,
W. C., Mielke, L. H., Osthoff, H. D., Tsai, C., Pikelnaya, O., Stutz, J., Veres, P. R., Roberts,
J. M., Griffith, S., Dusanter, S., Stevens, P. S., Flynn, J., Grossberg, N., Lefer, B., Holloway,
J. S., Peischl, J., Ryerson, T. B., Atlas, E. L., Blake, D. R. and Brown, S. S. (2013),
Evaluating evidence for Cl sources and oxidation chemistry in a coastal, urban environment,
Atmospheric Chemistry and Physics Discussions, Vol. 13, pp. 13685-13720
[9] Simmie, J. M. (2012), Kinetics and Thermochemistry of 2,5-Dimethyltetrahydrofuran and
Related Oxolanes: Next Next-Generation Biofuels, The Journal of Physical Chemistry A, Vol.
116, No. 18, pp. 4528-4538
[10] Bierbach, A., Barnes, I. and Becker, K. H. (1995), Product and kinetic study of the OH
initiated gas-phase oxidation of furan, 2-methylfuran and furanaldehydes at 300 K,
Atmospheric Environment, Vol. 29, No. 19, pp. 2651-2660
[11] Villanueva, F., Barnes, I., Monedero, E., Salgado, S., Gómez, V. and Martin, P. (2007),
Primary product distribution from the Cl-atom initiated atmospheric degradation of furan:
Environmental implications, Atmospheric Environment, Vol. 41, pp. 8796-8810

36
[12] Seinfield, J. H. and Pandis, S. N. (2006), Atmospheric chemistry and physics – from air
pollution to climate change, 2nd
edition, John Wiley & Sons Inc., Hoboken, New Jersey
[13] Adams, J. W. and Cox, R. A. (2002), Halogen chemistry of the marine boundary layer,
Journal De Physique IV France, 12, EDP Sciences, Les Ulis
[14] Engel, T. (2013), Quantum Chemistry and Spectroscopy, 3rd
edition, Pearson Education,
Inc., United States
[15] Williams, D. H. and Fleming, I. (1995), Spectroscopic methods in organic chemistry, 5th
edition, McGraw-Hill Higher Education, UK
[16] Ausmeel, S. (2012), Furans – The potential atmospheric impact of a next-generation bio
fuel, Lund University, Sweden
[17] Nilsson, E. J. K., Eskebjerg, C. and Johnson, M. S. (2009), A photochemical reactor for
studies of atmospheric chemistry, Atmospheric Environment, Vol. 43, pp. 3029-3033
[18] Linstrom, P. J. and Mallard, W. G., Eds., NIST Chemistry WebBook, NIST
Standard Reference Database Number 69, National Institute of Standards and
Technology, Gaithersburg MD, 20899, (Online) Available: Internet <http://webbook.nist.gov>
(retrieved June 7, 2013)
[19] EUROCHAMP FTIR Spectral database, (Online) Available: Internet
<http://euphore.es/FTIRReferences2/index.php> (Downloaded May 2013)
[20] Frisch, M. J., Trunks, G. W., Schlegel, H. B., Scuseria, G. E., Robb, M. A., Cheeseman,
J. R., Scalmani, G., Barone, V., Mennucci, B., Petersson, G. A., Nakatsuji, H., Caricato, M.,
Li, X., Hratchian, H. P., Izmaylov, A. F., Bloino, J., Zheng, G., Sonnenberg, J. L., Hada, M.,
Ehara, M., Toyota, K., Fukuda, R., Hasegawa, J., Ishida, M., Nakajima, T., Honda, Y., Kitao,
O., Nakai, H., Vreven, T., Montgomery, Jr., J. A., Peralta, J. E., Ogliaro, F., Bearpark, M.,
Heyd, J. J., Brothers, E., Kudin, K. N., Staroverov, V. N., Kobayashi, R., Normand, J.,
Raghavachari, K., Rendell, A., Burant, J. C., Iyengar, S. S., Tomasi, J., Cossi, M., Rega, N.,
Millam, J. M., Klene, M., Knox, J. E., Cross, J. B., Bakken, V., Adamo, C., Jaramillo, J.,
Gomperts, R., Stratmann, R. E., Yazyev, O., Austin, A. J., Cammi, R., Pomelli, C., Ochterski,
J. W., Martin, R. L., Morokuma, K., Zakrzewski, V. G., Voth, G. A., Salvador, P.,
Dannenberg, J. J., Dapprich, S., Daniels, A. D., Farkas, Ö., Foresman, J. B., Ortiz, J. V.,
Cioslowski, J. and Fox, D. J. (2009), Gaussian 09, Revision A.1, Gaussian Inc., Wallingford
CT
[21] Griffith, D. W. T. (1996), Synthetic calibration and quantitative analysis of gas-phase
FT-IR spectra, Applied Spectroscopy, Vol. 50, pp. 59-70

37
[22] Rothman, L. S., Gordon, I. E., Barbe, A., Benner, D. C., Bernath, P. E., Birk, M.,
Boudon, V., Brown, L. R., Campargue, A., Champion, J. P., Chance, K., Coudert, L. H.,
Dana, V., Devi, V. M., Fally, S., Flaud, J. M., Gamache, R. R., Goldman, A., Jacquemart, D.,
Kleiner, I., Lacome, N., Lafferty, W. J., Mandin, J. Y., Massie, S. T., Mikhailenko, S. N.,
Miller, C. E., Moazzen-Ahmadi, N., Naumenko, O. V., Nikitin, A. V., Orphal, J., Perevalov,
V. I., Perrin, A., Predoi-Cross, A., Rinsland, C. P., Rotger, M., Simeckova, M., Smith, M. A.
H., Sung, K., Tashkun, S. A., Tennyson, J., Toth, R. A., Vandaele, A. C. and Vander Auwera,
J. (2009), The HITRAN 2008 molecular spectroscopic database, Journal of Quantitative
Spectroscopy & Radiative Transfer, Vol. 110, No. 9-10, pp. 533-572
[23] Aschmann, S. M., Chew, A. A., Arey, J. and Atkinson, R. (1997), Products of the Gas-
Phase Reaction of OH Radicals with Cyclohexane: Reactions of the Cyclohexoxy Radical,
The Journal of Physical Chemistry A, Vol. 101, No. 43, pp. 8042-8048
[24] Anderson, R. B., Rowley, H. H. (1943), Kinetics of the thermal decomposition of n-
propyl and isopropyl formates, The Journal of Physical Chemistry, Vol. 52, pp. 454-463
[25] Le Crâne, J-P., Villenave, E., Hurley, M. D., Wallington, T. J. and Ball, J. C. (2005),
Atmospheric Chemistry of Propionaldehyde: Kinetics and Mechanisms of Reactions with OH
Radicals and Cl Atoms, UV Spectrum, and Self-Reaction Kinetics of CH3CH2C(O)O2
Radicals at 298 K, The Journal of Physical Chemistry A, Vol. 109, No. 51, pp. 11837-11850
[26] Yamamoto, S. and Back, R. A. (1983), The thermal and photochemical decompositions
of succinic anhydride and 2,3-dimethyl succinic anhydride in the gas phase, Canadian
Journal of Chemistry, Vol. 61, No. 12, pp. 2790-2794