Luminescent organometallo-silica materials. Organometallic … · 2017-08-10 · Organometallic...
19
Electronic Supplementary Information Organometallic phosphors as building blocks in sol-gel chemistry. Luminescent organometallo-silica materials. C. Ezquerro, a A.E. Sepúlveda, a A. Grau-Atienza, b E. Serrano, b E. Lalinde, a J. R. Berenguer, *a J. García- Martínez *b a Departamento de Química-Centro de Investigación en Síntesis Química (CISQ), Universidad de La Rioja, Madre de Dios, 51, E-26006,Logroño, Spain. Tel: +34 941299646; *E-mail: [email protected]s, URL: https://cisq.unirioja.es/gmmo.php b Laboratorio de Nanotecnología Molecular. Departamento de Química Inorgánica. Universidad de Alicante, Carretera San Vicente s/n, E-03690, Alicante, Spain. Fax: +34 965903454; Tel: +34 965903400 ext.2224; *E-mail: [email protected], URL: www.nanomol.es General methods IR spectra were recorded on a Nicolet Nexus FT-IR Spectrometer in a wavenumber range from 4000 to 200 cm -1 . All samples were prepared as KBr pellets. Elemental analyses were carried out in a Perkin-Elmer 2400 CHNS/O and a Thermo Finnigan Flash 1112 microanalyzer. Mass spectra were recorded on a Microflex MALDI-TOF Bruker spectrometer. NMR spectra were recorded on Bruker ARX300 and ARX400 spectrometers. Chemical shifts are reported in parts per million (ppm) relative to external standards (SiMe 4 for 1 H and 13 C{ 1 H}, CFCl 3 for 19 F and H 3 PO 4 for 31 P{ 1 H}) and coupling constants in Hz. 1 H and 13 C{ 1 H} NMR spectra were assigned, following the numbering scheme shown in Figure S1, by means of 2D experiments ( 1 H- 1 H COSY and 1 H- 13 C HSQC and HMBC) dinuclear. UV-Vis spectra in solution were recorded on an Agilent 8453 spectrophotometer. Diffuse Reflectance UV-vis (DRUV) spectra were carried out in KBr pellets, using a Shimazdu UV-3600 spectrophotometer with a Harrick praying mantis accessory, and recalculated following the Kubelka Munk function. The excitation and emission spectra were obtained on a Jobin-Yvon Horiba Fluorolog 3-11 Tau-3 spectrofluorimeter. The lifetime measurements were performed operating in the phosphorimeter mode (with a F1-1029 lifetime emission PMT assembly, using a 450 W Xe lamp) or with a Datastation HUB-B with a nanoLED controller and software DAS6. The nano-LEDs employed for lifetime measurements were of wavelength 370 nm with pulse lengths of 0.8−1.4 ns. The lifetime data were fitted using the Jobin-Yvon software package. Quantum yields in solid were measured using a F-3018 Integrating Sphere mounted on the Fluorolog 3-11 Tau-3 spectrofluorimeter. Electronic Supplementary Material (ESI) for Journal of Materials Chemistry C. This journal is © The Royal Society of Chemistry 2017
Transcript of Luminescent organometallo-silica materials. Organometallic … · 2017-08-10 · Organometallic...
Electronic Supplementary Information
Organometallic phosphors as building blocks in sol-gel chemistry. Luminescent organometallo-silica materials.
C. Ezquerro,a A.E. Sepúlveda,a A. Grau-Atienza,b E. Serrano,b E. Lalinde,a J. R. Berenguer,*a J. García-Martínez*b
a Departamento de Química-Centro de Investigación en Síntesis Química (CISQ), Universidad de La Rioja, Madre de Dios, 51, E-26006,Logroño, Spain. Tel: +34 941299646; *E-mail: [email protected], URL: https://cisq.unirioja.es/gmmo.php
b Laboratorio de Nanotecnología Molecular. Departamento de Química Inorgánica. Universidad de Alicante, Carretera San Vicente s/n, E-03690, Alicante, Spain. Fax: +34 965903454; Tel: +34 965903400 ext.2224; *E-mail: [email protected], URL: www.nanomol.es
General methods
IR spectra were recorded on a Nicolet Nexus FT-IR Spectrometer in a wavenumber range from 4000 to 200 cm-1.
All samples were prepared as KBr pellets. Elemental analyses were carried out in a Perkin-Elmer 2400 CHNS/O
and a Thermo Finnigan Flash 1112 microanalyzer. Mass spectra were recorded on a Microflex MALDI-TOF
Bruker spectrometer. NMR spectra were recorded on Bruker ARX300 and ARX400 spectrometers. Chemical
shifts are reported in parts per million (ppm) relative to external standards (SiMe4 for 1H and 13C{1H}, CFCl3 for 19F and H3PO4 for 31P{1H}) and coupling constants in Hz. 1H and 13C{1H} NMR spectra were assigned, following
the numbering scheme shown in Figure S1, by means of 2D experiments (1H-1H COSY and 1H-13C HSQC and
HMBC) dinuclear. UV-Vis spectra in solution were recorded on an Agilent 8453 spectrophotometer. Diffuse
Reflectance UV-vis (DRUV) spectra were carried out in KBr pellets, using a Shimazdu UV-3600
spectrophotometer with a Harrick praying mantis accessory, and recalculated following the Kubelka Munk
function. The excitation and emission spectra were obtained on a Jobin-Yvon Horiba Fluorolog 3-11 Tau-3
spectrofluorimeter. The lifetime measurements were performed operating in the phosphorimeter mode (with
a F1-1029 lifetime emission PMT assembly, using a 450 W Xe lamp) or with a Datastation HUB-B with a nanoLED
controller and software DAS6. The nano-LEDs employed for lifetime measurements were of wavelength 370
nm with pulse lengths of 0.8−1.4 ns. The lifetime data were fitted using the Jobin-Yvon software package.
Quantum yields in solid were measured using a F-3018 Integrating Sphere mounted on the Fluorolog 3-11 Tau-3
spectrofluorimeter.
Electronic Supplementary Material (ESI) for Journal of Materials Chemistry C.This journal is © The Royal Society of Chemistry 2017
Organometallic phosphors as building blocks in sol-gel chemistry… ESI
[Pt]N
2, 3
23
4
5
6
78
9
1011
1213
14[Ir]
N
1
23
4
5
6
78
9
1011
12
2
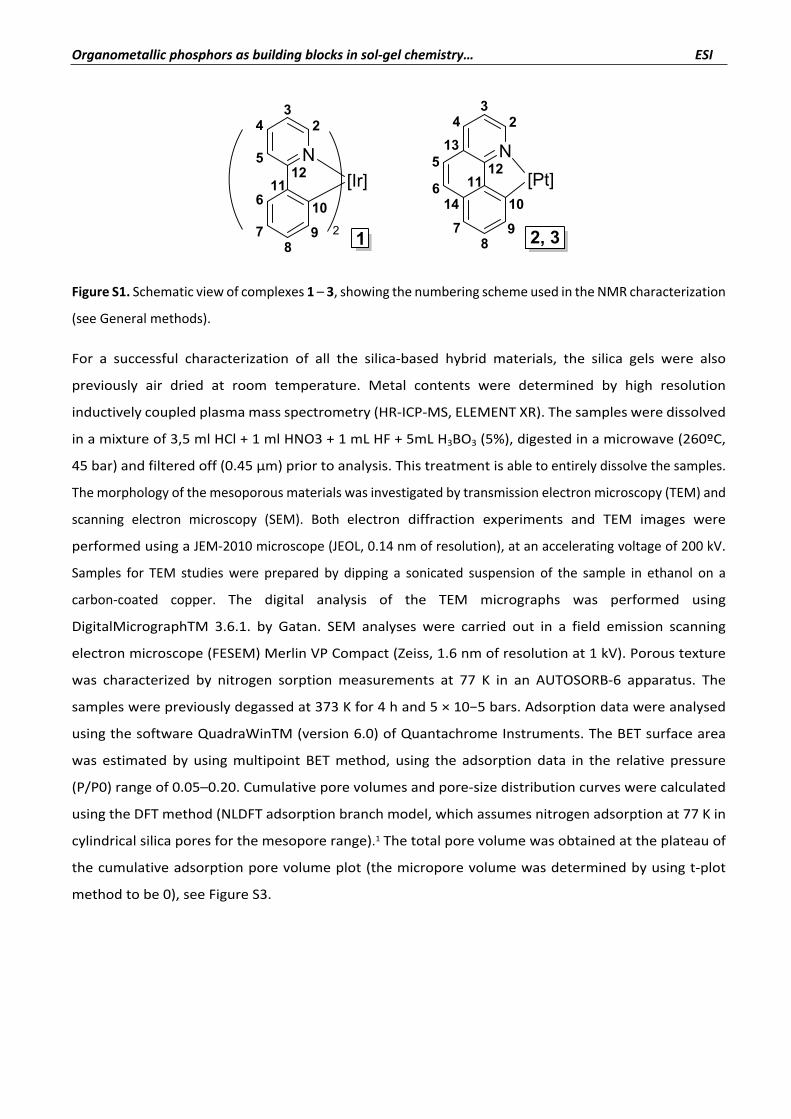
Figure S1. Schematic view of complexes 1 – 3, showing the numbering scheme used in the NMR characterization
(see General methods).
For a successful characterization of all the silica-based hybrid materials, the silica gels were also
previously air dried at room temperature. Metal contents were determined by high resolution
inductively coupled plasma mass spectrometry (HR-ICP-MS, ELEMENT XR). The samples were dissolved
in a mixture of 3,5 ml HCl + 1 ml HNO3 + 1 mL HF + 5mL H3BO3 (5%), digested in a microwave (260ºC,
45 bar) and filtered off (0.45 μm) prior to analysis. This treatment is able to entirely dissolve the samples.
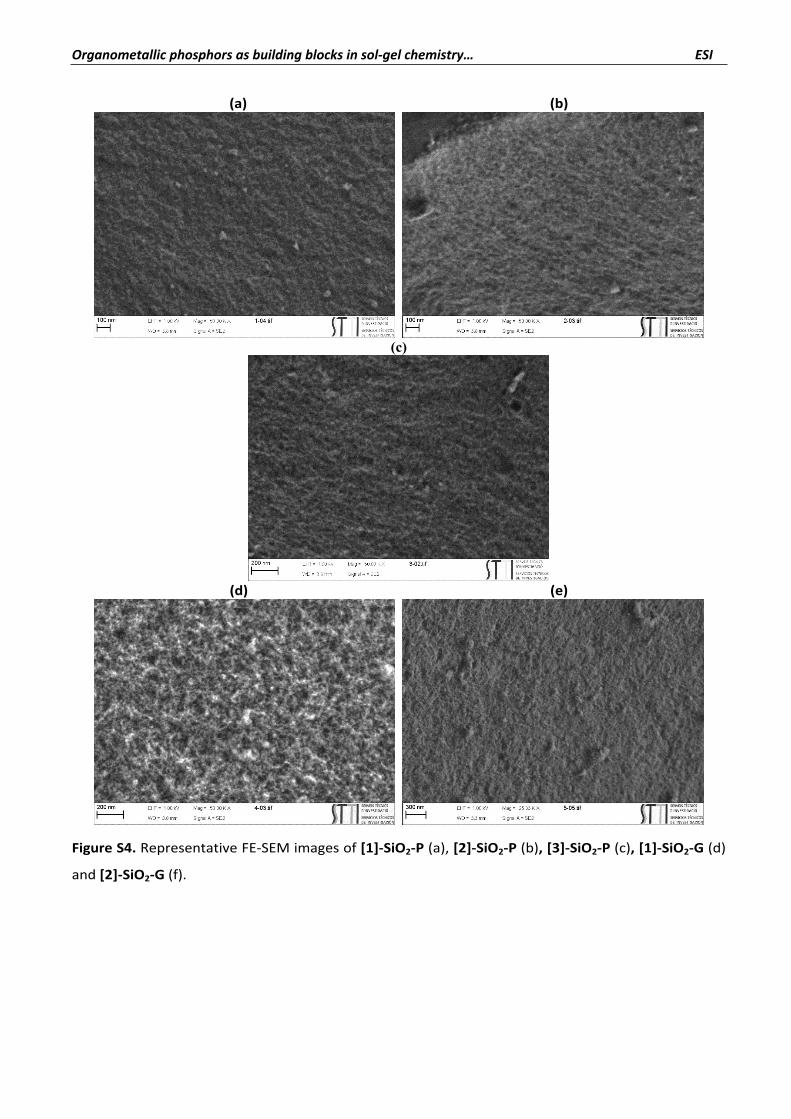
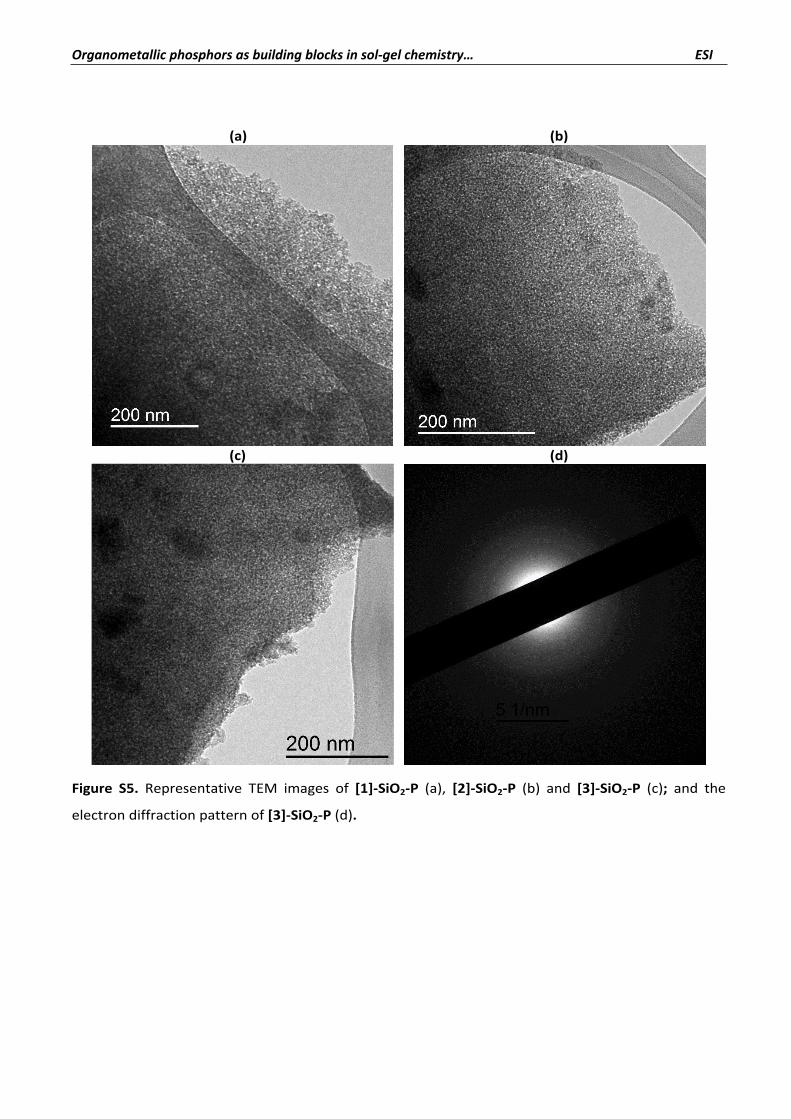
The morphology of the mesoporous materials was investigated by transmission electron microscopy (TEM) and
scanning electron microscopy (SEM). Both electron diffraction experiments and TEM images were
performed using a JEM-2010 microscope (JEOL, 0.14 nm of resolution), at an accelerating voltage of 200 kV.
Samples for TEM studies were prepared by dipping a sonicated suspension of the sample in ethanol on a
carbon-coated copper. The digital analysis of the TEM micrographs was performed using
DigitalMicrographTM 3.6.1. by Gatan. SEM analyses were carried out in a field emission scanning
electron microscope (FESEM) Merlin VP Compact (Zeiss, 1.6 nm of resolution at 1 kV). Porous texture
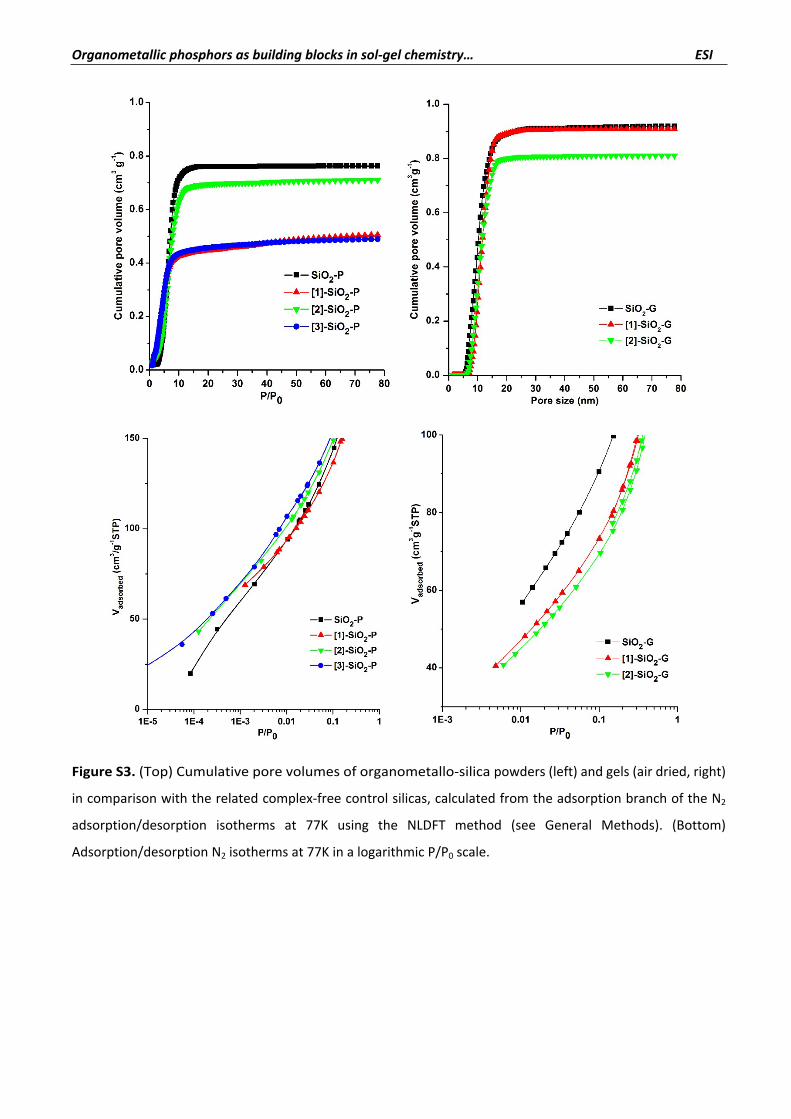
was characterized by nitrogen sorption measurements at 77 K in an AUTOSORB-6 apparatus. The
samples were previously degassed at 373 K for 4 h and 5 × 10⁻⁵ bars. Adsorption data were analysed
using the software QuadraWinTM (version 6.0) of Quantachrome Instruments. The BET surface area
was estimated by using multipoint BET method, using the adsorption data in the relative pressure
(P/P0) range of 0.05–0.20. Cumulative pore volumes and pore-size distribution curves were calculated
using the DFT method (NLDFT adsorption branch model, which assumes nitrogen adsorption at 77 K in
cylindrical silica pores for the mesopore range).1 The total pore volume was obtained at the plateau of
the cumulative adsorption pore volume plot (the micropore volume was determined by using t-plot
method to be 0), see Figure S3.

Organometallic phosphors as building blocks in sol-gel chemistry… ESI
X-ray diffraction structure of [Pt(bzq)(C6F5)(PPETS)] (2)
Yellow crystals of complex 2 were obtained by slow diffusion of n-hexane in a saturated dichloromethane
solution of the complex at room temperature. X-ray intensity data were collected with a NONIUS-CCD area-
detector diffractometer, using graphite-monochromated Mo Kα radiation (λ(MoKα) 0.71071 Å) and the images
were processed using the DENZO and SCALEPACK suite of programs,2 making the absorption correction at this
point. The structure was solved by intrinsic phasing using SHELXT3 and refined by full-matrix least squares on
F2 with SHELXL.4 All non-hydrogen atoms were assigned anisotropic displacement parameters. The hydrogen
atoms were constrained to idealized geometries fixing isotropic displacement parameters of 1.2 times the Uiso
value of their attached carbons for aromatic and methylene hydrogens and 1.5 times for the methyl groups.
One of the terminal ethyl groups of the phosphine ligand presented positional disorder and was modeled
adequately (C37, C38; occupancy 0.75/0.25).
Organometallic phosphors as building blocks in sol-gel chemistry… ESI
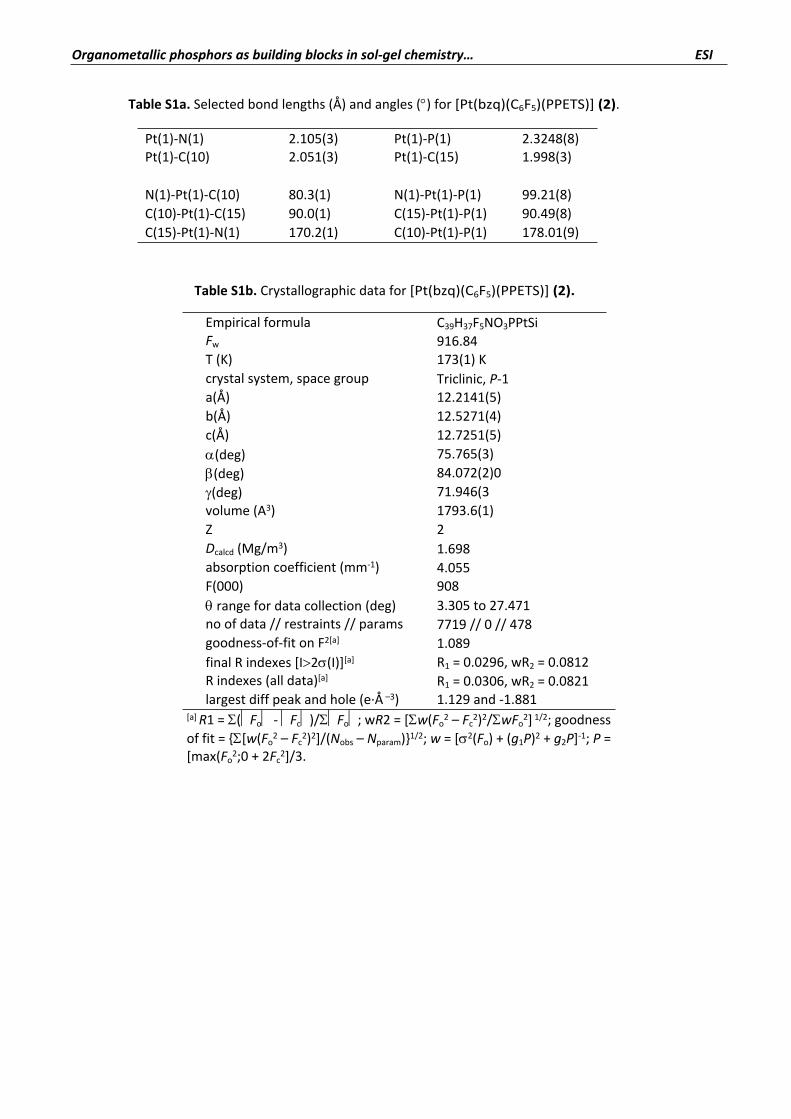
Table S1a. Selected bond lengths (Å) and angles () for [Pt(bzq)(C6F5)(PPETS)] (2).
Pt(1)-N(1) 2.105(3) Pt(1)-P(1) 2.3248(8)Pt(1)-C(10) 2.051(3) Pt(1)-C(15) 1.998(3)
N(1)-Pt(1)-C(10) 80.3(1) N(1)-Pt(1)-P(1) 99.21(8)C(10)-Pt(1)-C(15) 90.0(1) C(15)-Pt(1)-P(1) 90.49(8)C(15)-Pt(1)-N(1) 170.2(1) C(10)-Pt(1)-P(1) 178.01(9)
Table S1b. Crystallographic data for [Pt(bzq)(C6F5)(PPETS)] (2).
Empirical formula C39H37F5NO3PPtSiFw 916.84T (K) 173(1) Kcrystal system, space group Triclinic, P-1a(Å) 12.2141(5)b(Å) 12.5271(4)c(Å) 12.7251(5)(deg) 75.765(3)(deg) 84.072(2)0(deg) 71.946(3volume (A3) 1793.6(1)Z 2Dcalcd (Mg/m3) 1.698absorption coefficient (mm-1) 4.055F(000) 908 range for data collection (deg) 3.305 to 27.471no of data // restraints // params 7719 // 0 // 478goodness-of-fit on F2[a] 1.089final R indexes [I2(I)][a] R1 = 0.0296, wR2 = 0.0812R indexes (all data)[a] R1 = 0.0306, wR2 = 0.0821largest diff peak and hole (e·Å –3) 1.129 and -1.881
[a] R1 = (Fo - Fc)/Fo; wR2 = [w(Fo2 – Fc
2)2/wFo2] 1/2; goodness
of fit = {[w(Fo2 – Fc
2)2]/(Nobs – Nparam)}1/2; w = [2(Fo) + (g1P)2 + g2P]-1; P = [max(Fo
2;0 + 2Fc2]/3.
Organometallic phosphors as building blocks in sol-gel chemistry… ESI
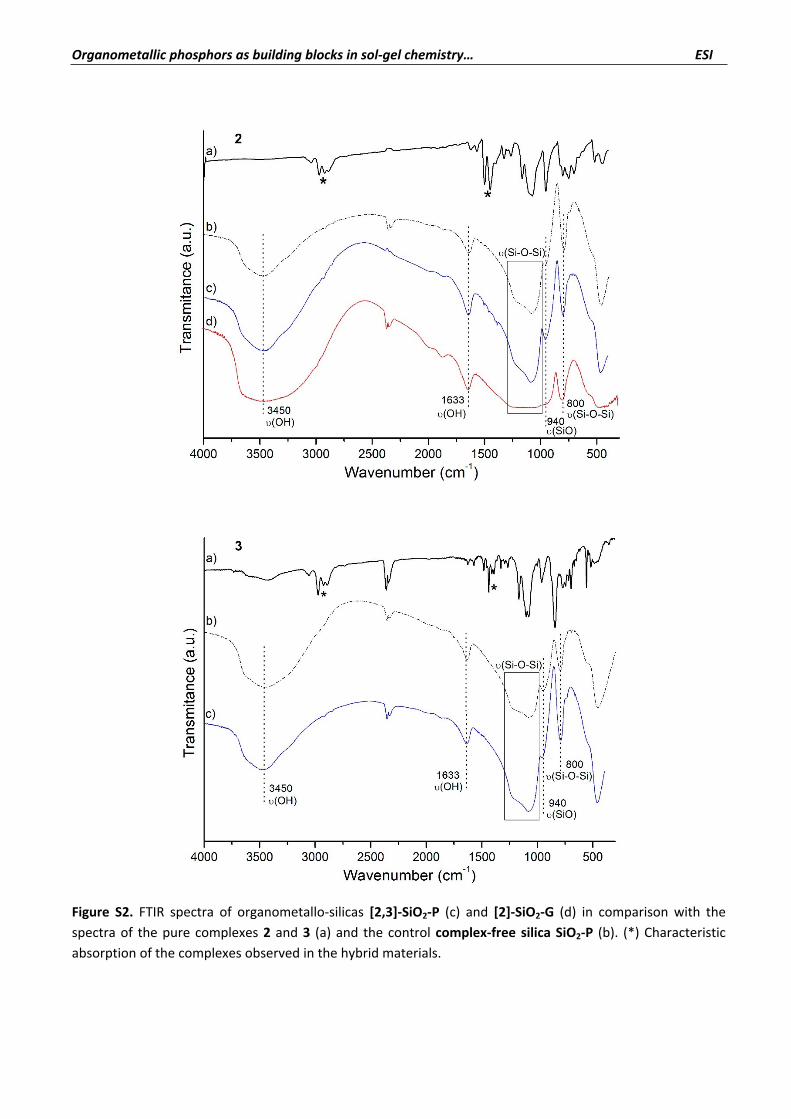
Figure S2. FTIR spectra of organometallo-silicas [2,3]-SiO2-P (c) and [2]-SiO2-G (d) in comparison with the spectra of the pure complexes 2 and 3 (a) and the control complex-free silica SiO2-P (b). (*) Characteristic absorption of the complexes observed in the hybrid materials.
Organometallic phosphors as building blocks in sol-gel chemistry… ESI
Figure S3. (Top) Cumulative pore volumes of organometallo-silica powders (left) and gels (air dried, right)
in comparison with the related complex-free control silicas, calculated from the adsorption branch of the N2
adsorption/desorption isotherms at 77K using the NLDFT method (see General Methods). (Bottom)
Adsorption/desorption N2 isotherms at 77K in a logarithmic P/P0 scale.
Organometallic phosphors as building blocks in sol-gel chemistry… ESI
(a) (b)
(c)
(d) (e)
Figure S4. Representative FE-SEM images of [1]-SiO2-P (a), [2]-SiO2-P (b), [3]-SiO2-P (c), [1]-SiO2-G (d)
and [2]-SiO2-G (f).
Organometallic phosphors as building blocks in sol-gel chemistry… ESI
(a) (b)
(c) (d)
Figure S5. Representative TEM images of [1]-SiO2-P (a), [2]-SiO2-P (b) and [3]-SiO2-P (c); and the
electron diffraction pattern of [3]-SiO2-P (d).
Organometallic phosphors as building blocks in sol-gel chemistry… ESI
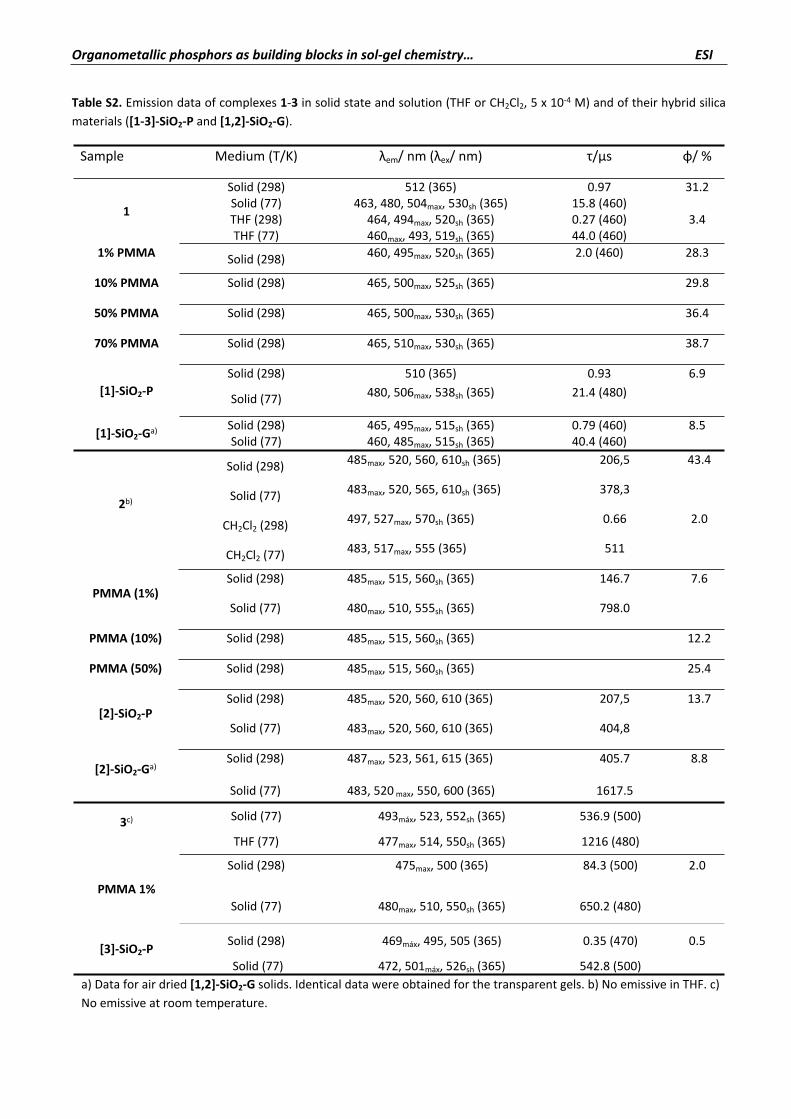
Table S2. Emission data of complexes 1-3 in solid state and solution (THF or CH2Cl2, 5 x 10⁻⁴ M) and of their hybrid silica materials ([1-3]-SiO2-P and [1,2]-SiO2-G).
Sample Medium (T/K) λem/ nm (λex/ nm) τ/µs φ/ %
Solid (298) 512 (365) 0.97 31.2Solid (77) 463, 480, 504max, 530sh (365) 15.8 (460)THF (298) 464, 494max, 520sh (365) 0.27 (460) 3.41
THF (77) 460max, 493, 519sh (365) 44.0 (460)1% PMMA Solid (298) 460, 495max, 520sh (365) 2.0 (460) 28.3
10% PMMA Solid (298) 465, 500max, 525sh (365) 29.8
50% PMMA Solid (298) 465, 500max, 530sh (365) 36.4
70% PMMA Solid (298) 465, 510max, 530sh (365) 38.7
Solid (298) 510 (365) 0.93 6.9[1]-SiO2-P Solid (77) 480, 506max, 538sh (365) 21.4 (480)
Solid (298) 465, 495max, 515sh (365) 0.79 (460) 8.5[1]-SiO2-Ga)Solid (77) 460, 485max, 515sh (365) 40.4 (460)
Solid (298) 485max, 520, 560, 610sh (365) 206,5 43.4
Solid (77) 483max, 520, 565, 610sh (365) 378,3
CH2Cl2 (298) 497, 527max, 570sh (365) 0.66 2.02b)
CH2Cl2 (77) 483, 517max, 555 (365) 511
Solid (298) 485max, 515, 560sh (365) 146.7 7.6PMMA (1%)
Solid (77) 480max, 510, 555sh (365) 798.0
PMMA (10%) Solid (298) 485max, 515, 560sh (365) 12.2
PMMA (50%) Solid (298) 485max, 515, 560sh (365) 25.4
Solid (298) 485max, 520, 560, 610 (365) 207,5 13.7[2]-SiO2-P
Solid (77) 483max, 520, 560, 610 (365) 404,8
Solid (298) 487max, 523, 561, 615 (365) 405.7 8.8[2]-SiO2-Ga)
Solid (77) 483, 520 max, 550, 600 (365) 1617.5
Solid (77) 493máx, 523, 552sh (365) 536.9 (500)3c)
THF (77) 477max, 514, 550sh (365) 1216 (480)
Solid (298) 475max, 500 (365) 84.3 (500) 2.0
PMMA 1%Solid (77) 480max, 510, 550sh (365) 650.2 (480)
Solid (298) 469máx, 495, 505 (365) 0.35 (470) 0.5[3]-SiO2-PSolid (77) 472, 501máx, 526sh (365) 542.8 (500)
a) Data for air dried [1,2]-SiO2-G solids. Identical data were obtained for the transparent gels. b) No emissive in THF. c) No emissive at room temperature.
Organometallic phosphors as building blocks in sol-gel chemistry… ESI
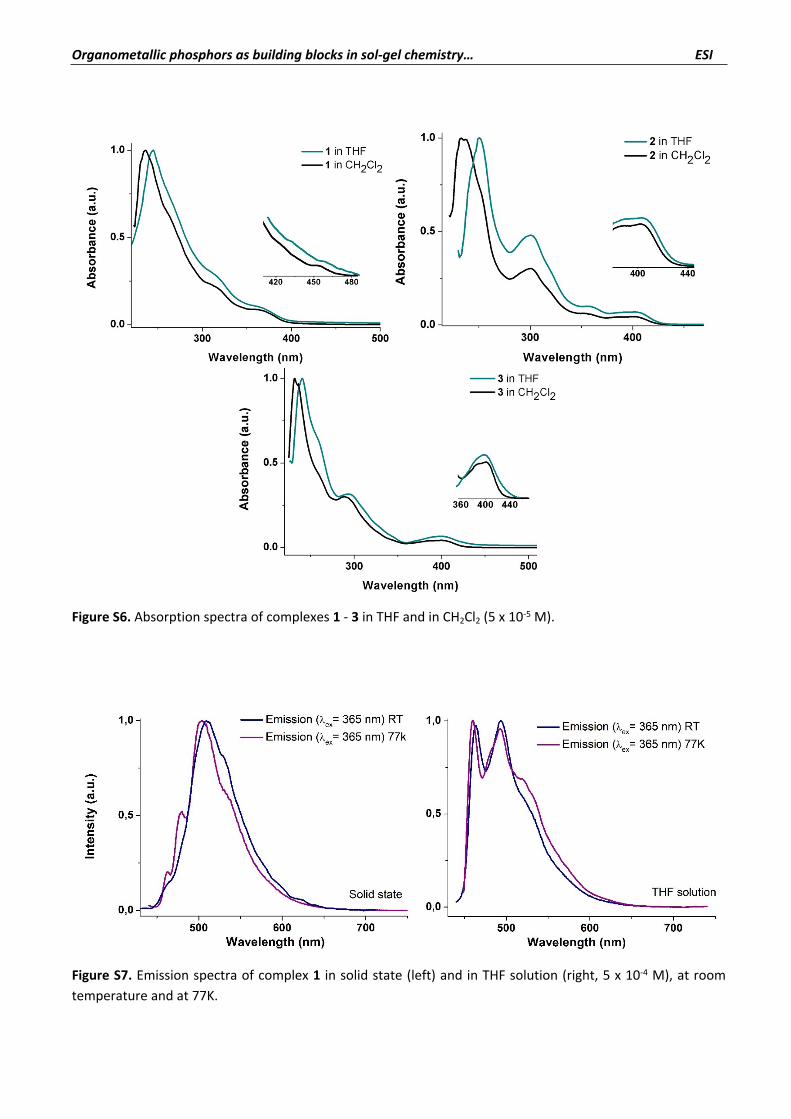
Figure S6. Absorption spectra of complexes 1 - 3 in THF and in CH2Cl2 (5 x 10⁻⁵ M).
Figure S7. Emission spectra of complex 1 in solid state (left) and in THF solution (right, 5 x 10⁻⁴ M), at room temperature and at 77K.
Organometallic phosphors as building blocks in sol-gel chemistry… ESI
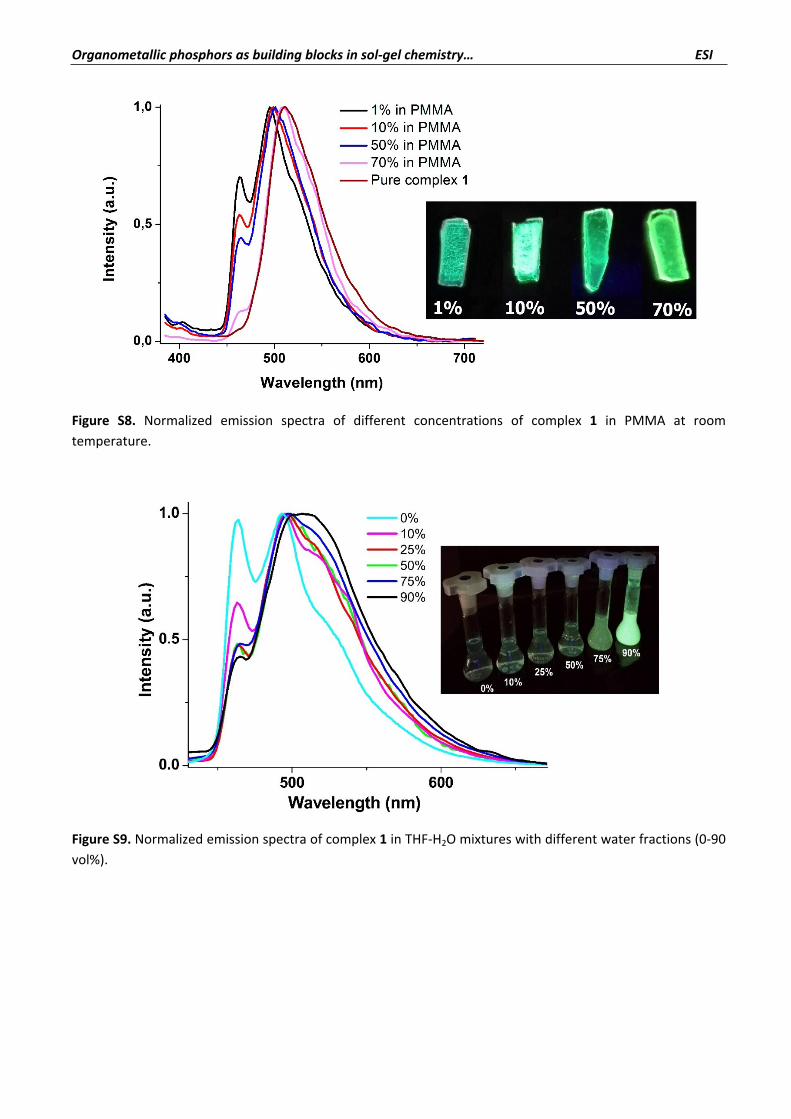
Figure S8. Normalized emission spectra of different concentrations of complex 1 in PMMA at room temperature.
Figure S9. Normalized emission spectra of complex 1 in THF-H2O mixtures with different water fractions (0-90 vol%).
Organometallic phosphors as building blocks in sol-gel chemistry… ESI
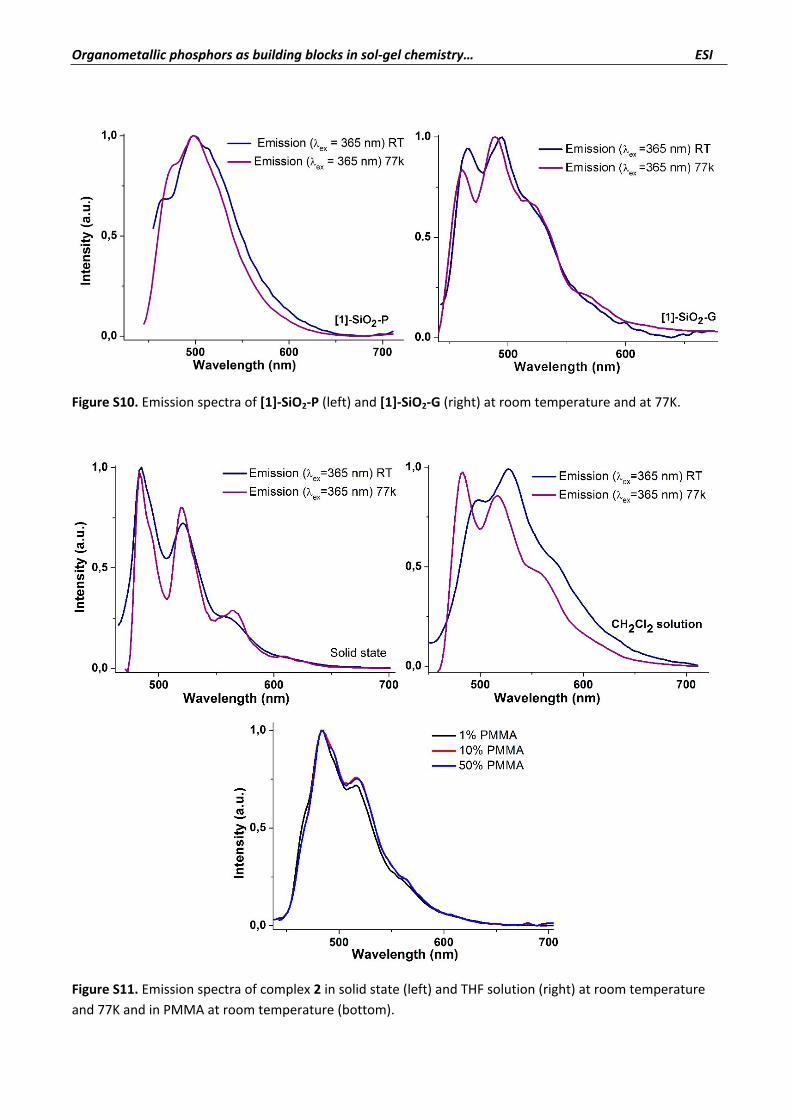
Figure S10. Emission spectra of [1]-SiO2-P (left) and [1]-SiO2-G (right) at room temperature and at 77K.
Figure S11. Emission spectra of complex 2 in solid state (left) and THF solution (right) at room temperature and 77K and in PMMA at room temperature (bottom).
Organometallic phosphors as building blocks in sol-gel chemistry… ESI
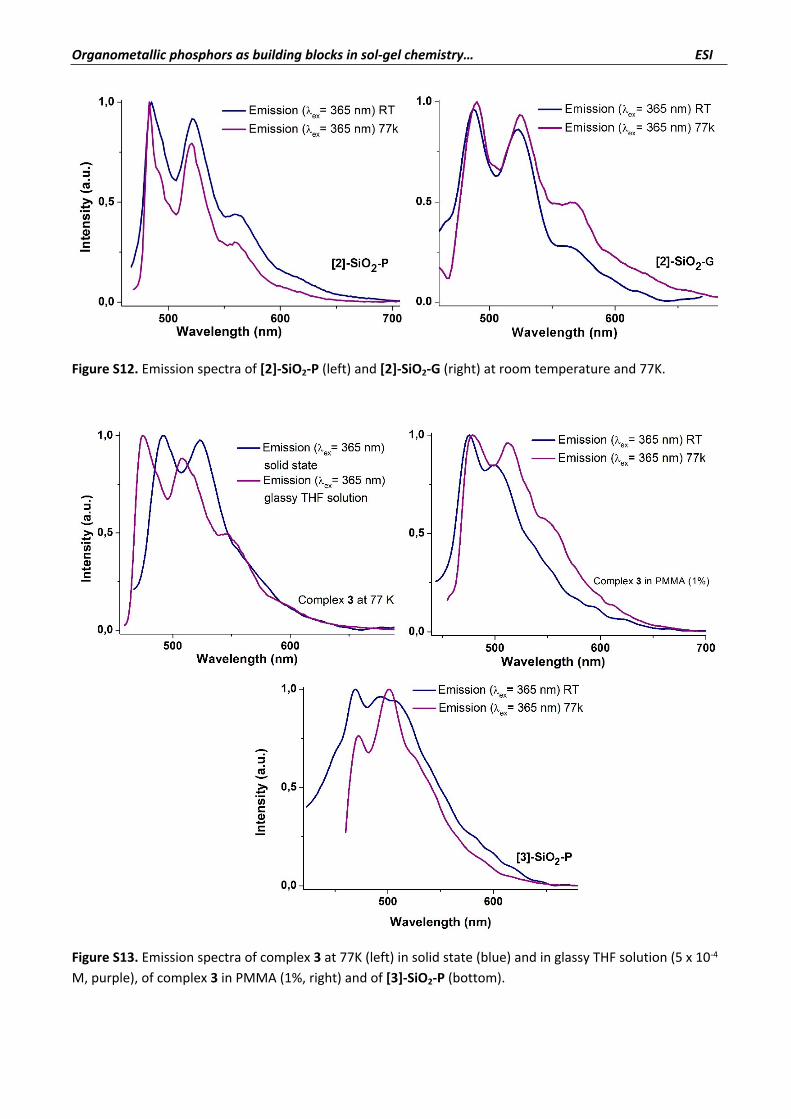
Figure S12. Emission spectra of [2]-SiO2-P (left) and [2]-SiO2-G (right) at room temperature and 77K.
Figure S13. Emission spectra of complex 3 at 77K (left) in solid state (blue) and in glassy THF solution (5 x 10⁻⁴ M, purple), of complex 3 in PMMA (1%, right) and of [3]-SiO2-P (bottom).
Organometallic phosphors as building blocks in sol-gel chemistry… ESI
Theoretical calculations
Methods
Calculations for complex 1 were carried out with the Gaussian 09 package5 using Becke’s three-parameter
functional combined with Lee-Yang-Parr’s correlation functional (B3LYP) in the singlet state (S0) and the
unrestricted U-B3LYP in the triplet state (T1).6 According to previous theoretical calculations for iridium
complexes, the optimized ground state geometry were calculated at the B3LYP/LANL2DZ (Ir)/6-31G(d,p) (ligand
atoms) level. The S0 geometry was found to be a true minimum as no negative frequencies in the vibrational
frequency study of the final geometry were found. DFT and TD-DFT calculations were carried out using the
polarized continuum model approach implemented in the Gaussian 09 software. The MO diagrams and the
orbital contributions were generated with Gaussian 09 software and Gauss-Sum7 program, respectively. The
emission energy was calculated as the difference of the optimized T1 geometry for both states.
Discussion
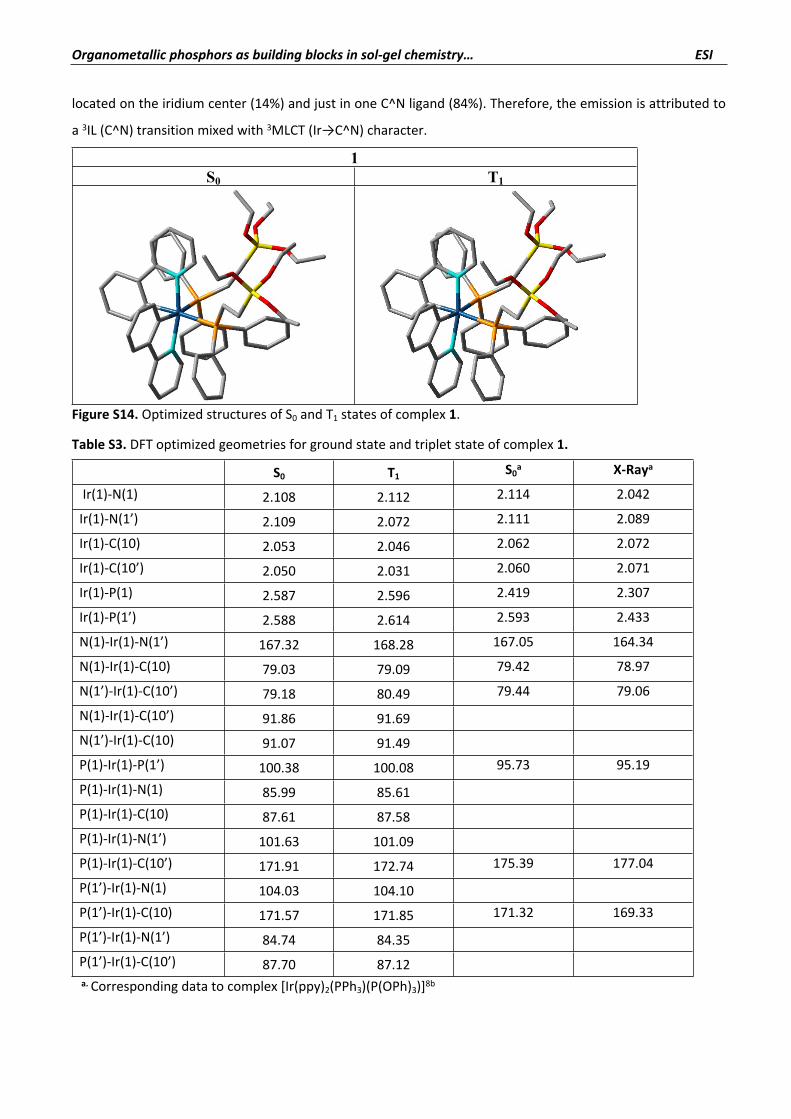
For complex 1, the optimized geometry reproduces most of the details of the calculated and experimental
values of a similar iridium compound ([Ir(ppy)2(PPh3)(P(OPh)3)])8 with a reasonable agreement. Its analysis
shows a good accuracy for the Ir-C, Ir-N and Ir-P bond lengths (maxima deviations of 0.2A) and no more than
5 of deviation was found between our complex bond angles and those reported.
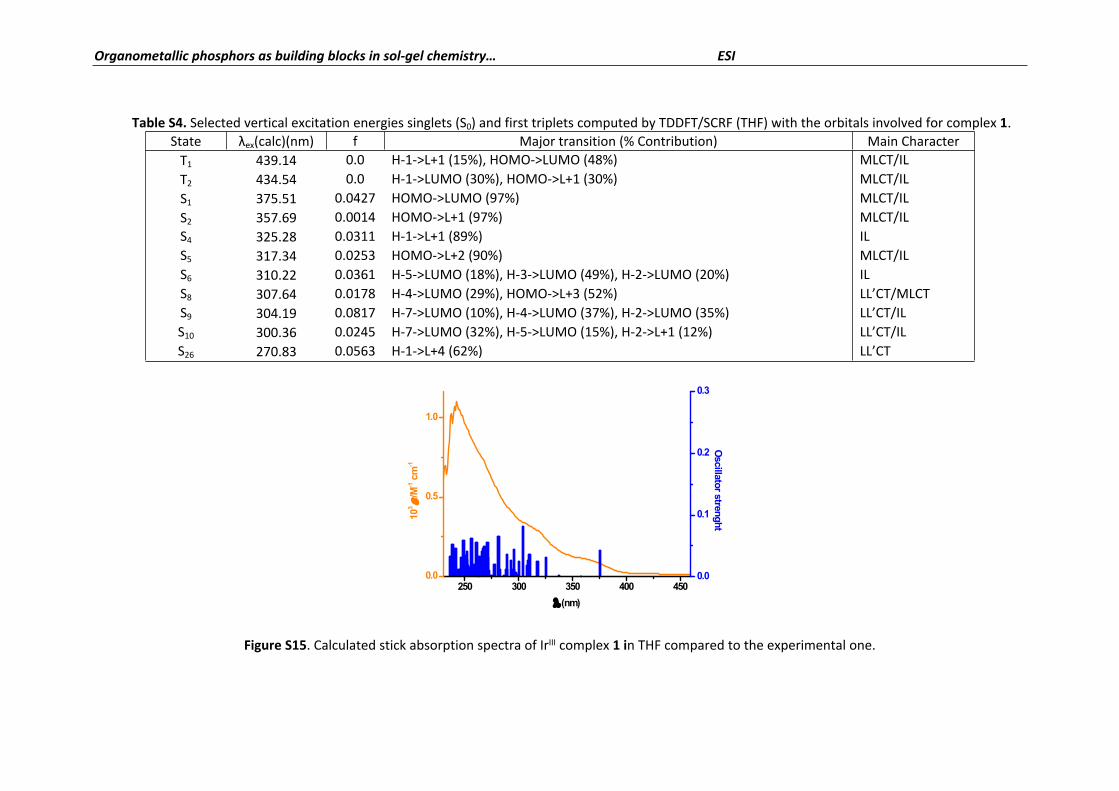
Figure S15 displays the experimental and calculated (bars) absorption spectra in THF for complex 1, which
presents weak low energy singlet excitations (S1 375, S2 358 and S4 325 nm, Table S4) that are related to
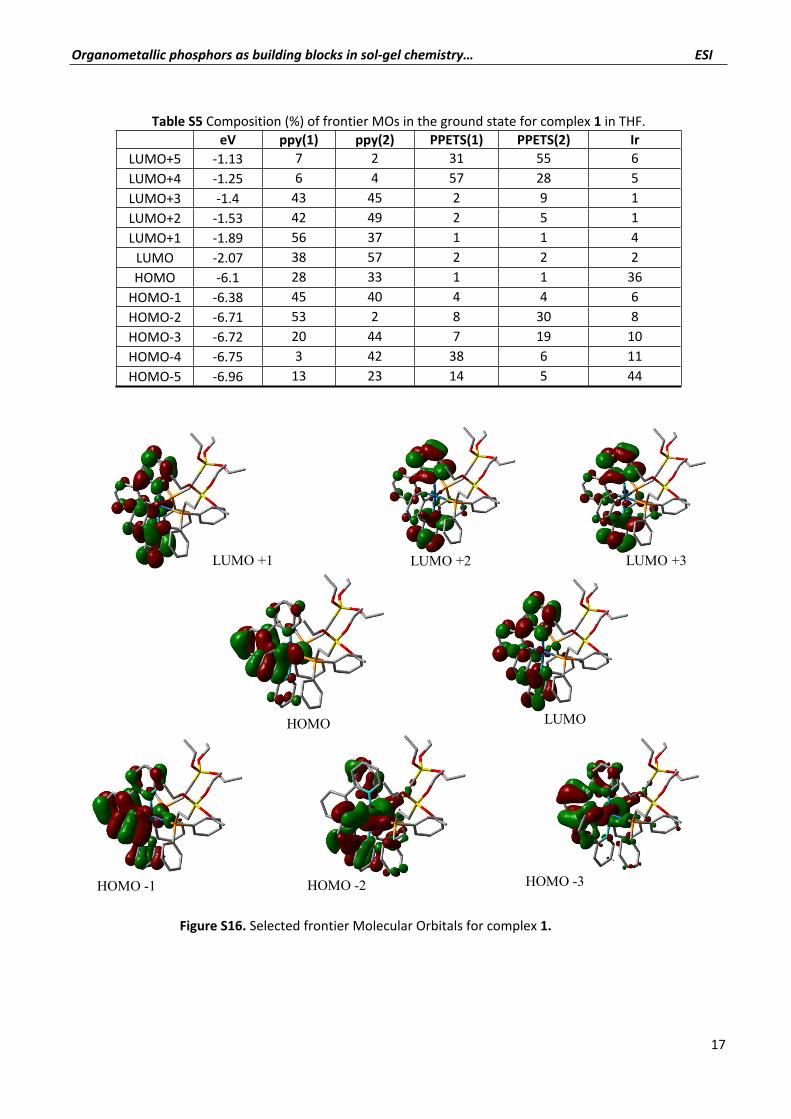
HOMO, H-1, LUMO and L+1 transitions. The target orbitals LUMO and LUMO+1 are distributed over both C^N
ligands (ppy) (95% and 93%, respectively), whereas the HOMO is primarily located in the iridium center (36%)
with some C^N contribution (61%), and HOMO-1 is only formed by C^N ligands (85%). Therefore, these
absorptions are attributed to metal-ligand (1MLCT, Ir→C^N) charge transfer transition with some intraligand 1IL (C^N) contribution. More intense singlet excitations are predicted at higher energies (270 and 320 nm,
LL’CT/MLCT). The lowest triplet state at the ground state geometry (T1) results from a mixed of MLCT (Ir→C^N)
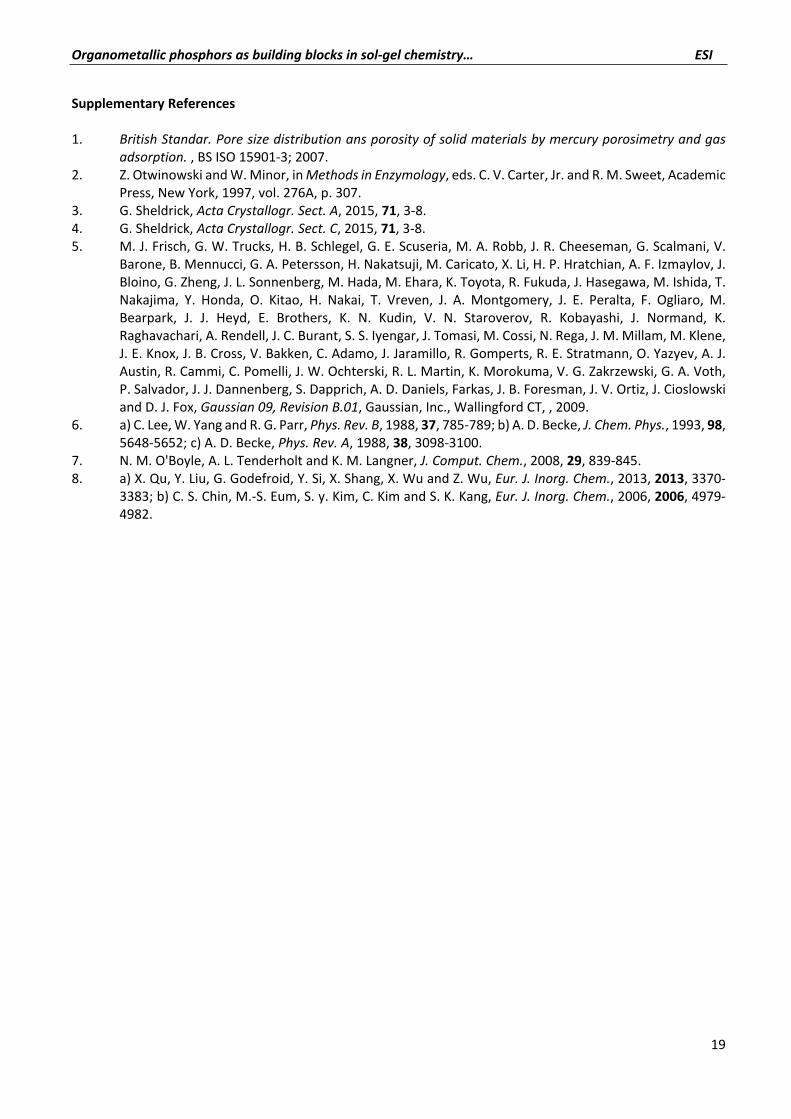
and IL (C^N) transitions. Geometry optimization was also carried out by spin-unrestricted DFT calculations. The
spin density at the optimized T1 state is primary localized on one ppy ligand and on the metallic center,
supporting so the 3IL/3MLCT assignment.
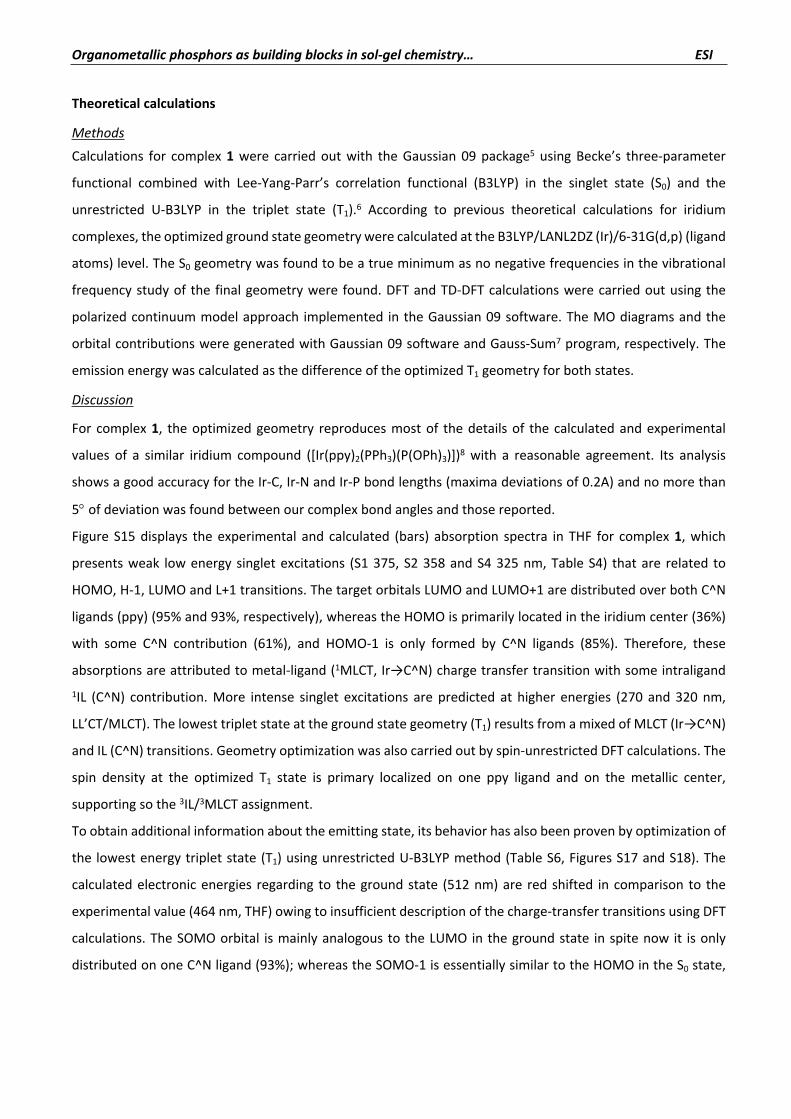
To obtain additional information about the emitting state, its behavior has also been proven by optimization of
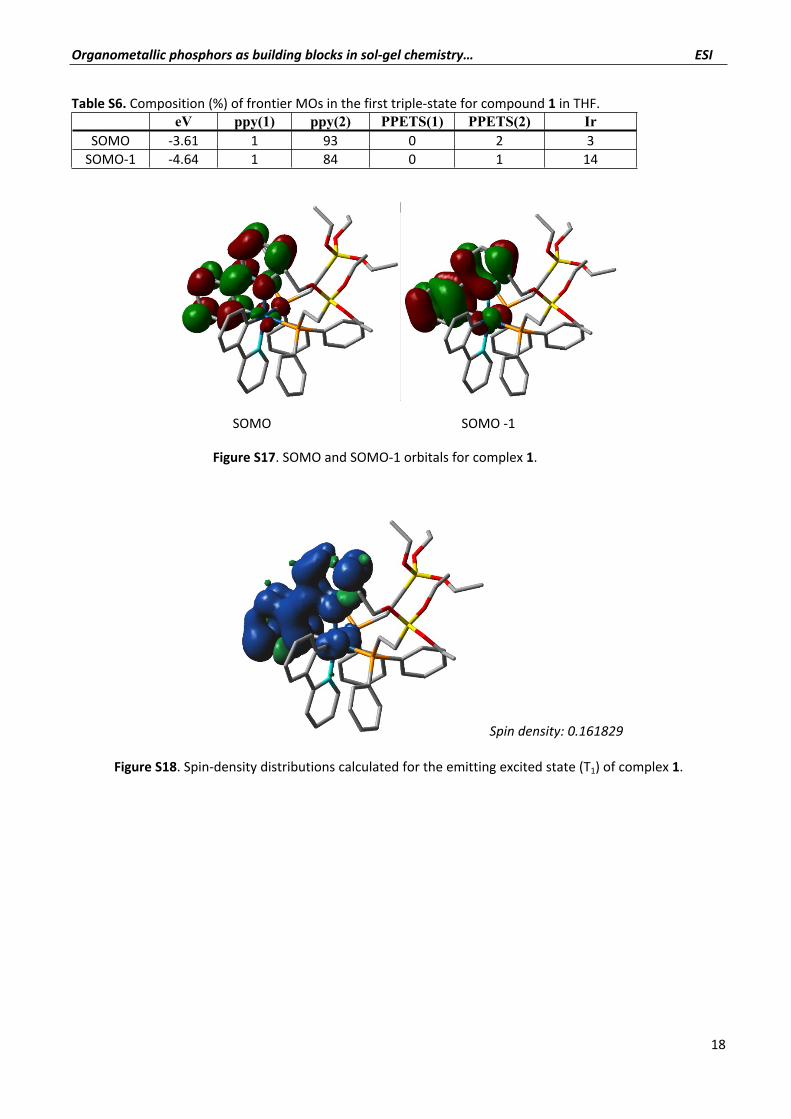
the lowest energy triplet state (T1) using unrestricted U-B3LYP method (Table S6, Figures S17 and S18). The
calculated electronic energies regarding to the ground state (512 nm) are red shifted in comparison to the
experimental value (464 nm, THF) owing to insufficient description of the charge-transfer transitions using DFT
calculations. The SOMO orbital is mainly analogous to the LUMO in the ground state in spite now it is only
distributed on one C^N ligand (93%); whereas the SOMO-1 is essentially similar to the HOMO in the S0 state,
Organometallic phosphors as building blocks in sol-gel chemistry… ESI
located on the iridium center (14%) and just in one C^N ligand (84%). Therefore, the emission is attributed to
a 3IL (C^N) transition mixed with 3MLCT (Ir→C^N) character.
1S0 T1
Figure S14. Optimized structures of S0 and T1 states of complex 1.
Table S3. DFT optimized geometries for ground state and triplet state of complex 1.
S0 T1 S0a X-Raya
Ir(1)-N(1) 2.108 2.112 2.114 2.042
Ir(1)-N(1’) 2.109 2.072 2.111 2.089
Ir(1)-C(10) 2.053 2.046 2.062 2.072
Ir(1)-C(10’) 2.050 2.031 2.060 2.071
Ir(1)-P(1) 2.587 2.596 2.419 2.307
Ir(1)-P(1’) 2.588 2.614 2.593 2.433
N(1)-Ir(1)-N(1’) 167.32 168.28 167.05 164.34
N(1)-Ir(1)-C(10) 79.03 79.09 79.42 78.97
N(1’)-Ir(1)-C(10’) 79.18 80.49 79.44 79.06
N(1)-Ir(1)-C(10’) 91.86 91.69N(1’)-Ir(1)-C(10) 91.07 91.49P(1)-Ir(1)-P(1’) 100.38 100.08 95.73 95.19
P(1)-Ir(1)-N(1) 85.99 85.61P(1)-Ir(1)-C(10) 87.61 87.58P(1)-Ir(1)-N(1’) 101.63 101.09P(1)-Ir(1)-C(10’) 171.91 172.74 175.39 177.04
P(1’)-Ir(1)-N(1) 104.03 104.10P(1’)-Ir(1)-C(10) 171.57 171.85 171.32 169.33
P(1’)-Ir(1)-N(1’) 84.74 84.35P(1’)-Ir(1)-C(10’) 87.70 87.12a. Corresponding data to complex [Ir(ppy)2(PPh3)(P(OPh)3)]8b
Organometallic phosphors as building blocks in sol-gel chemistry… ESI
Table S4. Selected vertical excitation energies singlets (S0) and first triplets computed by TDDFT/SCRF (THF) with the orbitals involved for complex 1.State λex(calc)(nm) f Major transition (% Contribution) Main Character
T1 439.14 0.0 H-1->L+1 (15%), HOMO->LUMO (48%) MLCT/ILT2 434.54 0.0 H-1->LUMO (30%), HOMO->L+1 (30%) MLCT/ILS1 375.51 0.0427 HOMO->LUMO (97%) MLCT/ILS2 357.69 0.0014 HOMO->L+1 (97%) MLCT/ILS4 325.28 0.0311 H-1->L+1 (89%) ILS5 317.34 0.0253 HOMO->L+2 (90%) MLCT/ILS6 310.22 0.0361 H-5->LUMO (18%), H-3->LUMO (49%), H-2->LUMO (20%) ILS8 307.64 0.0178 H-4->LUMO (29%), HOMO->L+3 (52%) LL’CT/MLCTS9 304.19 0.0817 H-7->LUMO (10%), H-4->LUMO (37%), H-2->LUMO (35%) LL’CT/ILS10 300.36 0.0245 H-7->LUMO (32%), H-5->LUMO (15%), H-2->L+1 (12%) LL’CT/ILS26 270.83 0.0563 H-1->L+4 (62%) LL’CT
250 300 350 400 4500.0
0.5
1.0
(nm)
103
/M-1 c
m-1
0.0
0.1
0.2
0.3O
scillator strenght
Figure S15. Calculated stick absorption spectra of IrIII complex 1 in THF compared to the experimental one.
Organometallic phosphors as building blocks in sol-gel chemistry… ESI
17
Table S5 Composition (%) of frontier MOs in the ground state for complex 1 in THF.eV ppy(1) ppy(2) PPETS(1) PPETS(2) Ir
LUMO+5 -1.13 7 2 31 55 6LUMO+4 -1.25 6 4 57 28 5LUMO+3 -1.4 43 45 2 9 1LUMO+2 -1.53 42 49 2 5 1LUMO+1 -1.89 56 37 1 1 4
LUMO -2.07 38 57 2 2 2HOMO -6.1 28 33 1 1 36
HOMO-1 -6.38 45 40 4 4 6HOMO-2 -6.71 53 2 8 30 8HOMO-3 -6.72 20 44 7 19 10HOMO-4 -6.75 3 42 38 6 11HOMO-5 -6.96 13 23 14 5 44
HOMO LUMO
HOMO -1 HOMO -3HOMO -2
LUMO +3LUMO +2LUMO +1
Figure S16. Selected frontier Molecular Orbitals for complex 1.
Organometallic phosphors as building blocks in sol-gel chemistry… ESI
18
Table S6. Composition (%) of frontier MOs in the first triple-state for compound 1 in THF.eV ppy(1) ppy(2) PPETS(1) PPETS(2) Ir
SOMO -3.61 1 93 0 2 3SOMO-1 -4.64 1 84 0 1 14
SOMO SOMO -1
Figure S17. SOMO and SOMO-1 orbitals for complex 1.
Spin density: 0.161829
Figure S18. Spin-density distributions calculated for the emitting excited state (T1) of complex 1.
Organometallic phosphors as building blocks in sol-gel chemistry… ESI
19
Supplementary References
1. British Standar. Pore size distribution ans porosity of solid materials by mercury porosimetry and gas adsorption. , BS ISO 15901-3; 2007.
2. Z. Otwinowski and W. Minor, in Methods in Enzymology, eds. C. V. Carter, Jr. and R. M. Sweet, Academic Press, New York, 1997, vol. 276A, p. 307.
3. G. Sheldrick, Acta Crystallogr. Sect. A, 2015, 71, 3-8.4. G. Sheldrick, Acta Crystallogr. Sect. C, 2015, 71, 3-8.5. M. J. Frisch, G. W. Trucks, H. B. Schlegel, G. E. Scuseria, M. A. Robb, J. R. Cheeseman, G. Scalmani, V.
Barone, B. Mennucci, G. A. Petersson, H. Nakatsuji, M. Caricato, X. Li, H. P. Hratchian, A. F. Izmaylov, J. Bloino, G. Zheng, J. L. Sonnenberg, M. Hada, M. Ehara, K. Toyota, R. Fukuda, J. Hasegawa, M. Ishida, T. Nakajima, Y. Honda, O. Kitao, H. Nakai, T. Vreven, J. A. Montgomery, J. E. Peralta, F. Ogliaro, M. Bearpark, J. J. Heyd, E. Brothers, K. N. Kudin, V. N. Staroverov, R. Kobayashi, J. Normand, K. Raghavachari, A. Rendell, J. C. Burant, S. S. Iyengar, J. Tomasi, M. Cossi, N. Rega, J. M. Millam, M. Klene, J. E. Knox, J. B. Cross, V. Bakken, C. Adamo, J. Jaramillo, R. Gomperts, R. E. Stratmann, O. Yazyev, A. J. Austin, R. Cammi, C. Pomelli, J. W. Ochterski, R. L. Martin, K. Morokuma, V. G. Zakrzewski, G. A. Voth, P. Salvador, J. J. Dannenberg, S. Dapprich, A. D. Daniels, Farkas, J. B. Foresman, J. V. Ortiz, J. Cioslowski and D. J. Fox, Gaussian 09, Revision B.01, Gaussian, Inc., Wallingford CT, , 2009.
6. a) C. Lee, W. Yang and R. G. Parr, Phys. Rev. B, 1988, 37, 785-789; b) A. D. Becke, J. Chem. Phys., 1993, 98, 5648-5652; c) A. D. Becke, Phys. Rev. A, 1988, 38, 3098-3100.
7. N. M. O'Boyle, A. L. Tenderholt and K. M. Langner, J. Comput. Chem., 2008, 29, 839-845.8. a) X. Qu, Y. Liu, G. Godefroid, Y. Si, X. Shang, X. Wu and Z. Wu, Eur. J. Inorg. Chem., 2013, 2013, 3370-
3383; b) C. S. Chin, M.-S. Eum, S. y. Kim, C. Kim and S. K. Kang, Eur. J. Inorg. Chem., 2006, 2006, 4979-4982.