
Lumax International Corp., Ltd. and Subsidiaries
58
Lumax International Corp., Ltd. and Subsidiaries Consolidated Financial Statements for the Years Ended December 31, 2016 and 2015 and Independent Auditors’ Report
Transcript of Lumax International Corp., Ltd. and Subsidiaries

Lumax International Corp., Ltd. and Subsidiaries
Consolidated Financial Statements for the Years Ended December 31, 2016 and 2015 and Independent Auditors’ Report

- 1 -

- 2 -
The audit procedures we performed are as follows:
1. Understand the impairment policy of trade receivables used by the management and test the accuracy of the
aging report of trade receivables.
2. Review the counterparties’ historical payment schedules, and analyze the possibility of impairment loss; in
the case of deviance, follow-up is conducted on the result of such event.
3. Understand the basis of allowance recognition for the trade receivables and evaluate the rationality by
referring to the status of its collection process and any other available information, and check individual
overdue receivables.
4. Check the collection of trade receivables in the subsequent period by sampling to confirm the possibility of
its collection to decide whether it is necessary to increase the amount of impairment loss recognized.
5. Review the impairment loss which is calculated by the management based on the classification of the
degree of credit risk derived from the counterparties; assess the appropriateness of the recognition of the
impairment loss in accordance with the history of impairment loss by classification.
Impairment Loss on Inventories
Refer to Note 10. The Group’s inventories amounted to $1,413,948 thousand, consisting 22% of total assets as
of December 31, 2016. Because the account thereof represents such a significant weight on the consolidated
balance sheet and the risk of inventory valuation resides mainly on the impairment assessment that is primarily
based on the management’s estimation of lower of cost or net realizable value as well as judgment on the
recognition of slow-moving, obsolete inventories, the process of impairment loss evaluation is subjective with
results that directly impacts the amount recognized as impairment loss. Therefore, we deem that the
impairment loss of inventories is a key audit matter.
We have inspected the amount of inventories as of the December 31, 2016 and the method of lower of cost or
net realizable value to ensure that the inventories have been evaluated by lower of cost or net realizable value.
The procedures we performed are as follows:
1. Review the management’s year end physical counting plan for the inventories, and observe and inquire
about the condition of the inventories to evaluate whether the inventories are impaired.
2. Sample from the year end inventories to verify the valuation method, calculated through lower of cost or
net realizable value, adopted by the management to verify the appropriateness of net realizable value of the
inventories.
3. Obtain the aging report of the inventories to inspect the appropriateness of the provision for impairment
loss estimated by management.
Other Matter
We have also audited the parent company only financial statements of Lumax International Corp., Ltd. as of and
for the years ended December 31, 2016 and 2015, on which we have issued an unmodified unqualified report,
respectively.

- 3 -
Responsibilities of Management and Those Charged with Governance for the Consolidated Financial
Statements
Management is responsible for the preparation and fair presentation of the consolidated financial statements in
accordance with the Regulations Governing the Preparation of Financial Reports by Securities Issuers, and for
such internal control as management determines is necessary to enable the preparation of consolidated financial
statements that are free from material misstatement, whether due to fraud or error.
In preparing the consolidated financial statements, management is responsible for assessing Lumax International
Corp., Ltd. and its subsidiaries’ ability to continue as a going concern, disclosing, as applicable, matters related
to going concern and using the going concern basis of accounting unless management either intends to liquidate
Lumax International Corp., Ltd. and its subsidiaries or to cease operations, or has no realistic alternative but to
do so.
Those charged with governance, including supervisors, are responsible for overseeing Lumax International
Corp., Ltd. and its subsidiaries’ financial reporting process.
Auditors’ Responsibilities for the Audit of the Consolidated Financial Statements
Our objectives are to obtain reasonable assurance about whether the consolidated financial statements as a
whole are free from material misstatement, whether due to fraud or error, and to issue an auditors’ report that
includes our opinion. Reasonable assurance is a high level of assurance, but is not a guarantee that an audit
conducted in accordance with the auditing standards generally accepted in the Republic of China will always
detect a material misstatement when it exists. Misstatements can arise from fraud or error and are considered
material if, individually or in the aggregate, they could reasonably be expected to influence the economic
decisions of users taken on the basis of these consolidated financial statements.
As part of an audit in accordance with the auditing standards generally accepted in the Republic of China, we
exercise professional judgment and maintain professional skepticism throughout the audit. We also:
1. Identify and assess the risks of material misstatement of the consolidated financial statements, whether due
to fraud or error, design and perform audit procedures responsive to those risks, and obtain audit evidence
that is sufficient and appropriate to provide a basis for our opinion. The risk of not detecting a material
misstatement resulting from fraud is higher than for one resulting from error, as fraud may involve
collusion, forgery, intentional omissions, misrepresentations, or the override of internal control.
2. Obtain an understanding of internal control relevant to the audit in order to design audit procedures that are
appropriate in the circumstances, but not for the purpose of expressing an opinion on the effectiveness of
Lumax International Corp., Ltd. and its subsidiaries’ internal control.
3. Evaluate the appropriateness of accounting policies used and the reasonableness of accounting estimates
and related disclosures made by management.
4. Conclude on the appropriateness of management’s use of the going concern basis of accounting and, based
on the audit evidence obtained, whether a material uncertainty exists related to events or conditions that
may cast significant doubt on Lumax International Corp., Ltd. and its subsidiaries’ ability to continue as a
going concern. If we conclude that a material uncertainty exists, we are required to draw attention in our
auditors’ report to the related disclosures in the consolidated financial statements or, if such disclosures are
inadequate, to modify our opinion. Our conclusions are based on the audit evidence obtained up to the
date of our auditors’ report. However, future events or conditions may cause Lumax International Corp.,
Ltd. and its subsidiaries to cease to continue as a going concern.
5. Evaluate the overall presentation, structure and content of the consolidated financial statements, including
the disclosures, and whether the consolidated financial statements represent the underlying transactions and
events in a manner that achieves fair presentation.

- 4 -
6. Obtain sufficient and appropriate audit evidence regarding the financial information of entities or business
activities within Lumax International Corp., Ltd. and its subsidiaries to express an opinion on the
consolidated financial statements. We are responsible for the direction, supervision, and performance of
the group audit. We remain solely responsible for our audit opinion.
We communicate with those charged with governance regarding, among other matters, the planned scope and
timing of the audit and significant audit findings, including any significant deficiencies in internal control that
we identify during our audit.
We also provide those charged with governance with a statement that we have complied with relevant ethical
requirements regarding independence, and to communicate with them all relationships and other matters that
may reasonably be thought to bear on our independence, and where applicable, related safeguards.
From the matters communicated with those charged with governance, we determine those matters that were of
most significance in the audit of the consolidated financial statements for the year ended December 31, 2016
and are therefore the key audit matters. We describe these matters in our auditors’ report unless law or
regulation precludes public disclosure about the matter or when, in extremely rare circumstances, we determine
that a matter should not be communicated in our report because the adverse consequences of doing so would
reasonably be expected to outweigh the public interest benefits of such communication.
The engagement partners on the audit resulting in this independent auditors’ report are Wen-chin Lin and
Li-wen Kuo.
Deloitte & Touche
Taipei, Taiwan
Republic of China
March 24, 2017
Notice to Readers
The accompanying consolidated financial statements are intended only to present the consolidated financial
position, financial performance and cash flows in accordance with accounting principles and practices
generally accepted in the Republic of China and not those of any other jurisdictions. The standards,
procedures and practices to audit such consolidated financial statements are those generally applied in the
Republic of China.
For the convenience of readers, the independent auditors’ report and the accompanying consolidated financial
statements have been translated into English from the original Chinese version prepared and used in the
Republic of China. If there is any conflict between the English version and the original Chinese version or any
difference in the interpretation of the two versions, the Chinese-language independent auditors’ report and
consolidated financial statements shall prevail.

- 5 -
LUMAX INTERNATIONAL CORP., LTD. AND SUBSIDIARIES
CONSOLIDATED BALANCE SHEETS
DECEMBER 31, 2016 AND 2015
(In Thousands of New Taiwan Dollars)
2016 2015
ASSETS Amount % Amount %
CURRENT ASSETS
Cash and cash equivalents (Notes 4 and 6) $ 1,350,450 21 $ 1,497,947 23
Debt investment with no active market - current (Notes 4, 8 and 25) 1,106,286 17 953,163 14
Notes receivable from unrelated parties (Note 9) 159,997 2 231,287 3
Trade receivables from unrelated parties (Notes 4, 5 and 9) 1,081,350 17 1,030,206 16
Other receivables (Notes 9 and 25) 65,076 1 107,626 2
Inventories (Notes 4, 5 and 10) 1,413,948 22 1,605,195 24
Other current assets 44,564 1 58,495 1
Total current assets 5,221,671 81 5,483,919 83
NON-CURRENT ASSETS
Financial assets measured at cost - non-current (Notes 4 and 7) 22,662 - 22,662 -
Property, plant and equipment (Notes 4, 12 and 25) 964,334 15 904,889 14
Investment property (Notes 4, 13 and 25) 118,046 2 57,666 1
Deferred tax assets (Notes 4 and 20) 35,185 1 28,748 -
Refundable deposits 48,650 1 48,219 1
Other non-current assets 28,960 - 98,856 1
Total non-current assets 1,217,837 19 1,161,040 17
TOTAL $ 6,439,508 100 $ 6,644,959 100
LIABILITIES AND EQUITY
CURRENT LIABILITIES
Notes payable to unrelated parties (Note 15) $ 29,328 1 $ 19,895 -
Trade payables to unrelated parties (Note 15) 361,244 6 393,189 6
Other payables (Note 16) 212,931 3 187,983 3
Current tax liabilities (Note 4) 78,506 1 65,293 1
Advance receipts 858,495 13 1,100,664 17
Current portion of long-term borrowings (Note 14) 19,995 - 19,581 -
Other current liabilities 5,339 - 7,736 -
Total current liabilities 1,565,838 24 1,794,341 27
NON-CURRENT LIABILITIES
Long-term borrowings (Note 14) 130,600 2 150,851 2
Finance lease payables - non-current (Note 4) 1,541 - 1,703 -
Net defined benefit liabilities- non-current (Notes 4, 5 and 17) 126,271 2 121,216 2
Guarantee deposits 1,892 - 1,657 -
Deferred tax liabilities (Notes 4 and 20) 353,917 6 359,791 6
Total non-current liabilities 614,221 10 635,218 10
Total liabilities 2,180,059 34 2,429,559 37
EQUITY (Note 18)
Common stocks 1,187,109 18 1,187,109 18
Capital surplus - additional paid-in capital 110,891 2 110,891 1
Retained earnings
Legal reserve 708,243 11 650,570 10
Special reserve 31,819 1 31,819 -
Unappropriated earnings 2,192,155 34 2,102,978 32
Total retained earnings 2,932,217 46 2,785,367 42
Other equity 29,232 - 132,033 2
Total equity 4,259,449 66 4,215,400 63
TOTAL $ 6,439,508 100 $ 6,644,959 100
The accompanying notes are an integral part of the consolidated financial statements.

- 6 -
LUMAX INTERNATIONAL CORP., LTD. AND SUBSIDIARIES
CONSOLIDATED STATEMENTS OF COMPREHENSIVE INCOME
FOR THE YEARS ENDED DECEMBER 31, 2016 AND 2015
(In Thousands of New Taiwan Dollars, Except Earnings Per Share)
2016 2015
Amount % Amount %
OPERATING REVENUE (Note 4)
Sales $ 3,837,403 80 $ 4,491,371 84
Service revenue (Note 5) 980,027 20 839,164 16
Total operating revenue 4,817,430 100 5,330,535 100
OPERATING COST (Note 19)
Cost of goods sold (Note 10) 2,977,590 62 3,391,288 64
Service cost 514,154 11 446,519 8
Total operating costs 3,491,744 73 3,837,807 72
GROSS PROFIT 1,325,686 27 1,492,728 28
OPERATING EXPENSES (Notes 4, 17 and 19)
Selling and marketing expenses 499,440 10 506,109 9
General and administrative expenses 183,615 4 202,505 4
Research and development expenses 57,647 1 62,817 1
Total operating expenses 740,702 15 771,431 14
OPERATING INCOME 584,984 12 721,297 14
NON-OPERATING INCOME AND EXPENSES
Other income (Notes 4 and 19) 55,059 1 32,599 -
Other gains and losses (Note 19) (5,741) - (11,325) -
Finance costs 2,853 - 4,852 -
Total non-operating income and expenses 46,465 1 16,422 -
PROFIT BEFORE INCOME TAX 631,449 13 737,719 14
INCOME TAX EXPENSE (Notes 4 and 20) 115,647 2 160,990 3
NET PROFIT FOR THE YEAR 515,802 11 576,729 11
(Continued)

- 7 -
LUMAX INTERNATIONAL CORP., LTD. AND SUBSIDIARIES
CONSOLIDATED STATEMENTS OF COMPREHENSIVE INCOME
FOR THE YEARS ENDED DECEMBER 31, 2016 AND 2015
(In Thousands of New Taiwan Dollars, Except Earnings Per Share)
2016 2015
Amount % Amount %
OTHER COMPREHENSIVE INCOME
Items that will not be reclassified subsequently to
profit or loss:
Remeasurement of defined benefit plans $ (15,445) (1) $ (9,374) -
Income tax relating to items that will not be
reclassified subsequently to profit or loss 2,625 - 1,594 -
Items that may be reclassified subsequently to profit
or loss:
Exchange differences on translating foreign
operations (102,801) (2) 17,472 -
Other comprehensive income for the year, net
of income tax (115,621) (3) 9,692 -
TOTAL COMPREHENSIVE INCOME FOR THE
YEAR $ 400,181 8 $ 586,421 11
EARNINGS PER SHARE (Note 21)
Basic $ 4.35 $ 4.86
Diluted $ 4.29 $ 4.79
The accompanying notes are an integral part of the consolidated financial statements. (Concluded)

- 8 -
LUMAX INTERNATIONAL CORP., LTD. AND SUBSIDIARIES
CONSOLIDATED STATEMENTS OF CHANGES IN EQUITY
FOR THE YEARS ENDED DECEMBER 31, 2016 AND 2015
(In Thousands of New Taiwan Dollars)
Other Equity
Exchange
Differences on
Retained Earnings Translating
Unappropriated Foreign
Common Stock Capital Surplus Legal Reserve Special Reserve Earnings Operations Total Equity
BALANCE AT JANUARY 1, 2015 $ 1,187,109 $ 110,891 $ 587,150 $ 31,819 $ 1,953,581 $ 114,561 $ 3,985,111
Appropriation of 2014 earnings
Legal reserve - - 63,420 - (63,420) - -
Cash dividends - NT$3 per share - - - - (356,132) - (356,132)
Net profit for the year ended December 31, 2015 - - - - 576,729 - 576,729
Other comprehensive income for the year ended December 31, 2015 - - - - (7,780) 17,472 9,692
Total comprehensive income for the year ended December 31, 2015 - - - - 568,949 17,472 586,421
BALANCE AT DECEMBER 31, 2015 1,187,109 110,891 650,570 31,819 2,102,978 132,033 4,215,400
Appropriation of 2015 earnings
Legal reserve - - 57,673 - (57,673) - -
Cash dividends - NT$3 per share - - - - (356,132) - (356,132)
Net profit for the year ended December 31, 2016 - - - - 515,802 - 515,802
Other comprehensive income for the year ended December 31, 2016 - - - - (12,820) (102,801) (115,621)
Total comprehensive income for the year ended December 31, 2016 - - - - 502,982 (102,801) 400,181
BALANCE AT DECEMBER 31, 2016 $ 1,187,109 $ 110,891 $ 708,243 $ 31,819 $ 2,192,155 $ 29,232 $ 4,259,449
The accompanying notes are an integral part of the consolidated financial statements.
- 9 -
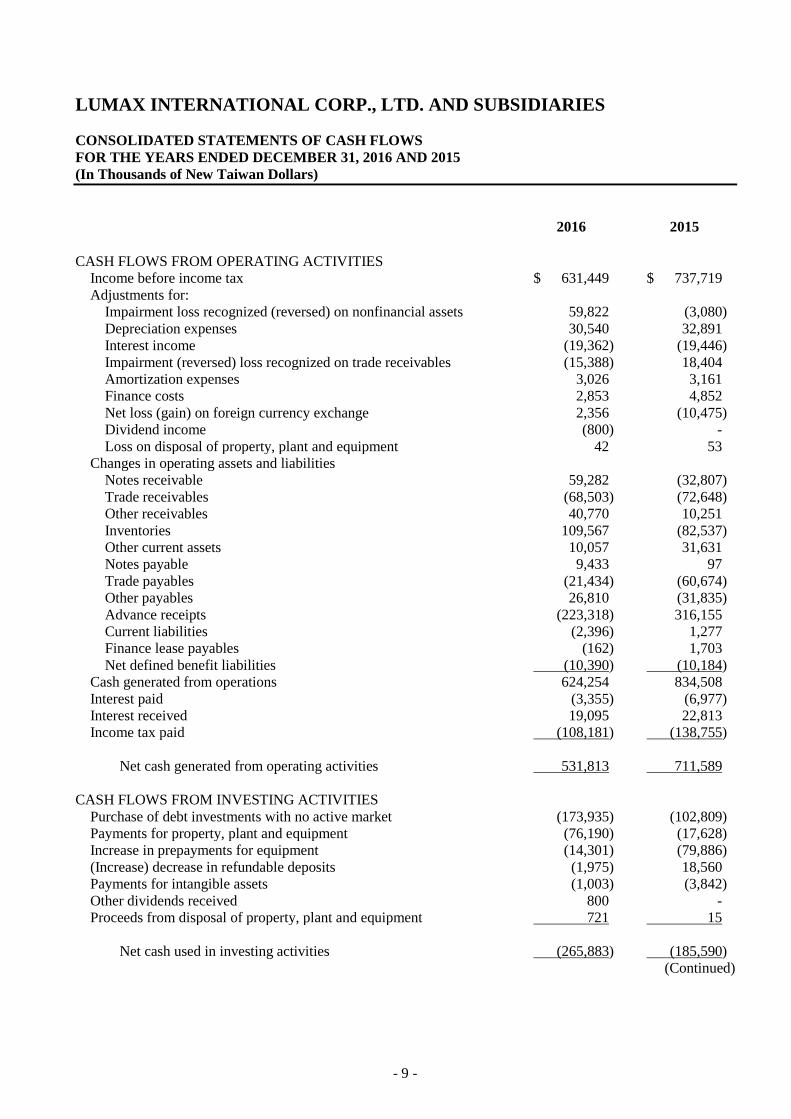
LUMAX INTERNATIONAL CORP., LTD. AND SUBSIDIARIES
CONSOLIDATED STATEMENTS OF CASH FLOWS
FOR THE YEARS ENDED DECEMBER 31, 2016 AND 2015
(In Thousands of New Taiwan Dollars)
2016 2015
CASH FLOWS FROM OPERATING ACTIVITIES
Income before income tax $ 631,449 $ 737,719
Adjustments for:
Impairment loss recognized (reversed) on nonfinancial assets 59,822 (3,080)
Depreciation expenses 30,540 32,891
Interest income (19,362) (19,446)
Impairment (reversed) loss recognized on trade receivables (15,388) 18,404
Amortization expenses 3,026 3,161
Finance costs 2,853 4,852
Net loss (gain) on foreign currency exchange 2,356 (10,475)
Dividend income (800) -
Loss on disposal of property, plant and equipment 42 53
Changes in operating assets and liabilities
Notes receivable 59,282 (32,807)
Trade receivables (68,503) (72,648)
Other receivables 40,770 10,251
Inventories 109,567 (82,537)
Other current assets 10,057 31,631
Notes payable 9,433 97
Trade payables (21,434) (60,674)
Other payables 26,810 (31,835)
Advance receipts (223,318) 316,155
Current liabilities (2,396) 1,277
Finance lease payables (162) 1,703
Net defined benefit liabilities (10,390) (10,184)
Cash generated from operations 624,254 834,508
Interest paid (3,355) (6,977)
Interest received 19,095 22,813
Income tax paid (108,181) (138,755)
Net cash generated from operating activities 531,813 711,589
CASH FLOWS FROM INVESTING ACTIVITIES
Purchase of debt investments with no active market (173,935) (102,809)
Payments for property, plant and equipment (76,190) (17,628)
Increase in prepayments for equipment (14,301) (79,886)
(Increase) decrease in refundable deposits (1,975) 18,560
Payments for intangible assets (1,003) (3,842)
Other dividends received 800 -
Proceeds from disposal of property, plant and equipment 721 15
Net cash used in investing activities (265,883) (185,590)
(Continued)

- 10 -
LUMAX INTERNATIONAL CORP., LTD. AND SUBSIDIARIES
CONSOLIDATED STATEMENTS OF CASH FLOWS
FOR THE YEARS ENDED DECEMBER 31, 2016 AND 2015
(In Thousands of New Taiwan Dollars)
2016 2015
CASH FLOWS FROM FINANCING ACTIVITIES
Cash dividends paid $ (356,132) $ (356,132)
Repayments of long-term borrowings (19,837) (19,394)
Proceeds from guarantee deposits received 235 1,035
Repayments of short-term borrowings - (133,879)
Net cash used in financing activities (375,734) (508,370)
EFFECTS OF EXCHANGE RATE CHANGES ON THE BALANCE
OF CASH HELD IN FOREIGN CURRENCIES (37,693) 18,456
NET (DECREASE) INCREASE IN CASH AND CASH
EQUIVALENTS (147,497) 36,085
CASH AND CASH EQUIVALENTS AT THE BEGINNING OF THE
YEAR 1,497,947 1,461,862
CASH AND CASH EQUIVALENTS AT THE END OF THE YEAR $ 1,350,450 $ 1,497,947
The accompanying notes are an integral part of the consolidated financial statements. (Concluded)

- 11 -
LUMAX INTERNATIONAL CORP., LTD. AND SUBSIDIARIES
NOTES TO CONSOLIDATED FINANCIAL STATEMENTS
FOR THE YEARS ENDED DECEMBER 31, 2016 AND 2015
(In Thousands of New Taiwan Dollars, Unless Stated Otherwise)
1. GENERAL INFORMATION
Lumax International Corp., Ltd. (the Company) was incorporated in the Republic of China (ROC) in
August 16, 1975, under the Company Law of the Republic of China (ROC) and related laws. The
Company’s shares had been traded on the ROC Over-the-Counter Securities Exchange (known as GreTai
Securities Market) since November 11, 2002. Afterward, the Company’s shares have been listed on the
Taiwan Stock Exchange since September 27, 2004. The Company is primarily engaged in wholesaling of
electronic materials, selling, installation, and integrated maintenance services of process-control devices or
system.
The consolidated financial statements are presented in the Company’s functional currency, New Taiwan
dollars.
2. APPROVAL OF FINANCIAL STATEMENTS
The consolidated financial statements were approved by the Company’s board of directors and authorized
for issue on March 24, 2017.
3. APPLICATION OF NEW, AMENDED AND REVISED STANDARDS AND INTERPRETATIONS
a. Amendments to the Regulations Governing the Preparation of Financial Reports by Securities Issuers
and the International Financial Reporting Standards (IFRS), International Accounting Standards (IAS),
Interpretations of IFRS (IFRIC), and Interpretations of IAS (SIC) endorsed by the FSC for application
starting from 2017.
Order No. 1050050021 and Order No. 1050026834 issued by the FSC stipulated that starting January 1,
2017, the Group should apply the amendments to the Regulations Governing the Preparation of
Financial Reports by Securities Issuers and the IFRS, IAS, IFRIC and SIC (collectively, the IFRSs)
issued by the IASB and endorsed by the FSC for application starting from 2017.
New, Amended or Revised Standards and Interpretations
(the New IFRSs)
Effective Date
Announced by IASB (Note 1)
Annual Improvements to IFRSs 2010-2012 Cycle July 1, 2014 (Note 2)
Annual Improvements to IFRSs 2011-2013 Cycle July 1, 2014
Annual Improvements to IFRSs 2012-2014 Cycle January 1, 2016 (Note 3)
Amendments to IFRS 10, IFRS 12 and IAS 28 “Investment Entities:
Applying the Consolidation Exception”
January 1, 2016
Amendment to IFRS 11 “Accounting for Acquisitions of Interests in
Joint Operations”
January 1, 2016
IFRS 14 “Regulatory Deferral Accounts” January 1, 2016
Amendment to IAS 1 “Disclosure Initiative” January 1, 2016
Amendments to IAS 16 and IAS 38 “Clarification of Acceptable
Methods of Depreciation and Amortization”
January 1, 2016
(Continued)

- 12 -
New, Amended or Revised Standards and Interpretations
(the New IFRSs)
Effective Date
Announced by IASB (Note 1)
Amendments to IAS 16 and IAS 41 “Agriculture: Bearer Plants” January 1, 2016
Amendment to IAS 19 “Defined Benefit Plans: Employee
Contributions”
July 1, 2014
Amendment to IAS 27 “Equity Method in Separate Financial
Statements”
January 1, 2016
Amendment to IAS 36 “Impairment of Assets: Recoverable Amount
Disclosures for Non-financial Assets”
January 1, 2014
Amendment to IAS 39 “Novation of Derivatives and Continuation of
Hedge Accounting”
January 1, 2014
IFRIC 21 “Levies” January 1, 2014
(Concluded)
Note 1: Unless stated otherwise, the above New IFRSs are effective for annual periods beginning on
or after their respective effective dates.
Note 2: The amendment to IFRS 2 applies to share-based payment transactions with grant date on or
after July 1, 2014; the amendment to IFRS 3 applies to business combinations with acquisition
date on or after July 1, 2014; the amendment to IFRS 13 is effective immediately; the
remaining amendments are effective for annual periods beginning on or after July 1, 2014.
Note 3: The amendment to IFRS 5 is applied prospectively to changes in a method of disposal that
occur in annual periods beginning on or after January 1, 2016; the remaining amendments are
effective for annual periods beginning on or after January 1, 2016.
The amendments include additions of several accounting items and requirements for disclosures of
impairment of non-financial assets as a consequence of the IFRSs endorsed by the FSC for application
starting from 2017. In addition, as a result of the post implementation review of IFRSs in Taiwan, the
amendments also include emphasis on certain recognition and measurement considerations and add
requirements for disclosures of related party transactions and goodwill.
The amendments stipulate that other companies or institutions of which the chairman of the board of
directors or president serves as the chairman of the board of directors or the president, or is the spouse
or second immediate family of the chairman of the board of directors or president of the Group are
deemed to have a substantive related party relationship, unless it can be demonstrated that no control,
joint control, or significant influence exists. Furthermore, the amendments require the disclosure of
the names of the related parties and the relationship with whom the Group has significant transaction.
If the transaction or balance with a specific related party is 10% or more of the Group’s respective total
transaction or balance, such transaction should be separately disclosed by the name of each related
party.
The initial application in 2017 of the above IFRSs and related amendments to the Regulations
Governing the Preparation of Financial Reports by Securities Issuers would not have any material
impact on the Group’s accounting policies.
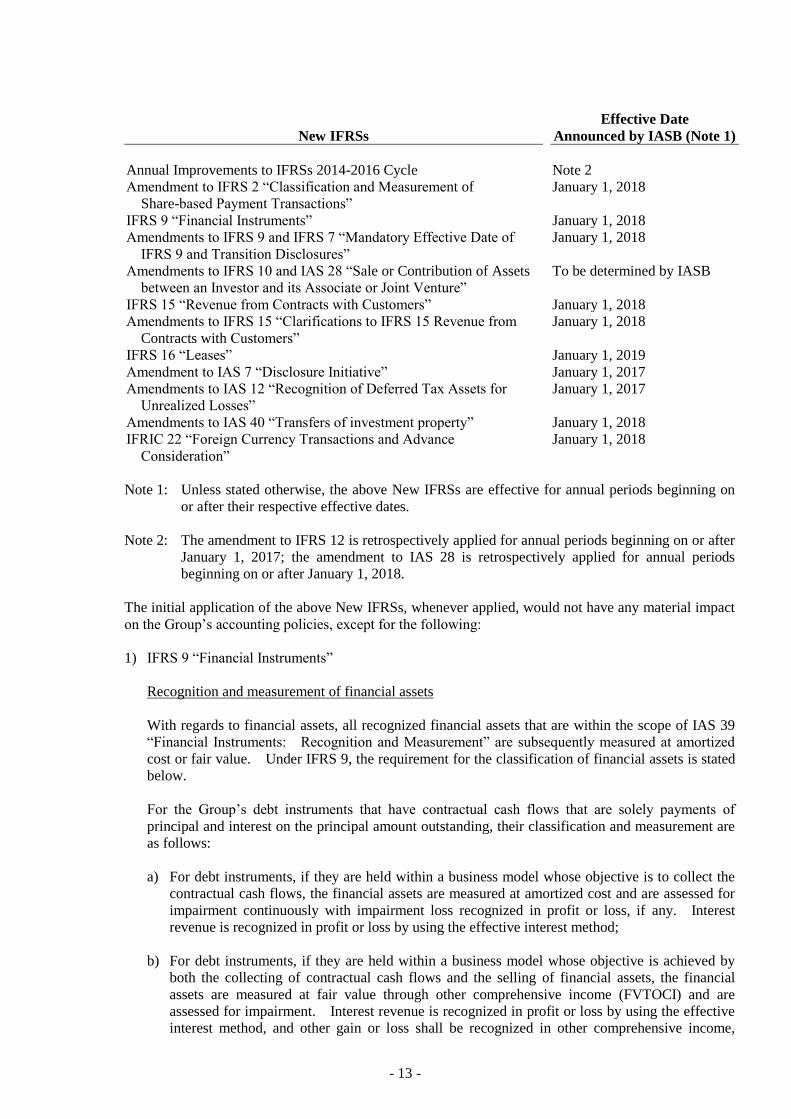
b. New IFRSs in issue but not yet endorsed by the FSC
The Group has not applied the following IFRSs issued by the IASB but not yet endorsed by the FSC.
The FSC announced that IFRS 9 and IFRS 15 will take effect starting January 1, 2018. As of the date
the consolidated financial statements were authorized for issue, the FSC has not announced the effective
dates of other new IFRSs.
- 13 -
New IFRSs
Effective Date
Announced by IASB (Note 1)
Annual Improvements to IFRSs 2014-2016 Cycle Note 2
Amendment to IFRS 2 “Classification and Measurement of
Share-based Payment Transactions”
January 1, 2018
IFRS 9 “Financial Instruments” January 1, 2018
Amendments to IFRS 9 and IFRS 7 “Mandatory Effective Date of
IFRS 9 and Transition Disclosures”
January 1, 2018
Amendments to IFRS 10 and IAS 28 “Sale or Contribution of Assets
between an Investor and its Associate or Joint Venture”
To be determined by IASB
IFRS 15 “Revenue from Contracts with Customers” January 1, 2018
Amendments to IFRS 15 “Clarifications to IFRS 15 Revenue from
Contracts with Customers”
January 1, 2018
IFRS 16 “Leases” January 1, 2019
Amendment to IAS 7 “Disclosure Initiative” January 1, 2017
Amendments to IAS 12 “Recognition of Deferred Tax Assets for
Unrealized Losses”
January 1, 2017
Amendments to IAS 40 “Transfers of investment property” January 1, 2018
IFRIC 22 “Foreign Currency Transactions and Advance
Consideration”
January 1, 2018
Note 1: Unless stated otherwise, the above New IFRSs are effective for annual periods beginning on
or after their respective effective dates.
Note 2: The amendment to IFRS 12 is retrospectively applied for annual periods beginning on or after
January 1, 2017; the amendment to IAS 28 is retrospectively applied for annual periods
beginning on or after January 1, 2018.
The initial application of the above New IFRSs, whenever applied, would not have any material impact
on the Group’s accounting policies, except for the following:
1) IFRS 9 “Financial Instruments”
Recognition and measurement of financial assets
With regards to financial assets, all recognized financial assets that are within the scope of IAS 39
“Financial Instruments: Recognition and Measurement” are subsequently measured at amortized
cost or fair value. Under IFRS 9, the requirement for the classification of financial assets is stated
below.
For the Group’s debt instruments that have contractual cash flows that are solely payments of
principal and interest on the principal amount outstanding, their classification and measurement are
as follows:
a) For debt instruments, if they are held within a business model whose objective is to collect the
contractual cash flows, the financial assets are measured at amortized cost and are assessed for
impairment continuously with impairment loss recognized in profit or loss, if any. Interest
revenue is recognized in profit or loss by using the effective interest method;
b) For debt instruments, if they are held within a business model whose objective is achieved by
both the collecting of contractual cash flows and the selling of financial assets, the financial
assets are measured at fair value through other comprehensive income (FVTOCI) and are
assessed for impairment. Interest revenue is recognized in profit or loss by using the effective
interest method, and other gain or loss shall be recognized in other comprehensive income,
- 14 -
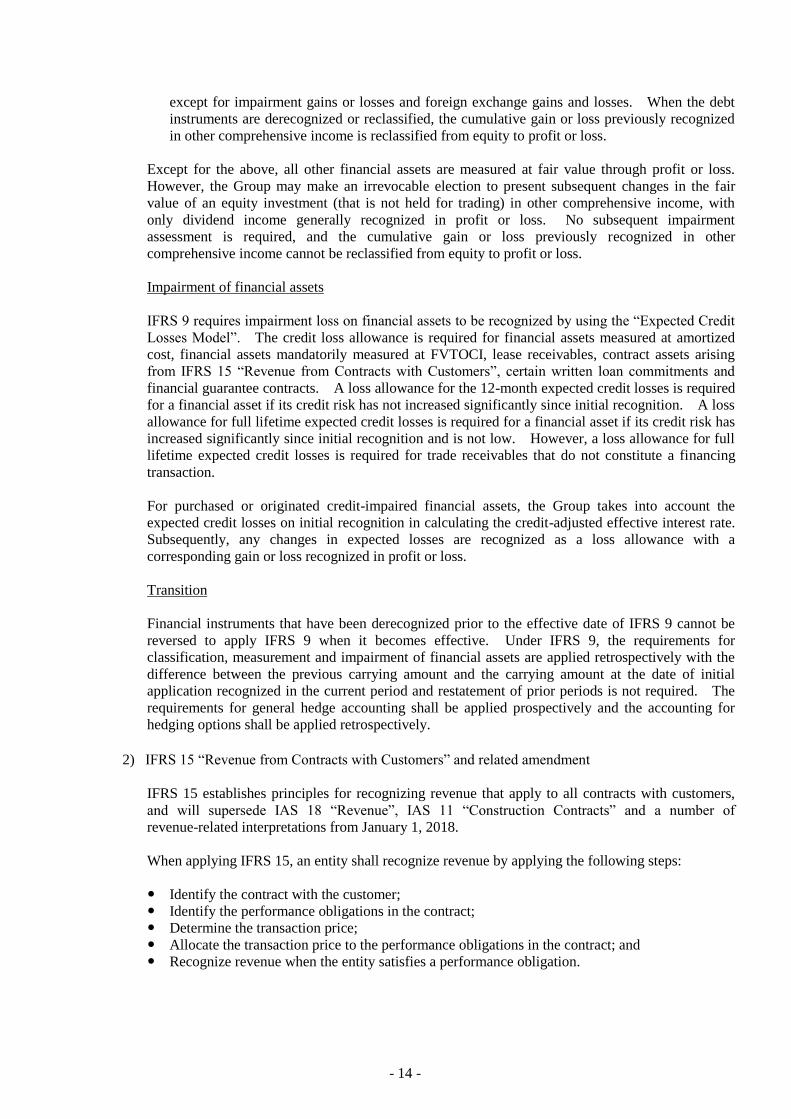
except for impairment gains or losses and foreign exchange gains and losses. When the debt
instruments are derecognized or reclassified, the cumulative gain or loss previously recognized
in other comprehensive income is reclassified from equity to profit or loss.
Except for the above, all other financial assets are measured at fair value through profit or loss.
However, the Group may make an irrevocable election to present subsequent changes in the fair
value of an equity investment (that is not held for trading) in other comprehensive income, with
only dividend income generally recognized in profit or loss. No subsequent impairment
assessment is required, and the cumulative gain or loss previously recognized in other
comprehensive income cannot be reclassified from equity to profit or loss.
Impairment of financial assets
IFRS 9 requires impairment loss on financial assets to be recognized by using the “Expected Credit
Losses Model”. The credit loss allowance is required for financial assets measured at amortized
cost, financial assets mandatorily measured at FVTOCI, lease receivables, contract assets arising
from IFRS 15 “Revenue from Contracts with Customers”, certain written loan commitments and
financial guarantee contracts. A loss allowance for the 12-month expected credit losses is required
for a financial asset if its credit risk has not increased significantly since initial recognition. A loss
allowance for full lifetime expected credit losses is required for a financial asset if its credit risk has
increased significantly since initial recognition and is not low. However, a loss allowance for full
lifetime expected credit losses is required for trade receivables that do not constitute a financing
transaction.
For purchased or originated credit-impaired financial assets, the Group takes into account the
expected credit losses on initial recognition in calculating the credit-adjusted effective interest rate.
Subsequently, any changes in expected losses are recognized as a loss allowance with a
corresponding gain or loss recognized in profit or loss.
Transition
Financial instruments that have been derecognized prior to the effective date of IFRS 9 cannot be
reversed to apply IFRS 9 when it becomes effective. Under IFRS 9, the requirements for
classification, measurement and impairment of financial assets are applied retrospectively with the
difference between the previous carrying amount and the carrying amount at the date of initial
application recognized in the current period and restatement of prior periods is not required. The
requirements for general hedge accounting shall be applied prospectively and the accounting for
hedging options shall be applied retrospectively.
2) IFRS 15 “Revenue from Contracts with Customers” and related amendment
IFRS 15 establishes principles for recognizing revenue that apply to all contracts with customers,
and will supersede IAS 18 “Revenue”, IAS 11 “Construction Contracts” and a number of
revenue-related interpretations from January 1, 2018.
When applying IFRS 15, an entity shall recognize revenue by applying the following steps:
Identify the contract with the customer;
Identify the performance obligations in the contract;
Determine the transaction price;
Allocate the transaction price to the performance obligations in the contract; and
Recognize revenue when the entity satisfies a performance obligation.

- 15 -
In identifying performance obligations, IFRS 15 and related amendment require that a good or
service is distinct if it is capable of being distinct and the promise to transfer it is distinct within the
context of the contract. The Group enters into contracts with its customers. In each contract,
each product or service has its stand-alone selling price. Under the contract, the Group provides a
significant service of integrating the goods and services, the combined output specified in the
contract. Therefore, the goods and services promised in the contract are not considered as distinct.
Under IFRS 15, the Group will account for the goods and services in each contract as a single
performance obligation.
If the customer has retained a portion of payment to the Group in accordance with the term of the
contract in order to protect the customer from the contractor’s possible failure to adequately
complete its obligations under the contract, such payment arrangement does not include a
significant financing component under IFRS 15. Under current standard, retention receivables
under construction contract should be discounted to reflect time value of money.
Under IFRS 15, the Group will allocate the transaction price to each performance obligation
identified in the contract on a relative stand-alone selling price basis. Under current standard, the
Group applies residual value method to allocate the amount of revenue to be recognized.
Incremental costs of obtaining a contract will be recognized as an asset to the extent the Group
expects to recover those costs. Such asset will be amortized on a basis that is consistent with the
transfer to the customer of the goods or services to which the asset relates. This will lead to the
later recognition of charges for certain customer-obtaining costs.
The Group provides service-type warranty in addition to the assurance that the product complies
with agreed-upon specifications. IFRS 15 requires such service to be considered as a performance
obligation. Transaction price allocated to service-type warranty will be recognized as revenue and
related costs will be recognized when warranty service is performed. Under current standard,
transaction price of the aforementioned transaction is fully recognized as revenue when products are
sold, and a corresponding provision is recognized for the expected warranty cost.
3) IFRIC 22 “Foreign Currency Transactions and Advance Consideration”
IAS 21 stipulated that a foreign currency transaction shall be recorded on initial recognition in the
functional currency by applying to the foreign currency amount the spot exchange rate between the
functional currency and the foreign currency at the date of the transaction. IFRIC 22 further
explains that the date of the transaction is the date on which an entity recognizes a non-monetary
asset or non-monetary liability from payment or receipt of advance consideration. If there are
multiple payments or receipts in advance, the entity shall determine the date of the transaction for
each payment or receipt of advance consideration.
The Group shall apply IFRIC 22 either retrospectively or prospectively to all assets, expenses and
income in the scope of the Interpretation initially recognized on or after (a) the beginning of the
reporting period in which the entity first applies IFRIC 22, or (b) the beginning of a prior reporting
period presented as comparative information in the financial statements of the reporting period in
which the entity first applies IFRIC 22.
As of the date the consolidated financial statements were authorized for issue, Lumax International
Corp., Ltd. and Subsidiaries is continuously assessing the possible impact that the application of other
standards and interpretations will have on the Group’s financial position and financial performance, and
will disclose the relevant impact when the assessment is completed.

- 16 -
4. SUMMARY OF SIGNIFICANT ACCOUNTING POLICIES
a. Statement of compliance
The consolidated financial statements have been prepared in accordance with the Regulations
Governing the Preparation of Financial Reports by Securities Issuers and IFRSs as endorsed by the
FSC.
b. Basis of preparation
The consolidated financial statements have been prepared on the historical cost basis except for
financial instruments which are measured at fair value.
The fair value measurements are grouped into Levels 1 to 3 based on the degree to which the fair value
measurements inputs are observable and the significance of the inputs to the fair value measurement in
its entirety. The levels of inputs are described as follows:
1) Level 1 inputs are quoted prices (unadjusted) in active markets for identical assets or liabilities;
2) Level 2 inputs are inputs other than quoted prices included within Level 1 that are observable for
the asset or liability, either directly (i.e. as prices) or indirectly (i.e. derived from prices); and
3) Level 3 inputs are unobservable inputs for the asset or liability.
c. Classification of current and non-current assets and liabilities
Current assets include:
1) Assets held primarily for the purpose of trading;
2) Assets expected to be realized within twelve months after the reporting period; and
3) Cash and cash equivalents unless the asset is restricted from being exchanged or used to settle a
liability for at least twelve months after the reporting period.
Current liabilities include:
1) Liabilities held primarily for the purpose of trading;
2) Liabilities due to be settled within twelve months after the reporting period, even if an agreement to
refinance, or to reschedule payments, on a long-term basis is completed after the reporting period
and before the consolidated financial statements are authorized for issue; and
3) Liabilities for which the Group does not have an unconditional right to defer settlement for at least
twelve months after the reporting period. Terms of a liability that could, at the option of the
counterparty, result in its settlement by the issue of equity instruments do not affect its
classification.
Assets and liabilities that are not classified as current are classified as non-current.
d. Basis of consolidation
The consolidated financial statements incorporate the financial statements of the Company and the
subsidiaries controlled by the Company. When necessary, adjustments are made to the financial
statements of subsidiaries to bring their accounting policies into line with those used by the Group.
All intra-group transactions, balances, income and expenses are eliminated in full upon consolidation.

- 17 -
e. Foreign currencies
In preparing the financial statements of each individual group entity, transactions in currencies other
than the entity’s functional currency (foreign currencies) are recognized at the rates of exchange
prevailing at the dates of the transactions. At the end of each reporting period, monetary items
denominated in foreign currencies are retranslated at the rates prevailing at that date.
Exchange differences on monetary items arising from settlement or translation are recognized in profit
or loss in the period.
Non-monetary items that are measured at historical cost in a foreign currency are not retranslated.
For the purposes of presenting consolidated financial statements, the assets and liabilities of the Group
foreign operations (including of the subsidiaries in other countries or currencies used different with the
Company) are translated into New Taiwan dollars using exchange rates prevailing at the end of each
reporting period. Income and expense items are translated at the average exchange rates for the
period. Exchange differences arising are recognized in other comprehensive income.
f. Inventories
Inventories are stated at the lower of cost or net realizable value. Inventory write-downs are made by
item, except where it may be appropriate to group similar or related items. Net realizable value is the
estimated selling price of inventories less all estimated costs of completion and costs necessary to make
the sale. Inventories are recorded at weighted-average cost on the balance sheet date.
g. Property, plant and equipment
Property, plant and equipment are stated at cost, less subsequent accumulated depreciation and
subsequent accumulated impairment loss.
Depreciation on property, plant and equipment is recognized using the straight-line method. Each
significant part is depreciated separately. The estimated useful lives, residual values and depreciation
method are reviewed at the end of each reporting period, with the effect of any changes in estimate
accounted for on a prospective basis.
On derecognition of an item of property, plant and equipment, the difference between the sales proceeds
and the carrying amount of the asset is recognized in profit or loss.
h. Investment property
Investment property is property held to earn rentals and/or for capital appreciation. Investment
property also includes land held for a currently undetermined future use.
Investment property is measured initially at cost, including transaction costs. Subsequent to initial
recognition, investment property is measured at cost less accumulated depreciation and accumulated
impairment loss. Depreciation is recognized using the straight-line method.
On derecognition of an item of property, plant and equipment, the difference between the sales proceeds
and the carrying amount of the asset is recognized in profit or loss.

- 18 -
i. Intangible assets
1) Intangible assets acquired separately
Intangible assets with finite useful lives that are acquired separately are initially measured at cost
and subsequently measured at cost less accumulated amortization and accumulated impairment loss.
Amortization is recognized on a straight-line basis. Intangible assets with indefinite useful lives
that are acquired separately are measured at cost less accumulated impairment loss.
2) Derecognition of intangible assets
Gains or losses arising from derecognition of an intangible asset, which are measured as the
difference between the net disposal proceeds and the carrying amount of the asset, are recognized in
profit or loss when the asset is derecognized.
j. Impairment of tangible and intangible assets
At the end of each reporting period, the Group reviews the carrying amounts of its tangible and
intangible assets, excluding goodwill, to determine whether there is any indication that those assets
have suffered an impairment loss. If any such indication exists, the recoverable amount of the asset is
estimated in order to determine the extent of the impairment loss. When it is not possible to estimate
the recoverable amount of an individual asset, the Group estimates the recoverable amount of the
cash-generating unit to which the asset belongs.
Recoverable amount is the higher of fair value less costs to sell and value in use. If the recoverable
amount of an asset or cash-generating unit is estimated to be less than its carrying amount, the carrying
amount of the asset or cash-generating unit is reduced to its recoverable amount, with the resulting
impairment loss recognized in profit or loss.
When an impairment loss is subsequently reversed, the carrying amount of the asset or cash-generating
unit is increased to the revised estimate of its recoverable amount, but only to the extent of the carrying
amount that would have been determined had no impairment loss been recognized for the asset or
cash-generating unit in prior years. A reversal of an impairment loss is recognized in profit or loss.
k. Financial instruments
Financial assets and financial liabilities are recognized when a group entity becomes a party to the
contractual provisions of the instruments.
Financial assets and financial liabilities are initially measured at fair value. Transaction costs that are
directly attributable to the acquisition or issue of financial assets and financial liabilities (other than
financial assets and financial liabilities at fair value through profit or loss) are added to or deducted
from the fair value of the financial assets or financial liabilities, as appropriate, on initial recognition.
Transaction costs directly attributable to the acquisition of financial assets or financial liabilities at fair
value through profit or loss are recognized immediately in profit or loss.
Financial assets
All regular way purchases or sales of financial assets are recognized and derecognized on a trade date
basis.
1) Measurement category
Financial assets are classified into the following categories: Available-for-sale financial assets and
loans and receivables.

- 19 -
a) Available-for-sale financial assets
Available-for-sale financial assets are non-derivatives that are either designated as
available-for-sale or are not classified as loans and receivables, held-to-maturity investments or
financial assets at fair value through profit or loss.
Available-for-sale equity investments that do not have a quoted market price in an active market
and whose fair value cannot be reliably measured and derivatives that are linked to and must be
settled by delivery of such unquoted equity investments are measured at cost less any identified
impairment loss at the end of each reporting period and are presented in a separate line item as
financial assets carried at cost. If, in a subsequent period, the fair value of the financial assets
can be reliably measured, the financial assets are remeasured at fair value. The difference
between carrying amount and fair value is recognized in other comprehensive income on
financial assets. Any impairment losses are recognized in profit and loss.
b) Loans and receivables
Loans and receivables including trade receivables, cash and cash equivalent and debt
investments with no active market are measured at amortized cost using the effective interest
method, less any impairment, except for short-term receivables when the effect of discounting is
immaterial.
Cash equivalent includes time deposits and with original maturities within three months from
the date of acquisition, highly liquid, readily convertible to a known amount of cash and be
subject to an insignificant risk of changes in value. These cash equivalents are held for the
purpose of meeting short-term cash commitments.
2) Impairment of financial assets
Financial assets, other than those at fair value through profit or loss, are assessed for indicators of
impairment at the end of each reporting period. Financial assets are considered to be impaired
when there is objective evidence that, as a result of one or more events that occurred after the initial
recognition of the financial asset, the estimated future cash flows of the investment have been
affected.
For financial assets carried at amortized cost, such as trade receivables, assets are assessed for
impairment on a collective basis even if they were assessed not to be impaired individually.
Objective evidence of impairment for a portfolio of receivables could include the Group’s past
experience of collecting payments, an increase in the number of delayed payments in the portfolio
past the average credit period of 180 days, as well as observable changes in national or local
economic conditions that correlate with default on receivables.
For financial assets carried at amortized cost, the amount of the impairment loss recognized is the
difference between the asset’s carrying amount and the present value of estimated future cash flows,
discounted at the financial asset’s original effective interest rate.
For financial assets measured at amortized cost, if, in a subsequent period, the amount of the
impairment loss decreases and the decrease can be related objectively to an event occurring after the
impairment was recognized, the previously recognized impairment loss is reversed through profit or
loss to the extent that the carrying amount of the investment at the date the impairment is reversed
does not exceed what the amortized cost would have been had the impairment not been recognized.

- 20 -
For all other financial assets, objective evidence of impairment could include significant financial
difficulty of the issuer or counterparty, breach of contract, such as a default or delinquency in
interest or principal payments, it becoming probable that the borrower will enter bankruptcy or
financial re-organization, or the disappearance of an active market for that financial asset because of
financial difficulties.
For financial assets that are carried at cost, the amount of the impairment loss is measured as the
difference between the asset’s carrying amount and the present value of the estimated future cash
flows discounted at the current market rate of return for a similar financial asset. Such impairment
loss will not be reversed in subsequent periods.
The carrying amount of the financial asset is reduced by the impairment loss directly for all
financial assets with the exception of trade receivables, where the carrying amount is reduced
through the use of an allowance account. When a trade receivable is considered uncollectible, it is
written off against the allowance account. Subsequent recoveries of amounts previously written
off are credited against the allowance account. Changes in the carrying amount of the allowance
account are recognized in profit or loss except for uncollectible trade receivables that are written off
against the allowance account.
3) Derecognition of financial assets
The Group derecognizes a financial asset only when the contractual rights to the cash flows from
the asset expire, or when it transfers the financial asset and substantially all the risks and rewards of
ownership of the asset to another party.
On derecognition of a financial asset in its entirety, the difference between the asset’s carrying
amount and the sum of the consideration received and receivable and the cumulative gain or loss
that had been recognized in other comprehensive income is recognized in profit or loss.
Financial liabilities
1) Subsequent measurement
All the financial liabilities are measured at amortized cost using the effective interest method.
2) Derecognition of financial liabilities
The difference between the carrying amount of the financial liability derecognized and the
consideration paid, including any non-cash assets transferred or liabilities assumed, is recognized in
profit or loss.
l. Revenue recognition
Revenue is measured at the fair value of the consideration received or receivable. Revenue is reduced
for estimated customer returns, rebates and other similar allowances.
1) Sale of goods
Revenue from the sale of goods is recognized when the goods are delivered and titles have passed,
at which time all the following conditions are satisfied:
a) The Group has transferred to the buyer the significant risks and rewards of ownership of the
goods;
b) The Group retains neither continuing managerial involvement to the degree usually associated
with ownership nor effective control over the goods sold;

- 21 -
c) The amount of revenue can be measured reliably;
d) It is probable that the economic benefits associated with the transaction will flow to the Group;
and
e) The costs incurred or to be incurred in respect of the transaction can be measured reliably.
2) Rendering of services
Service income is recognized when services are provided.
Revenue from a contract to provide services is recognized by reference to the stage of completion of
the contract.
The completion of the contract is measured based on the proportion of contract costs incurred to
date relative to the estimated total contract costs.
3) Interest income
Interest income from a financial asset is recognized when it is probable that the economic benefits
will flow to the Group and the amount of income can be measured reliably. Interest income is
accrued on a time basis, by reference to the principal outstanding and at the effective interest rate
applicable.
m. Leasing
Leases are classified as finance leases whenever the terms of the lease transfer substantially all the risks
and rewards of ownership to the lessee. All other leases are classified as operating leases.
1) The Group as lessor
Rental income from operating leases is recognized on a straight-line basis over the term of the
relevant lease. Initial direct costs incurred in negotiating and arranging an operating lease are
added to the carrying amount of the leased asset and amortized on a straight-line basis over the lease
term.
2) The Group as lessee
Assets held under finance leases are initially recognized as assets of the Group at their fair value at
the inception of the lease or, if lower, at the present value of the minimum lease payments. The
corresponding liability to the lessor is included in the consolidated balance sheets as a finance lease
obligation.
Finance expenses implicit in lease payments for each period are recognized immediately in profit or
loss, unless they are directly attributable to qualifying assets, in which case they are capitalized.
Operating lease payments are recognized as an expense on a straight-line basis over the lease term.
3) Leasehold land for own use
When a lease includes both land and building elements, the Group assesses the classification of
each element as finance or an operating lease separately based on the assessment as to whether
substantially all the risks and rewards incidental to ownership of each element have been transferred
to the Group. The minimum lease payments are allocated between the land and the building
elements in proportion to the relative fair values of the leasehold interests in the land element and
building element of the lease at the inception of the lease.

- 22 -
If the allocation of the lease payments can be made reliably, lease interest of land under operating
leases is amortized over the lease term on a straight-line basis. When the lease payments cannot
be allocated reliably between the land and building elements, the entire lease is generally classified
as a finance lease unless it is clear that both elements are operating leases, in which case the entire
lease is classified as an operating lease.
n. Employee benefits
1) Short-term employee benefits
Liabilities recognized in respect of short-term employee benefits are measured at the undiscounted
amount of the benefits expected to be paid in exchange for the related service.
2) Retirement benefits
Payments to defined contribution retirement benefit plans are recognized as an expense when
employees have rendered service entitling them to the contributions.
Defined benefit costs (including service cost, net interest and remeasurement) under the defined
benefit retirement benefit plans are determined using the projected unit credit method. Service
cost (including current service cost, and net interest on the net defined benefit liability are
recognized as employee benefits expense in the period they occur. Remeasurement, comprising
actuarial gains and losses, and the return on plan assets (excluding interest), is recognized in other
comprehensive income in the period in which they occur. Remeasurement recognized in other
comprehensive income is reflected immediately in retained earnings and will not be reclassified to
profit or loss.
Net defined benefit liability represents the actual deficit in the Group’s defined benefit plan. Any
surplus resulting from this calculation is limited to the present value of any refunds from the plans
or reductions in future contributions to the plans.
3) Other long-term employee benefits
Other long-term employee benefits are accounted for in the same way as the accounting required for
defined benefit plan except that remeasurement is recognized in profit or loss.
o. Taxation
Income tax expense represents the sum of the tax currently payable and deferred tax.
1) Current tax
According to the Income Tax Law, an additional tax at 10% of unappropriated earnings is provided
for as income tax in the year the shareholders approve to retain the earnings.
Adjustments of prior years’ tax liabilities are added to or deducted from the current year’s tax
provision.
2) Deferred tax
Deferred tax is recognized on temporary differences between the carrying amounts of assets and
liabilities in the consolidated financial statements and the corresponding tax bases used in the
computation of taxable profit. Deferred tax liabilities are generally recognized for all taxable
temporary differences. Deferred tax assets are generally recognized for all taxable profits will be
available against which those deductible temporary differences can be utilized.

- 23 -
The carrying amount of deferred tax assets is reviewed at the end of each reporting period and
reduced to the extent that it is no longer probable that sufficient taxable profits will be available to
allow all or part of the asset to be recovered. A previously unrecognized deferred tax asset is also
reviewed at the end of each reporting period and recognized to the to the extent that it has become
probable that future taxable profit will allow the deferred tax asset to be recovered.
Deferred tax assets and liabilities are measured at the tax rates that are expected to apply in the
period in which the liability is settled or the asset realized, based on tax rates (and tax laws) that
have been enacted or substantively enacted by the end of the reporting period. The measurement
of deferred tax liabilities and assets reflects the tax consequences that would follow from the
manner in which the Group expects, at the end of the reporting period, to recover or settle the
carrying amount of its assets and liabilities.
3) Current and deferred tax for the year
Current and deferred tax are recognized in profit or loss, except when they relate to items that are
recognized in other comprehensive income or directly in equity, in which case, the current and
deferred tax are also recognized in other comprehensive income or directly in equity respectively.
5. CRITICAL ACCOUNTING JUDGMENTS AND KEY SOURCES OF ESTIMATION
UNCERTAINTY
In the application of the Group’s accounting policies, management is required to make judgments, estimates
and assumptions about the carrying amounts of assets and liabilities that are not readily apparent from other
sources. The estimates and associated assumptions are based on historical experience and other factors
that are considered relevant. Actual results may differ from these estimates.
The estimates and underlying assumptions are reviewed on an ongoing basis. Revisions to accounting
estimates are recognized in the period in which the estimate is revised if the revision affects only that period
or in the period of the revision and future periods if the revision affects both current and future periods.
a. Estimated impairment of trade receivables
When there is objective evidence of impairment loss, the Group takes into consideration the estimation
of future cash flows. The amount of the impairment loss is measured as the difference between the
asset’s carrying amount and the present value of estimated future cash flows (excluding future credit
losses that have not been incurred) discounted at the financial asset’s original effective interest rate.
Where the actual future cash flows are less than expected, a material impairment loss may arise.
b. Impairment of inventory
Net realizable value of inventory is the estimated selling price in the ordinary course of business less the
estimated costs of completion and the estimated costs necessary to make the sale. The estimation of
net realizable value was based on current market conditions and the historical experience of selling
products of a similar nature. Changes in market conditions may have a material impact on the
estimation of net realizable value.

- 24 -
6. CASH AND CASH EQUIVALENTS
December 31
2016 2015
Cash on hand $ 1,444 $ 1,232
Checking accounts and demand deposits 1,190,618 661,260
Cash equivalent (investment with original maturities less than three
months)
Time deposits 158,388 835,455
$ 1,350,450 $ 1,497,947
The market rate intervals of cash in bank at the end of the reporting period were as follows:
December 31
2016 2015
Bank deposits (%) 0.01-1.7 0.01-4.05
7. FINANCIAL ASSETS MEASURED AT COST
December 31
2016 2015
Non-current
Domestic unlisted common shares
Powertec Energy Corp. $ 10,000 $ 10,000
Prohubs International Corp. 6,662 6,662
Domestic unlisted preference shares
Ta Shee Golf & Country Club 6,000 6,000
$ 22,662 $ 22,662
Classified according to financial asset measurement categories
Available-for-sale financial assets $ 22,662 $ 22,662
Management believed that the above unlisted equity investments held by the Group, whose fair value
cannot be reliably measured due to the range of reasonable fair value estimates was so significant; therefore
they were measured at cost less impairment at the end of reporting period.
8. DEBT INVESTMENTS WITH NO ACTIVE MARKET
December 31
2016 2015
Current
Time deposits with original maturity more than 3 months $ 1,077,950 $ 916,883
Pledge deposits 28,336 36,280
$ 1,106,286 $ 953,163

- 25 -
Rate intervals (%) 0.3-2.75 0.05-4.25
9. NOTES RECEIVABLE, TRADE RECEIVABLES AND OTHER RECEIVABLES
December 31
2016 2015
Notes receivable
Operating $ 159,997 $ 231,474
Less: Factored notes receivable - (187)
$ 159,997 $ 231,287
Trade receivables
Operating $ 1,145,180 $ 1,095,348
Less: Factored trade receivable (48,824) (46,982) (48,824)
Less: Allowance for impairment loss (16,318) (16,848) (16,318)
$ 1,081,350 $ 1,030,206
The Company signed the agreements of factoring without recourse with financial institutions. For the
information about the transfer of financial instrument, please refer to Note 23.
The average credit period for sales of goods is 90 to 120 days, and no interest is charged on accounts
receivable. In determining the recoverability of a trade receivable, the Group considers any change in the
credit quality of the accounts receivable from the date when credit was initially granted up to the balance
sheet date. Allowances for doubtful amounts are based on estimated irrecoverable amounts determined by
referring to the counterparty’s past default experience of the counterparty’s current financial position. For
the trade receivables balances that were past due for more than 180 days, unless specific reasons disagree,
the Group will recognize an allowance for impairment loss amounted at 50%.
For the trade receivables balances that were past due at the end of the reporting period, the Group did not
recognize an allowance for impairment loss, because there was not a significant change in credit quality and
the amounts were still considered recoverable. The Group did not hold any collateral or other credit
enhancements for these balances.
The aging of receivables was as follows:
December 31
2016 2015
Less than 120 days $ 836,675 $ 900,142
121-180 days 107,935 15,972
Over 181 days 153,588 130,410
$ 1,098,198 $ 1,046,524
The above aging schedule was based on the past due date.

- 26 -
The aging of receivables that were past due but not impaired was as follows:
December 31
2016 2015
Less than 120 days $ 98,369 $ 87,167
121-180 days 4,767 8,334
Over 181 days 5,801 41,987
$ 108,937 $ 137,488
The above aging schedule was based on the past due date.
The movements of the allowance for doubtful trade receivables (including overdue receivables) were as
follows:
Individually
Assessed for
Impairment
Collectively
Assessed for
Impairment Total
Balance at January 1, 2015 $ 38,822 $ 11,629 $ 50,451
Less: Impairment losses reversed 7,173 11,231 18,404
Less: Amounts written off during the period as
uncollectible 5,343 (5,343) -
Less: Reclassification (1,315) (2,438) (3,753)
Foreign exchange translation gains and losses (56) 1,239 1,183
Balance at December 31, 2015 49,967 16,318 66,285
Add: Impairment losses (reversed) recognized
on receivables (16,347) 959 (15,388)
Less: Reclassification (5,130) - (5,130)
Less: Amounts written off during the period as
uncollectible (3,740) (75) (3,815)
Foreign exchange translation gains and losses (957) (354) (1,311)
Balance at December 31, 2016 $ 23,793 $ 16,848 $ 40,641
The Group recognized impairment loss on trade receivables amounting to $23,793 thousand and $49,967
thousand as of December 31, 2016 and 2015, respectively. The Group did not hold any collateral over
these balances.
The amount recognized impairment loss above has been reclassified as overdue receivables.
10. INVENTORIES
December 31
2016 2015
Merchandise $ 1,413,948 $ 1,605,195
The cost of inventories recognized as cost of goods sold for the years ended December 31, 2016 and 2015
was $2,977,590 thousand and $3,391,288 thousand, respectively.

- 27 -
The cost of inventories recognized as cost of goods sold for the years ended December 31, 2016 and 2015
included inventory write-downs of $59,822 thousand and reversal of inventory write-downs of $3,080
thousand, respectively. Previous write-downs were reversed as a result of write-off obsolete inventory and
floating prices in certain markets.
11. SUBSIDIARIES
a. Subsidiaries included in consolidated financial statements
% of Ownership
December 31
Investor Investee Main Business 2016 2015 Note
The Company Lumax International Ltd.
(Lumax BVI)
International trade, transit trade, warehousing, and
processing
100.00 100.00 -
The Company and
Lumax BVI
Zennor Ltd. (Zennor) International trade, transit trade, warehousing, and
processing
100.00 100.00 -
Lumax BVI Dalian Ftz Lumax International
Trade Co., Ltd. (Dalian
Lumax)
a) Import and export business
b) Dealership and agency service quotations and
tenders of products or services of companies in
the bonded area
c) Planning and application of computer software
programs
100.00 100.00 -
Wimax Hi-Tech (Shen Zhen)
Co., Ltd. (Wimax)
Producing new styles of insulating materials,
power supplies and computer connectors with
thermostat and bearing high pressure
100.00 100.00 -
Zmax Hi-Tech (Su Zhou) Co.,
Ltd. (Zmax)
To process H.F. level of thermostable insulating
materials, thermal transfer materials, tape
materials, LCD and etc. sale of products
produced by the Company, install and maintain
valves and calibration instruments.
100.00 100.00 -
Lumax International (Xiamen)
Co., Ltd. (Lumax Xiamen)
Producing new styles of insulating materials,
power supplies and computer connectors with
thermostat and bearing high pressure
100.00 100.00 -
Zennor Dalian Ftz Zennor International
Industry & Trade Co., Ltd.
(Dalian Zennor)
International trade, transit trade, processing,
merchandise show and consulting services
100.00 100.00 -
Zennor and Dalian
Lumax
Lumax International (Shanghai)
Co., Ltd. (Lumax Shanghai)
To manufacture and design computer system,
instruments, measuring appliance industry
automation instruments and sale of products
made by the Company
100.00 100.00 -
Dalian Zennor Dalian Chuangzhan Mechanical
and Electrical Equipment
Maintenance Services Limited
(Dalian Chuangzhan)
The installation of mechanical and electrical
equipment, on-site maintenance; sales, import
and export of goods, technology import and
export, instrument sales; assembly, repair and
instrument calibration of mechanical/electrical
products
100.00 100.00 -
b. Subsidiaries excluded from consolidated financial statements: None
12. PROPERTY, PLANT AND EQUIPMENT
Freehold Land Buildings
Machinery and
Equipment
Transportation
Equipment
Office
Equipment
Leasehold
Improvements
Other
Equipment Total
Cost
Balance at January 1, 2015 $ 383,087 $ 597,805 $ 69,448 $ 51,175 $ 59,367 $ 17,422 $ 28,440 $ 1,206,744
Additions - 4,358 1,621 4,037 1,669 - 5,943 17,628
Disposals - - (1,942 ) (1,637 ) (2,675 ) - (173 ) (6,427 )
Reclassified - - - - - 1,157 (1,106 ) 51
Effect of foreign currency exchange
differences - (1,801 ) (410 ) (360 ) (194 ) (341 ) (453 ) (3,559 )
Balance at December 31, 2015 $ 383,087 $ 600,362 $ 68,717 $ 53,215 $ 58,167 $ 18,238 $ 32,651 $ 1,214,437
Accumulated depreciation
Balance at January 1, 2015 $ - $ 123,233 $ 50,059 $ 28,217 $ 48,750 $ 14,762 $ 20,943 $ 285,964
Disposals - - (1,942 ) (1,570 ) (2,674 ) - (173 ) (6,359 )
Depreciation expense - 12,799 4,653 6,616 2,800 1,508 3,216 31,592
Effect of foreign currency exchange
differences - (420 ) (200 ) (249 ) (168 ) (293 ) (319 ) (1,649 )
Balance at December 31, 2015 $ - $ 135,612 $ 52,570 $ 33,014 $ 48,708 $ 15,977 $ 23,667 $ 309,548
Carrying amount at December 31,
2015 $ 383,087 $ 464,750 $ 16,147 $ 20,201 $ 9,459 $ 2,261 $ 8,984 $ 904,889
(Continued)

- 28 -
Freehold Land Buildings
Machinery and
Equipment
Transportation
Equipment
Office
Equipment
Leasehold
Improvements
Other
Equipment Total
Cost
Balance at January 1, 2016 $ 383,087 $ 600,362 $ 68,717 $ 53,215 $ 58,167 $ 18,238 $ 32,651 $ 1,214,437
Additions - 63,055 6,497 3,275 1,248 181 1,934 76,190
Disposals - (150 ) (191 ) (3,100 ) (16,411 ) (5,908 ) (1,581 ) (27,341 )
Reclassification (20,850 ) (71,743 ) - - 623 - (623 ) (92,593 )
Prepayments for equipment - 79,587 2,033 - - - - 81,620
Effect of foreign currency exchange
differences - (7,018 ) (1,561 ) (1,325 ) (793 ) (1,124 ) (1,796 ) (13,617 )
Balance at December 31, 2016 $ 362,237 $ 664,093 $ 75,495 $ 52,065 $ 42,834 $ 11,387 $ 30.585 $ 1,238,696
Accumulated depreciation
Balance at January 1, 2016 $ - $ 135,612 $ 52,570 $ 33,014 $ 48,708 $ 15,977 $ 23,667 $ 309,548
Disposals - - (183 ) (2,958 ) (16,341 ) (5,514 ) (1,582 ) (26,578 )
Depreciation expense - 11,838 4,572 6,149 3,016 587 1,897 28,059
Reclassified - (29,732 ) - - 225 - (225 ) (29,732 )
Effect of foreign currency exchange
differences - (1,967 ) (847 ) (1,080 ) (666 ) (989 ) (1,386 ) (6,935 )
Balance at December 31, 2016 $ - $ 115,751 $ 56,112 $ 35,125 $ 34,942 $ 10,061 $ 22,371 $ 274,362
Carrying amount at December 31,
2016 $ 362,237 $ 548,342 $ 19,383 $ 16,940 $ 7,892 $ 1,326 $ 8,214 $ 964,334
(Concluded)
Because the equipment for the construction of Taoyuan Industrial Park had passed the examination in 2016,
the prepayment of thereof was reclassified as property, plant and equipment, which amounted to $79,587
thousand.
The above items of property, plant and equipment are depreciated on a straight-line basis over the estimated
useful life as follows:
Building
Main buildings 55 years
Building improvements 5-10 years
Machinery and equipment 5 years
Transportation equipment 5 years
Office equipment 5 years
Leasehold improvements 10 years
Other equipment 5 years
Refer to Note 25 for the carrying amount of property, plant and equipment pledged by the Group to secure
borrowings granted to the Group.
13. INVESTMENT PROPERTY
December 31
2016 2015
Completed investment property $ 118,406 $ 57,666
On July 1, 2016, the Group leased out the land and building worth $62,861 thousand on Nangang Road to
earn rental income and hence reclassified such from property, plant and equipment to investment property.
The investment property held by the Group were depreciated over their estimated useful lives using the
straight-line method as follows:
Main buildings 55 years
Building improvements 5-10 years

- 29 -
The fair value of the Group’s investment property for the years ended December 31, 2016 and 2015 was
$527,791 thousand and $248,035 thousand, respectively. The fair value evaluated was without
independent evaluators. The valuation was arrived at by reference to the market evidence of transaction
prices for similar properties.
All of the Group’s investment property was held under freehold interests. The carrying amount of
investment property pledged by the Group to secure borrowings/general banking facilities granted to the
Group, were reflected in Note 25.
14. BORROWINGS
December 31
2016 2015
Secured borrowings $ 150,595 $ 170,432
Less: Current portion (19,995) (19,581)
$ 130,600 $ 150,851
Interest rate (%) 1.66 1.84
Due date 2024.1.17 2024.1.17
The Group provided parts of property, plant and equipment as collaterals for borrowings and guarantees.
Please refer to Note 25.
15. NOTES PAYABLE AND TRADE PAYABLES
December 31
2016 2015
Notes payable
Operating $ 24,393 $ 16,355
Non-operating 5,035 3,540
$ 29,328 $ 19,895
Trade payables
Operating $ 361,244 $ 393,189
The Group has financial risk management policies in place to ensure that all payables are paid within the
pre-agreed credit terms.

- 30 -
16. OTHER LIABILITIES
December 31
2016 2015
Current
Other payables
Salaries and bonus $ 106,402 $ 80,303
Employee compensation and remuneration to directors and
supervisors 57,666 56,351
Others 48,863 51,329
$ 212,931 $ 187,983
17. RETIREMENT BENEFIT PLANS
a. Defined contribution plans
The Company of the Group adopted a pension plan under the Labor Pension Act (the LPA), which is a
state-managed defined contribution plan. Under the LPA, an entity makes monthly contributions to
employees’ individual pension accounts at 6% of monthly salaries and wages.
The employees of the Group’s subsidiaries in the People’s Republic of China are members of a
state-managed retirement benefit plan operated by the government of People’s Republic of China. The
subsidiaries are required to contribute a specified percentage of payroll costs to the retirement benefit
scheme to fund the benefits. The only obligation of the Group with respect to the retirement benefit
plan is to make the specified contributions.
b. Defined benefit plans
The defined benefit plan adopted by the Company of the Group in accordance with the Labor Standards
Law is operated by the government. Pension benefits are calculated on the basis of the length of
service and average monthly salaries of the six months before retirement. The Company contributes
amounts equal to 2% of total monthly salaries and wages to a pension fund administered by the pension
fund monitoring committee. Pension contributions are deposited in the Bank of Taiwan in the
committee’s name. Before the end of each year, the Group assesses the balance in the pension fund.
If the amount of the balance in the pension fund is inadequate to pay retirement benefits for employees
who conform to retirement requirements in the next year, the Group is required to fund the difference in
one appropriation that should be made before the end of March of the next year. The pension fund is
managed by the Bureau of Labor Funds, Ministry of Labor (the Bureau); the Group has no right to
influence the investment policy and strategy.
The amounts included in the consolidated balance sheets in respect of the Group’s defined benefit plans
were as follows:
December 31
2016 2015
Present value of defined benefit obligation $ 247,471 $ 232,987
Fair value of plan assets (121,200) (111,771)
Deficit 126,271 121,216
Asset ceiling - -
Net defined benefit liability $ 126,271 $ 121,216

- 31 -
Movements in net defined benefit liability (asset) were as follows:
Present Value
of the Defined
Benefit
Obligation
Fair Value of
the Plan Assets
Net Defined
Benefit
Liability (Asset)
Balance at January 1, 2015 $ 223,817 $ (101,791) $ 122,026
Service cost
Current service cost 1,500 - 1,500
Net interest expense (income) 3,917 (1,901) 2,016
Recognized in profit or loss 5,417 (1,901) 3,516
Remeasurement
Return on plan assets (excluding amounts
included in net interest) - (785) (785)
Actuarial loss - changes in demographic
assumptions 6,390 - 6,390
Actuarial loss - changes in financial
assumptions 5,314 - 5,314
Actuarial gain - experience adjustments (1,545) - (1,545)
Recognized in other comprehensive income 10,159 (785) 9,374
Contributions from the employer - (13,700) (13,700)
Benefits paid (6,406) 6,406 -
Balance at December 31, 2015 232,987 (111,771) 121,216
Service cost
Current service cost 1,414 - 1,414
Net interest expense (income) 3,495 (1,781) 1,714
Recognized in profit or loss 4,909 (1,781) 3,128
Remeasurement
Return on plan assets (excluding amounts
included in net interest) - 970 970
Actuarial loss - changes in demographic
assumptions 4,025 - 4,025
Actuarial loss - changes in financial
assumptions 8,368 - 8,368
Actuarial gain - experience adjustments 2,082 - 2,082
Recognized in other comprehensive income 14,475 970 15,445
Contributions from the employer - (13,518) (13,518)
Benefits paid (4,899) 4,899 -
Balance at December 31, 2016 $ 247,472 $ (121,201) $ 126,271
Through the defined benefit plans under the Labor Standards Law, the Group is exposed to the
following risks:
1) Investment risk: The plan assets are invested in domestic/and foreign/equity and debt securities,
bank deposits, etc. The investment is conducted at the discretion of the Bureau or under the
mandated management. However, in accordance with relevant regulations, the return generated by
plan assets should not be below the interest rate for a 2-year time deposit with local banks.
2) Interest risk: A decrease in the interest rate will increase the present value of the defined benefit
obligation; however, this will be partially offset by an increase in the return on the plan’s debt
investments.

- 32 -
3) Salary risk: The present value of the defined benefit obligation is calculated by reference to the
future salaries of plan participants. As such, an increase in the salary of the plan participants will
increase the present value of the defined benefit obligation.
The actuarial valuations of the present value of the defined benefit obligation were carried out by
qualified actuaries. The significant assumptions used for the purposes of the actuarial valuations were
as follows:
December 31
2016 2015
Discount rates(s) 1.13% 1.50%
Expected rates of salary increase 2.50% 2.50%
If possible reasonable change in each of the significant actuarial assumptions will occur and all other
assumptions will remain constant, the present value of the defined benefit obligation would increase
(decrease) as follows:
December 31
2016 2015
Discount rate(s)
0.25% increase $ (5,690) $ (5,474)
0.25% decrease $ 5,898 $ 5,676
Expected rate(s) of salary increase
0.25% increase $ 5,721 $ 5,524
0.25% decrease $ (5,549) $ (5,356)
The sensitivity analysis presented above may not be representative of the actual change in the present
value of the defined benefit obligation as it is unlikely that the change in assumptions would occur in
isolation of one another as some of the assumptions may be correlated.
December 31
2016 2015
The expected contributions to the plan for the next year $ 13,820 $ 13,880
The average duration of the defined benefit obligation 10.7 years 10.7 years
18. EQUITY
a. Common stock
December 31
2016 2015
Numbers of shares authorized (in thousands) 120,000 120,000
Shares authorized $ 1,200,000 $ 1,200,000
Number of shares issued and fully paid (in thousands) 118,711 118,711
Shares issued $ 1,187,109 $ 1,187,109
Fully paid ordinary shares, which have a par value of $10, carry one vote per share and carry a right to
dividends.

- 33 -
To adjust capital structure and improve return on equity, the board of directors on March 27, 2017,
resolved to propose in June 22, 2017, shareholders’ meeting the reduction of capital with cash
consisting 10% of the total capital; the reduction of such is expected to be $118,711 thousand, 11,871
thousand shares in total.
b. Capital surplus
The capital surplus arising from shares issued in excess of par may be distributed as cash dividends or
transferred to share capital (limited to a certain percentage of the Company’s capital surplus and once a
year).
c. Retained earnings and dividend policy
In accordance with the amendments to the Company Act in May 2015, the recipients of dividends and
bonuses are limited to shareholders and do not include employees. The shareholders held their regular
meeting on June 29, 2016 and, in that meeting, had resolved amendments to the Company’s Articles of
Incorporation (the Articles), particularly the amendment to the policy on dividend distribution and the
addition of the policy on distribution of employees’ compensation.
Under the dividend policy as set forth in the amended Articles, where the Company made profit in a
fiscal year, the profit shall be first utilized for paying taxes, offsetting losses of previous years, setting
aside as legal reserve 10% of the remaining profit, setting aside or reversing a special reserve in
accordance with the laws and regulations, and then any remaining profit together with any undistributed
retained earnings shall be used by the Company’s board of directors as the basis for proposing a
distribution plan, which should be resolved in the shareholders’ meeting for distribution of dividends
and bonus to shareholders. For the policies on distribution of employees’ compensation and
remuneration to directors and supervisors before and after amendment, please refer to Note 19
Employee benefits expense in (d).
The Group’s dividend policy was considered with the current and future development plans, squaring
up with investment environment, demanding of funds and competition both at home and abroad. Thus,
the Group adopts dividend distribution policy whereby only surplus profits of the Group shall be
distributed to shareholders.
In the distribution of earnings, the Company’s net income is the top priority consideration. Under the
balance dividend policy, prior years’ unappropriated earnings will be used when current net income is
not enough for distribution. The Company considers the operating scope and capital needs in dividend
distribution. However, the amount of cash dividends should not be less than 20% of the total
dividends to be distributed in a current year.
Appropriation of earnings to legal reserve shall be made until the legal reserve equals the Company’s
paid-in capital. Legal reserve may be used to offset deficit. If the Company has no deficit and the
legal reserve has exceeded 25% of the Company’s paid-in capital, the excess may be transferred to
capital or distributed in cash.
Under Order No. 1010012865 and Order No. 1010047490 issued by the FSC and the directive titled
“Questions and Answers for Special Reserves Appropriated Following Adoption of IFRSs”, the
Company should appropriate or reverse to a special reserve. Any special reserve appropriated may be
reversed to the extent that the net debit balance reverses and thereafter distributed.
Except for non-ROC resident shareholders, all shareholders receiving the dividends are allowed a tax
credit equal to their proportionate share of the income tax paid by the Company.

- 34 -
The appropriations of earnings for 2015 and 2014 have been approved in the shareholders’ meeting on
June 29, 2016 and June 17, 2015, respectively, were as follows:
Appropriation of Earnings
Dividends Per Share
(NT$)
For the Year Ended
December 31
For the Year Ended
December 31
2015 2014 2015 2014
Legal reserve $ 57,673 $ 63,420
Cash dividend 356,132 356,132 $ 3.0 $ 3.0
The appropriations of earnings for 2016 had been proposed by the Company’s board of directors on
March 24, 2017. The appropriations and dividends per share were as follows:
Appropriation
of Earnings
Dividends Per
Share (NT$)
Legal reserve $ 51,580
Cash dividends 237,422 $2.0
The appropriations of earnings for 2016 are subject to the resolution of the shareholders meeting to be
held on June 22, 2017.
19. NET PROFIT AND OTHER COMPREHENSIVE INCOME
Net profit for the year was as follows:
a. Other income
For the Year Ended December 31
2016 2015
Interest income $ 19,368 $ 19,446
Rental income 4,559 4,028
Reversal of doubtful accounts 15,388 -
Dividends income 800 -
Others 14,950 9,125
$ 55,059 $ 32,599
b. Other gains and losses
For the Year Ended December 31
2016 2015
Net foreign exchange gain (loss) $ 1,614 $ (7,322)
Loss on disposal of property, plant and equipment (42) (53)
Others (7,313) (3,950)
$ (5,741) $ (11,325)

- 35 -
c. Depreciation and amortization
For the Year Ended December 31
2016 2015
Property, plant and equipment $ 28,059 $ 31,592
Investment property 2,481 1,299
Intangible assets 3,026 3,161
$ 33,566 $ 36,052
An analysis of depreciation by function
Operating costs $ 756 $ 936
Operating expenses 29,784 31,955
$ 30,540 $ 32,891
An analysis of amortization by function
Operating expenses $ 3,026 $ 3,161
d. Employee benefits expense
1) Employees’ compensation and remuneration to directors and supervisors for 2016 and 2015
For the Year Ended December 31
2016 2015
Short-term benefits $ 528,672 $ 507,455
Post-employment benefits (see Note 18)
Defined contribution plans 13,231 13,101
Defined benefit plans 3,128 3,516
$ 545,031 $ 524,072
An analysis of employee benefits expense by function
Operating costs 47,897 52,200
Operating expenses 497,134 471,872
$ 545,031 $ 524,072
To be in compliance with the Company Act as amended in May 2016, the proposed amended
Articles of Incorporation of the Company stipulate to distribute employees’ compensation and
remuneration to directors and supervisors at the rates no less than 2% and no higher than 1%,
respectively, of net profit before income tax, employees’ compensation, and remuneration to
directors and supervisors. The employees’ compensation and remuneration to directors and
supervisors for the years ended December 31, 2016 and 2015 which have been approved by the
Company’s board of directors on March 24, 2017 and March 25, 2016, respectively, were as
follows:
Accrual rate
For the Year Ended December 31
2016 2015
Employees’ compensation 7.3% 6.5%
Remuneration to directors and supervisors 1.0% 0.7%

- 36 -
Amount
For the Year Ended December 31
2016 2015
Cash Share Cash Share
Employees’ compensation $ 50,860 $ - $ 50,000 $ -
Remuneration to directors
and supervisors 6,806 - 5,191 -
If there is a change in the amounts after the annual consolidated financial statements being
authorized for issue, the difference will be recorded as a change in the accounting estimate.
There was no difference between the actual amounts of employees’ compensation and remuneration
to directors and supervisors paid and the amounts recognized in the consolidated financial
statements for the year ended December 31, 2015.
Information on the employees’ compensation and remuneration to directors and supervisors
resolved by the Company’s board of directors in 2017 and 2016 is available at the Market
Observation Post System website of the Taiwan Stock Exchange.
2) Bonus to employees and remuneration to directors and supervisors for 2014
The bonus to employees and remuneration to directors and supervisors for 2014 which have been
approved in the shareholders’ meeting on June 17, 2015 were as follows:
For the Year Ended
December 31, 2014
Cash Share
Bonus of employees $ 58,285 $ -
Remuneration to directors and supervisors 5,708 -
There was no difference between the amounts of the bonus to employees and the remuneration to
directors and supervisors approved in the shareholders’ meeting on June 17, 2015 and the amounts
recognized in the consolidated financial statements for the year ended December 31, 2014.
Information on the bonus to employees and remuneration to directors and supervisors resolved by
the shareholders in their meeting in 2015 is available at the Market Observation Post System
website of the Taiwan Stock Exchange.
20. INCOME TAXES
a. Major components of tax expense (income) recognized in profit or loss
For the Year Ended December 31
2016 2015
Current tax
In respect of the current year $ 107,235 $ 115,855
Income tax on unappropriated earnings 15,514 19,850
Adjustments for prior years 2,090 466
Deferred tax
In respect of the current year (9,192) 24,819
Income tax expense recognized in profit or loss $ 115,647 $ 160,990

- 37 -
A reconciliation of accounting profit and income tax expenses is as follows:
For the Year Ended December 31
2016 2015
Profit before tax $ 631,449 $ 737,719
Income tax expense calculated at the statutory rate $ 98,177 $ 147,585
Tax-exempt income (136) (5,503)
Others 2 (1,408)
Income tax on unappropriated earnings 15,514 19,850
Adjustments for prior years’ tax 2,090 466
Income tax expense recognized in profit or loss $ 115,647 $ 160,990
The applicable tax rate used above is the corporate tax rate of 17% payable by the Group in ROC, while
the applicable tax rate used by subsidiaries in China is 25%.
As the status of 2017 appropriations of earnings is uncertain, the potential income tax consequences of
2016 unappropriated earnings are not reliably determinable.
b. Deferred tax assets and liabilities
The movements of deferred tax assets and deferred tax liabilities were as follows:
For the year ended December 31, 2016
Opening Balance
Recognized in
Profit or Loss
Recognized in
Other
Comprehensive
Income
Exchange
Differences Closing Balance
Deferred tax assets
Defined benefit obligation $ 14,876 $ (1,813 ) $ 2,625 $ - $ 15,688
Loss on inventories 6,749 7,531 - - 14,280
Allowance for impaired receivables 6,474 (2,743 ) - - 3,731 Others 649 837 - - 1,486
$ 28,748 3,812 $ 2,625 $ - $ 35,185
Deferred tax liabilities
Investment income recognized under
equity method $ 344,523 $ 9,394 $ - $ - $ 353,917
Others 15,268 (14,774 ) - (494 ) -
$ 359,791 $ (5,380 ) $ - $ (494 ) $ 353,917
For the year ended December 31, 2015
Opening Balance
Recognized in
Profit or Loss
Recognized in
Other
Comprehensive
Income
Exchange
Differences Closing Balance
Deferred tax assets
Defined benefit obligation $ 15,067 $ (1,785 ) $ 1,594 $ - $ 14,876 Loss on inventories 7,297 (548 ) - - 6,749
Allowance for impaired receivables 6,985 (511 ) - - 6,474
Others 3,340 (2,691 ) - - 649
$ 32,689 (5,535 ) $ 1,594 $ - $ 28,748
(Continued)
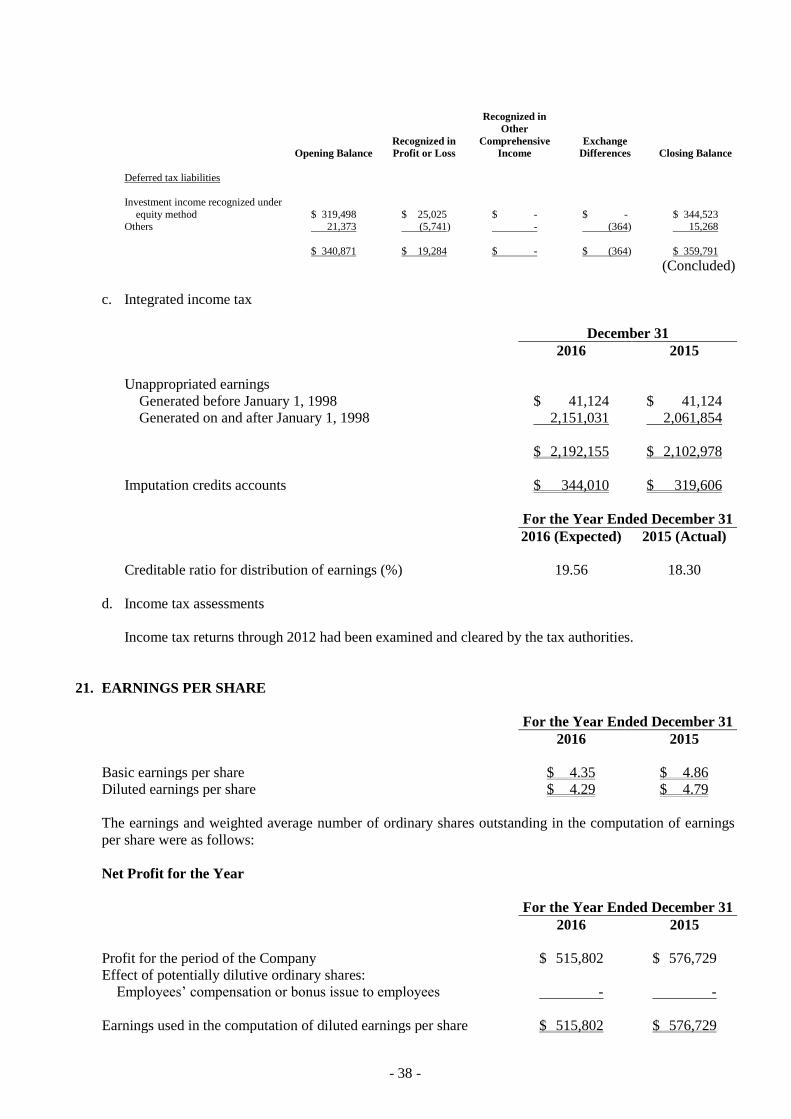
- 38 -
Opening Balance
Recognized in
Profit or Loss
Recognized in
Other
Comprehensive
Income
Exchange
Differences Closing Balance
Deferred tax liabilities
Investment income recognized under
equity method $ 319,498 $ 25,025 $ - $ - $ 344,523 Others 21,373 (5,741 ) - (364 ) 15,268
$ 340,871 $ 19,284 $ - $ (364 ) $ 359,791
(Concluded)
c. Integrated income tax
December 31
2016 2015
Unappropriated earnings
Generated before January 1, 1998 $ 41,124 $ 41,124
Generated on and after January 1, 1998 2,151,031 2,061,854
$ 2,192,155 $ 2,102,978
Imputation credits accounts $ 344,010 $ 319,606
For the Year Ended December 31
2016 (Expected) 2015 (Actual)
Creditable ratio for distribution of earnings (%) 19.56 18.30
d. Income tax assessments
Income tax returns through 2012 had been examined and cleared by the tax authorities.
21. EARNINGS PER SHARE
For the Year Ended December 31
2016 2015
Basic earnings per share $ 4.35 $ 4.86
Diluted earnings per share $ 4.29 $ 4.79
The earnings and weighted average number of ordinary shares outstanding in the computation of earnings
per share were as follows:
Net Profit for the Year
For the Year Ended December 31
2016 2015
Profit for the period of the Company $ 515,802 $ 576,729
Effect of potentially dilutive ordinary shares:
Employees’ compensation or bonus issue to employees - -
Earnings used in the computation of diluted earnings per share $ 515,802 $ 576,729

- 39 -
Weighted-average Number of Ordinary Shares Outstanding (In Thousand Shares)
For the Year Ended December 31
2016 2015
Weighted average number of ordinary shares in computation of basic
earnings per share
118,711 118,711
Effect of potentially dilutive ordinary shares:
Employees’ compensation or bonus issue to employees 1,482 1,673
Weighted average number of ordinary shares used in the
computation of diluted earnings per share
120,193 120,384
Since the Group offered to settle compensation or bonuses paid to employees in cash or shares, the Group
assumed the entire amount of the compensation or bonus would be settled in shares and the resulting
potential shares were included in the weighted average number of shares outstanding used in the
computation of diluted earnings per share, as the effect is dilutive. Such dilutive effect of the potential
shares is included in the computation of diluted earnings per share until the number of shares to be
distributed to employees is resolved in the following year.
22. CAPITAL MANAGEMENT
The Group manages its capital to ensure that entities in the Group will be able to continue as going
concerns while maximizing the return to shareholders through the optimization of the debt and equity
balance. The Group’s capital management aims to maintain the sufficiency of financial resources and the
soundness of operating strategies to meet the needs for operating capital, capital expenditure, R & D
expenses, debt handling, dividend disbursement, etc.
The capital structure of the Group consists of equity of the Group (comprising issued capital, reserves,
retained earnings and other equity).
The Group is not subject to any externally imposed capital requirements.
23. FINANCIAL INSTRUMENTS
a. Fair value of financial instruments that are not measured at fair value
Management believes the carrying amounts of financial assets and financial liabilities recognized in the
consolidated financial statements approximate their fair values.
b. Categories of financial instruments
December 31
2016 2015
Financial assets
Loans and receivables (1) $ 3,811,809 $ 3,868,448
Available-for-sale financial assets (2) 22,662 22,662
Financial liabilities
Amortized cost (3) 755,990 773,156

- 40 -
1) The balances included loans and receivables measured at amortized cost, which comprise cash and
cash equivalents, debt investments with no active market, notes receivable, trade and other
receivables and refundable deposits.
2) The balances included the carrying amount of available-for-sale financial assets measured at cost.
3) The balances included financial liabilities measured at amortized cost, which comprise short-term
and long-term loans, notes payable, trade and other payables, and guarantee deposits.
c. Financial risk management objectives and policies
The Group’s major financial instruments include cash and cash equivalents, debt investment with no
active market, notes receivable, trade receivables, short-term and long-term borrowings, notes payable,
trade payables and other payables. The Group’s financial risk management pertains to financial risks
relating to the operations of the Group, including currency risk, interest rate risk, credit risk and
liquidity risk. The Group seeks to identify, evaluate and hedge against market uncertainties to lower
the effect of market changes on the Group’s financial performance.
1) Market risk
The Group’s activities expose it primarily to the financial risks of changes in exchange rates (see
Item (a) below) and interest rates (see Item (b) below).
There had been no change to the Group’s exposure to market risks or the manner in which these
risks are managed and measured.
Details of sensitivity analysis for foreign currency risk and for interest rate risk are set out in (a) and
(b) below:
a) Foreign currency risk
The Company and its subsidiaries had foreign currency sales and purchases, which exposed the
Group to foreign currency risk. The proportion of foreign currency assets and liabilities to
total assets and liabilities is not significant, the Group does not plan to use derivative financial
instruments to hedge the exchange rate risk.
The carrying amounts of the Group’s foreign currency denominated monetary assets and
monetary liabilities (including those eliminated on consolidation) are set out in Note 27.
Sensitivity analysis
The Group was mainly exposed to USD, HKD, RMB, and EUR.
The Group’s sensitivity to a 5% increase and decrease in New Taiwan dollars (the functional
currency) against the relevant foreign currencies is the sensitivity rate used when reporting
foreign currency risk internally to key management personnel and represents management’s
assessment of the reasonably possible change in foreign exchange rates.
The sensitivity analysis included only outstanding foreign currency denominated monetary
items, and adjusts their translation at the end of the reporting period for a 5% change in foreign
currency rates.

- 41 -
A positive number below indicates an increase in pre-tax profit associated with New Taiwan
dollars strengthen 5% against the relevant currency. For a 5% weakening of New Taiwan
dollars against the relevant currency, pre-tax profits would have decreased/increased by $13,788
thousand and $7,155 thousand for the years ended December 31, 2016 and 2015, respectively.
b) Interest rate risk
The Group was exposed to interest rate risk because entities in the Group borrow funds at
floating interest rates. Hedging activities are evaluated regularly to align with interest rate
views and defined risk appetite, ensuring the most cost-effective hedging strategies are applied.
The carrying amounts of the financial assets and liabilities exposed to interest rates were as
follows:
December 31
2016 2015
Fair value interest rate risk
Financial assets $ 1,236,338 $ 1,752,338
Cash flow interest rate risk
Financial assets 1,202,626 731,722
Financial liabilities 150,595 170,432
Sensitivity analysis
The sensitivity analyses below have been determined on the basis of the exposure to interest
rates for nonderivative instruments at balance sheet dates. For floating rate liabilities, the
analysis is prepared assuming the amount of the liability outstanding at the balance sheet dates
outstanding for the entire period. A 50 basis point increase or decrease is used when reporting
interest rate risk internally to key management personnel and represents management’s
assessment of the reasonably possible change in interest rates.
If interest rates had been 50 basis points higher/lower and all other variables were held constant,
the Group’s pre-tax profit for the years ended December 31, 2016 and 2015 would
increase/decrease by $5,260 thousand and $2,806 thousand, respectively, which was mainly
attributable to the Group’s exposure to interest rates on its variable rate deposits and bank loans.
2) Credit risk
Credit risk refers to the risk that counterparty will default on its contractual obligations resulting in
financial loss to the Group. As at the end of the reporting period, the Group’s maximum exposure
to credit risk which will cause a financial loss to the Group due to failure of counterparties to
discharge an obligation and financial guarantees provided by the Group could arise from the
carrying amount of the respective recognized financial assets as stated in the balance sheets.
The Group adopted a policy of only dealing with creditworthy counterparties and obtaining
sufficient collateral, where appropriate, as a means of mitigating the risk of financial loss from
defaults. The Group only transacts with entities that are rated the equivalent of investment grade
and above. This information is supplied by independent rating agencies where available and, if not
available, the Group uses other publicly available financial information and its own trading records
to rate its major customers. The Group’s exposure and the credit ratings of its counterparties are
continuously monitored and the aggregate value of transactions concluded is spread amongst
approved counterparties. Credit exposure is controlled by counterparty limits that are reviewed
and approved by the risk management committee annually.

- 42 -
The Group did transactions with a large number of unrelated customers and, thus, no concentration
of credit risk was observed.
3) Liquidity risk
The Group manages liquidity risk by monitoring and maintaining a level of cash and cash
equivalents deemed adequate to finance the Group’s operations and mitigate the effects of
fluctuations in cash flows. In addition, management monitors the utilization of bank borrowings
and ensures compliance with loan covenants.
The Group relies on bank borrowings as a significant source of liquidity. As of December 31,
2016 and 2015, the Group’s unused bank credit lines in bank were $1,140,202 thousand and
$1,159,204 thousand, respectively.
Liquidity and interest risk tables
The following table details the Group’s remaining contractual maturity for its non-derivative
financial liabilities with agreed repayment periods. The tables had been drawn up based on the
undiscounted cash flows of financial liabilities from the earliest date on which the Group can be
required to pay. The tables included both interest and principal cash flows. Specifically, bank
loans with a repayment on demand clause were included in the earliest time band regardless of the
probability of the banks choosing to exercise their rights. The maturity dates for other
non-derivative financial liabilities were based on the agreed repayment dates.
To the extent that interest flows are floating rate, the undiscounted amount was derived from the
interest rate curve at the end of the reporting period.
December 31, 2016
Weighted
Average
Effective
Interest Rate
(%)
Within
1 Year
Over 1 Year to
5 Years
More Than
5 Years
Nonderivative financial
liabilities
Notes payable - $ 29,328 $ - $ -
Trade payables - 361,244 - -
Other payables - 212,931 - -
Variable interest rate
liabilities 1.66 22,341 90,918 47,015
$ 625,844 $ 90,918 $ 47,015

- 43 -
December 31, 2015
Weighted
Average
Effective
Interest Rate
(%)
Within
1 Year
Over 1 Year to
5 Years
More Than
5 Years
Nonderivative financial
liabilities
Notes payable - $ 19,895 $ - $ -
Trade payables - 393,189 - -
Other payables - 187,983 - -
Variable interest rate
liabilities 2.09 22,960 114,803 47,837
$ 624,027 $ 114,803 $ 47,837
The amounts included above for variable interest rate instruments for both non-derivative financial
assets and liabilities was subject to change if changes in variable interest rates differ from those
estimates of interest rates determined at the end of the reporting period.
Taking into account the Group’s financial position, management does not believe that it is probable
that the banks will exercise their discretionary rights to demand immediate repayment.
Nevertheless, management believes the operating funds of the Group and subsidiaries are sufficient
to meet the cash flow demand; thus, liquidity risk is not considered significant and the Group does
not make use of its overdraft limit.
4) Transfers of financial assets
Factored trade receivables for the years ended December 31, 2016 and 2015 were as follows:
Counterparties
Receivables
Sold
Amounts
Collected
Advances
Received at
Year-end
Interest
Rates on
Advances
Received (%) Credit Line
2016
First Commercial
Bank
$ 42,843 $ 64,840 $ - - $ 16,286
SinoPac Bank 88,083 74,566 - - 43,860
TC Bank 23,937 21,569 - - 20,000
$ 154,863 $ 160,975 $ - $ 80,146
2015
First Commercial
Bank
$ 76,130 $ 75,538 $ - - $ 58,100
SinoPac Bank 57,029 63,614 - - 19,695
TC Bank 28,871 37,134 - - 20,000
Skin Kong Bank 27,840 37,789 - - -
$ 189,870 $ 214,075 $ - $ 97,795

- 44 -
The above credit lines may be used on a revolving basis. The above sales amounts were
reclassified to other receivables.
24. TRANSACTIONS WITH RELATED PARTIES
Balances and transactions between the Company and its subsidiaries, which are related parties of the
Company, have been eliminated on consolidation and are not disclosed in this note. Besides information
disclosed elsewhere in the other notes, details of transactions between the Group and other related parties
are disclosed below.
a. Rental revenue
For the Year Ended December 31
Related Party Categories 2016 2015
Key management personnel $ 24 $ -
b. Compensation of key management personnel:
For the Year Ended December 31
2016 2015
Short-term employee benefits $ 72,623 $ 67,187
Post-employment benefits 4,606 4,190
Other long-term employee benefits 1,801 1,027
$ 79,030 $ 72,404
The remuneration of directors and key executives is determined by the remuneration committee on the
basis of the performance of individuals and market trends.
25. ASSETS PLEDGED
The following assets were provided as collateral for bank borrowings, the tariff of imported raw materials
guarantees:
December 31
2016 2015
Property, plant and equipment $ 358,867 $ 426,001
Investment property 118,046 57,666
Pledge deposits (classified as debt investments with no active market
- current) 28,336 36,280
Restricted deposits (classified as other receivables) 12,536 52,114
$ 517,785 $ 572,061

- 45 -
27. SIGNIFICANT COMMITMENTS AND CONTINGENCIES
In addition to those disclosed in other notes, significant commitments and contingencies of the Group as of
December 31, 2016 and 2015 were as follows:
a. As of December 31, 2016 and 2015, the Group issued refundable guarantee bills, and guarantee letters
of credit in the amounts of $1,276,455 thousand and $1,212,226 thousand, respectively, as guarantees
for performance of purchases or sales.
b. The Company should compensate Megmeet US$238 thousand for the loss from defective quality of
goods. The Company asked the original equipment manufacturer to compensate for the loss from
defective quality of goods. Based on negotiations up to December 31, 2016, the company had
obtained the compensation which was amounted US$88 thousand. Rest of the US$150 thousand are
waited to receive.
28. SIGNIFICANT ASSETS AND LIABILITIES DENOMINATED IN FOREIGN CURRENCIES
The following information was aggregated by the foreign currencies other than functional currencies of the
group entities and the exchange rates between foreign currencies and respective functional currencies were
disclosed. The significant assets and liabilities denominated in foreign currencies were as follows:
December 31, 2016
Foreign
Currencies Exchange Rate
Carrying
Amount
Financial assets
Monetary items
USD $ 13,400 32.25 (USD:NTD) $ 432,145
USD 1,536 6.99 (USD:RMB) 49,535
HKD 6,328 4.16 (HKD:NTD) 26,312
HKD 2,215 0.13 (HKD:USD) 9,212
EUR 141 1.05 (HKD:USD) 4,764
RMB 430 4.62 (RMB:NTD) 1,987
$ 523,955
Financial liabilities
Monetary items
USD 6,759 32.25 (USD:NTD) $ 217,981
USD 800 6.99 (USD:RMB) 25,805
EUR 130 33.90 (EUR:RMB) 4,419
$ 248,205

- 46 -
December 31, 2015
Foreign
Currencies Exchange Rate
Carrying
Amount
Financial assets
Monetary items
USD $ 11,587 32.83 (USD:NTD) $ 380,347
USD 1,981 6.57 (USD:RMB) 65,014
HKD 6,734 4.24 (HKD:NTD) 28,518
HKD 1,518 0.13 (HKD:USD) 6,428
RMB 293 5.00 (RMB:NTD) 1,463
$ 481,770
Financial liabilities
Monetary items
USD 7,998 32.83 (USD:NTD) $ 262,546
USD 2,319 6.57 (USD:RMB) 76,115
$ 338,661
(Concluded)
For the years ended December 31, 2016 and 2015, realized and unrealized net foreign exchange gains and
losses were $1,614 thousand and $7,322 thousand, respectively. Because of the wide variety of foreign
currencies involved in transactions as well as the functional currencies adopted by subsidiaries of the
Company, the foreign exchange gains or losses cannot be disclosed by their impacts to the consolidated
financial statements.
29. SEPARATELY DISCLOSED ITEMS
a. Information about significant transactions and investees:
1) Financing provided to others. (Table 1)
2) Endorsements/guarantees provided. (Table 2)
3) Marketable securities held (excluding investment in subsidiaries). (Table 3)
4) Marketable securities acquired and disposed at costs or prices at least NT$300,000 thousand or 20%
of the paid-in capital: None
5) Acquisition of individual real estate at costs of at least NT$300,000 thousand or 20% of the paid-in
capital: None
6) Disposal of individual real estate at prices of at least NT$300,000 thousand or 20% of the paid-in
capital: None
7) Total purchases from or sales to related parties amounting to at least NT$100,000 thousand or 20%
of the paid-in capital. (Table 4)
8) Receivables from related parties amounting to at least NT$100,000 thousand or 20% of the paid-in
capital: None

- 47 -
9) Trading in derivative instruments: None
10) Other: Intercompany relationships and significant intercompany transactions: (Table 7)
11) Information on investees. (Table 5)
b. Information on investments in mainland China
1) Information on any investee company in mainland China, showing the name, principal business
activities, paid-in capital, method of investment, inward and outward remittance of funds,
ownership percentage, net income of investees, investment income or loss, carrying amount of the
investment at the end of the period, repatriations of investment income, and limit on the amount of
investment in the mainland China area. (Table 6)
2) Any of the following significant transactions with investee companies in mainland China, either
directly or indirectly through a third party, and their prices, payment terms, and unrealized gains or
losses: (Table 6)
3) Endorsements, guarantees or collateral directly or indirectly provided to the investees: (Table 2)
4) Financings directly or indirectly provided to the investees: (Table 1)
5) Other transactions that significantly impacted current year’s profit or loss or financial position:
None
30. SEGMENT INFORMATION
Information reported to the chief operating decision maker for the purpose of resource allocation and
assessment of segment performance focuses on the types of goods or services delivered or provided.
Specifically, the Group’s reportable segments under IFRS 8 “Operating Segments” were as follows:
Process control instrument - department A
Process control system - department B
Telecommunication and linear transmission - department C
Electronics component - department D
Other process control - department CN
a. Segment revenues and results
Segment Revenue Segment Income Before Tax
For the Year Ended
December 31 For the Year Ended
December 31
2016 2015 2016 2015
Department A $ 2,096,087 $ 1,831,602 $ 542,573 $ 487,600
Department B 844,409 766,539 246,003 215,914
Department C 542,155 711,035 16,884 38,176
Department D 782,730 734,727 44,920 43,755
Department CN 810,787 1,605,572 30,361 225,822
Adjustments and eliminations (258,738) (318,940) - -
Total operating segment $ 4,817,430 $ 5,330,535 880,741 1,011,267
(Continued)

- 48 -
Segment Revenue Segment Income Before Tax
For the Year Ended
December 31 For the Year Ended
December 31
2016 2015 2016 2015
Management cost and
remuneration to directors and
supervisors $ (295,757) $ (289,970)
None-operating income and
expenses 46,465 16,422
Income before tax $ 631,449 $ 737,719
(Concluded)
The above revenues were generated through transactions with external customers. The inter-segment
revenue for the years ended December 31, 2016 and 2015 had been adjusted and eliminated from the
consolidated financial statements.
Segment operating income refers to profits earned by each segment, excluding interest income, foreign
exchange gain, finance cost and miscellaneous income (losses). This is the measure reported to the
Group’s chief operating decision maker to allocate resources to each segment and evaluate its
performance.
b. Segment assets
The Group’s measure of assets is not provided to the chief operating decision maker; thus, measure of
assets is disclosed zero.
c. Revenue from major products and services
The following is an analysis of the Group’s revenue from continuing operations from its major products
and services.
For the Year Ended December 31
2016 2015
Process control $ 3,562,323 $ 3,953,324
Electronics 1,255,107 1,377,211
$ 4,817,430 $ 5,330,535
d. Geographical information
The Group operates in two principal geographical areas - Taiwan and China.

- 49 -
The Group’s revenue from continuing operations from external customers by location of operations and
information about its non-current assets by location of assets are detailed below.
Revenue from External
Customers Non-current Assets
For the Year Ended December 31 December 31
2016 2015 2016 2015
Taiwan $ 3,514,342 $ 3,126,778 $ 1,053,549 $ 986,739
China 1,021,212 1,697,057 97,085 110,543
Others 281,876 506,700 9,356 12,348
$ 4,817,430 $ 5,330,535 $ 1,159,990 $ 1,109,630
Non-current assets exclude financial instruments and deferred tax assets.

- 50 -
TABLE 1
LUMAX INTERNATIONAL CORP., LTD AND SUBSIDIARIES
FINANCING PROVIDED TO OTHERS
FOR THE YEAR ENDED DECEMBER 31, 2016
(In Thousand New Taiwan Dollars)
No. Financing Company Name
Financial
Statement
Account
Counterparty
Maximum
Balance for the
Period
Ending
Balance Balance Used Interest Rate
Financing
Provided
(Note 2)
Transaction
Amount
Reasons for
Short-term
Financing
Allowance for
Bad Debt
Collateral Financing
Limit for Each
Borrowing
Company
(Note 1)
Financing
Company’s
Financing
Amount Limits
(Note 2)
Item Value
1 Lumax BVI Other receivable Zennor $ 83,625 $ 80,625 $ 80,625 - b $ - Working capital $ - - $ - $ 2,239,118 $ 2,239,118
2 Dalian Lumax Other receivable Lumax Shanghai 8,153 - - - b - Working capital - - - 548,869 548,869
3 Lumax Xiamen Other receivable Wimax 4,995 4,617 - - b - Working capital - - - 31,363 31,363
Note 1: The financing amounts should not exceed 100% of Lumax BVI ($2,239,118 × 100% = $2,239,118), Dalian Lumax ($548,869 × 100% = $548,869), and Lumax Xiamen’s ($31,363 × 100% = $31,363) net asset value.
Note 2: Explanations of financing provided are as follows:
a. For transaction.
b. For short-term financing.

- 51 -
TABLE 2
LUMAX INTERNATIONAL CORP., LTD. AND SUBSIDIARIES
ENDORSEMENT/GUARANTEE PROVIDED
FOR THE YEAR ENDED DECEMBER 31, 2016
(In Thousand New Taiwan Dollars)
No. Endorser/Guarantor
Endorsee/Guarantee
Limits on
Endorsement/
Guarantee Given
on Behalf of
Each Party
Maximum
Amount
Endorsed/
Guaranteed
During the
Period
Outstanding
Endorsement/
Guarantee at the
End of the Period
Actual
Borrowing
Amount
Amount
Endorsed/
Guaranteed by
Collaterals
Ratio of
Accumulated
Endorsement/
Guarantee to Net
Equity in Latest
Financial
Statements
(%)
Aggregate
Endorsement/
Guarantee Limit
Endorsement/
Guarantee Given
by Parent on
Behalf of
Subsidiaries
Endorsement/
Guarantee Given
by Subsidiaries
on Behalf of
Parent
Endorsement/
Guarantee Given
on Behalf of
Companies in
Mainland China
Note Name Relationship
0 The Company Lumax BVI Subsidiary $ 1,277,835 $ 234,607 $ 209,831 $ 67,502 $ - 4.93 $ 4,259,449 Y - -
Zennor Ltd Subsidiary 1,277,835 94,441 94,441 8,708 - 2.22 4,259,449 Y - -
Zmax Grandson company 1,277,835 67,478 67,478 - - 1.58 4,259,449 Y - Y
Lumax Shanghai Grandson company 1,277,835 79,045 79,045 79,045 - 1.86 4,259,449 Y - Y
Dalian Lumax Grandson company 1,277,835 98,723 98,723 - - 2.32 4,259,449 Y - Y
1 Dalian Zennor The Company Parent company 30,453 10,168 - - - - 101,509 - Y -
2 Wimax The Company Parent company 32,384 16,777 - - - - 107,945 - Y -
Note 1: The financing amounts should not exceed 30% of the Company ($4,259,449 × 30% = $1,277,835), Dalian Zennor ($101,509 × 30% = $30,453) and Wimax ($107,945 × 30% = $32,384) net asset value.
Note 2: The financing amounts should not exceed 100% of the Company ($4,259,449 × 100% = $4,259,449), Dalian Zennor ($101,509 × 100% = $101,509) and Wimax ($107,945 × 100% =$107,945).

- 52 -
TABLE 3
LUMAX INTERNATIONAL CORP., LTD. AND SUBSIDIARIES
MARKETABLE SECURITIES HELD
AS OF DECEMBER 31, 2016
(In Thousand New Taiwan Dollars)
Holding Company Name Marketable Securities Type and Name Relationship with
the Company Financial Statement Account
December 31, 2016
Note Shares
(In Thousand
Shares)
Carrying Value Percentage of
Ownership
Market Value or
Net Asset Value
(Note 1)
The Company Stock
Prohubs International Corp. - Financial assets carried at cost - non-current 1,820 $ 6,662 6.74 $ 20,985 Note 2
MinGo Telecom Inc. - Financial assets carried at cost - non-current 80 - 1.65 - Note 3
Powertec Energy Corporation - Financial assets carried at cost - non-current 3,333 10,000 0.15 10,520 Note 2
Preferred stock
Ta Shee Golf & Country Club - Financial assets carried at cost - non-current - 6,000 - 10,500 -
Note 1: Book value is original acquisition cost less accumulated impairment.
Note 2: The equity investments which had no quoted price in an active market were stated at net asset value.
Note 3: Book value is original acquisition cost of $2,000 thousand less equal amount of accumulated impairment.
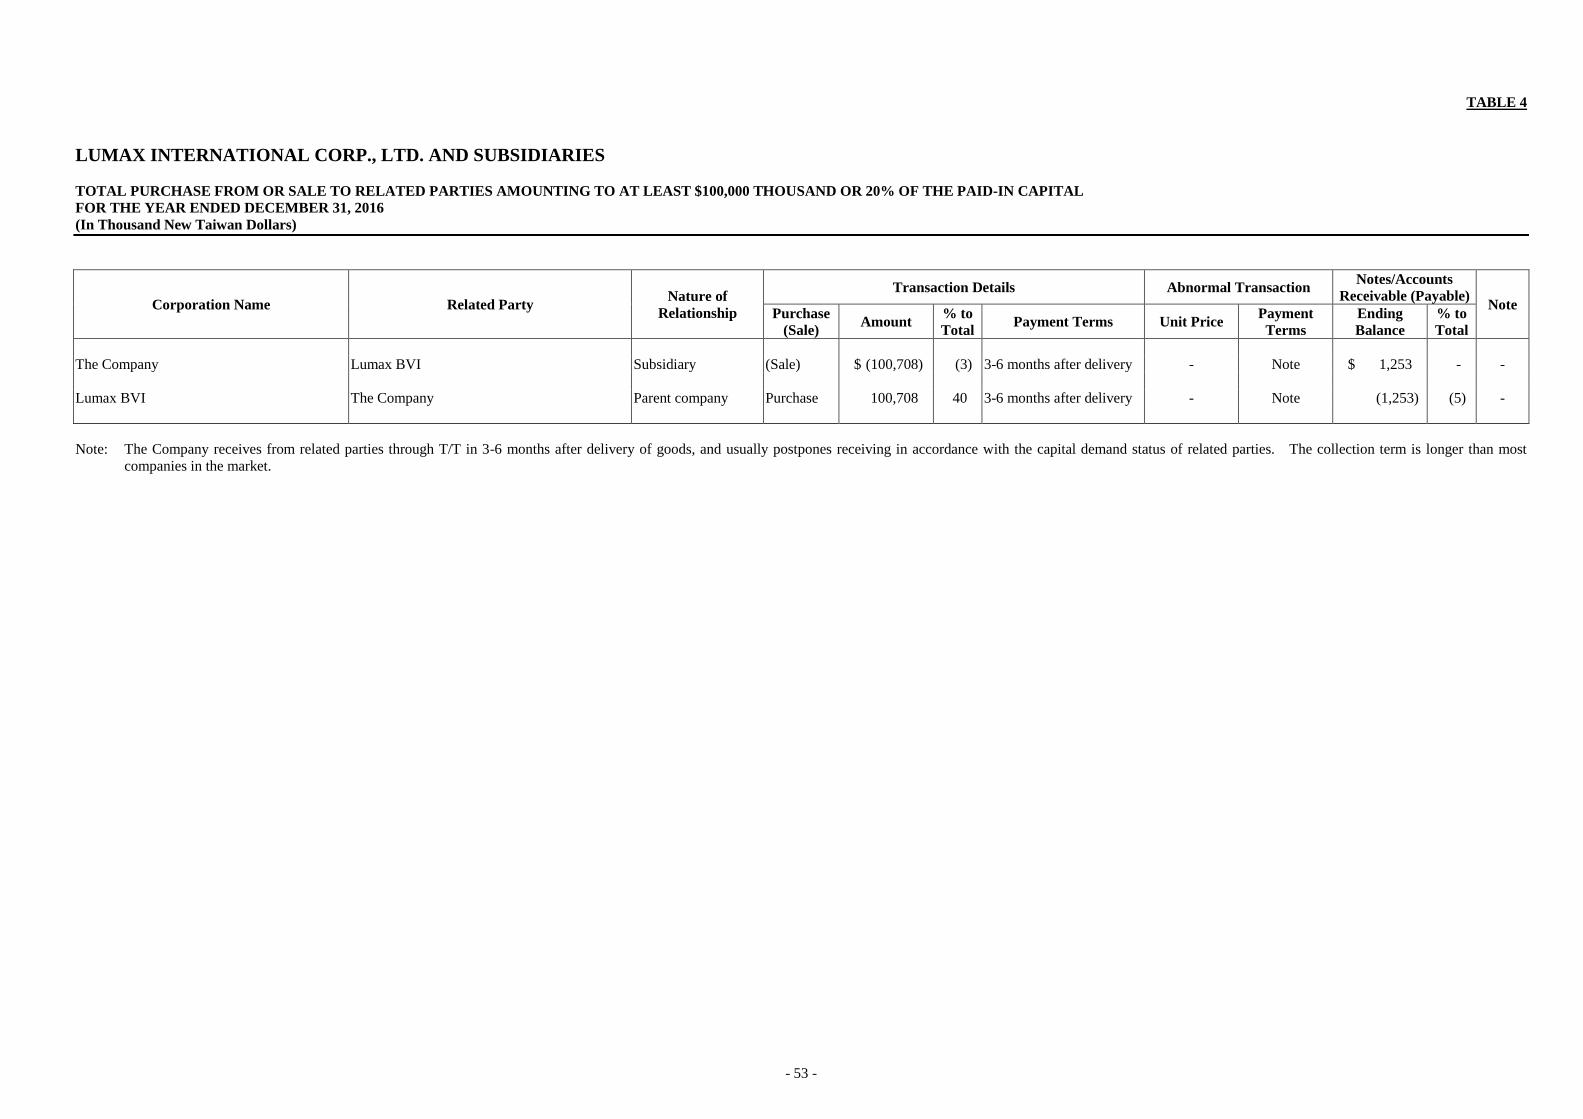
- 53 -
TABLE 4
LUMAX INTERNATIONAL CORP., LTD. AND SUBSIDIARIES
TOTAL PURCHASE FROM OR SALE TO RELATED PARTIES AMOUNTING TO AT LEAST $100,000 THOUSAND OR 20% OF THE PAID-IN CAPITAL
FOR THE YEAR ENDED DECEMBER 31, 2016
(In Thousand New Taiwan Dollars)
Corporation Name Related Party Nature of
Relationship
Transaction Details Abnormal Transaction Notes/Accounts
Receivable (Payable) Note
Purchase
(Sale) Amount
% to
Total Payment Terms Unit Price
Payment
Terms
Ending
Balance
% to
Total
The Company Lumax BVI Subsidiary (Sale) $ (100,708) (3) 3-6 months after delivery - Note $ 1,253 - -
Lumax BVI The Company Parent company Purchase 100,708 40 3-6 months after delivery - Note (1,253) (5) -
Note: The Company receives from related parties through T/T in 3-6 months after delivery of goods, and usually postpones receiving in accordance with the capital demand status of related parties. The collection term is longer than most
companies in the market.

- 54 -
TABLE 5
LUMAX INTERNATIONAL CORP., LTD. AND SUBSIDIARIES
INFORMATION ON INVESTEES
FOR THE YEAR ENDED DECEMBER 31, 2016
(In Thousand New Taiwan Dollars/in Thousand U.S. Dollars)
Investor Company Investee Company Location Main Businesses and Products
Original Investment Amount As of December 31, 2016 Net Income
(Loss) of the
Investee
Share of
Profits (Loss) Note December 31,
2016
December 31,
2015
Shares
(In Thousand
Shares)
% Carrying
Amount
The Company Lumax BVI British Virgin Islands International trade, transit trade,
warehousing, and processing
$ 128,148 $ 128,148 3,500 100.00 $ 2,235,200 $ 58,839 $ 58,839 -
Zennor Samoa International trade, transit trade,
warehousing, and processing
49,570 49,570 1,510 60.16 96,925 (5,958) (3,583) -
Lumax BVI Zennor Samoa International trade, transit trade,
warehousing, and processing
US$ 1,000 US$ 1,000 1,000 39.84 US$ 2,002 (US$ 186) (US$ 74) -
Note: Related information of investee company in China is referred to Table 6.

- 55 -
TABLE 6
LUMAX INTERNATIONAL CORP., LTD. AND SUBSIDIARIES
INFORMATION ON INVESTMENTS IN MAINLAND CHINA
FOR THE YEAR ENDED DECEMBER 31, 2016
(In Thousand New Taiwan Dollars/in Thousand U.S. Dollars/in Thousand Renminbi)
Investee Company Main Businesses and Products Paid-in Capital Method of
Investment
Accumulated
Outward
Remittance
Investment from
Taiwan as of
January 1, 2016
Remittance of Funds Accumulated
Outward
Remittance
Investment from
Taiwan as of
December 31,
2016
Net Income
(Loss) of the
Investee
% Ownership
of Direct or
Indirect
Investment
Investment
Gain (Loss)
(Note 2)
Carrying
Amount as of
December 31,
2016
Accumulated
Repatriation of
Investment
Income as of
December 31,
2016
Outward Inward
Dalian Lumax 1. Import and export business.
2. Dealership and agency service quotations and tenders of products
or services of companies in the bonded area.
3. Planning and applications of computer software programs.
$ 106,425
(US$ 3,300)
Note 1 $ 32,250
(US$ 1,000)
$ - $ - $ 32,250
(US$ 1,000)
RMB (7,454) 100 RMB (7,454) RMB 118,880 $ -
Wimax Producing new styles of insulating materials, power supplies and
computer connectors with thermostat and bearing the high
pressure.
25,800
(US$ 800)
Note 1 - - - - RMB (1,503) 100 RMB (1,503) RMB 23,380 -
Zmax To process H.F. level of thermostable insulating materials, thermal
transfer materials, tape materials, LCD and etc. sale of products
produced by the Company, install and maintain valves and
calibration instruments.
112,875
(US$ 3,500)
Note 1 80,625
(US$ 2,500)
- - 80,625
(US$ 2,500)
RMB (2,011) 100 RMB (2,011) RMB 36,306 -
Lumax Xiamen International trade, transit trade, warehousing, and processing. 32,250
(US$ 1,000)
Note 1 - - - - RMB (268) 100 RMB (268) RMB 6,793 -
Dalian Zennor International trade, transit trade, processing, merchandise show and
consulting services.
64,500
(US$ 2,000)
Note 1 32,250
(US$ 1,000)
- - 32,250
(US$ 1,000)
RMB (1,740) 100 RMB (1,740) RMB 21,986 -
Lumax Shanghai To manufacture and design computer system, instruments, measuring
appliance industry automation instruments and sale of products
made by the Company (with permission by management).
32,250
(US$ 1,000)
Note 1 16,448
(US$ 510)
- - 16,448
(US$ 510)
RMB 1,063 100 RMB 1,063 RMB 2,826 -
Note 1: The indirect investment made by Lumax BVI and Zennor
Note 2: The financial statements are audited by the certified public accountant of the parent company in Taiwan.
Accumulated Outward Remittance for Investment in Mainland China as of December 31, 2016 Investment Amounts Authorized by
Investment Commission, MOEA
Upper Limit on the Amount of
Investment Stipulated by Investment
Commission, MOEA
Dalian Lumax $ 32,250 (US$ 1,000) $ 117,713 (US$ 3,650)
Net asset value 60% $2,555,669
Wimax - - 32,250 (US$ 1,000)
Zmax 80,625 (US$ 2,500) 112,875 (US$ 3,500)
Dalian Zennor 32,250 (US$ 1,000) 64,500 (US$ 2,000)
Lumax Shanghai 16,448 (US$ 510) 16,448 (US$ 510)
Lumax Xiamen - - 32,250 (US$ 1,000)
(Continued)

- 56 -
Significant direct or indirect transactions with mainland China
Investee Company Relationship with the Company Purchase/Sale Amount Unit Price Payment
(Receivable) Terms
To Compare with
General Transaction Ending Balance % to Total
Unrealized Gain
(Loss)
Dalian Lumax Grandson company Sale $ 37,346 Note 1 Note 2 Note 1 Accounts receivable $ 3,992 - $ 3,933
Dalian Zennor Grandson company Sale 94,428 Note 1 Note 2 Note 1 Accounts receivable 37,022 3 536
Note 1: Sales prices are based on the Corporation’s purchasing costs plus reasonable profits.
Note 2: The Corporation collected receivables through T/T in 3-6 months after delivery of goods.
(Concluded)

- 57 -
TABLE 7
LUMAX INTERNATIONAL CORP., LTD. AND SUBSIDIARIES
BUSINESS RELATIONSHIPS AND SIGNIFICANT INTERCOMPANY TRANSACTIONS
FOR THE YEAR ENDED DECEMBER 31, 2016
(In Thousands of New Taiwan Dollars)
Number Company Name Counterparty
Transaction Details
Flow of
Transactions
(Note)
Account Amount Transaction Terms
Percentage to
Consolidated
Total
Operating
Revenues or
Total Assets
0 The Company Lumax BVI a Receipts in advance $ 55,954 Base on regular terms 1
a Operating revenue 100,708 Base on regular terms 2
a Purchasing 8,354 Base on regular terms -
Dalian Lumax a Trade receivables 3,992 Base on regular terms -
a Operating revenue 37,346 Base on regular terms 1
a Receipts in advance 3,836 Base on regular terms -
Dalian Zennor a Trade receivables 37,022 Base on regular terms 1
a Operating revenue 94,428 Base on regular terms 2
a Receipts in advance 3,975 Base on regular terms -
Lumax Shanghai a Trade receivables 8,673 Base on regular terms -
a Operating revenue 8,722 Base on regular terms -
1 Lumax BVI Zennor c Other receivables 80,625 Base on regular terms 1
Wimax c Other revenue 26,290 Base on regular terms 1
Dalian Lumax c Overdue receivable 6,652 Base on regular terms -
2 Wimax Zmax c Purchasing 4,840 Base on regular terms -
3 Dalian Lumax Dalian Chuangzhen c Purchasing 4,335 Base on regular terms -
Note: a. From parent to subsidiary.
b. From subsidiary to parent.
c. Between subsidiaries.


![SMC GLOBAL POWER HOLDINGS CORP. (Formerly … GLOBAL POWER HOLDINGS CORP. (Formerly Global 5000 Investment Inc.) [A Wholly-owned Subsidiary of San Miguel Corporation] AND SUBSIDIARIES](https://static.fdocuments.net/doc/165x107/5ac095ba7f8b9a4e7c8c0832/smc-global-power-holdings-corp-formerly-global-power-holdings-corp-formerly.jpg)
