Luleå University of Technology 2009
220
DOCTORAL THESIS Possibilities to use Industrial Oxidic By-products as Neutralising Agent in Bioleaching and the Effect of Chloride on Biooxidation Chandra Sekhar Gahan
Transcript of Luleå University of Technology 2009

DOCTORA L T H E S I S
Department of Chemical Engineering and GeosciencesDivision of Extractive Metallurgy
Possibilities to use Industrial Oxidic By-products as Neutralising Agent in Bioleaching and the Effect of
Chloride on Biooxidation
Chandra Sekhar Gahan
ISSN: 1402-1544 ISBN 978-91-7439-049-0
Luleå University of Technology 2009
Possibilities to use Industrial Oxidic B
y-products as Neutralising A
gent in B
ioleaching and the Effect of C
hloride on Biooxidation
ISSN: 1402-1544 ISBN 978-91-86233-XX-X Se i listan och fyll i siffror där kryssen är
Chandra Sekhar G
ahan

Possibilities to use Industrial Oxidic By-products as
Neutralising Agent in Bioleaching and the Effect of
Chloride on Biooxidation
Chandra Sekhar Gahan
Division of Extractive Metallurgy
Department of Chemical Engineering and Geosciences
Luleå University of Technology
December 2009

Printed by Universitetstryckeriet, Luleå 2009
ISSN: 1402-1544 ISBN 978-91-7439-049-0
Luleå 2009
www.ltu.se

3
ABSTRACT
The cost for neutralisation is the second largest cost in a bioleaching operation for which,
possibilities to replace generally used lime/limestone was tested. Industrial oxidic by-products
generated form Swedish industries were investigated for neutralising capacities by chemical
leaching with sulphuric acid at pH 1.5, which is the optimum pH for bioleaching operations. The
by-products used for the study comprised of five different steel slags from ore and scrap based steel
making, electric arc furnace (EAF) dust from scrap based steel plant, Mesalime from paper and pulp
industry and three different types of ashes from combustion for energy production. All the by-
products showed a good neutralising capacity, while some of them had higher capacities than the
reference Ca(OH)2. Due to the good neutralising potential of the by-products obtained from the
chemical leaching, attempts were made to use them as neutralising agent in batch bioleaching of
pyrite in stirred tank reactor to determine their neutralising potential, eventual toxic effects on the
microorganisms and pyrite oxidation. Pyrite oxidation in all the batch bioleaching was in the range
of 69-80%, except the Waste ash experiment which was 59%. Neutralising capacity was high for all
the by-products except Waste ash and Coal & Tyres ash compared to slaked lime. No remarkable
toxic effects due to the by-products were observed except in the Waste ash experiment, which was
probably due to the high content of chloride. To confirm if the chloride in the Waste ash caused any
toxic effect on the bioxidation activity, batch bioleaching studies were conducted with Ca(OH)2 +
NaCl as neutralizing agent with a similar chloride concentration profile obtained in the Waste ash
experiment. Effect of the chloride on the biooxidation of pyrite by sudden exposure of 2 g/L, 3 g/L,
and 4 g/L of chloride in the log phase of the biooxidation of pyrite was investigated. Addition of 2
g/L chloride resulted jarosite precipitation with a lower pyrite recovery than the reference
experiment, whereas the addition of 3 g/L chloride temporarily chocked the microorganisms but
activity was regained after a short period of adaptation. Population dynamics study conducted on
the experiment with 3 g/L chloride showed the variation in the microbial species at different stages
of the biooxidation of pyrite. The study with sudden exposure of 4 g/L of chloride was found to be
lethal to the microbes. Out of all the by-products used in batch bioleaching studies, Mesalime and
Electric Arc Furnace (EAF) dust were used as a neutralising agent in continuous biooxidation of
refractory gold concentrate. The neutralising capacity of EAF dust was lower, while the Mesalime
was similar to the Ca(OH)2 reference. The arsenopyrite oxidation in the experiments ranged from
85-90%, whereas the pyrite oxidation was 63-74%. In subsequent cyanidation 90% of the gold was
achieved in the bioresidues from Mesalime and Ca(OH)2, while 85% of gold was recovered in
bioresidue from EAF dust. A probable explanation for the low recovery of gold from the EAF dust
experiment could be due to the encapsulation of the part of the gold by high elemental sulphur

4
content present in the EAF dust. Cyanide consumption was relatively high and ranged from 8.1-9.2
kg/tonne feed after 24 hours of cyanidation. Both Mesalime and EAF dust proved to be feasible
options as neutralising agents in bioleaching operations. Studies on the modeling of ferrous iron
oxidation by a Leptospirillum ferriphilum-dominated culture was conducted with 9 g/L or 18 g/L
ferrous iron in a chemostat. Modeling data suggested that the kinetics and yield parameters changed
with the overall solution composition. The apparent Fe3+ inhibition on specific Fe2+ utilisation rate
was a direct consequence of the declining biomass yield on the Fe2+ oxidation, when dilution rate
was decreased. The maintenance activity contributed up to 90% of the maximum specific Fe2+
utilisation rate, which appears close to the critical dilution rate. Determination of the toxic limit of
chloride were studied both in batch and chemostat conditions. Batch studies showed a toxic limit at
12 g/L chloride, while chemostat studies showed a toxic limit of 4 g/L. Modeling of the ferrous iron
oxidation in chloride environment showed a decrease in maximum specific growth rate and increase
in the substrate constant. The biomass concentration decreased with the increase in chloride
concentration due to the toxic effect on the microorganisms. The maintenance coefficient decreased
by 70% in the chloride environment.

5
ACKNOWLEDGEMENT
First of all I would like to thank my supervisor Professor Åke Sandström for accepting me as a
doctoral student when I was struggling with my career. Thank you so much for being a strong
support to me both in academic world and outside academia too. I will always cherish your patience
to listen me, even if I spoke fast and your cool replies to all my queries without which, this four
years journey would have been a really difficult task. Thanks a lot for enriching my knowledge in
hydrometallurgical processes which made my research easier despite my microbiology background.
Thanks a lot for everything you have done for me.
I would like to thank my co-supervisor Jan-Eric Sundkvist from Boliden Mineral AB, for his
relentless effort in the co-supervision of my work and for having valuable discussions during the
whole course of research. I would like to praise the active effort shown by him during the final
stage of my thesis submission.
I could not have ever thought of pursuing my doctoral studies without my previous supervisor Mr.
L.B.Sukla, Scientist-G and head of the Biominerals Division, Institute of Minerals and Materials
Technology, Bhubaneswar, India. Thank you for all the efforts you made for me to come this long
way from India to Sweden. I would also like to thank you for introducing me into the field of
biomineral processing and biohydrometallurgy and for the continuous encouragement up to now.
I wish to express my gratitude to Prof. Bo Björkman. Thank you for always being kind towards me
in all occasions, whenever I needed your support and help. Special thanks to Birgitta for her timely
help in all my analytical works. My special thanks to Tech.Lic. Fredrik Engström for helping me
with XRD analysis and valuable discussions on the mineralogical studies. I would also like to
extend my special thanks to Dr. Ryan Robinson, for helping me out in the preparation of my thesis
especially in language correction. My special thanks to Tech.Lic. Ulrika Leimalm for motivating
me to learn dancing and taking care of plants, and of course valuable suggestions whenever I
required. Thanks to Maria Lundgren and Anita Wedholm for being very caring to me from the
beginning of my study here in this division. Thanks to Samuel Ayowole Awe and Fatai Ikumapayi
for their readiness to help me whenever I needed. I would like to thank to all my colleagues Prof.
Kota Hanumantha Rao, Prof. Jan Rosenkranz, Dr. Caisa Samuelsson, Late Dr. Margareta Lindström
Larsson, Dr. Bertil Pålsson, Dr. Qixing Yang, Dr. Ranjan Kumar Dwari, Dr. Charlotte Andersson,
Tech.Lic. Annamaria Vilinska, Tech.Lic. Pejman Oghazi, Tech.Lic. Daniel Adolfsson, Pär
Semberg, Sina Mostaghel, Andreas Lennartsson, Anders Rutqvist, Mats Andersson, Katarina
Lundkvist, Johanna Alatalo, and Ulf Nordström for their kind cooperation and help during my
study. I would like to thank Amang Saleh from Boliden Mineral AB for his help during
experimental work in Boliden. Special thanks to Maria Lucelinda Cunha from Portugal for her

6
support and valuable discussion in the research work. Thanks to Dr. Mark Dopson from Umeå
University, Umeå for all the valuable discussions and cooperation in the research work. I would
also like to thank Agnieszka Szyma ska, PhD student from Poland for making my days nice during
her stay both in research and extracurricular activities. Special thanks to Dr. Meryem Seferinoglu
from Turkey and Prof. Jan Paul from Department of Applied Physics and Mechanical Engineering,
LTU for their cooperation in some of this work. Thanks to Dr. Nourreddine Menad, BRGM France,
for his support during the initial days of my work. I wish to thank all my friends at the department
of Chemical Engineering and Geosciences. I would also like to thank all my friends in Luleå
especially to Mohammed Tahir Sidiqqui. Thanks to all the Indian friends and their family in Luleå
for their support during my study. Special thanks to Dr. Satya Panigrahi and Dr. Ruby Das for their
support and encouragement during my studies despite of being so far away down in south of
Sweden. I would also like to extend my heartfelt thanks to our previous administrator Erika
Bergman for her support during her stay in our division. I would also like to thank very much to our
present administrator Ulf Lindbäck for his cooperation, help and support whenever I needed.
Financial support from the EU-funded integrated project BioMinE, contract Nº 500329-1, is
gratefully acknowledged. I would also like to thank Carl Bennet AB, Kempe-stiftelsen and Boliden
Mineral AB for their financial support during the course of this work.
Apart from the academic world I would like thank Professor Åke Sandström’s family for their love
and affection, which made my life easier in Luleå and especially to Mrs. Ingrid Sandström for her
support and care for me from the day I arrived in Luleå to now.
I would also like to thank all my friends and teachers in Utkal University far away in India for their
continuous encouragement during my studies over here in Luleå. My heartfelt and special thanks to
Chinmay Nayak (chinu) and Susanta Sahoo for their all time support whenever I needed. I would
not forget Mrs. Manjubala Baral and Mr. Dambarudhara Nayak for their continuous support from
the beginning of my research. I would like to convey my heartiest thanks to my loving parents,
brothers and sister for their support and love during my stay in Luleå and finally my special thanks
to my loving mother without whom I am nothing in this world.
Chandra Sekhar Gahan
December 2009
Luleå, Sweden

7
PAPERS APPENDED IN THE THESIS
Paper I Leaching Behaviour of Industrial Oxidic By-products: Possibilities to Use as Neutralisation Agent in Bioleaching M. L. Cunha, C. S. Gahan, N. Menad, Å. Sandström Materials Science Forum, vol. 587-588, pp. 748-752, (2008) Paper II Comparative study on different steel slags as neutralising agent in bioleaching C. S. Gahan, M. L. Cunha, Å. Sandström
Hydrometallurgy, vol. 95(3-4), pp. 190-197, (2009)
Paper III Study on the Possibilities to use Ashes, EAF Dust and Lime Sludge as Neutralising Agent in Bioleaching C. S. Gahan, M. L. Cunha, Å. Sandström
The Open Mineral Processing Journal, vol. 1, pp. 26-36, (2008)
Paper IV A study on the toxic effects of chloride on the biooxidation efficiency of pyrite C. S. Gahan, J. E. Sundkvist, Åke Sandström
Journal of Hazardous Materials, vol. 172(2-3), pp. 1273-1281, (2009)
Paper V Use of mesalime and electric arc furnace (EAF) dust as a neutralising agent in biooxidation of refractory gold concentrate and their influence on the gold recovery by subsequent cyanidation C. S. Gahan, J. E. Sundkvist, Åke Sandström Submitted to Minerals Engineering,(2009)
Paper VI Modeling of Ferrous Iron Oxidation by Leptospirillum ferrooxidans-Dominated Chemostat Culture
J. E. Sundkvist, C. S. Gahan, Åke Sandström Biotechnology and Bioengineering, vol. 99(2), pp. 378-389, (2008)
Paper VII Effect of chloride on ferrous iron oxidation by a Leptospirillum ferriphilum- dominated chemostat culture C. S. Gahan, J. E. Sundkvist, Mark Dopson, Åke Sandström Submitted to Biotechnology and Bioengineering, (2009)
RELATED PAPERS NOT APPENDED IN THE THESIS Paper VIII Possibilities to use oxidic by-products for precipitation of Fe/As from leaching solutions for subsequent base metal recovery M. L. Cunha, C. S. Gahan, N. Menad, Å. Sandström
Minerals Engineering, vol. 21(1), pp. 38-47, (2008)
Paper IX Evaluation of the possibilities to use ladle slag and electric arc furnace (EAF) slag as neutralising agents in biooxidation of refractory gold concentrate and their influence on the gold recovery in subsequent cyanidation C.S. Gahan, J.E. Sundkvist, Å. Sandström Manuscript in preparation

8

9
CONTENT
1. INTRODUCTION……………………………………………………………………………..11
1.1. Background………………………………………………………………………………..11
1.2. Microorganisms in biomining……………………………………………………………..14
1.3. Bioleaching mechanisms…………………………………………………………………..16
1.4. General bioleaching process……………………………………………………………..…18
1.5. Cost of neutralising agents in bioleaching process…………………………………….......21
1.6. Alternative uses of industrial oxidic by-products…………………………………………..21
1.7. Chloride in bioleaching.........................................................................................................25
1.8. Modeling of ferrous iron oxidation………………………………………………………...27
2. AIM AND SCOPE OF THE PRESENT WORK ……….………………………………..…29
3. MATERIALS AND METHODS……………………………………………………………...31
3.1. Studies on the neutralising capacity of by-products………………………………………..31
3.2. Batch biooxidation of pyrite with by-products as neutralising agents……………………..32
3.3. Toxic effects of chlorides on the biooxidation efficiency of pyrite………………………..34
3.4. Continuous biooxidation of a refractory gold concentrate with Mesalime and EAF dust as
neutralising agents …………………………………………………………………………35
3.5. Modeling of ferrous iron oxidation…………………………………….…………………..37
3.6. Effect of chloride on the ferrous iron oxidation……………………………………………39
4. RESULTS AND DISCUSSION……………………………………………………………….41
4.1. Studies on the neutralising capacity of by-products………………………………………..41
4.2. Batch biooxidation of pyrite with by-products as neutralising agents……………………..42
4.3. Toxic effects of chlorides on the biooxidation efficiency of pyrite………………………. 49
4.4. Continuous biooxidation of a refractory gold concentrate with Mesalime and EAF dust as
neutralising agents …………………………………………………………………………56
4.5. Modeling of ferrous iron oxidation…………………………….…………………………..61
4.6. Effect of chloride on the ferrous iron oxidation……………………………………………63
5. CONCLUSION………………………………………………………………………………...67
FUTURE WORK…………………………………………………………………………………..69
REFERENCES…………………………………………………………………………………….71

10

11
1. INTRODUCTION
1.1. Background
Biomining is the extraction of metal values from sulphidic ores and mineral concentrates using
microorganisms. Microorganisms are well known for their active role in the formation and
decomposition of minerals in the earth’s crust from the beginning of life on earth. The utilization of
naturally available microorganisms for mineralization of mineral deposits is an age-old process used
in Roman times during the first century BC, and probably the Phoenicians before that. At its
inception, microbial mediated methods were used to leach copper without any knowledge of the
microorganisms involved in the process. Discovery of the microbial world unravelled the hidden
mysteries lying behind microbial processes involved in day to day human endeavours, out of which
microbe mediated mineral dissolution was well studied and developed with time. In recent years
remarkable achievements have been made in developing biomining to cater the interest of the
mineral industry to match the global demand for metals in the 21st century. Depletion of high grade
mineral deposits makes the traditional pyro-metallurgical process uneconomical for metal recovery.
The search for alternative metal recovery processes to achieve economical advantage over
conventional methods motivated the use of the biohydrometallurgical process, which in turn have
accelerated the willingness of the metal industries to use low grade minerals (Rawlings et al., 2003).
Biomining is mostly carried out either by continuous stirred tank reactors or heap reactors.
Continuous stirred tank reactors are used for both bioleaching and bio-oxidation processes
collectively termed as biomining. Stirred tank biooxidation processes are mostly applied on high
grade concentrates for recovery of precious metals like gold and silver, whereas the stirred tank
bioleaching process is used for the recovery of base metals like cobalt, zinc, copper, and nickel
from their respective sulphides, and uranium from its oxides. Continuous stirred tank reactors are
advantageous and widely used due to the following reasons (Rawlings and Johnson, 2007)
The continuous flow mode of operation facilitates continual selection of those microorganisms
that can grow more efficiently in the tanks, where the more efficient microorganisms will be
subjected to less wash out leading to a dominating microbial population in the tank reactor.
Rapid dissolution of the minerals due to the dominance of most efficient mineral degrading
microorganisms utilising the iron and sulphur present in the mineral as the energy source.
Therefore there will be continuous selection of microorganisms which will either catalyse the
mineral dissolution or create the conditions favourable for rapid dissolution of the minerals.
Process sterility is not required, as the objective of this process is to degrade the minerals stating
less importance on type of microorganisms involved in it. Therefore, more importance lies on an

12
efficient dissolution process and the microorganisms that carry out the dissolution process
efficiently are typically the most desirable ones.
Continuous stirred tank biooxidation of refractory gold concentrates and in one case on a cobaltic
pyrite concentrate is currently used in more than ten full-scale operations using two different
technologies with three more plants coming up in the near future (Rawlings et al., 2003; Brierley
and Briggs, 2002; Olson et al., 2004; van Aswegen et al., 2007). A total of eleven BIOX® plants
were commissioned over the last 20 years with five new plants commissioned the last three years.
There are currently 8 plants in operation with two plants under care and maintenance (Table 1).
Table 1. A summary of the commercial BIOX® operations (Reprinted from Niekerk, 2009).
Mine CountryConcentrate
treatmentcapacity
Reactorsize
Date of commissioning Current status
Fairview S.Africa 62 340a 1986 Operating São Bentob Brazil 150 550 1990 C&Me Harbour Lightsc Australia 40 160 1991 Decommissioned
Wiluna Australia 158 480 1993 Operating Ashanti Ghana 960 900 1994 Operating Coricanchad Peru 60 262 1998 C&Me Fosterville Australia 211 900 2005 Operating Suzdal Kazakhstan 196 650 2005 Operating Bogoso Ghana 820 1500 2007 Operating Jinfeng China 790 1000 2007 Operating Kokpatas Uzbekistan 1069 900 2008 Operating aThe volume of the two primary reactors at Fairview. bThe mine is under care and maintenance cMining operations were completed and 1994 and the plant decommissioned. dOperations were temporarily stopped in 2008. eCare and maintenance
Canadian-based BacTech Mining Company’s BACOX process is used for the treatment of
refractory gold concentrates (Rawlings et al., 2003). Three plants using the BACOX process are in
operation, with the most recent plant at Liazhou, in the Shandong province of China, owned by
Tarzan Gold Co. Ltd (China Metals, Reports Weekly, Interfax China Ltd., 2004; Miller et al.,
2004). Minbac Bactech bioleaching technology has been developed jointly by BATEMAN and
MINTEK in Australia and Uganda. Recently the BacTech Company has signed an agreement on
June 2008, to acquire Yamana Gold in two refractory gold deposits in Papua New Guinea. BacTech
Mining Corporation have achieved significantly improved metal recoveries from the test work
carried out on the tailing materials from the Castle Mine tailings deposit located in Gowganda near

13
Cobalt, Ontario. This metallurgical work is a precursor to BachTech’s plan to build a bioleaching
plant near Cobalt, Ontario, to neutralise the arsenic-laden tailings prevalent in this area, and at same
time also to recover significant quantities of Co, Ni and Ag present in the tailings (BachTech press
release 2009). BHP Billiton Ltd operates pilot and demonstration scale processes for the recovery of
base metals from metal sulphides of nickel, copper and zinc by stirred tank bioleaching (Dresher,
2004). Bioleaching of zinc sulphides has been widely investigated on laboratory scale by various
researchers (Shi et al., 2005; Deveci et al., 2004; Pani et al., 2003; Rodríguez et al., 2003;
Sandström and Petersson, 1997; Garcia et al., 1995., Bang et al., 1995; Chaudhury et al., 1987). The
possibilities to process low grade complex zinc sulphide ores through bioleaching have received
much attention and have been tested in pilot scale (Sandström and Petersson, 1997; Sandström et
al., 1997). MIM Holdings Pty, Ltd. holds a patent for a fully integrated process that combines
bioleaching of zinc sulphides with solvent extraction and electrowinning of zinc metal (Steemson et
al., 1994). New developments in stirred tank processes have come with high temperature mineral
oxidation, which has been set up in collaboration between BHP Billiton and Codelco in Chile
(Rawlings et al., 2003).
Biooxidation of refractory gold concentrates in continuous stirred tank reactors and bioleaching of
copper and nickel via heap reactors are some of the established and commercialised technologies in
present day use. Bioprocessing of ores and concentrates provides economical, environmental and
technical advantages over conventionally used roasting and pressure oxidation (van Aswegen et al.,
2007; Rawlings et al., 2003; Lindström et al., 2003; Liu et al., 1993). Increasing demand for gold
motivates the mineral exploration from economical deposits and cheaper processing for their
efficient extraction. Different chemical and physical extraction methods have been established for
the recovery of gold from different types and grades of ores and concentrates. Generally, high-grade
oxidic ores are pulverised and processed via leaching, while refractory ores containing carbon are
roasted at 500ºC to form oxidic ores by the removal of carbon due to combustion and sulphur as
sulphur dioxide gas. However, the sulphidic refractory gold ores without carbon are oxidised by
autoclaving to liberate the gold from sulphide minerals and then sent to the leaching circuit, where
gold is leached out using cyanide (Reith et al., 2007). In many cases pyrometallurgical processes for
the pre-treatment of refractory gold concentrates via roasting have been replaced with continuous
stirred tank reactors as a pre-treatment for successful removal of iron and arsenic through
biooxidation in the global scenario today.
14
Heap bioleaching is a rapidly emerging technology for the extraction of base metals from sulfide
minerals. Significant attention has been focussed on the development of bioheap leaching in recent
years (Brierley and Brierley, 2001). Heap bioleaching is mostly practised on low grade copper ores
with 1-3% copper and mainly on secondary copper sulphide minerals such as covelite (CuS) and
chalcocite (Cu2S). In heap leaching, the crushed secondary sulphidic ores are agglomerated with
sulphuric acid followed by stacking onto leach pads which are aerated from the base of the heap.
Then the ore is allowed to cure for 1-6 weeks and further leached with acidic leach liquor for 400-
600 days. A copper recovery of 75-95% is obtained within this period of time. As the construction
of heap reactors are cheap and easy to operate it is the preferred treatment of low grade ores
(Readett, 2001). Commercial application of bioheap leaching designed to exploit microbial activity,
was pioneered in 1980 for copper leaching. The Lo Aguirre mine in Chile processed about 16,000
tonnes of ore/day between 1980 and 1996 using bioleaching (Bustos et al., 1993). Numerous copper
heap bioleaching operations have been commissioned since then (Brierley and Brierley, 2001).
Overall, Chile produces about 400,000 tonnes of cathode copper by bioleaching process,
representing 5% of the total copper production (Informe al Presidente de la República, Comisión
Nacional para el desarrollo de la Biotecnología, Gobierno de Chile 2003). The Talvivaara Minning
Company Plc. started an on-site pilot heap in June 2005 and the bioheap leaching commenced in
August 2005. Talvivaara have planned to start full production in 2010. Estimated production of
nickel is approximately 33,000 tonnes and has the potential to provide 2.3% of the world's current
annual production of primary nickel by 2010. The first shipment of commercial grade nickel
sulphide started in February 2009 (www.talvivaara.com).
1.2. Microorganisms in biomining
The sulphide mineral oxidising microorganisms are acidophilic prokaryotes as their optimal growth
varies between pH 2-4. They are autotrophic in nature as they use inorganic carbon (CO2) as a
carbon source. They are strictly chemolithotrophic, i.e., derive energy for growth from oxidation of
reduced sulphur compounds, metal sulphides and some species also derive energy through
oxidation of ferrous iron while others by oxidation of hydrogen. They are classified into three
groups such as mesophiles (20-40ºC), moderate thermophiles (40-60ºC), and thermophiles (60-
80ºC), based on the temperature requirements for optimal growth. The mesophiles, moderate
thermophiles, and thermophiles actively involved in bioleaching are given in the Table 2.

15
Table 2. Different types of microorganisms actively involved in bioleaching.
Mesophiles Moderate thermophiles Thermophiles
Acidithiobacillus ferrooxidans Acidimicrobium ferroxidans Sulfolobus metallicus
Acidithiobacillus thiooxidans Acidithiobacillus caldus Sulphobacillus sp.
Acidithiobacillus caldus Sulphobacillus thermosulphooxidans Metallosphaera sedula
Leptospirillum ferrooxidans
Leptospirillum ferrodiazotrophum
Leptospirillum thermoferrooxidans
Leptospirillum ferriphilum
In a stirred tank reactor the acidophilic species vary from one type of concentrate to another, for
details see Table 3. The most widely reported mesophilic iron oxidiser dominating in continuous
stirred tank reactors is L. ferrooxidans but in some cases, Leptospirillum ferriphilum dominates
(Dew et al., 1997; Norris, 2007; Sundkvist et al., 2008). The cause for the dominance of L.
ferriphilum over L. ferrooxidans is due to its faster iron oxidation rate and tolerance to slightly
higher temperature (Plumb et al., 2007).
Table 3. Acidophiles in mineral sulphide concentrate processing at different temperatures (Table
reprinted from Norris, 2007).
Mineralconcentrate Temperature (ºC) Major types in populations
Pyrite/arsenopyritea 40 Leptospirillum ferrooxidans
(48-57%)
Acidithiobacillus thiooxidans /At. caldus (26-34%)
At. ferrooxidans (10-17%)
Mixed sulphidesb 45 At. caldus (65%) L. ferrooxidans (29%) Sulfobacillus sp. (6%)
49 At. caldus (63%) Acidimicrobium sp. (32%) Sulfobacillus sp. (6%) Nickel concentratec
55 Sulfobacillus sp. (93%) At. caldus (5%) Acidimicrobium sp.
(2%)
Chalcopyrited 75-78 “Sulfolobus” sp. (59%)
Metallosphaera sp. (1) (34%)
Metallosphaera sp. (2) (5%)
aFairview and São Bento industrial plants (Dew et al., 1997) bMintek pilot plant (Okibe te al., 2003) cWarwick University laboratory scale (Cleaver and Norris unpublished data) dWarwick University laboratory scale, HIOX culture (Norris unpublished data)
(The estimated proportions of species refer to continuous cultures and to primary reactors where several were in series)

16
1.3. Bioleaching mechanisms
Microbial processes facilitating mineral bio-oxidation and bioleaching are defined in terms of the
contact mechanism, the non-contact mechanism and the cooperative mechanism. In the contact
mechanism (Figure 1a) the bacterial cells attach with the aid of extracellular polymeric substance
(EPS) layers to the mineral surfaces, resulting in dissolution of the sulphide minerals at the interface
by an electrochemical process In the non-contact mechanism (Figure 1b) the ferric iron, produced
through bio-oxidation of ferrous iron comes in contact with the mineral surfaces, oxidises the
sulphide mineral and releases ferrous iron back into the cycle. While, in the cooperative mechanism
(Figure 1c) planktonic iron and sulphur oxidisers oxidise the colloidal sulphur, other sulphur
intermediates and ferrous iron in the leaching solution, releasing protons and ferric iron which is
further used in non-contact leaching (Rohwerder et al., 2003).
Figure 1. Patterns of direct and indirect interaction of the bacteria with pyrite (a) contact leaching;
(b) non-contact leaching; (c) cooperative leaching (Figure reprinted from Rawlings et
al., 1999).
Dissolution of the metal sulphides is controlled by two different reaction pathways, i.e. the
thiosulphate pathway and the polysulphide pathway (Figure 2).

17
Figure 2. Schematic comparison of thiosulphate (A) and polysulphide (B) mechanisms in
bioleaching of metal sulphides (Schippers and Sand, 1999) (Figure reprinted from
Rohwerder et al., 2003).
Thiosulphate pathway
The thiosulphate pathway is only applicable to the acid insoluble metal sulphides such as pyrite
(FeS2), molybdenite (MoS2) and tungstenite (WS2). The thiosulphate pathway (Figure 2A) reaction
mechanism followed in the bioleaching of pyrite is given below:
FeS2 + 6Fe3+ + 3H2O S2O32- + 7Fe2+ + 6H+ (1)
S2O32- + 8Fe3+ + 5H2O 2SO4
2- + 8Fe2+ + 10H+ (2)
The above two equations sum up to give the following overall equation:
FeS2 + 14Fe3+ + 8H2O 2SO42- + 15Fe2+ + 16H+ (3)
The main role of the microorganisms in this mechanism is to catalyse the regeneration of the
consumed ferric ions by means of aeration as given below in equation (4).
14Fe2+ + 3.5O2 + 14H+ 14Fe3+ + 7H2O (4)
The overall reaction based on the primary oxidant oxygen is given below:

18
FeS2 + 3.5O2 + H2O Fe2+ + 2SO42- + 2H+ (5)
Polysulphide pathway
The polysulphide pathway is applicable for acid soluble metal sulphides like galena (PbS),
sphalerite (ZnS), arsenopyrite (FeAsS) and chalcopyrite (CuFeS2). The polysulphide pathway
(Figure 2B) reaction mechanism of zinc sulphide bioleaching is stated below:
8ZnS + 14Fe3+ + 2H+ 8Zn2+ + 14 Fe2++ H2S8 (6)
H2S8 + 2Fe3+ S8 + 2Fe2+ + 2H+ (7)
The microorganism’s role in this mechanism is twofold:
To catalyse the regeneration of the ferric ions consumed for the chemical oxidation of the
intermediary hydrogen sulphide into elemental sulphur via formation of polysulphides.
To catalyse the generation of sulphuric acid in order to maintain the supply of protons required
in the first reaction step for the dissolution of the mineral.
The further reaction steps are given below:
S8 + 12O2 + 8H2O 8SO42-
+ 16H+ (8)
16 Fe2+ + 4O2 + 16H+ 16 Fe3+ + 8H2O (9)
However, the overall reaction based on the primary oxidant oxygen is pH neutral as shown below:
ZnS + 2O2 Zn2+ + SO42- (10)
It is evident from the above mechanism that a high microbial oxidation rate of ferrous to ferric iron
is important for an efficient bioleaching process of sulphide minerals.
1.4. General bioleaching process
Continuously stirred tank reactors are highly aerated reactors where pulp continuously flows
through a series of reactors with good control of pH, temperature and agitation thereby creating a
homogenous environment for mineral bio-oxidation. The ores and concentrates used for the stirred

19
tank reactors are finely ground before they are used in the bio-oxidation process. The pulp density
in the continuous stirred tank reactors is limited to ~20% solids. A pulp density higher than 20%
solids causes inefficient gas transfer and microbial cell damage by the high shear force caused by
the impellers. The limitation in a pulp density to 20% solids and the relatively high cost for stirred
tank reactors have confined the process for use only with high grade minerals (van Aswegen et al.,
1991; Rawlings et al., 2003). The microorganisms used in bioleaching processes are
chemolithotrophic and acidophilic having optimum activity at a pH around 1.5, therefore,
depending on the reactor configuration, addition of neutralising agents is required to maintain the
desired pH. Neutralisation of the acid produced during bioleaching of sulphide minerals is generally
practised using limestone (Arrascue and van Niekerk, 2006). In a bioleaching process of base metal
recovery neutralisation is required at different stages as stated in figure 3.
Figure 3. Flow sheet of a process for base metal production describing stages of neutralisation.
Effluent neutralisation (pH 7-8)
Electrowinning
Metal
By-products/Lime
Discharge
Concentrate
Bioleaching (pH ~1.5)
By-products/Limestone
S/L Residue
Fe/As precipitation (pH 3-4)
By-products/Limestone/Lime
S/L
Solvent Extraction
Fe/As/Gypsum

20
Primary neutralisation to pH~1.5 using limestone during the bioleaching process, secondary
neutralisation to pH 3–4 using lime/limestone for precipitation of iron and arsenic, and finally to pH
7–8 for effluent neutralisation by lime (Figure 3). Controlling pH at a proper level is important to
the operation efficiency in bioleaching processes and generally, a pH range of 1.0–2.0 is
maintained. Operating a bioleaching process at a pH above 1.85 may cause excessive iron
precipitation as jarosite, while operation at a pH below 1.0 may result in foam formation, as
observed at the BIOX® process at Fairview and Wiluna (Dew, 1995; Chetty et al., 2000). After
completion of bioleaching, the gold containing residue is treated for gold recovery through
cyanidation, leaving behind leach liquor with high levels of ferric iron (Fe3+) and arsenate (AsO43-).
A study on the possibility to use oxidic by-products, like steel slags, ashes and dusts as a
neutralising agent in bioleaching process at pH 1.5 and precipitation of Fe/As at pH 3 compared to
slaked lime have proved to be successful and promising, due to the alkaline nature of those
materials (Gahan, 2008; Gahan et al., 2008; Cunha et al., 2008a; Gahan et al., 2009a).
Neutralisation of the ferric iron (Fe3+) and arsenate (AsO43 ) from the leachate at a pH of 3–4 with
limestone or slaked lime precipitates arsenic as a ferric arsenate (FeAsO4) (Stephenson and Kelson,
1997). The ferric arsenate obtained is stable and environmentally acceptable according to the US
EPA (Environment Protection Agency) TCLP testing procedure (Cadena and Kirk, 1995;
Broadhurst, 1994).
Bioleached residues obtained from biooxidation of refractory gold concentrates have been reported
to consume large amounts of cyanide during the subsequent cyanidation step. This is due to
formation of elemental sulphur or other reduced inorganic sulphur compounds, which react with
cyanide to form thiocyanate (SCN-) (Hackl and Jones, 1997; Shrader and Su, 1997; Lawson, 1997).
In a study where a sequential two step biooxidation of a refractory gold concentrate was done,
moderate thermophiles were used in the first stage followed by a second stage with extreme
thermophiles. It was found that the arsenic toxicity was lowered with respect to the extreme
thermophiles while the NaCN consumption, due to SCN- formation, was significantly decreased
(Lindström et al., 2002; Lindström et al., 2003). Later in 2004, van Aswegen and van Niekerk also
reported similar studies as those conducted by Lindström et al (2003) and stated successful
biooxidation of a refractory gold concentrate by a combination of mesophilic and thermophilic
microorganisms and also achieved lower NaCN consumption and higher gold recovery (Lindström
et al., 2003; van Aswegen and Niekerk, 2004).

21
1.5. Cost of neutralising agents in bioleaching process
The cost for neutralisation is normally the second largest operation cost in BIOX® plants and the
limestone cost is directly proportional to the distance between the deposit and the operation plant
(van Aswegen and Marais, 1999). Therefore, it is important to look for substitutes like, dolomite,
ankerite or calcrete (a low-grade limestone) deposits located close to the plant, in order to save
operation costs. The Wiluna mine in Western Australia utilises locally mined cheap calcrete as a
neutralising agent, which contributes to the economic viability of the BIOX® process. The total cost
involved in calcrete mining and transporting is 5 Australian dollars per tonne. Savings due to the
use of calcrete helps in adjusting for Wiluna’s high power cost (van Aswegen and Marais, 1999;
Marais, The geologist guide to the BIOX® process). Studies conducted to determine the neutralising
capacity of the industrial oxidic by-products by chemical leaching at pH 1.5, the optimum pH level
for bioleaching microorganisms, found the neutralising potential to be good enough to be used in
bioleaching (Cunha et al, 2008b). Studies conducted on the use of oxidic industrial by-products as a
substitute neutralising agent to lime/ limestone in the biooxidation of pyrite have shown positive
results as stated by Gahan et al. (Gahan et al., 2008; Gahan et al., 2009a ). When a suitable
alternative neutralising agent is to be chosen some important criteria need to be fulfilled. Firstly, the
agent’s neutralising capacity; secondly, it should be non-toxic to the microorganisms; thirdly, the
overall net cost for delivery and handling of the agent which is a function of freight cost etc but may
also include an alternative cost for disposal.
1.6. Alternative uses of industrial oxidic by-products
1.6.1. Steel slag
European steel industries produce large amounts of steel slag every year. The total amount of steel
slag generated in 2004 was about 15 million tonnes, in which 62% was Basic Oxygen Furnace
(BOF) slag, 29% Electric Arc Furnace (EAF) slag and 9% secondary metallurgical slag.
Concerning the use of these slags, 45% is used for road construction, 17% for interim storage, 14%
for internal recycling, 11% for final deposit, 6% for other purposes, 3% for fertilizer, 3% for
hydraulic engineering and 1% for cement production (Figure 4) (EUROSLAG, 2006).

22
Road construction (45%)
Interim storage (17%)
Internal recycling (14%)
Final deposit (11%)
Others (6%)
Hydraulic engineering (3%)
Fertilizer (3%)
Ceement production (1%)
Figure 4. Use of steel slag produced in Europe (EUROSLAG, 2006).
The utilisation of steel slag in Sweden is different than what is practised in mainland Europe. The
main part of the steel slag produced in Sweden is sent to final deposit, while some part is used for
internal recycling, road construction and small amount is sent for interim storage and cement
production (Figure 5).
Final deposit (49% )
Internal recycling (30% )
Road construction (12% )
Interim storage (8% )
Ceement production (1% )
Figure 5. Use of steel slag produced in Sweden (Figure re-drawn from Engström 2007).
Trials have been conducted for alternative applications on the 49% steel slag sent to final deposit
(Figure 5) to save the cost of landfill. The use of steel slag as a neutralising agent is expected to be
viable due to its high alkalinity, ready availability and cost-affectivity in comparison to limestone.
Comparative cost studies conducted on limestone with different neutralising agents (Hedin and
Watzlaf, 1994) states that limestone was one-third the cost of slaked lime. As steel slag is much
cheaper than limestone, its use as a neutralising agent could therefore be a benefit for the process
cost-efficiency. Replacement of lime for steel slag in acid mine drainage (AMD) treatment was an

23
innovative approach where its high alkalinity and neutralising capacity was utilised (Ziemkiewicz,
1998). The calcium-alumina-silicate complexes present in steel slag causes the pH to rise to high
levels, thus precipitating metal ions and hindering the bacterial growth. However, if steel slags are
to be used as neutralising agents in bioleaching it is required that they should not contain elements
which are toxic for the bacteria. As an example, fluoride that is common in certain types of slag is
known to be toxic for microorganisms. It has been suggested that the reason for fluoride toxicity is
due to transport of fluoride through biological cell membranes, which occurs mainly through
passive non-ionic diffusion of the free protonated form of fluoride, hydrofluoric acid, especially at
pH<6 (Gutknecht and Walter, 1981). Hydrofluoric acid, HF, is a weak acid with a pKa-value of 2.9-
3.4, depending on temperature and ionic strength (Pettit and Powell, 2001). Bioleaching is normally
carried out at a pH range of 1 to 2. Consequently, free uncomplexed fluoride primarily exists as HF
in bioleaching solution. In a study by Sundkvist et al. it was shown that the fluoride toxicity greatly
depends on pH and redox potential in solution. In the presence of aluminium, strong aluminium
fluoride complexes are formed, making the solution non-toxic by reducing the free HF
concentration (Sundkvist et al., 2005; Brierley and Kuhn, 2009).
1.6.2. Combustion ashes
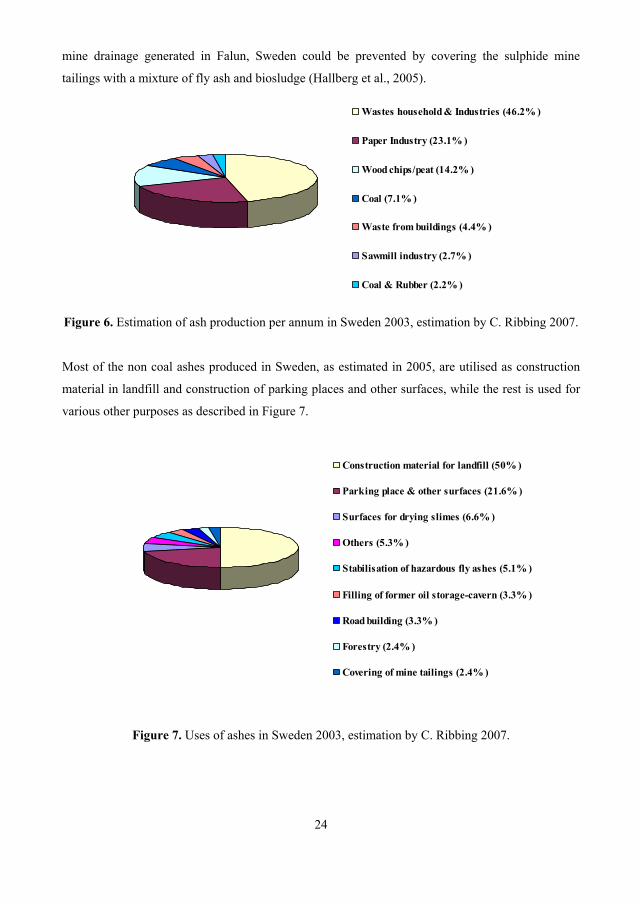
Sweden produces a large quantity of non-coal ashes every year. The amount of ashes produced from
different sources were 15-25% from municipal waste, ~5% from peat, 10-50% from sludge of paper
industry, 2-4% from bark and 0.3-0.5% from pure wood (Ribbing, 2007). In 2003, the estimated
total amount of ash produced was 1125,000 tonnes per annum, of which 715,000 tonnes was bottom
ash and 410,000 tonnes fly ash. The fly ash and bottom ash produced in Sweden varied from each
other depending on their fuel source and type of boilers used. The majority of the fly ash and
bottom ash produced from different boilers came from the combustion of wastes of household and
industries, paper industry and wood chips/peat (Figure 6) (Ribbing, 2007). All the non-coal ashes in
Sweden have a high pH due to their high lime content. Use of ashes as a liner construction material
in landfill is an option for their utilisation, but in Sweden, many landfills will be closed in the next
10-15 years (Tham and Ifwer, 2006; Ribbing, 2007). Therefore, alternative uses of ashes should be
investigated. Studies conducted on the use of three types of coal combustion ashes generated in a
power plant in Illinois, USA suggested that ashes could be used as a neutralising agent in
agriculture, waste treatment, fertilisers, wallboards, concrete and cement production, ceramics,
zeolites, road construction and manufacture of amber glass (Demir et al., 2001). AMD mitigation
can be another alternative use of fly ash. Studies conducted by Hallberg et al. stated that the acid
24
mine drainage generated in Falun, Sweden could be prevented by covering the sulphide mine
tailings with a mixture of fly ash and biosludge (Hallberg et al., 2005).
Wastes household & Industries (46.2% )
Paper Industry (23.1% )
Wood chips/peat (14.2% )
Coal (7.1% )
Waste from buildings (4.4% )
Sawmill industry (2.7% )
Coal & Rubber (2.2% )
Figure 6. Estimation of ash production per annum in Sweden 2003, estimation by C. Ribbing 2007.
Most of the non coal ashes produced in Sweden, as estimated in 2005, are utilised as construction
material in landfill and construction of parking places and other surfaces, while the rest is used for
various other purposes as described in Figure 7.
Construction material for landfill (50% )
Parking place & other surfaces (21.6% )
Surfaces for drying slimes (6.6% )
Others (5.3% )
Stabilisation of hazardous fly ashes (5.1% )
Filling of former oil storage-cavern (3.3% )
Road building (3.3% )
Forestry (2.4% )
Covering of mine tailings (2.4% )
Figure 7. Uses of ashes in Sweden 2003, estimation by C. Ribbing 2007.

25
1.6.3. Dust
Electric arc furnace (EAF) dust recovered from the gas cleaning system of scrap based steel
production is an industrial oxidic by-product with high zinc content. EAF dust is only about 1.5%
of the total output from a typical steel mill, but can create major environmental problems, which
therefore needs to be handled carefully. This dust contains zinc, calcium, iron, and silicate with
contaminants of heavy metals such as lead, cadmium, chromium and others. Since 1984, due to the
presence of small quantities of heavy metals (mainly lead) in the EAF dust, it has been regulated as
a hazardous waste under the U.S. EPA's solid waste Resource Conservation and Recovery Act
(RCRA, 1986). In the global scenario, a part of the EAF dust produced is shipped to hazardous
waste landfills, while the other part is sent to industries for recycling. All steel industry and electric
arc furnace users pay millions of dollars for removal of unwanted elements, treatment and disposal
of the EAF dust. In addition to posing a potential liability to the steel industries, the land filled dust
also contains significant and valuable quantities of recoverable zinc. In Sweden, a major part of the
EAF dust is recycled in a fuming process, which converts zinc ferrite into zinc oxide that is later
sent to the zinc smelter for the recovery of the zinc. Studies on hydrometallurgical processing for
recovery of zinc from EAF dust have been widely carried out by various researchers (Havlík et al.,
2006; Bruckard et al., 2005; Leclerc et al., 2002; Cruells et al., 1992).
1.6.4. Lime sludge
Lime sludge, a by-product generated from paper and pulp industry, is reused for production of lime
(calcium oxide) by calcination at temperatures ranging from 1000°C to 1300°C and marketed as
quicklime and hydrated lime (Sweet, 1986). Part of the lime sludge, called Mesalime, is bled out
from the process and has been found to be an excellent alternative neutralising agent during pyrite
biooxidation (Gahan et al., 2008). Therefore, alternative use of lime sludge generated from the
paper industry can save the cost incurred for landfill.
1.7. Chloride in bioleaching
Microbial mediated mineral dissolution processes normally occur in an aqueous phase, where the
process water becomes very important, as the microbial culture has to oxidise the soluble ferrous
iron and replicate rapidly to have sufficient microbial population for successful bioleaching
(Crundwell, 2003). As the bioleaching process requires much water for its operation, it becomes
difficult at times to provide sufficient water to bioleaching units in remote areas, where the
availability of water sources are limited. For the application of bioleaching in areas with limited
supply of chloride-free water, the quality of the process water with regard to salinity is of great

26
importance (Budden and Spencer, 1991; Weston et al., 1994). The quality of process water in
reference to salinity is very important especially for mesophilic acidophiles as they can only tolerate
1-4% (w/v) of chloride (Deveci et al., 2008). The ground water in some areas of Western Australia
contain 100 g/L of chloride, which limits the option of biooxidation of auriferous refractory
sulphide minerals available in those areas (Shiers et al., 2005).
Studies on the toxic effect of chloride on the acidophiles involved in biooxidation processes have
been conducted by various researchers mostly based on the rate of ferrous iron oxidation in
different concentrations of chloride supplemented growth medium (Lawson et al., 1995; Tuovinen
et al., 1971). Studies conducted by Blight and Ralph suggested that the initial effect of inhibitor on
the cell doubling time, as well as processes of selection and adaptation over subsequent growth
cycles, should be a function of the quantitative assessment of the activity of the mixed cultures of
iron oxidisers (Blight and Ralph, 2004). Shiers et al. observed a detrimental effect on the replication
rates of the iron oxidisers with a concentration of 7 g/L of sodium chloride, which is equivalent to
4.2 g/L of chloride (Shiers et al., 2005). They also suggested that prolonged exposure of 4.2 g/L of
chloride increased the cell doubling time by a factor 2 in batch cultures, which indicates that minor
changes in the chloride concentration could cause a lethal effect on the iron oxidisers by lowering
their maximal growth rate. The effect of chloride on sulphur oxidation was predicted as unclear due
to the lack of studies carried out with sulphur oxidisers. However, they strongly suggested that
modest concentration of chloride in the process water could have a significant inhibition effect on
iron oxidation affecting the biooxidation process (Shiers et al., 2005).
A study on bioleaching of zinc sulphide showed a decreasing trend in zinc dissolution with
increasing concentration of chloride from 1% to 4% (w/v) at a pH of 1.5 and temperature of 30ºC
(Deveci et al., 2008). Leong et al. (1993) reported that adaptation of a mixed bacterial culture of
Thiobacilli to a chloride level of 5 g/L improved their tolerance and worked well at a chloride
concentration of 8 g/L without affecting the dissolution process in the bioleaching of a copper ore.
Weston et al. (1994) proposed that the deleterious effects of salts on the microorganisms were due
to the sodium ions instead of chloride ions. They strongly debated that the coexisting sodium ions
favoured the precipitation of ferric iron as sodium jarosites, as they could observe negative effect on
the biooxidation process at a concentration of 1–2 g/L of chloride when operating at a lower pH
range of 1.1–1.3. Similarly Dew et al. (1997) suggested that high concentrations of chloride in the
bioleaching solution could damage the cell membrane leading to a lethal effect on the
microorganisms.

27
Most of the acidophiles used in bioleaching are sensitive to sodium chloride, which restricts their
use in biomining application at sites where only saline water is available. Few species of iron
oxidising acidophiles isolated from geothermal sites belonging to the Thiobacillus prosperus group
were found to be halotolerant by nature, while few moderate thermophiles are also known to be
halotolerant (Huber and Stetter, 1989; Norris, 2007). In a study it was suggested that the pyrite
oxidation was mostly carried out by sulphur-oxidizing Acidithiobacilli in the presence of 6% (w/v)
salt, whereas the ferrous iron oxidation was carried out by Thiobacillus prosperus-like acidophiles
(Norris and Simmons, 2004). Davis-Belmar et al. (2008) reported that the leaching of copper was
slightly retarded due to precipitation of ferric iron as sodium jarosite at 5% (w/v) NaCl resulting in
20% less ferric iron in solution compared to tests with 2.5% (w/v) NaCl. Ferrous iron oxidation and
leaching of copper ore with halotolerant bacteria in column leaching suggested that Thiobacillus
prosperous actively oxidized the mineral sulphides and maintained the percolating iron in the
oxidized state despite the presence of chloride ions that would have prevented the growth of other
acidophiles frequently used for biooxidation (Davis-Belmar et al., 2008). Apart from the
halotolerant group of Thiobacillus prosperous another similar halotolerant iron oxidising
microorganism Alicyclobacillus-like bacteria were isolated from marine harbour sediments (Crane
and Holden, 1999; Holden et al., 2001).
1.8. Modeling of ferrous iron oxidation
Presently, biohydrometallurgy has achieved its maturity as a technology used in full scale
operations, which can be seen by many ongoing and upcoming industries employing tank
bioleaching and heap bioleaching operations in different parts of the world. A number of studies
have been carried out to date to understand the intricacies of the kinetics of microbial ferrous iron
oxidation (Nemati et al., 1998; Ojumu et al., 2006). More recently, ferrous iron oxidation has been
used as a basis for development of novel processes such as nano particle synthesis (Gao et al.,
2006), bio-machining of metals and electricity generation in biofuel cells (Uno et al., 1998; Lilova
et al., 2007). The formation of highly oxidising solutions with redox potential of up to 1000 mV
SHE by microbial ferrous iron oxidation at low pH ranging from 1.0 to 2.5 is the most important
feature in these types of applications (Svirko et al., 2009). The major iron oxidisers prevailing as a
dominant microbial population in both tank leaching and heap leaching are Acidithiobacillus
ferrooxidans, Leptospirillum ferrooxidans and Leptospirillum ferriphilum (Bastias and Gentina,
2009). Dominance of Leptospirillum species over Acidithiobacillus ferroxidans in biooxidation
plants, due to their tolerance to high ferric iron concentration, has diverted the focus of ferrous iron

28
oxidation kinetics study more towards Leptospirillum species (Rawlings et al., 1999). Up to this
point, a limited amount of studies have been conducted on Leptospirillum species compared to
Acidithiobacillus ferrooxidans, while more focus has been given to the Leptosprillum ferriphilum,
as it dominates over Leptospirillum ferrooxidans in most bioleaching operations. Capability of the
Acidithiobacillus ferrooxidans to tolerate dissolved metal ions like As, Cu, Co, Ni, Mn, Ag, Hg and
Al and their effects on the ferrous iron oxidation and their growth kinetics have also been widely
investigated in the past (Tuovinen et al., 1971; Garcia Jr and da Silva, 1991 ; Wang et al., 2004).
The oxidation of ferrous iron to ferric by the iron oxidisers is one of the key sub processes in
bioleaching and the development of a comprehensive rate equation for this sub process is critical.
Such a rate equation is very important before designing and modeling either a tank bioreactor or
heap reactors (Ojumu et al. 2006). As the bioleaching operation, especially in cases of tank
leaching, has shown to contain more than 95% of ferric iron, it is prudent to study the possible
inhibition that could be caused by ferric iron on the microorganisms. It has also been reported that,
when Acidithiobacillus ferrooxidans grows in synthetic media like 9K, it will be limited by the
ferrous iron concentration (Rossi, 1990). Most of the rate equations developed till date by various
researchers defines the microbial specific growth rate based on the Monod equation for the terms
representing ferric iron inhibition and ferrous sulphate limitation. A few of the published rate
equations express the specific substrate utilization rate in terms of the modified Michaelis-Menten
equation and the maximum yield constant is expressed via the Pirt equation (Ojumu et al., 2006).
Despite the development of a number of equations for ferrous utilization rate, which give a good fit
to the expressions, the terms for true growth yield and maintenance yield as described in the Pirt
equation have been neglected (Pirt, 1975). Other rate equations developed today are based on
chemiosmotic theory or analogous to an electrochemical cell. Some of the rate equations developed
also have considered the effects of temperature, pH, biomass concentration, ionic strength and
arsenic inhibition (Ojumu et al., 2006).

29
2. AIM AND SCOPE OF THE PRESENT WORK
The scope of the present work was to investigate the possibilities to use industrial oxidic by-
products like slag, ashes, dust, and lime sludge as neutralising agent in bioleaching and
determination of their eventual toxic effects on the microorganisms or on the subsequent metal
production chain. The influence of chloride on the microbial population dynamics in bioleaching
was also investigated followed by studies on modeling of ferrous iron oxidation by a Leptospirillum
ferriphilum-dominated chemostat culture with varying ferrous iron concentrations and chloride
concentrations, respectively.

30

31
3. MATERIALS AND METHODS
3.1. Studies on the neutralising capacity of by-products (Paper I)
3.1.1. Industrial oxidic by-products
Industrial oxidic by-products, like steel slags, ashes, dust and lime sludge, generated from different
Swedish industries was used as neutralising agents in the experiments. The slags used in the
experiments were five different types of steel making slags from steel plants in Sweden. The AOD
(Argon Oxygen Decarbonisation) slag is a converter slag originating from stainless steel
production. The BOF (Basic Oxygen Furnace) slag is a converter slag from ore based steel
production. The CAS-OB (Composition Adjustment by Sealed Argon Bubbling-Oxygen Blowing)
is a ladle slag from an integrated steel plant. The EAF (Electric Arc Furnace) slag and the Ladle
slag (from ladle refining of steel) are both from scrap based steel production. Three different types
of ashes from combustion for power generation were used. Bioash is a mixture of fly and bottom
ash generated during combustion of biomass. Coal & Tyres ash is a fly ash from combustion of a
mixture with 67% coal and 33% tyres. Waste ash is a mixed fly ash from combustion of wood chips
and municipal waste. The EAF dust used is collected from the gas cleaning system of an electric arc
furnace in scrap based steel production. The Mesalime is generated in a paper and pulp industry and
the slaked lime, Ca(OH)2, a commercial chemical, which was used as reference to all the by-
products (For details see Paper I).
3.1.2. Analytical and instrumentation techniques
The analytical and instrumental techniques used in the experiments were as follows:
Platinum electrode measured against the Ag, AgCl reference electrode for redox potential.
Inductively Coupled Plasma-Atomic Emission Spectrometry (ICP-AES)/Quadrupole Mass
Spectrometry (ICP-QMS)/Sector Field Mass Spectrometry (ICP-SFMS) was used for the
elemental analysis.
X-ray powder diffraction (XRD) for identification of mineralogical phases (For details see
Paper I).
3.1.3. Neutralisation experiment
Leaching experiments were performed in 250 mL Erlenmeyer flasks with an initial solid to liquid
ratio of 1:10 in a rotary orbital incubator shaker at 35ºC at a rotation speed of 150 rpm (Figure 8).
Initially the pH was rapidly decreased to 1.5 by addition of 1M H2SO4 and thereafter the pH was
maintained at 1.5 by daily addition of 1M H2SO4. The experiments were stopped when no change in
pH was seen for at least 10 days. At the end the flasks were harvested by filtration and residues

32
were washed with 50 ml of acidified water (pH 1.5), leachate volumes were measured and the
residues were dried in hot air oven at 70-80ºC. The dried residues were analysed for mineralogical
phases by XRD. The chemical analysis of both residue and leachate were analysed by ICP-MS/AES
(For details see Paper I).
Figure 8. Rotary shaker used in neutralising capacity studies.
3.2. Batch biooxidation of pyrite with by-products as neutralising agents (Paper II & III)
3.2.1. Pyrite concentrate
The pyrite concentrate used for the experiment was tailing from chalcopyrite flotation at the
Boliden plant in Aitik, Sweden. The major constituents were 23.9% of sulphur, 25.7% iron, 12.9%
silicon and 4.5% aluminium. Pyrite and kyanite were the two prominent mineralogical phases
identified (For details see Paper II and III).

33
3.2.2. Neutralising agents
The neutralising agents used in the bioleaching experiments are well described in section 3.1.1.
3.2.3. Analytical and instrumentation techniques
Analytical and instrumental techniques used in the experiments were similar to techniques stated in
section 3.1.2., except the following:
Atomic Absorption Spectroscopy (AAS) for total iron estimation.
Lange LDOTM/sc100 for dissolved oxygen (For details see Paper II and III).
3.2.4. Microorganisms
The microbial culture used in the bioleaching experiments was a mixed culture of iron and sulphur
oxidisers with a few archaeal species (For details see Paper II and III).
Figure 9. Batch bioleaching experimental set up.

34
3.2.5. Bioleaching
A total number of eleven pH controlled batch experiments were conducted for bioleaching of a
pyrite concentrate using a mixed microbial culture (Figure 9). Ten different oxidic by-products and
slaked lime as reference material were used to control the pH in the bioreactor during the
experiment. The neutralising agents were added into the pulp when pH decreased below the desired
level of 1.5. The bioleaching experiments continued until no further changes in pH and redox
potential were observed. After completion of each experiment, the pulp was harvested by filtration.
The bioleach residues and bioleach liquor were analysed and the percentage of pyrite oxidation was
calculated (For details see Paper II and III).
3.3. Toxic effects of chlorides on the biooxidation efficiency of pyrite (Paper IV)
3.3.1. Pyrite concentrate
The pyrite concentrate used was a higher grade tailing from chalcopyrite flotation at the Boliden
plant in Aitik, Sweden. The concentrate sample as received was acid washed using sulphuric acid to
remove some of the gangue minerals prior to its use. The major constituents were 39.6% of sulphur,
36.4% iron, 7.7% silicon and 2.4% aluminium. Pyrite (FeS2), kyanite (Al2SiO5), and quartz (SiO2)
were the three major mineralogical phases identified (For details see Paper IV).
3.3.2. Neutralising agent
Calcium hydroxide and Waste ash were the two neutralizing agents used in this present study. The
details about Waste ash are well described in section 3.1.1.
3.3.3. Analytical and instrumentation techniques
All the analytical and instrumental techniques used in the experiments were similar to techniques
stated in section 3.2.3. (For details see Paper IV).
3.3.4. Microorganisms
The same microbial culture used in this study as stated in section 3.2.4. (For details see Paper IV).
3.3.5. Bioleaching
Two different experiments were conducted, where one was with Waste ash as neutralising agent
and another with slaked lime where same concentration of chloride were added serially similar to
the increasing chloride concentration in the Waste ash experiment. Another series of experiments
were conducted where effect on sudden exposure of 2, 3 and 4 g/L of chloride in the beginning of
35
the log phase of the experiment was studied. Slaked lime was used as neutralising agent in the batch
experiments. A population dynamic study was conducted in the experiment with 3 g/L chloride. The
oxygen uptake rate (OUR) value obtained from the experiments was used to determine the
microbial activity. When the OUR value approached zero the experiments were stopped as it
indicated no microbial activity. After completion of each experiment, the pulp was harvested by
filtration. The bioleach residues and bioleach liquor were analysed and the percentage of pyrite
oxidation was calculated (For details see Paper IV).
3.4. Continuous biooxidation of a refractory gold concentrate with Mesalime and EAF dust as
neutralising agents (Paper V)
3.4.1. Refractory gold concentrate
The refractory gold concentrate from the Boliden Mineral AB owned mine in Petiknäs North,
Sweden was used in this study. The major constituents were 40% of sulphur, 35% iron and 10%
arsenic with a gold and silver content of 10.8 g/ton and 91 g/ton, respectively. Mineralogical phase
analysis showed the presence of pyrite (FeS2), arsenopyrite (FeAsS), sphalerite (ZnS), pyrrhotite
(FeS) and quartz (SiO2) with gold and silver present mainly in arsenopyrite but also in the pyrite
phase (For details see Paper V).
3.4.2. Neutralising agent
The neutralising agents used in this continuous bioleaching studies were Mesalime, EAF dust and
the reference Ca(OH)2. The EAF dust was water leached to remove the chloride before use (For
details see Paper V).
3.4.3. Analytical and instrumentation techniques
Analytical and instrumental techniques used in the experiments were same as the techniques stated
in section 3.2.3. (For details see Paper V).
3.4.4. Microorganisms
The microbial culture used in the bioleaching experiments was same culture stated in section 3.2.4.
(For details see Paper V).

36
3.4.5. Biooxidation
A bench scale study was conducted for continuous biooxidation of the refractory gold concentrate
in a single stage 5 L bioreactor (Figure 10). EAF dust and Mesalime was tested as a neutralising
agent to maintain the pH in the bioreactor and compared with the reference slaked lime. The
experiments were conducted with a retention time of 57 hours. Steady state was assumed after a
leaching time of 5 times the retention time, i.e. 12 days, thereafter the outgoing pulp was collected
for 3 days for the subsequent cyanidation experiments before the experiments were terminated.
After termination the pulp was removed and filtered and the filter cake was thoroughly washed with
acidified deionised water (pH 1.5). The leachate and the residues obtained were analysed for their
chemical composition by ICP-AES/MS/SMS analysis, whereas the mineralogical content of the
bioleached residues were analysed by XRD (For details see Paper V).
Figure 10. Continuous bioleaching experimental set up.

37
3.4.6. Cyanidation
The dried biooxidised samples were prepared by grinding and were diluted with inert silica sand
prior to cyanidation to obtain a certain pulp solid content. Cyanidation tests were carried out in
stirred tanks. The free cyanide concentration was maintained at a level ranging from 0.03-0.1%
NaCN (vol/vol), which was determined by a titrimetric method. The pH was maintained at 10-11 by
adding quick lime whenever required. The total leaching time was between 52-72 hours after which
the experiments were stopped. Residues were washed, dried and analysed for gold and silver by the
fire assay method. The SCN- concentrations in the leach solutions were analysed by VIS
spectrophotometer (For details see Paper V).
3.5. Modeling of ferrous iron oxidation (Paper VI)
3.5.1. Chemostat
The experiments were carried out in an air sparged bioreactor with a working volume of 1 L (Figure
11). The feed solution was 9 K mineral salt medium (Silverman and Lundgren, 1959) supplemented
with either 9 g or 18 g of ferrous iron, while a constant temperature of 35 ºC was maintained
throughout the experiment. The working pH maintained in the bioreactor was 1.5 by daily addition
of sulphuric acid, whenever required. The continuous pumping was carried out using variable speed
peristaltic pumps. A paddle stirrer was used for homogenous mixing of the solution and air inside
the bioreactor. The bioreactor was operated at each dilution rate for at least three residence times
and until steady protein concentration, redox potential, and Fe2+ concentration was obtained. Steady
state was maintained for at least two consecutive days at each residence time. Reactor was cleaned
everyday to avoid microbial wall growth (For details see Paper VI).
3.5.2. Microorganisms
The microbial inoculum used for this experiment originated from a mixed mesophilic culture of iron
oxidisers dominated by Leptospirillum ferriphilum. The culture was initially identified as
Leptospirillum ferrooxidans (Paper VI) and later it was re-identified as Leptospirillum ferriphilum.
The culture was grown under non-aseptic conditions in a continuous reactor in 9 K mineral salt
medium (Silverman and Lundgren, 1959) supplemented with 9 g/L Fe2+ for a period of 6 months at
a dilution rate of 0.02 h-1. Characterisation of the inoculum used in the experiment was carried out
by quantitative PCR (Q-PCR) technique at Bioclear b.v., Netherlands (For details see Paper VI).

38
3.5.3. Protein estimation
The biomass concentration in the reactor was determined by estimating the bacterial protein content
and was analyzed by pelletization of the bacterial culture via centrifugation and treated with
Bradford reagent (Bradford, 1976) followed by incubation at room temperature and finally
measured for their absorbance at 595 nm in a UV-VIS Spectrophotometer. The protein
concentration was calculated from a standard calibration curve obtained by bovine serum albumin
treated with Bradford reagent (For details see Paper VI).
Figure 11. Experimental set up of the chemostat for ferrous iron oxidation by Lepstospirillum
ferriphlum-dominated culture.

39
3.5.4. Analytical and instrumentation techniques
The analytical and instrumental techniques used in the experiments were as follows:
Atomic Absorption Spectroscopy (AAS) for total iron estimation.
Platinum electrode measured against the Ag, AgCl reference electrode for redox potential.
Lange LDOTM/sc100 for dissolved oxygen.
UV-VIS spectrophotometer for protein estimation.
Mettler Toledo MC 226 conductivity meter for conductivity measurements of both feed
solution and working solution (For details see Paper VI).
3.6. Effect of chloride on the ferrous iron oxidation (Paper VII)
3.6.1. Batch biooxidation studies
Batch biooxidation experiments were performed using the shake-flask test technique with a
bacterial inoculum of 10% (v/v) in 9K mineral salt medium supplemented with 9 gL-1 ferrous iron.
Nine experiments were conducted with chloride concentrations of 0 g/L, 3 g/L, 5 g/L, 7 g/L, 9 g/L,
10 g/L, 11 g/L, 12 g/L and 13 g/L at a pH of 1.5 and temperature of 35ºC in a rotary orbital
incubator shaker. The redox potential and pH was measured at regular intervals to follow the
biooxidation trend (For details see Paper VII).
3.6.2. Chemostat studies
3.6.2.1. Chemostat
The experimental set up and conditions for this present was similar to the set up and conditions
stated in section 3.5.1., except the feed solution, which was 9 K mineral salt medium (Silverman
and Lundgren, 1959) with 9 g/L ferrous iron supplemented with 0 g/L, 2 g/L and 3 g/L of chloride.
(For details see Paper VII)
3.6.2.2. Microorganisms
The microbial inoculum used for this experiment was the same mixed microbial culture of iron
oxidisers dominated by Leptospirillum ferriphilum as stated in section 3.5.2. (For details see Paper
VII).
3.6.2.3. Protein estimation
The protein estimation method is the same as stated in section 3.5.3. (For details see Paper VII).

40
3.6.2.4. Analytical and instrumentation techniques
Analytical and instrumental techniques used in this experiment were the same as stated in section
3.5.4., except the conductivity measurement which was not done for this present study (For details
see Paper VII).
41
4. RESULTS AND DISCUSSION
4.1. Studies on the neutralising capacity of by-products (Paper I)
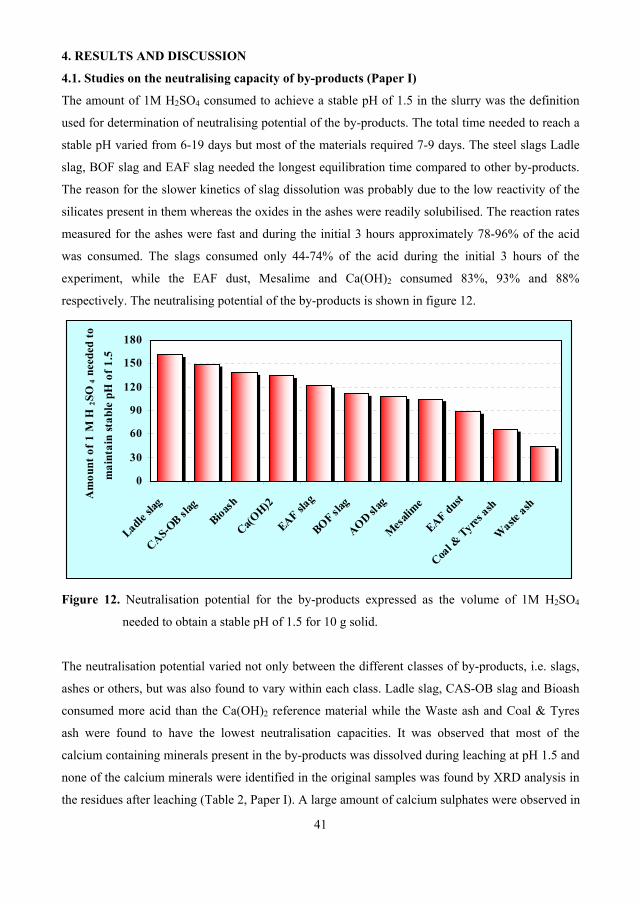
The amount of 1M H2SO4 consumed to achieve a stable pH of 1.5 in the slurry was the definition
used for determination of neutralising potential of the by-products. The total time needed to reach a
stable pH varied from 6-19 days but most of the materials required 7-9 days. The steel slags Ladle
slag, BOF slag and EAF slag needed the longest equilibration time compared to other by-products.
The reason for the slower kinetics of slag dissolution was probably due to the low reactivity of the
silicates present in them whereas the oxides in the ashes were readily solubilised. The reaction rates
measured for the ashes were fast and during the initial 3 hours approximately 78-96% of the acid
was consumed. The slags consumed only 44-74% of the acid during the initial 3 hours of the
experiment, while the EAF dust, Mesalime and Ca(OH)2 consumed 83%, 93% and 88%
respectively. The neutralising potential of the by-products is shown in figure 12.
0
30
60
90
120
150
180
Ladlesla
g
CAS-OB sla
gBioash
Ca(OH)2
EAF slag
BOF slag
AOD slag
Mesalim
e
EAF dust
Coal &
Tyres ash
Waste
ash Am
ount
of 1
M H
2SO
4 nee
ded
to
mai
ntai
n st
able
pH
of 1
.5
Figure 12. Neutralisation potential for the by-products expressed as the volume of 1M H2SO4
needed to obtain a stable pH of 1.5 for 10 g solid.
The neutralisation potential varied not only between the different classes of by-products, i.e. slags,
ashes or others, but was also found to vary within each class. Ladle slag, CAS-OB slag and Bioash
consumed more acid than the Ca(OH)2 reference material while the Waste ash and Coal & Tyres
ash were found to have the lowest neutralisation capacities. It was observed that most of the
calcium containing minerals present in the by-products was dissolved during leaching at pH 1.5 and
none of the calcium minerals were identified in the original samples was found by XRD analysis in
the residues after leaching (Table 2, Paper I). A large amount of calcium sulphates were observed in

42
the all the leach residues with the exception of EAF dust and CAS-OB slag. The precipitation of
calcium sulphate was due to the low solubility of calcium in sulphate media (Table 2, Paper I).
Franklinite (ZnFe2O4) was observed in the leach residue obtained from the experiment with EAF
dust as it requires hot acid treatment to dissolve. A mineralogical phase of Herrcynite (FeAl2O4)
was observed in the residue obtained from the experiment with CAS-OB slag, which was not found
in the original CAS-OB slag. This phase might have formed by the partial leaching of the spinel
ferrian (Mg(Al Fe)2O4). Leaching yield of Al and Mg was 60-90% from the different slag samples,
while silica yield was between 13-76%. Recovery of Zn from the EAF dust was 80%, due to the
dissolution of the ZnO content, while remaining Zn was in the form of insoluble ZnFe2O4. The
leaching yield of Zn in Coal & Tyres ash was 96% as it contained only ZnO. Therefore both EAF
dust and Coal & Tyres ash could be suitable neutralising agents in the case of zinc bioleaching as
they can enrich the zinc tenor. The presence of 11% chloride in the Waste ash was identified as a
possible toxic element for microorganisms in bioleaching. Furthermore, the presence of 2.4%
fluoride in AOD slag and the relatively high concentration of chromium in stainless steel slag could
also be deleterious to the microorganisms if used in bioleaching.
4.2. Batch biooxidation of pyrite with by-products as neutralising agents (Paper II & III)
After the initial lag phase the redox potential started to increase followed by a decrease in the pH
(Figure 13). The neutralising agents were then added directly into the pulp to maintain the pH in the
bioreactor at the desired level of 1.5. It was observed that the different neutralising agents used in
the batch experiments behaved differently due to differences in their chemical composition (Table
2, Paper II and III). During the log phase, the total iron concentration in solution increased for a
period of 7-10 days, thereafter the concentration gradually decreased due to the precipitation of
jarosite and possibly other basic iron sulphates (Figure 14). The kinetics for jarosite precipitation
are known to be relatively slow at 35 C but the long duration of batch bioleaching experiments
promotes the precipitation of jarosite (Deveci et al., 2004). Different forms of jarosite were
identified by XRD in all bioleaching residues except in the experiment with CAS-OB slag (Table 7,
paper II and III). Potassium jarosite is one of the least soluble jarosite and the presence of high
amounts of soluble potassium in Bioash and Waste ash is probably the reason for their low total
iron concentration in solution. When ferric iron is precipitated as jarosite both the redox potential
and the pH in solution is lowered, in accordance with equation (11) given below:
X+ + 3Fe3+ + 2SO42- + 6H2O XFe3(SO4)2(OH)6 + 6H+ [X+=K+, Na+, H3O+, NH4
+,..] (11)

43
400
500
600
700
800
0 10 20 30 40 50 60 70 80
Time, days
Red
ox p
oten
tial,
mV
Ca(OH)2AOD slagBOF slagCAS-OB slagEAF slagLadle slagBioashCoal & Tyres ashWaste ashEAF dustMesalime
Figure 13. A plot of redox potential vs. time in the experiment with by-products.
0
3
6
9
12
15
18
0 10 20 30 40 50 60 70 80
Time, days
Fe (t
otal
), g/
L
Ca(OH)2AOD slagBOF slagCAS-OB slagEAF slagLadle slagBioashCoal & Tyres ashWaste ashEAF dustMesalime
Figure 14. A plot of total iron concentration vs. time in the experiment with steel slag.

44
A lowering in redox potential, as seen in the later parts in most of the experiments, is therefore also
a consequence of jarosite precipitation (Figure 14). The total amount of neutralising agent
consumed in the experiments is a measure of neutralising capacity of the by-products used. The
slaked lime reference material needed 22 g while the amount required for the different by-products
varied from 16 to 82 g (Figure 15, Table 1). The materials with the highest neutralising capacities
were generally the slags, where Ladle slag and CAS-OB slag required only 16 g and 19 g,
respectively, i.e. neutralising capacities even better than that of slaked lime. The lowest neutralising
capacities were obtained for Coal & Tyres ash and Waste ash, which needed 57 g and 82 g,
respectively.
0
10
20
30
40
50
60
70
80
90
0 10 20 30 40 50 60 70 80 90 100
Time, days
Cum
ulat
ive
addi
tions
, g
g
Ca(OH)2AOD slagBOF slagCAS-OB slagEAF slagLadle slagBioashCoal & Tyres ashWaste ashEAF dustMesalime
Figure 15. A plot of additions vs. time in the experiment with by-products.
Pyrite oxidation in the experiments ranged from 59% to 80%, with the lowest value of 59%
obtained with Waste ash and the highest value of 80% was obtained with BOF slag (Figure 16).
Pyrite oxidation in experiments conducted with AOD slag and Coal & Tyres ash were 75%, which
was similar to the reference, slaked lime, while CAS-OB slag, EAF slag and Ladle slag all had
recoveries of 77%. The other materials, i.e. Mesalime, Bioash and EAF dust had pyrite oxidation of
around 70%.

45
0102030405060708090
BOF slag
Ladle
slag
CAS-OB sla
g
EAF slag
Coal &
Tyres
ash
Ca(OH)2
AOD slag
Mesa
lime
EAF dust
Bioash
Wast
e ash
Pyri
te o
xida
tion,
%
Figure 16. Pyrite oxidation obtained in experiments.
From the results obtained regarding pyrite oxidation, it is clear that the usage of by-products, except
in the case of Waste ash, had no negative effect on the bioleaching efficiency. Apart from the result
obtained with Waste ash, the differences observed in pyrite oxidation were relatively small and with
the limited experimental data available all other neutralising agents must be considered equally
effective for use in bioleaching processes.
Table 4. Summary of the experimental results.
Ca(OH)2AOD slag
Ladleslag
EAFslag
BOF slag
CAS-OB slag
Bioash Wasteash
Coal&
Tyresash
EAFdust
Mesalime
Neutralising agents, (g) 22.1 25.5 16.1 27.2 24.6 18.8 32.7 81.5 57.0 37.5 28.7
Concentrate, (g) 100 100 100 100 100 100 100 100 100 100 100
Bioleach residue, (g) 127.8 128.3 101.2 130.9 119.7 94.8 147.4 180.0 151.1 123.3 121
Wash water , (L) 0.25 0.28 0.28 0.35 0.21 0.32 0.35 0.35 0.35 0.25 0.22
Bioleach liquor, (L) 1.19 1.04 1.24 1.16 0.98 1.28 1.23 0.90 1.24 1.15 1.14
Pyrite oxidation, (%) 74.9 74.6 77.6 77.1 80.2 77.5 68.7 59.1 75.3 69.8 72.6
The calcium content in the different neutralising agents was comparatively high and was in a range
from 23-38 wt%, except the CAS-OB slag, the EAF dust and the Waste ash, which contained 17%,
14% and 12% respectively. The dissolution of calcium into solution in all experiments was
observed to be low with concentrations in the range 0.5 g/L to 0.6 g/L in the bioleachate, due to the

46
limited solubility of calcium in sulphate medium. The calcium precipitated as gypsum, which was
the major mineralogical phase identified in all the bioleach residues.
The concentration of sulphate in the bioleachates was in the range of 26-50 g/L (Table 5, Paper II
and III). The lowest sulphate concentrations of 26 g/L and 28 g/L were obtained in the experiments
with Ca(OH)2 and Bioash, respectively. The highest sulphate concentrations were seen in
experiments with CAS-OB slag and Ladle slag with concentrations of 50 g/L and 48 g/L,
respectively. The variation in sulphate concentrations was dependent on the total amount of soluble
metal sulphates in the solution.
The aluminium concentration in the majority of oxidic by-products varied from 0.1% to 4.0% with
the exception of CAS-OB slag and Ladle slag which had concentrations of 18.7% and 13.4%,
respectively. The aluminium present in the by-products was relatively soluble and aluminium
concentrations of 2.7 g/L and 2.5 g/L were obtained in the experiments with CAS-OB slag and
Ladle slag, respectively. Aluminium oxides present in the by-products do contribute to the
neutralising capacity, especially at the relatively low pH utilised in bioleaching operations.
However, the high aluminium concentrations obtained in the leachates, although not having a
negative impact on bioleaching efficiency, will be a disadvantage in the down stream processing of
leach liquor. In case the high aluminium containing by-products are used in a leaching process of a
refractory gold concentrate, the aluminium has to be precipitated with lime as the effluent is leaving
the process, thus the benefits of acid neutralisation with aluminium oxide is lost.
Toxic elements like chromium, fluorine, chlorine, vanadium were found at high concentrations in
some of the by-products used in the present study. These elements could pose a threat to both the
microbial activity as well as the environment. The AOD slag had a chromium concentration of
1.3% which could be toxic for the bacteria used in bioleaching operations. Approximately 17% of
the chromium content in the AOD slag dissolved during the bioleaching resulting in a concentration
of 55 mg/L in the bioleachate (Table 5, Paper II). This concentration did however not influence the
microbial activity negatively as judged from the pyrite oxidation and redox potential in solution, but
for environmental reasons chromium containing materials should be avoided as chromium is known
to be a toxic element, especially in its hexavalent state (Dayan and Paine, 2001; Russo et al., 2005).
Fluoride was another toxic element present in the AOD slag with a relatively high concentration of
2.4% (Dayan and Paine, 2001; Russo et al., 2005), which dissolved completely giving a
concentration of 0.6 g/L. Fluoride is toxic in its protonated form (HF) but fluoride ions form strong

47
complexes with aluminium ions, which under suitable conditions regarding pH and redox potential
in the leaching solution might lower the free HF concentration to non-toxic levels (Sundkvist et al.,
2005). In the experiment with AOD slag the presence of 1.6 g/L aluminium (Table 5, Paper II) in
the bioleachate was sufficient to complex the fluoride present in solution to non-toxic levels for the
bacteria. Fluoride is also an unwanted ion in zinc electrowinning since fluoride ions react with the
aluminium cathode making the deposited zinc difficult to strip from the cathode (Han and O'keefe,
1992). The combination of the above effects makes AOD slag unsuitable for use in bioleaching
processes.
Chloride is an element known to be toxic for bioleaching microorganisms and generally
concentrations of around 4-5 g negatively influences their activity (Shiers et al., 2005). The chlorine
concentrations in the Waste ash and the EAF dust was 11% and 1.5%, respectively. The chlorine
was present in the form of highly soluble halite in both materials and dissolved into solution giving
rise to concentrations of 8.9 g/L and 0.5 g/L, respectively (Table 5, Paper III). The concentration
obtained in the experiment with Waste ash was clearly above the toxic level stated in the literature
and is probably the reasons for the low pyrite leaching yield and low redox potential in that
experiment, whereas no such toxic effects were observed in the experiment with EAF dust. The
Waste ash is obtained from combustion of municipal waste and contains many different metal
oxides, some of which were toxic like lead, cadmium and mercury along with high content of
chlorides and fluorides. All of this taken into account makes the Waste ash the most unsuitable by-
product of all materials tested in this investigation.
With a zinc content of 24%, EAF dust might be an asset in a bioleaching operation for zinc
recovery from zinc sulphides. The majority of the zinc present in the EAF dust was in the form of
ZnO, which is soluble at pH 1.5. The zinc content dissolved to an extent of 74% during leaching,
resulting in a concentration of 5.8 g/L in solution (Table 5, Paper II), which would greatly increase
the process economics. Thus, EAF dust appears to be a very suitable neutralising agent provided
that chlorides present in the dust are removed for example by water washing prior to its use
(Bruckard et al., 2005).
Vanadium is another potentially toxic element present in the BOF slag and the CAS-OB slag at
concentrations of 2.5% and 0.5%, respectively. Vanadium is mainly toxic in its pentavalent state,
which is the most probable speciation in a bioleaching process which usually operates at high redox
potentials (Frank et al., 1996). The vanadium in BOF slag dissolved to an extent of 75%, resulting

48
in a concentration of 481 mg/L, while 53% of the vanadium dissolved in the CAS-OB slag giving a
concentration of 42 mg/L. In the present investigation no toxic effects due to vanadium were
observed. The use of BOF slag, which has higher vanadium content than CAS-OB slag, as
neutralising agent in a large scale bioleaching can cause environmental problems unless vanadium
is removed before disposal of the leach liquor. On the other hand, the recovery of vanadium from a
0.5 g/L solution might be worthy due to vanadium’s high market value.
The presence of un-burnt carbon in Bioash and Coal & Tyres ash were identified by XRD. The high
content of unburnt carbon in Coal & Tyres ash gave a blackish colour and when added to the pulp
became oily and stuck to the reactor walls. It is therefore believed that the use of Coal & Tyres ash
as neutralising agent in a bioleaching operation may cause handling problems due to its sticky
nature, making it unsuitable for use. Apart from that, it was also observed that the redox potential in
the experiment conducted with Coal & Tyres ash decreased immediately after each addition
indicating a reducing property in the Coal & Tyres ash. The reason for this may be due to the
presence of some organic compound in the ash.
In summary, all by-products investigated, except Waste ash, have proven to be good alternatives to
lime or limestone as neutralising agents in bioleaching operations, without negative impact on the
bioleaching efficiency. The Waste ash should be avoided due to the high amounts of toxic elements
and the low neutralising capacity. The AOD slag is less suitable due to the presence of
environmentally hazardous elements. The CAS-OB and BOF slags have the disadvantage of
occurring as lump solids and will thus require crushing and grinding before use and might be less
eco-friendly due to the vanadium content. The Coal & Tyres ash should also be avoided due to its
carbon content which made it sticky, and caused handling problems. The EAF dust could be an
excellent substitute for limestone, particularly in a zinc bioleaching process due to its high content
of soluble zinc, provided that the chlorides are removed before use. Bioash was found to be a
favourable neutralising agent as it had a high neutralising capacity and no significant toxic effects
on the microorganisms. Both EAF slag and Ladle slag would be convenient to use as neutralising
agents due to their fine particulate nature, high neutralisation capacity and absence of
environmentally hazardous elements. Mesalime is a relatively pure calcite product and is the best
alternative neutralising agent of the oxidic by-products investigated in this study.

49
4.3. Toxic effects of chlorides on the biooxidation efficiency of pyrite (Paper IV)
Waste ash and sodium chloride toxicity was studied by comparing their behaviour in pyrite
biooxidation with that of a slaked lime reference. The reference experiment began with a short lag
phase (Figure 17) and later when the pH started to decrease, Ca(OH)2 was added to maintain pH at
1.50. The OUR values, which determine the biooxidation activity in the bioleaching system, were at
high levels between days 9-19 and thereafter, due to substrate deficiency, decreased steadily until
the end of the experiment. A total amount of Ca(OH)2 needed for neutralisation of the acid
produced during the experiment was 30.4 g and the amount of bioleach residue obtained was 109 g.
Iron concentration in the leach liquor increased to 20 g/L by day 30 and was maintained the same
level until the end of the experiment (Figure 18). The pyrite oxidation degree in this experiment was
85% and the major mineralogical phase in the bioleach residue was gypsum together with minor
phases of jarosite, quartz and pyrite (Table 5, Paper IV).
The effect of chloride on pyrite biooxidation was studied by comparing neutralisation with Waste
ash in one experiment and combination of Ca(OH)2 + NaCl in the other. When using Ca(OH)2 +
NaCl, Ca(OH)2 was added whenever a drop in pH required adjustment back to pH = 1.5.
Furthermore, NaCl was added in order to maintain the same chloride concentration, as was
observed in the experiment with Waste ash, but with a time delay due to the longer lag phase
(Figures 17).
400
500
600
700
800
0 5 10 15 20 25 30 35 40 45 50
Time, days
Red
ox p
oten
tial,
mV
Ca(OH)2Waste ashCa(OH)2 + NaCl
Figure 17. Comparative plot of the change in redox potential.
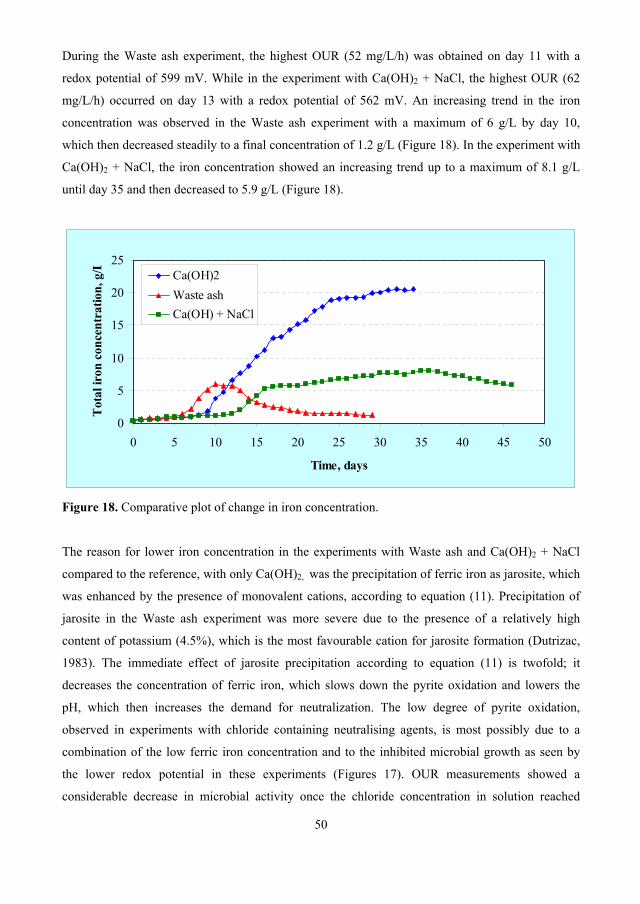
50
During the Waste ash experiment, the highest OUR (52 mg/L/h) was obtained on day 11 with a
redox potential of 599 mV. While in the experiment with Ca(OH)2 + NaCl, the highest OUR (62
mg/L/h) occurred on day 13 with a redox potential of 562 mV. An increasing trend in the iron
concentration was observed in the Waste ash experiment with a maximum of 6 g/L by day 10,
which then decreased steadily to a final concentration of 1.2 g/L (Figure 18). In the experiment with
Ca(OH)2 + NaCl, the iron concentration showed an increasing trend up to a maximum of 8.1 g/L
until day 35 and then decreased to 5.9 g/L (Figure 18).
0
5
10
15
20
25
0 5 10 15 20 25 30 35 40 45 50
Time, days
Tot
al ir
on c
once
ntra
tion,
g/L Ca(OH)2
Waste ashCa(OH) + NaCl
Figure 18. Comparative plot of change in iron concentration.
The reason for lower iron concentration in the experiments with Waste ash and Ca(OH)2 + NaCl
compared to the reference, with only Ca(OH)2, was the precipitation of ferric iron as jarosite, which
was enhanced by the presence of monovalent cations, according to equation (11). Precipitation of
jarosite in the Waste ash experiment was more severe due to the presence of a relatively high
content of potassium (4.5%), which is the most favourable cation for jarosite formation (Dutrizac,
1983). The immediate effect of jarosite precipitation according to equation (11) is twofold; it
decreases the concentration of ferric iron, which slows down the pyrite oxidation and lowers the
pH, which then increases the demand for neutralization. The low degree of pyrite oxidation,
observed in experiments with chloride containing neutralising agents, is most possibly due to a
combination of the low ferric iron concentration and to the inhibited microbial growth as seen by
the lower redox potential in these experiments (Figures 17). OUR measurements showed a
considerable decrease in microbial activity once the chloride concentration in solution reached

51
levels of 2-3 g/L. In the experiment with Ca(OH)2 + NaCl, low OUR was observed for a long time
even after the final chloride concentration of 6.7 g/L was reached. The pyrite oxidation degrees for
experiments with Waste ash and Ca(OH)2 + NaCl were 34% and 49%, respectively, compared to
85% in the reference experiment. There are two possible reasons for the lower final pyrite oxidation
in experiments with chloride. One reason could be that jarosite precipitation leads to a reduction in
ferric iron concentration in the bioleaching solution as stated by Weston et al (1994) and the other
could be the direct toxic effect of chloride ions on the microorganisms (Weston et al., 1994; Lawson
et al., 1995). Gypsum, pyrite, jarosite and quartz were the mineralogical phases observed in the
bioleached residues of both experiments with chloride.
0
20
40
60
80
100
Ca(OH)2 Waste ash Ca(OH)2 + Serialaddition of Cl
Pyri
te o
xida
tion,
%
Figure 19. Pyrite oxidation obtained in experiments with Waste ash, Ca(OH)2 and
Ca(OH)2 + Serial addition of Cl.
In another study, a series of experiments with different concentrations of chloride were conducted
to determine the toxic limit for the microbial activity by sudden exposure of chloride in the mid lag
phase of pyrite biooxidation. Three different concentrations i.e. 2 g/L, 3 g/L and 4 g/L of chloride
were used in this investigation. A sudden exposure of 2 g/L chloride to the bioleaching pulp
resulted in an immediate response in redox potential which decreased for two consecutive days to a
level of 548 mV from 565 mV. This type of response shows that the microorganisms react instantly
to the occurrence of chloride ions (Figure 19) but recover gradually suggesting the adaptation of the
microorganisms to 2 g/L of chloride. At 3 g/L chloride, again the response was an immediate fall in
redox potential from 571 mV to 538 mV in the following day (Figure 20), but here the redox

52
potential continued to decrease to 515 mV, after which it started to recover. This inhibitory effect of
chloride on the microorganisms was also observed from the OUR measurements, which was zero
on day 18 indicating that no biooxidation activity occurred. Interestingly, from that day
biooxidation slowly started to recover as evidenced by a gradual increase in both redox potential
(Figure 20) and the OUR which reached 26 mg/L/h on day 26. Finally, at 4 g/L chloride, a similar
immediate fall in redox potential was observed as in the two previous experiments, but this time
activity was irreversibly lost (Figure 20), the same for OUR which also became zero and never
recovered, thereby confirming 4g/L chloride as the toxic limit.
400
500
600
700
800
0 5 10 15 20 25 30 35 40 45 50
Time, days
Red
ox p
oten
tial,
mV
Ca(OH)22 g/L chloride3 g/L chloride4 g/L chloride
Figure 20. Comparative plot of redox potential evolution in the experiments with 2, 3 and 4 g/L
chloride with standard Ca(OH)2.
The iron concentration in the bioleaching solution with 2 g/L chloride increased to a maximum of
12.4 g/L on day 31, while after the addition of 3 g/L chloride the total iron concentration was
stagnant for some time before it started to increase again (Figure 21). When figures 20 and 21 are
compared it can be seen that there is a delay between the recovery of the redox potential and
increasing iron concentration in solution for the case with 3 g/L chloride. This is probably an effect
of the high sodium ion concentration in this experiment, which induces precipitation of jarosite.
However, it was observed that the iron concentration in the bioleaching solution eventually
increased up to 9 g/L after a short period of adaptation for the microorganisms (Figure 21).

53
In the experiment with 4 g/L chloride, the iron concentration in solution never increased after
addition of chloride and is most likely due to the toxic effect of chloride.
0
5
10
15
20
25
0 5 10 15 20 25 30 35 40 45 50
Time, days
Iron
con
cent
ratio
n, g
/L ba
d bo
y
Ca(OH)22 g/L chloride3 g/L chloride4 g/L chloride
Figure 21. Comparative plot of change in iron concentration in the experiments with 2, 3 and 4 g/L
chloride with standard Ca(OH)2.
The pyrite oxidation degrees obtained from experiments with 2, 3 and 4 g/L of chloride were
71.0%, 47.8% and 13.4% respectively (Figure 22). In agreement with observations made by
Watling (2006), it appears that the chloride addition decreases pyrite oxidation because jarosite
attaches itself to the pyrite surfaces, which then hinders further oxidation. The bioleach residues
from all experiments contained gypsum as the major mineralogical phase with minor phases of
jarosite, except for the experiment with 4 g/L, where biooxidation never started due to the lethal
effect on the microorganisms. All bioleach residues also had minor phases of quartz and pyrite
(Table 5, Paper IV).

54
0
20
40
60
80
100
Ca(OH)2Ca(OH)2 + 2 g/L Cl
Ca(OH)2 + 3 g/L Cl
Ca(OH)2 + 4 g/L Cl
Pyri
te o
xida
tion,
%
Figure 22. Pyrite oxidation obtained in experiments with Ca(OH)2, Ca(OH)2 + 2 g/L Cl,
Ca(OH)2 + 3 g/L Cl and Ca(OH)2 + 4 g/L Cl.
4.3.1. Population dynamics of the microorganisms in a chloride affected biooxidation process.
A population dynamic study was conducted during the experiment with sudden exposure of 3 g/L
chloride. This experiment was characterised by highly dynamic changes in population with an
apparent complete loss of microbial activity followed by a recovery of the activity after a short
period of adaptation. Samples were taken from the bioreactor at different occasions; i.e. the starting
inoculum, day 14 just before the chloride was added, day 16 when the culture was shocked and
exhibiting a decreasing redox potential and day 21 when the culture had recovered. A Q-PCR
analysis was conducted to quantify the microbial population. The iron oxidiser Leptospirillum
ferriphilum existed in the inoclum at a higher magnitude than the sulphur oxidiser Acidithiobacillus
caldus (Table 5). The iron and sulphur oxidising species Sulphobacillus sp. was also detected at low
concentration, while Acidimicrobium sp. was not detected at all in the inoculum. Interestingly, it
was found that the population of both the universal count of bacteria as well as the archaea in the
inoculum was approximately the same (Table 4).
The microbial population changed drastically on day 14 of the experiment, as the previously
dominating Leptospirillum ferriphilum and the archaea were below the detection limit. On the other
hand, the population of Acidithiobacillus caldus had increased and was in fact the dominating
species followed by Sulphobacillus sp. which was the dominating iron oxidiser in the bioleaching
pulp. The microbial population on day 16, i.e. 2 days after the chloride addition, showed the

55
presence of the same type of species as on day 14, but the population of each species was reduced.
It was obvious that the microorganisms were affected by the chloride addition, but still maintained
relatively high populations. The population of the microorganisms on day 21, when the culture
regained its activity as seen from the recovery of the redox potential (Figure 20), reduced further
and it was mainly the sulphur oxidiser Acidithiobacillus caldus that decreased in number. However,
Acidithiobacillus caldus had been reduced with one order of magnitude during the 7 days in
chloride environment (Table 5). On the contrary, the population of Sulphobacillus sp. remained
approximately the same as observed on day 16, but an interesting observation was the re-
appearance of Leptospirillum ferriphilum but at a low population compared to the inoculum (Table
5).
Table 5. Microbial population dynamics in 3 g/L of chloride experiment.
Number of cells per ml Microorganism
Inoculum Day 14 Day 16 Day 21
Universal ; Bacteria 1.7 x 10⁸ 9.2 x 10⁷ 3.7 x 10⁸ 8.8 x 10⁷
Universal ; Archaea 1.8 x 10⁸ N.D. N.D. N.D.
Acidimicrobium sp. N.D. N.D. N.D. N.D.
Acidithiobacillus caldus 4.2 x 10⁷ 3.2 x 10⁸ 1.5 x 10⁸ 3.4 x 10⁷
Leptospirillum ferriphilum 4.7 x 10⁸ N.D. N.D. 6.3 x 10⁵
Sulfobacillus sp. 8.2 x 10⁵ 3.8 x 10⁷ 1.5 x 10⁷ 1.1 x 10⁷
N.D.: Not detected
The overall study on population dynamics showed that Leptospirillum ferriphilum is very sensitive
to changes in the environment, as this species was initially dominating in the inoculum, but
disappeared to a non detectable level when it was added into the batch bioleaching reactor.
Leptospirillum species are usually the main iron oxidiser in continuous bioleaching reactors and the
peculiarity of these species is that they dominate other iron oxidisers at high redox potentials [29].
The reason for the high sensitivity of Leptospirillum species could be their sensitivity to sudden
changes in the bioleaching environment. Other microbial species in the bioreactor, like

56
Acidithiobacillus caldus and especially Sulphobacillus sp., were found to be less affected by
changes in environment.
Of further interest was that Sulphobacillus sp., which was initially present at low numbers, in fact
was responsible for the main part of the all ferrous iron oxidation. This study implies that care must
be taken while using pure cultures for batch experiments because it might be a species, present in
the inoculum at very low numbers or in the concentrate itself, which is actually responsible for the
biooxidation.
4.4. Continuous biooxidation of a refractory gold concentrate with Mesalime and EAF dust as
neutralising agents (Paper V)
4.4.1. Biooxidation
Biooxidation of a refractory gold concentrate was conducted at controlled pH by addition of
neutralising agents. The biooxidation activity in the continuous experiments was observed to be
good, as judged from the high redox potential, and slight increase in temperature due to the
exothermic reactions. The stable and high redox potential obtained at steady state (Figure 23) in the
experiments implies that the high concentration of 15 g/L arsenic was not toxic for the
microorganisms (Figure 24).
560
580
600
620
640
9 10 11 12 13 14 15 16
Time, days
Red
ox p
oten
tial,
mV
Ca(OH)2Mesalime
EAF Dust
Figure 23. Redox potential during the steady state operation.

57
Mesalime, EAF dust or Ca(OH)2 was added manually twice per day in order to maintain the pH at
1.5. The pH in the bioleaching pulp during biooxidation varied between 1.3 and 1.5. Some of the
steady state data are shown in Table 6 and Figures 23-25.
0
3
6
9
12
15
18
9 10 11 12 13 14 15 16Time, days
Ars
enic
, g/L
Ca(OH)2MesalimeEAF Dust
Figure 24. Arsenic concentration during steady state operation.
A higher concentration of iron was obtained in the leachate from the experiment with EAF dust
compared to Mesalime and slaked lime (Figure 25). The reason for this was partly due to the high
iron content in the dust, which is partially soluble, although the main part of the iron was present in
insoluble form (ZnFe2O4 and Fe3O4).

58
0
10
20
30
40
9 10 11 12 13 14 15 16
Time, days
Iron
, g/L
Ca(OH)2
Mesalime
EAF Dust
Figure 25. Iron concentration during the steady state operation.
The neutralising potential of EAF dust, Mesalime and slaked lime was quantified using the amount
of daily additions required to maintain the desired pH of 1.5 during steady state operation of the
bioreactor. The EAF dust had the lowest neutralising capacity with daily additions of 60 g, while
Mesalime and Ca(OH)2 had higher neutralising capacities with daily additions of 28 g and 22 g,
respectively (Table 6).
Table 6. Summary of results obtained at steady state.
Ca(OH)2 EAF dust Mesalime
Redox potential (mV) 604 623 604
Daily by-product addition (g) 22.1 60.8 28.3
Daily dry residue weight (g) 160 164 156
Despite the fact that higher amounts of EAF dust were required compared to slaked lime and
Mesalime, the difference in the amount of bioleached residue produced (Table 6) was not large.
This is due to, amongst others, the zincite (ZnO) content in EAF dust which is soluble at pH 1.5
while the other neutralising agents produced more gypsum precipitates due to their higher Ca
contents (Table 1, Paper V). The high zinc content in EAF dust, 26.5% (Table 1, Paper V) of which
~75% was in the form of soluble ZnO, resulted in the enrichment of the zinc concentration in the
leach liquor to 9.5 g/L. Whereas in the other experiments, the zinc concentrations were in the range

59
2.1-2.4 g/L (Table 5). Therefore, EAF dusts could be an excellent choice as neutralising agent in
bioleaching of zinc sulphides to enhance the zinc tenor in the leachate.
The degree of arsenopyrite oxidation achieved in the experiments was in the range of 85% to 90%,
which is high considering operation in a single stage reactor (Table 7). In this concentrate, a high
degree of arsenopyrite oxidation is required as the major part of the gold is locked within the
arsenopyrite matrix. Similarly a part of the gold and silver is also locked within the pyrite matrix.
The degree of pyrite oxidation ranged from 63% to 74% (Table 7).
Table 7. Summary of biooxidation and cyanidation studies.
Bioresidue specifications
Bioresidue origin Slaked lime Mesalime EAF dust
Retention time (hours) 56 58 58 Pyrite oxidation (%) 67.8 73.6 63.4 Arsenopyrite oxidation (%) 85.4 89.8 89.2 Leaching yield zinc (%) 57.5 69.2 75.6 Bioresidue analysis Stot (%) 32.1 29.7 25.6 S (%) 1.74 1.97 3.33 Ratio bioresidue/feed (w/w) 0.80 0.78 0.80 S (kg/ton feed) 13.9 15.3 26.5 Cyanidation results Cyanidation time, hours 52 52 78 Cyanide leach residue grade, g Au/tonne feed 1.19 1.01 1.59 Cyanide leach residue grade, g Ag/tonne feed 24.7 13.2 29.5 Gold extraction (%) 88.9 90.6 85.3 Silver extraction (%) 72.9 85.5 67.6 Cyanidation time, hours 52 52 72 NaCN consumption, kg/tonne feed 10.8 11.4 15.9 SCN formation, kg/tonne feed 4.10 4.34 5.82 NaCN losses as SCN, kg/tonne feed 3.53 3.74 5.01 NaCN losses as SCN, % of total consumption 32.6 31.8 31.5 Cyanidation time, hours 24 24 24 NaCN consumption, kg/tonne feed 8.14 8.23 9.24 SCN formation, kg/tonne feed 2.95 2.83 3.85 NaCN losses as SCN, kg/tonne feed 2.54 2.44 3.33 NaCN losses as SCN, % of total consumption 30.2 30.7 36.0

60
The high leaching yields obtained in the experiment with by-products ruled out any negative effects
the by-products might have incurred on biooxidation efficiency. Normally, calcite is used as a
neutralising agent in full scale processes as it helps to maintain pH levels in the biooxidation tanks
and at the same time, fulfils the carbon dioxide demand of the autotrophic microorganisms. In this
sense, Mesalime would be an excellent candidate as it is a homogenous product mainly comprising
of calcite (Table 2, Paper V), whereas for EAF dust it would be better to mix the dust with calcite in
such proportions that the carbon dioxide requirement is met. The mineralogical phases found in all
residues were gypsum, free quartz and un-reacted pyrite. The bioresidue obtained from the
experiment with EAF dust had a higher content of elemental sulphur compared to the other
bioresidues (Table 7). The reason for this could be an increase in the ionic strength of the leaching
solution due to high concentrations of iron, zinc and sulphate ions leading to the inhibition of the
microbial biooxidation (De Kock et al., U.S.Patent, 2009) (Table 5, Paper V).
4.4.2. Cyanidation
Cyanide leaching continued until 52 hours for the residues from experiments with Mesalime and
Ca(OH)2, whereas it took 78 hours for the residue from EAF dust. Results obtained from cyanide
leaching are stated in Table 7. The final gold recovery from the Ca(OH)2 and Mesalime experiments
was 90%, while the experiment with EAF dust gave a recovery of 85%. Although the recovery of
gold was lower with EAF dust than with Mesalime and Ca(OH)2, the kinetics of gold dissolution
was faster in the EAF dust experiment. The high gold recoveries obtained from the present study in
a single stage reactor at a retention time of less than 60h reflects the high level of association of
contained gold with arsenopyrite. The pyrite oxidation degree ranged from 63% to 74% (Table 7).
Bioresidues obtained from Mesalime and Ca(OH)2 experiments had a higher content of total
sulphur compared to that with EAF dust, whereas the elemental sulphur (S0) content in the
bioresidue from EAF dust was highest among other bioresidues. The high content of elemental
sulphur in the EAF dust bioresidue resulted in high consumption of sodium cyanide (NaCN) due to
the reaction of cyanide (CN-) with elemental sulphur (S0) to form thiocyanate (SCN-) (Table 7,
Figure 4).

61
0
36
9
1215
18
0 20 40 60 80Leach time, hours
NaC
N c
onsu
mpt
ion,
kg N
aCN
/ton
Ca(OH)2MesalimeEAF Dust
Figure 26. NaCN consumption as a function of time.
Cyanide losses due to thiocyanate formation were similar for all bioresidues irrespective of leaching
time and material tested. The NaCN consumption per tonne of feed was rather high for all
bioresidues, but this can partly be explained by the incomplete biooxidation of the concentrates in a
single stage reactor. In normal industrial practice biooxidation is performed in a series of reactors,
therefore the cyanide consumption is expected to decrease by optimisation of retention time and
tank configuration.
4.5. Modeling of ferrous iron oxidation (Paper VI)
Determination of the kinetic and yield parameters was completed using data from the chemostat
based on the output from biomass- and substrate balances. During experiments, dilution rates were
chosen so that chemostat conditions were fulfilled, i.e. the culture must be in exponential growth
phase (Table II, Paper VI). It was necessary to avoid overly low dilution rates because this would
cause starvation and eventual cell death. Similarly, the higher dilution rates were set below the
critical dilution rate in order to avoid wash out of the cells. The Monod kinetic constants were
determined by Langmuir methods (Table III, Paper VI). The plots obtained from the linearized
Monod equations, (Figure 1, Paper VI), show good fit to the experimental steady-state data. The
μmax and Ks values were calculated using the Monod equation, while the Pirt yield parameters were
determined by using a linearization of the relationship between observed protein yield on oxidized
Fe2+ and dilution rate (Table IV, Paper VI). Within the tested range of the dilution rates, the residual
ferrous concentration was higher at higher total iron concentrations at the same dilution rate (Figure

62
3, Paper VI). This agrees to the findings of Boon et al., 1999. As most of the iron in the
experimental points was in ferric state, the observation seemed to be the result of ferric inhibition.
However, it was noted that the differences in residual Fe2+ concentrations decreased when the
dilution approached the critical dilution rate. Based on the Monod fit, the estimated maximum
specific growth rate was not inhibited by a higher iron concentration (Table III and Figure 3, Paper
VI). The biomass concentration in the reactor increased with a higher dilution rate and the model
suggests that it should increase until it is close to the critical rate, which is in agreement with Pirt
theory. It must be noted that the units for specific Fe2+ oxidation rate were incorrectly stated in
Paper VI and should have been mg Fe2+/mg protein/h and not mg Fe2+/ g protein/h. Since the
estimated μmax was higher with higher iron concentrations in the feed solution, the estimated critical
dilution rate was also higher (Figure 4, Paper VI).
The experimental data indicates that the specific Fe2+ utilization rate reaches a minimum value at
high redox potential and does not go to zero. This confirms that at a low dilution rate or high Fe3+ to
Fe2+ ratio the chemostat requirements are not fulfilled due to extensive starvation or non-negligible
cell death. According to Equation (12) the true maintenance coefficient during chemostat conditions
can be obtained by setting the D-value to zero and which is valid over the entire chemostat range.
strue
sFe m
YD
XPq 2 (12)
( 2Feq = Specific ferrous utilization rate on biomass, sP = Reactor ferric productivity, X = Cell
concentration in the reactor and discharge, D = Dilution rate, trueY = True biomass yield for
growth, sm = Maintenance coefficient)
For solutions with 9 g and 18 g Fe/L, the specific Fe2+ utilization rate due to maintenance activities
contributed approximately 90% and 65%, respectively, to the overall maximum specific Fe2+
utilization rate at the critical dilution rate according to Equation (12). The contribution of uncoupled
Fe2+ oxidation to the specific Fe2+ utilization rate will increase with lower dilution rates (Eq. (12)).
Any discontinuity in the maintenance coefficient could be due to deviations from the chemostat
conditions. It is obvious from the modeling of chemostat conditions that the apparent ferric
inhibition on specific Fe2+ utilization rate was a direct consequence of the declining biomass yield
for Fe3+ when the dilution rate was decreased. Figures 11 and 13 (Paper VI) show that the specific
Fe2+ utilization rate was not only a function of the Fe3+ to Fe2+ ratio, which was determined by the

63
dilution, but also depended on the overall composition of the solution. From Figure 11 it can be
seen that the measured specific Fe2+ utilization rates were approximately 1.3–1.4 times higher for
the culture grown on 9 g Fe2+/L. This clarifies why the biomass concentrations were 2.6–2.8 times
higher in the 18 g Fe2+/L experiments since the Fe2+ conversion was almost complete in all
experiments.
It was observed that the conductivities of the steady-state solutions were lower than in the feed
solutions (Table II, Paper VI). This indicated a significant drop in the ionic strength when Fe2+ was
oxidized due to the change in the chemical speciation. The resulting simulated speciation versus
redox potential was calibrated using experimentally determined Fe2+ concentrations at
approximately 630 mV versus the Ag, AgCl reference electrode. A drastic drop in conductivity
observed in the oxidised solution (Figure 13, Paper VI) was due to the formation of stable Fe3+
sulphate complexes. Figure 13 from Paper VI shows that the ionic strength reaches a minimum and
remains constant at a redox potential above 550 mV. It was also observed that the ionic strength for
the 18 g Fe/L solution was higher than for the 9 g Fe/L solution over the considered redox potential
range. However, the decline in ionic strength at higher redox potential was also confirmed by the
conductivity measurements. In spite of the higher concentration of ions in the feed solution, the
maintenance coefficient for the 18 g Fe/L solution was lower than that for the 9 g Fe/L solution. A
higher maintenance coefficient may be explained by higher concentrations of non-complexed
HSO4- and SO4
2- ions appearing in the 9 g Fe/L solution at redox potentials higher than about 450
mV (Figure 14, Paper VI). Therefore, the values for the Monod and Pirt parameters determined here
are most likely invalid if dilution rates are allowed to approach the critical dilution rate because it
coincides with both a dramatic increase in ionic strength and free sulphate species. It was also
observed that the general composition and chemical speciation may also have a crucial impact on
growth rate and biomass yield.
4.6. Effect of chloride on the ferrous iron oxidation (Paper VII)
4.6.1. Batch biooxidation studies
A gradual increase in the chloride concentration resulted in a related increase in the lag phase
during batch growth of the L. ferriphilum dominated culture (Figure 1, Paper VII). The lag phase
varied from approximately 25 h with no chloride addition up to 250 h with an addition of 11 g/L
chloride (no growth occurred after 2 weeks with 12 g/L and 13 g/L). Once the bacteria were adapted
to the chloride (i.e. after the lag phase), rapid Fe2+ oxidation occurred in the presence of 10 g/L as

64
the redox potential increased. The lower endpoint redox potentials were not due to complexation of
Fe3+ with chloride because chloride addition to a solution containing 9 g Fe3+/L at pH 1.5 had no
effect on the redox potential up to 12 g/L, which is in agreement with Welham et al. (2000). A more
probable explanation could be sodium jarosite precipitation stimulated by the increased sodium
concentrations. These data are in agreement with Shiers et al. (2005) where chloride concentrations
up to 6.7 g/L resulted in an increased lag phase, and adaption in the presence of 0.6 and 1.8 g/L
chloride resulted in lag phases similar to the control culture growing without chloride. Another
study has demonstrated that sudden exposure of chloride was toxic to A. ferrooxidans at 4.2 g/L
(Lawson et al., 1995).
4.6.2. Chemostat studies
Initially, experiments were carried out with the same retention times but washout occurred with
increased chloride concentrations unless the microorganisms were adapted to the chloride. After
adaption, the critical dilution rates for increasing chloride concentrations were lower than the
critical dilute rate in the experiment without chloride (Figure 3, Paper VII). Kinetic constants were
determined by linearizing the Monod equation using the Langmuir method, which gave the best fits
to the experimental data (Table II, Paper VII). The maximum specific growth rate (μmax) decreased
with increasing chloride concentration while the substrate constant (Ks) increased. The yield and
maintenance parameters were obtained from the Pirt equation (Equation 2, Paper VII) by plotting
the inverse of observed biomass yield on Fe2+ (Yobs) in Table III versus retention time (1/D) or
(1/ obs) (Figure 3, Paper VII). In this plot the intercept was equal to the inverse of the true yield
(1/Ytrue) and the slope equal to the maintenance coefficient (ms). Chloride addition greatly
influenced the true yield (Ytrue) when 2 g/L and 3 g/L of chloride were added (Table IV, Paper VII).
The increased energy demand for production of new cell material may be explained by the effects
described for the batch experiments. Also, Ytrue may vary for a given substrate and depends on
growth conditions and should not be considered as a biological constant (van Bodegom, 2007).
The determined μmax, Ks, and Yobs values were used with the Pirt constants (Table IV, Paper VII) to
model Fe2+ oxidation with different chloride concentrations. The plot of D versus residual Fe2+
concentration (Figure 4, Paper VII) was based on Equation 3 of Paper VII. The μmax values
decreased (Table II and Figure 4, Paper VII) and the residual Fe2+ and Ks values increased (Table I
and II, Paper VII) with increasing chloride concentrations in the growth medium. The plot obtained
by plotting the biomass (X) against D (Figure 5, Paper VII) showed that without chloride, the
biomass linearly increased with increasing D until the critical dilution rate was approached. With

65
the addition of 2 g/L and 3 g/L of chloride, the biomass production was reduced and was relatively
insensitive to the dilution rate. An attempt was also made to increase the chloride to 4 g/L but the
microorganisms were unable to withstand that chloride concentration. Due to the high Fe2+ to Fe3+
conversion rate in all experiments the ferric productivity followed a linear relationship (Figure 7,
Paper VII). The only deviation from linearity was that with less chloride addition, higher dilution
rates were tolerated before the critical dilution rate was reached. The biomass yield increased with
increasing dilution rate (Figure 8, Paper VII), which is also in agreement with Pirt theory.
Surprisingly, the maintenance coefficient was much higher when no chloride was added (Figure 9
and Table IV, Paper VII). The contribution from maintenance activities on the maximum specific
ferrous utilization rate to the overall specific ferrous utilization rate in the experiments with 0 g/L, 2
g/L and 3 g/L chloride was 93%, 24%, and 23% respectively (Figure 10, Paper VII). The calculated
maintenance coefficient based on Pirt theory (Table IV, Paper VII) showed that the introduction of
2-3 g/L chloride to the growth medium in the feed to the bioreactor decreases the maintenance
coefficient by 70% when compared to the experiment without chlorides.
A comparative study of the Fe2+ oxidation capacity for a batch culture growing with 0 g/L and 3 g/L
chloride was modeled using the obtained maximum specific Fe2+ utilization rates. Favorable
conditions were assumed to have adequate supply of Fe2+ and oxygen to ensure maximum growth
rate (Figure 10, Paper VII) and the initial biomass was assumed to be 1 mg in both cases. From the
comparative batch modeling study it was observed that the culture with 3 g/L chloride had the faster
Fe2+ oxidation rate until 20 h of growth. Thereafter 20 h, the culture with 0 g/L chloride dominated
with a faster rate of Fe2+ oxidation (Figure 10, Paper VII). Modeling studies suggested a probability
of inhibition of specific Fe2+ utilization rate due to chloride at lower growth rates, whereas a higher
dilution rates specific ferrous utilization is stimulated (Figure 8, Paper VII). Similarly the effect of
chloride would also be more pronounced at lower substrate level as the growth rate will decrease
with the increment of the chloride concentration at a given residual substrate concentration (Figure
3, Paper VII).
The effects of chloride were observed in both the ferrous oxidation system as can be seen from the
change in μmax and Ks and the growth and maintenance by the change in Ytrue and ms. The toxic
effect to the microorganisms caused by chloride could be due to the following reasons:
overloading of pH mechanisms from proton transport into the cytoplasm (Alexander et al.,
1987; Suzuki et al., 1999)

66
a deleterious effect on the cell membrane eventually leading to cell death as is observed in batch
culture with high NaCl additions (Dew et al., 1997)
increased ionic strength caused by the increased NaCl concentrations imposing an energy load
on the cell due to the osmotic gradient between the cells interior and exterior (Blight and Ralph,
2004; Ojumu et al., 2008).
Earlier studies also state a high permeability of chloride ions into the lipid bilayer in the cell
membrane (Gutknecht and Walter, 1981; Toyoshima and Thompson, 1975); similarly other studies
show a higher permeability of protons over sodium ions (Driessen et al., 1996). The high
permeability of chloride into the cell membrane, results in a loss of inside the cell, developing
an electrostatic potential which to attract protons for restoration of the cell (McLaggan et al.,
1990). The influx of protons into the cell cytoplasm will lead to a low pH, resulting in a reduction
of the pH which might lower the energy required to pump protons out of the cell resulting in a
decrease in the maintenance coefficient.

67
6. CONCLUSION
All the industrial oxidic by-products tested both by chemical and bioleaching showed similar or
better neutralisation potential than the slaked lime reference with the exception of Waste ash and
Coal & Tyres ash which had lower neutralising capacity. EAF and Ladle slag were advantageous
over the other slags due to their disintegrating property, which saves the cost for grinding.
Mesalime from paper and pulp industry was found to be a good neutralising agent as it mainly
contains calcite. EAF dust would be an excellent neutralising agent for bioleaching of zinc
sulphides due to its high zinc content if the chloride content is removed by water washing prior to
its use. Among the ashes, the large amount of metals and the high chloride content in the Waste ash
was responsible for causing toxic effect on the microorganisms, thereby resulting in low
bioleaching efficiency. This innovative approach to use by-products can save the cost for the
generally used limestone in bioleaching and preserve the virgin limestone deposits for future.
Simultaneously, it would also create an alternative approach for the recycling of by-products
together with cost savings for landfilling.
A study on microbial population dynamics showed the sensitivity of Leptospirillum ferriphilum to
change in the bioleaching environment such as for example a sudden decrease in redox potential,
while Sulphobacillus sp. and Acidithiobacillus caldus were found to be robust species as they could
tolerate both the fluctuation in redox potential and exposure to chloride. This study implies the
essence of the care that should be taken while using pure cultures in batch studies, since it could be
a very low populated species in the inoculum or in the concentrate itself, which may be the actual
species responsible for the biooxidation.
Modeling of ferrous iron oxidation by a Leptospirillum ferriphilum dominated chemostat culture
showed that changes in the ionic strength in the working solution may influence the kinetic and
yield parameters. The model proposes a significant decrease in contribution of maintenance
activities to the maximum Fe2+ utilization rate for both high ferrous concentration and incremental
chloride concentration respectively in the feed. The effects of chloride were observed in both the
ferrous oxidation system as can be seen from the change in μmax and Ks and in the growth and
maintenance by the change in Ytrue and ms. The testwork and modeling approach can help future
research and development of both tank and heap bioleaching operations especially in developing
biomining processes in regions lacking process water free from chloride.

68

69
FUTURE WORK
Chemostat study on the effect of chloride with variable cations (e.g. K+, Na+ and Ca2+) on
the ferrous iron oxidation by a Leptospirillum ferriphilum culture.
Study the Influence of chloride on the Fe2+ oxidation by Leptospirillum ferriphilum in a
chemostat at variable pH to investigate the pH dependence on the maintenance activities.
Studies on chloride toxicity with microbial strains important for heap and tank bioleaching
operations.

70
71
REFERENCES
1. D.E. Rawlings, D. Dew and C.D. Plessis (2003), “Biomineralization of metal-containing ores
and concentrates”, Trends in Biotechnology, vol. 21, pp. 38-44.
2. D.E. Rawlings and D.B. Johnson (2007), “The microbiology of biomining: development and
optimization of mineral-oxidizing microbial consortia”, Microbiology, vol. 53, pp. 315–324.
3. C.L. Brierley and A.P. Briggs (2002), “Selection and sizing of biooxidation equipment and
circuits”, In: A.L. Mular, D.N. Halbe, D.J. Barret (Eds) Mineral processing plant design,
practice and control, Society of Mining Engineers, Littleton, Colo., pp. 1540-1568.
4. G.J. Olson, J.A. Brierley and C.L. Brierley (2004), “Bioleaching review part B: Progress in
bioleaching: applications of microbial processes by the minerals industries”, Applied
Microbiology and Biotechnology, vol. 63, pp. 249-257.
5. P.C. van Aswegen, J. van Niekerk and W. Olivier (2007), “The BIOXTM Process for the
Treatment of Refractory Gold Concentrates”, In: Rawlings, D.E., Johnson, D.B., (Eds.),
Biomining, ISBN-10 3-540-34909-X, Springer-Verlag Berlin Heidelberg, New York, pp. 1-33.
6. J. van Niekerk, (2009), “Recent advances in the BIOX® technology”, Advanced Materials
Research, Vol. 71-73, pp. 465-468.
7. China’s first bacterial oxidation plant (2004) Interfax information services, Interfax china,
china metals, reports weekly, Interfax china limited, China business news, pp 1-7, Available
from http://www.michelago.com/press/docs/200704_interfax.pdf
8. P. Miller, F. Jiao and J. Wang (2004), “The bacterial oxidation (BACOX) plant at Liazhou,
Shandong province, China-The first three years of operation”, Bac-Min Conference, November
8-10, Bendigo, Australia, pp. 1-9.
9. W.H. Dresher (2004), “Producing copper nature’s way: Bioleaching”, CWD: INNOVATIONS,
May issue, pp. 10.
10. S. Shi, Z. Fang and J. Ni (2005), “Bioleaching of marmatite flotation concentrate with a
moderately thermoacidophilic iron-oxidizing bacterial strain”, Minerals Engineering, vol. 18,
pp. 1127–1129.
11. H. Deveci, A. Akcil and I. Alp (2004), “Bioleaching of complex zinc sulphides using
mesophilic and thermophilic bacteria: comparative importance of pH and iron”,
Hydrometallurgy, vol. 73, pp. 293–303.

72
12. C.K. Pani, S. Swain, R.N. Kar, G.R. Chaudhury, L.B. Sukla and V.N. Misra (2003), “Bio-
dissolution of zinc sulfide concentrate in 160 l 4-stage continuous bioreactor”, Minerals
Engineering, vol. 16, pp. 1019–1021.
13. Y. Rodríguez, A. Ballester, M. L. Blázquez, F. González and J. A. Muñoz (2003), “New
information on the sphalerite bioleaching mechanism at low and high temperature”,
Hydrometallurgy, vol. 71, pp. 57-66.
14. Å. Sandström and S. Petersson (1997), “Bioleaching of a complex sulphide ore with moderate
thermophilic and extreme thermophilic microorganisms”, Hydrometallurgy, vol. 46, pp. 181–
190.
15. O. Garcia Jr, J.M. Bigham and O.H. Tuovinen (1995), “Sphalerite oxidation by Thiobacillus
ferrooxidans and Thiobacillus thiooxidans”, Canadian Journal of Microbiology, vol. 41, pp.
578–584.
16. S.S. Bang, S.S. Deshpande and K.N. Han (1995), “The oxidation of galena using
Thiobacillus ferrooxidans”, Hydrometallurgy, vol. 37, pp. 181–192.
17. G.R. Chaudhury and R.P. Das (1987), “Bacterial leaching complex sulfides of copper, lead
and zinc”, International Journal of Mineral Processing, vol. 21, pp. 57–64.
18. Å. Sandström, J.E. Sundkvist and S. Petersson (1997), “Bio - oxidation of a complex zinc
sulphide ore: A study performed in continuous bench-and pilot scale”, in Proceedings of
Australian Mineral Foundation Conference, Biomine-97, Glenside, Australia, pp. M1.1.1-
M1.1.11.
19. M.L. Steemson, G.J. Sheehan, D.A. Winborne and F.S. Wong (1994), “An integrated
bioleach/solvent extraction process for zinc metal production form zinc concentrates”, PCT
World Patent, WO 94/28184, May 24.
20. E.B. Lindström, Å. Sandström and J.E. Sundkvist (2003), “A sequential two-step process
using moderately and extremely thermophilic cultures for biooxidation of refractory gold
concentrates”, Hydrometallurgy, vol. 71, pp. 21-30.
21. X. Liu, S. Petersson and Å. Sandström (1993), “Evaluation of process variables in bench-
scale biooxidation of the Olympias concentrate”, FEMS Microbiology Reviews, vol. 11, pp.
207-214.
22. F. Reith, S.L. Rogers, D.C. McPhail and J. Brugger (2007), “Potential for the utilisation of
micro-organisms in gold processing”, In: J. Avraamides, G. Deschenes, D. Tucker (Eds.),

73
World Gold 2007 by and co-products and the environment, ISBN-9781920806743,
Australasian Institute of Mining and Metallurgy, World Gold 2007, Cairns, Australia, pp. 1-8.
23. J. Brierley and C. Brierley (2001), “Present and future commercial applications of
biohydrometallurgy”, Hydrometallurgy, Vol. 59 pp. 233–239.
24. D.J. Readett (2001), “Biotechnology in the mining industry, Straits Resources Limited and the
Industrial Practice of Copper Bioleaching in Heaps”, Australasian Biotechnology, vol. 11, pp.
30-31.
25. S. Bustos, S. Castro and R. Montealegre (1993), “The Sociedad Minera Pudahuel bacterial
thin-layer leaching process at Lo Aguirre”, FEMS Microbiology Reviews, Vol. 11, pp. 231–
236.
26. www.talvivaara.com
27. D.W. Dew, E.N. Lawson and J.L. Broadhurst (1997), The BIOX@ process for biooxidation
of gold bearing concentrates, In: D.E. Rawlings (Ed.), Biomining, Springer, Berlin, Heidelberg,
New York, pp. 45–80.
28. P.R. Norris (2007), Acidophile diversity in mineral sulfide oxidation, In: D.E. Rawlings, D.B.
Johnson (Eds.), Biomining, Springer-Verlag, Berlin, Heidelberg, New York, pp. 199–212.
29. J.E. Sundkvist, C.S. Gahan and Å. Sandström (2008), “Modeling of ferrous iron oxidation
by Leptospirillum ferrooxidans-dominated chemostat culture”, Biotechnology and
Bioengineering, vol. 99, pp. 378–389.
30. J.J. Plumb, R.B. Hawkes and P.D. Franzmann (2007), “The microbiology of moderately
thermophilic and transiently thermophilic ore heaps”, In: D.E. Rawlings, D.B. Johnson (Eds.),
Biomining, Springer-Verlag, Berlin, Heidelberg, New York, pp. 217–235.
31. N. Okibe, M. Gericke, K.B. Hallberg and D.B. Johnson (2003), Enumeration and
characterisation of acidophilic microorganisms isolated from a pilot plant stirred-tank
biooxidation operation, Appl. Environ. Microbiol., vol. 69, pp. 1936–1943.
32. T. Rohwerder, T. Gehrke, K. Kinzler and W. Sand (2003), “Bioleaching review part A:
Progress in bioleaching: fundamentals and mechanisms of bacterial metal sulfide oxidation”,
Applied Microbiology and Biotechnology, vol. 63, pp. 239–248.
33. D.E. Rawlings, H. Tributsch and G.S. Hansford (1999), “Reasons why ‘Leptospirillum’-like
species rather than Thiobacillus ferrooxidans are the dominant iron-oxidizing bacteria in many

74
commercial processes for the biooxidation of pyrite and related ores”, Microbiology, vol. 145,
pp. 5-13.
34. A. Schippers and W. Sand (1999), “Bacterial Leaching of Metal Sulfides Proceeds by Two
Indirect Mechanisms via Thiosulfate or via Polysulfides and Sulfur”, Applied and
Environmental Microbiology, vol. 65, pp. 319–321.
35. P.C. van Aswegen, M.W. Godfrey, D.M. Miller and A.K. Haines (1991), “Developments and
innovations in bacterial oxidation of refractory ores”, Miner. Metallurg. Process, vol. 8,
pp.188–191.
36. M.E.L. Arrascue and J. van Niekerk (2006), “Biooxidation of arsenopyrite concentrate using
BIOX® process: Industrial experience in Tamboraque, Peru”, Hydrometallurgy, vol. 83, pp. 90-
96.
37. D.W. Dew (1995), “Comparison of performance for continuous bio-oxidation of refractory gold
ore flotation concentrates”, In: T. Vargas, C.A. Jerez, J.V. Wiertz and H. Toledo (Eds.),
Proceedings of International Biohydrometallurgy Symposium IBS-95. Vina del Mar, Chile,
November 19-22, ISBN 956-19-0209-5, vol. 1, pp. 239-251.
38. K.R. Chetty, H.J. Marais and M.J. Kruger (2000), “The importance of pH control in the
biooxidation process” In: Proceedings of the colloquium bacterial oxidation for the recovery of
metals, Johannesburg, pp.1-12.
39. C.S. Gahan (2008), “Comparative study on different industrial oxidic by-products as
neutralising agent in bioleaching”, Licentiate Thesis. Luleå University of Technology. ISSN:
1402-1757 / ISRN LTU-LIC--08/19--SE / NR 2008:19.
40. C.S. Gahan, M.L. Cunha and Å. Sandström (2008), “Study on the possibilities to use ashes,
EAF dust and lime sludge as neutralizing agent in biooxidation”, The Open Mineral Processing
Journal, vol. 1, pp. 26–36.
41. M.L. Cunha, C.S. Gahan, N. Menad and Å. Sandström (2008a), “Possibilities to use oxidic
by-products for precipitation of Fe/As from leaching solutions for subsequent base metal
recovery”, Minerals Engineering, vol. 21, pp. 38–47.
42. C.S. Gahan, M.L. Cunha and Å. Sandström (2009a), “Comparative study on different steel
slags as neutralising agent in bioleaching”, Hydrometallurgy, vol. 95, pp. 190-197.

75
43. D. Stephenson and R. Kelson (1997), “Wiluna BIOX Plant - Expansion and New
Developments”, Conference proceedings of IBS-BIOMINE '97, August 4-6, Sydney, Australia,
pp. M4.1.1-M4.1.8.
44. F. Cadena and T.L. Kirk (1995), “Arsenate precipitation using ferric iron in acidic
conditions”, New Mexico Water Resource Research Institute Technical Completion Report No.
293, New Mexico State University, Las Cruces, NM.
45. J.L. Broadhurst (1994), “Neutralisation of arsenic bearing BIOX® liquors”, Minerals
Engineering, vol. 7, pp. 1029-1038.
46. R.P. Hackl and L. Jones (1997), “Bacterial sulfur oxidation pathways and their effect on the
cyanidation characteristics of biooxidized refractory gold concentrates”, In: Biomine 97,
International Biohydrometallurgy Symposium IBS-97, Biotechnology Comes of Age, Australian
Mineral Foundation, ISBN- 0-908039-66-2, Sydney, Australia, pp. M14.2.1–M14.2.10.
47. V.J. Shrader and S.X. Su (1997), “Factors affecting elemental sulfur formation in biooxidized
samples: Preliminay studies”, In: Biomine 97, International Biohydrometallurgy Symposium
IBS-97, Biotechnology Comes of Age, Australian Mineral Foundation, ISBN- 0-908039-66-2,
Sydney, Australia, pp. M3.3.1-M3.3.10.
48. E.N. Lawson (1997), “The composition of mixed populations of leaching bacteria active in
gold and nickel recovery from sulphide ores”, In: Biomine 97, International
Biohydrometallurgy Symposium IBS-97, Biotechnology Comes of Age, Australian Mineral
Foundation, ISBN- 0-908039-66-2, Sydney, Australia, pp. QP4.1–QP4.10.
49. E.B. Lindström, Å. Sandström and J.E. Sundkvist, (2002) “Two-stage bioleaching of
sulphidic material containing arsenic”. United States Patent, Patent No. US 6,461,577 B1.
50. E.B. Lindström, Å. Sandström and J.E. Sundkvist (2003), “A sequential two-step process
using moderately and extremely thermophilic cultures for biooxidation of refractory gold
concentrates”, Hydrometallurgy, vol. 71, pp. 21-30
51. P.C. van Aswegen and J. van Niekerk (2004), “New developments in the bacterial oxidation
technology to enhance the efficiency of the BIOX process”, In: Proceedings of Bac-Min
Conference, Bendigo, Victoria, Australia, pp. 181–189.
52. P.C. van Aswegen and H.J. Marais (1999), “Advances in application of the BIOX® process
for the refractory gold ores” Minerals and Metallurgical Processing, vol. 16, pp. 61-68.

76
53. H. Marais, “The geologist guide to the BIOX® process”. Available from
http://www.bioxgf.co.za/content/publications/pdfs/THE%20GEOLOGISTS%20GUIDE%20TO
%20THE%20BIOX%20PROCESS.pdf
54. M.L. Cunha, C.S. Gahan, N. Menad and Å. Sandström (2008b), “Leaching Behaviour of
Industrial Oxidic By-Products: Possibilities to Use as Neutralisation Agent in Bioleaching”,
Materials Science Forum, vol. 587-588, pp. 748-752.
55. The European Slag Association (EUROSLAG) (2006), Legal status of slags. Position paper,
Available in http://www.euroslag.org/media/Position_paper_Jan_2006.pdf, March 2006.
56. F. Engström (2007), “Mineralogical influence of different cooling conditions on leaching
behaviour of steel making slags”, Licentiate Thesis, Luleå University of Technology, ISSN:
1402-1757 / ISRN LTU-LIC--07/58--SE / NR 2007:58.
57. R.S. Hedin and G.R. Watzlaf (1994), “Passive treatement of acid mine drainage with
limestone”, Journal of Environment Quality, vol. 23, pp. 1338-1345.
58. P. Ziemkiewicz (1998), “Steel slag: Applications for AMD control”, Proceedings of the
conference on Hazardous Waste Research, pp. 44-62.
59. J. Gutknecht and A. Walter (1981), “Hydrofluoric and nitric acid transport through lipid
bilayer membranes”, Biochimica Biophysica Acta (BBA) — Biomembranes, vol. 644, pp. 153–
156.
60. L.D. Pettit and K.J. Powell (2001), “SC-database for Windows”, Academic Software version
5.4. Sourby Old Farm, Timble, Otley, Yorks, UK.
61. J.E. Sundkvist, Å. Sandström, L. Gunneriusson and E.B. Lindström (2005), “Fluorine
toxicity in bioleaching systems”, Proceedings of the XVI International Biohydrometallurgy
Symposium, ISBN: 1-920051-17-1, pp. 19-28.
62. J.A. Brierley and M.C. Kuhn (2009), “From Laboratory to application heap bioleach or not”,
Advanced Materials Research, Vol. 71-73, pp. 311-317.
63. C. Ribbing (2007), “Environmentally friendly use of non-coal ashes in Sweden”, Waste
Management, vol. 27, pp. 1428-1435.
64. G. Tham and K. Ifwer (2006), “Utilization of ashes as construction materials in landfills”.
Värmeforsk report 966, March 2006 (in Swedish).
65. I. Demir, R.E. Hughes and P.J. DeMaris (2001), “Formation and use of Coal combustion
residues from three types of power plants burning Illinois coals”, Fuel, vol. 80, pp.1659-1673.

77
66. R.O. Hallberg, J.R. Granhagen and A. Liljemark (2005), “A fly ash/biosludge dry cover for
the mitigation of AMD at the falun mine”, Chemie der Erde, vol. 65, pp. 43–63.
67. U.S. E.P.A. SW 846, method 1311; Title 40-261.24 of the Code of Federal Regulation, in
Federal Register, vol. 51, , pp. 21648-21693, June (1986).
68. T. Havlík, B. Vidor e Souza, A. M. Bernardes, I.A.H. Schneider and A. Miškufová (2006),
“Hydrometallurgical processing of carbon steel EAF dust”, Journal of Hazardous Materials,
vol. 135, pp. 311-318.
69. W.J. Bruckard, K.J. Davey, T. Rodopoulos, J.T. Woodcock and J. Italiano (2005), “Water
leaching and magnetic separation for decreasing the chloride level and upgrading the zinc
content of EAF steelmaking baghouse dusts”, International Journal of Mineral Processing,
vol. 75, pp. 1-20.
70. N. Leclerc, E. Meux and J.M. Lecuire (2002), “Hydrometallurgical recovery of zinc and lead
from electric arc furnace dust using mononitrilotriacetate anion and hexahydrated ferric
chloride”, Journal of Hazardous Materials, vol. 91, pp. 257–270.
71. M. Cruells, A. Roca and C. Núñez (1992), “Electric arc furnace flue dusts: characterization
and leaching with sulphuric acid”, Hydrometallurgy, vol. 31, pp. 213-231.
72. P.C. Sweet (1986), “Virginia's lime industry”, Quarterly Journal of Virginia division of mineral
resources, Charlottesville, Virginia, ISSN 0042-6652, vol. 32, pp.33-43.
73. F.K. Crundwell (2003), “How do bacteria interact with minerals?”, Hydrometallurgy, vol. 71,
pp. 75–81.
74. J.R. Budden and P.A. Spencer (1991), “The effect of temperature and water quality on
bacterial oxidation: the advantages of a moderately thermophilic culture over conventional
Thiobacillus cultures”, In: Randol Gold Forum, pp. 271–274.
75. T. Weston, J. Perkins, I. Ritchie and H. Marais (1994), “Concentrate biooxidation in a
hypersaline environment for Knowna Belle”, Biomine’94, In: International Conference and
Workshop Applications of Biotechnology to the Minerals Industry, Australian Mineral
Foundation, Perth, WA.
76. H. Deveci, M.A. Jordan, N. Powell and I. Alp (2008), “Effect of salinity and acidity on
biooxidation activity of mesophilic and extremely thermophilic bacteria”, Trans. Nonferrous
Met. Soc. China., vol. 18, pp. 714–721.

78
77. D.W. Shiers, K.R. Blight and D.E. Ralph (2005), “Sodium sulphate and sodium chloride
effects on batch culture of iron oxidising bacteria”, Hydrometallurgy, vol. 80, pp. 75–82.
78. E.N. Lawson, C.J. Nicholas and H. Pellat (1995), “The toxic effects of chloride ions on
Thiobacillus ferrooxidans”, In: T. Vargas, C.A. Jerez, J.V. Wiertz, H. Toledo (Eds.),
Biohydrometallurgy Processing, University of Chile.
79. O.H. Tuovinen, S.I. Niemela and H.G. Gyllenberg (1971), “Effect of mineral nutrients and
organic substances on the development of Thiobacillus ferrooxidans”, Biotechnology and
Bioengineering, vol. 13, pp. 517–527.
80. K.R. Blight and D.E. Ralph (2004), “Effect of ionic strength on iron oxidation with batch
cultures of chemolithotrophic bacteria”, Hydrometallurgy, vol. 73, pp. 325–334.
81. B.J.Y. Leong, D.B. Dreisinger, M. Lo, R.M.R. Branion, R.P. Hackl, L.S. Gormerly and
D.R. Crombie (1993), “The microbiological leaching of a sulphidic copper ore in a strongly
saline medium (I): shake flask and column studies”, In: A.E. Torma, J.E. Wey, V.I.
Lakshmanan (Eds.), Biohydrometallurgical Technologies, Proc. of Int. Biohydrometallurgy
Symp., TMS, Warrendale, PA, vol. 1, pp. 117–126.
82. H. Huber and K.O. Stetter (1989), “Thiobacillus prosperous sp. nov., represents a new group
of halotolerant metal-mobilising bacteria isolated from marine geothermal field”, Arch.
Microbiol., vol. 151, pp. 479–485.
83. P.R. Norris and S. Simmons (2004), “Pyrite oxidation of halotolerant, acidophilic bacteria”,
In: M. Tsezos, A. Hatzikioseyian, E. Remoundaki (Eds.), Biohydrometallurgy: A Sustainable
Technology in Evolution, Part II, National Technical University, Athens, pp. 1347–1351.
84. C.S. Davis-Belmar, J.L.C. Nicolle and P.R. Norris (2008), “Ferrous iron oxidation and
leaching of copper ore with halotolerant bacteria in ore columns”, Hydrometallurgy, vol. 94, pp.
144–147.
85. A.G. Crane and P.J. Holden (1999), “Leaching of harbour sediments by estuarine iron
oxidising bacteria”, In: R. Amils, A. Ballester (Eds.), Biohydrometallurgy and the Environment
towards the Minning of the 21st Century. Part A, Elsevier, Amsterdam, pp. 229–238.
86. P.J. Holden, L.J. Foster, B.A. Neilan, G. Berra and Q.M. Vu (2001), “Characterisation of
novel salt tolerant iron oxidising bacteria”, In: V.S.T. Ciminelli, O. Garcia Jr. (Eds.),
Biohydrometallurgy: Fundamentals Technology and Sustainable Development, Part A,
Elsevier, Amsterdam, pp. 283–290.

79
87. M. Nemati, S.T.L. Harrison, G.S. Hansford and C. Webb (1998), “Biological oxidation of
ferrous sulphate by Thiobacillus ferrooxidans: a review on the kinetic aspects”, Biochemical
Engineering Journal, Vol. 1, pp. 171-190.
88. T.V. Ojumu, J. Petersen, G.E. Searby and G.S. Hansford (2006), “A review of rate
equations proposed for microbial ferrous iron oxidation with a view to application to heap
bioleaching”, Hydrometallurgy, vol. 83, pp. 21–28.
89. J. Gao, J. Xie, J. Ding, J. Kang, H. Cheng and G. Qiue, (2006) “Extraction and purification
of magnetic nanoparticles from strain of Leptospirillum ferriphilum.” Trans Nonferrous Met
Soc China. Vol. 16, pp. 1417-1420.
90. Y. Uno, T. Kaneeda and S. Yokomizo (1998) “Micromachining of metals using
microorganism”, Materia, Vol. 37, pp. 52–54.
91. K. Lilova, D. Karamanev, R.L. Flemming and T. Karamaneva (2007) “Biological
Oxidation of Metallic Copper by Acidithiobacillus ferrooxidans” Biotechnology and
Bioengineering, Vol. 97, pp. 308-316.
92. L. Svirko, I. Bashtan-Kandybovich and D. Karamanev (2009), “Experimental study of
ferrous iron biooxidation by Leptospirillum ferriphilum in different biofilm reactors”,
Advanced Materials Research, Vol. 71-73, pp. 263-266.
93. M. Bastias and J.C. Gentina (2009), “Effect of the energy and carbon source limitations and
ferric inhibition on metabolic parameters of Leptospirillum ferrooxidans growing in
chemostat”, Advanced Materials Research, Vol. 71-73, pp. 267-270.
94. O. Garcia Jr and L.L. da Silva (1991) “Differences in growth and iron oxidation among
Thiobacillus ferrooxidans cultures in the presence of some toxic metals”, Biotechnology
Letters, Vol. 13, pp. 567-570.
95. M. Wang, Y. Zhang, T. Deng and K. Wang (2004) “Kinetic modeling for the bacterial
leaching of chalcopyrite catalyzed by silver ions”, Minerals Engineering, Vol. 17, pp. 943-947.
96. G. Rossi (1990), Biohydrometallurgy, Mc Graw Hill.
97. S.J. Pirt (1975), “Principles of microbe and cell cultivation”, Oxford: Blackwell Scientific
Publications.
98. M.P. Silverman and D.G. Lundgren (1959), “Studies on the chemoautotrophic iron bacterium
Ferrobacillus ferrooxidans I. An improved medium and a harvesting procedure for securing
high cell yields”, J. Bacteriol., vol. 77, pp. 642–647.

80
99. M.M. Bradford (1976), “A rapid and sensitive method for the quantitation of microgram
quantities of protein utilizing the principle of protein-dye binding”, Anal. Biochem., vol. 72, pp.
248–254.
100.A.D. Dayan and A.J. Paine (2001), “Mechanisms of chromium toxicity, carcinogenicity and
allergenicity: Review of the literature from 1985 to 2000”, Human & Experimental Toxicology,
vol. 20, pp. 439 –451.
101.P. Russo, A. Catassi, A. Cesario, A. Imperatori, N. Rotolo, M. Fini, P. Granone and L.
Dominioni (2005), “Molecular Mechanisms of Hexavalent Chromium–Induced Apoptosis in
Human Bronchoalveolar Cells”, American Journal of Respiratory Cell and Molecular Biology,
vol. 33, pp. 589–600.
102.J. S. Han and T. J. O'keefe (1992), “The degradation of aluminium cathodes by fluoride ion
during zinc electrowinning”, Journal of Applied Electrochemistry, vol. 22, pp. 606-612.
103.A. Frank, A. Madej, V. Galgan and L.R. Petersson (1996), “Vanadium poisoning of cattle
with basic slag. Concentrations in tissues from poisoned animals and from a reference,
slaughter-house material”, Science of the total environment., Elsevier Science, Shannon,
Irlande, ISSN 0048-9697, vol. 181, pp. 73-92.
104.J.E. Dutrizac (1983), “Factors affecting alkali jarosite precipitation”, Metall. Trans. B, vol. 14,
pp. 531–539.
105.H.R. Watling (2006), “The bioleaching of sulphide minerals with emphasis on copper
sulphides—a review”, Hydrometallurgy, vol. 84, pp. 81–108.
106.P.M. Doran (1995), Bioprocess engineering principles. London: Academic Press, Harcourt
Brace & Company, Publishers.
107.M. Boon, T.A. Meeder, C. Thöne, C. Ras and J.J. Heijnen (1999b), “The ferrous iron
oxidation kinetics of Thiobacillus ferrooxidans in continuous cultures”, Appl. Microbiol.
Biotechnol., vol. 51, pp.820–826.
108.N.J. Welham, K.A. Malatt and S. Vukcevic (2000), “The effect of solution speciation on
iron–sulphur–arsenic–chloride systems at 298 K”, Hydrometallurgy, vol. 57, pp. 209–223.
109.P. van Bodegom, (2007), “Microbial Maintenance: A Critical Review on Its Quantification”,
Microbial Ecolog, Vol. 53, pp. 513-523.

81
110.B. Alexander, S. Leach and W.J. Ingledew, (1987), “The relationship between chemiosmotic
parameters and sensitivity to anions and organic acids in the acidophile Thiobacillus
ferrooxidans”, J Gen Microbiol, Vol. 133, pp. 1171-1179.
111.I. Suzuki, D. Lee, B. Mackay, L. Harahuc and J.K. Oh, (1999), “Effect of various ions, pH,
and osmotic pressure on oxidation of elemental sulfur by Thiobacillus thiooxidans”, Appl
Environ Microbiol, Vol. 65, pp. 5163-5168.
112.D.W. Dew, E.N. Lawson and J.L. Broadhurst, (1997), “The BIOX@ process for biooxidation
of gold bearing concentrates” In: Rawlings DE, editor. Biomining: Theory, Microbes and
Industrial Processes. New York: Springer-Verlag, pp. 45-80.
113.T.V. Ojumu, J. Peterson and G.S. Hansford, (2008), “The effect of dissolved cations on
microbial ferrous-iron oxidation by Leptospirillum ferriphilum in continuous culture”,
Hydrometallurgy, Vol. 94, pp. 69-76.
114.D. McLaggan, M. Keyhan and A. Matin, (1990), “Chloride Transport Pathways and Their
Bioenergetic Implications in the Obligate Acidophile Bacillus coagulans”, J Bacteriol, Vol.
177, pp. 1485-1490.
115.Y. Toyoshima and T.E. Thompson, (1975), “Chloride flux in the bilayer membranes: chloride
permeability in aqueous dispersions of single walled, bilayer vesicles”, Biochemistry, Vol. 14,
pp. 1518-1524.
116.A. J. M. Driessen, J. L.C. M. van de Vossenberg and W.N. Konings (1996) “Membrane
composition and ion-permeability in extremophiles” FEMS Microbiology Reviews, Vol. 18, pp.
139-148.
117.M. Dopson, E.B. Lindstrom and K.B. Hallberg, (2002), “ATP generation during reduced
inorganic sulfur compound oxidation by Acidithiobacillus caldus is exclusively due to electron
transport phosphorylation”, Extremophiles, Vol. 6, pp. 123-129.


PAPER I
Leaching Behaviour of Industrial Oxidic By-products: Possibilities to Use as
Neutralisation Agent in Bioleaching
M.L. Cunha, C.S. Gahan, N. Menad and Å. Sandström
Materials Science Forum, vol. 587-588, pp. 748-752, 2008


Materials Science Forum Vols. 587-588 (2008) pp 748-752online at http://www.scientific.net© (2008) Trans Tech Publications, SwitzerlandOnline available since 2008/Jun/17
All rights reserved. No part of contents of this paper may be reproduced or transmitted in any form or by any means without the written permission of thepublisher: Trans Tech Publications Ltd, Switzerland, www.ttp.net. (ID: 130.240.59.50-07/09/08,20:23:49)

Materials Science Forum Vols. 587-588 749

750 Advanced Materials Forum IV

Materials Science Forum Vols. 587-588 751
752 Advanced Materials Forum IV


PAPER II
Comparative study on different steel slags as neutralising agent in bioleaching.
C.S. Gahan, M.L. Cunha, Å. Sandström
Hydrometallurgy, vol. 95(3-4), pp. 190-197, 2009


Comparative study on different steel slags as neutralising agent in bioleaching
Chandra Sekhar Gahan a, Maria Lucelinda Cunha b, Åke Sandström a,⁎a Division of Process Metallurgy, Luleå University of Technology, SE-971 87 Luleå, Swedenb Dep. Ciência dos Materiais/CENIMAT, FCT/UNL, 2829-516 Caparica, Portugal
A B S T R A C TA R T I C L E I N F O
Article history:Received 10 April 2008Received in revised form 26 May 2008Accepted 27 May 2008Available online 3 June 2009
Keywords:BacteriaSteel slagPyriteNeutralisationBioleaching
A comparative study on bioleaching of a pyrite concentrate using five different steel slags as neutralising agenthas been performed with reference to a commercial grade slaked lime. The acid produced during oxidation ofpyrite was neutralised by regular additions of neutralising agent to maintain a pH of 1.5. Bioleaching wasconducted as batch in 1-L reactorswith amixedmesophilic culture at a temperature of 35 °C. The different steelslags used were Argon Oxygen Decarbonisation (AOD) slag, Basic Oxygen Furnace (BOF) slag, Electric ArcFurnace (EAF) slag, Composition Adjustment by Sealed Argon Bubbling–Oxygen Blowing (CAS–OB) slag andLadle slag, representing slags produced in both integrated steel plants and scrap based steel plants. The aim ofthe study was to investigate the possibility to replace normally used lime or limestone with steel slags,considering their neutralising capacity and eventual toxic effects on the bacterial activity.The bioleaching efficiencywas found to be equally good or better, when steel slagswere used for neutralisationinstead of slaked lime and the extent of pyrite oxidation of pyrite was in the range 75–80%. Some of the slagsused contained potentially toxic elements for the bacteria, like fluoride, chromium and vanadium, but nonegative effect of these elements could be observed on the bacterial activity. However, slags originating fromstainless steel production are less environmentally friendly due to the presence of chromium. The neutralisingpotential of the slagswas high, as determined by the amount needed for neutralisation during bioleaching. Therange of additions of neutralising agents required to control the pH at 1.5 for all the experiments ranged from16–27 g, while 22 g was needed in the experiment with slaked lime.Hence, it was concluded that considerable savings in operational costs could be obtained by replacement oflime or limestone with steel slag, without negative impact on bioleaching efficiency. Recycling of steel slagswould render an eco-friendly process and provide a means for sustainable use of natural resources.
© 2008 Elsevier B.V. All rights reserved.
1. Introduction
Stirred tank biooxidation of refractory gold concentrates utilisingmesophilic microorganisms is one of the processes successfullycommercialised today. Mineral decomposition in temperature andoxygen controlled stirred tank reactors normally takes 5 days in contrastto heap bioleaching of secondary copper sulphides, which takesmonthsor even years. Stirred tank bioleaching is the most effective bioleachingprocess though it is restricted to high value minerals due to its limi-tations on solid concentration and higher process costs (Rawlings et al.,2003). Approximately ten operational units have successfully estab-lished stirred tank reactor biooxidation using Gold field's proprietaryBIOX® process for commercial application with three more plantsupcoming in the near future (van Aswegen et al., 2007).
The mineral dissolution process in bioleaching follows either thepolysulphide or thiosulphate pathway (Schippers and Sand, 1999;Tributsch, 2001;Sandet al., 2001;Rohwerder et al., 2003;Rawlings et al.,2003). The thiosulphate mechanism applies to acid insoluble disul-
phides like FeS2 andMoS2,while thepolysulphidemechanismapplies toacid soluble sulphides like ZnS, CuFeS2, NiS etc. The present study dealswith bioleaching of pyrite following the thiosulphate pathway inwhich,Fe3+ ions attacks the FeS2, producing thiosulphate and ferrous iron asintermediate products (Eq. (1)). The ferrous iron is then oxidised to ferriciron by the ironoxidisingmicroorganisms (Eq. (2)),while thiosulphate isoxidised by Fe3+ ions to produce sulphate (Eq. (3)).
FeS2 þ 6Fe3þ þ 3H2O→7Fe2þ þ S2O2−3 þ 6Hþ ð1Þ
Fe2þ þ 1=4O2 þ Hþ→Fe3þ þ 1=2H2O ð2Þ
S2O2−3 þ 8Fe3þ þ 5H2O→2SO2−
4 þ 8Fe2þ þ 10Hþ ð3Þ
The thiosulphate can alternatively also be oxidised into sulphate bysulphur oxidising microorganisms. The overall reaction based on theprimary oxidant is given in Eq. (4).
FeS2 þ 7=2O2 þ H2O→Fe2þ þ 2SO2−4 þ 2Hþ ð4Þ
From the equations given above it is seen that bioleaching of pyrite is anacid producing process and further acid is produced due to the
Hydrometallurgy 95 (2009) 190–197
⁎ Corresponding author. Tel.: +46 920 491290; fax: +46 920 491199.E-mail address: [email protected] (Å. Sandström).
0304-386X/$ – see front matter © 2008 Elsevier B.V. All rights reserved.doi:10.1016/j.hydromet.2008.05.042
Contents lists available at ScienceDirect
Hydrometallurgy
j ourna l homepage: www.e lsev ie r.com/ locate /hydromet

hydrolysis of ferric iron. The microorganisms used in bioleaching pro-cesses are chemolithotrophic andacidophilic havingoptimumactivityata pH around 1.5, therefore, depending on the reactor configuration,addition of neutralising agents is required to maintain the desired pH.
Neutralisation of the acid produced during bioleaching of sulphideminerals is generally practised using limestone. In a bioleachingprocess, neutralisation is required at different stages (Fig. 1). Primaryneutralisation to pH~1.5 using limestone during the bioleachingprocess, secondary neutralisation to pH 3–4 using lime/limestone forprecipitation of iron and arsenic, and finally to pH 7–8 for effluentneutralisation by lime (Fig. 1). Controlling pH at a proper level isimportant to the operation efficiency in bioleaching processes andgenerally, a pH range of 1.0–2.0 is maintained. Operating a bioleachingprocess at a pH above 1.85 may cause excessive iron precipitation asjarosite, while operation at a pH below 1.0 may result in foamformation, as observed at the BIOX® process at Fairview and Wiluna
(Dew, 1995; Chetty et al., 2000). Neutralisation of the ferric iron (Fe3+)and arsenate (AsO43−) containing leachate at a pH of 3–4 with limestoneor slaked lime precipitates arsenic as a ferric arsenate (FeAsO4)(Stephenson and Kelson, 1997). The ferric arsenate obtained is stableand environmentally acceptable according to the US EPA (EnvironmentProtection Agency) TCLP testing procedure (Cadena and Kirk, 1995;Broadhurst,1994). Studies on the possibilities to use oxidic by-products,like steel slags, for precipitation of Fe/As at pH 3 in comparison to slakedlime proved promising, due to the presence of high concentrations ofoxides and silicates in those materials (Cunha et al., 2008).
The cost for neutralisation is normally the second largest operationcost in BIOX® plants and the limestone cost is directly proportional tothe distance between the deposit and the operation plant (vanAswegen and Marais, 1999). Therefore, to save operation costs it isimportant to find substitutes such as dolomite, ankerite or calcrete (alow-grade limestone) deposits located close to the plant.
Fig. 1. Example of a process for base metal production with points of neutralisation highlighted.
Table 1Elemental composition of the pyrite concentrate
Material Composition (%)
Pyrite concentrate Si Al Ca Fe K Mg Mn Na S Ba Cu Cr Mo Zn12.9 4.5 1.9 25.7 2.3 0.7 0.2 0.7 23.9 0.6 0.2 0.01 0.01 0.01
Table 2Elemental composition of the neutralising agents
Neutralising agents Si(%)
Al(%)
Ca(%)
Fe(%)
K(%)
Mg(%)
Mn(%)
Na(%)
S(%)
Ba(mg/kg)
Cr(mg/kg)
Mo(mg/kg)
Pb(mg/kg)
V(mg/kg)
Zn(mg/kg)
F(mg/kg)
Cl(mg/kg)
Ca(OH)2 0.1 0.0 53.6 0.0 0.1 0.4 0.0 b0.004 0.02 b2 b10.0 b6.0 1.9 b2.0 27.3 30.9 1047AOD slag 12.9 2.5 37.5 1.6 0.1 3.7 0.7 0.09 0.12 101 13,100 232 19.4 205 251 23,600 695Ladle slag 5.9 13.4 29.9 2.4 0.1 8.6 0.2 0.04 0.34 85.1 2350 174 16.3 347 476 5273 1738EAF slag 7.0 3.0 31.2 19.8 0.1 1.9 2.3 0.13 0.06 243 2200 11.5 2.9 227 91.9 63.1 1617BOF slag 3.9 0.7 28.2 18.9 b0.1 7.3 2.9 b0.04 0.09 66.1 1500 b6.0 10.5 25,100 90.8 97.0 883CAS–OB slag 3.4 18.7 17.0 12.7 0.1 2.7 8.2 0.05 0.03 41.3 2930 b6.0 6.8 5060 112 119 1205
191C.S. Gahan et al. / Hydrometallurgy 95 (2009) 190–197

European steel making industries are producing large amounts ofsteel slag every year. The total amount of steel slag generated in 2004was about 15 million tonnes, of which 62% was Basic Oxygen Furnaceslag, 29% Electric Arc Furnace slag and 9% secondary metallurgical slag.Concerning the use of these slags, 45% is used for road construction,17%for interim storage, 14% for internal recycling, 11% for landfill, 6% forothers, 3% for fertilizer, 3% for hydraulic engineering and 1% for cementproduction (EUROSLAG, 2006). Trials have been conducted for alter-native applications to reduce the 11% of the steel slag currentlylandfilled. The use of steel slag as neutralising agent is expected to beviable due to its high alkalinity, immediate availability and lower cost incomparison to limestone. Comparative cost studies on limestone withdifferent neutralising agents conducted by Hedin and Watzlaf (1994)state that the cost of limestonewas one-third the cost of slaked lime. Assteel slag ismuch cheaper than limestone, its use as a neutralising agentcould therefore be a benefit for the process cost-efficiency. Replacementof lime for steel slag in acid mine drainage (AMD) treatment was aninnovative approach where its high alkalinity and neutralising capacitywas utilised (Ziemkiewicz, 1998). The calcium-alumina-silicate com-plexes present in steel slag cause the pH to rise to high levels, thusprecipitating metal ions and hindering bacterial growth.
However, if steel slags are to be used as neutralising agents inbioleaching it is required that they should not contain elements,which are toxic for the bacteria. As an example, fluoride that iscommon in certain types of slag is known to be toxic for microorgan-isms. It has been suggested that the reason for fluoride toxicity is dueto transport of fluoride through biological cell membranes, whichoccurs mainly through passive non-ionic diffusion of the freeprotonated form of fluoride, hydrofluoric acid, especially at pHb6(Gutknecht and Walter, 1981). Hydrofluoric acid, HF is a weak acidwith a pKa-value of 2.9–3.4, depending on temperature and ionicstrength (Pettit and Powell, 2001). Bioleaching is normally carried outat a pH range of 1 to 2. Consequently, free uncomplexed fluorideprimarily exists as HF in bioleaching solution. In a study by Sundkvistet al. it was shown that the fluoride toxicity greatly depends on pH andredox potential in solution. In the presence of aluminium, strongaluminium fluoride complexes are formed, making the solution non-toxic by reducing the free HF concentration (Sundkvist et al., 2005).
The aim with the present investigation is to study the possibilitiesof using slag from different Swedish steel industries as neutralisingagent in bioleaching operations. Batch bioleaching experiments wereconducted to determine the neutralising capacity of the slags and todetermine any eventual toxicity for the microorganisms.
2. Materials and methods
2.1. Microorganisms
Inocula for all bioleaching experimentswere taken from a continuousreactor in order to have an identical bacterial culture for start up of theexperiments. The continuous culture was growing on the 9-K nutrientmedium (Silverman and Lundgren, 1959) supplemented with 4.5 g/L ofFe2+ and 2 mM of potassium tetrathionate at a dilution rate of 0.021 h−1.The reactor was maintained at a pH level of 1.45±0.05 and a redoxpotential of 740±5mV vs. Ag/AgCl. The usedmixed culture comprised ofironoxidisers, sulphuroxidisers anda fewarchaeal species as determinedthroughQ-PCRanalysis byBioclear B.V., Netherlands. Dominating speciesin the culture were Leptospirillum ferrooxidans, Acidithiobacillus caldus,Acidithiobacillus thiooxidans, Sulphobacillus sp. and Ferroplasma sp.
2.2. Analytical and instrumentation techniques
Total iron concentrations of leach liquor samples were analysed byAtomic Absorption Spectroscopy (AAS). A platinum electrode with aAg, AgCl reference electrodewas used for redoxmeasurements,while aLange LDO™/sc100 was used for the measurement of dissolved oxy-gen. Chemical analyses of the pyrite concentrate, neutralising agentsand bioleaching residues were carried out by Inductively CoupledPlasma-Atomic Emission Spectrometry (ICP-AES)/Quadrupole MassSpectrometry (ICP-QMS)/Sector Field Mass Spectrometry (ICP-SFMS).X-ray powder diffraction (XRD) on pulverised samples was performedusing a Siemens D5000 automatic diffractometer equipped with acontinuous scanning device. Cu Kα radiation of 40 kV and 30mA and asample rotation of 30 rpm were used. Diffraction patterns were mea-sured in the range from 10° to 90° and crystalline phases wereidentified using the Joint Committee for Powder Diffraction Standards(JCPDS) file of the instrument.
2.3. Pyrite concentrate
The pyrite concentrate was obtained from tailings of a chalcopyriteflotation at the Boliden plant in Aitik, Sweden. Chemical compositionof the concentrate showed the presence of sulphur 23.9% and iron25.7% asmajor constituents, and relatively high amounts of silicon andaluminium, 12.9% and 4.5%, respectively (Table 1). Mineralogicalphases identified in the concentrate were pyrite (FeS2), which wasdominating, and kyanite (Al2SiO5), a gangue mineral.
2.4. Neutralising agents
The neutralising agents used in this experiment were five steelmaking slags from several steel plants in Sweden, which are common
Table 3Mineralogical phases of neutralising agents identified by XRD
Neutralisingagents
Phases identified by XRD
Ca(OH)2 Portlandite (Ca(OH)2)AOD slag Bredigite (Ca14Mg2(SiO4)8), cuspidine (Ca4Si2O7F2), calcium silicate
(Ca2SiO4), merwinite (Ca3Mg(SiO4)2), periclase (MgO)Ladle slag Calcium silicate (Ca2SiO4), gehlenite (Ca2Al2SiO7), mayenite
(Ca12Al14O33), periclase (MgO)EAF slag Calcium iron oxide (CaFe2O4), calcium magnesium aluminium iron
silicate (Ca2Mg0.2AlFe0.6Si0.2O5), calcium silicate (Ca2SiO4),wuestite (FeO)
BOF slag Calcium iron oxide (Ca2Fe2O5), calcium manganese solid solutionoxide ((CaXMn(1−X))O), calcium silicate (Ca2SiO4), wuestite (FeO)
CAS–OBslag
Hercynite (FeAl2O4), gehlenite (Ca2Al2SiO7), maghemite — C (Fe2O3),calcium aluminium oxide (Ca3Al2O6), manganese oxide (MnO)
Table 4Elemental composition of the bioleach residues
Bioleach residues Si(%)
Al(%)
Ca(%)
Fe(%)
K(%)
Mg(%)
Mn(%)
Na(%)
S(%)
Ba(mg/kg)
Cu(mg/kg)
Cr(mg/kg)
Mo(mg/kg)
Pb(mg/kg)
V(mg/kg)
Zn(mg/kg)
Ca(OH)2 10.8 2.9 10.9 11.9 1.9 0.2 0.1 0.7 11.4 4840 645 29.0 104 32.5 44.1 43.0AOD slag 13.1 2.8 8.5 12.4 1.9 0.3 0.1 0.7 12.1 4720 627 2180 146 36.2 73.5 35.2Ladle slag 13.8 3.8 6.2 14.4 2.4 0.3 0.1 0.9 10.9 5950 747 663 190 44.4 144 48.7EAF slag 11.9 2.9 8.1 15.9 1.9 0.5 0.4 0.7 10.9 4820 528 202 102 31.2 82.5 26.7BOF slag 12.2 3.1 7.3 14.3 2.0 0.8 0.4 0.7 10.4 5110 577 156 98.9 36.8 2140 31.2CAS–OB slag 14.6 5.2 4.6 15.9 2.7 0.6 0.6 0.9 8.2 6460 757 588 122 43.0 586 29.3
192 C.S. Gahan et al. / Hydrometallurgy 95 (2009) 190–197

by-products obtained at any steel producing facility. The AOD (ArgonOxygen Decarbonisation) slag is a converter slag originating fromstainless steel production. The BOF (Basic Oxygen Furnace) slag is alsoa converter slag from ore based steel production. The CAS–OB(Composition Adjustment by Sealed Argon Bubbling–Oxygen Blow-ing) is a ladle slag from an integrated steel plant. The EAF (Electric ArcFurnace) slag and the Ladle slag (from ladle refining of steel) bothoriginate from scrap based steel production. Slaked lime, Ca(OH)2, acommercial chemical, was used as reference material.
The AOD, EAF and Ladle slags used were disintegrating, i.e. uponcooling an expanding phase change in di-calcium silicate occurs,which turns the slag into a fine dust. However, the AOD and EAF slagstill contained some bigger aggregates and together with the CAS–OB
slag, were initially crushed to less than 5 mm. The CAS–OB slag wasfurther rod-milled which also was the case with BOF slag for 10 and20 min, respectively. After these primary size reductions, all slagswere ring milled for 20 s. The slaked lime was used as received.
Particle size analysis by laser size classification was carried out onall samples. Final grind size of the particles expressed as 80% passing(d80), was in the range of 15–25 μm for the Ladle, EAF and CAS–OBslags, while the AOD and BOF slags had a particle size of approximately50 μm. The particle size for the calcium hydroxide reference materialwas the finest with a d80 of 8 μm. The materials used werecharacterised chemically and mineralogically (Tables 2 and 3)(Cunha and Sandström, 2006). The neutralisation agents were addedinto the pulp in powder form.
Fig. 2. Change in initial and final pH with addition of Ca(OH)2.
Fig. 3. Change in redox potential and iron concentration with addition of Ca(OH)2.
Fig. 4. A plot of redox potential vs. time of the experiment using slags and slaked lime as a reference.
193C.S. Gahan et al. / Hydrometallurgy 95 (2009) 190–197

2.5. Bioleaching
The batch bioleaching experiments were carried out in a glassreactor with a working volume of 1 L. An airtight lid with a condenserwas used to minimize evaporation from the reactor. The temperaturein the bioreactor was maintained at 35 °C by a hot plate heater placedbelow the reactor. Homogenous mixing of the pulp was achieved byagitation with a propeller stirrer at a rotation speed of 250 rpm. Toavoid vortex formation two baffles were mounted perpendicular tothe vessel wall. Air enriched with CO2 (2–3% v/v) was blown into thebioreactor at a rate of 1 L/min beneath the propeller leading to adissolved oxygen (D.O.) level of 5 mg/L in the bioleaching solution. Theexperiments were performed with 10% (w/v) of concentrate and 10%(v/v) inoculum with the iron free 9K mineral salt medium (Silvermanand Lundgren, 1959).
During the first days of the experiments, the pH was adjusted to 1.5with H2SO4 to neutralise acid consuming gangue minerals present inthe concentrate. The bacterial activity started after a lag phase ofapproximately 4–7 days afterwhich an increase in redox potential and adecrease in pHwas observed. The pH and redox potential were checkedonce or twice daily andwhenever needed, the pHwas adjusted to 1.5 byadditions of slag (or slaked lime). The bioleaching experimentscontinued until no further changes in pH and redox potential wereobserved. Leach liquor samples from the bioreactor were taken everysecond day during the course of bioleaching and the total ironconcentration was analysed to follow the bioleaching trend. Aftercompletion of each experiment, the pulp was harvested by filtrationand the filter cake was washed with a measured volume of deionisedwater, acidified to pH 1.5 with H2SO4. The total volume of leach liquorincludingwashwater, wasmeasured before assay (Table 5). Thewashedbioleaching residues were dried in a hot air oven at 70 °C for severaldays. Bioleach residues were analysed chemically and mineralogically(Tables 4 and 7).
2.6. Calculation of pyrite oxidation
During bioleaching of pyrite, part of the ferric iron in solution pre-cipitated as ferric hydroxide, jarosite and possibly other basic ferricsulphates. In order to obtain the total extent of pyrite oxidation, theprecipitates in the residues were dissolved in 6 M HCl. This treatmentdoes not dissolve pyrite. The residues might also contain un-dissolvediron originating from the slag, which has to be accounted for in theoxidation calculation. Therefore, the amountof soluble iron in 6MHCl inthe slag was determined, and the oxidation based on feed and residueanalysis was thus calculated according to the following formula:
Oxidation ¼ 1−Fe rð Þ−Fe srð Þ−Fe nssð Þ
Fe fð Þ� �
� 100;
where Fe(r) is the iron content in residue, Fe(sr) is the soluble ironcontent in residue, Fe(nss) is the content of non-soluble iron in theslag and Fe(f) is the iron content in the pyrite.
3. Results
3.1. Bioleaching with Ca(OH)2 as a reference neutralising agent
In this experiment, initial fluctuations in pH disturbed the bacterialgrowth (Fig. 2), resulting in a prolonged lag phase that lasted 12 days,which can be seen by a comparatively slow evolution of the redoxpotential (Figs. 3 and 4). Later, when a high bacterial activity wasobtained, the pH varied between 1.25 and 1.59. The bulk of the acidproduction was observed between days 18 and 23, which alsocorrespond to the period when most of the slaked lime was added. Atthis time the pH decreased at night and on one occasion it decreaseddown to a pH of 1.25 (Fig. 2). The total amount of calcium hydroxideneeded for neutralisation during bioleaching of the pyrite concentratewas 22.1 g (Table 6). The dry solid residue obtained after bioleachingweighed 128 g, i.e. more than the total amount of solids introduced intothe reactor due to the formation of gypsum. Other phases identified inthe residue by XRD include hydronian jarosite, unleached pyrite and thesilicate microcline (Table 7).
Fig. 5. A plot of total iron concentration vs. time of the experiment using slags and slaked lime as a reference.
Table 5Elemental composition of the bioleach liquors
Neutralisingagents
Composition
Fe(g/L)
Al(g/L)
SO42−
(g/L)Ca(mg/L)
Mg(mg/L)
Cu(mg/L)
Mn(mg/L)
V(mg/L)
Si(mg/L)
Cr(mg/L)
F(mg/L)
Ca(OH)2 8.7 0.8 27.6 536 426 93.6 43.6 2.1 197 0.8 N.A.AOD slag 9.0 1.6 37.7 517 1090 112.0 166 4.3 336 55 608Ladle slag 9.4 2.5 48.3 574 1560 95.9 64.5 2.9 416 6.5 N.A.EAF slag 9.4 1.4 35.1 552 508 90.1 219 3.0 395 3.3 N.A.BOF slag 11.9 1.1 44.1 554 1420 120.0 445 481 237 3.1 N.A.CAS–OBslag
11.7 2.7 50.1 580 557 87.7 1150 42.4 358 3.2 N.A.
N.A.: Not analysed.
Table 6Experimental results
Ca(OH)2
AODslag
Ladleslag
EAFslag
BOFslag
CAS–OBslag
Amount of neutralising agentaddition, (g)
22.1 25.5 16.1 27.2 24.6 18.8
Concentrate addition, (g) 100 100 100 100 100 100Bioleach residue, (g) 127.8 128.3 101.2 130.9 119.7 94.8Wash water, (L) 0.25 0.28 0.28 0.35 0.21 0.32Bioleach filtrate, (L) 1.19 1.04 1.24 1.16 0.98 1.28Pyrite oxidation, (%) 74.9 74.6 77.6 77.1 80.2 77.5
194 C.S. Gahan et al. / Hydrometallurgy 95 (2009) 190–197

The total iron and sulphate contents in the leach solution were8.7 g/L and 27.6 g/L, respectively (Fig. 5, Table 5). Apart from iron, alsosome aluminium (0.8 g/L) and magnesium (0.4 mg/L) dissolved fromthe pyrite concentrate (Table 5). The sulphate concentration in theleachate was 27.6 g/L in this reference experiment and 75% of thepyrite was oxidised (Table 6).
3.2. Bioleaching with AOD slag as neutralising agent
The lag phase in the AOD experiment was short, as seen by anincrease in redox potential already after 4 days (Fig. 4). The reactivity ofthe AOD slagwas relatively high,whichmade it easy to control the pH atthe desired level and after the acid consuming gangue had beenneutralised, the pH in the experiment varied between 1.30 and 1.57. Thehighest activity was between days 7 and 12 when the bulk of theneutralisation occurred (Figs. 4 and 6). The total amount of AOD slagaddedwas25.5 g and theweightof dry bioleach residuewas129g (Fig. 6,Table 6). Crystalline mineral phases identified by XRD were gypsum,hydronian jarosite, sanidine and some remaining pyrite (Table 7).
The leach liquor contained9.0 g/L of iron and37.7 g/L of sulphate ionsas major composition (Fig. 5, Table 5). The concentrations of aluminiumand magnesium in the leachate were 1.6 g/L and 1.1 g/L, respectively(Table 5). TheAODslag,whichoriginates fromstainless steel production,contained relatively high concentrations of chromium (1.3%) andfluoride (2.4%) (Table 2), both of them can be toxic for the microorgan-isms as well as the environment (Dayan and Paine, 2001; Russo et al.,2005). Approximately 16% of the chromium content in the slagdissolved, giving a concentration of 55 mg/L (Table 5). The fluorideanalysis was 608 mg/L, which means that 100% of fluoride dissolvedduring leaching. The pyrite oxidation was found to be 75% (Table 6).
3.3. Bioleaching with Ladle slag as neutralising agent
Due to the lower reactivity of some of the silicates in the Ladle slag,the pH was more difficult to control in this experiment. After the pHwas adjusted to 1.5 it continued to increase, giving rise to too high pHvalues the next day. Therefore, the pH variations were high in thisexperiment ranging from 1.18 to 1.64 (Fig. 6). Even though the pHvaried more in this experiment, the bacterial activity was good whichcan be seen by a fast and steady increase in redox potential from day 8until day 16. The total amount of slag added was 16.1 g, which was thelowest amount needed in all experiments and the amount of dryresidue obtained after filtration was 101 g (Fig. 6, Table 6).
The bioleach liquor contained 9.4 g/L of iron and 48.3 g/L ofsulphate ions (Fig. 5, Table 5). The aluminium concentration in theLadle slag was 13.4% (Table 2) of which 46% dissolved, resulting in analuminium concentration in the leach liquor of 2.5 g/L (Table 5). Theconcentration of magnesium in the slag was 8.6% (Table 2) of whichabout 90% dissolved giving 1.6 g/L of magnesium in the leachingsolution (Table 5). In addition to gypsum, mineralogical phases of
hydronian jarosite and the silicate sanidine together with free quartzwere identified in the residue by XRD (Table 7). The pyrite oxidationwas 78% in this experiment (Table 6).
3.4. Bioleaching with EAF slag as neutralising agent
During the course of this experiment, the pH varied between 1.34and 1.76. Similar to the Ladle slag, the EAF slag also had a slowdissolution rate, resulting in too high pH the next day. The final additionbefore the experiment was stopped was slightly too large, giving a finalpH of approximately 1.6 (Fig. 6). The amount of EAF slag consumed was27.2 g, while the dry residueweighed 131 g, whichwas the highest of allthe experiments (Table 6).
The final bioleach liquor had a concentration of 9.4 g/L iron and35.1 g/L sulphate ions (Fig. 5, Table 5). The aluminium concentrationwas 1.4 g/L and the magnesium concentration of 0.5 g/L was similar tothat obtained in the experiment with slaked lime. Mineralogicalphases of gypsum, potassium jarosite, sanidine and free quartz wereidentified in the residue by XRD (Table 7). The experiment with EAFslag resulted in a pyrite oxidation of 77.1% (Table 6).
3.5. Bioleaching with BOF slag as neutralising agent
After the acid consuming gangue had been neutralised, the pHvaried in the range 1.25 to 1.66. Even in this case the slag continued toreact after addition, occasionally giving slightly higher pH thandesired (Fig. 6). The total amount of BOF slag used for neutralisationduring the bioleaching experiment was 24.6 g and the dry residueweighed 120 g (Table 6).
In the leachate, the iron and sulphate concentrations were 11.9 g/Land 44.1 g/L, respectively, while the aluminium and magnesium con-centrations were 1.1 g/L and 1.4 g/L, respectively (Fig. 5, Table 5). TheBOF slag had a high content of vanadium (2.5%) (Table 2), whichdissolved to an extent of 75% during leaching, giving a concentration
Fig. 6. A plot of additions vs. time of the experiment using slags and slaked lime as a reference.
Table 7Mineralogical phases of bioleach residues identified by XRD
Bioleachresidues
Phases identified by XRD
Ca(OH)2 Gypsum (CaSO4·2H2O), jarosite hydronian ((K,H3O)Fe3(SO4)2(OH)6),microcline intermediate (KAlSi3O8), pyrite (FeS2)
AODslag
Gypsum (CaSO4·2H2O), jarosite hydronian ((K,H3O)Fe3(SO4)2(OH)6), sanidinedisordered (K(Si3Al)O8), pyrite (FeS2)
Ladleslag
Gypsum (CaSO4·2H2O), quartz (SiO2), jarosite hydronian ((K,H3O)Fe3(SO4)2(OH)6), sanidine disordered (K(Si3Al)O8)
EAF slag Gypsum (CaSO4·2H2O), quartz (SiO2), sanidine disordered (K(Si3Al)O8),jarosite (KFe3(SO4)2(OH)6)
BOF slag Gypsum (CaSO4·2H2O), jarosite hydronian ((K.H3O)Fe3(SO4)2(OH)6),orthoclase (KAlSi3O8)
CAS–OBslag
Gypsum (CaSO4·2H2O), microcline intermediate (KAlSi3O8), killalaite (Ca3.2(H0.6Si2O7)(OH))
195C.S. Gahan et al. / Hydrometallurgy 95 (2009) 190–197

of almost 0.5 g/L in the solution (Table 5). Crystalline phases of thesilicate orthoclase together with gypsum and hydronian jarosite wereidentified by XRD in the residue (Table 7). In this experiment, thehighest pyrite oxidation of 80.2% was achieved (Table 6).
3.6. Bioleaching with CAS–OB slag as neutralising agent
The pH was easy to control with the CAS–OB slag and variedbetween 1.22 and 1.55 throughout the experiment. A total of 18.8 gslag was needed for neutralisation and the residue weight was 95 g,which was the lowest amount in all experiments (Fig. 6, Table 6).
Concentrations of 11.7 g/L of iron and 50.1 g/L of sulphate werefound in the leaching solution (Fig. 5, Table 5). This slag had thehighest content of aluminium (18.7%) (Table 2) and the concentrationin solutionwas 2.7 g/L (Table 5), which corresponds to a leaching yieldof 44%. The content of manganese was also relatively high in this slag(8.2%) (Table 2) of which 59% dissolved during bioleaching, resultingin a manganese concentration of 1.2 g/L in solution. Minor concentra-tions of magnesium (557 mg/L) and vanadium (42 mg/L) wereanalysed in the leachate (Table 5). Apart from gypsum, the silicatesmicrocline and killalaite were identified in the residue (Table 7). Thepyrite oxidation was 77.5% (Table 6).
4. Discussion
The aim of the present study has been to investigate if steel slagcan be used for neutralisation during bioleaching instead of limestone.Therefore, batch bioleaching experiments were conducted on a highlyacid producing pyrite concentrate to determine the neutralisationpotential of the steel slags in comparison to slaked lime. Of specialimportance is to establish if the slags contain elements that might betoxic for the bacteria used in bioleaching operations. From the resultsobtained, it was clear that the introduction of slags had no negativeeffect on the biooxidation of pyrite giving pyrite oxidation of 75–80%in all experiments. In fact, most of the materials used had better pyriteoxidation compared to the reference experiment with Ca(OH)2.Regarding neutralisation capacity, i.e. the amount of slag needed tomaintain pH at the required level, the CAS–OB slag had 27% and theLadle slag had 15% higher neutralising capacities than slaked lime,whereas the other slag samples had 11–23% lower capacity (Table 6).
During the initial 14–23 days of leaching the total iron concentra-tion in solution increased and thereafter gradually decreased due tothe precipitation of ferric iron as jarosites and other basic sulphates(Fig. 5, Table 7). The kinetics for jarosite precipitation at 35 °C is slow,but the long duration of batch bioleaching experiments promotes theprecipitation of jarosites (Deveci et al., 2004). Different forms ofjarosites were identified in all bioleach residues except in the CAS–OBslag (Table 7). The low solubility of calcium in sulphate media gavecalcium concentrations of 0.5 to 0.6 g/L in all bioleachates resulting ingypsum formation, which was the major mineralogical phaseidentified in all residues. The sulphate concentration varied from35 g/L to 50 g/L for the slag studied, whereas a concentration of 28 g/Lwas obtained in the experiment with slaked lime. The higher sulphateconcentrations obtained with the slag samples is due to the presenceof soluble sulphates of elements like aluminium andmagnesium apartfrom the ferric sulphate.
With respect to the fluoride toxicity discussed in the Introductionsection, it was assumed that the AOD slag might be toxic for thebacteria, as it contained 2.4% fluoride (Table 2). However, no toxiceffects were observed in this experiment, despite the relatively highfluoride concentration of 608 mg/L obtained in the leachate (Table 5).It is anticipated that the aluminium concentration together with otherconditions in the bioleachate was sufficient to complex the fluoridepresent in the solution thereby preventing fluoride toxicity. In addi-tion, the AOD slag had relatively high amounts of chromium (1.3%)which is a well-known toxic element especially in its hexavalent state,
which is the probable valence at the high redox potentials encoun-tered in bioleaching operations (Table 2) (Dayan and Paine, 2001;Russo et al., 2005). The presence of both these toxic elementsdiscussed above, taken together makes the AOD slag less suitable as aneutralising agent in bioleaching, although no direct toxic effectscould be observed in the present study. Another potential toxic ele-ment is vanadium, present mainly in the BOF slag and to a lesserextent in the CAS–OB slag. Vanadium is most toxic in the pentavalentstate, which is the most probable valency encountered in a high redoxpotential bioleaching process (Frank et al., 1996). The vanadiumconcentrations obtained in the bioleachates of BOF and CAS–OB slagsof 481 mg/L and 42 mg/L, respectively (Table 5), had no negativeinfluence on the bacterial activity. The price of vanadium in 2008 is34,000 US$ per tonne and with the concentrations encountered in theBOF slag leachate it may even be worth recovering.
Both the CAS–OB and the Ladle slag originate from ladle refiningwhere oxygen in the steel is removed by addition of aluminium intothe steel and therefore these slags contain different forms ofaluminium oxides (mayenite, calcium aluminium oxide, hercynite)and silicates (gehlenite, di-calcium silicate) (Table 3). Aluminiumdissolved to a high extent (~46%) in both slags, which is the reasonwhy these slags had the lowest amount of residue after leaching andthe highest amount of aluminium and sulphate in the leachate. Thehigh dissolution of aluminium from these slags is disadvantageous inthe down-stream processing of the leachate. If these slags are used asneutralising agent in a process for biooxidation of a refractory goldconcentrate, aluminium and sulphate have to be removed, togetherwith iron and arsenic before the final effluent can be disposed.Alternatively, in the case of a process for base metal recovery thealuminium has to be bled out of the process at some stage, otherwise itwould build up to high concentrations. Both these cases would needlime in order to remove aluminium, which sets a drawback to the useof aluminium rich steel slags as a neutralising agent.
Among the silicates identified in the slags and in the pyrite con-centrate, none of themwas found in the final bioresidues. The originalsilicates present both in the slags and the concentrate are transformedin the acidic aqueous environment to form new silicate phases. Thesilicates sanidine, orthoclase and microcline, all having the samechemical formula, KAlSi3O8, were found in all residues.
5. Conclusions
All the slag materials studied in this work had high neutralisationcapacities and have proven to be very good alternatives to limestonefor pH control in bioleaching operations, without any negative impacton the bioleaching efficiency. The disintegrating property of AOD slag,EAF slag and Ladle slag used in this present study is an advantage as itreduces the cost of grinding. From the comparative analysis performedon the steel slags it is concluded that the EAF slag is the best alter-native neutralising agent, while the AOD slag was considered lesssuitable due to the presence of environmentally hazardous elements.Substitution of limestone with steel slag provides environmentaladvantages along with considerable operational cost savings in thebioleaching process. Apart from the cost of limestone, the cost forlandfill of the slags can also be saved. The only cost associatedwith theutilisation of slag is that of transportation, that depends on thedistance between steel plant and bioleaching plant, which might beless than the cost of landfilling. Use of steel slag as neutralising agentwill also save virgin natural resources of limestone for future gene-rations to come.
Acknowledgements
Theauthorswish to express their gratitude forfinancial support fromthe EU-funded integrated project BioMinE, contract no. 500329-1.Funding from Carl Bennet AB is also gratefully acknowledged.
196 C.S. Gahan et al. / Hydrometallurgy 95 (2009) 190–197

References
Broadhurst, J.L., 1994. Neutralisation of arsenic bearing BIOX® liquors. MineralsEngineering 7 (8), 1029–1038.
Cadena, F., Kirk, T.L.,1995. Arsenate precipitation using ferric iron in acidic conditions. NewMexicoWater Resource Research Institute Technical Completion Report No. 293. NewMexico State University, Las Cruces, NM.
Chetty, K.R., Marais, H.J., Kruger, M.J., 2000. The importance of pH control in thebiooxidation process. Available from http://www.bioxgf.co.za/content/publica-tions/pdfs/Importance%20of%20pH%20Control.pdf.
Cunha, M.L., Sandström, Å., 2006. Characterisation of by-products for use as neutralizingagent in bioleaching. Proceedings of XXIII IMPC, vol. 2, pp. 1392–1397. Istanbul,Turkey, ISBN 975-7946-27-3.
Cunha, M.L., Gahan, C.S., Menad, N., Sandström, Å., 2008. Possibilities to use oxidic by-products for precipitation of Fe/As from leaching solutions for subsequent basemetal recovery. Minerals Engineering 21 (1), 38–47.
Dayan, A.D., Paine, A.J., 2001. Mechanisms of chromium toxicity, carcinogenicity andallergenicity: review of the literature from 1985 to 2000. Human & ExperimentalToxicology 20 (9), 439–451.
Deveci, H., Akcil, A., Alp, I., 2004. Bioleaching of complex zinc sulphides usingmesophilic and thermophilic bacteria: comparative importance of pH and iron.Hydrometallurgy 73 (3–4), 293–303.
Dew, D.W., 1995. Comparison of performance for continuous bio-oxidation of refractorygold ore flotation concentrates. In: Vargas, T., Jerez, C.A., Wiertz, J.V., Toledo, H.(Eds.), Proceedings of International Biohydrometallurgy Symposium IBS-95. Vinadel Mar, Chile, November 19–22, vol. 1. ISBN 956-19-0209-5, pp. 239–251.
Frank, A., Madej, A., Galgan, V., Petersson, L.R., 1996. Vanadium poisoning of cattle withbasic slag. Concentrations in tissues from poisoned animals and from a reference,slaughter-house material. Science of the Total Environment, 181 (1). ElsevierScience, Shannon, Irlande, pp. 73–92. ISBN:0048-9697.
Gutknecht, J., Walter, A., 1981. Hydrofluoric and nitric acid transport through lipidbilayer membranes. Biochimica Biophysica Acta (BBA) — Biomembranes 644 (1),153–156.
Hedin, R.S., Watzlaf, G.R., 1994. Passive treatment of acid mine drainagewith lime stone.Journal of Environment Quality 23 (6), 1338–1345.
Pettit, L.D., Powell, K.J., 2001. SC-database for Windows, Academic Software version 5.4.Sourby Old Farm, Timble, Otley, Yorks, UK.
Rawlings, D.E., Dew, D., Plessis, C.D., 2003. Biomineralization of metal-containing oresand concentrates. Trends in Biotechnology 21 (1), 38–44.
Rohwerder, T., Gehrke, T., Kinzler, K., Sand, W., 2003. Bioleaching review part A:progress in bioleaching: fundamentals and mechanisms of bacterial metal sulfideoxidation. Applied Microbiology and Biotechnology 63 (3), 239–248.
Russo, P., Catassi, A., Cesario, A., Imperatori, A., Rotolo, N., Fini, M., Granone, P.,Dominioni, L., 2005. Molecular mechanisms of hexavalent chromium-inducedapoptosis in human bronchoalveolar cells. American Journal of Respiratory Cell andMolecular Biology 33 (6), 589–600.
Sand, W., Gehrke, T., Jozsa, P.G., Schippers, A., 2001. (Bio)chemistry of bacterial leaching-direct vs. indirect bioleaching. Hydrometallurgy 59 (2–3), 159–175.
Schippers, A., Sand, W., 1999. Bacterial leaching of metal sulfides proceeds by twoindirect mechanisms via thiosulfate or via polysulfides and sulfur. Applied andEnvironmental Microbiology 65 (1), 319–321.
Silverman, M.P., Lundgren, D.G., 1959. Studies on the chemoautotrophic iron bacteriumFerrobacillus ferrooxidans I. An improved medium and a harvesting procedure forsecuring high cell yields. Journal of Bacteriology 77 (5), 642–647.
Stephenson, D., Kelson, R., 1997. Wiluna BIOX Plant — expansion and new develop-ments. Conference Proceedings of IBS-BIOMINE '97, August 4–6. Australian MineralFoundation, South Australia, ISBN 0-908039-66-2.
Sundkvist, J.E., Sandström, Å., Gunneriusson, L., Lindström, E.B., 2005. Fluorine toxicityin bioleaching systems. Proceedings of the 16th International BiohydrometallurgySymposium, ISBN: 1-920051-17-1, pp. 19–28.
The European Slag Association (Euroslag). Legal status of slags. Position paper. January2006. http://www.euroslag.org/media/Position_paper_Jan_2006.pdf, March 2006.
Tributsch, H., 2001. Direct versus indirect bioleaching. Hydrometallurgy 59 (2–3),177–185.
van Aswegen, P.C., Marais, H.J., 1999. Advances in application of the BIOX® process forthe refractory gold ores. Minerals and metallurgical processing 16 (4), 61–68.
van Aswegen, P.C., van Niekerk, J., Olivier, W., 2007. The BIOX™ process for thetreatment of refractory gold concentrates. In: Rawlings, D.E., Johnson, D.B. (Eds.),Biomining, ISBN-10 3-540-34909-X. Springer-Verlag Berlin Heidelberg, New York,pp. 1–33.
Ziemkiewicz, P., 1998. Steel slag: Applications for AMD control. Proceedings of theConference on Hazardous Waste Research, pp. 44–62.
197C.S. Gahan et al. / Hydrometallurgy 95 (2009) 190–197

PAPER III
Study on the Possibilities to use Ashes, EAF Dust and Lime Sludge as
Neutralising Agent in Bioleaching.
C.S. Gahan, M.L. Cunha, Å. Sandström
The Open Mineral Processing Journal, vol. 1, pp. 26-36, 2008


26 The Open Mineral Processing Journal, 2008, 1, 26-36
1874-8414/08 2008 Bentham Open
Open Access
Study on the Possibilities to Use Ashes, EAF Dust and Lime Sludge as Neutralising Agent in Bioleaching Chandra Sekhar Gahan1, Maria Lucelinda Cunha2 and Åke Sandström*,1
1Division of Process Metallurgy, Luleå University of Technology, SE-971 87 Luleå, Sweden and 2Dept. Ciência dos Materiais/CENIMAT, FCT/UNL, 2829-516 Caparica, Portugal
Abstract: Studies were conducted to investigate the possibilities to use combustion ashes, electric arc furnace (EAF) dust and lime sludge as neutralising agent with reference to a commercial grade slaked lime. To maintain optimum pH during biooxidation of pyrite the acid produced has to be neutralised. Batch bioleaching was performed on a pyrite concentrate in 1-L reactors, using a mixed mesophilic culture at a temperature of 35ºC. Neutralising agents were added regularly to ad-just pH to the desired level of 1.5. The ashes used were Bioash, Waste ash and Coal & Tyres ash, representing ashes gen-erated from combustion of biomass, a mixture of wood chips and municipal waste, and a mixture of coal and tyres. The dust used was an EAF dust produced in a scrap-based steel plant, while the sludge used was Mesalime produced in a pa-per and pulp plant.
The study aimed to investigate the possibility to replace the conventionally used lime or limestone with by-products, based on their neutralising capacity and to observe eventual toxic effects on the bacterial activity. The bioleaching effi-ciency was similar for all the neutralising agents used except Waste ash, when compared with slaked lime. The extent of pyrite oxidation was in the range 69-75% for all neutralising agents, except Waste ash, which had a pyrite oxidation of 59%. The Waste ash contained a large number of potentially toxic elements and the chloride concentration of 11% proba-bly had a negative effect as observed on the lower redox potential and pyrite oxidation. The EAF dust has a good potential to be used as neutralising agent in bioleaching processes for zinc recovery from zinc sulphides, due to the high content of zinc, however the chlorides present should be removed prior to its use.
The neutralising capacity, as determined by the amount needed for neutralisation during bioleaching, were rather high for EAF dust, Bioash and Mesalime with 37 g, 33 g and 29 g, respectively as compared with 22 g needed for slaked lime. However, Waste ash and Coal & Tyres ash had lower neutralising capacities with 81 g and 57 g needed, respectively. It is concluded that the replacement of lime or limestone with ash, dust or lime sludge can render considerable cost savings to the bioleaching operation. In addition, it is a means for sustainable use of natural resources, which would provide oppor-tunities to recycle elements present in them like for example zinc.
Key Words: Bacteria, ash, dust, slime, pyrite, neutralisation, bioleaching.
1. INTRODUCTION
Biooxidation and bioleaching processes are mainly ap-plied in heap and stirred tank leaching processes for the ex-traction of metal values from sulphidic ores and concen-trates. Heap bioleaching is carried out on low-grade copper ores with 1-3% copper, mainly on secondary sulphide min-erals as covelite (CuS) and chalcocite (Cu2S), while tank leaching is done on refractory gold concentrates. In the bioleaching process, the microorganisms play a role in con-verting insoluble metal sulphides (zinc, copper, nickel, co-balt) or oxides (uranium) into water-soluble metal sulphates, whereas in the biooxidation process, which is applied on refractory gold concentrates, the role of the microorganisms are to decompose the mineral matrix, thereby exposing the entrapped gold for cyanide leaching. Dissolution of metal sulphides is controlled by two different reaction mechanisms i.e., the thiosulphate pathway and the polysulphide pathway.
*Address correspondence to this author at the Division of Process Metal-lurgy, Luleå University of Technology, SE-971 87 Luleå, Sweden; Tel: +46 920 491290; Fax: +46 920 491199; E-mail: [email protected]
The thiosulphate pathway is only applicable to the acid in-soluble metal sulphides such as pyrite, molybdenite and tungstenite, while the polysulphide pathway is applicable for acid soluble metal sulphides like sphalerite, galena, arseno-pyrite and chalcopyrite [1, 2]. The stirred tank biooxidation process has proved to be advantageous over heap bioleaching because the heap leach-ing process takes months and years to complete in compari-son to only a few days needed in tank biooxidation process [3]. Stirred tank biooxidation of refractory gold concentrates and in one case on a cobaltic pyrite concentrate is currently used in more than ten full-scale operations using two differ-ent technologies with three more plants coming up in the near future [3-6]. New developments in stirred tank proc-esses have come with high temperature mineral oxidation, which has been set up in collaboration between BHP Billiton and Codelco in Chile [3]. Most of the commercial applica-tion of stirred tank reactors uses Gold field’s proprietary BIOX@ process, while three are using the Canadian-based BacTech Mining Company’s BACOX process for the treat-ment of refractory gold concentrates [3]. BHP Billiton Ltd operates pilot and demonstration scale processes for the re-

Study on the Possibilities to Use Ashes, EAF Dust and Lime Sludge The Open Mineral Processing Journal, 2008, Volume 1 27
covery of base metals from metal sulphides of nickel, copper and zinc by stirred tank bioleaching [7]. Bioleaching of zinc sulphides has been widely investigated at laboratory scale by various researchers [8-15]. The possibilities to process low-grade complex zinc sulphide ores through bioleaching have received much attention and has been tested in pilot scale [12, 16]. MIM Holdings Pty, Ltd. holds a patent for a fully integrated process that combines bioleaching of zinc sul-phides with solvent extraction and electrowinning of zinc metal [17]. In the biooxidation of sulphide minerals, neutralisation of the acid produced is commonly practised with limestone. Neutralisation is required at three different stages in a bioleaching process for base metal recovery, as stated in Fig. (1). First, neutralisation is carried out at a pH ~1.5 during bioleaching with the help of limestone, the second neutrali-sation is done at pH 3-4 using lime or limestone to precipi-tate iron and arsenic, while the third neutralisation is done at pH 7-8 by lime to treat the final effluent (Fig. 1). Stirred tank bioxidation is carried out with finely ground high-grade min-eral concentrates in highly aerated continuous flow reactors at temperatures ranging from 40-50ºC. The mineral decom-position takes place in the pulp flowing through the series of stirred tanks with controlled pH, temperature and aeration. The pH in the reactors is maintained between 1.0-2.0 by ad-dition of limestone, or if the concentrate contains acid con-suming gangue minerals sulphuric acid is used to avoid jarosite precipitation at higher pH or foam formation at
lower pH [18, 19]. Control of pH at a desired level increases the process efficiency, while the use of a cheap neutralising agent increases the cost efficiency of the stirred tank biomin-ing process. After biooxidation of the refractory gold con-centrates, the bioleached residues is cyanide leached for gold recovery, while the ferric iron and arsenate in the leach liq-uor is precipitated in the form of ferric arsenate [20]. The precipitation of ferric arsenate is generally carried out with neutralising agents like lime/limestone. Studies conducted on the use of oxidic industrial by-products for precipitation of Fe/As from leaching solution by Cunha et al. shows that ashes, dust and mesalime are highly reactive due to the pres-ence of calcite and lime [21]. Due to the extensive use of neutralising agents in various steps of biomining and the relatively high cost associated with it, researchers and indus-tries have tried to find substitutes to lime/limestone. Impor-tant criteria for choosing an alternative neutralising agent are; the neutralising capacity; no toxic effects for the micro-organisms; the distance between the bioleaching plant and the source of neutralising agent should be short; and finally, the cost of the neutralising agent should be cheaper than the generally used lime/limestone. Sweden produces a large quantity of non-coal ashes every year. In 2003, the estimated total amount of ash pro-duced was 1,125,000 tons per annum, of which 715,000 tons was bottom ash and 410,000 tons fly ash. The fly ash and bottom ash produced in Sweden have different characteris-tics depending on their fuel source and type of boilers used.
Fig. (1). Flow sheet of a process for base metal production describing stages of neutralisation.
Concentrate
L
Fe/As precipitation (pH 3.0)
SX Effluent neutralisation (pH 7-8)
Electrowinning
Metal
By-products/Lime
Discharge
Concentrate
Bioleaching (pH ~1.5)
By-products/Limestone
S/L Residue
Fe/As precipitation (pH 3-4)
By-products/Limestone/Lime
S/L
Solvent Extraction
Fe/As/Gypsum

28 The Open Mineral Processing Journal, 2008, Volume 1 Gahan et al.
The amount of ashes produced from different sources were 15-25% from municipal waste, ~5% from peat, 10-50% from sludge of paper industry, 2-4% from bark, 0.3-0.5% from pure wood [22]. All the non-coal ashes in Sweden have a high pH due to their high lime content. Use of ashes as a liner construction material in landfill is an option for the utilisation of the ashes, but in Sweden, many landfills are going to be closed in the next 10-15 years [22, 23]. There-fore, alternative applications should be looked for to use ashes in various other aspects. Studies conducted on use of three types of coal combustion ashes generated from a power plant in Illinois, USA suggested that they could be used as a neutralising agent in agriculture, waste treatment, fertilisers, wallboards, concrete and cement production, ceramics, zeo-lites, road construction and manufacture of amber glass [24]. Acid mine drainage mitigation can be another alternative use of fly ash. Studies conducted by Hallberg et al. stated that the acid mine drainage generated in Falun, Sweden could be prevented by covering the sulphide mine tailings with a mix-ture of fly ash and biosludge [25].
Electric arc furnace (EAF) dust recovered from the gas cleaning system of scrap based steel production is an indus-trial oxidic by-product with high content of zinc. It is only about 1.5% of the total output from a typical steel industry, but can create major environmental problems, which needs to be handled carefully. The material comprises of zinc, cal-cium, iron, and silicate with contaminants of heavy metals such as lead, cadmium, chromium and others. Since 1984, due to the presence of small quantities of heavy metals, mainly lead in the EAF dust, it has been regulated as a haz-ardous waste under the U.S. EPA's solid waste Resource Conservation and Recovery Act (RCRA) [26]. Steel indus-tries have installed elaborate dust collection systems to con-trol the dust due to its hazardous nature. Every steel industry and electric arc furnace user pays millions of dollars for re-moval, treatment and disposal of the EAF dust. Part of the EAF dust produced is sent to industries for recycling, while parts are shipped to hazardous waste landfills, where it is chemically treated, and buried at a cost of more than US dol-lars 100 per ton. In addition to posing a tremendous potential liability to the steel industries, the landfilled dust also con-tains significant and valuable quantities of recoverable zinc. Studies on hydrometallurgical processing for recovery of zinc from EAF dust have been widely carried out by various researchers [27-30]. In a future plant for bioleaching of zinc sulphide EAF dust can be a potential neutralising agent as it would then enrich the zinc concentration in the leachate [21]. Lime sludge, a by-product generated from paper and pulp industry is reused for production of lime (calcium oxide) by calcination, at temperature ranging from 1000° C to 1300° C, and marketed as quicklime and hydrated lime [31]. Some part of the lime sludge has to be bled out, due to formation of metakaolin on calcination [32]. Therefore, alternative use of lime sludge generated from the paper industry can save the cost incurred for the landfill. The use of oxidic by-products as neutralising agent is expected to be useful due to its high alkalinity, availability and cost effectivity in comparison to limestone. A compara-tive cost analysis conducted on limestone with different neu-tralising agents [33] states that the cost of limestone was one-third to that of slaked lime. As industrial oxidic by-
products are much cheaper than limestone, their use as a neutralizing agent would benefit to the cost efficiency of the process. The aim of the present investigation is to study the possibilities to use ashes, dust and lime sludge generated from different Swedish industries as neutralising agents in a bioleaching operation. Batch bioleaching experiments on a highly acid producing pyrite concentrate were conducted to determine the neutralising capacity of the ashes, dust and lime sludge, and observe any eventual toxic effects on the microorganisms used.
2. MATERIALS AND METHOD
2.1. Microorganisms
The microbial cultures for all bioleaching experiments were taken from a continuous reactor in order to have an identical bacterial culture for the start up of the experiments. The culture was growing on the 9K nutrient medium [34] supplemented with 4.5 g/L of Fe2+ and 2 mM of potassium tetrathionate at a dilution rate of 0.021 h-1. The continuous reactor was maintained at a pH level of 1.45 ± 0.05 and a redox potential of 740 ± 5 mV vs. Ag/AgCl. The mixed cul-ture used in the experiments contained iron oxidisers, sul-phur oxidisers and a few archaeal species, as determined through Q-PCR analysis by Bioclear B.V., Netherlands. Dominating species in the culture were Leptospirillum fer-rooxidans, Acidithiobacillus caldus, Acidithiobacillus thiooxidans, Sulphobacillus sp. and Ferroplasma sp.
2.2. Analytical and Instrumentation Techniques
Total iron concentrations in the leach liquor samples were analysed by Atomic Absorption Spectroscopy (AAS). Redox potential was measured with a platinum electrode against the Ag, AgCl reference electrode, and a Lange LDOTM/sc100 was used for the measurement of dissolved oxygen. Elemental analysis of the pyrite concentrate, neutral-ising agents and bioleaching residues were accomplished by Inductively Coupled Plasma-Atomic Emission Spectrometry (ICP-AES)/Quadrupole Mass Spectrometry (ICP-QMS)/ Sector Field Mass Spectrometry (ICP-SFMS). X-ray powder diffraction (XRD) on by-products and leaching residues was performed using a Siemens D5000 automatic diffractometer equipped with a continuous scanning device. Cu K radia-tion of 40 kV and 30 mA and a sample rotation of 30 rpm were used. Diffraction patterns were measured in the range from 10° to 90º and crystalline phases were identified using the Joint Committee for Powder Diffraction Standards (JCPDS) file of the instrument.
2.3. Pyrite Concentrate
The pyrite concentrate used for bioleaching was obtained from the tailings of a chalcopyrite flotation at the Boliden plant in Aitik, Sweden. Elemental composition of the con-centrate showed the presence of sulphur, 23.9% and iron, 25.7% as major constituents, and relatively high amounts of silicon and aluminium, 12.9% and 4.5%, respectively (Table 1). Mineralogical phases identified in the concentrate were pyrite (FeS2), which was dominating, and kyanite (Al2SiO5), a gangue mineral.
2.4. Neutralising Agents
Industrial oxidic by-products, like ashes, dust and lime sludge, generated from different Swedish industries was used

Study on the Possibilities to Use Ashes, EAF Dust and Lime Sludge The Open Mineral Processing Journal, 2008, Volume 1 29
as neutralising agents in the bioleaching experiments. Three different types of ashes from combustion for power genera-tion were used. Bioash is a mixture of fly and bottom ash generated during combustion of biomass. Coal & Tyres ash is a fly ash from combustion of a mixture with 67% coal and 33% tyres. Waste ash is a mixed fly ash from combustion of wood chips and municipal waste. The EAF dust used is a dust collected in the gas cleaning system of an electric arc furnace in scrap based steel production. The lime sludge used was Mesalime generated in a paper and pulp industry. A chemical grade slaked lime, Ca(OH)2, was used as the reference material.
The Mesalime was dried at 65ºC for 22 h to remove its water content. All by-products were ring milled for 20 sec-onds before used except slaked lime, which was used as re-ceived. Particle size analysis by laser size classification was carried out on all samples. Final grind size of the particles expressed as 80% passing (d80) was in the range of 15–25
m for the by-products. The particle size for the calcium
hydroxide reference material was the finest with a d80 of 8 m [35]. The by-products used for the study were character-
ised chemically and mineralogically (Tables 2 and 3) [35]. All the neutralising agents were added directly into the pulp in the form of powder.
2.5. Bioleaching
Batch experiments were performed for bioleaching of the pyrite concentrate in a glass reactor with a working volume of 1 L. An airtight lid with a condenser was used to mini-mize evaporation from the reactor. A hot plate heater was placed below the reactor to maintain the temperature at 35ºC in the reactor. A propeller stirrer was fixed at a height of 1.5 cm above the base of the reactor at a rotation speed of 250 rpm for homogenous mixing of the pulp. Two baffles were mounted perpendicular to the vessel wall to avoid vortex formation. Air enriched with CO2 (2-3%, v/v) was blown into the bioreactor at a rate of 1 L/min beneath the propeller resulting in a dissolved oxygen (D.O.) level of 5 mg/L in the
Table 1. Elemental Composition of the Pyrite Concentrate
Material Composition (%)
Si Al Ca Fe K Mg Mn Na S Ba Cu Cr Mo Zn Pyrite concentrate
12.9 4.5 1.9 25.7 2.3 0.7 0.2 0.7 23.9 0.6 0.2 0.01 0.01 0.01
Table 2. Elemental Composition of the Neutralising Agents
Neutralis-ing Agents
Si
(%)
Al
(%)
Ca
(%)
Fe
(%)
K
(%)
Mg
(%)
Mn
(%)
Na
(%)
S
(%)
Ba
(mg/kg)
Cr
(mg/kg)
Mo
(mg/kg)
Pb
(mg/kg)
V
(mg/kg)
Zn
(mg/kg)
F
(mg/kg)
Cl
(mg/kg)
Ca(OH)2 0.1 0.0 53.6 0.0 0.1 0.4 0.0 <0.004 0.02 <2 <10.0 <6.0 1.9 <2.0 27.3 30.9 1047
Bioash 1.5 0.3 30.7 0.6 6.9 3.3 3.7 0.1 0.53 5630 65.1 <6 30.8 5.5 1420 138 1900
Waste ash 8.0 4.0 12.3 4.6 4.5 1.5 0.2 4.6 5.22 1840 584 47.3 7670 57.9 83900 3624 110050
Coal & Tyres ash
3.2 1.4 23.0 1.5 0.4 0.5 0.0 0.3 6.87 463 39.8 <6 154 60.4 44000 362 9531
EAF dust 1.2 0.4 13.9 20.1 0.8 0.9 2.9 0.7 0.43 308 1300 49.5 7280 21.9 241000 846 15225
Mesalime 0.1 0.1 38.2 0.1 <0.1 1 0.1 0.7 0.03 145 23.8 <6 2.30 10 96.7 41.6 1144
Table 3. Mineralogical Phases of Neutralising Agents Identified by XRD
Neutralising Agents Phases Identified by XRD
Ca(OH)2 portlandite (Ca(OH)2)
Bioash calcite (CaCO3), calcium manganese oxide (Ca3Mn2O7), carbon (C), lime (CaO), periclase (MgO)
Waste ash halite (NaCl), quartz (SiO2), calcium sulphate (CaSO4), periclase (MgO), potassium magnesium silicate (K2MgSiO4), calcium aluminium oxide (CaAl2O4)
Coal & Tyres ash calcium sulfate sulfite (Ca3(SO3)2.12(SO4)0.88), calcium sulfite hydrate (CaSO3*0.5H2O), carbon (C), portlandite (Ca(OH)2), zincite (ZnO)
EAF dust franklinite (ZnFe2O4), lime (CaO), zincite (ZnO), calcium manganese oxide (Ca3Mn2O7), manganese zinc iron solid solution (MnxZnyFe1-x-y)Fe2O3
Mesalime calcite (CaCO3)

30 The Open Mineral Processing Journal, 2008, Volume 1 Gahan et al.
bioleaching pulp. The experiments were performed with 10% (w/v) of concentrate and 10% (v/v) inoculum with the iron free 9K mineral salt medium [34].
Due to the presence of acid consuming gangue in the concentrate, pH was adjusted to 1.5 with H2SO4 during the initial days of the experiments. The bacterial activity was followed by measurements of pH and redox potential once or twice daily. The pH was adjusted to 1.5 by additions of ashes/dust/lime sludge (or slaked lime) whenever required. The bioleaching experiments continued until no further changes in pH and redox potential were observed. Leach
liquor was drawn every second day from the bioreactor dur-ing the course of bioleaching and analysed by AAS for the total iron concentration to follow the bioleaching trend. After completion of each experiment, the pulp was harvested by filtration and the filter cake was washed with a measured volume of deionised water, acidified to pH 1.5 with H2SO4.Total volume of leach liquor including wash water, was measured before analysis (Table 6). The washed bioleach residues were dried in a hot air oven at 70 ºC for several days. Bioleach residues were analysed chemically and min-eralogically (Tables 4 and 7).
Table 4. Elemental Composition of the Bioleach Residues
Bioleach Residues
Si
(%)Al
(%)Ca (%)
Fe (%)
K(%)
Mg (%)
Mn(%)
Na(%)
S(%)
Ba (mg/kg)
Cu
(mg/kg)Cr
(mg/kg)Mo
(mg/kg)Pb
(mg/kg)Zn
(mg/kg)
Ca(OH)2 10.8 2.9 10.9 11.9 1.9 0.2 0.1 0.7 11.4 4840 645 29.0 104 32.5 43.0
Bioash 9.3 2.4 8.2 15.2 3.2 0.1 0.1 0.7 12.2 5480 485 52.6 93 39.5 <20
Waste ash 10.8 2.8 6.4 15.7 3.2 0.4 0.1 0.9 11.8 4230 839 271 98 6820 6600
Coal & Tyres ash 10.3 2.9 10.0 10.6 1.7 0.2 0.1 0.7 11.6 4300 500 34.1 82.7 83.9 1130
EAF dust 11.2 3.1 5.5 18.1 2.2 0.3 0.5 0.8 10.7 5090 956 1020 117 2390 18800
Mesalime 11.5 3.1 10.4 11.7 2.1 0.2 0.1 0.8 11.9 5400 607 24.4 108 33.7 29.7
Table 5. Elemental Composition of the Bioleach Liquors
Composition Neutralising
Agents Fe
(g/L)
Al
(g/L) SO4
2-
(g/L) Ca
(mg/L)
Si
(mg/L)
K
(mg/L)
Mg
(mg/L)
Mn
(mg/L)
Na
(mg/L)
Cu
(mg/L)
Zn
(mg/L)
F
(mg/L)
Cl
(mg/L)
Ca(OH)2 8.7 0.8 27.6 536 197 <10 426 43.6 21.2 93.6 14.3 N.A. N.A.
Bioash 3.1 0.9 25.6 495 336 <5 1190 976 39.9 85.8 63.4 N.A. N.A.
Waste ash 1.0 3.3 29.7 505 416 486 1160 117 3190 344 5720 313 8910
Coal & Tyres ash 8.9 0.9 34.2 550 395 <5 518 45.7 62.2 93.4 1790 33 464
EAF dust 9.8 0.9 42.9 513 237 <5 512 569 118 132 5820 48 519
Mesalime 9.6 0.9 33.9 520 358 <5 607 79 131 102 15.3 N.A. N.A.
*N.A. : Not analysed
Table 6. Experimental Results
Ca(OH)2 Bioash Waste Ash Coal & Tyres Ash EAF Dust Mesalime
Neutralising agent addition, (g) 22.1 32.7 81.5 57.0 37.5 28.7
Concentrate addition, (g) 100.0 100.0 100.0 100.0 100.0 100.0
Bioleach residue, (g) 127.8 147.4 180.0 151.1 123.3 121.0
Wash water, (L) 0.25 0.35 0.35 0.35 0.25 0.22
Bioleach filtrate, (L) 1.19 1.23 0.90 1.24 1.15 1.14
Pyrite oxidation, (%) 74.9 68.7 59.1 75.3 69.8 72.6

Study on the Possibilities to Use Ashes, EAF Dust and Lime Sludge The Open Mineral Processing Journal, 2008, Volume 1 31
2.6. Calculation of Pyrite Oxidation During bioleaching of pyrite, part of the ferric iron in solution precipitated as ferric hydroxide, jarosite and possi-bly other basic ferric sulphates. In order to obtain the total extent of pyrite oxidation, the precipitates in the residues were dissolved in 6 M HCl. This treatment does not dissolve pyrite. The residues might also contain un-dissolved iron originating from the ashes/dust/lime sludge, which has to be accounted for in the oxidation calculation. Therefore, the amount of soluble iron in 6 M HCl in the ashes/dust/lime sludge was determined, and the recovery based on feed and residue analysis was thus calculated according to the follow-ing formula:
Oxidation = 1Fe(r) Fe(sr) Fe(nss)
Fe(f)100 , where Fe(r)
is the iron content in residue, Fe(sr) is the soluble iron con-tent in residue, Fe(nss) is the content of non soluble iron in the ashes/dust/lime sludge and Fe(f) is the iron content in the pyrite.
3. RESULTS
3.1. Bioleaching with Ca(OH)2 as a Reference Neutralis-ing Agent
During the initial stage of this experiment, enough care was not taken to avoid fluctuations in pH, which disturbed the bacterial growth resulting in a lag phase that lasted 12 days, which can be observed from the slow trend of increase in redox potential (Figs. 2 and 3). When a good bacterial activity was obtained after the initial disturbances, the pH in the experiment varied between 1.25-1.59 (Fig. 2). The high-est bioleaching activity was between day 18 and 23 during which time most of the slaked lime was added. During night, when no additions were made, pH decreased considerably as seen in Fig. (2). The total amount of calcium hydroxide needed for neutralisation during bioleaching of the pyrite concentrate was 22.1 g (Table 6). The dry solid residue ob-tained after bioleaching weighed 128 g, i.e. more than the total amount of solids introduced into the reactor, due to the formation of gypsum. Other phases identified in the residue
Table 7. Mineralogical Phases of Bioleach Residues Identified by XRD
Bioleach Residues Phases Identified by XRD
Ca(OH)2 gypsum (CaSO4.2H2O), jarosite hydronian ((K,H3O)Fe3(SO4)2(OH)6), microcline intermediate (KAlSi3O8), pyrite (FeS2)
Bioash gypsum (CaSO4.2H2O), jarosite hydronian ((K,H3O)Fe3(SO4)2(OH)6), quartz (SiO2)
Waste ash gypsum (CaSO4.2H2O), jarosite (KFe3 (SO4)2(OH)6), pyrite (FeS2), quartz (SiO2)
Coal & Tyres ash gypsum (CaSO4.2H2O), jarosite hydronian ((K,H3O)Fe3(SO4)2(OH)6), pyrite (FeS2), quartz (SiO2)
EAF Dust gypsum (CaSO4.2H2O), jarosite (KFe3(SO4)2(OH)6), franklinite (ZnFe2O4), iron sulfate hydroxide (2Fe(OH)SO4 / Fe2O3.2SO3.H2O), quartz (SiO2)
Mesalime gypsum (CaSO4.2H2O), jarosite (KFe3(SO4)2(OH)6), quartz (SiO2)
Fig. (2). Change in redox potential and iron concentration with addition of Ca(OH)2.
0
5
10
15
20
25
0 5 10 15 20 25 30 35 40 45 50
Time, days
Add
ition
s, g
1.0
1.1
1.2
1.3
1.4
1.5
1.6
1.7
1.8
1.9
2.0
pH
Cumulative additions
Initial pH
Final pH

32 The Open Mineral Processing Journal, 2008, Volume 1 Gahan et al.
by XRD include hydronian jarosite, minor amounts of un-leached pyrite and the silicate microcline (Table 7). The total iron and sulphate content in the leach solution was 8.7 g/L and 27.6 g/L, respectively (Fig. 5, Table 5). Apart from iron, also some aluminium (0.8 g/L) and magne-sium (0.4 mg/L) dissolved from the pyrite concentrate (Table 5). The sulphate concentration in the leachate was 27.6 g/L and in this reference experiment 75% of the pyrite was oxi-dised (Table 6).
3.2. Bioleaching with Bioash as Neutralising Agent
The lag phase was relatively short in this experiment with an increase in redox potential after 6 days (Fig. 4). The reac-tivity of the Bioash was relatively high, which made it easy to control the pH at the desired level after the acid consum-ing gangue had been neutralised, the pH in the experiment varied between 1.18 and 1.54. The highest activity with re-spect to acid production was between day 15 and 18 when the bulk of the neutralising agent was needed (Figs. 4 and 6).
Fig. (3). pH before and after addition of Ca(OH)2.
Fig. (4). A plot of redox potential vs. time in the experiments with reference to slaked lime.
0
5
10
15
20
25
0 5 10 15 20 25 30 35 40 45 50
Time, days
Add
ition
s, g
Fe
(tot),
g/L
400
450
500
550
600
650
700
750
800
Red
ox p
oten
tial,
mV
vs. A
g/A
gCl
Total iron concentration
Cumulative additions
Redox potential
400
450
500
550
600
650
700
750
800
0 5 10 15 20 25 30 35 40 45 50 55 60 65 70 75 80
Time, days
Red
ox p
oten
tial,
mV
vs. A
g/A
gCl
Ca(OH)2BioashCoal & Tyres ashWaste ashEAF dustMesalime

Study on the Possibilities to Use Ashes, EAF Dust and Lime Sludge The Open Mineral Processing Journal, 2008, Volume 1 33
The redox potential reached a maximum of about 750 mV after 20 days and thereafter it had a decreasing trend with relatively big daily fluctuations giving a final value around 710 mV (Fig. 4). The total amount of Bioash added was 32.7 g and the dry residue weight was 147.4 g (Fig. 6, Table 6). Crystalline mineral phases identified by XRD were gypsum, hydronian jarosite and free quartz (Table 7).
The final leach liquor contained 3.1 g/L of iron, but as can be seen in Fig. (5), the concentration decreased gradually from almost 10 g/L after 20 days. The solution had a sul-phate concentration of 25.6 g/L together with concentrations of approximately 1 g/L of aluminium, magnesium and man-ganese (Table 5). The content of magnesium and manganese in the Bioash was 3.3% and 3.7%, respectively (Table 2), which gives leaching yields of these elements of about 85%. The pyrite oxidation was found to be 68.7% (Table 6).
3.3. Bioleaching with Waste Ash as Neutralising Agent
The pH was relatively easy to control with Waste ash, since it did not contain minerals with slow dissolution rates, and after the initial days, pH varied in the range 1.30-1.56 (Fig. 6). After an initial increase in redox potential up to 607 mV on day 15 and with acid production, the redox potential, suddenly within 3 days, decreased below 550 mV and re-mained at that level until the experiment was stopped (Fig. 4). However, smaller amounts of acid continued to be pro-duced until day 30, which was neutralised by more additions of ash (Fig. 6). The total amount of Waste ash added was 81.5 g, which was the biggest amount needed in all experi-ments and the amount of dry residue obtained after filtration was 180 g (Fig. 6, Table 6). The XRD diffractogram of the residue revealed in addition to gypsum, mineralogical phases of jarosite, pyrite and free quartz (Table 7).
Fig. (5). A plot of total iron concentration vs. time in the experiments with reference to slaked lime.
Fig. (6). A plot of additions vs. time in the experiments with reference to slaked lime.
0
2
4
6
8
10
12
14
16
18
0 5 10 15 20 25 30 35 40 45 50 55 60 65 70 75 80
Time, days
Fe(to
tal),
g/L
Ca(OH)2
Bioash
Coal & Tyres ash
Waste ash
EAF dust
Mesalime
0
10
20
30
40
50
60
70
80
90
0 5 10 15 20 25 30 35 40 45 50 55 60 65 70 75 80
Time, days
Cum
ulat
ive
addi
tions
, g
Ca(OH)2
Bioash
Coal & Tyres ash
Waste ash
EAF dust
Mesalime

34 The Open Mineral Processing Journal, 2008, Volume 1 Gahan et al.
The iron concentration in the leachate was low through-out the entire experiment and was only 1 g/L at the end of the experiment (Fig. 5, Table 5). The sulphate, aluminium and magnesium concentrations in the final leachate obtained were 29.7 g/L, 3.3 g/L and 1.2 g/L, respectively (Table 5). Chloride was present in the ash as highly soluble halite (Ta-ble 3) giving a chloride concentration of 8.9 g/L in the leachate (Table 5). The content of zinc in Waste ash was 8.4% (Table 2) of which 75% dissolved, giving a zinc con-centration of 5.7 g/L (Table 5). Vacuum filtration of the pulp was difficult and took much longer time than in the other experiments and therefore the volume of final leachate was only 900 ml. The pyrite oxidation was 59%, which was the lowest among all the experiments (Table 6).
3.4. Bioleaching with Coal & Tyres Ash as Neutralising Agent
The pH varied in the range 1.32-1.57 throughout and was relatively easy to control (Fig. 6). The redox potential in-creased steadily but slowly during the course of the experi-ment. Notable is (Figs. 4 and 6) that after each ash addition, the redox potential decreased, in some cases with as much as 15 mV. The amount of Coal & Tyres ash consumed in the experiment was 57 g, and the dry residue weighed 151 g (Fig. 6, Table 6). The final bioleach liquor had a concentration of 8.9 g/L iron and 34.2 g/L sulphate ions (Fig. 5, Table 5). The ash contained 4.4% zinc of which 89% dissolved resulting in a concentration of 1.8 g/L in solution (Table 2 and 5). Alumin-ium and magnesium concentrations of 0.9 g/L and 0.5 g/L respectively were similar to that obtained in the experiment with slaked lime (Table 5). Mineralogical phases of gypsum, hydronian jarosite, pyrite and free quartz were identified by XRD analysis of the bioleached residue (Table 7). The ex-periment with Coal & Tyres ash resulted in a pyrite oxida-tion of 75.3%, which was slightly higher than the reference experiment with Ca(OH)2 (Table 6).
3.5. Bioleaching with EAF Dust as Neutralising Agent
Initially when the bacteria became active, too much dust was added leading to a too high pH, which had to be lowered by additions of acid. The slightly too high pH remained until day 17 when bacterial acidity production lowered it to 1.5 again (Fig. 6). This disturbance made the lag phase longer but did not affect the bacteria negatively as is seen by a steady increase in redox potential from day 14 and onwards (Fig. 4). During the last 14 days, the redox potential gradu-ally decreased to 660 mV from values above 700 mV (Fig. 4). The total amount of EAF dust used for neutralisation was 38 g and the dry residue weighed 123 g (Fig. 6, Table 6). In the bioleachate, the analysed iron and sulphate concen-trations were 9.8 g/L and 42.9 g/L, respectively, while the aluminium and magnesium concentrations were 0.9 g/L and 0.5 g/L, respectively (Fig. 5, Table 5). The EAF dust had a high content of zinc (24.1%) (Table 2), which dissolved to an extent of 74% during leaching, giving a concentration of 5.8 g/L in solution (Table 5). The chloride concentration in the leachate was 0.5 g/L due to the presence of highly solu-ble chlorides in the dust. Crystalline phases of franklinite, jarosite and iron sulphate hydroxide together with gypsum and free quartz were identified by XRD in the residue (Table
7). In this experiment, a pyrite oxidation of 70% was achiev- ed (Table 6).
3.6. Bioleaching with Mesalime as Neutralising Agent
Also in this experiment slightly too much material was added in the beginning resulting in a high pH initially (Fig. 6). A steady increase in the redox potential was seen from day 11 and during the last 20 days of the experiment the re-dox potential remained at around 680 mV (Fig. 4). The amount of Mesalime needed for neutralisation was 29 g and the weight of the residue was 121 g, which was the lowest weight obtained in all experiments (Fig. 6, Table 6). Concentrations of 9.6 g/L of iron and 34 g/L of sulphate were found in the leaching solution (Fig. 5, Table 5). The lime sludge was a relatively pure product containing mainly calcite (Tables 2 and 3) and therefore the metal concentra-tions obtained in the leachate are very similar to what was obtained with slaked lime (Table 5). Apart from gypsum, phases of jarosite and free quartz were identified in the resi-due (Table 7). The pyrite oxidation was 72.6%, which also was similar to the reference experiment (Table 6).
4. DISCUSSION
The purpose with the present study is to investigate if by-products like ashes, sludge and dust can be used as neutralis-ing agent in bioleaching operations. Important to consider, apart from their neutralising capacity, is also if the by-product to be used contains elements that might be toxic for the microorganisms. To conduct the study a pyrite concen-trate was chosen since pyrite generates high amounts of acid when it is oxidised. Comparison of the pyrite oxidation in the different experiments shows that the experiment with Coal & Tyres ash and slaked lime both resulted in 75% py-rite oxidation. The experiments with EAF dust, Bioash and Mesalime all had pyrite oxidation in the range from 69% to 73%, while in the experiment with Waste ash the pyrite oxi-dation was only 59% (Table 6). Regarding neutralisation capacity, i.e. the amount of oxidic by-products needed to maintain pH at the required level, all by-products needed higher amounts than slaked lime. Mesalime required 30% more than slaked lime, which reflects the difference in molecular weight between Ca(OH)2 and CaCO3. The EAF dust and Bioash had relatively high neutralising capacities and needed 70% and 48% more additions, respectively, to achieve the same neutralisation as slaked lime. The Waste ash and Coal & Tyres ash had lower neutralising capacities and required an amount of 2.6 and 3.7 times the amount needed for the experiment with slaked lime (Table 6). The total iron concentration increased during the first 3-4 weeks of bioleaching, thereafter, the iron concentration started to decrease due to the precipitation of ferric iron as jarosite and possibly other basic sulphates (Fig. 5, Table 7). The kinetics for jarosite precipitation at 35° C is known to be relatively slow, but the long duration of batch bioleaching experiments enhanced the jarosite precipitation, which was confirmed by XRD analysis of the bioleaching residues (Ta-ble 7) [9]. Potassium jarosite is among the least soluble jarosite and it was seen in the experiments with Bioash and Waste ash, which both had high potassium content, 6.9% and 4.5%, respectively (Table 2), that jarosite precipitated to a great extent. In the experiments with these ashes, the ferric

Study on the Possibilities to Use Ashes, EAF Dust and Lime Sludge The Open Mineral Processing Journal, 2008, Volume 1 35
iron concentrations were much lower than what was obtained with the other materials (Fig. 5, Table 5). In the case of Waste ash the total iron concentration in the final leachate was only 1.0 g/L (Table 5) and with such low concentration, the pyrite leaching might also be affected since the oxidation proceeds through ferric iron. Jarosite precipitation lowers the redox potential due to the removal of ferric ions from the solution, and thereby leads to a lowering of the pH in the solution, according to the following formula: K+ + 3Fe3+ + 2SO4
2- + 6H2O KFe3(SO4)2(OH)6 + 6H+
This is probably what is seen in the later parts of most of the experiments, with gradual decrease in both the total iron concentration and the redox potential. The calcium content in the leachate obtained in all experiments was 0.5-0.6 g/L re-flecting the limited solubility of calcium in sulphate medium (Table 5). The sulphate concentrations varied from 26 g/L for Bioash to 43 g/L for the EAF dust, while a concentration of 28 g/L was obtained in the experiment with Ca(OH)2 (Ta-ble 5). The great variation in sulphate concentrations in the solution was due to the presence of various soluble metal sulphates of elements like zinc, magnesium and aluminium, apart from the iron sulphates.
The Waste ash was chosen as a worst case, since ashes from combustion of municipal waste are known to contain many different metal oxides, some of them potentially toxic like lead, cadmium and mercury. In addition, the Waste ash studied also contained high amounts of chlorine (11%) mainly as highly soluble halite (NaCl) as identified by XRD; fluorine, which is potentially toxic for the microorganisms [36], was also present in relatively high amounts (~0.4%). In a study [37], it was shown that biooxidation cultures were able to adapt to chloride levels up to 4.2 g/L, while greater concentrations gave inhibitory effects. When the experiment with Waste ash was examined, it was observed that the ex-periment started normally with an increase in redox potential that reached above 600 mV after 15 days (Fig. 4). However, after that the redox potential decreased to about 550 mV and remained at that level throughout the experiment. The total amount of ash added on day 16, when the redox potential started to decrease was 46 g, which then would give a chlo-ride concentration of 5.1 g/L with the assumption that all chloride dissolved, i.e. the toxic level of chloride was prob-able exceeded during that time period. Also the Coal & Tyres ash and the EAF dust had elevated levels of chlorine, 1% and 1.6%, respectively (Table 2), but the concentrations obtained in the leachate when these materials were used was only 0.5 g/L (Table 5), which did not hamper the bacterial activity, since high redox potentials of 660-670 mV was ob-tained in these experiments (Fig. 4). Since chlorine in these materials is present as NaCl and possibly KCl, which both are very soluble in water, one possible pre-treatment to re-move the chlorides would be to do a water leaching prior to their use as neutralising agents, which also has been prac-tised to upgrade the zinc content in the EAF dust [28]. The Bioash and Coal & Tyres ash contained un-burnt carbon as identified by XRD and in the case of Coal & Tyres ash the colour was blackish and once added into the pulp it became oily and sticky to the reactor walls. It is also obvious from the behaviour of the redox potential (Fig. 4) that the ash contained something with reducing properties since upon
each addition the redox potential immediately decreased. The reason for this is not clear but it is believed that some organic component in the ash might be responsible for this behaviour. However, despite the disturbances in this experi-ment, it appeared to have high bacterial activity since the redox potential always recovered and increased throughout the experiment and resulted in a higher pyrite oxidation than the experiment with Ca(OH)2 (Table 6). Some of the by-products chosen had high zinc contents, which would add to the zinc tenor in the leachate. Use of these materials as neutralising agents in bioleaching would be a benefit especially in the case of a bioleaching process for zinc recovery. The concentration of zinc in the leachate obtained from the experiments with EAF dust, Waste ash and Coal & Tyres ash were 5.8 g/L, 5.7 g/L and 1.8 g/L, re-spectively (Table 5). The zinc oxide present in them dis-solved readily, whereas ferrites like franklinite (ZnFe2O4)(Table 3) require higher temperatures and lower pH to dis-solve. Franklinite was identified by XRD in the EAF dust and was also observed in the residue after leaching and due to its presence the zinc leaching yield in this experiment was 74% (Table 5). The Mesalime used in this study was the pur-est by-product investigated and consisted essentially of pure calcite (CaCO3) giving similar results as the reference ex-periment with slaked lime.
5. CONCLUSIONS
The comparative study of by-products has proved that all materials investigated would be good substitutes for lime-stone for pH control in bioleaching operations, and in most cases without negative impact on the bioleaching efficiency. The Mesalime is the best alternative since it is practically a pure calcite, which is normally used. If the chlorides in the EAF dust were removed by a water-washing step preceding its use as neutralising agent this dust would be an excellent substitute for limestone, especially in a process for zinc re-covery due to its high content of soluble zinc. Bioash is also a good alternative neutralising agent with high neutralising capacity due to its content of calcite and lime and relatively low content of other impurities. The Coal & Tyres ash is less suitable despite the presence of relatively high amounts of zinc since the organic compounds present in it would create material handling problems in the bioleaching process due to its sticky nature. The Waste ash was found to be the least suitable by-product due to the presence of high amounts of potentially toxic elements, low neutralising capacity and a low pyrite oxidation. The alternative use of the by-products would save the cost of landfill and at the same time reduce the operational cost for neutralisation thus making the bioleaching operation more economical. The only cost in-volved in the use of by-products is the transportation cost that depends on the distance between the industry producing oxidic by-products and the bioleaching plant, which might be less than the landfill cost. The use of oxidic by-products will render an environmentally friendly process and prevent over use of natural limestone deposits.
ACKNOWLEDGEMENTS
The authors wish to express their gratitude for financial support from the EU-funded integrated project BioMinE, contract Nº 500329-1. Funding from LTU, Sweden and Carl Bennet AB are also gratefully acknowledged.

36 The Open Mineral Processing Journal, 2008, Volume 1 Gahan et al.
REFERENCES [1] A. Schippers and W. Sand, “Bacterial leaching of metal sulfides
proceeds by two indirect mechanisms via thiosulfate or via Polysul-fides and Sulfur”, Applied and Environmental Microbiology, vol. 65, pp. 319-321, 1999.
[2] T. Rohwerder, T. Gehrke, K. Kinzler and W. Sand, “Bioleaching review part A: Progress in bioleaching: fundamentals and mecha-nisms of bacterial metal sulfide oxidation. Applied Microbiology and Biotechnology, vol. 63, pp. 239-248, 2003.
[3] D.E. Rawlings, D. Dew and C.D. Plessis, “Biomineralization of metal-containing ores and concentrates”, Trends in Biotechnology,vol. 21, pp. 38-44, 2003.
[4] C.L. Brierley and A.P. Briggs, “Selection and sizing of biooxida-tion equipment and circuits”, In: A.L. Mular, D.N. Halbe, D.J. Bar-ret (Eds) Mineral processing plant design, practice and control, So-ciety of Mining Engineers, Littleton, Colo., 2002; pp. 1540-1568.
[5] G.J. Olson, J.A. Brierley and C.L. Brierley, “Bioleaching review part B: Progress in bioleaching: applications of microbial processes by the minerals industries”, Applied Microbiology and Biotechnol-ogy, vol. 63, pp. 249-257, February 2004.
[6] P.C. van Aswegen, J. van Niekerk and W. Olivier, “The BIOXTM Process for the Treatment of Refractory Gold Concentrates”, In: D.E. Rawlings, D.B. Johnson, (Eds.), Biomining, Springer-Verlag Berlin Heidelberg, New York, 2007; pp. 1-33.
[7] W.H. Dresher, “Producing copper nature’s way: Bioleaching”, CWD: INNOVATIONS, May issue, pp. 10, 2004.
[8] S. Shi, Z. Fang and J. Ni, “Bioleaching of marmatite flotation con-centrate with a moderately thermoacidophilic iron-oxidizing bacte-rial strain”, Minerals Engineering., vol. 18, pp. 1127-1129, Sep-tember 2005.
[9] H. Deveci, A. Akcil and I. Alp, “Bioleaching of complex zinc sulphides using mesophilic and thermophilic bacteria: comparative importance of pH and iron”, Hydrometallurgy, vol. 73, pp. 293-303, June 2004.
[10] C.K. Pani, S. Swain, R.N. Kar, G.R. Chaudhury, L.B. Sukla and V.N. Misra, “Bio-dissolution of zinc sulfide concentrate in 160 l 4-stage continuous bioreactor”, Minerals Engineering, vol. 16, pp. 1019-1021, October 2003.
[11] Y. Rodríguez, A. Ballester, M. L. Blázquez, F. González and J. A. Muñoz, “New information on the sphalerite bioleaching mecha-nism at low and high temperature”, Hydrometallurgy, vol. 71, pp. 57-66, October 2003.
[12] Å. Sandström and S. Petersson, “Bioleaching of a complex sul-phide ore with moderate thermophilic and extreme thermophilic microorganisms”, Hydrometallurgy, vol. 46, pp. 181-190, 1997.
[13] O. Garcia Jr, J.M. Bigham and O.H. Tuovinen, “Sphalerite oxida-tion by Thiobacillus ferrooxidans and Thiobacillus thiooxidans”, Canadian Journal of Microbiology., vol. 41, pp. 578-584, 1995.
[14] S.S. Bang, S.S. Deshpande and K.N. Han, “The oxidation of galena using Thiobacillus ferrooxidans”, Hydrometallurgy, vol. 37, pp. 181-192, February 1995.
[15] G.R. Chaudhury and R.P. Das, “Bacterial leaching complex sul-fides of copper, lead and zinc”, International Journal of Mineral Processing., vol. 21, pp. 57-64, August 1987.
[16] Å. Sandström, J.E. Sundkvist and S. Petersson, “Bio - oxidation of a complex zinc sulphide ore: A study performed in continuous bench-and pilot scale”, in proceedings of Australian Mineral Foun-dation Conference, Biomine-97, Glenside, Australia, 1997; pp. M1.1.1-M1.1.11.
[17] M.L. Steemson, G.J. Sheehan, D.A. Winborne and F.S. Wong, “An integrated bioleach/solvent extraction process for zinc metal pro-duction form zinc concentrates”, PCT World Patent, WO 94/28184, May 24, 1994.
[18] D.W. Dew, “Comparison of performance for continuous bio-oxidation of refractory gold ore flotation concentrates”, In: T. Var-gas, C.A. Jerez, J.V. Wiertz and H. Toledo (Eds.), Proceedings of
International Biohydrometallurgy Symposium IBS-95. Vina del Mar, Chile, November 19-22, 1995; vol. 1, pp. 239-251.
[19] K.R. Chetty, H.J. Marais and M.J. Kruger, “The importance of pH control in the biooxidation process”, 2000, Available from http://www.bioxgf.co.za/content/publications/pdfs/Importance%20of%20pH%20Control.pdf
[20] D. Stephenson and R. Kelson, “Wiluna BIOX Plant - Expansion and New Developments”, Conference proceedings of IBS-BIOMINE '97, August 4-6, Sydney, Australia, 1997; pp. M4.1.1-M4.1.8,.
[21] M.L. Cunha, C.S. Gahan, N. Menad and Å. Sandström, “Possibili-ties to use oxidic by-products for precipitation of Fe/As from leach-ing solutions for subsequent base metal recovery”, Minerals Engi-neering., vol. 21, pp. 38-47, 2008.
[22] C. Ribbing, “Environmentally friendly use of non-coal ashes in Sweden”, Waste Management., vol. 27, pp. 1428-1435, October 2007.
[23] G. Tham and K. Ifwer, “Utilization of ashes as construction materi-als in landfills”. Värmeforsk report 966, March 2006 (in Swedish).
[24] I. Demir, R.E. Hughes and P.J. DeMaris, “ Formation and use of Coal combustion residues from three types of power plants burning Illinois coals”, Fuel, vol. 80, pp.1659-1673, September 2001.
[25] R.O. Hallberg, J.R. Granhagen and A. Liljemark, “A fly ash/biosludge dry cover for the mitigation of AMD at the falun mine”, Chem Erde., vol. 65, pp. 43-63, 2005.
[26] U.S. E.P.A. SW 846, method 1311; Title 40-261.24 of the Code of Federal Regulation, in Federal Register, vol. 51, pp. 21648-21693, June 1986.
[27] T. Havlík, B. Vidor e Souza, A. M. Bernardes, I.A.H. Schneider and A. Mi kufováa, “Hydrometallurgical processing of carbon steel EAF dust”, Journal of Hazardous Materials, vol. 135, pp. 311-318, July 2006.
[28] W.J. Bruckard, K.J. Davey, T. Rodopoulos, J.T. Woodcock and J. Italiano, “Water leaching and magnetic separation for decreasing the chloride level and upgrading the zinc content of EAF steelmak-ing baghouse dusts” International Journal of Mineral Processing,vol. 75, pp. 1 - 20, 2005.
[29] N. Leclerc, E. Meux and J.M. Lecuire, “Hydrometallurgical recov-ery of zinc and lead from electric arc furnace dust using mononi-trilotriacetate anion and hexahydrated ferric chloride”, Journal of Hazardous Materials, vol. 91, pp. 257-270, April 2002.
[30] M. Cruells, A. Roca and C. Núñez, “Electric arc furnace flue dusts: characterization and leaching with sulphuric acid”, Hydrometal-lurgy, vol. 31, pp. 213-231, November 1992.
[31] P.C. Sweet, “Virginia's lime industry”, quarterly Journal of Vir-ginia division of mineral resources, Charlottesville, Virginia, vol. 32, pp.33-43, November 1986.
[32] J. Pera and A. Amrouz, “Development of highly reactive metakao-lin from paper sludge”, Advanced Cement Based Material, vol. 7, pp. 49-56, 1998.
[33] R.S. Hedin and G.R. Watzlaf, “Passive treatement of acid mine drainage with limestone”, Journal of Environment Quality, vol. 23, pp. 1338-1345, 1994.
[34] M.P. Silverman and D.G. Lundgren, “Studies on the chemoautot-rophic iron bacterium Ferrobacillus ferrooxidans I. An improved medium and a harvesting procedure for securing high cell yields” Journal of Bacteriology, vol. 77, pp. 642-647, 1959.
[35] M.L. Cunha and Å. Sandström, “Characterisation of by-products for use as neutralizing agent in bioleaching”, in XXIII International Mineral Processing Congress, 2006; pp. 1392-1397.
[36] J.E. Sundkvist, Å. Sandström, L. Gunneriusson and E.B. Lind-ström, “Fluorine toxicity in bioleaching systems”, Proceedings of the XVI International Biohydrometallurgy Symposium, 2005; pp. 19-28.
[37] D.W. Shiers, K.R. Blight and D.E. Ralph, “Sodium sulphate and sodium chloride effects on batch culture of iron oxidising bacteria”, Hydrometallurgy, vol. 80, pp. 75-82, November 2005.
Received: June 3, 2008 Revised: September 5, 2008 Accepted: September 8, 2008
© Gahan et al.; Licensee Bentham Open.This is an open access article licensed under the terms of the Creative Commons Attribution Non-Commercial License (http://creativecommons.org/licenses/by-nc/3.0/) which permits unrestricted, non-commercial use, distribution and reproduction in any medium, provided the work is properly cited.


PAPER IV
A study on the toxic effects of chloride on the biooxidation efficiency of pyrite.
C.S. Gahan, J.E. Sundkvist, Å. Sandström
Journal of Hazardous Materials, vol. 172(2-3), pp. 1273-1281, 2009


Journal of Hazardous Materials 172 (2009) 1273–1281
Contents lists available at ScienceDirect
Journal of Hazardous Materials
journa l homepage: www.e lsev ier .com/ locate / jhazmat
A study on the toxic effects of chloride on the biooxidation efficiency of pyrite
Chandra Sekhar Gahana, Jan-Eric Sundkvista,b, Åke Sandströma,∗
a Division of Extractive Metallurgy, Luleå University of Technology, SE-971 87 Luleå, Swedenb Boliden Mineral AB, SE-936 81 Boliden, Sweden
a r t i c l e i n f o
Article history:Received 30 April 2009Received in revised form 29 July 2009Accepted 30 July 2009Available online 7 August 2009
Keywords:MicroorganismPyriteNeutralizationToxicityBiooxidation
a b s t r a c t
Bioleaching operations in areas with limited chloride-free water and use of ashes and dust as neutralizingagents have motivated to study the chloride toxicity and tolerance level of the microorganisms. Biooxi-dation of pyrite using chloride containing waste ash compared with Ca(OH)2 + NaCl as neutralizing agentwas investigated to evaluate the causes of low pyrite oxidation. Both precipitation of jarosite as well asthe toxic effect of chloride on the microorganisms were responsible for lower pyrite recoveries. Anotherstudy with sudden exposure of chloride during pyrite biooxidation, addition of 4 g/L was lethal for themicroorganisms. Addition of 2 g/L chloride resulted in precipitation of jarosite with slightly lower pyriterecovery whereas the addition of 3 g/L chloride temporarily chocked the microorganisms but activity wasregained after a short period of adaptation. Population dynamics study conducted on the experiment with3 g/L chloride surprisingly showed that Leptospirillum ferriphilum, which was dominating in the inocu-lum, completely disappeared from the culture already before chloride was added. Sulphobacillus sp. wasresponsible for iron oxidation in the experiment. Both Acidithiobacillus caldus and Sulphobacillus sp. wereadaptive and robust in nature and their numbers were slightly affected after chloride addition. There-fore, it was concluded that the microbial species involved in the biooxidation of pyrite vary in populationduring the different stages of biooxidation.
© 2009 Elsevier B.V. All rights reserved.
1. Introduction
The microbial mediated extraction of metal values from basemetal sulphide mineral ores and concentrates via bioleach-ing and biooxidation processes is a well-known phenomenonboth in biohydrometallurgy and biomineral processing collec-tively termed as biomining [1]. The biomining processes for theextraction of metal values are mostly carried out in continu-ous stirred tank reactors or in heap leaching operations [1].The dominating mesophilic acidophiles in stirred tank bioreac-tors vary from one type of concentrate to another. The majoracidophiles prevalent in biooxidation of pyritic or arsenopyriticconcentrates at 40 ◦C are Leptospirillum ferrooxidans (48–57%),Acidithiobacillus thiooxidans or Acidithiobacillus caldus (26–34%) andAcidithiobacillus ferrooxidans (10–17%), while A. caldus (65%), L.ferrooxidans (29%) and Sulphobacillus sp. (6%) are the dominat-ing species in the biooxidation of mixed sulphide concentrates at45 ◦C [2–4]. The most widely reported mesophilic iron oxidiserdominating in the continuous stirred tank reactors is L. ferrooxi-dans but in some cases, Leptospirillum ferriphilum dominates thecontinuous stirred tank reactors [2,4,6]. The cause for the dom-
∗ Corresponding author. Tel.: +46 920 491290.E-mail address: [email protected] (Å. Sandström).
inance of L. ferriphilum over L. ferrooxidans is due to its fasteriron oxidation rate and tolerance to slightly higher temperature[5].
All these microbial mediated mineral dissolution processesoperate in an aqueous phase, where the process water becomesvery important, as the microbial culture has to oxidise the solu-ble ferrous iron and replicate rapidly to have sufficient microbialpopulation for successful bioleaching [7]. As the bioleaching pro-cess requires much water for its operation, it becomes difficult attimes to provide sufficient water to bioleaching units in remoteareas, where the availability of the water sources are limited.For the application of bioleaching in areas with limited supply ofchloride-free water, the quality of the process water with regardto salinity is of great importance [8,9]. The quality of process waterin reference to salinity is very important especially for mesophilicacidophiles as they can only tolerate 1–4% (w/v) of chloride, whilefew extreme thermophiles were found to be halophilic by nature[10]. The ground water in some areas of Western Australia contain100 g/L of chloride, which limits the option of biooxidation of auri-ferrous refractory sulphide minerals available in those areas [11].Studies on the toxic effect of chloride on the acidophiles involvedin biooxidation processes have been widely investigated by variousresearchers mostly based on the rate of ferrous iron oxidation in dif-ferent concentrations of chloride supplemented growth medium[12,13].
0304-3894/$ – see front matter © 2009 Elsevier B.V. All rights reserved.doi:10.1016/j.jhazmat.2009.07.133
1274 C.S. Gahan et al. / Journal of Hazardous Materials 172 (2009) 1273–1281
Studies conducted by Blight and Ralph suggested that the initialeffect of inhibitor on the cell doubling time as well as processesof selection and adaptation over subsequent growth cycles shouldbe reflected from the quantitative assessment of the activity ofthe mixed cultures of iron oxidisers [14]. Shiers et al. stated theprolonged detrimental effect on the replication rates of the ironoxidisers with a concentration of 7 g/L of sodium chloride, which isequivalent to 4.2 g/L of chloride [11]. They also suggested that pro-longed exposure of 4.2 g/L of chloride increased the cell doublingtime by a factor 2 in batch cultures, which indicates that minorchanges in the chloride concentration could cause severe lethaleffect on the iron oxidisers by lowering their maximal growth rate.The effect of the chloride on the sulphur oxidation process waspredicted as unclear due to the lack of studies carried out with sul-phur oxidisers. However, they have strongly suggested that modestconcentration of chloride in the process water could have a signif-icant inhibition effect on iron oxidation affecting the biooxidationprocess [11]. A study on bioleaching of zinc sulphide showed adecreasing trend in zinc dissolution with increasing concentrationof chloride from 1% to 4% (w/v) at a pH of 1.5 and temperature of30 ◦C [10]. Leong et al. reported that adaptation of a mixed bacterialculture of Thiobacilli to a chloride level of 5 g/L improved their tol-erance and worked well at a chloride concentration of 8 g/L withoutaffecting the dissolution process in the bioleaching of a copper ore[15]. Weston et al. proposed that the deleterious effects of saltswere due to the sodium ions instead of chloride ions [9]. Theystrongly debated that the coexisting sodium ions favoured the pre-cipitation of ferric iron as sodium jarosites, as they could observenegative effect on the biooxidation process at a concentration of1–2 g/L of chloride when operating at a lower pH range of 1.1–1.3.Similarly Dew et al. suggested that high concentrations of chlo-ride in the bioleaching solution could damage the cell membraneleading to a lethal effect on the microorganisms [2].
Most of the acidophiles used in bioleaching are sensitive tosodium chloride, which restricts their use in biomining applicationat sites where only saline water is available. Few species of ironoxidising acidophiles isolated from geothermal sites belonging toThiobacillus prosperus group [16] were found to be halotolerant bynature, while few moderate thermophiles are also known to behalotolerant [4]. In a study conducted by Norris and Simmons itwas suggested that the pyrite oxidation was mostly carried out bysulphur-oxidizing Acidithiobacilli in the presence of 6% (w/v) salt,whereas the ferrous iron oxidation was carried out by T. prosperus-like acidophiles [17]. Davis-Belmar et al. reported that the leachingof copper was slightly retarded due to precipitation of ferric ironas sodium jarosite at 5% (w/v) NaCl resulting in 20% less ferric ironin solution compared to with 2.5% (w/v) NaCl [18]. Ferrous ironoxidation and leaching of copper ore with halotolerant bacteria incolumns suggested that Thiobacillus prosperous actively oxidizedthe mineral sulphides and maintained the percolating iron in theoxidized state despite the presence of chloride ions that wouldhave prevented the growth of other acidophiles frequently usedfor biooxidation [18]. Apart from the halotolerant group of T. pros-perous another similar halotolerant iron oxidising microorganismAlicyclobacillus-like bacteria were also isolated from marine har-bour sediments [19,20].
The present study focuses on the toxic effects of chloride on thebiooxidation of pyrite. This study was motivated from a previouswork conducted by the authors on the possibilities to replace theconventionally used lime or limestone with waste ash as a neutral-izing agent [21]. The authors suspected two possible reasons for thelower biooxidation in comparison to when calcium hydroxide wasused as neutralizing agent. One reason could be due to the increasein chloride concentration upon the addition of waste ash for neu-tralizing the acid produced by pyrite oxidation. The other reasoncould be due to the precipitation of ferric iron from the solution
as potassium jarosite leading to low content of ferric iron in thebioleaching solution. In the first part, a comparative study was doneto investigate the chloride toxicity by increasing the concentrationof chloride similar to the chloride concentration profile obtainedin the waste ash experiment. Three further experiments were con-ducted with sudden exposure of 2, 3 and 4 g/L of chloride addedin the log phase of the pyrite biooxidation to investigate the toxiceffects on the microorganisms. Population dynamics of the domi-nating microorganisms in the experiment with 3 g/L were done atthree different stages of the biooxidation.
2. Materials and methods
2.1. Pyrite concentrate
The concentrate used for the biooxidation experiment wasa pyrite concentrate obtained from the tailings of chalcopyriteflotation at the Boliden plant in Aitik, Sweden. Mineralogical andchemical analyses have shown that the concentrate sample con-tains pyrite (FeS2), kyanite (Al2SiO5) and quartz (SiO2) as majormineralogical phases with a chemical composition of 39.6% S, 36.4%Fe, 7.7% Si and 2.4% Al (Table 1). The concentrate sample as receivedwas acid washed using sulphuric acid to remove some of the acidconsuming gangue minerals from the concentrate prior to its usein the biooxidation experiments.
2.2. Neutralizing agent
Calcium hydroxide and waste ash were the two neutralizingagents used in this present study. The calcium hydroxide used wasa chemical grade slaked lime, while the waste ash was a mixed flyash from combustion of wood chips and municipal wastes in Swe-den. The waste ash was ring milled for 20 s before used and thecalcium hydroxide was used as received. The particle size obtainedexpressed, as 80% passing (d80) was 20 �m for waste ash and 8 �mfor calcium hydroxide [22]. Both the neutralizing agents were char-acterised for their mineralogical phases, for details see [22], andchemical analysis (Table 1) and was directly added into the pulp ofthe bioreactor in the form of powder.
2.3. Microorganisms and growth medium
A mixed culture of acidophilic and mesophilic microorganismswas used which consisted of iron oxidisers, sulphur oxidisers anda few archaeal species, as determined through Q-PCR analysis byBioclear B.V., Netherlands. The dominating species in the culturewere L. ferriphilum, A. caldus, Acidimicrobium sp. and Sulphobacillussp. The inoculum was taken from a continuous bioreactor in orderto have an identical start up culture for all the experiments. Themicrobial culture in the continuous bioreactor was growing on a 9 Knutrient medium ((NH4)2SO4, 3.0 g/L; KCl, 0.1 g/L; K2HPO4, 0.5 g/L;MgSO4·7H2O, 0.5 g/L; Ca(NO3)2·4H2O, 0.01 g/L) [23] supplementedwith 4.5 g/L of ferrous iron and 2 mM of potassium tetrathionate at adilution rate of 0.021 h−1. The culture was maintained at a temper-ature 35 ◦C at pH of 1.45 ± 0.05 and a redox potential of 740 ± 5 mVvs. Ag/AgCl.
For the study of microbial population dynamics, bioleachingpulp samples were taken on different occasions and fixed by adding1 volume of 2 M Tris–HCl buffer (pH 9.0) and 2 volumes of 96%ethanol for 1 volume of the sample. Later the DNA was extractedfrom the fixed sample for Q-PCR analysis to determine the microbialpopulation. The number of cell count was based on the assump-tion that 1 DNA copy was equal to 1 cell. The method detects DNAfrom both dead and living cells but lysed and dead cells usually aretransferred into the foam covering most bioleaching reactors.

C.S. Gahan et al. / Journal of Hazardous Materials 172 (2009) 1273–1281 1275
Tab
le1
Elem
enta
lcom
pos
itio
nof
the
pyr
ite
con
cen
trat
ean
dn
eutr
aliz
ing
agen
ts.
Si(%
)A
l(%
)C
a(%
)Fe
(%)
K(%
)M
g(%
)M
n(%
)N
a(%
)S
(%)
Ba
(mg/
kg)
Cu
(mg/
kg)
Cr
(mg/
kg)
Mo
(mg/
kg)
Pb(m
g/kg
)V
(mg/
kg)
Zn(m
g/kg
)F
(mg/
kg)
Cl(
mg/
kg)
Pyri
te7.
72.
40.
836
.41.
30.
30.
10.
539
.64,
060
446
26.0
47.4
3125
.576
.8N
.A.
N.A
.C
a(O
H) 2
0.1
0.0
53.6
0.0
0.1
0.4
0.0
<0.0
040.
02<2
33.8
<10.
0<6
.01.
9<2
.027
.330
.91,
047
Was
teas
h8.
04.
012
.34.
64.
51.
50.
24.
65.
221,
840
3,41
058
447
.37,
670
57.9
83,9
003,
624
110,
050
N.A
.:n
otan
alys
ed.
2.4. Analytical and instrumentation techniques
Inductively Coupled Plasma-Atomic Emission Spectrometry(ICP-AES)/Quadrupole Mass Spectrometry (ICP-QMS)/Sector FieldMass Spectrometry (ICP-SFMS) was used for the elementalanalysis. A titrimetric method using cerium sulphate with 1,10-phenanthroline indicator was used to determine the residualferrous ion concentration in the bioleach liquor [24]. Iron con-centrations in the leach liquor during the course of experimentwas analysed by Atomic Absorption Spectroscopy (AAS). A plat-inum electrode with a Ag, AgCl reference electrode was used forthe measurement of the redox potential, and a Lange LDOTM/sc100instrument was used for measuring dissolved oxygen. Mineralog-ical studies of the samples were conducted by X-ray powderdiffraction (XRD) using a Siemens D5000 automatic diffractometerequipped with a continuous scanning device with CuK� radiationof 40 kV and 30 mA and a sample rotation of 30 rpm. Measure-ment of the diffraction patterns were carried out in the range of10–90◦ while, the crystalline phases were identified using the JointCommittee for Powder Diffraction Standards (JCPDS) file of theinstrument.
2.5. Biooxidation experiments and chloride toxicity studies
Biooxidation experiments were carried out in a 2.5 L glass reac-tor with a working volume of 1 L. The batch experiment wasconducted with 10% solids (w/v) of the pyrite concentrate in theiron free 9 K mineral salt medium (900 mL) and inoculated with100 mL mixed microbial culture. Mixing of the pulp was achievedby a propeller stirrer at a rotation of 250 rpm. A temperature of 35 ◦Cwas maintained in the baffled reactor using hot plates. A dissolvedoxygen (D.O.) level of 5 mg/L was maintained inside the reactor byblowing air enriched with CO2 (2–3%, v/v) at a flow rate of 1 L/minunderneath the propeller. Biooxidation of the pyrite concentratewas followed by regular measurement of pH and redox potentialonce or twice daily depending on the state of activity of the bacte-ria. The pulp pH was maintained at 1.5 throughout the experiments.During the initial days of the experiments, an increase in pH dueto the presence of some remaining acid consuming gangue miner-als in the pyrite concentrate was adjusted by adding H2SO4. WhenpH started to decrease because of the biooxidation of the pyriteconcentrate the pH was maintained at 1.5 by addition of neutraliz-ing agents. Calcium hydroxide was used as neutralizing agent inall the experiments except one where waste ash was used. Thetoxic effect of chloride was studied in two different series of exper-iments. In the first, two experiments were conducted, one withwaste ash as a neutralizing agent and another with calcium hydrox-ide as a neutralizing agent, where a total of 6.7 g/L of chloride wasadded serially similar to the increasing chloride concentration inthe waste ash experiment. Another series of experiment was con-ducted where three different concentrations of chloride (2, 3 and4 g/L) was added directly to the biooxidation pulp in the begin-ning of the log phase of the experiment. A population dynamicstudy was conducted in the experiment with 3 g/L chloride. Theoxygen uptake rate (OUR) was determined by measuring the oxy-gen concentration in the bioleach liquor by closing the inflow ofthe oxygen into the reactor, thereafter the decrease of the oxygenconcentration was registered for 3–5 min using an oxygen sensor(Lange LDOTM/sc 100). The relationship between the decrease inoxygen concentration and time was found to be linear and theoxygen uptake rate was determined from the slope of the curve[25]. The OUR value obtained from the experiment determined themicrobial activity during biooxidation. When the OUR reached zerothe experiments were stopped as it indicated no microbial activ-ity. As no iron oxidation would take place once the OUR reacheszero, further prolongation of the experiment would mainly lead to
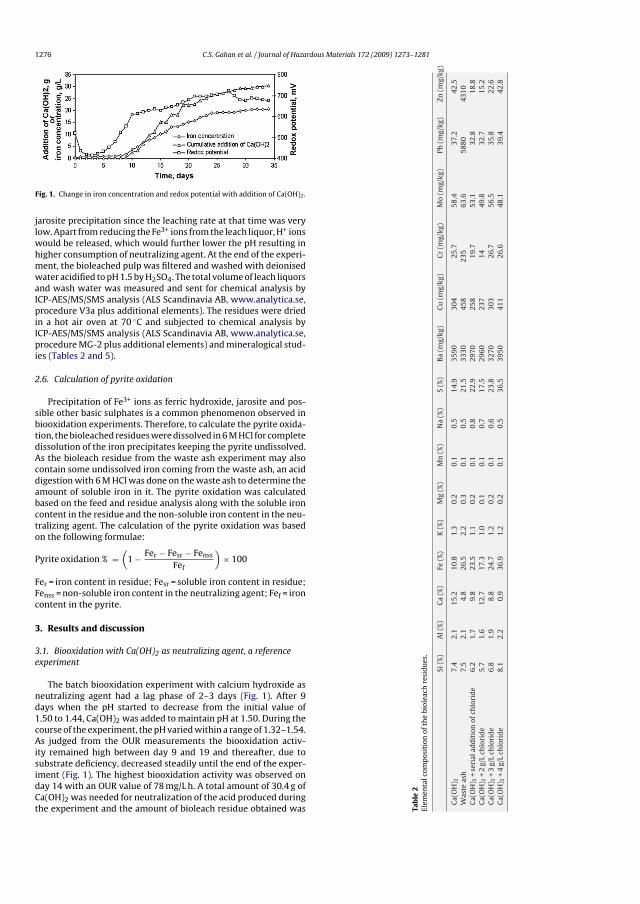
1276 C.S. Gahan et al. / Journal of Hazardous Materials 172 (2009) 1273–1281
Fig. 1. Change in iron concentration and redox potential with addition of Ca(OH)2.
jarosite precipitation since the leaching rate at that time was verylow. Apart from reducing the Fe3+ ions from the leach liquor, H+ ionswould be released, which would further lower the pH resulting inhigher consumption of neutralizing agent. At the end of the experi-ment, the bioleached pulp was filtered and washed with deionisedwater acidified to pH 1.5 by H2SO4. The total volume of leach liquorsand wash water was measured and sent for chemical analysis byICP-AES/MS/SMS analysis (ALS Scandinavia AB, www.analytica.se,procedure V3a plus additional elements). The residues were driedin a hot air oven at 70 ◦C and subjected to chemical analysis byICP-AES/MS/SMS analysis (ALS Scandinavia AB, www.analytica.se,procedure MG-2 plus additional elements) and mineralogical stud-ies (Tables 2 and 5).
2.6. Calculation of pyrite oxidation
Precipitation of Fe3+ ions as ferric hydroxide, jarosite and pos-sible other basic sulphates is a common phenomenon observed inbiooxidation experiments. Therefore, to calculate the pyrite oxida-tion, the bioleached residues were dissolved in 6 M HCl for completedissolution of the iron precipitates keeping the pyrite undissolved.As the bioleach residue from the waste ash experiment may alsocontain some undissolved iron coming from the waste ash, an aciddigestion with 6 M HCl was done on the waste ash to determine theamount of soluble iron in it. The pyrite oxidation was calculatedbased on the feed and residue analysis along with the soluble ironcontent in the residue and the non-soluble iron content in the neu-tralizing agent. The calculation of the pyrite oxidation was basedon the following formulae:
Pyrite oxidation % =(
1 − Fer − Fesr − Fenss
Fef
)× 100
Fer = iron content in residue; Fesr = soluble iron content in residue;Fenss = non-soluble iron content in the neutralizing agent; Fef = ironcontent in the pyrite.
3. Results and discussion
3.1. Biooxidation with Ca(OH)2 as neutralizing agent, a referenceexperiment
The batch biooxidation experiment with calcium hydroxide asneutralizing agent had a lag phase of 2–3 days (Fig. 1). After 9days when the pH started to decrease from the initial value of1.50 to 1.44, Ca(OH)2 was added to maintain pH at 1.50. During thecourse of the experiment, the pH varied within a range of 1.32–1.54.As judged from the OUR measurements the biooxidation activ-ity remained high between day 9 and 19 and thereafter, due tosubstrate deficiency, decreased steadily until the end of the exper-iment (Fig. 1). The highest biooxidation activity was observed onday 14 with an OUR value of 78 mg/L h. A total amount of 30.4 g ofCa(OH)2 was needed for neutralization of the acid produced duringthe experiment and the amount of bioleach residue obtained was Ta
ble
2El
emen
talc
omp
osit
ion
ofth
ebi
olea
chre
sid
ues
.
Si(%
)A
l(%
)C
a(%
)Fe
(%)
K(%
)M
g(%
)M
n(%
)N
a(%
)S
(%)
Ba
(mg/
kg)
Cu
(mg/
kg)
Cr
(mg/
kg)
Mo
(mg/
kg)
Pb(m
g/kg
)Zn
(mg/
kg)
Ca(
OH
) 27.
42.
115
.210
.81.
30.
20.
10.
514
.935
9030
425
.758
.437
.242
.5W
aste
ash
7.5
2.1
4.8
26.5
2.2
0.3
0.1
0.5
21.5
3330
458
235
63.6
5880
4310
Ca(
OH
) 2+
seri
alad
dit
ion
ofch
lori
de
6.2
1.7
9.8
23.5
1.1
0.2
0.1
0.8
22.9
2970
258
19.7
53.1
32.8
18.8
Ca(
OH
) 2+
2g/
Lch
lori
de
5.7
1.6
12.7
17.3
1.0
0.1
0.1
0.7
17.5
2960
237
1449
.832
.715
.2C
a(O
H) 2
+3
g/L
chlo
rid
e6.
81.
98.
824
.71.
20.
20.
10.
623
.832
7030
326
.756
.535
.822
.6C
a(O
H) 2
+4
g/L
chlo
rid
e8.
12.
20.
936
.91.
20.
20.
10.
536
.539
5041
126
.648
.139
.442
.8

C.S. Gahan et al. / Journal of Hazardous Materials 172 (2009) 1273–1281 1277
Fig. 2. Comparative plot of change in redox potential.
109 g (Table 4). Iron concentration in the leach liquor increasedup to 20 g/L by day 30 and maintained at the same level until theend of the experiment (Fig. 1). Pyrite oxidation in this experimentwas 85% with a final sulphate concentration of 54 g/L in the leachliquor (Tables 3 and 4). Gypsum was the major mineralogical phaseobserved in the bioleach residue with minor phases of jarosite,quartz and pyrite (Table 5).
3.2. Comparative biooxidation study with additions of waste ashand Ca(OH)2 + NaCl for neutralization
A comparative study was conducted to examine the effect ofchloride on pyrite biooxidation by using waste ash in one experi-ment and Ca(OH)2 + NaCl in the other (Fig. 4). In the experimentwith Ca(OH)2 + NaCl, the additions of Ca(OH)2 was done when-ever required to maintain the pH at 1.5, whereas the additionsof NaCl was done to obtain the same chloride concentration asin the waste ash experiment but with a time delay due to thelonger lag phase in that experiment (Figs. 2 and 4). In the wasteash experiment, the highest oxidation activity was observed onday 11 with an OUR of 52 mg/L h and at a redox potential of599 mV, while the Ca(OH)2 + NaCl experiment had its highest activ-ity on day 13 with an OUR of 62 mg/L h and at a redox potential of562 mV.
The iron concentration in the waste ash experiment increased to6 g/L by day 10 and then decreased steadily to a final concentrationof 1.2 g/L (Fig. 3). In contrast, in the Ca(OH)2 + NaCl experiment, theiron concentration had an increasing trend up to 8.1 g/L until day 35and then decreased down to 5.9 g/L (Fig. 3). At the redox potentialsobtained, the main part (96–98%) of the iron in the bioleach liquorswas in the ferric form as determined from residual ferrous irontitration. The iron concentration in solution was much lower in theexperiments with waste ash and Ca(OH)2 + NaCl compared to thereference experiment with Ca(OH)2 (Table 3) (Fig. 3). The reason forthe lower iron concentration in these experiments was the forma-tion of jarosite, which is enhanced in the presence of monovalent
Fig. 3. Comparative plot of change in iron concentration. Tab
le3
Elem
enta
lcom
pos
itio
nof
the
biol
each
liqu
ors.
Com
pos
itio
n
Fe(g
/L)
Na
(g/L
)SO
42−
(g/L
)C
l(g/
L)C
a(m
g/L)
K(m
g/L)
Mg
(mg/
L)Si
(mg/
L)A
l(m
g/L)
Co
(mg/
L)C
u(m
g/L)
Mn
(mg/
L)Zn
(mg/
L)
Ca(
OH
) 220
.00.
0154
.2N
.A.
661
<10
220
168
207
54.7
10.3
12.7
14.4
Was
teas
h1.
01.
820
.16.
750
142
957
014
1012
4018
.614
255
.032
70C
a(O
H) 2
+se
rial
add
itio
nof
chlo
rid
e6.
03.
120
.86.
770
7<5
022
016
022
031
.414
.014
.714
.2C
a(O
H) 2
+2
g/L
chlo
rid
e11
.40.
733
.62.
065
7<1
026
016
823
751
.513
.017
.516
.0C
a(O
H) 2
+3
g/L
chlo
rid
e8.
31.
426
.83.
066
4<5
021
516
123
430
.913
.315
.016
.5C
a(O
H) 2
+4
g/L
chlo
rid
e3.
22.
416
.54.
066
727
914
516
116
65.
59.
310
.914
.7
N.A
.:n
otan
alys
ed.

1278 C.S. Gahan et al. / Journal of Hazardous Materials 172 (2009) 1273–1281
Table 4Summary of the biooxidation experimental results.
Ca(OH)2 Waste ash Ca(OH)2 + serialaddition of chloride
Ca(OH)2 + 2 g/Lchloride
Ca(OH)2 + 3 g/Lchloride
Ca(OH)2 + 4 g/Lchloride
Neutralizing agent addition (g) 30.4 61.3 25.2 31.9 20.7 1.9Bioleach residue (g) 109.2 144.4 126.9 138.1 112.9 88.5Bioleach filtrate (L) 1.04 0.92 0.93 0.93 0.89 0.97Pyrite oxidation (%) 84.6 34.4 48.8 71.0 47.8 13.4
cations, according to the following equation.
X+ + 3Fe3+ + 2SO42− + 6H2O → XFe3(SO4)2(OH)6 + 6H+
[X+ = K+, Na+, H3O+, NH4+, . . .] (1)
In the experiment with waste ash, the jarosite precipitationwas more severe since the waste ash contained relatively highamounts of potassium (4.5%) which is the most favourable cationfor jarosite formation (Table 1) [26]. The immediate effect of jarositeprecipitation according to Eq. (1) is two-fold; it decreases the con-centration of ferric iron, which is the active oxidising agent in pyritedissolution and lowers the pH, which increases the demand of neu-tralization. The lower ferric iron concentration in solution obtainedin the experiments with chloride affects the leaching kinetics neg-atively. At the same time the microorganisms are experiencingan increasing chloride concentration, which is influencing theiroxidising capability negatively which is seen on the lower redoxpotential in these experiments (Figs. 2 and 4). When waste ash orNaCl is added to the pulp the increasing trend in redox potentialis stopped, this is an effect of both jarosite precipitation, loweringthe amount of ferric iron in solution, and a lower microbial oxi-dation rate. Other possible reasons for the lowering of the redoxpotential could have been a change in speciation due to ferric ironcomplexation with chloride ions. This can however be ruled outsince the effect of chloride additions on redox potential was ignor-able as tested on relevant synthetic solutions (results not given)and which also was found in the paper by Welham et al. [27]. OURmeasurements showed a considerable decreased microbial activ-ity once the chloride concentration in solution reached levels of2–3 g/L. In the Ca(OH)2 + NaCl experiment a low OUR was observedfor a long time even after the final chloride concentration of 6.7 g/Lwas reached. The pyrite oxidation obtained were 34% and 49% forthe waste ash and Ca(OH)2 + NaCl, respectively, compared to 85%in the reference experiment (Table 4). The reasons for the lowerfinal pyrite oxidation is thus dual and depends on both the reducedamount of ferric iron due to jarosite precipitation as also argued byWeston et al. and also due to the direct toxic effect of chloride ionson the microbes [9].
The sulphate concentration in the bioleach liquor in both exper-iments was ∼20 g/L, which was considerable less than in thereference due to extensive losses of sulphate into solid phases
Fig. 4. Comparative plot of increase in chloride concentration.
of jarosite and gypsum (Table 3). Gypsum and pyrite were themajor mineralogical phases observed in the bioleached residues inboth experiments along with minor phases of quartz and jarosite(Table 5).
3.3. Toxic effect on biooxidation with sudden exposure of 2, 3 and4 g/L of chloride
In this series of experiments, an attempt was made to deter-mine the chloride concentration inhibiting the microbial activity bya sudden exposure of chloride in the mid log phase of pyrite bioox-idation. Three different concentrations, i.e. 2, 3 and 4 g/L of chloridewas decided for this investigation based on the work reported byShiers et al. stating that 4.2 g/L of chloride provokes an inhibitiveeffect which reduced the cell replication rate by more 50%. The sud-den exposure of the chloride during biooxidation was motivatedfrom the studies conducted by Lawson et al. and Touvinen et al.[12,13].
3.3.1. Effect of sudden exposure of 2 g/L chloride on thebiooxidation of pyrite
This experiment had a lag phase of 4 days after which the redoxpotential started to increase (Fig. 5). When the redox potentialreached 565 mV by day 13, an addition of 3.3 g sodium chloride(2 g/L chloride) was made to the bioleaching pulp. The responsein redox potential was immediate and decreased for 2 consecu-tive days down to 548 mV, which shows that the microorganismsreacted instantly to the chloride ions (Fig. 5). Later the redox poten-tial gradually recovered but at a slower pace which suggest that themicroorganisms can adapt and tolerate 2 g/L of chloride. The ironconcentration in the bioleaching solution maintained an increas-ing trend up to 12.4 g/L on day 41, which was at a much lower levelwhen compared to the reference experiment (Fig. 6). It can also be
Table 5Mineralogical phases of bioleach residues identified by XRD.
Bioleach residues Phases identified by XRD
Ca(OH)2 Gypsum (CaSO4·2H2O), jarositehydronian((K,H3O)Fe3(SO4)2(OH)6), quartz(SiO2), pyrite (FeS2)
Waste ash Gypsum (CaSO4·2H2O), jarositehydronian((K,H3O)Fe3(SO4)2(OH)6), quartz(SiO2), pyrite (FeS2)
Ca(OH)2 + serial addition of chloride Gypsum (CaSO4·2H2O), jarositehydronian((K,H3O)Fe3(SO4)2(OH)6), quartz(SiO2), pyrite (FeS2)
Ca(OH)2 + 2 g/L chloride Gypsum (CaSO4·2H2O), jarositehydronian((K,H3O)Fe3(SO4)2(OH)6), quartz(SiO2), pyrite (FeS2)
Ca(OH)2 + 3 g/L chloride Gypsum (CaSO4.2H2O), jarositehydronian((K,H3O)Fe3(SO4)2(OH)6), quartz(SiO2), pyrite (FeS2)
Ca(OH)2 + 4 g/L chloride Pyrite (FeS2), sphalerite cadmian(Zn0.9Cd0.1S), quartz (SiO2)

C.S. Gahan et al. / Journal of Hazardous Materials 172 (2009) 1273–1281 1279
Fig. 5. Comparative plot of redox potential evolution in the experiments with 2, 3and 4 g/L chloride with standard Ca(OH)2.
seen that when the chloride was added on day 13 the rate of ironincrease in solution had a dip before it started to increase again. Thereasons for the lower iron concentration in solution are both due tojarosite precipitation and lower pyrite oxidation efficiency as com-pared to the reference experiment. The pyrite oxidation was 71.0%in this experiment which was 13.6% lower than in the Ca(OH)2 ref-erence experiment (Table 4). The major mineralogical phase foundin the bioleached residue through XRD was gypsum together withminor phases of jarosite, quartz and pyrite (Table 5).
3.3.2. Effect of sudden exposure of 3 g/L chloride on thebiooxidation of pyrite
This experiment had a lag phase of 6 days and at day 14 whena high biooxidation activity was reached, with a redox potentialof 571 mV and an OUR of 46 mg/L h, 4.9 g of sodium chloride (3 g/Lchloride) was added into the bioleaching pulp (Fig. 5). The additionwas followed by an immediate fall in redox potential from 571 to538 mV in the following day (Fig. 5). The redox potential continuedto decrease until it reached 515 mV by day 18 after which it startedto recover. The inhibitory effect of the chloride on the microor-ganisms was also observed by the OUR measurements, which onday 18 gave a zero reading stating that no biooxidation activityoccurred. Interestingly, from that day biooxidation slowly startedto recover as evidenced by a gradual increase in both redox poten-tial (Fig. 5) and the OUR which reached 26 mg/L h on day 26. Thebehaviour of the iron concentration in solution had a similar trendas in the 2 g/L chloride experiment, i.e. after chloride addition therewas a halt in the increase but in the 3 g/L experiment the durationof this was much longer before the iron concentration started toincrease again (Fig. 6). When Figs. 5 and 6 are compared it can beseen that there is a delay between the recovery of the redox poten-tial and increasing iron concentration in solution. This is probablyan effect of the high sodium ion concentration in this experiment,which induces precipitation of jarosite. Thereafter, the iron con-
Fig. 6. Comparative plot of change in iron concentration with the experiments with2, 3 and 4 g/L chloride with standard Ca(OH)2.
Table 6Microbial population dynamics in 3 g/L of chloride experiment.
Microorganism Number of cells per mL
Inoculum Day 14 Day 16 Day 21
Universal; Bacteria 1.7 × 10⁸ 9.2 × 10⁷ 3.7 × 10⁸ 8.8 × 10⁷
Universal; Archaea 1.8 × 10⁸ N.D. N.D. N.D.Acidimicrobium sp. N.D. N.D. N.D. N.D.Acidithiobacillus caldus 4.2 × 10⁷ 3.2 × 10⁸ 1.5 × 10⁸ 3.4 × 10⁷
Leptospirillum ferriphilum 4.7 × 10⁸ N.D. N.D. 6.3 × 10⁵
Sulfobacillus sp. 8.2 × 10⁵ 3.8 × 10⁷ 1.5 × 10⁷ 1.1 × 10⁷
N.D.: not detected.
centration in the bioleaching solution increased from 3.1 g/L up toa maximum of 9 g/L, which shows that the biooxidation of pyritecommenced after the microorganisms got adapted to the chloride.However, despite the fact that the microorganisms were able toregain their activity and the experiment was allowed to run for46 days until no biooxidation activity was detected through OURmeasurements; the pyrite oxidation obtained was only 47.8% ascompared to 84.6% in the reference experiment (Table 4). It appearsthat chloride additions apart from giving lower iron concentrationsbecause of jarosite precipitation also gives lower pyrite recover-ies due to attachment of jarosite onto the pyrite surfaces whichhinders further oxidation as also stated by Watling [28]. The lowsulphate concentration in the bioleach liquor of 27 g/L also sup-ports the massive precipitation of jarosite and gypsum (Table 3).The bioleach residue comprised of gypsum as major mineralogicalphase together with minor phases of jarosite and quartz (Table 5).
3.3.3. Effect of sudden exposure of 4 g/L chloride on thebiooxidation of pyrite
After a lag phase of 5 days the culture became active and on day11, at a redox potential of 572 mV and with an OUR value 32 mg/L h,6.6 g of sodium chloride (4 g/L chloride) was added to the reactor(Fig. 5). Similar to the experiments with 2 and 3 g/L an immediateeffect on the microbial activity by an instant fall in redox potentialwas observed also in this experiment. However, the activity wasirreversibly lost and the OUR reached zero within 5 days (i.e. day16) after the chloride addition (Figs. 5 and 6). The low pyrite oxida-tion of only 13.4% resulted in low concentrations of both iron andsulphate in the leachate (Tables 3 and 4). The major mineralogicalphase found in the bioleach residue was pyrite with minor phasesof quartz and sphalerite, i.e. similar to the mineralogical phasesobserved in pyrite concentrate (Table 5).
3.4. Population dynamics study of microorganisms in a chlorideaffected biooxidation process
As seen in the previous section, the experiment with suddenexposure of 3 g/L chloride exhibited much dynamics with an appar-ent complete loss of microbial activity followed by a recovery ofthe activity after a short period of adaptation. This experimentwas therefore chosen for the microbial population dynamics study.Four samples were taken for the study on different occasions, i.e.the inoculum, day 14 just before the chloride was added, day 16when the culture was shocked and exhibiting a decreasing redoxpotential trend and on day 21 when the culture had recovered. Thepopulation of the microorganisms in the inoculum was dominatedby the iron oxidiser L. ferriphilum and with a magnitude lower con-centration the sulphur oxidiser A. caldus (Table 6). The iron andsulphur oxidising species Sulphobacillus sp. was also detected atlow concentration while Acidimicrobium sp. was not detected at all.Interestingly, it was found that the population of both the universalcount of bacteria as well as archaea in the inoculum was approx-imately same (Table 6). In the sample taken on day 14, when the

1280 C.S. Gahan et al. / Journal of Hazardous Materials 172 (2009) 1273–1281
culture was growing in the log phase on the pyrite concentrate,drastic changes in the bacterial population was observed. The pre-viously dominating species L. ferriphilum and the archaea was nowbelow the detection limit while At. caldus had increased in numberand become the dominating species. Sulphobacillus sp. increasedmuch in numbers and was now the dominating iron oxidiser inthe culture. On day 16, i.e. 2 days after the chloride addition, thesame species were present in the bioleaching pulp but the amountwas reduced to approximately the half of what was present beforethe chloride addition. It is obvious that the microorganisms wereseverely affected by the chloride ions but still maintained relativelyhigh populations. In the sample taken on day 21, when the culturewas more active again as judged from the increase of the redoxpotential (Fig. 5), the number of microorganisms were reduced fur-ther and it was mainly the sulphur oxidiser At. caldus that decreasedin number, in fact At. caldus had been reduced with an order of mag-nitude during the 7 days in chloride environment. The number ofSulphobacillus sp. remained approximately the same as on day 16and L. ferriphilum started to emerge again although at low numbers(Table 6).
From the results obtained it is clear that L. ferriphilum is verysensitive to changes in the environment, this species was dominat-ing in the inoculum but disappeared to non-detectable numbersonce added into the batch bioleaching reactor. It is known that Lep-tospirillum species usually are the main iron oxidiser in continuousbioleaching reactors and that one characteristic of these species isthat it is outgrowing other iron oxidisers at high redox potentials[29]. The reasons for this high sensitivity can only be speculated onwhere one reason can be that it simply has problems to withstandsudden changes in the environment. In this experiment, Leptospiril-lum was thriving in a continuous reactor at high redox potential andwas then transferred into a batch reactor where the redox potentialquickly decreased from 740 mV down to less than 500 mV withinan hour and then further down to 420 mV within a day. On the otherhand At. caldus and especially Sulphobacillus sp. were not affectedby the change in environment and were growing to higher numbersin the presence of pyrite.
The result of this experiment is surprisingly that Sulphobacil-lus sp. initially present in only very low numbers, in fact has beenresponsible for all ferrous iron oxidation, at least until day 21, in theexperiment. Implications of this is that care must be taken whenpure cultures are used in batch experiments since it might be aspecies present in the inoculum at very low numbers or in the con-centrate itself that might be the species actually responsible for thebiooxidation.
4. Conclusions
It has been shown that the presence of chloride in solutions dur-ing biooxidation of pyrite severely affects the leaching yields. Thereasons for the lower recoveries depends both on a direct toxiceffect of chloride on the microorganisms and on the jarosite precipi-tation induced by the chloride counter ion, i.e. sodium or potassium.It was seen that with the same chloride concentrations the potas-sium containing waste ash gave lower pyrite oxidation comparedto the experiment where sodium chloride was added. Jarosites ofpotassium are formed more easily than those of sodium and there-fore a larger amount of ferric iron was removed from the leachatein the waste ash experiment. In experiments performed with sud-den exposure of various concentrations of sodium chloride, themicroorganisms were initially shocked as seen by a lowered OURbut were able to recover their activity with additions of 2 and3 g/L chloride, whereas at a concentration of 4 g/L the activity wasirreversibly lost. It is also concluded that the more jarosite thatis formed the less pyrite oxidation is obtained. The lower leaching
yields are observed despite considerable amounts of remaining fer-ric iron in the leachate that probably is due to jarosite covering thepyrite surfaces thereby hindering further leaching.
The microbial dynamics study showed that L. ferriphilum is verysensitive to sudden changes in their environment. L. ferriphilum wasthe dominating species in the inoculum, which disappeared com-pletely from the leaching pulp even before chloride was added, butreappeared at the later stages of leaching at low numbers. The mostrobust species were Sulphobacillus sp. and At. caldus and especiallythe former which was present at low numbers in the inoculum butin fact was the species responsible for iron oxidation during theprocess.
Acknowledgements
The authors wish to express their gratitude for financial sup-port from the EU-funded integrated project BioMinE, contract No.500329-1. Funding from Carl Bennet AB is also gratefully acknowl-edged. Thanks to Kempe-stiftelsen and Boliden Minerals AB fortheir timely financial support of the work.
References
[1] D.E. Rawlings, D.B. Johnson, The microbiology of biomining: development andoptimization of mineral—oxidising microbial consortia, Microbiology 53 (2007)315–324.
[2] D.W. Dew, E.N. Lawson, J.L. Broadhurst, The BIOX@ process for biooxidation ofgold bearing concentrates, in: D.E. Rawlings (Ed.), Biomining, Springer, Berlin,Heidelberg, New York, 1997, pp. 45–80.
[3] N. Okibe, M. Gericke, K.B. Hallberg, D.B. Johnson, Enumeration and character-isation of acidophilic microorganisms isolated from a pilot plant stirred-tankbiooxidation operation, Appl. Environ. Microbiol. 69 (2003) 1936–1943.
[4] P.R. Norris, Acidophile diversity in mineral sulfide oxidation, in: D.E. Rawlings,D.B. Johnson (Eds.), Biomining, Springer-Verlag, Berlin, Heidelberg, New York,2007, pp. 199–212.
[5] J.J. Plumb, R.B. Hawkes, P.D. Franzmann, The microbiology of moderately ther-mophilic and transiently thermophilic ore heaps, in: D.E. Rawlings, D.B. Johnson(Eds.), Biomining, Springer-Verlag, Berlin, Heidelberg, New York, 2007, pp.217–235.
[6] J.E. Sundkvist, C.S. Gahan, Å. Sandström, Modeling of ferrous iron oxidation byLeptospirillum ferrooxidans-dominated chemostat culture, Biotechnol. Bioeng.99 (2008) 378–389.
[7] F.K. Crundwell, How do bacteria interact with minerals? Hydrometallurgy 71(2003) 75–81.
[8] J.R. Budden, P.A. Spencer, The effect of temperature and water quality on bac-terial oxidation: the advantages of a moderately thermophilic culture overconventional Thiobacillus cultures, in: Randol Gold Forum, 1991, pp. 271–274.
[9] T. Weston, J. Perkins, I. Ritchie, H. Marais, Concentrate biooxidation in a hyper-saline environment for Knowna Belle, Biomine’94, in: International Conferenceand Workshop Applications of Biotechnology to the Minerals Industry, Aus-tralian Mineral Foundation, Perth, WA, 1994.
[10] H. Deveci, M.A. Jordan, N. Powell, I. Alp, Effect of salinity and acidity on bioox-idation activity of mesophilic and extremely thermophilic bacteria, Trans.Nonferrous Met. Soc. China 18 (2008) 714–721.
[11] D.W. Shiers, K.R. Blight, D.E. Ralph, Sodium sulphate and sodium chloride effectson batch culture of iron oxidising bacteria, Hydrometallurgy 80 (2005) 75–82.
[12] E.N. Lawson, C.J. Nicholas, H. Pellat, The toxic effects of chloride ions onThiobacillus ferrooxidans, in: T. Vargas, C.A. Jerez, J.V. Wiertz, H. Toledo (Eds.),Biohydrometallurgy Processing, University of Chile, 1995.
[13] O.H. Tuovinen, S.I. Niemela, H.G. Gyllenberg, Effect of mineral nutrients andorganic substances on the development of Thiobacillus ferrooxidans, Biotech.Bioeng. 13 (1971) 517–527.
[14] K.R. Blight, D.E. Ralph, Effect of ionic strength on iron oxidation with batchcultures of chemolithotrophic bacteria, Hydrometallurgy 73 (2004) 325–334.
[15] B.J.Y. Leong, D.B. Dreisinger, M. Lo, R.M.R. Branion, R.P. Hackl, L.S. Gormerly, D.R.Crombie, The microbiological leaching of a sulphidic copper ore in a stronglysaline medium (I): shake flask and column studies, in: A.E. Torma, J.E. Wey,V.I. Lakshmanan (Eds.), Biohydrometallurgical Technologies, vol. 1: Proc. of Int.Biohydrometallurgy Symp., TMS, Warrendale, PA, 1993, pp. 117–126.
[16] H. Huber, K.O. Stetter, Thiobacillus prosperous sp. nov., represents a new group ofhalotolerant metal-mobilising bacteria isolated from marine geothermal field,Arch. Microbiol. 151 (1989) 479–485.
[17] P.R. Norris, S. Simmons, Pyrite oxidation of halotolerant, acidophilic bacteria,in: M. Tsezos, A. Hatzikioseyian, E. Remoundaki (Eds.), Biohydrometallurgy:A Sustainable Technology in Evolution, Part II, National Technical University,Athens, 2004, pp. 1347–1351.
[18] C.S. Davis-Belmar, J.L.C. Nicolle, P.R. Norris, Ferrous iron oxidation and leachingof copper ore with halotolerant bacteria in ore columns, Hydrometallurgy 94(2008) 144–147.

C.S. Gahan et al. / Journal of Hazardous Materials 172 (2009) 1273–1281 1281
[19] A.G. Crane, P.J. Holden, Leaching of harbour sediments by estuarine iron oxi-dising bacteria, in: R. Amils, A. Ballester (Eds.), Biohydrometallurgy and theEnvironment Towards the Minning of the 21st Century. Part A, Elsevier, Ams-terdam, 1999, pp. 229–238.
[20] P.J. Holden, L.J. Foster, B.A. Neilan, G. Berra, Q.M. Vu, Characterisation of novelsalt tolerant iron oxidising bacteria, in: V.S.T. Ciminelli, O. Garcia Jr. (Eds.),Biohydrometallurgy: Fundamentals Technology and Sustainable Development,Part A, Elsevier, Amsterdam, 2001, pp. 283–290.
[21] C.S. Gahan, M.L. Cunha, Å. Sandström, Study on the possibilities to use ashes, EAFdust and lime sludge as neutralizing agent in biooxidation, Open Min. Process.J. 1 (2008) 26–36.
[22] M.L. Cunha, Å. Sandström, Characterisation of by-products for use as neutraliz-ing agent in biooxidation, in: XXIII International Mineral Processing Congress,2006, pp. 1392–1397.
[23] M.P. Silverman, D.G. Lundgren, Studies on the chemoautotrophic iron bac-terium Ferrobacillus ferrooxidans I. An improved medium and a harvestingprocedure for securing high cell yields, J. Bacteriol. 77 (1959) 642–647.
[24] J.M. Kolthoff, B. Sandell, Text Book of Quantitative Inorganic Chemistry,Macmillan Publishing Co, New York, NY, 1963.
[25] M. Hagman, J.L.C. Jansen, Oxygen uptake rate measurements for application atwastewater treatment plants, Vatten 63 (2007) 131–138.
[26] J.E. Dutrizac, Factors affecting alkali jarosite precipitation, Metall. Trans. B 14(1983) 531–539.
[27] N.J. Welham, K.A. Malatt, S. Vukcevic, The effect of solution speciation oniron–sulphur–arsenic–chloride systems at 298 K, Hydrometallurgy 57 (2000)209–223.
[28] H.R. Watling, The bioleaching of sulphide minerals with emphasis on coppersulphides—a review, Hydrometallurgy 84 (2006) 81–108.
[29] D.E. Rawlings, H. Tributsch, G.S. Hansford, Reasons why ‘Leptospirillum’-likespecies rather than Thiobacillus ferrooxidans are the dominant iron-oxidizingbacteria in many commercial processes for the biooxidation of pyrite andrelated ores, Microbiology 145 (1999) 5–13.


PAPER V
Use of mesalime and electric arc furnace (EAF) dust as a neutralising agent in
biooxidation of refractory gold concentrate and their influence on the gold
recovery by subsequent cyanidation.
C.S. Gahan, J.E. Sundkvist, Å. Sandström
Submitted to Minerals Engineering, 2009


Use of mesalime and electric arc furnace (EAF) dust as neutralising agents in
biooxidation and their effects on gold recovery in subsequent cyanidation
Chandra Sekhar Gahana, Jan-Eric Sundkvista,b and Åke Sandströma*
aDivision of Extractive Metallurgy, Department of Chemical Engineering and Geosciences,
Luleå University of Technology, SE-971 87 Luleå, Sweden.
bBoliden Mineral AB, SE-936 81 Boliden, Sweden
*Corresponding author: Åke Sandström, E-mail: [email protected],
Tel.: +46 920 491290, Fax: +46 920 491199
Abstract
The cost of lime/limestone for neutralisation is generally the second largest operation cost in
bioleaching. Therefore, studies were conducted to investigate the possibilities to use by-
products as mesalime and Electric Arc Furnace (EAF) dust for neutralisation during
continuous biooxidation of a refractory gold concentrate. The experiments were done with a
retention time of 57 hours in a one-stage reactor and the influence of by-products on the
biooxidation performance was evaluated. The neutralising capacity of EAF dust was lower,
while the mesalime was similar to the Ca(OH)2 reference. The arsenopyrite oxidation in the
experiments ranged from 85-90%, whereas the pyrite oxidation was 63-74%. In subsequent
cyanidation final gold recoveries of 90% were achieved with bioresidues from mesalime and
Ca(OH)2, while the EAF dust bioresidue had a recovery of 85%. The higher elemental sulphur
content probably encapsulates part of the gold, which explains the lower recovery for the EAF
dust bioresidue, despite a longer residence time. Cyanide consumption was relatively high and
ranged from 8.1-9.2 kg/tonne feed after 24 hours of cyanidation. Overall, the by-products
tested have proved to be feasible options as neutralising agents in bioleaching operations.
Key words: Mesalime, EAF dust, Neutralisation, Biooxidation, Cyanidation.

Page 2 of 32 2
1. Introduction
Biooxidation of refractory gold in continuous stirred tank reactors and bioleaching of copper
and nickel via heap reactors are some of the established and commercialised technologies in
present days. Bioprocessing of ores and concentrates provides economical, environmental
advantages and technical advantages over conventionally used roasting and pressure oxidation
(van Aswegen et al., 2007; Rawlings et al., 2003; Lindström et al., 2003; Liu et al., 1993).
Increasing demand for gold motivates the mineral exploration from economical deposits and
cheaper processing for their efficient extraction. Different chemical and physical extraction
methods have been established for the recovery of gold from different types and grades of
ores and concentrates. Generally, high-grade oxidic ore are pulverised and processed via
leaching, while refractory ore containing carbon are roasted at 500ºC to transform it into an
oxidic ore by the removal of carbon due to combustion and sulphur as sulphur dioxide gas.
However, the sulphidic refractory gold ores without carbon are oxidised by autoclaving to
liberate the gold from sulphide minerals followed by cyanide leaching for the recovery of
gold (Reith et al., 2007). Replacement of the roasting and pressure oxidation processes by
continuous stirred tank reactors as a pre-treatment for successful removal of iron and arsenic
via biooxidation from the refractory gold concentrate is working successfully in the global
scenario today. Presently majority of the commercial application on stirred tank biooxidation
of refractory gold are using the Gold field’s proprietary BIOX@ process, whereas few of them
use the Canadian-based BacTech Mining Company’s BACOX process (Rawlings et al., 2003).
Bioprocessing of refractory sulphide ores and concentrates as pre-treatment for gold
extraction requires neutralisation at two different stages. The first is carried out in the stirred
bioreactors. Generally, the working pH in the reactors during biooxidation ranges between pH
1.0-2.0. To maintain the desired pH level, limestone is normally used which also fulfils the
carbon requirement for the microbial growth. The second neutralisation is done on the leach
Page 3 of 32 3
liquor using lime/limestone to precipitate iron, arsenic and base metals from the solution
using slaked lime (Gahan et al., 2009a). To avoid iron precipitation as jarosite, sulphuric acid
may be used to adjust the pH due to the acid consuming gangue minerals in the ore or
concentrate (Dew, 1995; Chetty et al., 2000). Operation of the bioreactor in controlled pH
conditions increases the efficiency of the process, whereas the use of cheaper neutralising
agent like dolomite, ankerite or calcrete (a low-grade limestone) could enhance the cost
efficiency of the stirred tank biomining (van Aswegen and Marais, 1999). The bioresidues
obtained after biooxidation of refractory gold concentrates are further treated by cyanidation
for gold recovery, while the leach liquor is neutralised for precipitation of Fe3+ iron and ferric
arsenate (Stephenson and Kelson, 1997). Studies conducted on the use of oxidic industrial by-
products as a substitute neutralising agent to lime/ limestone in the biooxidation of pyrite had
shown positive results as stated by authors in their previous works (Gahan et al., 2009a;
Gahan et al., 2008).
In another study on the industrial oxidic by-products to evaluate their neutralising capacity by
chemical leaching at pH 1.5, the optimum pH level for bioleaching microorganisms was
found to be successful suggesting its feasibility to be used in bioleaching and biooxidation
processes (Cunha et al., 2008a). Use of industrial oxidic by-products for precipitation of
Fe/As from the leaching system due to their good neutralising capacity, showed the possibility
in its application in the bioprocess (Cunha et al., 2008b). Extensive use of neutralising agents
in several steps of bioprocessing of refractory gold motivates the current research on
biohydrometallurgy to focus on finding an alternative neutralising agent to limestone. When a
suitable alternative neutralising agent is to be chosen some important criteria need to be
fulfilled. Firstly, the neutralising capacity; secondly, it should be non-toxic to the
microorganisms; thirdly, the overall net cost for delivery and handling the alternative

Page 4 of 32 4
neutralising agent which is a function of freight cost etc but may also include an alternative
cost for disposal.
Industrial oxidic by-product like electric arc furnace (EAF) dust recovered from the gas
cleaning system of scrap based steel production, which usually contains high concentrations
of zinc and chloride, constitutes about 1.5% of the total output from a typical scrap based steel
industry. This EAF dust is considered environmentally hazardous under the U.S. EPA's solid
waste Resource Conservation and Recovery Act (RCRA) as it contains amongst others
contains lead, cadmium and chromium (U.S. E.P.A. SW 846 Method 1311, 1986). Several
millions dollars is spent by the steel industries for the treatment and disposal of the EAF dust,
while hydrometallurgical recovery of zinc by recycling EAF dust is one of the possibility as
stated by various workers in past (Havlík et al., 2006; Bruckard et al., 2005; Cruells et al.,
1992; Leclerc et al., 2002). This EAF dust, could be a future option to use as a neutralising
agent for the bioleaching of zinc sulphide concentrates and in return, it would enable to enrich
the zinc concentration in the leachate (Gahan et al., 2008; Cunha et al., 2008a; Cunha et al.,
2008b).
By-products generated in paper and pulp industry such as lime sludge are generally recycled
for the production of quicklime and hydrated lime via calcination at 1000° C to 1300° C
(Sweet, 1986). Part of the lime sludge, called mesalime, is bled out from the process and has
been found to be an excellent alternative neutralising agent during pyrite biooxidation (Gahan
et al., 2008).
Residues from biooxidation of refractory gold concentrates have been reported to consume
large amounts of cyanide during the subsequent cyanidation step. This is due to formation of
elemental sulphur or other reduced inorganic sulphur compounds, which react with cyanide to
form thiocyanate (SCN-) (Hackl and Jones, 1997; Shrader and Su, 1997; Lawson, 1997). In a
study where a sequential two step biooxidation of a refractory gold concentrate was done,

Page 5 of 32 5
moderately thermophiles were used in the first stage followed by a second stage with extreme
thermophiles. It was found that the arsenic toxicity was lowered with respect to the extreme
thermophiles while the NaCN consumption due to SCN- formation was significantly
decreased (Lindström et al., 2003; Lindström et al., 2002). Later in 2004, van Aswegen and
van Niekerk also reported similar studies as those conducted by Lindström et al (2003) and
stated successful biooxidation of a refractory gold concentrate by a combination of mesophilic
and thermophilic microorganisms and also achieved lower NaCN consumption and higher
gold recovery (Lindström et al., 2003; van Aswegen and van Niekerk, 2004).
The present investigation aims at the comparative study of mesalime and EAF dust generated
from different Swedish industries, as a neutralising agent in the biooxidation of refractory
gold concentrate. One-stage continuous biooxidation studies were conducted using mesalime
and EAF dust as a neutralising agent and compared with slaked lime as reference. Eventual
toxic effects of mesalime and EAF dust on the microorganisms and their neutralising
capacities followed by precious metal recovery by cyanidation were studied.

Page 6 of 32 6
2. Materials and method
2.1. Refractory gold concentrate
A refractory gold concentrate from the Boliden Mineral AB owned mine named Petiknäs
North was used in this study. About 20 kg was dried and divided in a rotary divider into 1 kg
packets before used in the experiment. The major elements in the concentrate were S (40%),
Fe (35%) and As (10%) with a gold and silver content of 10.8 g/ton and 91 g/ton, respectively
(Table 1). The mineralogical phase analysis showed the presence of pyrite (FeS2),
arsenopyrite (FeAsS), sphalerite (ZnS), pyrrhotite (FeS) and quartz (SiO2) with gold and
silver present mainly in arsenopyrite but also in the pyrite phase. The calculated relative
mineralogical compositions based on the elemental analysis of the concentrate were 55.2%
pyrite, 22.2% arsenopyrite, 1.6% pyrrhotite and 2.0% chalcopyrite.
2.2. Neutralising agents
Electric arc furnace (EAF) dust from scrap based steel production and lime sludge (mesalime)
from a paper and pulp industry were compared with chemical grade slaked lime (Ca(OH)2) as
neutralising agents in the biooxidation experiments. The materials have previously been
described and characterised (Cunha and Sandström, 2006) and the chemical and mineralogical
analysis are given in (Tables 1 and 2). The original EAF dust had relatively high chloride
content (1.5%) of which the major part (91%) was removed by a water leaching stage before
used in the experiments. Water leaching was done at room temperature on 1 kg dust with 5 L
of water over night, solids and liquid were separated by vacuum filtration, washing of the
solids was done with 3 L deionised before being dried in an oven at 65ºC. Particle sizes as
determined by laser classification (Cilas 1064 liquid) and expressed as 80% passing was 4.8
m for the EAF dust, 20.2 m for the mesalime while it was 8.5 m for the Ca(OH)2.
Page 7 of 32 7
Neutralising agents were added as a pulp with 10% solids (w/v) directly into the biooxidation
reactor.
2.3. Microorganisms
The microorganisms used were obtained from a continuous culture operating at 37 C on the
modified 9K nutrient medium ((NH4)2SO4, 3.0 g/L; KCl, 0.1 g/L; K2HPO4, 0.5 g/L;
MgSO4•7H2O, 0.5 g/L; Ca(NO3)2•4H2O, 0.01 g/L) supplemented with 4.5 g/L Fe2+ and 2 mM
potassium tetrathionate at a retention time of 48 hours (Silverman and Lundgren, 1959). The
pH in the continuous reactor was 1.45 ± 0.05 and the redox potential was 740 5 mV versus
the Ag/AgCl reference electrode. The continuous culture contained bacterial iron and sulphur
oxidisers as well as archaea and was dominated by Leptospirillum ferriphilum followed by
Acidithiobacillus caldus and with approximately same numbers of Acidithiobacillus
thiooxidans, Sulphobacillus sp. and Ferroplasma sp. as determined by Q-PCR analysis
conducted by Bioclear B.V., Netherlands (Gahan et al., 2009a; Gahan et al., 2008; Gahan et
al., 2009b).
2.4. Analytical and instrumentation techniques
Fe, As and Zn in leach liquors were determined by atomic absorption spectroscopy (AAS).
Redox potential was measured with a platinum electrode against the Ag, AgCl reference
electrode, while a Lange LDOTM/sc100 was used to measure the dissolved oxygen. Elemental
analysis of the refractory gold concentrate, neutralising agents and bioleaching residues were
conducted by Inductively Coupled Plasma-Atomic Emission Spectrometry (ICP-AES) /
Quadrupole Mass Spectrometry (ICP-QMS) / Sector Field Mass Spectrometry (ICP-SFMS).
Mineralogical analysis of concentrate, neutralising agents and bioresidues was accomplished
by X-ray powder diffraction (XRD) using a Siemens D5000 automatic diffractometer

Page 8 of 32 8
equipped with a continuous scanning device. Diffractograms were taken with Cu K radiation
of 40 kV and 30 mA a sample rotation of 30 rpm, while the diffraction patterns were
measured in the range 10 -90º and the crystalline phases were identified using the Joint
Committee for Powder Diffraction Standards (JCPDS) file of the instrument.
2.5. Biooxidation
The bench scale equipment consisted of a 10 L feed tank and a single stage 5 L baffled
bioreactor. To minimise varying %-solids in the feed, the level in the feed tank was kept
constant by daily additions of make up pulp. Air enriched with 2-3% (v/v) CO2 was sparged
beneath the impeller in the bioreactor at a flow rate of 5 L/min giving a dissolved oxygen
(D.O.) level of 3-5 mg/L in the biooxidation pulp. The temperature in the pulp was
maintained at 36-37º C by heat exchange with warm deionised water flowing inside the jacket
surrounding the bioreactor. Pumping of both feed into the reactor and pumping of 90% of the
oxidised pulp out of the reactor was done intermittently with peristaltic pumps 1-2 times per
hour to match the flow-rate requirements. Remaining 10% of the oxidised pulp was allowed
to over-flow to ensure constant level in the reactor. Evaporation in the bioreactor was around
275 ml per day as determined by measurement of inlet and outlet flows. All experiments
started in batch mode with 20% inoculum (v/v) and with 1-2% solids (w/w) until a redox
potential of 600 mV was obtained. Pumping of feed pulp with 10%-solids (w/w) started with
gradually increased flow-rates until the desired retention time of 57 1 hour was attained.
Once pH began to decrease neutralisation was done twice daily with slaked lime or oxidic by-
products by additions into the bioleaching pulp as a 20% (w/v) pulp in water to maintain a pH
of 1.5± 0.1. Steady state was assumed after a leaching time of 5 times the retention time, i.e.
12 days, thereafter outgoing pulp was collected for 3 days for the subsequent cyanidation
experiments before bioleaching was stopped by complete removal of the leaching pulp, which

Page 9 of 32 9
was done in order to obtain a good control of the material balance in the experiments. The
collected pulp was filtered and the filter cakes were washed with a specified volume of
acidified deionised water (pH 1.5), dried in a hot air oven at 70 C, weighted and analysed for
their chemical composition by ICP-AES/MS/SMS analysis (ALS Scandinavia AB,
www.analytica.se, procedure MG-2 plus additional elements) and mineralogical content by
XRD (Table 3 and 4). The volume of the leachate including wash water was measured and
then sent for chemical analysis by ICP-AES/MS/SMS (ALS Scandinavia AB,
www.analytica.se, procedure V3a plus additional elements) (Table 5). Leaching yields have
been calculated based on amount of the respective element in feed and residue. Regarding
leaching yield of Fe, care was taken to include Fe that had been leached and then precipitated
by dissolving residues in 6 M HCl. Fe originating from by-products (mainly EAF dust) was
also accounted for by compensating for the amount of Fe that dissolved at pH 1.5 in a
previously performed chemical equilibrium study (Cunha et al., 2008a).
2.6. Cyanidation
Dried biooxidised residues obtained from the three experiments were ground using mortar and
pestle and approximately 100 g of the each residue was diluted with 400 g of inert silica sand
prior to cyanidation at a pulp solid content of about 25% (w/w). All cyanidation tests were
carried out in glass vessels provided with a motor driven stirrer. The free cyanide
concentration was maintained at a level ranging from 0.03-0.1% NaCN (v/v) as determined
by titration with AgNO3 and rhodanine as indicator (Gold and Silver recovery Innovations
phase III). The pH was maintained at 10-11 by addition of quick lime whenever required. Air
was sparged into the pulp by the vortex action of the agitators. The total leaching time varied
between 52-72 hours after which the experiments were stopped. Residues were washed and
dried before analysed for gold and silver by the fire assay method. The SCN- concentrations
Page 10 of 32 10
in the leach solutions were analysed by VIS spectrophotometry via formation of coloured
ferric - SCN complex.
3. Results and Discussion
3.1. Biooxidation
Initially, it was attempted to conduct an additional experiment without pH control to study the
effect of pH on biooxidation efficiency and subsequent gold recovery and cyanide
consumption. However, this experiment was not possible to run although several attempts
were made. Each attempt was started in batch mode and then switched to continuous feeding
of pulp. In the beginning of continuous pumping the activity was good as judged by a rise in
redox potential, decrease in pH with time and even a small rise in temperature due to the
exothermic reactions. After approximately one week of operation in continuous mode, the
activity was lost, seen by a fall in redox potential and excessive foaming indicating dead
microbial cells in the reactor. It was later concluded that the reason for cell death was the low
pH values obtained, which could fall down to 0.9, and not because of the high arsenic
concentrations in solution. This could be resolved since later when pH was controlled to 1.5,
biooxidation was running smoothly with As concentrations up to 15 g/L (Figure 1).
In the experiments with pH control, pH was adjusted to 1.5 by addition of neutralising agents
(slaked lime, mesalime and EAF dust) by manual additions twice daily. The pH varied
between 1.3 and 1.5 since pH decreased during night. In Figures 1-3 and Table 6 some of the
steady state data are given. Small variations in Fe and As concentrations are due to the
irregular additions (twice daily) of neutralising agents. Fe concentration in leachate (Figure 2)
was higher in the case when EAF dust was used for neutralisation. This is partly due to the
high iron content in the dust, from which some are soluble, although the main part of the iron
was present in insoluble minerals like zinc ferrite (ZnFe2O4) and magnetite (Fe3O4), which

Page 11 of 32 11
both require harsher conditions to dissolve. A higher redox potential was also obtained in the
experiment with EAF dust compared to the Ca(OH)2 and mesalime experiments probably due
to the higher Fe concentration in solution.
The neutralising potential was enumerated based on the daily amount of neutralising agent
needed to maintain the desired pH during steady state operation of the bioreactor. The EAF
dust had the lowest neutralising capacity with daily additions of 60 g, while mesalime and
Ca(OH)2 had higher neutralising capacities with daily additions of 28 g and 22 g, respectively
(Table 6). Despite the higher amounts of EAF dust added compared with slaked lime and
mesalime, the difference in the amount of bioleached residue produced was not big since the
EAF dust amongst others contained zincite (ZnO) which is soluble at pH 1.5 while the other
neutralising agents produced more gypsum precipitates due to their higher Ca contents (Table
1). The daily amount of residue produced in the reactor was 164 g, 160 g and 156 g in the
experiment with EAF dust, Ca(OH)2 and mesalime, respectively (Table 6). The high zinc
content in the EAF dust 26.5% (Table 1) of which ~75% was in the form of soluble ZnO
resulted in a zinc concentration in the leach liquor of 9.5 g/L whereas in other experiments the
zinc concentrations was in the range 2.1-2.4 g/L (Table 5). The high ZnO content in EAF
dusts makes this type of by-products an excellent choice as neutralising agent in bioleaching
processes where zinc is a target metal since its use will considerably enhance the zinc tenor in
the leachate.
Zinc was associated with sphalerite in the concentrate and the leaching yield of zinc in the
experiments with mesalime and slaked lime were 69% and 58%, respectively (Table 7).
Sphalerite, normally oxidises easily and the reason for the relatively low leaching yields is
that part of the sphalerite mineral grains are locked within larger pyrite grains, which has been
observed in previous (not published) studies of this concentrate.

Page 12 of 32 12
The arsenopyrite oxidation was efficient in all experiments, considering that the experiments
were done in a single stage reactor, and was in the range 85-90%. A high arsenopyrite
oxidation is essential for treatment of this concentrate since the major part of the gold is
locked within its matrix. Part of the gold and silver is also locked within pyrite which
oxidation varied between 63-74% with the lowest oxidation in the EAF dust experiment and
the highest when mesalime was used for neutralisation (Table 7). Based on the leaching yields
obtained in the experiments no negative effect can be seen on the biooxidation performance
when by-products are used for pH control instead of Ca(OH)2. In full-scale processes, calcite
is used for neutralisation since it also fulfils the autotrophic microorganisms demand of
carbon dioxide. In this sense, the mesalime is an excellent by-product since it is a pure
product mainly consisting of calcite (Table 2) whereas in the case of EAF dust it would be
best to mix the dust with calcite in such proportions that the carbon dioxide requirement is
met.
The bioresidues obtained were characterised regarding chemical and mineralogical content
(Table 3 and 4), which is an important aspect since this material, is the feed to the following
cyanide leaching. The mineralogical phases found in all residues were gypsum, free quartz
and un-reacted pyrite. In the experiment with EAF dust solid solution of spinels between
ZnFe2O4 and Fe3O4 were found, which are common minerals in this type of dusts and are
known to require strong leaching conditions to be leached. The elemental sulphur content in
the EAF dust experiment was high (3.3%) compared to the other bioresidues (Table 3). The
reason for the less efficient sulphur oxidation in the experiment with EAF dust is not clear but
could be due to the higher concentrations of iron, zinc and sulphate ions resulting in higher
ionic strength in the leaching solution (Table 5). Mixing the EAF dust with calcite as
discussed above would thus be beneficial also since that would reduce the ionic strength in

Page 13 of 32 13
solution. Jarosite, which normally is present in bioleaching residues, could not be detected in
any of the residues (Table 4).
3.2. Cyanidation of bioresidues
The cyanide leaching results are summarised in Table 7, where both the final and 24 hours
results is given. Gold and silver recoveries were calculated based on concentrate grade, ratio
bioresidue/feed and final cyanide grade in tailing. Cyanide leaching continued for 52 hours on
residues from experiments with mesalime and Ca(OH)2 whereas it was 78 hours for the
residue from the EAF dust experiment. Final gold recovery of 85% was achieved in the EAF
dust experiment whereas the experiments with mesalime and the Ca(OH)2 reference gave
recoveries of about 90% (Table 7). The kinetics of gold dissolution were fast especially in the
EAF dust experiment where very high gold recovery was obtained after 24-30 hours (data not
shown). The high gold recoveries obtained after biooxidation in a single stage reactor at a
retention time of less than 60 hours reflects that the main part of the gold in the concentrate
used is associated with arsenopyrite, which is more easily oxidised than pyrite. The calculated
arsenopyrite oxidation was in the range 85-90% whereas the pyrite oxidation ranged from
63% to 74%.
The residues after neutralisation with mesalime and Ca(OH)2 had higher total sulphur content
compared to the EAF dust experiment since more gypsum was formed in those residues. On
the other hand, the elemental sulphur content, which is responsible for large proportions of the
cyanide consumption, was higher in the residue after biooxidation with EAF dust as
neutralising agent. The sodium cyanide consumption as a function of time is shown in Table 7
and Figure 4 where it can be seen that the higher elemental sulphur content in the experiment
with EAF dust also is reflected in higher cyanide consumption. The percentage of cyanide

Page 14 of 32 14
that was lost due to thiocyanate formation was relatively constant and in the range of 30-36%
irrespective of leaching time and material tested.
The sodium cyanide consumption of 8.1-9.2 kg per tonne of feed, which were obtained after
24 hours biooxidation, is rather high but this is partly due to the incomplete oxidation in the
single stage bioreactor. When biooxidation is performed in a series of reactors, which of
course is the normal industrial practice, cyanide consumption is expected to decrease by
optimisation of retention time and tank configuration. To reduce the cyanide consumption
further a two-stage biooxidation process could be performed (Lindström et al., 2003). In this
process, biooxidation in the first stage was done with an arsenic tolerant moderately
thermophilic bacterial culture and the second stage was done at higher temperatures with
thermophilic microorganisms. By operating the biooxidation process in this way it is
anticipated that the cyanide consumption and the thiocyanate formation will be significantly
lowered.

Page 15 of 32 15
4. Conclusions
It has been demonstrated that oxidic by-products such as electric arc furnace (EAF) dust from
steel industry and mesalime from paper and pulp industry effectively can replace limestone as
neutralising agent during biooxidation. The by-products were used to neutralise the acid
produced during bacterial oxidation of a refractory gold concentrate and the results were
compared with a reference experiment where slaked lime was used. No negative effect of the
by-products on the biooxidation efficiency of the gold containing pyrite and arsenopyrite
minerals in the concentrate could be seen in the experiments conducted. The EAF dust had the
lowest neutralisation capacity and required three times higher additions to control the pH at
the desired level of 1.5. However, since the EAF dust contained soluble oxides such as ZnO
the amount of bioresidue obtained in all experiments were similar. The ZnO leaching from the
dust also resulted in a high zinc tenor in solution, which would be beneficial in bioleaching
for zinc recovery from zinc concentrates. If EAF dust is to be used as neutralising agent the
best option would be to mix the dust with limestone in such proportions that the microbial
carbon dioxide requirements for growth is fulfilled. Mesalime is of course an excellent
substitute for limestone since it essentially consists of calcite.
Regarding the subsequent cyanide leaching for gold and silver recovery, the higher
concentration of elemental sulphur in the EAF dust bioresidue requires a prolonged retention
time to extract the precious metals content compared to the lime and mesalime bioresidues to
achieve the same final gold content in the cyanidation residue. Since the cyanide consumption
and the thiocyanate formation will increase by increasing the cyanidation time the overall cost
for gold extraction will be higher for the EAF dust compared to the other neutralising agents.
The cost for chloride removal from the EAF dust prior to its use has also to be considered.
However, the potential increase in the revenue from extracted zinc is also a factor in the
judgement of the overall process economy.

Page 16 of 32 16
It can thus be concluded that both EAF dust and mesalime can substitute the commonly used
limestone for neutralisation during bioleaching without any major negative impact on either
biooxidation or subsequent cyanide leaching.
Acknowledgements
The authors wish to express their gratitude for financial support from the EU-funded
integrated project BioMinE, contract Nº 500329-1. Funding from Carl Bennet AB is also
gratefully acknowledged. Thanks to Kempe-stiftelsen and Boliden Minerals AB for their
timely financial support of the work.

Page 17 of 32 17
References
Bruckard, W.J., Davey, K.J., Rodopoulos, T., Woodcock, J.T., Italiano, J., Water leaching and
magnetic separation for decreasing the chloride level and upgrading the zinc content of EAF
steelmaking baghouse dusts. International Journal of Mineral Processing, 2005, 75(1-2) 1-20.
Chetty, K.R., Marais, H.J., Kruger, M.J., The importance of pH control in the biooxidation
process. In Proceedings of the colloquium bacterial oxidation for the recovery of metals,
Johannesburg, 2000, pp.1-12.
Cruells, M., Roca, A., Núñez, A., Electric arc furnace flue dusts: characterization and
leaching with sulphuric acid. Hydrometallurgy, 1992, 31(3) 213-231.
Cunha, M.L., Gahan, C.S., Menad, N., Sandström, Å., Leaching behaviour of industrial oxidic
by-products: possibilities to use as neutralisation agent in bioleaching. Materials Science
Forum, 2008a, 587-588, 748-752.
Cunha, M.L., Gahan, C.S., Menad, N., Sandström, Å., Possibilities to use oxidic by-products
for precipitation of Fe/As from leaching solutions for subsequent base metal recovery.
Minerals Engineering, 2008b, 21(1) 38-47.
Cunha, M.L., Sandström, Å., Characterisation of by-products for use as neutralizing agent in
bioleaching, In Proc. of XXIII International Mineral Processing Congress IMPC-2006,
ISBN-975-7946-27-3, Istanbul, Turkey, 2006, pp. 1392–1397.
Dew, D.W., Comparison of performance for continuous bio-oxidation of refractory gold ore
flotation concentrates. In Proc. of International Biohydrometallurgy Symposium IBS-95, ed. T.
Vargas, C.A. Jerez, J.V. Wiertz and H. Toledo, ISBN-956-19-0209-5, Vina del Mar, Chile,
1995, pp. 239-251.
Gahan, C.S., Cunha, M.L., Sandström, Å., Comparative study on different steel slags as
neutralising agent in bioleaching. Hydrometallurgy, 2009a, 95(3-4), 190-197.

Page 18 of 32 18
Gahan, C.S., Cunha, M.L., Sandström, Å., Study on the Possibilities to use Ashes, EAF dust
and Lime Sludge as Neutralising Agent in Bioleaching. The Open Mineral Processing Journal,
2008, 1, 26-36.
Gahan, C.S., Sundkvist, J.E., Sandström, Å., A study on the toxic effects of chloride on the
biooxidation efficiency of pyrite. Journal of Hazardous Materials, 2009b, 172(2-3), 1273-
1281.
Gold and Silver Recovery Innovations Phase III, Randol International, 1987, vol. 9, pp. 5187.
Hackl, R.P., Jones, L., Bacterial sulfur oxidation pathways and their effect on the cyanidation
characteristics of biooxidized refractory gold concentrates. In Biotechnology Comes of Age,
Proc. of International Biohydrometallurgy Symposium IBS-97, Australian Mineral Foundation,
ISBN- 0-908039-66-2, Sydney, Australia, 1997, pp. M14.2.1–M14.2.10.
Havlík, T., Souza, B.V.E., Bernardes, A.M., Schneider, I.A.H., Miškufová, A.,
Hydrometallurgical processing of carbon steel EAF dust. Journal of Hazardous Materials,
2006, 135(1-3), 311-318.
Lawson, E.N., The composition of mixed populations of leaching bacteria active in gold and
nickel recovery from sulphide ores. In Biotechnology Comes of Age, Proc. of International
Biohydrometallurgy Symposium IBS-97, Australian Mineral Foundation, ISBN- 0-908039-66-
2, Sydney, Australia, 1997, pp. QP4.1-QP4.10.
Leclerc, N., Meux, E., Lecuire, J.M., Hydrometallurgical recovery of zinc and lead from
electric arc furnace dust using mononitrilotriacetate anion and hexahydrated ferric chloride.
Journal of Hazardous Materials, 2002, 91(1-3) 257–270.
Lindström, E.B., Sandström, Å., Sundkvist, J.E., A sequential two-step process using
moderately and extremely thermophilic cultures for biooxidation of refractory gold
concentrates. Hydrometallurgy, 2003, 71(1-2), 21-30.

Page 19 of 32 19
Lindström, E.B., Sandström, Å., Sundkvist, J.E., Two-stage bioleaching of sulphidic material
containing arsenic. United States Patent, Patent No. US 6,461,577 B1, 2002.
Liu, X., Petersson, S., Sandström, Å., Evaluation of process variables in bench-scale
biooxidation of the Olympias concentrate. FEMS Microbiology Reviews, 1993, 11(1-3) 207-
214.
Rawlings, D.E., Dew, D., Plessis, C.D., Biomineralization of metal-containing ores and
concentrates. Trends in Biotechnology, 2003, 21(1), 38-44.
Reith, F., Rogers, S.L., McPhail, D.C., Brugger, J., Potential for the utilisation of micro-
organisms in gold processing, In World Gold 2007 by and co-products and the environment,
ed. J. Avraamides, G. Deschenes and D. Tucker, ISBN-9781920806743, Australasian
Institute of Mining and Metallurgy, World Gold 2007, Cairns, Australia, pp. 1-8.
Shrader, V.J., Su, S.X., Factors affecting elemental sulfur formation in biooxidized samples:
Preliminay studies, In Biotechnology Comes of Age, Proc. of International
Biohydrometallurgy Symposium IBS-97, Australian Mineral Foundation, ISBN- 0-908039-66-
2, Sydney, Australia, 1997, pp. M3.3.1-M3.3.10.
Silverman, M.P., Lundgren, D.G., Studies on the chemoautotrophic iron bacterium
Ferrobacillus ferrooxidans I. An improved medium and a harvesting procedure for securing
high cell yields. Journal of Bacteriology, 1959, 77(5) 642–647.
Stephenson, D., Kelson, R., Wiluna BIOX Plant - Expansion and New Developments. In
Biotechnology Comes of Age, Proc. of International Biohydrometallurgy Symposium IBS-97,
Australian Mineral Foundation, ISBN- 0-908039-66-2, Sydney, Australia, 1997, pp. M4.1.1-
M4.1.8.
Sweet, P.C., Virginia's lime industry. In Quarterly Journal of Virginia division of mineral
resources, ISSN 0042-6652, Charlottesville, Virginia, 1986, pp. 33-43.

Page 20 of 32 20
U.S. E.P.A. SW 846, method 1311; Title 40-261.24 of the Code of Federal Regulation, in
Federal Register, 1986, vol. 51, pp. 21648-21693.
van Aswegen, P.C., Marais, H.J., Advances in application of the BIOX® process for the
refractory gold ores. Minerals and Metallurgical Processing, 1999, 16(4), 61–68.
van Aswegen, P.C., van Niekerk, J., New developments in the bacterial oxidation technology
to enhance the efficiency of the BIOX process. In Proc. of Bac-Min Conference, Bendigo,
Victoria, Australia, 2004, pp. 181–189.
van Aswegen, P.C., van Niekerk, J., Olivier, W., The BIOXTM Process for the Treatment of
Refractory Gold Concentrates, In Biomining , ed. D.E. Rawlings and D.B. Johnson. ISBN-10
3-540-34909-X, Springer-Verlag Berlin Heidelberg, New York, 2007, pp. 1-33.

Page 21 of 32 21
Figure captions
Figure 1. Arsenic concentration during steady state operation.
Figure 2. Iron concentration during steady state operation.
Figure 3. Redox potential variations at steady state.
Figure 4. NaCN consumption as a function of time

Page 22 of 32 22
Table 1 Elemental composition of the concentrate and neutralising agents.
Si Al Ca Fe K Mg As Cu Pb S Zn Au Ag
% % % % % % % % % % % g/ton g/ton
Concentrate 5.0 0.8 0.7 34.9 0.3 0.6 10.20 0.71 0.52 39.90 3.4 10.8 91
Ca(OH)2 0.1 0.0 53.6 0.0 0.1 0.4 0.00 0.00 0.00 0.02 0.0 NA NA
EAF dust 1.4 0.4 13.3 22.4 <0.1 1.0 0.00 0.67 0.67 0.50 26.5 NA NA
Mesalime 0.1 0.1 38.2 0.1 <0.1 1.0 0.00 0.00 0.00 0.03 0.0 NA NA
NA-Not analysed

Page 23 of 32 23
Table 2 Mineralogical phases identified in the neutralising agents
Ca(OH)2 Portlandite (Ca(OH)2)
EAF dust Franklinite type solid solution (ZnxMnyFe1-x-y)Fe2O4, Calcium zinc hydroxide hydrate (Ca(Zn(OH)3)2.2H2O, Zincite (ZnO)
Mesalime Calcite (CaCO3)
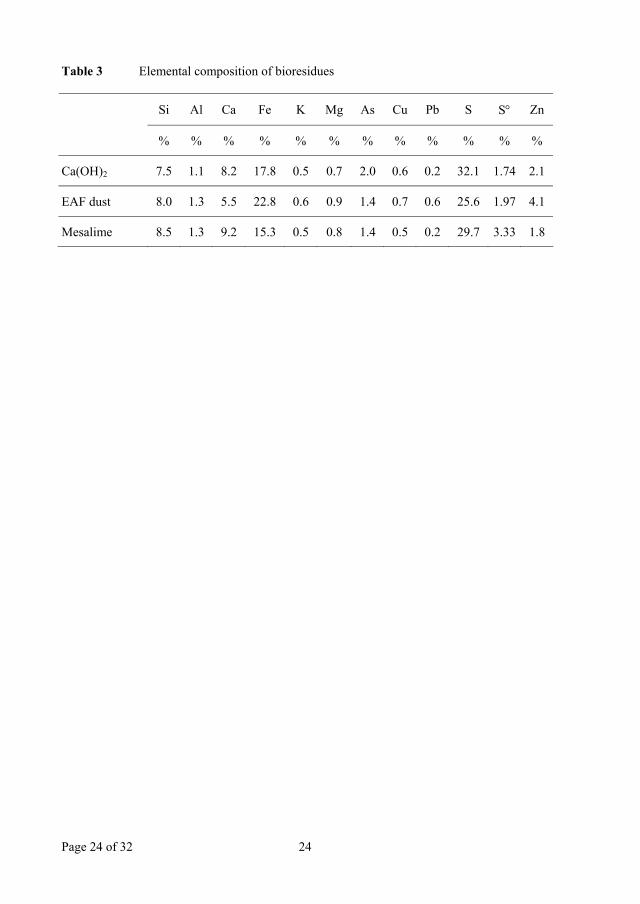
Page 24 of 32 24
Table 3 Elemental composition of bioresidues
Si Al Ca Fe K Mg As Cu Pb S S Zn
% % % % % % % % % % % %
Ca(OH)2 7.5 1.1 8.2 17.8 0.5 0.7 2.0 0.6 0.2 32.1 1.74 2.1
EAF dust 8.0 1.3 5.5 22.8 0.6 0.9 1.4 0.7 0.6 25.6 1.97 4.1
Mesalime 8.5 1.3 9.2 15.3 0.5 0.8 1.4 0.5 0.2 29.7 3.33 1.8

Page 25 of 32 25
Table 4 Mineralogical phases identified in the bioresidues
Ca(OH)2 Gypsum (CaSO4.2H2O), Pyrite (FeS2), Quartz (SiO2)
EAF dust Bassanite (CaSO4.0.5H2O), Franklinite (ZnFe2O4), Pyrite (FeS2), Quartz (SiO2)
Mesalime Gypsum (CaSO4.2H2O), Pyrite (FeS2), Quartz (SiO2)

Page 26 of 32 26
Table 5 Elemental composition of bioleach liquors
Si Al Ca Fe K Mg As Cu Pb SO42- Zn
g/L g/L g/L g/L g/L g/L g/L g/L g/L g/L g/L
Ca(OH)2 0.07 0.04 0.7 25.0 0.32 0.21 10.9 0.28 0.5 53.3 2.1
EAF dust 0.34 0.10 0.6 36.3 0.19 0.33 13.0 0.34 0.5 84.5 9.5
Mesalime 0.09 0.05 0.6 27.5 0.36 0.35 11.0 0.27 0.4 59.9 2.4

Page 27 of 32 27
Table 6 Summary of steady state conditions
Ca(OH)2 EAF dust Mesalime
Redox potential (mV) 604 623 604
Daily by-product addition (g) 22.1 60.8 28.3
Daily dry residue weight (g) 160 164 156

Page 28 of 32 28
Table 7 Summary of biooxidation and cyanidation studies
Bioresidue specifications Bioresidue origin Slaked lime Mesalime EAF dust Retention time (hours) 56 58 58 Pyrite oxidation (%) 67.8 73.6 63.4 Arsenopyrite oxidation (%) 85.4 89.8 89.2 Leaching yield zinc (%) 57.5 69.2 75.6 Bioresidue analysis Stot (%) 32.1 29.7 25.6 S (%) 1.74 1.97 3.33 Ratio bioresidue/feed (w/w) 0.80 0.78 0.80 S (kg/ton feed) 13.9 15.3 26.5 Cyanidation results Cyanidation time, hours 52 52 78 Cyanide leach residue grade, g Au/tonne feed 1.19 1.01 1.59 Cyanide leach residue grade, g Ag/tonne feed 24.7 13.2 29.5 Gold extraction (%) 88.9 90.6 85.3 Silver extraction (%) 72.9 85.5 67.6 Cyanidation time, hours 52 52 72 NaCN consumption, kg/tonne feed 10.8 11.4 15.9 SCN formation, kg/tonne feed 4.10 4.34 5.82 NaCN losses as SCN, kg/tonne feed 3.53 3.74 5.01 NaCN losses as SCN, % of total consumption 32.6 31.8 31.5 Cyanidation time, hours 24 24 24 NaCN consumption, kg/tonne feed 8.14 8.23 9.24 SCN formation, kg/tonne feed 2.95 2.83 3.85 NaCN losses as SCN, kg/tonne feed 2.54 2.44 3.33 NaCN losses as SCN, % of total consumption 30.2 30.7 36.0

Page 29 of 32 29
Figures
0
3
6
9
12
15
18
9 10 11 12 13 14 15 16
Time, days
Ars
enic
, g/L
Ca(OH)2
Mesalime
EAF Dust
Figure 1. Arsenic concentration during steady state operation.

Page 30 of 32 30
0
10
20
30
40
9 10 11 12 13 14 15 16
Time, days
Iron
, g/L
Ca(OH)2
Mesalime
EAF Dust
Figure 2. Iron concentration during steady state operation.

Page 31 of 32 31
560
580
600
620
640
9 10 11 12 13 14 15 16
Time, days
Red
ox p
oten
tial,
mV
Ca(OH)2
Mesalime
EAF Dust
Figure 3. Redox potential variations at steady state.

Page 32 of 32 32
0
3
6
9
12
15
18
0 15 30 45 60 75
Leach time, hours
NaC
N c
onsu
mpt
ion,
kg
NaC
N/to
n
Ca(OH)2MesalimeEAF Dust
Figure 4. NaCN consumption as a function of time.

PAPER VI
Modeling of Ferrous Iron Oxidation by Leptospirillum ferrooxidans-
Dominated Chemostat Culture.
J.E. Sundkvist, C.S. Gahan, Å. Sandström
Biotechnology and Bioengineering, vol. 99(2), pp. 378-389, 2008


ARTICLE
Modeling of Ferrous Iron Oxidation by aLeptospirillum ferrooxidans-DominatedChemostat Culture
Jan-Eric Sundkvist,1,2 Chandra Sekhar Gahan,2 Ake Sandstrom2
1Boliden Mineral AB, Boliden, Sweden2Division of Process Metallurgy, Lulea University of Technology, SE-971 87 Lulea, Sweden;
telephone: þ46 920 491290; fax: þ46 920 491199; e-mail: [email protected]
Received 27 February 2007; revision received 25 May 2007; accepted 18 June 2007
Published online 5 July 2007 in Wiley InterScience (www.interscience.wiley.com). DOI 10.1002/bit.21563
ABSTRACT: The objective of this study was to evaluate adirect classical bioengineering approach to model datagenerated from continuous bio-oxidation of Fe2þ by aLeptospirillum ferrooxidans-dominated culture fed witheither 9 g or 18 g Fe2þ L�1 under chemostat conditions(dilution rates were between 0.051 and 0.094 h�1). Thebasic Monod and Pirt equations have successfully beenintegrated in an overall mass balance procedure, whichhas not been previously presented in this detail for Fe2þ
oxidation. To ensure chemostat conditions, it was foundthat the range of the dilution rates had to be limited. A toolong retention time might cause starvation or non-negligibledeath rate whereas, a too short retention time may cause asignificant alteration in solution chemistry and culturecomposition. Modeling of the experimental data suggestedthat the kinetic- and yield parameters changed with theoverall solution composition. However, for respective feedsolutions only minor changes of ionic strength and chemicalspeciation can be expected within the studied range ofdilution rates, which was confirmed by thermodynamiccalculations and conductivity measurements. The presentedmodel also suggests that the apparent Fe3þ inhibition onspecific Fe2þ utilization rate was a direct consequence of thedeclining biomass yield on Fe2þ due to growthuncoupled Fe2þ oxidation when the dilution rate wasdecreased. The model suggested that the maintenance activ-ities contributed up to 90% of the maximum specific Fe2þ
utilization rate, which appears close to the critical dilutionrate.
Biotechnol. Bioeng. 2008;99: 378–389.
� 2007 Wiley Periodicals, Inc.
KEYWORDS: ferrous iron oxidation; ionic strength; chemi-cal speciation; kinetic; modeling; chemostat culture;Leptospirillum ferrooxidans
Introduction
Fe2þ- and sulfur-oxidizing microorganisms such as Acid-ithiobacillus ferrooxidans and Leptospirillum spp. play amajor role in the generation of acid mine drainage fromsulfide minerals such as pyrite (FeS2) (Fowler et al., 1999;Schippers et al., 1996). Acidophilic microorganisms areexploited to extract valuable metals from sulfidic ores andconcentrates, and the two dominating technologies thathave been commercialized are agitated-tank leaching andheap leaching. Heap bioleaching is mainly applied on low-grade copper ores containing secondary minerals (e.g.,covellite and chalcocite) and tank bioleaching is mainly usedfor refractory gold-arsenopyrite-pyrite flotation concen-trates (Marchbank et al., 2003; Rawlings et al., 2003). Twodifferent indirect mechanisms have been proposed for Fe3þ
oxidation of the metal sulfide bond that generates eitherthiosulfate or polysulfides as the initial sulfur species(Schippers and Sand, 1999). The thiosulfate mechanismapplies to acid-insoluble sulfides such as FeS2 and MoS2 andthe polysulfide mechanism applies to acid-soluble sulfidessuch as ZnS and CuS. The role of microorganisms inbioleaching is to oxidize Fe2þ to produce a catalytic cyclethat increases the rate of metal solubilization (reviewed inRohwerder et al. (2003)).
Adequate kinetic expressions for growth- and substrateconsumption rates are required for proper design andmodeling of bioprocesses (Doran, 1995). Rate expressionsfor microbial Fe2þ oxidation in batch and continuousreactors have been formulated for over 30 years (reviewed inOjumu et al. (2006)). Most expressions explaining thespecific microbial growth rate are based on the Monodequation with further added terms to correct for Fe3þ
inhibition and an example is given in Equation (1)
Correspondence to: A. Sandstrom
Contract grant sponsor: Agricola Research Centre, funded by Swedish Foundation for
Strategic Research
Contract grant sponsor: Boliden Mineral
Contract grant sponsor: Carl Bennet AB
378 Biotechnology and Bioengineering, Vol. 99, No. 2, February 1, 2008 � 2007 Wiley Periodicals, Inc.

(Liu et al., 1988).
m ¼ mmax Fe2þ½ �
Fe2þ½ � þ Ks 1þ Ki Fe3þ½ �ð Þ (1)
A number of equations for the Fe2þ utilization rate havebeen presented, although the experimental data seem tohave been mostly fitted to expressions that do not explicitlyinclude terms for true growth yield and maintenance yieldaccording to the Pirt equation (Pirt, 1975). An example isEquation (2), formulated by Boon et al. (1999a).
qO2 ¼qmaxO2
1þ Ks
½Fe2þ��½Fe2þ�t þKs
Ki� ½Fe3þ�½Fe2þ��½Fe2þ�t
(2)
Boon et al. (1999a) related the specific Fe2þ utilizationrate to the specific oxygen consumption. It was assumed thatthe maximum specific growth and oxygen consumptionrates coincided, which gives the following relation betweenqmaxO2
and the maximum specific growth rate (mmax):
qmaxO2
¼ mmax
Ymax;oxþmO (3)
where Ymax,ox is the maximum growth yield and mO is themaintenance coefficient on oxygen. Equation (2) includesa Fe3þ inhibition constant and a Fe2þ threshold concentra-tion (at which the oxygen uptake is terminated) to describehow the specific oxygen utilization rate indirectly varies witheither the actual specific growth- or dilution rate by relatingit to the Fe2þ and Fe3þ concentrations (Boon et al., 1999a).However, no dependence of total iron concentration isincluded in the equation. Boon et al. (1999a) also found thatthe value of qmax
O2is not constant for a batch culture that
starts to grow in a high Fe2þ concentration and insteadrelates to the specific growth rate of the microorganism.
The objective of this article was to evaluate a directclassical bioengineering approach to model data generatedfrom continuous bio-oxidation of Fe2þ. The basic Monodand Pirt equations have been integrated in an overall massbalance in order to describe the steady-state conditions ina Fe2þ oxidation chemostat.
Theory
The most convenient method for determining the kinetic-and yield parameters for a culture is to run a one-stagecontinuous bioreactor at steady state with different dilutionrates (Doran, 1995). In a steady-state chemostat with sterilefeed, negligible cell death, and no accumulation of biomass itis found that the specific growth rate is equal to the dilutionrate. Therefore, the reactor performance at any specificgrowth rate can be determined for different feed substrateconcentrations by varying the flow rate. To model the massbalance for a steady-state chemostat with respect to biomass
and substrate, expressions for specific microbial growth rateand biomass yield from the substrate are required.
Microbial cultures require a number of nutrients orsubstrates for growth that supply the cell with materialand energy. The growth of a culture can be classified assubstrate-limited and substrate-sufficient according to theavailability of the actual substrate under consideration inrelation to other essential substrates (Zeng and Deckwer,1995). However, the specific growth rate is determined bythe limiting substrate at a certain residual concentration,or vice versa. The most frequently used expression formicrobial growth is the Monod equation, which relates thespecific growth rate (m) to the growth-limiting substrateconcentration:
m ¼ mmax � SKs þ S
(4)
where mmax is the maximum specific growth rate constant(e.g., h�1); S, the growth-limiting substrate concentration(e.g., g substrate L�1); and Ks is the substrate saturation oraffinity constant (e.g., g substrate L�1). When Ks equals thesubstrate concentration the expression gives a specificgrowth rate half of the maximum. The mmax and Ks of theculture varies with temperature, ionic strength, etc. (Doran,1995; Ojumu et al., 2006).
The Monod equation is only valid for balanced growthwhere the biomass composition remains constant andtherefore, a bad fit to the expression would be expected whenthe growth conditions change rapidly. It has also been foundthat extra terms have to be added to the Monod expression tocorrect for inhibiting effects due to a substrate, product, orother toxic species. The usefulness of the Monod expressionhas also been found to be limited at extremely low substrateconcentrations (Doran, 1995). Introduction of a Fe2þ thresh-old concentration has been demonstrated to improve the fit toexperimental data (Boon et al., 1999a; Ojumu et al., 2006).
The Pirt maintenance equation is the most frequently usedexpression for biomass yield from a substrate. According tothe theory (Pirt, 1975), the observed growth rate undersubstrate-limited conditions and balanced growth has aneffect on the observed growth yield (Equation (5)):
1
Yobs¼ 1
Ytrueþ ms
mobs
(5)
where Yobs is the observed biomass yield (e.g., mg biomass � gsubstrate consumed�1); Ytrue (reflecting the stoichiometryof biomass production) is the maximum possible growthyield in the absence of competing reactions consumingATP (e.g., mg biomass � g substrate consumed�1); mobs isthe observed specific growth rate (h�1); and ms is themaintenance coefficient which is the specific substrateuptake rate for maintenance activities (e.g., g substrateconsumed (mg biomass)�1 h�1). Since the metabolicpathway is often complicated and partially unknown, Ytruemay be considered as an imaginary value which relates to the
Sundkvist et al.: Modeling of Fe2þ Oxidation 379
Biotechnology and Bioengineering. DOI 10.1002/bit

observed yield (Doran, 1995) that can never be observedsince the maximal observable biomass yield appears at thecritical dilution rate. Examples of maintenance activitiesinclude cell motility, adjustment of cell membrane potential,and internal pH. Ionic strength has been shown to be aparameter that significantly affects the ms-value (Doran,1995). It has been observed for Bacillus-strains that undersubstrate sufficient condition, the correlation between ATPconsumption and biomass formation is poor. The observedbiomass yield decreases with increasing residual substrateconcentration in comparison with growth under a substrate-limited condition at the same dilution rate. This may beexplained by over utilization of the substrate by processesother than those associated with growth and maintenance.According to the Pirt equation, all non-growth-associatedenergy requirements are attributed to cell maintenance (Liu,1998; Liu and Chen, 1997; Zeng and Deckwer, 1995).
Continuous Microbial Oxidation of Fe2R UnderSteady-State Chemostat Conditions
In order to determine kinetic and yield parameters fora Fe2þ-oxidizing culture the overall biomass- and substratemass balance has to be established during continuousoperation at different retention times. The generalassumptions for a Fe2þ-oxidizing chemostat are: (1) thereaction is carried out in a well-mixed reactor with uniformtemperature and substrate concentrations; (2) there is noaccumulation of biomass in the reactor by attachment to the
walls etc.; (3) there is no formation of solid iron compounds;(4) the feed and discharge flow rates are equal; (5) thereactor volume is constant; (6) the culture is in exponentialgrowth phase and is substrate-limited with respect to Fe2þ;(7) no growth inhibition factors are present (or areconstant); and (8) the culture should be axenic and asepticor strongly dominated by one species. The nomenclatureused in the mass balancing is given in Table I.
Overall Biomass Balance
The amount of viable biomass in the reactor over time willbe given by the following equation:
dMb
dt¼ Mbi �Mbo þ RbG � RbD (6)
where,
Mb ¼ X � V (7)
Mbi ¼ F � Xo (8)
Mbo ¼ F � X (9)
RbG ¼ m � X � V (10)
RbD ¼ Kd � X � V (11)
Table I. Nomenclature used in the mass balancing.
Symbol Definition Units
F Flow rate L h�1
Xo Cell concentration in the feed mg protein L�1
X Cell concentration in the reactor and discharge mg protein L�1
So Fe2þ concentration in the feed g Fe2þ L�1
S Fe2þ concentration in the reactor and discharge g Fe2þ L�1
V Reactor volume L
Mb Actual biomass in reactor mg protein
Mbi Biomass feed flow rate mg protein h�1
Mbo Biomass discharge flow rate mg protein h�1
RbG Biomass generation rate mg protein h�1
RbD Biomass degeneration rate mg protein h�1
t Time h
m Specific growth rate h�1
mmax Maximum specific growth rate h�1
Ks Substrate constant g Fe2þ L�1
Kd Specific death or degeneration constant h�1
Ms Fe2þ iron in the reactor g Fe2þ
Msi Fe2þ feed flow rate g Fe2þ h�1
Mso Fe2þ discharge flow rate g Fe2þ h�1
RsG Fe2þ consumption rate by true growth g Fe2þ h�1
RsM Fe2þ consumption rate by cell maintenance g Fe2þ h�1
RsP Fe2þ consumption rate by product formation g Fe2þ h�1
ms Maintenance coefficient g Fe2þ(mg protein)�1 h�1
Ytrue True biomass yield for growth mg protein (g Fe2þ)�1
Yobs Observed biomass yield mg protein (g Fe2þ)�1
PX Reactor biomass productivity mg protein h�1 L�1
Ps Reactor ferric productivity g Fe3þ h�1 L�1
qFe2þ Specific ferrous utilization rate on biomass g Fe2þ(mg protein)�1 h�1
380 Biotechnology and Bioengineering, Vol. 99, No. 2, February 1, 2008
DOI 10.1002/bit

If the feed is assumed to be sterile then: Xo¼ 0; and if it isfurther assumed that the reactor is operated with a shortretention time then the death rate is negligible, thus RbD¼ 0.Equation (6) is then reduced to the following expression:
dðX � VÞdt
¼ �FX þ m � X � V (12)
Since the reactor volume is constant, Equation (12) can bere-written to the following expression:
dðXÞdt
¼ � F � XV
þ m � X (13)
At steady state the change in biomass concentration is zero:
dðXÞdt
¼ 0 (14)
which gives
m ¼ F
V¼ D ¼ Dilution rate or ðretention timeÞ�1 (15)
Overall Ferrous Balance
The amount of Fe2þ in the reactor over time is given byEquation (16):
dMs
dt¼ Msi �Mso � RsG � RsM � RsP (16)
The RsP term has to be considered either under substratesufficient conditions or abiotic Fe2þ oxidation. In acidic pHand at mesophilic temperatures, abiotic Fe2þ oxidation can beneglected (Johnson and Hallberg, 2005). Therefore, Fe3þ
production is assumed to be directly coupled to energymetabolism for a substrate-limitedmesophilic culture. The RsPterm can then be removed and Equation (16) is reduced to:
dMs
dt¼ Msi �Mso � RsG � RsM (17)
where,
Ms ¼ S � V (18)
Msi ¼ F � So (19)
Mso ¼ F � S (20)
RsG ¼ m � XYtrue
� V (21)
RsM ¼ ms � X � V (22)
Equation (16) will then be reduced to the followingexpression:
dðS � VÞdt
¼ F � So � F � S� m � XYtrue
� V �ms � X � V (23)
At steady-state conditions, the change in Fe2þ concentra-tion is zero and therefore for a constant reactor volumeEquation (23) can be transcribed to the followingexpression:
dðSÞdt
¼ F
V� So � F
V� S� X � m
Ytrueþms
� �¼ 0 (24)
The steady-state biomass concentration then becomes asfollows:
X ¼ ðSo � SÞ � mðm=Ytrue þmsÞ (25)
It has previously been shown that the dilution rate is equalto m at steady-state (Equations (12)–(15)) and therefore,Equation (25) can be re-written to the following expression:
X ¼ ðSo � SÞ � DðD=Ytrue þmsÞ (26)
The instantaneous observed biomass yield from Fe2þ
oxidation can be expressed as follows:
Yobs ¼ � dX=dt
dS=dt¼ �dX
dS¼ �mX�ðm=Ytrue þmsÞ � Xð Þ (27)
or by substituting m with D for a chemostat:
Yobs ¼ D
D=Ytrue þmsð Þ (28)
Equation (26) can be simplified to the following expression:
X ¼ Yobs � ðSo � SÞ (29)
Equation (26) can be rearranged as follows to directlyassociate to the Pirt maintenance Equation (5):
X ¼ 1
ð1=Ytrue þ ð1=DÞmsÞ � ðSo � SÞ (30)
The Fe2þ concentration in the reactor at any dilution ratecan be calculated from Monod Equation (4):
S ¼ D � Ks
ðmmax � DÞ (31)
Substituting S in Equation (30) with Equation (31) givesan expression for biomass concentration as a function of
Sundkvist et al.: Modeling of Fe2þ Oxidation 381
Biotechnology and Bioengineering. DOI 10.1002/bit

dilution rate:
X ¼ 1=1
Ytrueþ 1
Dms
� �� So � D � Ks
ðmmax � DÞ� �
(32)
The reactor productivity expressed as biomass- and Fe3þ
production per reactor volume and time unit will be asEquations (33) and (34), respectively:
PX¼ F
V� X¼D � X (33)
Ps ¼ F
V� So � D � Ks
ðmmax � DÞ� �
¼ D � So � D � Ks
ðmmax � DÞ� �
(34)
Any Fe3þ concentration can be calculated from the Fe2þ
concentration in the feed and the actual dilution rateaccording to Equation (31).
½Fe3þ� ¼ So � D � Ks
ðmmax � DÞ (35)
By taking the logarithmic ratio of Fe3þ to Fe2þ
concentration (Equation (35) divided by Equation (31)),Equation (36) is obtained that reflects the redox potential ofthe solution at various dilution rates or specific growth rates:
log½Fe3þ�½Fe2þ�
� �¼ log
SoðD � Ks=ðmmax � DÞÞ � 1
� �(36)
The specific Fe2þ utilization rate on biomass is obtained bydividing Equation (34) with Equation (26):
qFe2þ ¼PsX¼ D
Ytrueþms (37)
Determination of Kinetic and Yield Parameters
The mass balances indicate that mmax, Ks, ms, and Ytruedetermine the steady-state conditions for a given feedprovided that chemostat conditions are maintained withinthe selected range of dilution rates. These values can becalculated if the Fe2þ and biomass concentrations aremeasured for at least two different dilution rates. However,it is recommended that a number of measuring points aretaken. The kinetic parameters in the Monod equation(Equation (4)) can be determined graphically by lineariza-tion procedures such as Lineweaver-Burk, Eadie-Hofstee,and Langmuir plots (Doran, 1995). The procedures givedifferent degrees of distortion in the experimental datawhich amplifies the errors in the determination at lowsubstrate concentration. The linearized Monod equation by
the Lineweaver-Burk method is given by Equation (38):
1
D¼ Ks
mmax � Sþ 1
mmax
(38)
Ideally, by plotting 1Dversus 1
Sa straight line with the
slope¼ Ksmmax
and the intercept¼ 1mmax
is obtained.The linearized Monod equation by the Eadie-Hofstee
method is given by Equation (39):
D
S¼ mmax
Ks� D
Ks(39)
Ideally, by plotting DSversus D a straight line with the
slope¼� 1Ks
and the intercept¼ mmaxKs
is obtained. Thelinearized Monod equation by the Langmuir method isgiven by Equation (40):
S
D¼ Ks
mmax
þ S
mmax
(40)
By plotting SDversus S a straight line with the slope¼ 1
mmaxand the intercept¼ Ks
mmaxis obtained. The yield parameters in
the Pirt maintenance equation (Equation (5)) are deter-mined by plotting:
1
Yobsversus
ms
D: From equation ð39Þ Yobs ¼ X
S� So(41)
Ideally, a straight line with the slope¼ms and theintercept¼ 1
Ytrueis obtained.
Materials and Methods
Reactor Design
Experiments were carried out in a 2.5 L bioreactor madeof borosilicate glass. The bioreactor had a height/diameter(H/D) ratio� 1.8 and a working volume of 1 L. The bioreactorswere maintained at a constant temperature of 358C. The feedsolution was 9 K mineral salt medium supplemented witheither 9 g or 18 g Fe2þ L�1 (Silverman and Lundgren, 1959)giving a conductivity of 37.7 and 44.3 mS cm�1, respectively.The pH of the feed solution was 1.3 and pH in the reactorwas maintained at 1.55� 0.05 by daily addition of sulfuricacid. The bioreactor feed rate and total culture volume weremaintained constant by variable speed peristaltic pumps.Mixing and gas dispersion was achieved by a paddle stirrerrotating at 250 rpm located 1.5 cm from the base of thebioreactor. Two baffles (width¼D/12) were mountedperpendicular to the vessel wall on opposite sides. Thevessel was sparged with 1 Lmin�1 CO2 enriched air (2–3% (vol/vol)) below the stirrer to ensure that there was nolimitation of carbon for growth. The dissolved oxygenconcentration was typically maintained above 5 mg L�1. The
382 Biotechnology and Bioengineering, Vol. 99, No. 2, February 1, 2008
DOI 10.1002/bit

bioreactor was operated at each dilution rate for at leastthree residence times or until steady protein concentration,redox potential, and Fe2þ concentration in the bioreactorsolution was obtained. Steady state was maintained for atleast two consecutive days at each residence time.Conductivity was measured on feed solutions as well assteady-state solutions. To avoid problems associated withbacterial wall growth in a chemostat culture (Breed et al.,1999; Ghauri et al., 2007; Senn et al., 1994) the bioreactorsolution was transferred on a daily basis to an identical,thoroughly pre-cleaned reactor in order to minimizedisturbance of the steady-state conditions. The reactorwas swapped after sampling and the whole procedure wascompleted within 4–5 min.
Growth and Characterization of the Culture
The bacteria used for the experiments originated from amixed mesophilic culture grown under non-aseptic condi-tions in a continuous reactor in 9 K media supplementedwith 9 g Fe2þ L�1 for a period of 6 months at a dilution rateof 0.02 h�1 before being used. The culture was characterizedby quantitative PCR (Q-PCR) by Bioclear b.v., Netherlands.Samples for Q-PCR were fixed by addition of 1 volume of2 M Tris-HCl buffer (pH 9) and 2 volumes of 96% ethanolbefore DNA was extracted.
Analytical Methods
The residual Fe2þ concentration was determined by atitrimetric method using cerium sulfate with 1,10-phenan-throline as indicator (Kolthoff and Sandell, 1963). Tominimize bacterial Fe2þ oxidation after sampling, thesample was immediately filtered (GHP Acrodisc1 25 mmsyringe filter with 0.2 mm GHP membrane; PALL Life
Sciences, Ann Arbor, MI). Total Fe in the feed solutions wasanalyzed by atomic absorption spectroscopy (PerkinElmerInstruments, Upplands Vasby, Sweden, AAnalyst 100).Redox potential was measured with a platinum electrodewith a Ag, AgCl reference electrode. A Lange LDOTM/sc100was used for dissolved oxygen measurements and con-ductivity was analyzed with a Mettler Toledo MC 226conductivity meter.
Bacterial protein concentration was analyzed by pelleting2� 1 mL culture (10,000g for 20 min). 0.5 mL Bradfordreagent (Bradford, 1976) was added to one of the cell pellets,mixed for 15 s, incubated at room temperature for 5 min,0.5 mL ultra-pure water added (Milli-Q water system,Millipore, Molsheim, France), mixed for 5 s, and thenincubated for 30 min at room temperature. The absorbanceof the Bradford reagent samples was measured at 595 nmon a UV-VIS spectrophotometer (Beckman Coulter AB,Bromma, Sweden, DU1 730 life science) against an 1:1 ratioof Bradford reagent and ultra-pure water. The second 1 mLsample was pelleted (as above) and re-suspended in 1 mLultra-pure water and measured at 595 nm against an ultra-pure water blank. The optical density was determined bysubtracting the absorbance of the cells in ultra-pure waterfrom the Bradford reagent sample and the proteinconcentration calculated with a standard calibration curveobtained by bovine serum albumin treated with Bradfordreagent. Six samples were taken for each protein analysis andthe determination giving the highest concentration wasconsidered as the most accurate and chosen for thesubsequent calculations. The rationale for this is based onthe assumption that the cells were randomly distributed inthe reactor and the relative sampling error was therefore verysmall due to the high number of cells per sample volume.Therefore, any error was assumed to be due to uncontrolledcell losses during protein determination.
Table II. Steady-state conditions for each of the replicates at 9 g and 18 g Fe2þ L�1 feed solution concentration and dilution rates.
Feed concentration
(g Fe2þ L�1)Dilution rate
(h�1)Residual concentration
(g Fe2þ L�1)Temperature
(8C) pH
Biomass
(mg proteinmL�1)Redox
(mV)
Dissolved O2
(mgO2 L�1)
Conductivity
(mS cm�1)
9 0.0942 0.0290 35.5 1.60 5.47 611.4 5.4 N/A
9 0.0814 0.0068 35.6 1.60 5.35 6317 5.3 19.12
9 0.0810 0.0116 35.2 1.58 4.84 630.4 5.5 N/A
9 0.0678 0.0027 35.6 1.60 4.15 643.3 5.4 18.29
18 0.0893 0.0438 35.0 1.60 15.14 591.3 5.3 23.9
18 0.0813 0.0294 34.7 1.58 13.48 608.8 5.3 N/A
18 0.0700 0.0171 35.5 1.57 10.13 629.7 4.9 24.8
18 0.0511 0.0112 36.0 1.58 9.43 655.7 N/A N/A
N/A, not available.
Table III. Calculated Monod-constants for chemostats at 9 and 18 g Fe2þ L�1, respectively.
Linearization method
9 g Fe2þ L�1 18 g Fe2þ L�1
mmax (h�1) Ks (g Fe
2þ L�1) Fit (R2) mmax (h�1) Ks (g Fe
2þ L�1) Fit (R2)
Lineweaver-Burk 0.0932 0.00104 0.920 0.1076 0.00923 0.969
Eadie-Hofstee 0.0954 0.00123 0.873 0.1233 0.01496 0.901
Langmuir 0.0987 0.00166 0.997 0.1166 0.01296 0.993
Sundkvist et al.: Modeling of Fe2þ Oxidation 383
Biotechnology and Bioengineering. DOI 10.1002/bit

Results and Discussion
Characterization of the Culture
Q-PCR analysis was carried out on a sample removed fromthe steady-state chemostat under a dilution rate of 0.081 h�1
with 9 g Fe L�1 and showed that the microorganism culturewas dominated by the Fe2þ-oxidizing acidophile Leptospir-illum ferrooxidans (2.1� 108 cells mL�1) along with minorpopulations of the Fe2þ oxidizer Sulfobacillus sp. (7.3� 105);Acidithiobacillus sp. (4.9� 104); and the sulfur oxidizerAcidithiobacillus thiooxidans (2.6� 104). A further spot Q-PCR analysis was made 2 months later at a dilution rate of0.071 h�1 which confirmed the predominance ofL. ferrooxidans (>99.4% of the total population). Thedetection of At. thiooxidans was surprising since the culturewas grown on Fe2þ as sole energy source, however, theobserved cell numbers were close to the detection limit. Inaddition, a few archaeal strains at approximately 2.2�105 cells mL�1 were identified.
Steady-State Conditions in the Continuous Bioreactor
Based on the output from the biomass- and substratebalance, the required data were collected for determinationof the kinetic and yield parameters. Dilution rates were
chosen such that the stipulated criteria for a chemostatoperation were met, that is, the culture should be inexponential growth phase (Table II). A too long retentiontime might cause starvation or non-negligible death rate. Itis reasonable to believe that at a certain low dilution rate theoperation will become unstable and oscillate such that cellwashout will occur due to non-growth until the Fe2þ
concentration is restored to a level where the retained andresting population grow again. It is also likely that any wallgrowth will have a more significant effect on the steady-stateconditions since it was found that the biomass in the reactordecreased with decreasing retention time. In the presence ofwall growth, it can be shown that the actual specific growthrate always will be lower than the dilution rate. The decreasein specific growth rate is a function of the ratio betweennumber of microorganism on wall and planktonic micro-organism. On the other hand, too short retention timesmight cause culture wash out. It has been reported thatdominance of L. ferroxidans in mixed cultures over otheriron oxidizers such as At. ferroxidans strongly depends onlow residual Fe2þ concentration because of its higher affinityto Fe2þ (Norris et al., 1988; Rawlings et al., 1999). It was alsofound by Norris et al. (1988) that At. ferrooxidans was onlyable to dominate at a critical dilution rate. A too shortresidence time might therefore also cause significant alteration inthe culture composition by high residual Fe2þ concentration.
Determination of Kinetic and Yield Constants
The Monod kinetic constants were determined by Line-weaver-Burk, Eadie-Hofstee, and Langmuir methods(Table III). The plots obtained from the linearized Monodequations obtained by the Langmuir method are shown inFigure 1 and the obtained steady-state data fitted closely totheMonod equation. However, the calculated values ofmmax
and Ks varied between the evaluation methods with theLangmuir method giving the best fit since it gives a heavierweight on the higher residual Fe2þ concentrations that weredetermined most accurately. The Pirt yield parameters werealso determined by a linearization of the relationshipobtained between observed protein yield on oxidized Fe2þ
and dilution rate (Table IV) and the best fit to the linearizedequation is presented (Fig. 2).
Figure 1. Plot of the Monod equation by the Langmuir method (Eq. 40).
Table IV. Obtained biomass yield from Fe2þ oxidation for the two different feed concentrations.
Feed concentration (g Fe2þ L�1) D (h�1) Yobs (mg protein � g Fe2þ oxidized)
9 0.0942 0.610
9 0.0814 0.595
9 0.0810 0.538
9 0.0678 0.462
18 0.0893 0.843
18 0.0813 0.750
18 0.0700 0.564
18 0.0511 0.524
384 Biotechnology and Bioengineering, Vol. 99, No. 2, February 1, 2008
DOI 10.1002/bit

Modeling
For the modeling, the calculated Monod parameters mmax
and Ks determined by the Langmuir linearization methodhave been used together with the calculated Pirt-constantsgiven in Table V. Good fits were obtained without the needfor extra terms for Fe3þ inhibition or threshold Fe2þ
concentration, which confirm that the experimental pointsmeet the criteria for chemostat conditions. Within the testedrange of dilution rates, the residual Fe2þ concentration washigher at higher total iron concentrations at the samedilution rate (Fig. 3). This agrees with the findings for acontinuous At. ferrooxidans culture (Boon et al., 1999b).Since most of the iron at the experimental points was inthe Fe3þ state, the observation seems to be a result of Fe3þ
inhibition. However, it was noted that the differences inresidual Fe2þ concentrations decreased when the dilutionapproached the critical rate. Based on the Monod fit, theestimated maximum specific growth rate was not inhibitedby a higher iron concentration (Table III and Fig. 3). Thebiomass concentration in the reactor increased with a higherdilution rate and the model suggests that it should increaseuntil it is close to the critical rate. Since the estimated mmax
was higher at higher iron concentrations in the feedsolution, the estimated critical dilution rate was also higher(Fig. 4). The model suggests that an increased flow ratethrough the reactor will give higher reactor biomassproductivity until a flow rate close to the critical dilutionrate is applied (Fig. 5), which is also true for Fe3þ
productivity (Fig. 6). Fe3þ productivity was approximatelyproportional to the Fe2þ concentration in the feed since theconversion was almost complete in all experiments (Fig. 7).In accordance with the Pirt theory, the biomass yieldincreases with the dilution rate (Fig. 8). Therefore, contrary
to several reports this shows that growth uncoupled Fe2þ
oxidation is important and cannot be neglected as assumedby several authors (Harvey and Crundwell, 1996; Lacey andLawson, 1970; MacDonald and Clark, 1970). Otherwise aconstant biomass yield would have been observed inFigure 8. The phenomenon of growth uncoupled Fe2þ
oxidation has been previously reported in At. ferrooxidansbatch growth (Breed et al., 1999; Kelly and Jones, 1978). InFigure 9 the biomass yield was plotted versus the logarithmof the Fe3þ/Fe2þ ratio. The figure shows that for differenttotal iron concentrations the biomass yields were at the samelevel until the dilution neared the critical rate. The Fe3þ/Fe2þ
ratios were plotted against the dilution rate (Fig. 10) andwere determined by the actual Monod parameters. Theprojected-specific biomass Fe2þ utilization rate versusdilution rate (Fig. 11) and specific Fe2þ utilization rateversus Fe3þ to Fe2þ ratio (Fig. 12) demonstrated that thespecific Fe2þ utilization rates reached their maximum valuesat the critical dilution rate. This is in agreement with resultsreported by Boon et al. (1999b) and Ojumu et al. (2006). Ingeneral, the obtained shape of the curves in Fig. 12 was alsoin agreement with the corresponding curves presented byBreed et al. (1999), where biomass formation is related tocarbon dioxide uptake. However, the data indicate that thespecific Fe2þ utilization rate reaches a minimum value athigh redox potential and does not go to zero, which isindicated by Breed et al. (1999). This confirms that at a lowdilution rate or high Fe3þ/Fe2þ ratio, the chemostatrequirements are not fulfilled due to extensive starvationor non-negligible cell death. According to Equation (37) thetrue maintenance coefficient during chemostat conditionscan be obtained by setting the D-value to zero and is validover the entire chemostat range. For solutions with 9 g and18 g Fe L�1, the specific Fe2þ utilization rate due tomaintenance activities contributed approximately 90%and 65%, respectively, to the overall specific Fe2þ utilizationrate at the critical dilution rate according to Equation (37).However, it can be noted that Breed et al. (1999) reportedsignificantly lower maintenance contributions to themaximum specific Fe2þ utilization rate. The contributionof uncoupled Fe2þ oxidation to the specific Fe2þ utilizationrate will increase with lower dilution rates (Eq. (37)). Anydiscontinuity in the maintenance coefficient is then due todeviations from chemostat conditions.
It is obvious from the modeling of the chemostatconditions that the apparent ferric inhibition onspecific Fe2þ utilization rate was a direct consequence ofthe declining biomass yield on Fe3þ when the dilution ratewas decreased. According to the Pirt equation (Eq. (5)), adeclining biomass yield is caused by growth uncoupled Fe2þ
oxidation, which does not necessarily have to be related to
Figure 2. Plot of the Pirt equation (Eq. 5).
Table V. Calculated Pirt-constants for the two different feed concentrations.
Feed concentration (g Fe2þ L�1) ms (g Fe2þ (mg protein)�1 h�1) Ytrue (mg protein (g Fe2þ)�1) Fit (R2)
9 0.132 5.393 0.875
18 0.083 2.780 0.801
Sundkvist et al.: Modeling of Fe2þ Oxidation 385
Biotechnology and Bioengineering. DOI 10.1002/bit

the actual change of Fe3þ to Fe2þ ratio. Figures 11 and 13also show that the specific Fe2þ utilization rate was not onlya function of the Fe3þ to Fe2þ ratio, which was determinedby the dilution ratio, but also depended on the overallcomposition of the solution. From Figure 11 it can be seenthat the measured specific Fe2þ utilization rates wereapproximately 1.3–1.4 times higher for the culture grown on9 g Fe2þ L�1. This clarifies why the biomass concentrationswere 2.6–2.8 times higher in the 18 g L�1 experiments sincethe Fe2þ conversion was almost complete in all experiments.
Thermodynamic Calculations
It was observed that the conductivities of the steady-statereactor solutions were lower than in the feed solutions(Table II). This indicated a significant drop in the ionicstrength when Fe2þ was oxidized due to the change in the
chemical speciation. The actual chemical system wassimulated by performing thermodynamic calculations usingthe computer program Solgaswater (Sundkvist et al., 2005).The obtained simulated speciation versus redox potentialwas calibrated versus the experimentally determined Fe2þ
concentrations at approximately 630 mV versus the Ag,AgCl reference electrode.
From the calculated speciation, the ionic strength versusredox potential was calculated for the two feed solutions(detailed results not shown). The observed drastic drop inconductivity could be expected when the solutions wereoxidized (Fig. 13). The chemical speciation showed that themain reason for this was the formation of stable Fe3þ sulfatecomplexes when the solution was oxidized. All the presentedcontinuous Fe2þ oxidation tests were performed at dilution
Figure 3. Dilution rate versus residual Fe2þ concentration (Eq. 31).
Figure 4. Biomass concentration versus dilution rate (Eq. 32).
Figure 5. Reactor biomass productivity versus dilution rate (Eq. 33).
Figure 6. Reactor Fe3þ productivity versus dilution rate (Eq. 34).
386 Biotechnology and Bioengineering, Vol. 99, No. 2, February 1, 2008
DOI 10.1002/bit

rates giving a high redox potential. Figure 13 shows that theionic strength reached its minimum value and remainsconstant at a redox potential above 550 mV. The data alsoshowed that the ionic strength for the 18 g Fe L�1 solutionwas higher than for the 9 g Fe L�1 solution over theconsidered redox potential range. However, the differencesin ionic strength decline at higher redox potential, whichwas also confirmed by the conductivity measurements. Inspite of the higher concentration of ions in the feed solutionthe maintenance coefficient for the 18 g Fe L�1 solution waslower than that for the 9 g Fe L�1 solution. Therefore, thehigher maintenance coefficient obtained with the 9 g Fe L�1
solution could not be explained by the higher ionic strength(see Table V). The higher maintenance coefficient may
instead be explained by the indicated higher concentrationsof non-complexed HSO�4 and SO2�
4 ions appearing in the9 g Fe L�1 solution at redox potentials higher than about450 mV (Fig. 14).
Therefore, the determined values of the Monod and Pirtparameters are most probably invalid if the dilution rates areallowed to approach the critical since it coincides with boththe dramatic increase in ionic strength and free sulfatespecies. As a consequence of the observed change in ionicstrength and chemical speciation versus redox potential, thevalues of the kinetic- and yield parameters determined bybatch tests might therefore be different from those obtainedfrom continuous tests. In batch culture, the redox potentialnormally starts at a low level and increases rapidlyduring the course of oxidation. This is in agreement withBoon et al. (1999a) who reported that batch cultures(containing a low Fe3þ to Fe2þ ratio) inoculated by At.
Figure 7. Fe2þ conversion versus dilution rate (from feed concentration
and Eq. 35).
Figure 8. Biomass yield from Fe2þ oxidation versus dilution rate (Eqs. 30 and 31).
Figure 9. Biomass yield on oxidized Fe2þ versus log[Fe3þ/Fe2þ] (Eqs. 30, 31, 36).
Figure 10. log[Fe3þ/Fe2þ] versus dilution rate (Eq. 36).
Sundkvist et al.: Modeling of Fe2þ Oxidation 387
Biotechnology and Bioengineering. DOI 10.1002/bit

ferrooxidans cells from continuous culture needed 14–18 hto reach themmax and the maximum specific Fe2þ utilizationrate found for the continuous culture.
The data presented here also agrees with Blight and Ralph(2004), that ionic strength is a significant variable in thegrowth of chemolithotrophic cultures. In addition, we foundthat the general composition and chemical speciation mayalso have a crucial impact on growth rate and biomass yield.
Conclusions
It has been shown that the Fe2þ oxidation rate and thebiomass formation rate for a continuous L. ferrooxidans
dominated culture at steady-state chemostat conditions canbe described for a given feed solution by using the basicMonod kinetic equation and the Pirt maintenance equationin an overall mass-balancing procedure. To ensure chemo-stat conditions, it was found that the range of the dilutionrates have to be limited. A too long retention time mightcause starvation or non-negligible death rate whereas; a tooshort retention time may cause a significant alteration inboth solution chemistry and culture composition.
Thermodynamic calculations indicated that chemicalspeciation during the course of Fe2þ oxidation changed suchthat the ionic strength as well as the free sulfateconcentration was significantly affected. However, the
Figure 11. Specific Fe2þ utilization rate on biomass versus dilution rate (Eq. 37).
Figure 12. . Specific Fe2þ utilization rate versus log[Fe3þ/Fe2þ] (Eqs. 36 and 37).
Figure 13. Calculated ionic strength versus redox potential.
Figure 14. Calculated free sulfate (HSO�4 þSO2�4 )� concentration versus
redox potential.
388 Biotechnology and Bioengineering, Vol. 99, No. 2, February 1, 2008
DOI 10.1002/bit

thermodynamic calculations which were confirmed byconductivity measurements showed that only minorchanges in ionic strength and speciation can be expectedwithin the range of selected experimental dilution rates forrespective feed solutions.
Therefore, since major changes in ionic strength andspeciation occur during the course of a batch Fe2þ oxidationit was concluded that the values of kinetic- and yieldparameters determined by batch growth might be differentfrom those obtained from continuous cultures at steady state.
The model suggests that the values of the kinetic and yieldparameters change with the overall composition of thesolution, both with respect to ionic strength and chemicalspeciation. It has also been shown that the reactor Fe3þ
productivity was approximately proportional to the Fe2þ
concentration in the feed, provided that the reactors werenot operating too close to the lowest determined criticaldilution rate.
The model proposes that for solutions with 9 g and 18 gFe L�1, the specific Fe2þ utilization rate due to maintenanceactivities contributed approximately 90% and 65% to themaximum Fe2þ-specific utilization rate, respectively. Themaximum specific Fe2þ utilization rate appears close to thecritical dilution rate and varies with the total concentrationof iron.
The presented model also suggests that the apparent Fe3þ
inhibition on specific Fe2þ utilization rate is a directconsequence of the declining biomass yield on Fe2þ due togrowth uncoupled Fe2þ oxidation when the dilution rate isdecreased in accordance with the Pirt equation. Growthuncoupled Fe2þ oxidation may not necessarily be coupled tothe Fe3þ to Fe2þ ratio.
We thank the Agricola Research Centre, Boliden Mineral, and Carl
Bennet AB for funding this work. We also thank Bioclear b.v.,
Netherlands for the Q-PCR analysis carried out within the EU-funded
BioMinE project contract N8 500329-1 and Dr. Mark Dopson, Umea
University, Sweden for his comments on the manuscript.
References
Blight KR, Ralph DE. 2004. Effect of ionic strength on iron oxidation with
batch cultures of chemolithotrophic bacteria. Hydrometallurgy
73:325–334.
Boon M, Ras C, Heijnen JJ. 1999a. The ferrous iron oxidation kinetics of
Thiobacillus ferrooxidans in batch cultures. Appl Microbiol Biotechnol
51:813–819.
Boon M, Meeder TA, Thone C, Ras C, Heijnen JJ. 1999b. The ferrous iron
oxidation kinetics of Thiobacillus ferrooxidans in continuous cultures.
Appl Microbiol Biotechnol 51:820–826.
Bradford MM. 1976. A rapid and sensitive method for the quantitation of
microgram quantities of protein utilizing the principle of protein-dye
binding. Anal Biochem 72:248–254.
Breed AW, Dempers CJN, Searby GE, Gardner MN, Rawlings DE, Hansford
GS. 1999. The effect of temperature on the continuous ferrous iron
oxidation kinetics of a predominantly Leptospirillum ferrooxidans cul-
ture. Biotechnol Bioeng 65:44–53.
Doran PM. 1995. Bioprocess engineering principles. London: Academic
Press, Harcourt Brace & Company, Publishers.
Fowler TA, Holmes PR, Crundwell FK. 1999. Mechanism of pyrite dis-
solution in the presence of Thiobacillus ferrooxidans. Appl Environ
Microbiol 65:2987–2993.
Ghauri AM, Okibe N, Johnson DB. 2007. Attachment of acidophilic
bacteria to the solid surfaces: The significance of species and strain
variations. Hydrometallurgy 85:72–80.
Harvey PI, Crundwell FK. 1996. The effect of As (III) on the growth of
Thiobacillus ferrooxidans in an electrolytic cell under controlled redox
potentials. Miner Eng 9:1059–1068.
Johnson DB, Hallberg KV. 2005. Acid mine drainage remediation options:
A review. Sci Total Environ 338:3–14.
Kelly DP, Jones CA. 1978. Factors affecting metabolism and ferrous iron
oxidation in suspensions and batch cultures of Thiobacillus ferroox-
idans: Relevance to ferric iron leach solution regeneration. Metallurgi-
cal applications of bacterial leaching and related microbiological
phenomena. New Mexico: Academic press Inc. pp 19–44.
Kolthoff JM, Sandell B. 1963. Textbook of quantitative inorganic chemistry.
New York, NY: MacMillan publishing Co.
Lacey DT, Lawson F. 1970. Kinetics of liquid-phase oxidation of acid ferrous
sulphate by the bacterium Thiobacillus ferrooxidans. Biotechnol Bioeng
12:29–50.
Liu Y. 1998. Energy uncoupling in microbial growth under substrate-
sufficient conditions. Appl Microbiol Biotechnol 49:500–505.
Liu Y, Chen GH. 1997. Model of energy uncoupling for substrate-sufficient
culture. Biotechnol Bioeng 55:571–576.
Liu MS, Branion RMR, Duncan DW. 1988. The effects of the ferrous iron,
dissolved oxygen, and inert solids concentration on the growth of
Thiobacillus ferrooxidans. Can J Chem Eng 66:445–451.
MacDonald DG, Clark RH. 1970. The oxidation of aqueous ferrous
sulphate by Thiobacillus ferrooxidans. Can J Chem Eng 482:669–
676.
Marchbank AR, Kirby E, Roberto FF. 2003. The application of biologically
mediated leaching methods—A comprehensive review. CIM Bull
(June/July): 143–147.
Norris PR, Barr DW, Hinson D. 1988. Iron and mineral oxidation by
acidophilic bacteria: Affinities for iron and attachment to pyrite.
Biohydrometall Proc Int Sym p 43–59.
Ojumu TV, Petersen J, Searby GE, Hansford GS. 2006. A review of rate
equations proposed for microbial ferrous iron oxidation with a view to
application to heap bioleaching. Hydrometallurgy 83:21–28.
Pirt SJ. 1975. Principles of microbe and cell cultivation. Oxford: Blackwell
Scientific Publications.
Rawlings DE, Tributsch H, Hansford GS. 1999. Reasons why ‘‘Leptospir-
illum’’-like species rather than Thiobacillus feroroxidans are the
dominant iron-oxidizing bacteria in many commercial processes
for the biooxidation of pyrite and related ores. Microbiology 145:
5–13.
Rawlings DE, DewD, Plessis CD. 2003. Biomineralization of metal-contain-
ing ores and concentrates. Trends Biotechnol 21:38–44.
Rohwerder T, Gehrke T, Kinzler K, Sand W. 2003. Bioleaching review part
A: Progress in bioleaching: Fundamentals and mechanisms of bacterial
metal sulfide oxidation. Appl Microbiol Biotechnol 63:239–248.
Schippers A, Sand W. 1999. Bacterial leaching of metal sulfides proceeds by
two indirect mechanisms via thiosulfate or via polysulfides and sulfur.
Appl Environ Microbiol 65:319–321.
Schippers A, Von Rege H, Sand W. 1996. Impact of microbial diversity and
sulphur chemistry on safeguarding sulfidic mine waste. Miner Eng
9:1069–1079.
Senn H, Lendenmann U, Snozzi M, Hammer GI, Egli T. 1994. The growth
of Escherichia coli in glucose-limited chemostat cultures: A re-exam-
ination of the kinetics. Biochim Biophys Acta 1201:424–436.
Silverman MP, Lundgren DG. 1959. Studies on the chemoautotrophic iron
bacterium Ferrobacillus ferrooxidans I. An improved medium and a
harvesting procedure for securing high cell yields. J Bacteriol 77:642–
647.
Sundkvist JE, Sandstrom A, Gunneriusson L, Lindstrom EB. 2005. Fluorine
toxicity in bioleaching systems. Proceedings of the 16th International
Biohydrometallurgy Symposium ISBN: 1-920051-17-1: 19–28.
Zeng AP, Deckwer WD. 1995. A kinetic model for substrate and energy
consumption of microbial growth under substrate-sufficient condi-
tions. Biotechnol Prog 11:71–79.
Sundkvist et al.: Modeling of Fe2þ Oxidation 389
Biotechnology and Bioengineering. DOI 10.1002/bit
PAPER VII
Effect of chloride on ferrous iron oxidation by a Leptospirillum ferriphilum
dominated chemostat culture
C. S. Gahan, J. E. Sundkvist, Mark Dopson, Åke Sandström
Submitted to Biotechnology and Bioengineering, 20091


Effect of chloride on ferrous iron oxidation by a Leptospirillum ferriphilum-
dominated chemostat culture
Chandra Sekhar Gahan1, Jan-Eric Sundkvist1,2, Mark Dopson3, Åke Sandström1
1Division of Extractive Metallurgy, Dept. of Chemical Engineering and Geosciences,
Luleå University of Technology, SE-971 87 Luleå, Sweden
2Boliden Mineral AB, SE-936 81 Boliden, Sweden
3Department of Molecular Biology, Umeå University, Umeå, Sweden
E-mail address of each author:
[email protected]; [email protected]; [email protected];
Corresponding author: Åke Sandström
Division of Extractive Metallurgy, Dept. of Chemical Engineering and Geosciences,
Luleå University of Technology, SE-971 87 Luleå, Sweden
Tel.: +46 920 491290
Fax: +46 920 491199
E-mail: [email protected]

Page 2 of 40
Abstract: Biomining is the use of microorganisms to catalyze metal extraction from
sulfide ores. However, the available water in some biomining environments has high
chloride concentrations and therefore, chloride toxicity to ferrous oxidizing
microorganisms has been investigated. Batch biooxidation of Fe2+ by a Leptospirillum
ferriphilum-dominated culture was completely inhibited by 12 g L-1 chloride. In
addition, the effects of chloride on oxidation kinetics in a Fe2+ limited chemostat was
studied. Biomass and residual Fe2+ concentrations obtained at three different dilution
rates from each experiment were utilized to model Fe2+ oxidation with the Monod and
Pirt equations. Modeling showed a decrease in the maximum specific growth rate (μmax)
and an increase in the substrate constant (Ks) with increasing chloride concentrations,
indicating an effect on the Fe2+ oxidation system. The model proposes a low
maintenance activity of 23-24% of the maximum specific Fe2+ utilization rate when the
media was fed with 2 to 3 g L-1 chloride; while a maintenance activity of 93% of the
maximum Fe2+ specific utilization rate was observed without chloride. Chloride toxicity
was attributed to affects on Fe2+ oxidation, pH homeostasis, and the proton motive force.
This model helps to understand the influence of chloride on Fe2+ biooxidation kinetics.
Key words: ferrous iron oxidation, chloride, modeling, chemostat, Leptospirillum
ferriphilum

Page 3 of 40
Introduction
Ferrous iron oxidation by Acidithiobacillus ferrooxidans has been extensively studied
and its tolerance to dissolved metal ions including As, Cu, Co, Ni, Mn, Ag, Hg, and Al;
their effects on the Fe2+ oxidation; and their growth kinetics has been widely
investigated (Tuovinen et al., 1971; Garcia Jr and da Silva, 1991; Wang et al., 2004).
However, the kinetics of Fe2+ oxidation by Leptospirillum ferrooxidans and
Leptospirillum ferriphilum has only recently received more attention (Sundkvist et al.,
2008; Ojumu and Petersen, 2009; Penev and Karamanev, 2009; Ojumu et al., 2009;
Bastias and Gentina, 2009; Rawlings et al., 1999). The greater attention paid to
Leptospirillum species is due to their capability to withstand extreme conditions such as
low pH, high redox potential and high temperatures compared to other iron oxidizers
(Rawlings et al., 1999). This permits Leptospirillum spp. to be prevalent in tank
bioleaching operations as well as heap reactors (Norris, 2007; Rawlings, 2007). Tank
bioleaching reactors operating for biooxidation of gold containing arsenopyritic ores
and concentrates are known to be dominated by Leptospirillum spp. (Leptospirillum
ferriphilum dominates over Leptospirillum ferrooxidans) and Acidithiobacillus caldus
(Coram and Rawlings, 2002). The wider applications of Leptospirillum species in
nanoparticle synthesis and microbial fuel cells have also motivated the study of their
Fe2+ oxidation kinetics (Gao et al., 2006).
Chloride may be present in biomining operations via dissolution of silicate minerals
or utilization of brackish groundwater’s present in important biomining areas such as
Western Australia and Chile. In general, acidophiles (microorganisms with an optimum
growth pH <5) have little tolerance to chloride ions. Chloride is known to inhibit both
cell growth and the Fe2+ iron oxidation enzyme system in acidophilic iron oxidizers

Page 4 of 40
(Din and Suzuki, 1967). The growth rate of a mixed culture of acidophilic Fe2+
oxidizers is reduced by >50% in the presence of 7 g NaCl L-1 (Shiers et al., 2005) and A.
ferrooxidans Fe2+ inhibition was more sensitive to the addition of chloride than sulfur
oxidation (Harahuc et al., 2000). The mechanism of chloride inhibition to A.
ferrooxidans (Alexander et al., 1987) and Acidithiobacillus thiooxidans (Suzuki et al.,
1999) is attributed to influx of chloride ions across the cytoplasmic membrane. This
dissipates the membrane potential ( ), resulting in leakage of protons into the cell,
and disruption of pH homeostasis (reviewed in Slonczewski et al. 2008). Chloride ions
also collapse the in the acidophile Bacillus coagulans (McLaggan et al., 1990). In
the absence of an uncoupler, protons will not enter the cytoplasm due to the balance
between the internal positive and the pH gradient across the cytoplasmic membrane
( pH) without the passive inflow or outflow of a permeant anion or cation, respectively
(Ferguson and Ingledew, 2008).
Bioleaching operations in regions with limited chloride free water have motivated
the study of the effect of chloride ions on biomining efficiency (Weston et al., 1994;
Deveci et al., 2008; Shiers et al., 2005; Lawson et al., 1995; Gahan et al., 2009). High
concentrations of chloride may influence the biooxidation efficiency both by jarosite
precipitation with its counter-ions (e.g. sodium or potassium), that removes Fe3+ from
solution, as well as imposing toxic effects on the microorganisms. Salt tolerant
acidophiles including ‘Thiobacillus prosperus’ (Huber and Stetter, 1989; Simmons and
Norris, 2002) have been isolated from marine acidic environments and are more
chloride resistant than terrestrial isolates (Huber and Stetter, 1989). ‘Thiobacillus
prosperus’ requires the presence of chloride ions for growth and achieves Fe2+ oxidation
rates similar to that of A. ferrooxidans (Nicolle et al., 2009). A different marine

Page 5 of 40
acidophile isolate, A. thiooxidans strain SH, also requires NaCl for growth and its sulfur
and sulfite oxidizing activities were stimulated in resting cells but not cell free extracts
(Kamimura et al., 2005).
The present investigation helps to understand the effects of chloride on Fe2+
oxidation kinetics by a L. ferriphilum-dominated culture by supplementing different
chloride concentrations into the growth medium in batch and chemostat studies. The
derivations for the modeling of the Fe2+ oxidation kinetics were based on previous work
conducted by Sundkvist et al. (2008).
Theory and importance of true chemostat operation
All rate equations developed in the study were based on the basic Monod and Pirt
equations with no further assumptions made (symbols and nomenclature given in Table
I) (Doran, 1995; Pirt, 1975). Dempers et al. (2003) describe a batch Fe2+ oxidation
experiment where the specific bacterial Fe2+ iron utilization rate (qFe2+) is plotted against
the bacterial growth rate ( ). In true chemostat culture, this type of plot yields a straight
line where the value of the intercept is equal to the maintenance coefficient (ms) and the
slope equals the inverse of the observed yield (1/Yobs). Dempers shows that batch Fe2+
biooxidation passes through three zones of which, the initial and final zones with low
and high redox potentials, respectively define chemostat conditions. In between, there is
a transition zone where the specific Fe2+ utilization rate decreases more quickly and the
specific growth rate increases indicating that the maintenance coefficient is not strictly
growth rate dependent. These observations agree with Sundkvist et al. (2008) regarding
changes in kinetic and growth parameters during the course of batch oxidation since

Page 6 of 40
ionic strength significantly decreases in a transition zone when Fe2+ is oxidized to Fe3+
due to stronger complexation of Fe3+ to sulfate ions.
An interpretation of Dempers results would be that the high ionic strength and
concentration of non-complexed sulfate ions manifested in a higher maintenance
coefficient of 8.2 mol Fe2+ (mol C)-1(h-1) when operated at low redox potentials.
Maintenance gradually decreases when Fe2+ is oxidized to Fe3+ until it reaches
approximately 1.3 mol Fe2+ (mol C)-1(h-1). An explanation for the increase in specific
growth rate during the transition zone is that that the reduction in ionic strength
enhances the growth rate greater than the reduction caused by decreased substrate
concentration.
An often-overlooked phenomenon under chemostat conditions is wall growth that
masks true microbial growth (Sundkvist et al., 2008). If it is assumed that planktonic
and sessile cells have the same specific growth rate then the true specific growth rate in
a continuous reactor can be described by Equation 1 (Becker and Märkl, 2000).
ba
D1
(1)
Where a stands for sessile biomass, b for planktonic biomass, and D is equal to the
apparent specific growth rate or dilution rate. This implies that with wall growth, the
specific growth rate ( ) is not equal to D and at high dilution rates, the actual growth
rate is lower than the observed dilution rate. Also, when the reactor is operated at very
low dilution rates the ratio of sessile to planktonic cells is difficult to minimize.
Depending on how biomass is measured, different effects due to wall growth can be
observed. Direct biomass measurements (e.g. protein concentration) under-estimates the
value; while indirect methods (e.g. carbon dioxide off-gas analysis) over-estimates the

Page 7 of 40
amount of biomass since it includes carbon dioxide uptake for processes un-related to
cell production. One such process is EPS layer formation as sessile cells produce 1000-
fold more EPS than planktonic cells (Sand et al., 2009) and therefore, all efforts to
avoid biofilm formation should be made such as regular cleaning or silane treatment of
the reactor (Sundkvist et al., 2008; Eccleston and Kelly, 1978; Svirko et al., 2009).
Extensive wall growth is manifested by a flattened growth curve when biomass is
plotted against dilution rate (Becker and Märkl, 2000, Ojumo et al., 2009).
Mass balance studies show that μmax, Ks, ms, and Ytrue determine the steady state
conditions for a given concentration of the feed if chemostat conditions are obeyed
(Sundkvist et al., 2008). The values of the above stated parameters may be calculated if
residual Fe2+ and biomass concentration for at least two different dilution rates are
determined (Sundkvist et al., 2008).
Materials and methods
Microorganisms and growth media
The inoculum used in the experiments was from a mixed mesophilic culture of iron
oxidizers dominated by Leptospirillum ferriphilum (previously identified as
Leptospirillum ferrooxidans) (Sundkvist et al. 2008). Batch and chemostat cultures were
incubated in 9K nutrient medium (3.0 g L-1 (NH4)2SO4, 0.1 g L-1 KCl, 0.5 g L-1 K2HPO4,
0.5 g L-1 MgSO4·7H2O, 0.01 g L-1 Ca(NO3)2.4H2O) supplemented with 9 g Fe2+ L-1
(Silverman and Lundgren, 1959). The microbial population was dominated by
Leptospirillum ferriphilum (2.1 108 cells mL-1) together with a minor content of
Sulfobacillus sp. (7.3 105 cells mL-1), Acidithiobacillus sp. (4.9 104 cells mL-1), and
A. thiooxidans (2.6 104 cells mL-1) as determined by Q-PCR analysis (Bioclear B.V.,

Page 8 of 40
Netherlands). Q-PCR samples were fixed before DNA extraction with 5 mL of 2 M
Tris-HCl buffer (pH 9) and 10 mL of 95% of ethanol for each 5 mL of the culture
sample.
Shake-flask experiments
Batch biooxidation experiments (100 mL working volume) were performed in 250 mL
Erlenmeyer shake-flasks with an inoculum of 10 % (vol/vol) in 9K medium (pH 1.5)
supplemented with 9 g L-1 Fe2+ (Silverman and Lundgren, 1959) and the indicated
chloride concentrations. Batch experiments were incubated in a Max Q Mini 4450
rotary orbital shaker at 35 ± 0.5ºC and a rotation speed of 150 rpm. Water evaporation
was compensated at regular intervals by addition of deionized water. The oxidation-
reduction potential and pH were measured at regular intervals to follow the biooxidation
trends in the experiments. The pH was controlled by addition of 1 M H2SO4 or 1 M
NaOH as required. Experiments were continued until no further change in redox
potential or pH was observed.
Chemostat experiments
Chemostat experiments were carried out in a 2.5 L baffled borosilicate glass bioreactor
with a height/diameter (H/D) value of 1.8 and a working volume of 1 L (Sundkvist et
al., 2008). The culture had a dilution rate of 0.08 h-1 controlled with a Watson-Marlow
505S peristaltic pump (Christian Berner AB, Sweden) and an inlet medium pH of 1.50 ±
0.05. The temperature was maintained at 35ºC by a hot plate under the reactor. The
culture was stirred with a propeller placed 1.5 cm above the base of the reactor at 300
rpm. A dissolved oxygen level of 5-6 mg L-1 was maintained by blowing CO2 enriched

Page 9 of 40
air (2-3%, vol/vol) at a flow rate of 1 L min-1 underneath the propeller. Continuous Fe2+
oxidation experiments were conducted with 9K nutrient medium containing 9 g Fe2+ L-1
supplemented with 0, 2, or 3 g chloride L-1 fed into the reactor, each of which were
operated at 3 dilution rates ranging from 0.03-0.09 h 1. Steady state was maintained for
at least 2-3 consecutive days (to achieve steady state the bioreactor was operated for >3
culture volumes at each dilution rate) as measured by stable values of redox potential,
residual Fe2+ concentration, and protein concentration (Table II). No attempts were
made to maintain sterile conditions. Microbial wall growth effects were minimized by
daily transferring the microbial solution to a new, thoroughly cleaned reactor.
Analytical techniques
Oxidation of Fe2+ was monitored by determining the residual Fe2+ concentration by a
titrimetric method using cerium sulfate with 1,10-phenanthroline indicator (Kolthoff
and Sandel, 1963). Samples taken for Fe2+ titration were immediately filtered through a
GHP Acrodisc® 25 mm syringe filter with 0.2 μm GHP membrane (PALL Life Sciences,
Ann Arbor, MI) to stop bacterial Fe2+ oxidation after sampling. Redox potential and pH
were measured using an ORION portable pH/ISE Mode-250A meter and the probe used
to measure the redox potential was a platinum electrode with an Ag, Ag/Cl reference
electrode. The dissolved O2 content in the bioreactor was measured using a HQ10 Hach
portable LDOTM meter.
To estimate the bacterial protein concentration, 2 1 mL of bacterial culture was
pelleted (10,000 g for 20 min). The cell pellet obtained from one of the samples was re-
suspended in 0.5 mL Bradford reagent (Bradford, 1976) and mixed for 30 sec, followed
by 5 min incubation at room temperature. After incubation, 0.5 mL of ultra pure Milli-Q

Page 10 of 40
water (Millipore, Molsheim, France) was added, vortexed for 10 sec, and incubated for
30 min in room temperature. The cell pellet obtained from the other 1 mL sample was
re-suspended in 1 mL of ultra pure Milli-Q water and vortexed for 30 sec. Finally, the
sample with Bradford reagent treatment was measured for its absorbance on a UV-VIS
spectrophotometer (Beckman Coulter AB, Bromma, Sweden, DU® 730 life science) at
595 nm against 1:1 ratio of Bradford reagent and ultra pure Milli-Q water as blank. The
absorbance for the sample treated with only ultra pure Milli-Q water was measured at
595 nm against ultra pure Milli-Q water as blank. The absorbance obtained from the cell
pellet treated with ultra pure Milli-Q water was subtracted from the absorbance obtained
from the cell pellet treated with Bradford reagent. A standard protein calibration curve
was obtained from bovine serum albumin treated with Bradford reagent. Sampling for
protein estimation was carried out in triplicate and the sample with highest
concentration considered most accurate and used for the calculations as the most
probable experimental error was pellet loss during cell washing.
Results and Discussion
Tolerance limit of chloride in batch studies
A gradual increase in the chloride concentration resulted in a concomitant increase in
the lag phase during batch growth of the L. ferriphilum dominated culture (Figure 1).
The lag phase varied from approximately 25 h with no chloride addition up to 250 h
with an addition of 11 g chloride L-1 (no growth occurred after 2 weeks with 12 g and
13 g L-1). Rapid Fe2+ oxidation occurred (determined by the increase in the redox
potential) in the presence of 10 g L-1 once the bacteria were adapted to the chloride (i.e.
after the lag phase). The lower endpoint redox potentials were not due to complexation
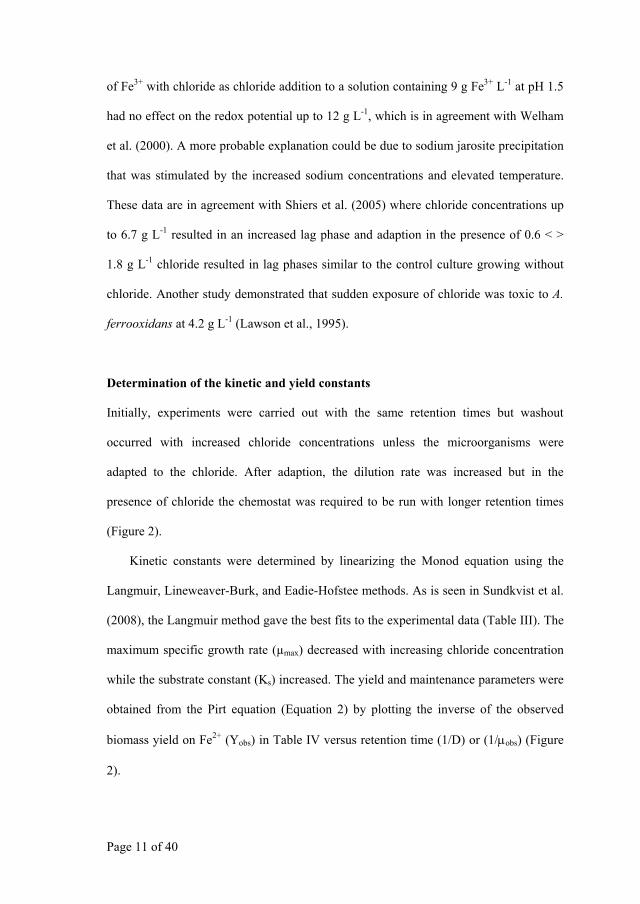
Page 11 of 40
of Fe3+ with chloride as chloride addition to a solution containing 9 g Fe3+ L-1 at pH 1.5
had no effect on the redox potential up to 12 g L-1, which is in agreement with Welham
et al. (2000). A more probable explanation could be due to sodium jarosite precipitation
that was stimulated by the increased sodium concentrations and elevated temperature.
These data are in agreement with Shiers et al. (2005) where chloride concentrations up
to 6.7 g L-1 resulted in an increased lag phase and adaption in the presence of 0.6 < >
1.8 g L-1 chloride resulted in lag phases similar to the control culture growing without
chloride. Another study demonstrated that sudden exposure of chloride was toxic to A.
ferrooxidans at 4.2 g L-1 (Lawson et al., 1995).
Determination of the kinetic and yield constants
Initially, experiments were carried out with the same retention times but washout
occurred with increased chloride concentrations unless the microorganisms were
adapted to the chloride. After adaption, the dilution rate was increased but in the
presence of chloride the chemostat was required to be run with longer retention times
(Figure 2).
Kinetic constants were determined by linearizing the Monod equation using the
Langmuir, Lineweaver-Burk, and Eadie-Hofstee methods. As is seen in Sundkvist et al.
(2008), the Langmuir method gave the best fits to the experimental data (Table III). The
maximum specific growth rate (μmax) decreased with increasing chloride concentration
while the substrate constant (Ks) increased. The yield and maintenance parameters were
obtained from the Pirt equation (Equation 2) by plotting the inverse of the observed
biomass yield on Fe2+ (Yobs) in Table IV versus retention time (1/D) or (1/ obs) (Figure
2).

Page 12 of 40
obs
s
true
mY
1Y
1obs
(2)
In this plot, the intercept was equal to the inverse of the true yield (1/Ytrue) and the slope
equal to the maintenance coefficient (ms). Chloride addition greatly influenced the true
yield (Ytrue) when 2 and 3 g L-1 chloride were added with a lower yield at higher
chloride concentrations (Table V). However, Ytrue may vary for a given substrate and
depends on growth conditions and should not be considered as a biological constant
(van Bodegom, 2007).
Modeling of the Fe2+ oxidation
The determined μmax, Ks, and Yobs values were used with the Pirt constants (Table V) to
model Fe2+ oxidation with different chloride concentrations. An increase in residual
Fe2+ with increasing dilution rate was observed in all experiments. However, the critical
dilution rate decreased with increasing chloride concentrations in the growth medium
(Figure 3). The plot of D versus residual Fe2+ concentration (Figure 3) was based on
Equation 3.
)( max DKDS s (3)
μmax values decreased with increasing chloride concentrations in the growth medium
(Table III and Figure 3) that was accompanied by increased residual Fe2+ and Ks values
(Tables II and III). Figure 4 was obtained by plotting the biomass (X) against D
according to Equation 4.
))(
()11/(1max
0 DKDSm
DYX s
strue
(4)

Page 13 of 40
Without chloride, the biomass linearly increased with increasing D until the critical
dilution rate was approached. With the addition of 2 g and 3 g L-1 chloride, the biomass
production was reduced and was relatively insensitive to the dilution rate. An attempt
was also made to increase the chloride to 4 g L-1 but the microorganisms were not able
to withstand that chloride concentration.
Biomass and Fe3+ productivity in the reactor increased with increasing dilution rate
as seen in the Figures 5 and 6 which were derived from Equations 5 and 6.
XDXVFPx (5)
DKDSDP s
smax
0 (6)
However, both the biomass and Fe3+ productivities decreased with increasing chloride
concentration in the feed. Due to the high Fe2+ to Fe3+ conversion rate in all experiments
the Fe3+ productivity was linear (Figure 6) with the only difference that higher dilution
rates were tolerated with less chloride added before the critical dilution rate was reached.
As per the Pirt theory, the biomass yield increased with increasing dilution rate
(Figure 7), as growth uncoupled Fe2+ oxidation cannot be ignored (Equations 3 and 7),
and was in agreement with previous studies (Sundkvist et al., 2008, Becker and Märkl,
2000).
SSmDY
Xs
true
011
1 (7)
The plots of specific Fe2+ oxidation rate versus dilution rate (Equation 8; Figure 8) and
specific Fe2+ oxidation rate versus the log of the Fe3+ to Fe2+ ratio (Equations 8 and 9;
Figure 9) showed that the specific Fe2+ oxidation rate was relatively constant and
insensitive to both dilution rate and the Fe3+ to Fe2+ ratio. It must be noted that the units
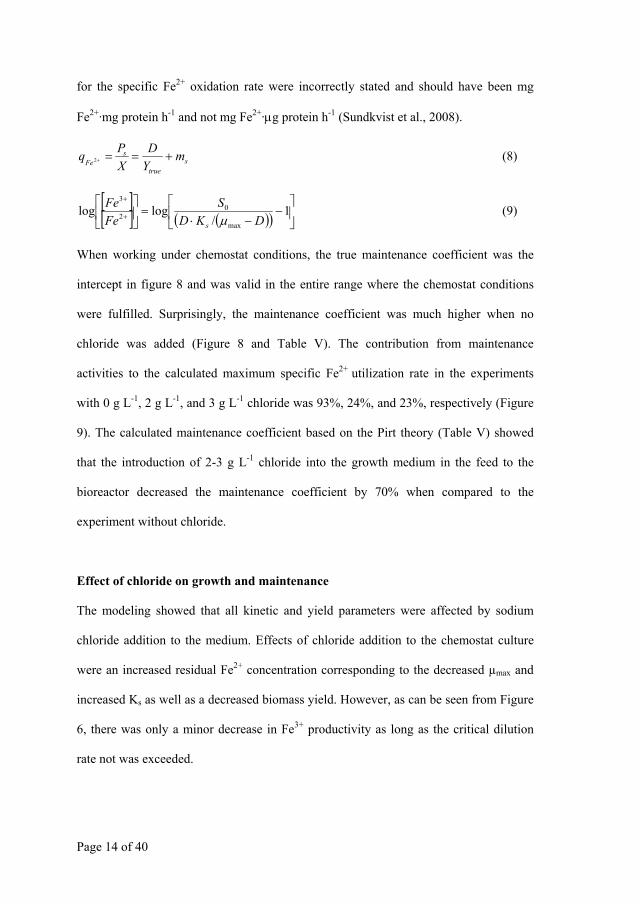
Page 14 of 40
for the specific Fe2+ oxidation rate were incorrectly stated and should have been mg
Fe2+·mg protein h-1 and not mg Fe2+· g protein h-1 (Sundkvist et al., 2008).
strue
sFe m
YD
XPq 2 (8)
1/
loglogmax
02
3
DKDS
FeFe
s
(9)
When working under chemostat conditions, the true maintenance coefficient was the
intercept in figure 8 and was valid in the entire range where the chemostat conditions
were fulfilled. Surprisingly, the maintenance coefficient was much higher when no
chloride was added (Figure 8 and Table V). The contribution from maintenance
activities to the calculated maximum specific Fe2+ utilization rate in the experiments
with 0 g L-1, 2 g L-1, and 3 g L-1 chloride was 93%, 24%, and 23%, respectively (Figure
9). The calculated maintenance coefficient based on the Pirt theory (Table V) showed
that the introduction of 2-3 g L-1 chloride into the growth medium in the feed to the
bioreactor decreased the maintenance coefficient by 70% when compared to the
experiment without chloride.
Effect of chloride on growth and maintenance
The modeling showed that all kinetic and yield parameters were affected by sodium
chloride addition to the medium. Effects of chloride addition to the chemostat culture
were an increased residual Fe2+ concentration corresponding to the decreased μmax and
increased Ks as well as a decreased biomass yield. However, as can be seen from Figure
6, there was only a minor decrease in Fe3+ productivity as long as the critical dilution
rate not was exceeded.

Page 15 of 40
The Fe2+ oxidation capacity for a batch culture growing with 0 g and 3 g L-1
chloride was modeled using the found maximum specific Fe2+ utilization rates in the
chemostat modeling. Optimum conditions were assumed such that an adequate supply
of Fe2+ and oxygen ensured maximum growth rate and the initial biomass was assumed
to be 1 mg in both cases. The results obtained from the comparative batch modeling
suggested that until about 20 h of growth, the culture with 3 g L-1 chloride had the
higher Fe2+ oxidation capacity. However, after 20 h the culture with 0 g L-1 chloride
oxidized Fe2+ at the faster rate (Figure 10) in spite of the lower maximum specific Fe2+
utilization rate, since the culture without chloride grew at a faster growth rate. The
predicted higher initial Fe2+ oxidation rate agreed with chloride toxicity effects found in
batch tests with other acidophiles (Zammit & Dopson, unpublished data). However,
modeling of the experimental data suggested that chloride may inhibit the specific Fe2+
utilization rate at lower growth rates (Figure 8). Therefore, at lower substrate levels the
effect of chloride will be even more emphasized since the growth rate also decreased
with increased chloride concentration for a given residual substrate concentration
(Figure 3).
This suggests that the observed effects of chloride are a combination of inhibition
of the Fe2+ oxidation system (change in μmax and Ks since the chemostat is energy
limited), and a change in the energy requirements for growth and maintenance (change
in Ytrue and ms). Possible explanations for the toxic effect of chloride could be due to: i.
overloading of pH mechanisms from proton transport into the cytoplasm (Alexander et
al., 1987; Suzuki et al., 1999); ii. a deleterious effect on the cell membrane eventually
leading to cell death as is observed in batch culture with high NaCl additions (Dew et al.,
1997); or iii. increased ionic strength caused by the NaCl imposing an energy load on

Page 16 of 40
the cell due to the osmotic gradient between the cells interior and exterior (Blight and
Ralph, 2004; Ojumu et al., 2008).
Proton transport into the cell may be as a result of chloride permeability due to
electrostatic attraction by the inside positive acidophile cell (McLaggan et al., 1990).
Studies state that the lipid bilayer in the cell membrane has a high permeability to
chloride ions (Gutknecht and Walter, 1981; Toyoshima and Thompson, 1975) and
proton permeability is higher than that of sodium (Driessen et al., 1996). Rapid chloride
permeation would decrease the , allowing influx of protons across the membrane,
lowering the pH and consequently, the proton motive force (PMF). The inhibitory role
of the chloride ions may not be to dissipate the per se but rather to facilitate the
transport of protons into the cytoplasm, collapsing the pH, and inhibiting acidophile
energy production (Dopson et al., 2002). The can be restored by potassium or
rubidium entry as a counter-ion but sodium is less effective (Suzuki et al., 1999).
Therefore, the increased specific Fe2+ oxidation rate with a lower Ytrue may be due to the
extra energy required to maintain pH, although at a lower level, in the presence of
chloride. Also, as a consequence of the reduced PMF the cells may require a higher Fe2+
consumption for biomass synthesis due to that a higher metabolic turnover to transport
H+ through the electron transport chain is required to generate a similar amount of ATP.
Other likely affects of chloride addition is up-regulation of efflux pumps to remove the
chloride anion out of the cell.
A further effect of chloride addition was a reduced maintenance coefficient under
chemostat conditions. Reduction of the pH will lower the energy required to pump H+
out of the cell, reducing the maintenance coefficient. Active transport of H+ over
membranes to maintain the pH is considered to be the most important ‘energy spilling’

Page 17 of 40
reaction (van Bodegom, 2007). Consequently, the relation between energy requirements
for growth and for maintenance activities explains the dual effect of chloride on the
specific Fe2+ utilization as visualized by figure 8.
Conclusions
Complete inhibition of Fe2+ oxidation occurred at 12 g L-1 chloride in the batch
biooxidation studies. The chemostat results showed that the obtained data can be fitted
to a previously developed model for Fe2+ oxidation by the L. ferriphilum-dominated
culture (Sundkvist et al., 2008). The model showed that NaCl significantly affected the
kinetic and yield parameters. The model suggests that there was a significant decrease in
the contribution of maintenance activities from 93 % to 23-24 % to the maximum Fe2+
utilization rate with 2-3 g L-1 chloride that was attributed to affects on the PMF and
pH. The model also suggested that the overall specific Fe2+ utilization rate will be
enhanced at higher growth rates, while it was inhibited at lower growth rates by
increasing sodium chloride concentrations as a consequence of the relation between
energy used for growth and maintenance activities (Figure 8). The testwork and
modeling approach can be used as a supplement to other engineering approaches for
future research and development of developing biomining processes for regions lacking
chloride free process water.
Acknowledgements
The authors wish to express their gratitude for financial support from Kempe stiftelsen
Vetenskapsrådet and Boliden Mineral AB. Funding from Carl Bennet AB is gratefully
acknowledged. We are also thankful to Bioclear b.v., Netherlands for carrying out the

Page 18 of 40
Q-PCR analysis within the EU-funded integrated project BioMinE, contract Nº 500329-
1.
References
Alexander B, Leach S, Ingledew WJ. 1987. The relationship between chemiosmotic
parameters and sensitivity to anions and organic acids in the acidophile
Thiobacillus ferrooxidans. J Gen Microbiol 133:1171-1179.
Bastias M, Gentina JC. 2009. Effect of the energy and carbon source limitations and
ferric inhibition on metabolic parameters of Leptospirillum ferrooxidans growing in
chemostat. Adv Mater Res 71-73:267-270.
Becker P, Märkl H. 2000. Modeling of olive oil degradation and oleic acid inhibition
during chemostat and batch cultivation of Bacillus thermoleovorans IHI-91.
Biotechnol Bioeng 70:630-637.
Blight KR, Ralph DE. 2004. Effect of ionic strength on iron oxidation with batch
cultures of chemolithotrophic bacteria. Hydrometallurgy 73:325-334.
Bradford MM. 1976. A rapid and sensitive method for the quantitation of microgram
quantities of protein utilizing the principle of protein-dye binding. Anal Biochem
72:248–254.
Coram NJ, Rawlings DE. 2002. Molecular relationship between two groups of
Leptospirillum and the finding that Leptospirillum ferriphilum sp. nov. dominates
South African commercial bioodxidations tanks which operates at 40 ºC. Appl
Environ Microbiol 68:838-845.

Page 19 of 40
Dempers CJN, Breed AW, Hansford GS. 2003. The kinetics of ferrous-iron oxidation
by Acidithiobacillus ferrooxidans and Leptospirillum ferrooxidans: effect of cell
maintenance. Biochem Eng J 16:337-346.
Deveci H, Jordan MA, Powell N, Alp I. 2008. Effect of salinity and acidity on
biooxidation activity of mesophilic and extremely thermophilic bacteria. Trans
Nonferrous Metal Soc China 18:714-721.
Dew DW, Lawson EN, Broadhurst JL. 1997. The BIOX@ process for biooxidation of
gold bearing concentrates. In: Rawlings DE, editor. Biomining: Theory, Microbes
and Industrial Processes. New York: Springer-Verlag, p 45-80.
Din GA, Suzuki I. 1967. Mechanism of Fe2+-cytochrome c reductase of Ferrobacillus
ferrooxidans. Can J Biochem 45:1547-1556.
Dopson M, Lindstrom EB, Hallberg KB. 2002. ATP generation during reduced
inorganic sulfur compound oxidation by Acidithiobacillus caldus is exclusively due
to electron transport phosphorylation. Extremophiles 6:123-129.
Doran PM.1995. Bioprocess engineering principles. London: Academic Press, Harcourt
Brace & Company, Publishers.
Driessen AJM, Van de Vossenberg JLCM, Konings WN. 1996. Membrane composition
and ion-permeability in extremophiles. FEMS Microbiol Rev 18:139-148.
Eccleston M, Kelly DP. 1978. Oxidation kinetics and chemostat growth kinetics of
Thiobacillus ferrooxidans on tetrathionate and thiosulfate. J Bacteriol 134:718-727.
Ferguson SJ, Ingledew WJ. 2008. Energetic problems faced by micro-organisms
growing or surviving on parsimonious energy sources and at acidic pH: I.

Page 20 of 40
Acidithiobacillus ferrooxidans as a paradigm. Biochim Biophys Acta -
Bioenergetics 1777:1471-1479.
Gahan CS, Sundkvist JE, Sandström Å. 2009. A study on the toxic effects of chloride
on the biooxidation efficiency of pyrite. J Hazard Mater 172:1273-1281.
Gao J, Xie J, Ding J, Kang J, Cheng H, Qiue G. 2006. Extraction and purification of
magnetic nanoparticles from strain of Leptospirillum ferriphilum. Trans Nonferrous
Met Soc China. 16:1417-1420.
Garcia Jr O, da Silva LL. 1991. Differences in growth and iron oxidation among
Thiobacillus ferrooxidans cultures in the presence of some toxic metals. Biotechnol
Lett 13:567-570.
Gutknecht J, Walter A. 1981. Transport of protons and hydrochloric acid through lipid
bilayer membranes. Biochim Biophys Acta 641:183-188.
Harahuc L, Lizama HM, Suzuki I. 2000. Selective inhibition of the oxidation of ferrous
iron or sulfur in Thiobacillus ferrooxidans. Appl Environ Microbiol 66:1031-1037.
Huber H, Stetter KO. 1989. Thiobacillus prosperus sp. nov., represents a new group of
halotolerant metal-mobilizing bacteria isolated from a marine geothermal field.
Arch Microbiol 151:479-485.
Kamimura K, Higashino E, Kanao T, Sugio T. 2005. Effects of inhibitors and NaCl on
the oxidation of reduced inorganic sulfur compounds by a marine acidophilic,
sulfur-oxidizing bacterium, Acidithiobacillus thiooxidans strain SH. Extremophiles
9:45-51.
Kolthoff JM, Sandell B. 1963. Text book of quantitative inorganic chemistry, New
York, NY: Macmillan publishing Co.

Page 21 of 40
Lawson EN, Nicholas CJ, Pellat H. 1995. The toxic effects of chloride ions on
Thiobacillus ferrooxidans. In: Vargas T, Jerez CA, Wiertz, JV, Toledo H, editor.
Biohydrometallurgy Processing, University of Chile.
McLaggan D, Keyhan M, Matin A. 1990. Chloride transport pathways and their
bioenergetic implications in the obligate acidophile Bacillus coagulans. J Bacteriol
172:1485-1490.
Nicolle JLC, Simmons S, Bathe S, Norris PR. 2009. Ferrous iron oxidation and
rusticyanin in halotolerant, acidophilic 'Thiobacillus prosperus'. Microbiology
155:1302-1309.
Norris PR. 2007. Acidophile diversity in mineral sulfide oxidation, In: Rawlings DE,
Johnson DB, editor. Biomining. New York: Springer-Verlag. p 199-216.
Ojumu TV, Hansford GS, Peterson J. 2009. The kinetics of ferrous iron oxidation by
Leptospirillum ferriphilum in continuous culture: the effect of temperature.
Biochem Eng J 46:161-168.
Ojumu TV, Petersen J. 2009. Kinetics of microbial ferrous-iron oxidation by
Leptospirillum ferriphilum: effect of ferric iron on biomass growth. Adv Mater Res
71-73:259-262.
Ojumu TV, Peterson J, Hansford GS. 2008. The effect of dissolved cations on microbial
ferrous-iron oxidation by Leptospirillum ferriphilum in continuous culture.
Hydrometallurgy 94:69-76.
Penev K, Karamanev D. 2009. Kinectics of ferrous iron oxidation by Leptospirillum
ferriphilum at moderate to high total iron concentrations. Adv Mater Res 71-
73:255-258.

Page 22 of 40
Pirt SJ. 1975. Principles of microbe and cell cultivation. Oxford: Blackwell Scientific
Publications.
Rawlings DE, Tributsch H, Hansford GS. 1999. Reasons why ‘Leptospirillum’-like
species rather than Thiobacillus ferrooxidans are the dominant iron-oxidizing
bacteria in many commercial processes for the biooxidation of pyrite and related
ores. Microbiology 145:5-13.
Rawlings DE. 2007. Relevance of cell physiology and genetic adaptability of biomining
microorganisms to Industrial processes. In: Rawlings DE, Johnson DB, editor.
Biomining. New York: Springer-Verlag. p 177-198.
Sand W, Florian B, Noël N. 2009. Mechanisms of bioleaching and the visualization of
these by combined AFM & EFM. Adv Mater Res 71-73:311-317.
Shiers DW, Blight KR, Ralph DE. 2005. Sodium sulphate and sodium chloride effects
on batch culture of iron oxidising bacteria. Hydrometallurgy 80:75–82.
Silverman MP, Lundgren DG. 1959. Studies on the chemoautotrophic iron bacterium
Ferrobacillus ferrooxidans I. An improved medium and a harvesting procedure for
securing high cell yields. J Bacteriol 77:642–647.
Simmons S, Norris P. 2002. Acidophiles of saline water at thermal vents of Vulcano,
Italy. Extremophiles 6:201-207.
Slonczewski JL, Fujisawa M, Dopson M, Krulwich TA. 2009. Cytoplasmic pH
measurement and homeostasis in bacteria and archaea. Adv Microb Physiol 55:1-
79.
Page 23 of 40
Sundkvist JE, Gahan CS, Sandström Å. 2008. Modeling of ferrous iron oxidation by
Leptospirillum ferrooxidans-dominated chemostat culture. Biotechnol Bioeng
99:378-389.
Suzuki I, Lee D, Mackay B, Harahuc L, Oh JK. 1999. Effect of various ions, pH, and
osmotic pressure on oxidation of elemental sulfur by Thiobacillus thiooxidans.
Appl Environ Microbiol 65:5163-5168.
Svirko L, Bashtan-Kandybovich I, Karamanev D. 2009. Experimental study of ferrous
iron biooxidation by Leptospirillum ferriphilum in different biofilm reactors. Adv
Mater Res 71-73:263-266.
Toyoshima Y, Thompson TE. 1975. Chloride flux in the bilayer membranes: chloride
permeability in aqueous dispersions of single walled, bilayer vesicles. Biochemistry
14:1518-1524.
Tuovinen OH, Niemelä SI, Gyllenberg HG. 1971. Tolerance of Thiobacillus
ferrooxidans to some metals. Anton van Leeuwen 37:489-496.
van Bodegom P. 2007. Microbial maintenance: A critical review on its quantification.
Microb Ecol 53:513-523.
Wang M, Zhang Y, Deng T, Wang K. 2004. Kinetic modeling for the bacterial leaching
of chalcopyrite catalyzed by silver ions. Miner Eng 17:943-947.
Welham NJ, Malatt KA, Vukcevic S. 2000. The effect of solution speciation on iron–
sulphur–arsenic–chloride systems at 298 K. Hydrometallurgy 57:209–223.
Weston T, Perkins J, Ritchie I, Marais H. 1994. Concentrate biooxidation in a
hypersaline environment for Knowna Belle. Proceedings of Int. Conference and

Page 24 of 40
Workshop Applications of Biotechnology to the Minerals Industry, ‘Biomine’94,
Perth W.A.: Australian Mineral Foundation, p 9.1-9.18.

Page 25 of 40
Table I. Symbols and nomenclature.
Symbol Definition Units D Dilution rate h-1 F Flow rate L h-1
sK Substrate constant g Fe2+ L-1
sm Maintenance coefficient mg Fe2+(mg protein)-1 h-1 specific growth rate h-1
max Maximum specific growth rate h-1
obs Observed specific growth rate h-1
sP Reactor ferric productivity g Fe2+ h-1 L-1
xP Reactor biomass productivity mg protein h-1 L-1
2Feq Specific ferrous utilization rate g Fe2+(mg protein)-1 h-1 S Fe2+ concentration in the reactor and discharge g Fe2+ L-1
0S Fe2+ concentration in the feed g Fe2+ L-1 V Reactor volume L X Cell concentration in the reactor and discharge mg protein L-1
obsY Observed biomass yield mg protein (g Fe2+)-1
trueY True biomass yield for growth mg protein (g Fe2+)-1

Page 26 of 40
Table II. Steady state conditions for each replicate with 9 g Fe2+ L-1 supplemented with
0, 2, and 3 g L-1 chloride.
Chloride conc. (g L-1)
Dilution rate (h-1)
Residual conc. (mg Fe2+ L-1)
Temp (ºC)
pH
Biomass (mg protein L-1)
Redox (mV)
Dissolved O2 (mg O2 L-1)
0.098 65 36.3 1.54 6.55 603 5.6 0.081 10 36.6 1.54 5.40 632 5.5 0 0.070 4 36.0 1.52 4.81 644 5.7 0.072 77 36.2 1.52 4.20 585 5.8 0.062 42 36.2 1.53 4.01 601 5.6 2 0.051 23 36.0 1.54 3.78 618 5.8 0.062 99 36.2 1.52 2.67 579 5.4 0.050 35 36.2 1.54 2.38 602 5.4 3 0.039 20 36.0 1.53 2.32 617 5.3

Page 27 of 40
Table III. Calculated Monod constants.
0 g Cl- L-1 2 g Cl- L-1 3 g Cl- L-1 μmax (h-1)
Ks (g Fe2+ L-1)
Fit (R2)
μmax (h-1)
Ks (g Fe2+ L-1)
Fit (R2)
μmax (h-1)
Ks (g Fe2+ L-1)
Fit (R2)
0.10 0.002 0.99 0.09 0.017 0.99 0.07 0.016 0.99

Page 28 of 40
Table IV. Biomass yields obtained with varying chloride concentrations and dilution
rates.
Chloride conc. (g L-1)
D (h-1)
Yobs (mg protein.(g Fe2+) -1)
0.098 0.73 0.081 0.60 0 0.070 0.54 0.072 0.47 0.062 0.45 2 0.051 0.42 0.062 0.30 0.050 0.27 3 0.039 0.26

Page 29 of 40
Table V. Calculated Pirt-constants.
Chloride conc. (g L-1)
ms (mg Fe2+(mg protein)-1 h-1)
Ytrue (mg protein (g Fe2+)-1)
Fit (R2)
0 0.13 10.8 0.99 2 0.04 0.66 0.99 3 0.05 0.39 0.85

Page 30 of 40
Figure legends
Figure 1. Redox potential versus time at different chloride concentrations.
Figure 2. Plot for the Pirt equation (Equation 2).
Figure 3. Dilution rate versus residual Fe2+ concentration (Equation 3).
Figure 4. Biomass concentration versus dilution rate (Equation 4).
Figure 5. Reactor biomass productivity versus dilution rate (Equation 5).
Figure 6. Reactor Fe3+ productivity versus dilution rate (Equation 6).
Figure 7. Biomass yield from Fe2+ oxidation versus dilution rate (Equations 3 and 7).
Figure 8. Specific Fe2+ utilization rate versus dilution rate (Equation 8).
Figure 9. Specific Fe2+ utilization rate versus log [Fe3+/Fe2+] (Equations 8 and 9).
Figure 10. Simulated Fe2+ oxidation capacity profile with 0 g and 3 g L-1 chloride at
maximum growth rate and 1 mg initial protein concentration.

Page 31 of 40
400
440
480
520
560
600
640
680
720
760
0 25 50 75 100 125 150 175 200 225 250 275 300 325 350
Time, hours
Red
ox p
oten
tial,
mV
0 [g L-1] Cl 3 [g L-1] Cl 5 [g L-1] Cl 7 [g L-1] Cl 9 [g L-1] Cl 10 [g L-1] Cl 11 [g L-1] Cl 12 [g L-1] Cl 13 [g L-1] Cl
Figure 1. Redox potential versus time at different chloride concentrations.

Page 32 of 40
0,0
0,5
1,0
1,5
2,0
2,5
3,0
3,5
4,0
4,5
0,0 2,5 5,0 7,5 10,0 12,5 15,0 17,5 20,0 22,5 25,0 27,5
1/D, h
1/Yo
bser
ved ,
[ g F
e2+ox
idis
ed (m
g pr
otei
n) -1]
Experimental: 0 [g L-1]
Experimental: 2 [g L-1]
Experimental: 3 [g L-1]
Best fit: 0 [g L-1]
Best fit: 2 [g L-1]
Best fit: 3 [g L-1]
Figure 2. Plot for the Pirt equation (Equation 2).

Page 33 of 40
0,00
0,02
0,04
0,06
0,08
0,10
0,12
0,00 0,03 0,06 0,09 0,12 0,15 0,18 0,21
Residual ferrous concentration, g (L)-1
Dilu
tion
rate
, h-1
Model: 0 [g L-1]Model: 2 [g L-1]Model: 3 [g L-1]Experimental: 0 [g L-1]
Experimental: 2 [g L-1]Experimental: 3 [g L-1]
Figure 3. Dilution rate versus residual Fe2+ concentration (Equation 3).

Page 34 of 40
0,0
1,0
2,0
3,0
4,0
5,0
6,0
7,0
0,00 0,01 0,02 0,03 0,04 0,05 0,06 0,07 0,08 0,09 0,10 0,11
Dilution rate, h-1
Bio
mas
s, m
g pr
otei
n (L
)-1
Model: 0 [g L-1]Model: 2 [g L-1]Model: 3 [g L-1]Experimental: 0 [g L-1]Experimental: 2 [g L-1]Experimental: 3 [g L-1]
Figure 4. Biomass concentration versus dilution rate (Equation 4).

Page 35 of 40
0,0
0,1
0,2
0,3
0,4
0,5
0,6
0,7
0,00 0,01 0,02 0,03 0,04 0,05 0,06 0,07 0,08 0,09 0,10 0,11
Dilution rate, h-1
Prod
uctiv
ity, m
g pr
otei
n (L
h)-
Model: 0 [g L-1]
Model: 2 [g L-1]
Model: 3 [g L-1]
Experimental: 0 [g L-1]
Experimental: 2 [g L-1]
Experimental: 3 [g L-1]
Figure 5. Reactor biomass productivity versus dilution rate (Equation 5).

Page 36 of 40
0
100
200
300
400
500
600
700
800
900
1000
0,00 0,01 0,02 0,03 0,04 0,05 0,06 0,07 0,08 0,09 0,10 0,11
Dilution rate, h-1
Prod
uctiv
ity, m
g Fe3+
(L h
)-1
Model: 0 [g L-1]
Model: 2 [g L-1]
Model: 3 [g L-1]
Experimental: 0 [g L-1]
Experimental: 2 [g L-1]
Experimental: 3 [g L-1]
Figure 6. Reactor Fe3+ productivity versus dilution rate (Equation 6).

Page 37 of 40
0,0
0,1
0,2
0,3
0,4
0,5
0,6
0,7
0,8
0,00 0,01 0,02 0,03 0,04 0,05 0,06 0,07 0,08 0,09 0,10 0,11
Dilution rate, h-1
Yie
ld, m
g pr
otei
n (g
Fe2+
)-1Model: 0 [g L-1]
Model: 2 [g L-1]
Model: 3 [g L-1]
Experimental: 0 [g L-1]
Experimental: 2 [g L-1]
Experimental: 3 [g L-1]
Figure 7. Biomass yield from Fe2+ oxidation versus dilution rate (Equations 3 and 7).

Page 38 of 40
0
25
50
75
100
125
150
175
200
225
250
0,00 0,01 0,02 0,03 0,04 0,05 0,06 0,07 0,08 0,09 0,10 0,11
Dilution rate, h-1
Spec
ific
ferr
ous o
xida
tion
rate
mg
Fe2+
(mg
prot
ein
h)-1
Model: 0 [g L-1]
Model: 2 [g L-1]
Model: 3 [g L-1]
Experimental: 0 [g L-1]
Experimental: 2 [g L-1]
Experimental: 3 [g L-1]
Figure 8. Specific Fe2+ utilization rate versus dilution rate (Equation 8).

Page 39 of 40
0
25
50
75
100
125
150
175
200
225
250
-2 -1 0 1 2 3 4 5 6 7 8
log[Fe3+/Fe2+]
Spec
ific
ferr
ous o
xida
tion
rate
mg
Fe2+
(mg
prot
ein
h)-1
Model: 0 [g L-1]
Model: 2 [g L-1]
Model: 3 [g L-1]
Experimental: 0 [g L-1]
Experimental: 2 [g L-1]
Experimental: 3 [g L-1]
Figure 9. Specific Fe2+ utilization rate versus log [Fe3+/Fe2+] (Equations 8 and 9).

Page 40 of 40
0
50
100
150
200
250
300
0 5 10 15 20 25 30 35 40
Time, h
mg
Fe2+
h-1
0 [g L-1]
3 [g L-1]
Expon. ( 0 [g L-1])
Expon. (3 [g L-1])
Figure 10. Simulated Fe2+ oxidation capacity profile with 0 g and 3 g L-1 chloride at
maximum growth rate and 1 mg initial protein concentration.