

Luis Moneda, Data Scientist at Nubank Qualifiers + Final Phase
30
Qualifiers + Final Phase Luis Moneda, Data Scientist at Nubank
Transcript of Luis Moneda, Data Scientist at Nubank Qualifiers + Final Phase

Qualifiers + Final PhaseLuis Moneda, Data Scientist at Nubank

Overview● Data Science Game 2017● Team● Qualifiers & Finals
○ The challenge○ Data○ Our strategy○ What we could have done better?○ Other teams approach (14th and 2nd)○ Take away

Data Science Game● Annual student competition since
2014;● Teams composed of 4 students
from the same university (Phd, master or undergraduate);
● 2 phases;● Hosted in Kaggle;● Organized by students from France;● Data from french companies;

Team● Name: Team Maia!● University: USP São Paulo● Members:
○ Luis Moneda○ Pedro Cicolin○ Arthur Lacerda○ Wanderson Ferreira○ Paulo Castro
● Qualifiers: 27th from 210● Finals: 12th from 21
Sponsors:

The challenge● Deezer play registers data:
○ Information about user, song, service and a target “is_listened”;
● Goal: Predict the probability of listening a song suggested by the “flow” service;
● Metric: AUC;● The submission set consist of one register per unique user in the data, their
last flow play;● We need to learn how to relate user historical data and his probability of
listening a certain song in the flow in the future;

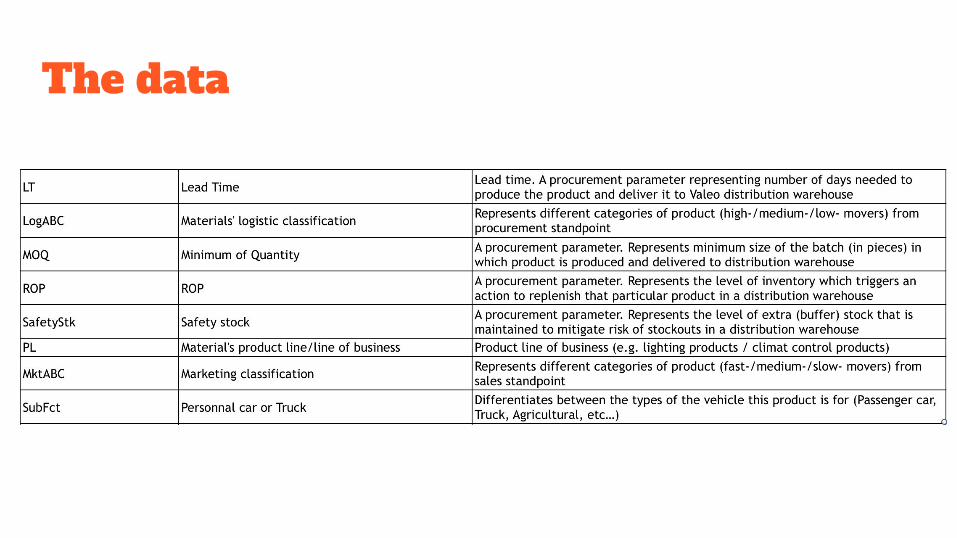
Data● media_id - identifiant of the song
listened by the user● album_id - identifiant of the album of
the song● Genre_id - identifiant of the song genre● context_type - playlist, album…
○ release_date - release date YYYYMMDD
○ ts_listen - timestamp of the listening in UNIX time
○ platform_name - type of os○ artist_id - identifiant of the
artist of the song

Data II● media_duration - duration of the song● user_gender - gender of the user● user_id - anonymized id of the user● platform_family - type of device● user_age - age of the user
● artist_id - identifiant of the artist of the song
● is_listened - 1 if the track was listened, 0 otherwise
● listen_type - if the songs was listened in a flow or not

Data III● Further Media Info:
○ {"media_id":213952, "sng_title":"Maria Cristina","alb_title":"El Son de Cuba","art_name":"Septeto Nacional De Ignacio Pineiro"} {"media_id":223014,"sng_title":"Love stealer","alb_title":"Sounds from the fourth world","art_name":"Calvin Russell"}
● API Information (Album, Artist and Song):○ Artist_albums: num of released
albums○ Artist_fans: num of fans in deezer○ Artist_radio: if it has a radio in
deezer○ Bpm: song bpm○ Song_rank: song ranking

Overall Strategy● Create as many features as possible;● Validate using the last flow execution for each user (closer to the submission
set than random sampling);● Use simpler models to users with few registers;● Blend different models results (different sets of features)● Approaches:
○ (Benchmark): mean target for flow mode;○ Random Forest;○ XGBoost with all features;○ XGBoost with basic features;○ Blend the predictions;
User distribution x number of registers

Feature Engineering I● Transform the original features using:
○ Difference between release date and listening date (in days, months and years);○ Expansion on release date: day (hehe), month and year;○ Day of week (mon, tue, wed..) and period of day (morning, afternoon) the user is
listening;○ Binning for release date (song from 70s, 80s..) and user age○ Difference between song and user age;

Feature Engineering II● User-specific features:
○ Successful reproduction in flow and non-flow mode;○ Proportion between normal and flow registers;○ How many std above the mean for flow registers;○ How many platform_family and platform_name the user uses;○ Maximum number of executions of the same song;○ How many different songs he has listened during training time (flow and non-flow);○ How many different artists, genres, difference decades;○ Mean / std of age, duration, bpm and rank from listened and not listened songs;○ Proportion of playlist execution;○ Do all the above for flow and non-flow;

ModelingTwo kinds of model
● Performance (random sample):○ 0.861694 (w/ user-specific features)○ 0.8262 (general features)
● Score:○ Public: 0.6423○ Private: 0.6393
After blending predictions scores:
● Public: 0.6647
● Private: 0.6718
Feature Importance in XGBoost Model

What we could have done better?● Explore the time series nature in everything we have done:
○ Features in time (all the user specific for the last month, day, "listening chunk"...)○ Create a more robust out-of-time validation schema;

14th place solutionSource: Team E3 Analytics - Peru
● Likelihood Features strong dependent on the time the song was listened;● Users with less than 20 registers have their likelihood features set to NaN;● Train only with registers in the flow mode;● Use non-flow data to build non-flow behavior features for the users;● Score
○ Public: 0.68036 (5th)○ Private: 0.67310 (14th)

14th place solution● Different features engineered:
○ Last_is_listened ○ Song / Album name features:
■ "Remastered" ,"Tribute to", "Version", "Edition", "Deluxe", "Special", "Remix", "Live";
○ Listening daytime;○ Song duration comparison with the last one;
They use 100+ features;
Single model performance in local validation: 0.7275

The challenge● Demand for Valeo products:
○ Information about past demand, product, price, competidor and so on;
● Goal: Predict the demand for a certain Material from a certain Organization● Metric: MAE (Mean Absolute Error);● The submission set consist of 38676 Material-Organization series for 3
periods: 2017-04, 2017-05 and 2017-06

The data
The data

The data

The data
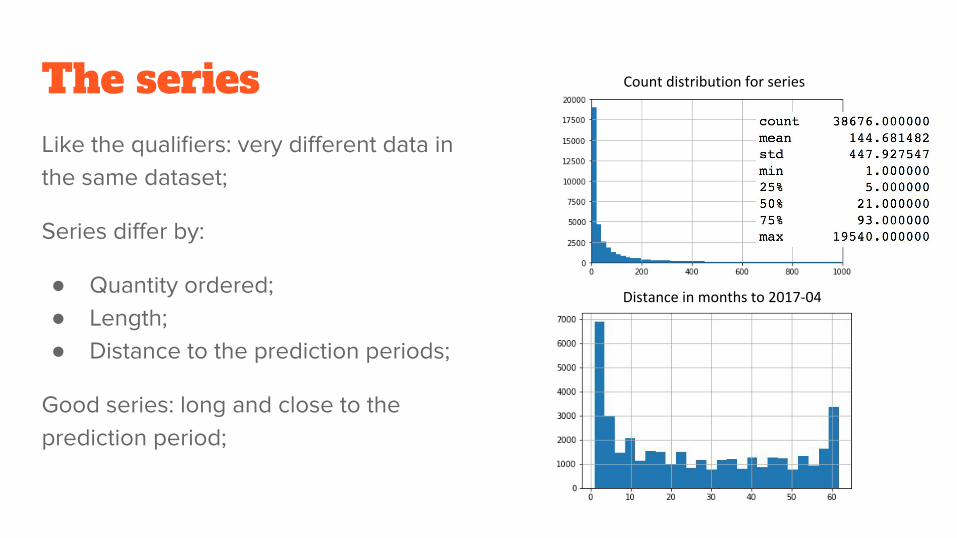
The series Like the qualifiers: very different data in the same dataset;
Series differ by:
● Quantity ordered;● Length;● Distance to the prediction periods;
Good series: long and close to the prediction period;
Distance in months to 2017-04
Count distribution for series

Overall Strategy● Use different models to the good and bad series;● Use a simple model to bad / corner cases;● Validate out-of-time: 2017-01, 2017-02 and 2017-03;● Create as many features as possible (lags and its statistics, max, min..)● Try to use different models to get uncorrelated predictors;● Blend different models results;● Approaches:
○ (Benchmark): Last 3 months averaged;○ Lasso for good series;○ XGBoost them all!○ Entity Embedding;○ Not included in final submission: Prophet and LSTM;
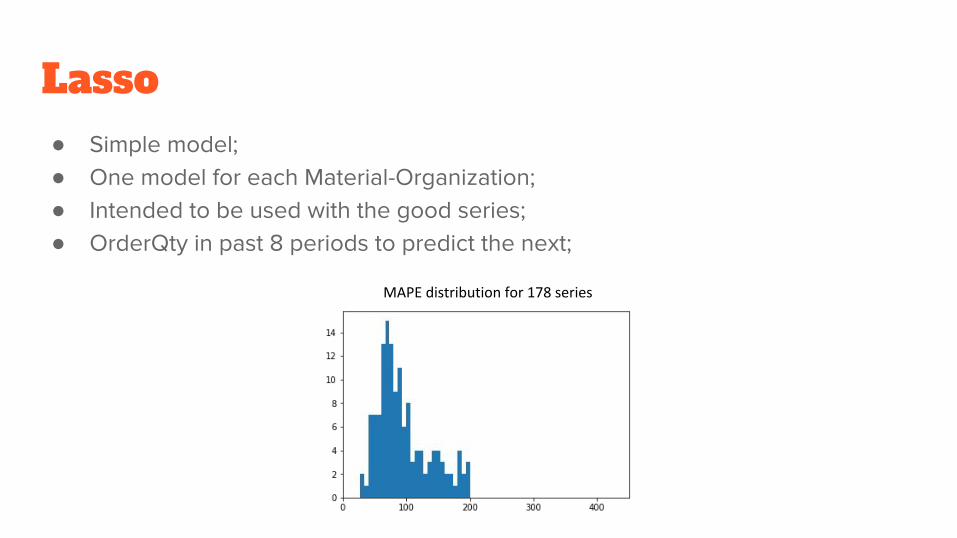
Lasso ● Simple model;● One model for each Material-Organization;● Intended to be used with the good series;● OrderQty in past 8 periods to predict the next;
MAPE distribution for 178 series
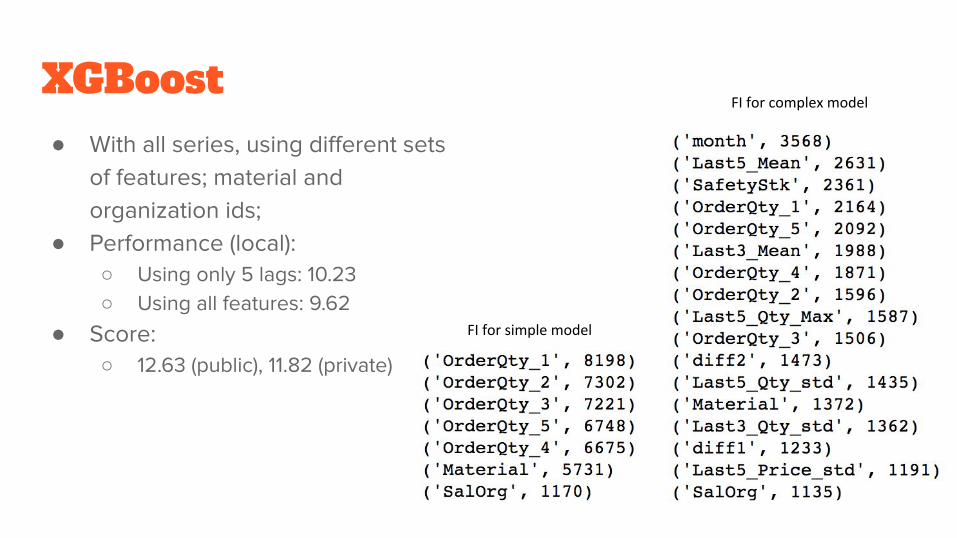
XGBoost● With all series, using different sets
of features; material and organization ids;
● Performance (local): ○ Using only 5 lags: 10.23 ○ Using all features: 9.62
● Score:○ 12.63 (public), 11.82 (private)
FI for simple model
FI for complex model

Entity Embedding● We know the code snippet is
small, check it online later;● From Rossmann Sales
Prediction Kaggle Competition;● Sources: Repository and Paper;● Another way to use all the data
in a single model;● Performance
○ Local 9.34○ Public: 11.68○ Private: 10.96
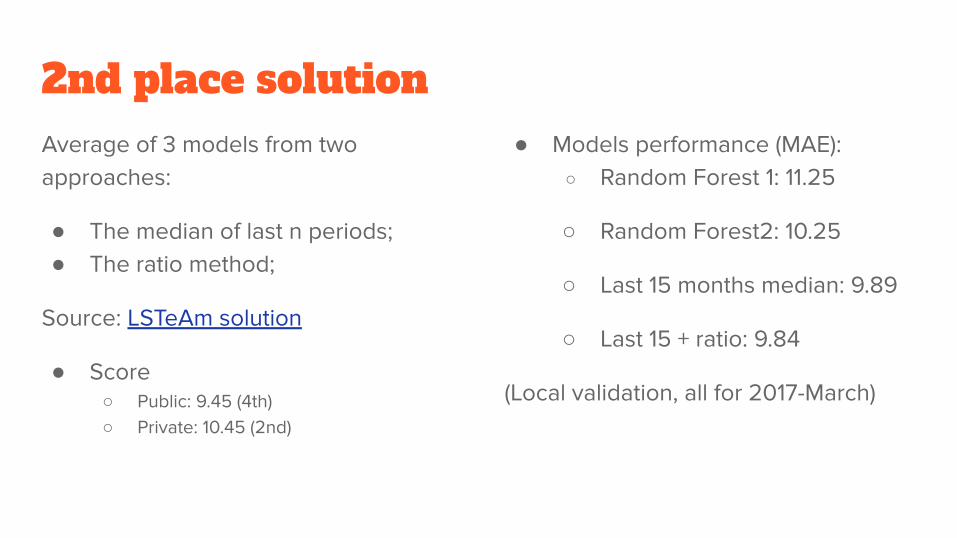
2nd place solutionAverage of 3 models from two approaches:
● The median of last n periods;● The ratio method;
Source: LSTeAm solution
● Score○ Public: 9.45 (4th)○ Private: 10.45 (2nd)
● Models performance (MAE):○ Random Forest 1: 11.25
○ Random Forest2: 10.25
○ Last 15 months median: 9.89
○ Last 15 + ratio: 9.84
(Local validation, all for 2017-March)

2nd place solution● Median:
"If a couple SalOrg - Material has less than i months of history (we consider that the history of a couple SalOrg-Meterial begins when the demand takes a non zero value for the first time), we take the median over the available history."

2nd place solution● Ratio I (not for Material-Org, but by Product Line)
● Ratio II: "computed based on PL + [low, mid, high] where low/mid/high indicates the order of magnitude of the median : low [0;1[, mid [1,10[, and high [10+]"
Basically, see the past errors of using median / mean as a prediction and apply a factor to the next prediction;

Take aways● After hitting a performance plateau the iteration must include the Exploratory
Data Analysis;● Time always plays a role in the data, check if the dataset makes it possible to
use it;● It worths to have someone only engineering new features (and checking if
they make sense);● Try to segment the data and find corner cases, use a different strategy to
them, measure how good each approach is in every segment you have identified;
● Be russian;


![Welcome [mygga.genomatix.de]mygga.genomatix.de/manuals/BioinformaticsWorkbench.pdf · welcome to contact us ... the parameter qualifiers are required, lowercase letters are optional.](https://static.fdocuments.net/doc/165x107/5ab9873d7f8b9aa6018e00b3/welcome-mygga-mygga-to-contact-us-the-parameter-qualiers-are-required.jpg)