Lubricant Deterioration in Service - InfoHouseinfohouse.p2ric.org/ref/28/27124.pdf · Volume I 517...
17
Volume I 517 LUBRICANT DETERIORATION IN SERVICE 2712 Y Elisha Abner, Jr. INTRODUCTION Under certain conditions of field severity and make-up rate, lubricants can indeed “wear out”, at least to the extent that they can become unsuitable for their intended purpose. Degradation can be the result of both physical and chemical actions, inter- nally generated or from extraneous contamination. It should be remembered that lu- bricants are usually complex blends of chemical additives in a variety of base oils. Since these finished lubricants are often specifically designed for particular applica- tions, exposure of lubricants to conditions and component materials for which they are not intended may accelerate lubricant deterioration and result in equipment dam- age. Lubricant deterioration is the loss of ability of a lubricant to effectively perform its intended function. A used oil may become too dirty or viscous for further use. It may become corrosive to system components or form harmful sludges and deposits. Nec- essary additives compounded into the lubricant may become depleted. Contamination by abrasive or corrosive materials can cause severe damage to equipment. Contami- nants sometime act as catalytic agents and accelerate chemical breakdown of the lubri- cant. Lubricant deterioration is usually a function of time in service, system tempera- tures, make-up rate, and environmental conditions. Physical deterioration - a lubricant can become unsuitable for further service by direct action of foreign materials. Particulate matter such as core sand, weld spatter, lint, metal chips, and abrasive dust can be left in a lubricating system during manufac- ture and assembly. Outside contaminants can enter through ineffective seals, dirty oil filler pipes, or make-up with an incorrect lubricant. Internally generated contamina- tion includes wear debris, rust, and sealing materials. Chemical deterioration - lubricant oxidation is the most important and most com- mon type of deterioration. When an oil oxidizes, its most unstable constituents com- bine with oxygen to form acids, resins, varnishes, sludges, and carbonaceous deposits. In addition to increasing the lubricant’s viscosity, which in itself might result in a performance problem, oxidation products can plug small orifices and filters, restrict flow, or cause critical components to stick. Oxidation products mainly fall into two classes: soluble organic acid compounds and oil insoluble solids, such as gums, resins, varnishes, and asphaltenes. The oxidation rate of a fully inhibited mineral oil is quite low at temperatures less than 60°C. Oxidation life becomes shorter and shorter as temperatures rise above this level; a rough approximation is that the oxidation rate will double for every 10°C rise in temperature. In addition, certain contaminants such as water and metals can act as catalysts and accelerate the oxidation rate. These effects are shown in Figure 1.’ Air entrapped within the fluid coupled with agitation of the lubricant can also increase the rate of oxidation.2 Oil also typically contains 10% by volume of dissolved air. Water, in addition to affecting the viscosity and oxidation rate of a lubricant, may also cause corrosion problems. Other types of internal chemical breakdown can result from excessive temperatures. mal degradation of an oil may cause it to crack or polymerize. In some cases, additives may become unstable and breakdown into insoluble materials. Contamina- tion with chemically active materials such as sulfur and chlorine compounds in chemi- cal Plants can result in formation of sludges and system deposits. Such active materials
Transcript of Lubricant Deterioration in Service - InfoHouseinfohouse.p2ric.org/ref/28/27124.pdf · Volume I 517...

Volume I 517
LUBRICANT DETERIORATION IN SERVICE
2712 Y Elisha Abner, Jr.
INTRODUCTION
Under certain conditions of field severity and make-up rate, lubricants can indeed “wear out”, a t least to the extent that they can become unsuitable for their intended purpose. Degradation can be the result of both physical and chemical actions, inter- nally generated or from extraneous contamination. It should be remembered that lu- bricants are usually complex blends of chemical additives in a variety of base oils. Since these finished lubricants are often specifically designed for particular applica- tions, exposure of lubricants to conditions and component materials for which they are not intended may accelerate lubricant deterioration and result in equipment dam- age.
Lubricant deterioration is the loss of ability of a lubricant to effectively perform its intended function. A used oil may become too dirty or viscous for further use. It may become corrosive to system components or form harmful sludges and deposits. Nec- essary additives compounded into the lubricant may become depleted. Contamination by abrasive or corrosive materials can cause severe damage to equipment. Contami- nants sometime act as catalytic agents and accelerate chemical breakdown of the lubri- cant. Lubricant deterioration is usually a function of time in service, system tempera- tures, make-up rate, and environmental conditions.
Physical deterioration - a lubricant can become unsuitable for further service by direct action of foreign materials. Particulate matter such as core sand, weld spatter, lint, metal chips, and abrasive dust can be left in a lubricating system during manufac- ture and assembly. Outside contaminants can enter through ineffective seals, dirty oil filler pipes, o r make-up with an incorrect lubricant. Internally generated contamina- tion includes wear debris, rust, and sealing materials.
Chemical deterioration - lubricant oxidation is the most important and most com- mon type of deterioration. When an oil oxidizes, its most unstable constituents com- bine with oxygen to form acids, resins, varnishes, sludges, and carbonaceous deposits. In addition to increasing the lubricant’s viscosity, which in itself might result in a performance problem, oxidation products can plug small orifices and filters, restrict flow, or cause critical components to stick. Oxidation products mainly fall into two classes: soluble organic acid compounds and oil insoluble solids, such as gums, resins, varnishes, and asphaltenes. The oxidation rate of a fully inhibited mineral oil is quite low at temperatures less than 60°C. Oxidation life becomes shorter and shorter as temperatures rise above this level; a rough approximation is that the oxidation rate will double for every 10°C rise in temperature. In addition, certain contaminants such as water and metals can act as catalysts and accelerate the oxidation rate. These effects are shown in Figure 1.’ Air entrapped within the fluid coupled with agitation of the lubricant can also increase the rate of oxidation.2 Oil also typically contains 10% by volume of dissolved air. Water, in addition to affecting the viscosity and oxidation rate of a lubricant, may also cause corrosion problems.
Other types of internal chemical breakdown can result from excessive temperatures. mal degradation of an oil may cause it to crack or polymerize. In some cases,
additives may become unstable and breakdown into insoluble materials. Contamina- tion with chemically active materials such as sulfur and chlorine compounds in chemi- cal Plants can result in formation of sludges and system deposits. Such active materials

7
518 CRC Handbook of Lubrication
11.2, COPPER + WATER
8.0 8.1, IRON + WATER I

Volume I 5 19
fied simply by stirring a beaker of used oil with the magnet anc examining the particles picked up. Another test which helps sort out causes of contamination involves diluting the sample with lighter fluid, filtering it through filter paper, placing the residue on a piece of glass, and then running a knife blade across it. If sand or grit is in the residue, the message comes across loud and clear.
Numerous field test kits are also available for measuring signs of lubricant deterio- ration, such as viscosity, water content, particulate matter, and degree of oxidation. Kits are also available for measuring dispersancy, and for detecting diesel fuel dilution and strong acids in engine crankcase oils.
LABORATORY ANALYSIS
Turbine oils, circulating oils, gear lubricants, hydraulic fluids, etc. are commonly exposed in varying degrees to the same kinds of deterioration. Thus, similar testing procedures can be used for all of them. The criteria used to judge their suitability for further service, however, must still be based on each particular application.
It is very helpful and sometimes mandatory that the original lubricant properties be known if test results on the used lubricant are to be meaningful. Many of these data are available from the lubricant supplier and the remainder can be developed by appro- priate testing. Some of the routine data used for comparing new and used products include: gravity, viscosity, Viscosity index (VI), flash point, insolubles, color, water content, neutralization number, trace metals, particulate matter, foaming, demulsibil- ity, and rust protection. More complex procedures can be used for determining the level of oxidation and other kinds of chemical and physical breakdown that have taken place.
Important reasons for analyzing lubricant samples include: problem solving, setting proper drain intervals, preventive maintenance, and lubricant conservation. While these benefits can be obtained by a good analysis program, the primary purpose of lubricant analysis is to determine the product’s stability for further service. Appropri- ate actions can then be recommended based on the test results.
The following tests are those primarily used in appropriate combinations to deter- mine the condition of lubricating oils.
Viscosity - this is usually the most important single property of an oil. Change in viscosity is very useful for following the performance of a lubricant in service. A re- duction usually indicates that a lower viscosity product has been added as make-up or that the system has been contaminated with a solvent. A loss of viscosity may also result if the oil becomes contaminated with refrigerant fluid of the halogenated type. Products using high molecular weight polymers as thickening agents and viscosity in- dex improvers may lose viscosity when used in applications where there are high me- chanical shear rate^.^ Fuel dilution is usually the cause of viscosity reduction in used engine oils. Significant viscosity increases normally are traced to admixture with a higher viscosity product, contamination, or to oil oxidation.. Oxidation is particularly indicated when there is a simultaneous increase in neutralization number and darken- ing color. A resulting viscosity increase of 10 to 20% is considered severe for most applications.
Viscosity index - an increase or decrease of VI usually indicates contamination with another product. A reduction in VI can also occur as a result of shear forces rupturing the molecular structure of polymeric additives used in some products. In a few in- stances, oxidation causes an increase of VI in used oil. Even though the viscosity in- crease at the higher reference temperature (lOO°C) may be less than that at the lower temperature (4OOC) an ASTM viscosity-temperature curve (ASTM D341) with a re- duced slope (higher VI) can still occur.
,
I

520 CRC Handbook of Lubrication
Gravity - the specific (or “API) gravity of a lubricant is of little significance as a measure of quality or usefulness. Gravity of used oil should be very close to that of new oil. Abnormal values may indicate contamination by a different product, a sol- vent, o r by a gas. For example, a change in gravity of an engine oil could be an indi- cation of fuel dilution. At one time, gravity was used as a guide to help identify the source of crude from which a product was manufactured, but it has lost most of this significance since the advent of new refining processes.
Flash point - the flash point (ASTM D92) of an oil is sometimes used for identifi- cation of a product. A flash point significantly lower than that of the typical value for new oil would indicate the presence of a lower viscosity oil, a light distillate, a volatile solvent, or cracking of the oil due to excessively high temperatures. Higher than normal flash points indicate admixture with a higher viscosity oil. In general, flash points will be quite close to new oil values unless admixture or cracking have occurred. In the case of diesel engine oils, a significant drop in flash point, using the Pensky-Martens (ASTM D93) method, can be qualitative confirmation that fuel dilu- tion is responsible for any noted reduction in crankcase oil visco~i ty .~ To determine fuel dilution in gasoline engines, ASTM D322 method can be used.
Insolubles - filtration following dilution with pentane and toluene (ASTM D893) is used to determine insolubles in a used oil. The n-pentane insolubles represent dirt, grit, wear metals, fuel soot, and oxidized products of fuels and lubricants. Toluene dissolves oxidation products so that insolubles include only dirt, grit, wear metals, and fuel soot. (Normally toluene insolubles are not reported unless the *pentane insolubles exceed 0.1 wt 070). The difference between the two is the presence of resins or oxidized materials.
Color - the primary significance of color (ASTM 01500) is the degree of change from previous time period samples collected from the same system. Noticeable dark- ening in short periods of time indicates either contamination or the beginning of oil oxidation. A darkening color with no significant change in neutralization number or viscosity usually indicates contamination with foreign materials. While color is usually the first visual change to take place in an oil during service, care should be taken not to put too much emphasis on it without considering viscosity and neutralization nu ber changes, etc. Color bodies can impart a significant color change to an oil witho necessarily affecting other properties. Color, as such, has little significance in the formance of crankcase oils. Many new oils use additives that are dark in color, engine oils normally darken in service very rapidly.
Water - in a lubricant not only promotes corrosion and oxidation, but form a n emulsion having the appearance of a soft sludge. If more than a trac of water (over 0.1%) is present in industrial circulating oils, it should be rem centrifuging, filtration, or vacuum treating. Generally, a simple hot plate “c test” can detect water in an oil down to 0.1070. This test involves letting a drop fall onto a hot plate set at a temperature high enough to boil off any water The degree of activity noted in and around the oil droplet indicates the water ASTM D95 or D1744 can be used if a more precise value is needed. Light col will often start to show a haze at room temperature when water exceeds its SO
limit of 75 to 100 ppm.6 Acidity - neutralization number, often reported as Total Acid Number (T
the most common measure of lubricant acidity. There are two ASTM procedures for a TAN determination: D974 (Neutralization Number by Color-Indicator Titr and D664 (Neutralization Number by Potentiometric Titration). The D974 is suitable for light colored oils where color indicator changes can be ob D664 should be used where oil samples are dark in color. Both procedu

Volume I 521
suitable for Total Base’Number (TBN) and Strong Acid Number (SAN) determina- tions.
The TAN of a used lubricant is one measure of its degree of degradation by oxida- tion. Interpretation of this test requires a knowledge of the lubricant characteristics since “unusually” high values may occur in some cases. For most lubricants the TAN will start at some relatively low initial value and gradually rise throughout the oil’s service life. Conversely, there are products such as antiwear hydraulic fluids that often contain metallo-organic additives such as zinc dialkyl dithiophosphate. Since these ad- ditives introduce high initial neutralization numbers, the initial value for new oil can- not be used for accurately predicting performance. In service such lubricants actually show a small decrease in TAN during early stages due to depletion of the antiwear additive. During continued use the value will level off and stay relatively constant. After extended service, the TAN will again start to rise and then becomes a more accurate reflection both of oxidation inhibitor depletion and of acidity due to oxida- tion. Any condemning limits on TAN should be set using other test results as well and reviewing the history of each application.
Neutralization number should not be used as the sole criterion for oil deterioration due to oxidation since other properties such as viscosity, insolubles, and sludge content must also be considered.
Trace metals - analyses are very useful for identifying contamination, confirming additive content, and indicating system wear. Two procedures suitable for determining trace metals in the parts per million range are emission spectroscopy and atomic ab- sorption.
In the first procedure, both direct-reading and photograph-recording emission spec- trographs are used for metals analysis of organic and inorganic substances. Emission spectroscopy, coupled with other analytical techniques, provides a very powerful tool for obtaining definitive answers to many difficult problems. It can be used for liquid or solid samples and virtually all elements can be determined.’ This method is routinely used for determining trace metals in lubricants: aluminum, barium, boron, calcium, chromium, copper, iron, lead, phosphorus, silicon, sodium, tin, and zinc are normally reported.
The second procedure, atomic absorption, also allows a quick accurate determina- tion of individual metals in organic and inorganic materials. This technique is partic- ularly useful when used in combination with X-ray and emission spectroscopy. With atomic absorption most metallic elements can be detected in the low part per billion level. Solids and liquids generally require ashing and solution in acid; however, some of these can be analyzed directly. The following metals are normally reported: calcium, chromium, copper, iron, potassium, lithium, magnesium, molybdenum sodium, nickel, lead, and zinc.
Particulate matter - accurate measurement of particulate matter in a lubricant can be very important for many applications. While the determination of insolubles, sedi- ment, and trace metals normally will serve this purpose, there are other applications such as hydraulic and turbine oil systems, hydrostatic oil systems and high speed bear- ings, where more detailed contamination data are needed. Particulates are measured using various techniques: weighing the contaminants, counting particles microscopi- cally, or counting particles using an automatic counter. Weighing particulates or gra- vimetric methods may use SAE/ARP 785, ANSVASTM F313, or some modification O f these procedures.e A specified volume of fluid is passed through a filter membrane o f known pore size and the residue is weighed. Microscopic particle counting is usually duirc by SAE/ARP 598A, ANSI/ASTM F312, or some similar ~ a r i a t i o n . ~ Here too a measured amount of fluid is passed through a filter membrane of a specific pore size and then the residue particles are counted and sized microscopically. Automatic parti-

7
522 CRC Handbook of Lubrication
Table 1 PARTICULATE CONTAMINATION
Particle size range
System class - particles/100 cm' sample
Olm) 0 1 2 3 4 5 6
5-10 2.700 4.600 9.700 24,000 32,000 87,000 128.000 10-25 670 1,340 2.680 5,360 10,700 21.400 42,000 25-SO 93 210 380 780 1.510 3,130 6.500 50-100 16 28 56 I10 225 430 I ,000
> I 0 0 I 3 5 11 21 41 92
Note: General significance: Class 0 - rarely attained; Class I - rarely attained; Class 2 - good missile system; Classes 3 and 4 - critical systems in general; Class 5 - poor missile system; and Class 6 - fluid as received.
From SAE, ASTM, and AIA Tentative Standard, SAE 749D. September 1963.
cle counting makes use of a light beam-photocell instrument which automatically re- cords the particle counts in various size ranges. A commonly used contamination level specification that can be used to categorize particulate matter is shown in Table 1 . A comprehensive standard for reporting hydraulic fluid contamination where counts are performed by automatic counters is ANSI B93.30 (NFPA Std: T2.9.3) . l o
Interfacial tension (IFT) - normally made using the ASTM D971 procedure, IFT measurements have very little significance for new oils other than for occasional use in quality control. IFT has been found to be useful in evaluating certain used oils: particularly, rust and oxidation inhibited turbine oil and transformer oils. The usual case shows the IFT value dropping in service to serve as an early warning of oxidation. Such signals can be apparent before significant oxidation as indicated by T viscosity changes has occurred. A reduction in IFT can also mean that a lub contaminated with polar type materials such as the calcium sulfonate rust inh in some preservative oils. An increase in IFT can also indicate problem areas ence has shown that certain corrosion inhibitors in the process of being deplet an increased IFT. A drop at the same time in the TAN is a strong indication lubricant is reverting to a neutral condition. This can be serious because the protection of needed corrosion inhibitors has been lost or at least IFT changes noted must be considered in light of other properties and oil type.
Demulsibility - two ASTM procedures measure the water separating of petroleum oils. These are ASTM D1401 for turbine oils and ASTM dium and high-viscosity lubricating oils. A modification of the D2711 pr it applicable for extreme pressure type lubricants. Although both proc able for inhibited and uninhibited oils, results are not always indicati
tamination often degrades the water separating properties of used oils. Foaming - the foaming characteristics of a lubricant are determined
temperatures by ASTM D892. Uninhibited, clean, and dry mineral oils S foaming tendencies; however, certain additives and/or contamination can affect foaming properties. The formation of rapidly rising air bubbles foaming problem if there is inadequate breakout of the surface bubbles.
oil or air leakage into the oil flow may lead to foam. Trace contam lubricant by surface-active materials such as rust preventives and dete
~~
Foaming can be both system oriented and oil related. Excessive turbul _-

Volumei 523
cause foaming. Foaming can have serious consequences; mechanical damage and poor system performance can result. Most lubricants, however, are inhibited with silicones or other special additives to maintain good foam breakout. I t should also be remem- bered that results under the D892 laboratory conditions d o not always correlate with field performance.
Rust Test - the ASTM D665 rust test method is suitable for a wide variety of lubricants. The method consists of two parts: Procedure A using distilled water and Procedure B using synthetic sea water. Most new lubricants are formulated to pass either Procedure A or B; premium quality turbine oils, gear oils, and hydraulic fluids are formulated to pass Procedure B. In the method, the oil to be evaluated is mixed with 10% water, and a polished grade 1018 carbon steel is rated as to its degree of rusting. The rust preventive test rating as reported by a laboratory can look startling. For example, the statement “severe rusting” is anything over 5% rust on the polished steel specimen. Under the criteria of this test, such results may not be totally condemn- ing for a well-maintained system with a maximum of 0.01% free water in the oil. For maximum benefits from the D665 evaluation of used lubricants, laboratories should always report the amount of rusting when it is present. Severe rust can sometimes be the result of contamination adversely affecting the lubricant’s rust inhibitor.
Ash - two ASTM methods are widely used for determining the noncombustible residue or mineral matter which remains after a lubricant is burned. ASTM D482 is normally used with those lubricants not containing ash-forming additives and with distillate and residual fuels, crude oils, and waxes. Lubricants of this type include turbine oils and many high viscosity circulating oils. Applications where lubricants containing ashless additives are sometimes used include compressors (crankcase and compressor), gear drives, and gas engines. ASTM D874 (sulfated ash) is used for lu- bricants compounded with ash containing additives. Many lubricants such as antiwear hydraulic fluids, heavy-duty crankcase oils, extreme pressure gear lubricants, and cer- tain compressor oils fall into this category. These products usually contain one or more of the following metals: barium, calcium, magnesium, zinc, or sodium. The elements sulfur, phosphorus, and chlorine may also be present. Although both procedures are applicable for new oil quality control, they can also be used for evaluating the condi- tion of used oil. The percentage of ash remaining after an oil is burned gives an indi- cation of the total concentration of metallic additives, noncombustible solid contami- nation and wear debris. To more fully interpret the significance, spectrographic methods are used to determine the concentration of the various metals in the ash.
There are additional procedures applicable to the testing of used lubricants which can be very helpful in solving specific problems relating to lubricant and equipment performance. A brief description of some of these methods follows.
Infrared spectroscopy - IR is probably the most universally applied method of all instrumental techniques. The infrared absorption spectrum of a lubricant furnishes a means of fingerprinting organic compounds and functional groups. Little or no sample pretreatment is required and both qualitative and quantitative determinations can be made. The method is often used for identifying additives and their concentration, re- action products, and contamination by organic materials in used lubricants.”
Gas chromatography - in this separation technique a sample is carried through a small diameter column by an inert gas such as helium. The sample is partitioned be- tween the inert carrier gas and a nonvolatile solvent such as silicone oil which is either supported on an inert solid material or coated onto the column’s interior wall. The solvent selectively retards sample constituents, according to their distribution coeffi- cients, until they form a segregated chain of individual constituents in the carrier gas. These constituents elute from the column in the carrier gas stream, are measured by a

52.4 CRC Handbook o f Lubrication
Table 2
DIFFRACTION SOME ELEMENTS AND COMPOUNDS IDENTIFIABLE BY X-RAY
Name Chemical formula Example(s) of occurrence
Chromium Copper Copper oxides Iron Iron oxide Iron oxide Iron oxide
Iron oxide hydrates
Silicon dioxide Sodium chloride Tin Tin oxides
Cr c u CuO and Cu,O Fe FeO( Wusti te) uFe20,( Hematite) Fe,O,( Magnetite)
yFe20,. H,O (Lepido-
uFe103. H,O(Goethite) /lFe,O,. HIO(Beta iron
SiO, NaCl (salt) Sn SnO and SnO,
crocite)
oxide hydrate)
Wear metal Wear metal or corrosion
Wear metal Fretting corrosion at high temperatures Fretting corrosion Corrosion of iron with limited supply of
Light surface rusting oxygen (under oil layer)
Bulk or heavy rusting Halide corrosion or paint pigment residue
Sand, quartz, or other siliceous material Brine or welding f lux residues Wear metal or corrosion
detector and recorded as a chromatogram. Gas chromatography is applicable to the analysis of a wide variety of organic solids, liquids, and gases, and only a few micro- grams of sample are required. Normally, little or no sample preparation is necessary. Gas samples should be collected and submitted in nonreactive pressure cylin technique is principally a quantitative tool, and most components can be d in concentrations below 1070. Sensitivity can be extended to the part per million r using special techniques and detectors. Identification of sample components is usua achieved by comparison with calibration standards. Certain additive concentrations well as solvent dilutions can be determined.
Liquid chromatography - modern high-speed analytical liquid chromatograp particularly useful for the qualitative analysis of thermally unstable samples and terials of low volatility, an area not amenable to gas chromatography. It is applic to both liquids and solids and normally requires only a few milligrams of Liquid chromatography can also be used for separation and determination of a in petroleum products.
X-Ray diffraction - this technique is used for substances exhibi properties. It is applicable to organic and inorganic solids and can be u tatively and quantitatively. X-ray diffraction measurements of crystalline of value for identification and estimation of phases, symmetry determina lite size and ordering, determination of reaction rate and completeness and determination of purity. Normally catalysts, deposits, and other PO ples are ground to 200 mesh or smaller in stainless steel mills prior to analy done to assure uniformity of particle size and increase reliability of results. ments and compounds identifiable by X-ray diffraction are shown in Table 2
X-Ray fluorescence - this technique can be used for the direc the constituent elements in both organic and inorganic materials. applicable to both liquid and solid samples. All elements with atomic higher can be identified. Generally, a gram or more of sample is adequa The sensitivity of the technique depends on the composition of the s element to be detected.
~
c - - ~

Volume I 525
Table 3 ANALYSIS OF USED TURBINE OIL
Steam turbine bearing lubricant
Inspection tests
Gravity (ASTM D287) ("API) Viscosity (ASTM D445) (mm'/sec)
4OoC 100°C
100°F 210°F
Viscosity (SSU)
Viscosity index (ASTM D2270) Flash (ASTM D92) ["C ( O F ) ]
Color (ASTM DI500) Appearance Neutralization no. (ASTM D974) Water (ASTM D1744) (ppm) Trace Sediment (ASTM D2273) (% vol) Emission Spectroscopy (ppm)
Aluminum Barium Boron Calcium Chromium Copper Iron Lead Silicon Silver Sodium Tin Zinc
New oil Used oil
29.8 28.9
62.16 67.61 8.18 8.57
322 351 53.7 55.5 99 97
230 (446) 225 (437) L 1.5 L 6.5 Bright Hazy
24 97 0.13 4.10
<0.001 0.02
< I < I 2 < I
< I < I (5 (5 < I < I < I < I <1 I < I O <IO < I < I < I < I < I < I < I < I < I O < I O
Greatest sensitivity is achieved for any element with low atomic number element matrices. Matrix effects, caused by the presence of other elements, may lead to prob- lems in the analysis and must be corrected before the fluorescent emission of the ele- ment of interest can be related to concentration.
Both X-ray analysis techniques have been applied to a number of industrial problems including studies on catalysts, metallurgical failures, corrosion and various reactor and engine deposits.
INTERPRETATION OF OIL TEST DATA
The information covered in the preceding sections provides a basis to evaluate used lubricants by interpreting their test data. The examples used are taken from actual field applications and show a cross-section of tests. The examples d o not represent all of the types of deterioration that can occur.
Table 3 shows the analysis of a used steam turbine oil in a more seriously degraded condition. The results indicate that the system oil should be discarded. The viscosity (SSU at 100OF) has increased about 9%, the color is very dark, and most importantly, (he TAN is very high. These factors indicate that the lubricant is highly oxidized, prob- ably from long-term service or high operating temperatures. The trace metals, as shown by emission spectroscopy, indicate that no significant wear has occurred. The

526 CRC Handbook of Lubrication
Table 4 ANALYSIS OF USED HYDRAULIC OIL
Hydraulic oil
Inspection tests
Gravity (ASTM D287) ("API) Viscosity (ASTM D445) (mm'lsec)
40°C 100°C
100°F 210°F
Viscosity (SSU)
Viscosity index (ASTM D2270) Flash (ASTM D92) ["C (OF)] Color (ASTM D1500) Appearance Neutralization no. (ASTM D664) Insoluble matter (ASTM D893)
Wt 070 Procedure A *Pentane Toluene Resins
Water Additive elements (wt. W)
Barium Phosphorus Zinc
Emission spectroscopy (ppm ) Aluminum Boron Chromium Copper Iron Lead Silicon Sodium Tin
Gravimetric (mg/100 cm') Particulate matter
New oil
29.0
57.75 7.62
299 51.8 93
205 (401) 3.5
Bright 1 .o
Nil Nil Nil Absent
0.12 0.06 0.06
< I < I <I < I < I <IO
< I <1 < I
2.0
Used oil
28.8
69.94 8.75
363 55.7 96
203 (397) Dil 8 Dark
1.92
2.64 0.46 2.18
Absent
0. IO 0.04 0.04
< I < I
14 48
<10
measurement of the oxidation inhibitor content was beyond the scope of m
inhibitor is effectively depleted. The hazy appearance of the used oil is due to contamination although this is not at a critical level.
Table 4 represents the analysis of a used hydraulic fluid taken from an molding machine. The test results indicate that the oil is unsuitable for furth and should be replaced. The viscosity (SSU at 100'F) has increased 21%, very dark, and the insolubles are very high for an oil of this type and for this
start with a relatively high value (1.0 in this case) and show a reductio
have passed the leveled off stage and has increased to the degree that i surpassed the new fluid level.
4ALYSIS OF
Inspection tests
Gravity (ASTM D287) ("API) Viscosity (ASTM D445) (mm'/sec)
40OC 100°C
100°F 210°F
Viscosity index (ASTM D2270) Appearance Neutralization No. (ASTM D664) Water Additive elements (Wt %)
Viscosity (SSU)
Barium Phosphorus Zinc
Aluminum Boron Chromium Copper Iron Lead Silicon Silver Sodium Tin
Emission spectroscopy (ppm)
Emulsion test (ASTM D1401) Particulate matter (mg/100 cm') Sulfated ash (ASTM D874) (wt VO) Insoluble matter (ASTM D893)
Wt @70 Procedure A *Pentane Toluene Resins
Procedure A Rust Test (ASTM D665)
Volume Z
Table 5
527
JSED PAPER 4CHINE OIL
Paper machine circulating oil
New oil
27.3
199.9 16.60
1 0 6 1 86.5 86
Bright 1.9
Absent
0.15 0.01 0.07
< I < I 2
< 1 1
< 10 5
< I <I <1
0.30 0.40
40-40-q25)
Nil Nil Nil
Pass
used oil
28.1
216 17.83
1146 91.7 89
Dark 1.6
Absent
0.10 0.05 0.04
<1 < I
2 99 58 21 < I < I
1 <1
9.6 0.56
30-30-20(60)
0.52 0.15 0.37
Pass
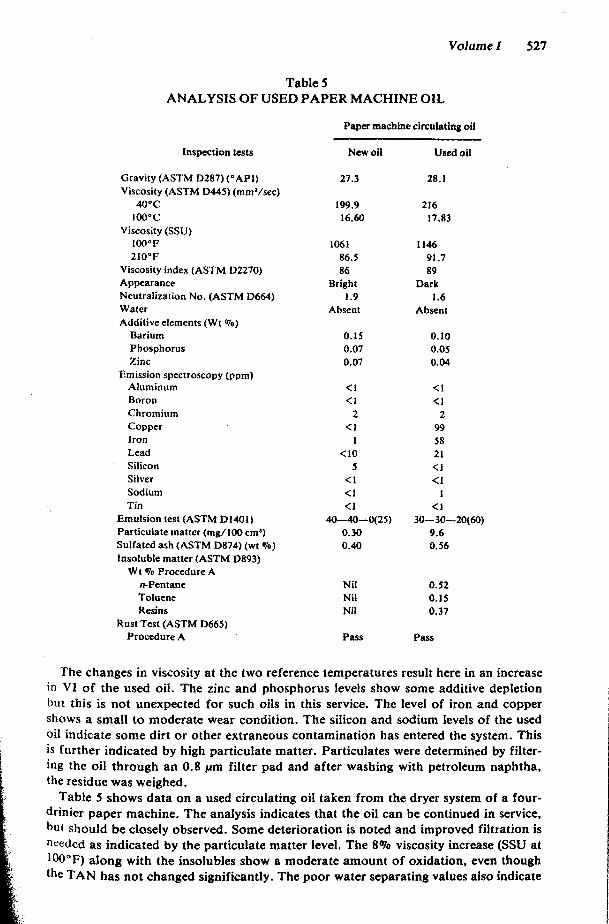
The changes in viscosity at the two reference temperatures result here in an increase in V I of the used oil. The zinc and phosphorus levels show some additive depletion but this is not unexpected for such oils in this service. The level of iron and copper shows a small to moderate wear condition. The silicon and sodium levels of the used oil indicate some dirt or other extraneous contamination has entered the system. This is further indicated by high particulate matter. Particulates were determined by filter- ing the oil through an 0.8 pm filter pad and after washing with petroleum naphtha, the residue was weighed.
Table 5 shows data on a used circulating oil taken from the dryer system of a four- drinier paper machine. The analysis indicates that the oil can be continued in service, but should be closely observed. Some deterioration is noted and improved filtration is needed as indicated by the particulate matter level. The 8% viscosity increase (SSU at lW0F) along with the insolubles show a moderate amount of oxidation, even though the TAN has not changed significantly. The poor water separating values also indicate

528 CRC Handbook of Lubrication
Table 6 ANALYSIS OF USED GAS ENGINE OIL
Gas engine lubricant
Inspection tests
Gravity (ASTM D287) ("API) Viscosity (ASTM D445) (mm'/sec)
40°C 100°C
100°F 210°F
Viscosity (SSU)
Viscosity index (ASTM D2270) Flash (ASTM D92) 1°C ( O F ) ]
Appearance Neutralization no. (ASTM D664) Insoluble matter (ASTM D893)
Wt % Procedure B *Pentane Toluene Resins
Water (hotplate) Additive Elements (wt @/a)
Calcium Phosphorus Zinc
Aluminum Emission spectroscopy (ppm)
Boron Chromium Copper Iron Lead Silicon Sodium Tin
Oxidation Nitrogen fixation
Infrared analysis
New oil
27.5
114.3 12.48
597
100 243(469) Bright
3.0
69.6
Nil Nil Nil Absent
0. I9 0 .13 0.14
< I < I < I < I (1 <IO <IO
< I < I
Nil Nil
Used oil B
27.8
137.0 14.24
717
101 240(464) Dark
5.2
76.6
2 < I
8 8
I S <IO <10
21 < I
t
Slight Moder- ate
possible contamination. Additive elements are slightly reduced but not abnor The iron content indicates some wear, but is not critical at this time. The copper is probably from copper lines or from brass bearing cages. Because the dryer bead are antifriction spherical roller bearings, they are not the source of the lead in the used oil. The lead is probably from lead type paint sometimes used on of bearing housings.
Table 6 covers a used crankcase oil taken from a high speed, natural gas cycle, 650 hp, V-12 nonturbo charged engine. Significant increases in viscod TAN indicate the lubricant to be highly oxidized and unsuitable for fur Changeout is recommended to avoid possible formation of engine depo cosity shows a 20% increase (SSU at 100OF) and the acid number has 2.2. While oxidation and nitrogen fixation by infrared shows only slight and II levels respectively, this points out the caution required in evaluating only lia on a used lubricant. Viscosity and TAN considerations are of primary Although not critical at this point, some wear is noted in the trace metal
_ _ _ _ ~ 0
P
0,
di re

Inspection tests
Gravity (ASTM D287) (“API) Viscosity (ASTM D445) (mm2/sec)
40°C l000C
100°F 210’F 1
Viscosity (SSU)
Viscosity index (ASTM D2270) Flash (ASTM D92) [“C ( O F ) ] Color (ASTM DISOO) Appearance Neutralization no. (ASTM D664) Insoluble matter (ASTM D893)
Wt qo by Procedure A @Pentane Toluene Resins
Water (hotplate) Chlorine (ASTM D808) (wt %) Sulfated ash (ASTM D874) (wt %) Additive elements (wt To)
Sulfur’ Phosphorus Emission Spectroscopy (ppm)
Aluminum
I Volume I 529 I I
Table 7 ANALYSIS OF USED EP GEAR OIL
EP gear oil
Used oil
25.9
Barium Boron Calcium Copper Iron Lead Silicon Sodium Tin Zinc
Foam test (ASTM D892) 5 Min blowing (cmS)
Sequence I L
3
Sequence I 2 3
10 Min settling (cm’)
’ Determined by ASTM DI552.
New oil
26.0
293 23.42
I556 116.6 99
252(485) 5 .o
Bright 0.45
Nil Nil Nil Absent Nil
0.02
0.79 0.024
< I < I <1 <5 < I < I
<10 < I < I <1 <IO
10 25 10
0 0 0
304 24.15
1612 119.9 101 22 l(430) L 8.0 dil Dark
2.3
0.03 0.00 0.03
Absent 0.13 0.03
0.38 <O.Ol
1 < I <1 <5
2 2
<IO < I <l <1 10
330 340 600
25 0
300
of copper may be from copper tubing lubrication lines. The sodium in the used oil is Probably from airborne dirt.
Table 7 shows the analysis of a sulfur-phosphorus “mild” extreme pressure gear 0 x 1 . Although this product is judged to be in acceptable condition for further use, the data are interesting. First, the viscosity has not appreciably changed and the insoluble resins are low. Both conditions indicate that very little oxidation has taken place. On

v 530 CRC Handbook of Lubrication
the other hand, the TAN has increased significantly and the color has darkened. These factors while indicating oxidation, are not felt to be of undue concern, at least at this time, because of the viscosity and insolubles results. Admixture of the lubricant with another product is indicated by the presence of chlorine and the reduced levels of the sulfur and phosphorus extreme pressure additive system. The contaminating lubricant probably had a higher initial TAN than the lubricant in the system and affected the TAN results. Foam test deterioration also often occurs when oils of different types are mixed. Trace metals by emission spectroscopy show no abnormal wear.
INTERPRETATION OF GREASE TEST DATA
Up to this point only deterioration of fluid lubricants has been considered. Greases perform most of the lubricating functions of fluid lubricants and are preferred for many applications, especially those with ball and roller bearings. Analysis of a grease on a routine basis is seldom required because greases are not reused. Most grease anal- yses are performed in connection with bearing failures, malfunction of equipment, or in setting relubrication schedules. The following tests provide useful data on the char- acteristics of the grease and possible contamination of the equipment the grease lubri- cates:
1. Dropping Point (ASTM D566) 2. Penetration (ASTM D217) 3. Appearance 4. Color Visual 5 . Texture 6. Ash (ASTM D128) 7. 8. Spectrographic Analysis 9. Thickener Content
Ash as Sulfates (ASTM D128)
10. 11 - 12. Water (ASTM D95) 13. Insoluble Matter (ASTM D128)
Free Fatty Acids (ASTM D128) Free Alkalinity (ASTM D128)
Table 8 shows test results of a used grease sample taken from a large antifric paper machine press roll bearing. The grease is lithium soap thickened and contain lead type extreme pressure additive system. The test results show the used grease s ened considerably and has a reduced dropping point. The product is indicated to contaminated with a calcium soap thickened grease. Insoluble matter is high and content shows high wear. The product has likely been exposed to service condi for which it is not suitable.
Since the soap or other gelling agents in a grease tend to mask many test o tions, a preliminary separation of the oil phase is often useful. This may be out with petroleum ether o r with acetone used to leach away the oil phase from 5 or 10 g weighed sample of the used grease. The soap and any wear particles be examined microscopically. This also allows the analyses indicated earlier plied separately to both the oil phase and thickener.

Table 8 ANALYSIS OF USED GREASE
Inspection tests
Dropping Point (OF) Penetration (ASTM ~ 2 1 7 )
h w o r k e d Worked 60 strokes
NLGI consistency Appearance Color Texture Odor Ash (Modified) (wt. VO) Spectrographic analysis
Major Minor Trace
Water (ASTM D95) (wt TO) Insoluble matter (ASTM D128)
Wt Vo Nature
Infrared analysis
Flame photometric analysis Calcium Lithium Potassium
Sodium Lead Or PbO (ASTM D1262) (wt TO)
Press roll bearing g r w
used grease New grease
358
317 323
290
444 448
Smooth-bright 1 Smooth-bright OOO
Black Dark brown Smooth Smooth Normal Oxidized 2.9 4.29
0.64 0.64
Trace 0.04 0.79
0.30 I .29
Trace 0.01 1.78

532 CRC Handbook o f Lubrication
REFERENCES
I . Staff article, Oil stability bench tests. I , Lubrication.49, 159, December 1963. 2. Keller, G. R., Hydraulic System Analysis, Hydraulic & Pneumatics, Cleveland, 1969. 3. Berkley, J. B., Lubricating oils, Criteria for Quality of Petroleum Products, Allinson, J . P.. Ed.,
4. Bcrkley, J. B. and Gaynor, J. W., Lubricating oils, in Significance of Tests for Petroleum Products,
5. Snook, W. A., Used engine oil analysis, Lubrication, 54(9). 104, 1968. 6. Young, C. H.. Used hydraulic oil analysis, Lubrication, 63(4), 41, 1977. 7. Scribner, B. F. and Margoshes. M., Emission Spectroscopy, in Treatise on Analytical Chemistry,
Interscience, New York, 1965. 3352. 8. Society of Automotive Engineers Procedure for Determination of Particulate Contamination in Hy-
draulic Fluids by the Control Filter Gravimetric Procedure (test method only), SAE/ARP 785-1963, Society of Automotive Engineers, New York, 1963.
9. Society of Automotive Engineers Procedure for the Determination of Particulate Contamination of Hydraulic Fluids by the Particle Count Method (test method only), SAEIARP 598A-1969, Society of Automotive Engineers, New York.
10. Fluid Power Standards. Luecke, J . R., Ed., Vol. I , 4th ed.. National Fluid Power Association, Milwaukee, 1976, 521.
11. Otte, 0. M., A Practical Application of Engine Inspection Observations and Used Gas Engine Oil Analysis, Society of Automotive Engineers, New York, 1973.5.
12. Young, C. H.. Used hydraulic oil analysis, Lubrication, 63(4), 44, 1977.
John Wiley& Sons, New York, 1973, 177.
Holl, B. R. and Boldt, K.. Eds.. American Society for Testing Materials, Philadelphia, 1977. 142.
at

Editor E. Richard Booser, Ph.D.
Manager Systems Engineering Subsection Turbine Technology Laboratory
General Electric Company Schenectady, New York