Lte optimization libre
120
LTE L10 Optimization LZT 123 9165 R2A © Ericsson 2009 - 1 - LTE L10 Optimization STUDENT BOOK LZT 123 9165 R2A
-
Upload
virender-solanki -
Category
Technology
-
view
910 -
download
120
Transcript of Lte optimization libre
LTE L10 Optimization
LZT 123 9165 R2A © Ericsson 2009 - 1 -
LTE L10 Optimization
STUDENT BOOK LZT 123 9165 R2A
LTE L10 Optimization
- 2 - © Ericsson 2009 LZT 123 9165 R2A
DISCLAIMER This book is a training document and contains simplifications. Therefore, it must not be considered as a specification of the system. The contents of this document are subject to revision without notice due to ongoing progress in methodology, design and manufacturing. Ericsson assumes no legal responsibility for any error or damage resulting from the usage of this document. This document is not intended to replace the technical documentation that was shipped with your system. Always refer to that technical documentation during operation and maintenance.
© Ericsson 2010 This document was produced by Ericsson. • It is used for training purposes only and may not be copied or
reproduced in any manner without the express written consent of Ericsson.
This Student Book, LZT 123 9165, R2A supports course number LZU 108 7416 .
Table of Contents
LZT 123 9165 R2A © Ericsson 2009 - 3 -
Table of Contents
1 INTRODUCTION............................................................................7
INTRODUCTION....................................................................................9
LTE RAN EVOLUTION .....................................................................................9
LTE PERFORMANCE MANAG EMENT SOLUTION ...........................11
PERFORMANCE STATISTICS ......................................................................12
PERFORMANCE RECORDING .....................................................................13
PERFORMANCE DATA ANALYSIS ...............................................................14
WCDMA RAN KEY PERFORMANCE INDICATORS .....................................15
LTE RAN OPTIMIZATION....................................................................17
SUMMARY...........................................................................................18
2 DATA COLLE CTION...................................................................19
E-UTRAN COUNTER COLLE CTION AND STORAGE .......................21
E-UTRAN COUNTER TYPES.........................................................................24
PEG COUNTER..............................................................................................25
GAUGE COUNTER ........................................................................................25
ACCUMULATOR AND SCAN COUNTERS....................................................26
PROBABILITY DENSITY FUNCTION (PDF)..................................................28
E-UTRAN COUNTER DESCRIPTIONS .........................................................29
COUNTERS IN XML FILES ............................................................................31
LTE OBSERVABILITY .........................................................................32
SUMMARY...........................................................................................34
3 TRAFFIC......................................................................................35
INTRODUCTION..................................................................................36
BUSY HOUR...................................................................................................37
TRAFFIC TYPES ............................................................................................38
TRAFFIC MIX..................................................................................................40
SUMMARY......................................................................................................40
LTE L10 Optimization
- 4 - © Ericsson 2009 LZT 123 9165 R2A
4 SERVICE ACCESSIBILITY OPTIMIZATION ..............................41
INTRODUCTION..................................................................................43
E-UTRAN ACCESSIBI LITY KPIS........................................................43
CONNECTION SETUP ........................................................................44
E-RAB SETUP PROCEEDURE...........................................................45
RRC CONNECTION ESTABLISHMENT ........................................................46
S1 SIGNALING CONNECTION ESTABLISHMENT .......................................48
E-RAB ESTABLISHMENT ..............................................................................50
ANALYSIS.......................................................................................................54
PAGING CAPACITY .......................................................................................55
PARAMETERS.....................................................................................62
SUMMARY...........................................................................................63
5 SERVICE RETAINABILIT Y OPTIMIZATION ..............................65
RETAINABIL ITY ..................................................................................67
E-UTRAN RETAINAB ILITY KPI ..........................................................67
E-RAB RELEASE PR OCEDURES......................................................68
E-RAB RELEASE PROCEDURE....................................................................68
UE CONTEXT RELEASE PROCEDURE .......................................................70
MME INITIATED RELEASE COUNTERS.......................................................72
ENODEB INITIATED RELEASE COUNTERS................................................73
UE SESSION TIME.........................................................................................74
EUTRAN MOBILITY........................................................................................75
SUMMARY...........................................................................................91
6 SERVICE INTEGRITY OPTIMIZATION.......................................93
E-UTRAN INTEGRITY MEASUREMENTS..........................................95
DATA RADIO BEARER THROUGHPUT AND LATENCY..............................95
E-UTRAN THROUGHPUT KPIS..........................................................96
E-UTRAN PACKET LOSS ............................................................................102
Table of Contents
LZT 123 9165 R2A © Ericsson 2009 - 5 -
ACTIONS ......................................................................................................104
PARAMETERS...................................................................................110
SUMMARY.........................................................................................110
7 TRACES ....................................................................................111
LTE CELL AND UE T RACE CONTENTS ..........................................113
INTERNAL EVENTS .....................................................................................114
EXTERNAL EVENTS....................................................................................115
LTE CELL AND UE TRACE CO LLECTION AND STORAGE ...........116
SUMMARY.........................................................................................119
LTE L10 Optimization
- 6 - © Ericsson 2009 LZT 123 9165 R2A
Intentionally Blank
1 Introduction
LZT 123 9165 R2A © 2010 Ericsson - 7 -
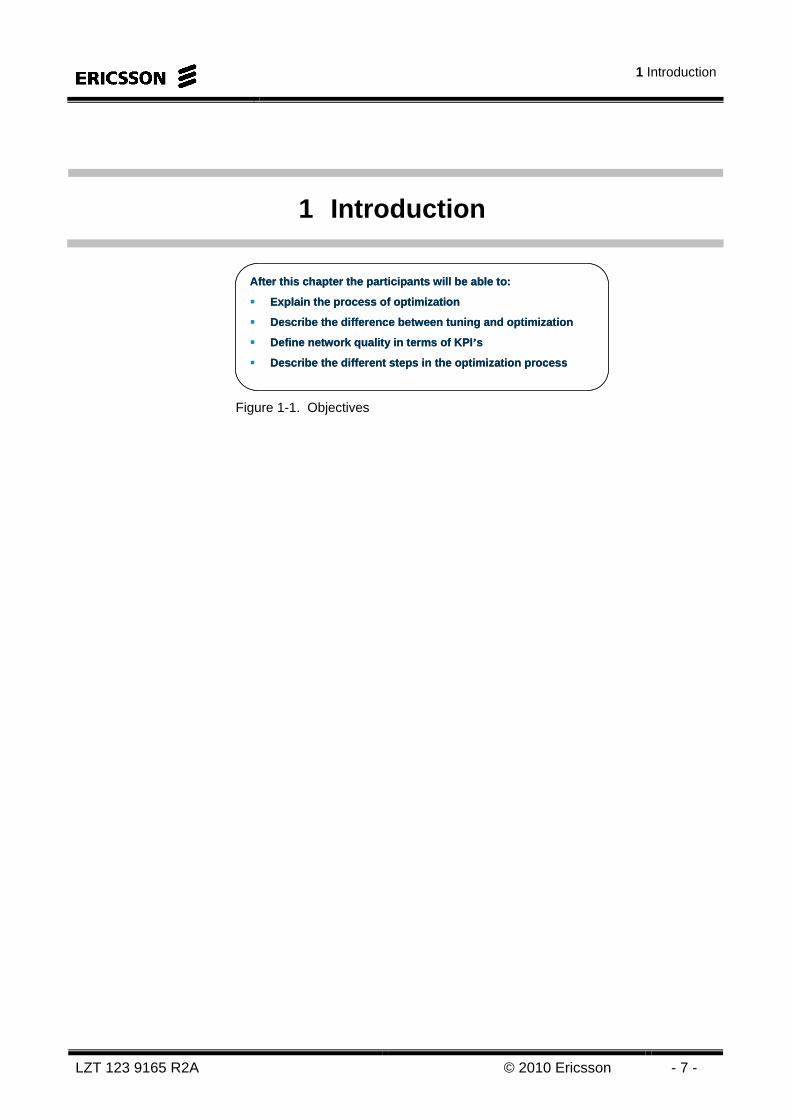
1 Introduction
After this chapter the participants will be able to:
Explain the process of optimization
Describe the difference between tuning and optimization
Define network quality in terms of KPI ’s
Describe the different steps in the optimization process
After this chapter the participants will be able to:
Explain the process of optimization
Describe the difference between tuning and optimization
Define network quality in terms of KPI ’s
Describe the different steps in the optimization process
Figure 1-1. Objectives

LTE L10 Optimization
- 8 - © Ericsson 2010 LZT 123 9165 R2A
Intentionally Blank
1 Introduction
LZT 123 9165 R2A © 2010 Ericsson - 9 -
INTRODUCTION
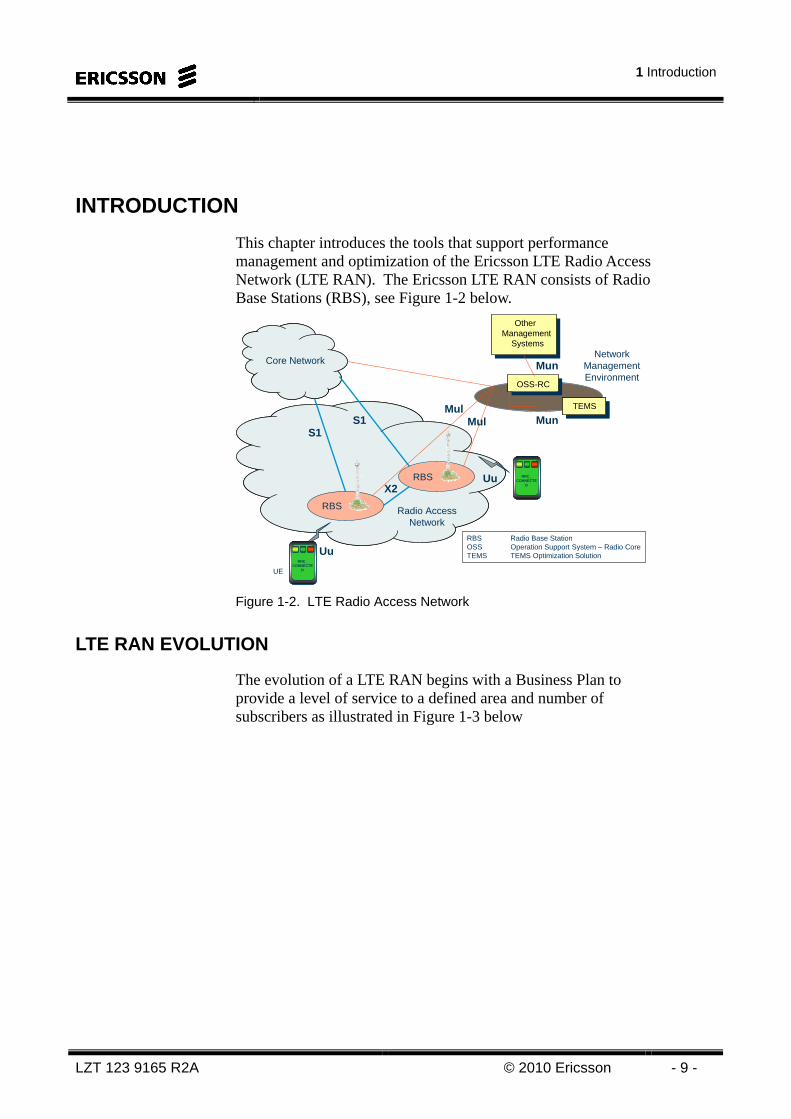
This chapter introduces the tools that support performance management and optimization of the Ericsson LTE Radio Access Network (LTE RAN). The Ericsson LTE RAN consists of Radio Base Stations (RBS), see Figure 1-2 below.
Other Management
Systems
RBSRBS
TEMSTEMS
Core Network
RBS
RBS
Radio AccessNetwork
S1
Uu
OSS-RC
MulMul
Mun
Mun
NetworkManagementEnvironment
RBS Radio Base StationOSS Operation Support System – Radio CoreTEMS TEMS Optimization Solution
UE
UuX2
S1
RRC_CONNECTE
D
RRC_CONNECTE
D
RRC_CONNECTE
D
RRC_CONNECTE
D
Figure 1-2. LTE Radio Access Network
LTE RAN EVOLUTION
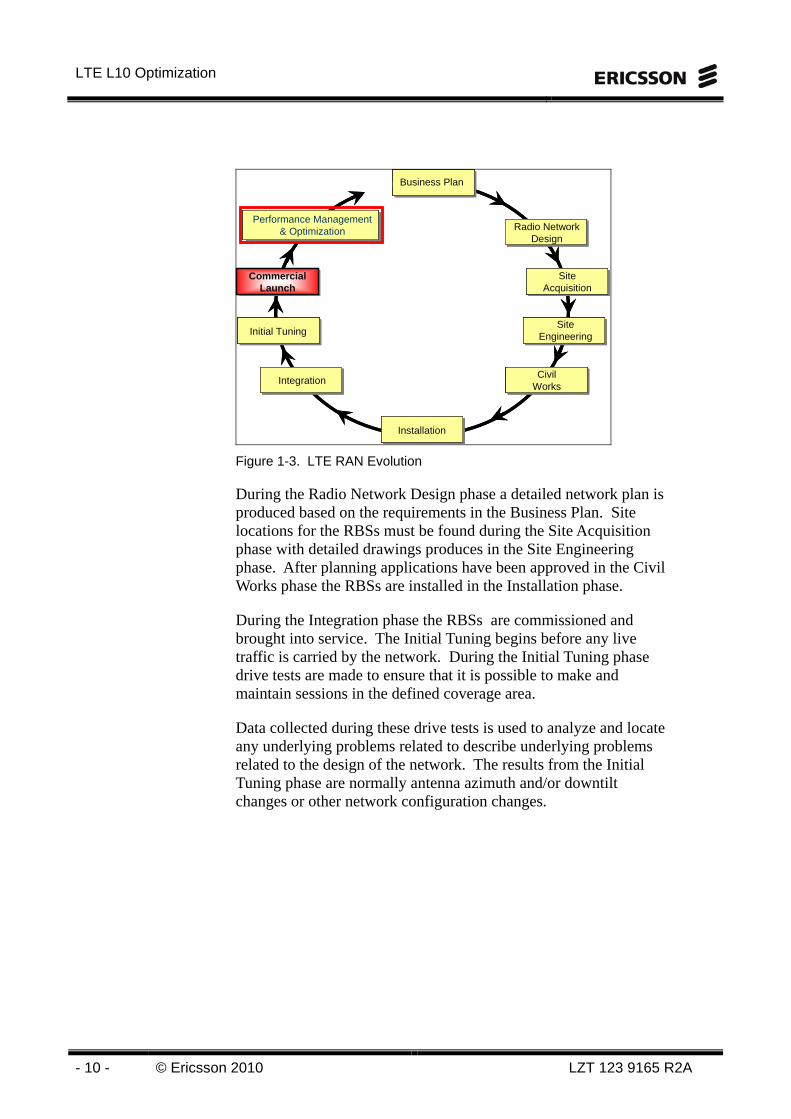
The evolution of a LTE RAN begins with a Business Plan to provide a level of service to a defined area and number of subscribers as illustrated in Figure 1-3 below
LTE L10 Optimization
- 10 - © Ericsson 2010 LZT 123 9165 R2A
Business Plan
Radio Network Design
Site Acquisition
Site Engineering
CivilWorks
Installation
Integration
Initial Tuning
Commercial Launch
Performance Management & Optimization
Business Plan
Radio Network Design
Site Acquisition
Site Engineering
CivilWorks
Installation
Integration
Initial Tuning
Commercial Launch
Performance Management & Optimization
Figure 1-3. LTE RAN Evolution
During the Radio Network Design phase a detailed network plan is produced based on the requirements in the Business Plan. Site locations for the RBSs must be found during the Site Acquisition phase with detailed drawings produces in the Site Engineering phase. After planning applications have been approved in the Civil Works phase the RBSs are installed in the Installation phase.
During the Integration phase the RBSs are commissioned and brought into service. The Initial Tuning begins before any live traffic is carried by the network. During the Initial Tuning phase drive tests are made to ensure that it is possible to make and maintain sessions in the defined coverage area.
Data collected during these drive tests is used to analyze and locate any underlying problems related to describe underlying problems related to the design of the network. The results from the Initial Tuning phase are normally antenna azimuth and/or downtilt changes or other network configuration changes.
1 Introduction
LZT 123 9165 R2A © 2010 Ericsson - 11 -
When the Initial Tuning is complete the network can be commercially launched. This may be with friendly, non-paying users or actual fee paying subscribers. Once the network is carrying live traffic Performance Management and Optimization can begin and will continue for the lifetime of the network. During this phase network statistics (counters) are collected from the nodes and used to create Key Performance Indicators (KPIs) to gauge the performance of the network against a defined set of targets. A detailed analysis of the network is required if these targets are not met. This is achieved using additional counters or any of the many optimization tools available to the Operator. The results of the optimization phase are normally parameter changes or other network configuration changes. In some instances a drive test may be required to give a better picture of the network performance during this phase.
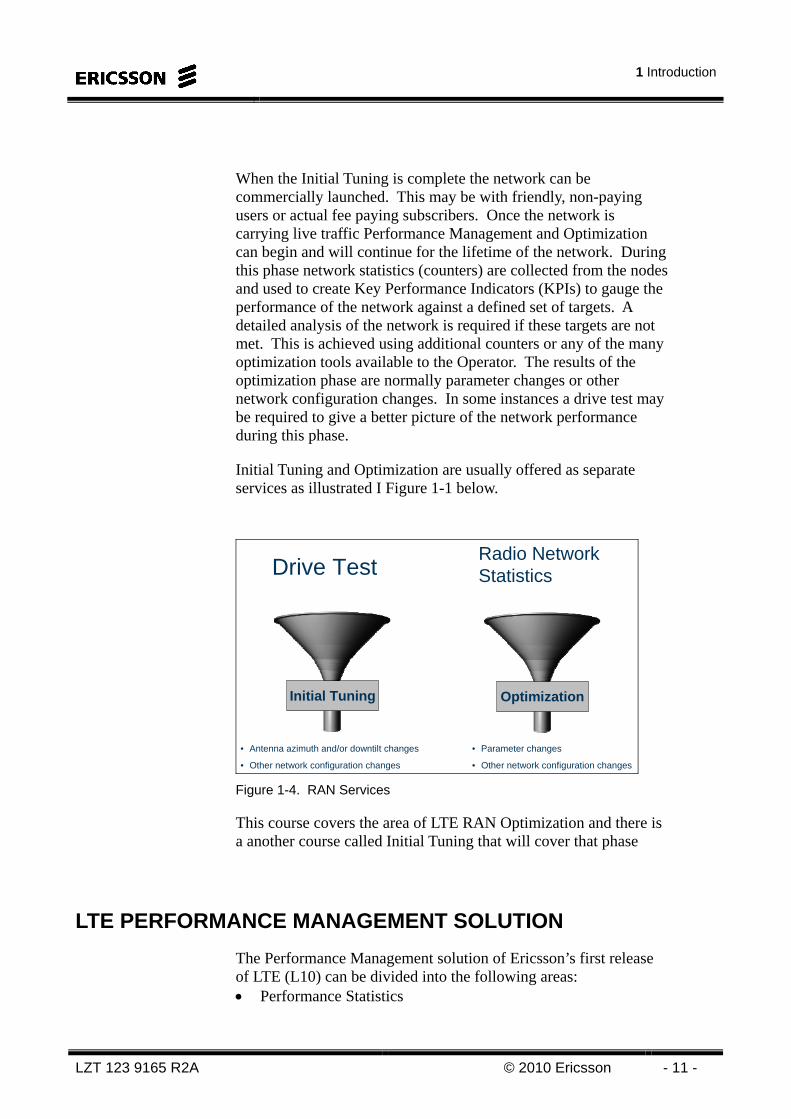
Initial Tuning and Optimization are usually offered as separate services as illustrated I Figure 1-1 below.
• Antenna azimuth and/or downtilt changes
• Other network configuration changes
• Parameter changes
• Other network configuration changes
Drive Test
Initial Tuning Optimization
Radio Network Statistics
Figure 1-4. RAN Services
This course covers the area of LTE RAN Optimization and there is a another course called Initial Tuning that will cover that phase
LTE PERFORMANCE MANAGEMENT SOLUTION
The Performance Management solution of Ericsson’s first release of LTE (L10) can be divided into the following areas: • Performance Statistics
LTE L10 Optimization
- 12 - © Ericsson 2010 LZT 123 9165 R2A
• Performance Recording
• Performance Data Analysis
PERFORMANCE STATISTICS
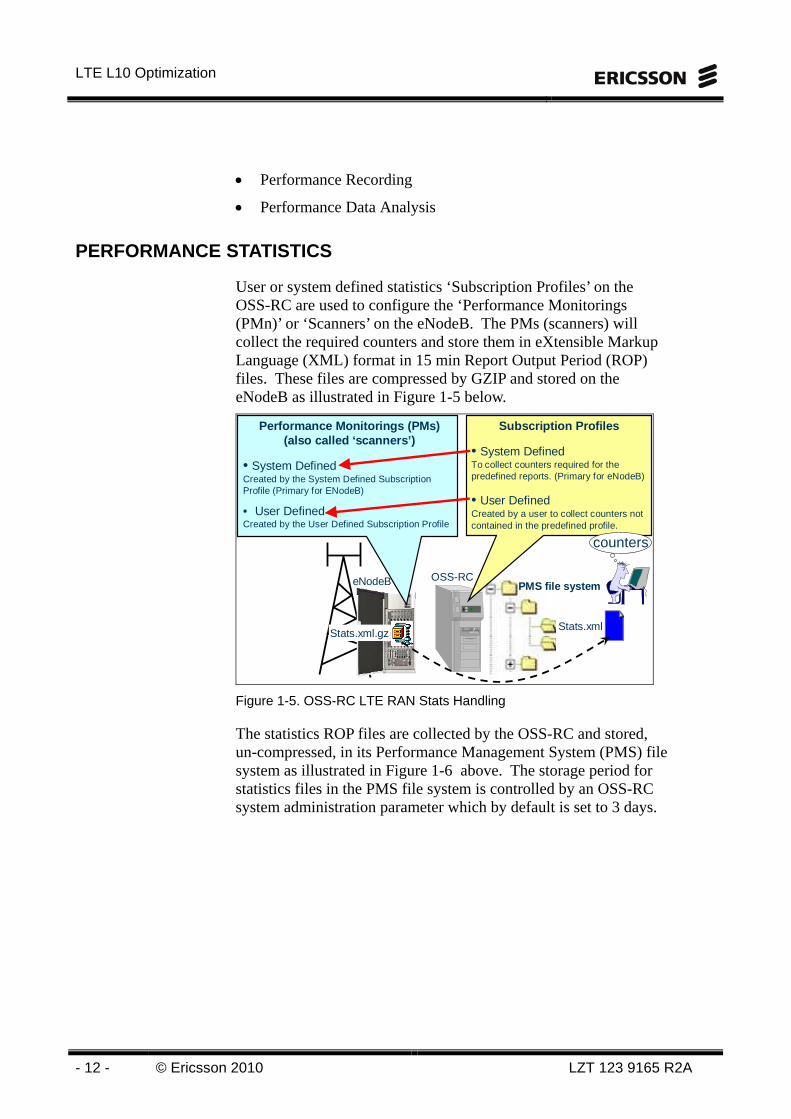
User or system defined statistics ‘Subscription Profiles’ on the OSS-RC are used to configure the ‘Performance Monitorings (PMn)’ or ‘Scanners’ on the eNodeB. The PMs (scanners) will collect the required counters and store them in eXtensible Markup Language (XML) format in 15 min Report Output Period (ROP) files. These files are compressed by GZIP and stored on the eNodeB as illustrated in Figure 1-5 below.
Stats.xml.gz
PMS file systemeNodeB OSS-RC
Stats.xml
Subscription Profiles
• System DefinedTo collect counters required for the predefined reports. (Primary for eNodeB)
• User Defined Created by a user to collect counters not contained in the predefined profile.
Performance Monitorings (PMs)(also called ‘scanners’)
• System DefinedCreated by the System Defined Subscription Profile (Primary for ENodeB)
• User DefinedCreated by the User Defined Subscription Profile
counters
Figure 1-5. OSS-RC LTE RAN Stats Handling
The statistics ROP files are collected by the OSS-RC and stored, un-compressed, in its Performance Management System (PMS) file system as illustrated in Figure 1-6 above. The storage period for statistics files in the PMS file system is controlled by an OSS-RC system administration parameter which by default is set to 3 days.
1 Introduction
LZT 123 9165 R2A © 2010 Ericsson - 13 -
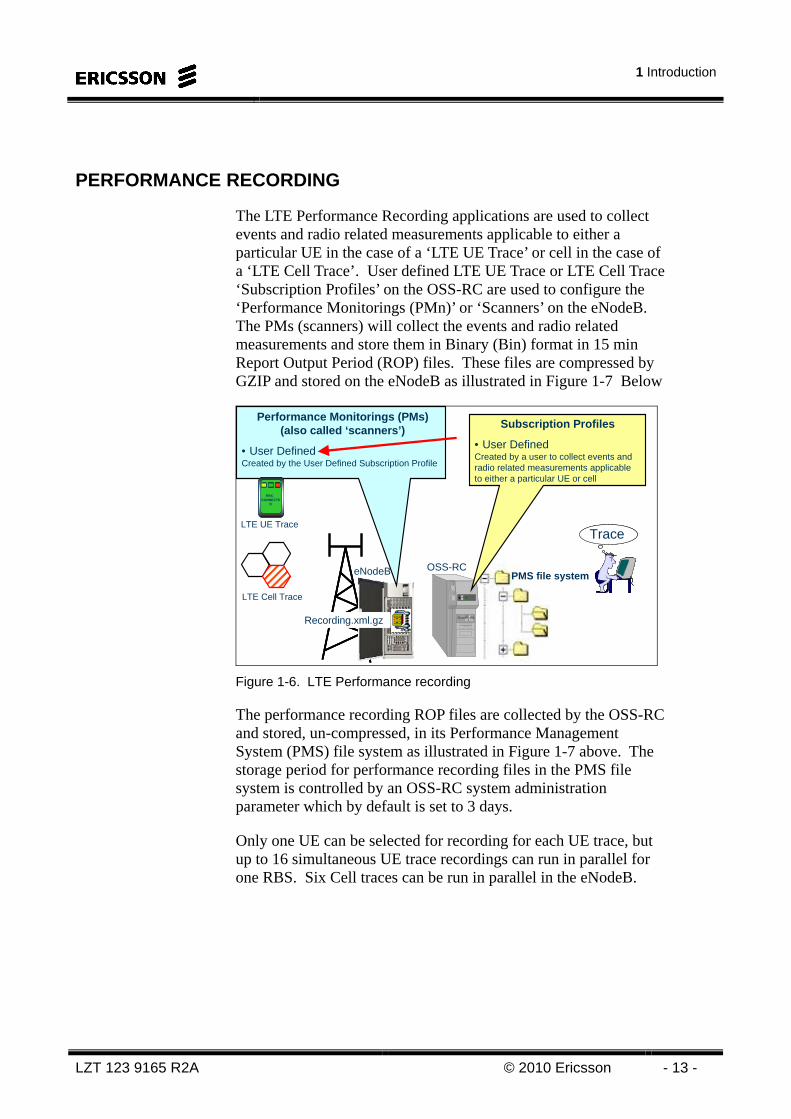
PERFORMANCE RECORDING
The LTE Performance Recording applications are used to collect events and radio related measurements applicable to either a particular UE in the case of a ‘LTE UE Trace’ or cell in the case of a ‘LTE Cell Trace’. User defined LTE UE Trace or LTE Cell Trace ‘Subscription Profiles’ on the OSS-RC are used to configure the ‘Performance Monitorings (PMn)’ or ‘Scanners’ on the eNodeB. The PMs (scanners) will collect the events and radio related measurements and store them in Binary (Bin) format in 15 min Report Output Period (ROP) files. These files are compressed by GZIP and stored on the eNodeB as illustrated in Figure 1-7 Below
Recording.xml.gzRecording.xml.gz
PMS file systemeNodeB OSS-RC
Subscription Profiles
• User Defined Created by a user to collect events and radio related measurements applicable to either a particular UE or cell
TraceTrace
Performance Monitorings (PMs)(also called ‘scanners’)
• User DefinedCreated by the User Defined Subscription Profile
LTE UE Trace
LTE Cell Trace
RRC_CONNECTE
D
RRC_CONNECTE
D
Figure 1-6. LTE Performance recording
The performance recording ROP files are collected by the OSS-RC and stored, un-compressed, in its Performance Management System (PMS) file system as illustrated in Figure 1-7 above. The storage period for performance recording files in the PMS file system is controlled by an OSS-RC system administration parameter which by default is set to 3 days.
Only one UE can be selected for recording for each UE trace, but up to 16 simultaneous UE trace recordings can run in parallel for one RBS. Six Cell traces can be run in parallel in the eNodeB.
LTE L10 Optimization
- 14 - © Ericsson 2010 LZT 123 9165 R2A
PERFORMANCE DATA ANALYSIS
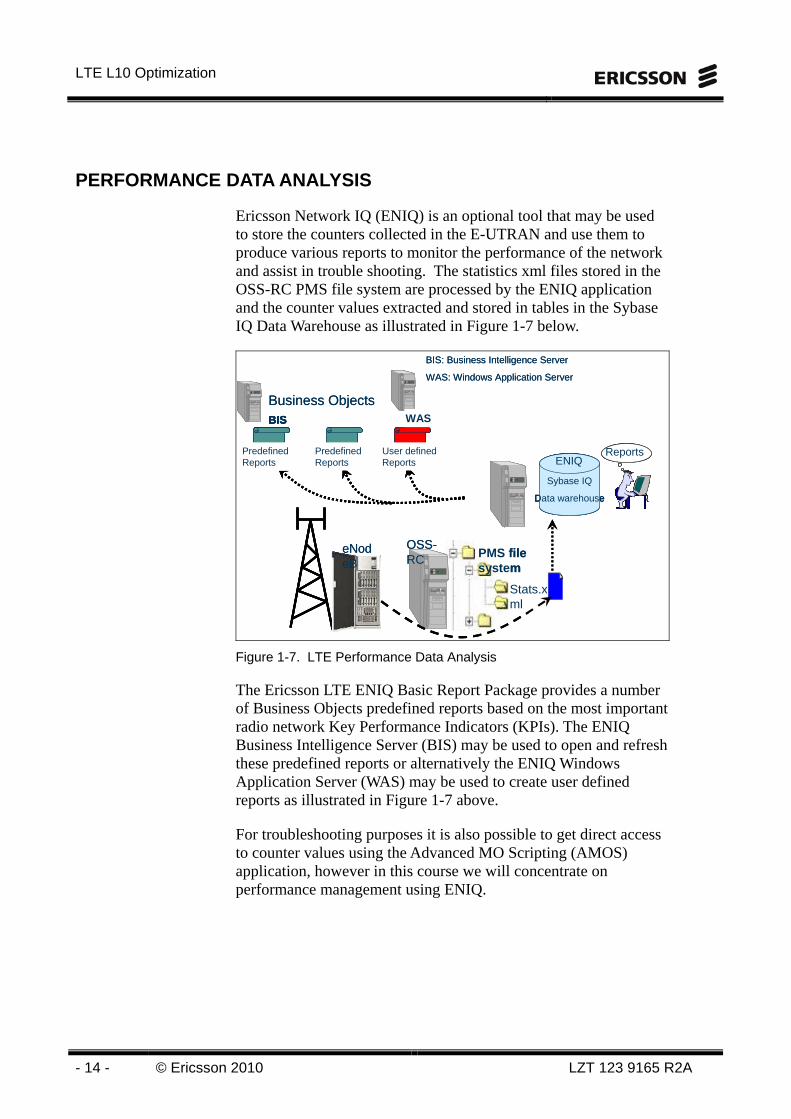
Ericsson Network IQ (ENIQ) is an optional tool that may be used to store the counters collected in the E-UTRAN and use them to produce various reports to monitor the performance of the network and assist in trouble shooting. The statistics xml files stored in the OSS-RC PMS file system are processed by the ENIQ application and the counter values extracted and stored in tables in the Sybase IQ Data Warehouse as illustrated in Figure 1-7 below.
Business Objects
BIS: Business Intelligence Server
WAS: Windows Application Server
PMS file system
eNodeB
OSS-RC
Stats.xml
ReportsPredefined Reports
BIS
Predefined Reports
User defined Reports
WAS
Sybase IQ
Data warehouse
ENIQ
Business Objects
BIS: Business Intelligence Server
WAS: Windows Application Server
PMS file system
eNodeB
OSS-RC
Stats.xmlStats.xml
ReportsReportsPredefined Reports
BIS
Predefined Reports
User defined Reports
Predefined Reports
BIS
Predefined ReportsPredefined Reports
BIS
Predefined Reports
User defined Reports
WAS
Sybase IQ
Data warehouse
ENIQ
Sybase IQ
Data warehouse
Sybase IQ
Data warehouse
ENIQ
Figure 1-7. LTE Performance Data Analysis
The Ericsson LTE ENIQ Basic Report Package provides a number of Business Objects predefined reports based on the most important radio network Key Performance Indicators (KPIs). The ENIQ Business Intelligence Server (BIS) may be used to open and refresh these predefined reports or alternatively the ENIQ Windows Application Server (WAS) may be used to create user defined reports as illustrated in Figure 1-7 above.
For troubleshooting purposes it is also possible to get direct access to counter values using the Advanced MO Scripting (AMOS) application, however in this course we will concentrate on performance management using ENIQ.
1 Introduction
LZT 123 9165 R2A © 2010 Ericsson - 15 -
WCDMA RAN KEY PERFOR MANCE INDICATORS
LTE Observability
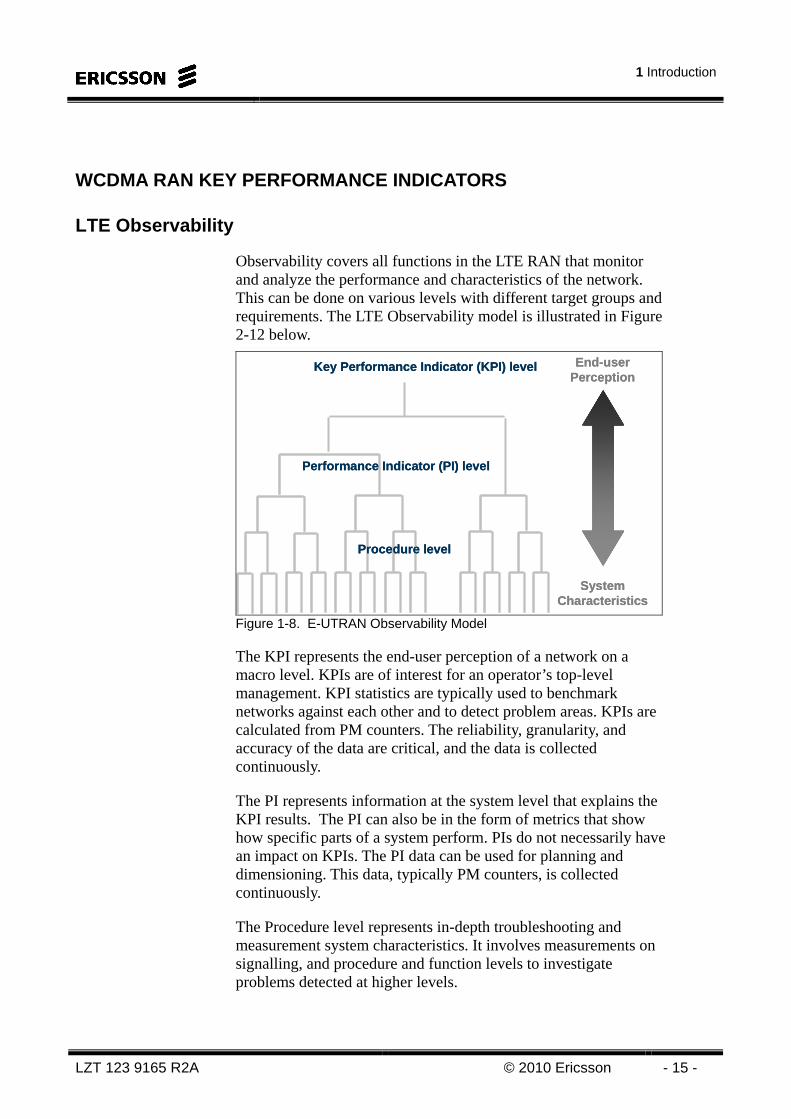
Observability covers all functions in the LTE RAN that monitor and analyze the performance and characteristics of the network. This can be done on various levels with different target groups and requirements. The LTE Observability model is illustrated in Figure 2-12 below.
Key Performance Indicator (KPI) level
Performance Indicator (PI) level
Procedure level
SystemCharacteristics
End-userPerception
Key Performance Indicator (KPI) level
Performance Indicator (PI) level
Procedure level
SystemCharacteristics
End-userPerception
Figure 1-8. E-UTRAN Observability Model
The KPI represents the end-user perception of a network on a macro level. KPIs are of interest for an operator’s top-level management. KPI statistics are typically used to benchmark networks against each other and to detect problem areas. KPIs are calculated from PM counters. The reliability, granularity, and accuracy of the data are critical, and the data is collected continuously.
The PI represents information at the system level that explains the KPI results. The PI can also be in the form of metrics that show how specific parts of a system perform. PIs do not necessarily have an impact on KPIs. The PI data can be used for planning and dimensioning. This data, typically PM counters, is collected continuously.
The Procedure level represents in-depth troubleshooting and measurement system characteristics. It involves measurements on signalling, and procedure and function levels to investigate problems detected at higher levels.
LTE L10 Optimization
- 16 - © Ericsson 2010 LZT 123 9165 R2A
The amount of data at the Procedure level is enormous and the measurements are generally user-initiated for a specific purpose and area of the network to limit the scope of the measurements. The typical source for this data is the UE Trace and the Cell Trace recording functions.
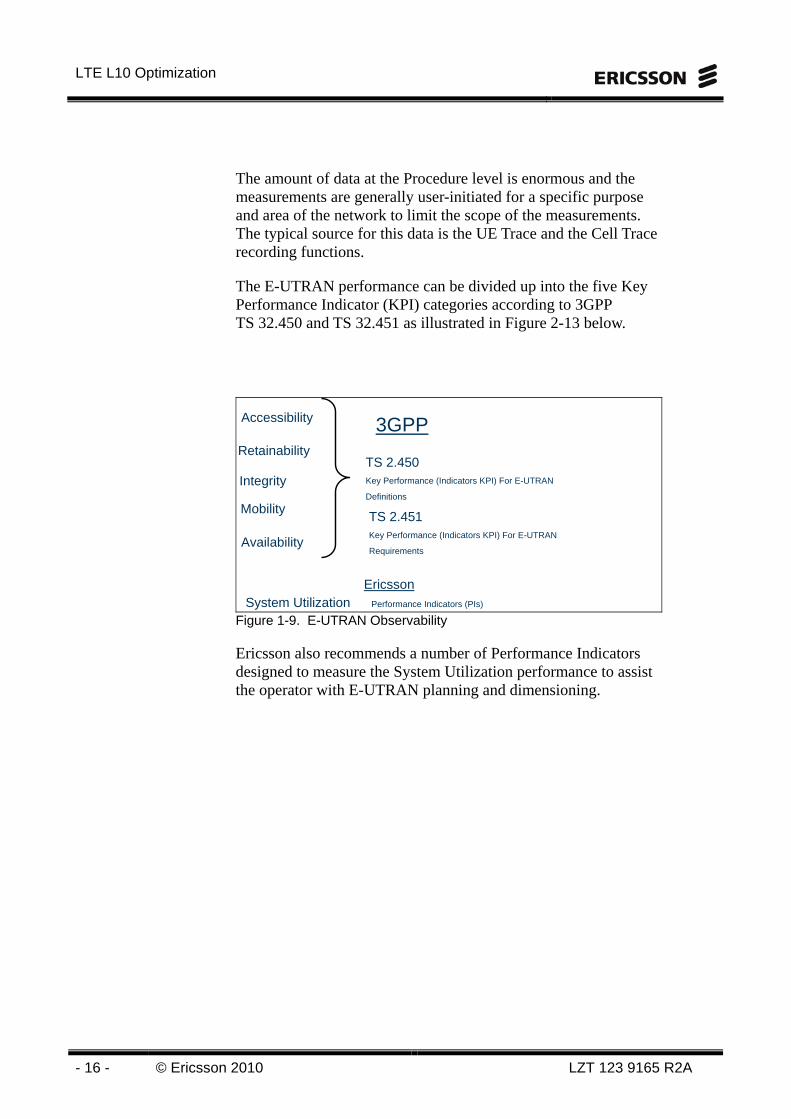
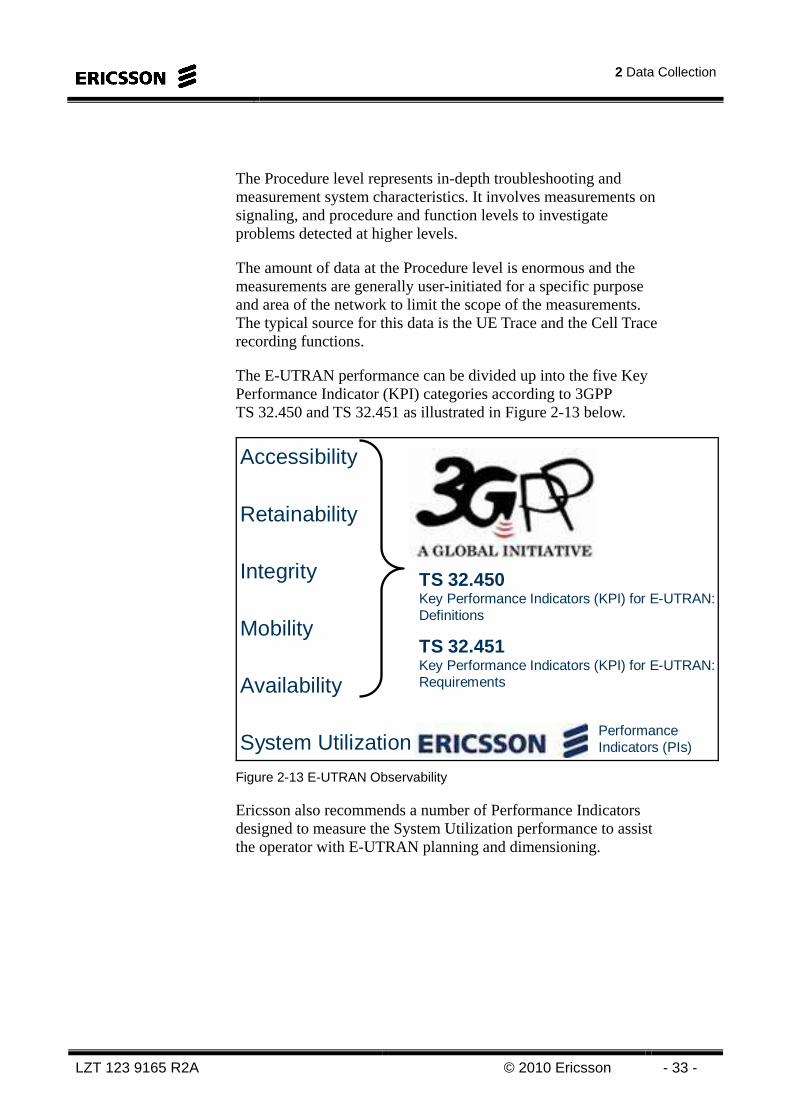
The E-UTRAN performance can be divided up into the five Key Performance Indicator (KPI) categories according to 3GPP TS 32.450 and TS 32.451 as illustrated in Figure 2-13 below.
Top right corner for field-
mark, customer or partner logotypes. See Best practice for example.
40 pt
24 pt
Text24 pt
-520 pt
Accessibility
Retainability
Integrity
Mobility
Availability
System Utilization
TS 2.450Key Performance (Indicators KPI) For E-UTRAN
Definitions
TS 2.451Key Performance (Indicators KPI) For E-UTRAN
Requirements
Performance Indicators (PIs)
Ericsson
3GPP
Figure 1-9. E-UTRAN Observability
Ericsson also recommends a number of Performance Indicators designed to measure the System Utilization performance to assist the operator with E-UTRAN planning and dimensioning.
1 Introduction
LZT 123 9165 R2A © 2010 Ericsson - 17 -
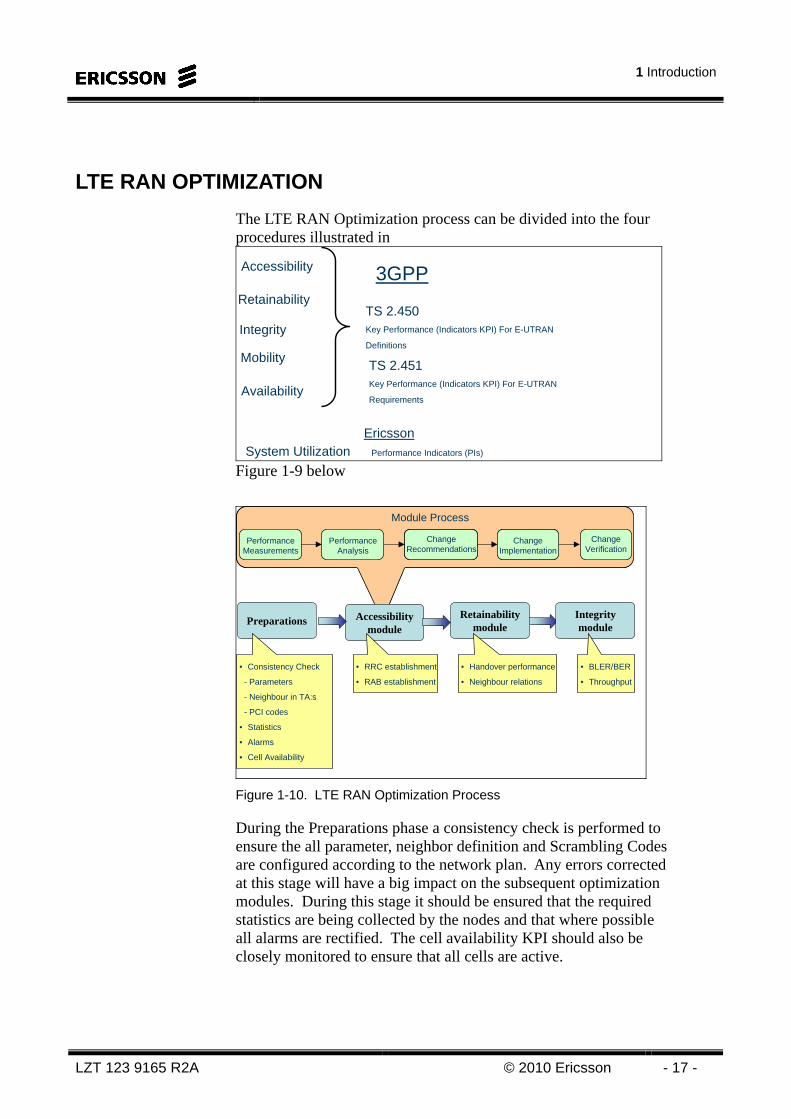
LTE RAN OPTIMIZATION
The LTE RAN Optimization process can be divided into the four procedures illustrated in
Top right corner for field-
mark, customer or partner logotypes. See Best practice for example.
40 pt
24 pt
Text24 pt
-520 pt
Accessibility
Retainability
Integrity
Mobility
Availability
System Utilization
TS 2.450Key Performance (Indicators KPI) For E-UTRAN
Definitions
TS 2.451Key Performance (Indicators KPI) For E-UTRAN
Requirements
Performance Indicators (PIs)
Ericsson
3GPP
Figure 1-9 below
Performance Measurements
Performance Analysis
Change Implementation
Change Recommendations
Change Verification
Module Process
Performance Measurements
Performance Analysis
Change Implementation
Change Recommendations
Change Verification
Module Process
Performance Measurements
Performance Analysis
Change Implementation
Change Implementation
Change Recommendations
Change Recommendations
Change Verification
Module Process
Retainabilitymodule
Accessibilitymodule
PreparationsIntegritymodule
• Consistency Check
- Parameters
- Neighbour in TA:s
- PCI codes
• Statistics
• Alarms
• Cell Availability
• RRC establishment
• RAB establishment
• Handover performance
• Neighbour relations
• BLER/BER
• Throughput
Figure 1-10. LTE RAN Optimization Process
During the Preparations phase a consistency check is performed to ensure the all parameter, neighbor definition and Scrambling Codes are configured according to the network plan. Any errors corrected at this stage will have a big impact on the subsequent optimization modules. During this stage it should be ensured that the required statistics are being collected by the nodes and that where possible all alarms are rectified. The cell availability KPI should also be closely monitored to ensure that all cells are active.
LTE L10 Optimization
- 18 - © Ericsson 2010 LZT 123 9165 R2A
Once the preparations have been completed the Optimization modules can be performed. Each module begins with Performance Measurements where the network statistics are collected. The performance is measured using the relevant KPIs and if required a drive test using TEMS Investigation or similar tool.
Based on this analysis the Engineer must come up with recommendations on how this performance can be improved. After the changes have been implemented they must be verified with network performance data.
The Accessibility module deals with the optimization of the Radio Resource Control (RRC) and E-Radio Access Bearer (E-RAB) connection processes. The result of this module should be an improvement in the accessibility success of both.
In the Retainability module the handover performance and neighbor relations are optimized to reduce dropped sessionsin the network.
The Integrity module deals with optimizing the network in terms of Block Error Rate (BLER), throughput and RTT.
SUMMARY
After this chapter the participants will be able to:
Explain the process of optimization
Describe the difference between tuning and optimization
Define network quality in terms of KPI ’s
Describe the different steps in the optimization process
After this chapter the participants will be able to:
Explain the process of optimization
Describe the difference between tuning and optimization
Define network quality in terms of KPI ’s
Describe the different steps in the optimization process
Figure 1-11. Summary
2 Data Collection
LZT 123 9165 R2A © 2010 Ericsson - 19 -
2 Data Collection
Objectives
After this chapter the participants will be able to:
Explain the data collection
Show the collection and storage of the performance statistics
Learn how to setup formulas and statistic for the RAN
After this chapter the participants will be able to:
Explain the data collection
Show the collection and storage of the performance statistics
Learn how to setup formulas and statistic for the RAN
Figure 2-1 Objectives of Chapter 2
LTE L10 Optimization
- 20 - © Ericsson 2010 LZT 123 9165 R2A
Intentionally Blank
2 Data Collection
LZT 123 9165 R2A © 2010 Ericsson - 21 -
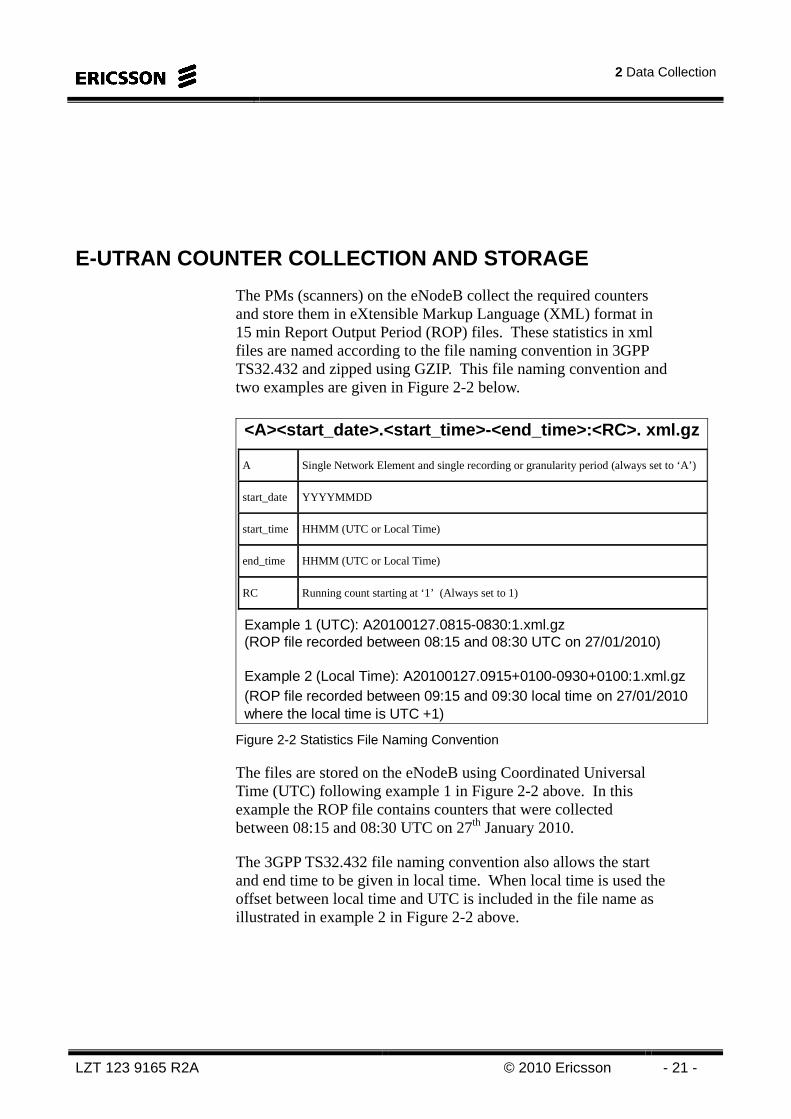
E-UTRAN COUNTER COLLECTION AND STORAGE
The PMs (scanners) on the eNodeB collect the required counters and store them in eXtensible Markup Language (XML) format in 15 min Report Output Period (ROP) files. These statistics in xml files are named according to the file naming convention in 3GPP TS32.432 and zipped using GZIP. This file naming convention and two examples are given in Figure 2-2 below.
<A><start_date>.<start_time>-<end_time>:<RC>. xml.gz
Example 1 (UTC): A20100127.0815-0830:1.xml.gz(ROP file recorded between 08:15 and 08:30 UTC on 27/01/2010)
Example 2 (Local Time): A20100127.0915+0100-0930+0100:1.xml.gz(ROP file recorded between 09:15 and 09:30 local time on 27/01/2010 where the local time is UTC +1)
A Single Network Element and single recording or granularity period (always set to ‘A’)
start_date YYYYMMDD
start_time HHMM (UTC or Local Time)
end_time HHMM (UTC or Local Time)
RC Running count starting at ‘1’ (Always set to 1)
Figure 2-2 Statistics File Naming Convention
The files are stored on the eNodeB using Coordinated Universal Time (UTC) following example 1 in Figure 2-2 above. In this example the ROP file contains counters that were collected between 08:15 and 08:30 UTC on 27th January 2010.
The 3GPP TS32.432 file naming convention also allows the start and end time to be given in local time. When local time is used the offset between local time and UTC is included in the file name as illustrated in example 2 in Figure 2-2 above.
LTE L10 Optimization
- 22 - © Ericsson 2010 LZT 123 9165 R2A
The use of Local Time in the statistics file name is subject to configuration in the OSS-RC, that is, the function can be switched on or off in the OSS-RC. The default value is on, that is, Local Time is included in the file name of the XML files that are stored on the OSS-RC.
The statistics zipped XML files are collected by the OSS-RC PMS from the eNodeB five minutes after each ROP end (5, 20, 35 and 50 minutes past the hour) using standard ftp/s-ftp services on TCP ports 20/22. This five minute delay allows the node to close the file with the data reported for the relevant ROP. The PMS will unzip and rename each file according to the convention below: A<Date>.<StartTime>-<EndTime>_<ShortNodeId>_statsfile.xml
Where: • A; denotes the single NE and single granularity. It represents the "Type" field for statistical files according to the 3GPP TS32.432.
• <Date>; specifies the date when the file has been generated, in the format YYYYMMDD.
• <Start Time>,<Stop Time>; specify start and stop time of the measurement period which the file has been created for. These time stamps can be given in UTC or Local depending on the configuration in the OSS-RC. The default is Local time in which case the offset to UTC is included.
• <ShortNodeId>; is the NE Full Distinguished Name as configured by the OSS-RC Configuration Management application. (i.e. in the format Subnetwork=,Subnetwork=,MeContext=)
The unzipped and renamed XML file is then stored in the ‘var/opt/ericsson/nms_umts_pms_seg/segment1/XML’ OSS-RC directory in a separate subdirectory for each eNodeB.
For example, in a network where the local time is UTC+1 the ‘A20100127.0815-0830:1.xml.gz’ file containing counters collected between 08:15 and 08:30 UTC on the 27th January from an EnodeB with the Full Distinguished Name (FDN) defined as: ‘SubNetwork=ONRM_ROOT_MO,SubNetwork=LTEKi,MeContext=kienb4001’ would be unzipped and renamed to: ‘A20100127.0915+0100-0930+0100_SubNetwork=ONRM_ROOT_MO,SubNetwork=LTEKi,MeContext=kienb4001_statsfile.xml’.
2 Data Collection
LZT 123 9165 R2A © 2010 Ericsson - 23 -
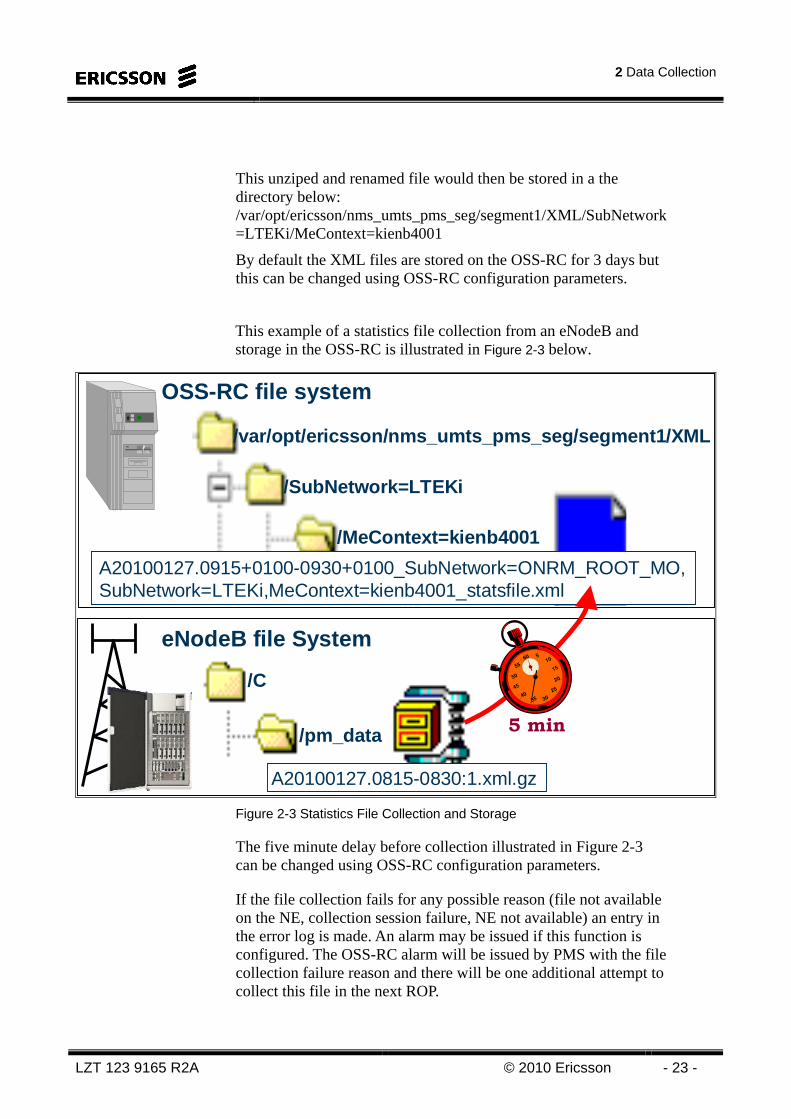
This unziped and renamed file would then be stored in a the directory below: /var/opt/ericsson/nms_umts_pms_seg/segment1/XML/SubNetwork=LTEKi/MeContext=kienb4001
By default the XML files are stored on the OSS-RC for 3 days but this can be changed using OSS-RC configuration parameters.
This example of a statistics file collection from an eNodeB and storage in the OSS-RC is illustrated in Figure 2-3 below.
RBS/SubNetwork=LTEKi
/var/opt/ericsson/nms_umts_pms_seg/segment1/XML
/MeContext=kienb4001
OSS-RC file system
/C
/pm_data
eNodeB file System
A20100127.0815-0830:1.xml.gz
A20100127.0915+0100-0930+0100_SubNetwork=ONRM_ROOT_MO, SubNetwork=LTEKi,MeContext=kienb4001_statsfile.xml
5 min
Figure 2-3 Statistics File Collection and Storage
The five minute delay before collection illustrated in Figure 2-3 can be changed using OSS-RC configuration parameters.
If the file collection fails for any possible reason (file not available on the NE, collection session failure, NE not available) an entry in the error log is made. An alarm may be issued if this function is configured. The OSS-RC alarm will be issued by PMS with the file collection failure reason and there will be one additional attempt to collect this file in the next ROP.
LTE L10 Optimization
- 24 - © Ericsson 2010 LZT 123 9165 R2A
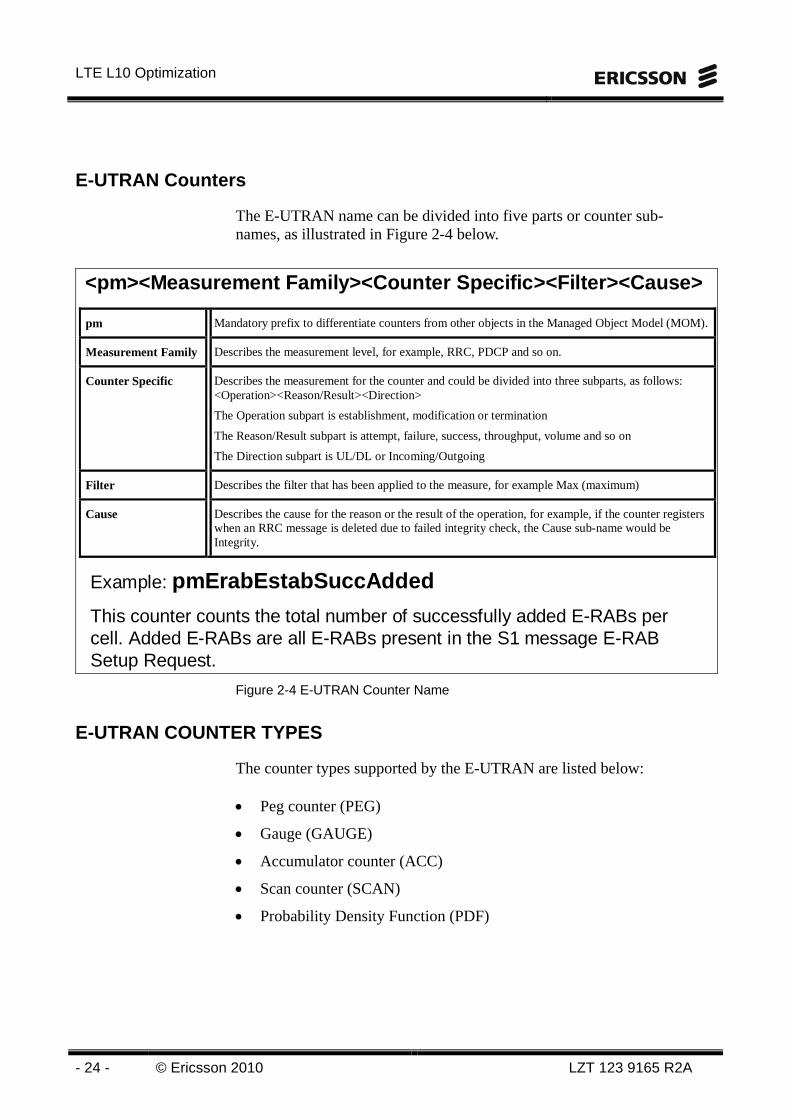
E-UTRAN Counters
The E-UTRAN name can be divided into five parts or counter sub-names, as illustrated in Figure 2-4 below.
<pm><Measurement Family><Counter Specific><Filter><Cause>
Example: pmErabEstabSuccAdded
This counter counts the total number of successfully added E-RABs per cell. Added E-RABs are all E-RABs present in the S1 message E-RAB Setup Request.
pm Mandatory prefix to differentiate counters from other objects in the Managed Object Model (MOM).
Measurement Family Describes the measurement level, for example, RRC, PDCP and so on.
Counter Specific Describes the measurement for the counter and could be divided into three subparts, as follows: <Operation><Reason/Result><Direction>
The Operation subpart is establishment, modification or termination
The Reason/Result subpart is attempt, failure, success, throughput, volume and so on
The Direction subpart is UL/DL or Incoming/Outgoing
Filter Describes the filter that has been applied to the measure, for example Max (maximum)
Cause Describes the cause for the reason or the result of the operation, for example, if the counter registers when an RRC message is deleted due to failed integrity check, the Cause sub-name would be Integrity.
Figure 2-4 E-UTRAN Counter Name
E-UTRAN COUNTER TYPES
The counter types supported by the E-UTRAN are listed below: • Peg counter (PEG)
• Gauge (GAUGE)
• Accumulator counter (ACC)
• Scan counter (SCAN)
• Probability Density Function (PDF)
2 Data Collection
LZT 123 9165 R2A © 2010 Ericsson - 25 -
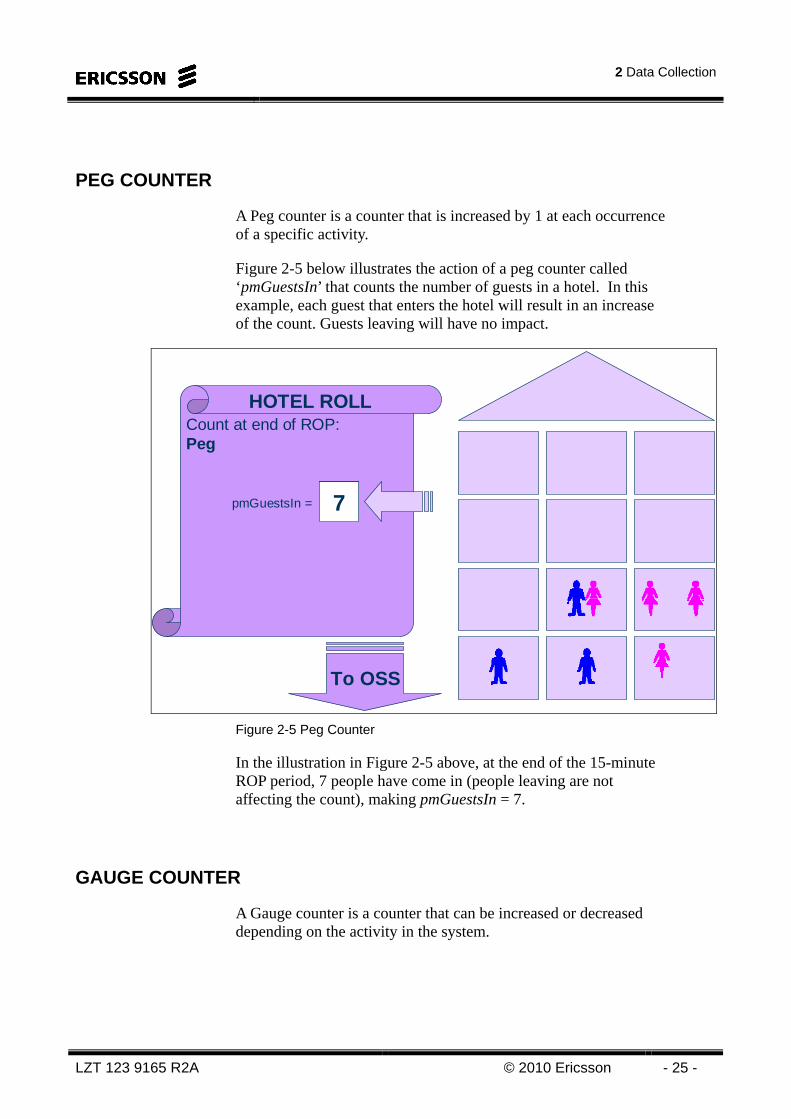
PEG COUNTER
A Peg counter is a counter that is increased by 1 at each occurrence of a specific activity.
Figure 2-5 below illustrates the action of a peg counter called ‘pmGuestsIn’ that counts the number of guests in a hotel. In this example, each guest that enters the hotel will result in an increase of the count. Guests leaving will have no impact.
Count at end of ROP:Peg
HOTEL ROLL
pmGuestsIn = 0
To OSS
1234567
Figure 2-5 Peg Counter
In the illustration in Figure 2-5 above, at the end of the 15-minute ROP period, 7 people have come in (people leaving are not affecting the count), making pmGuestsIn = 7.
GAUGE COUNTER
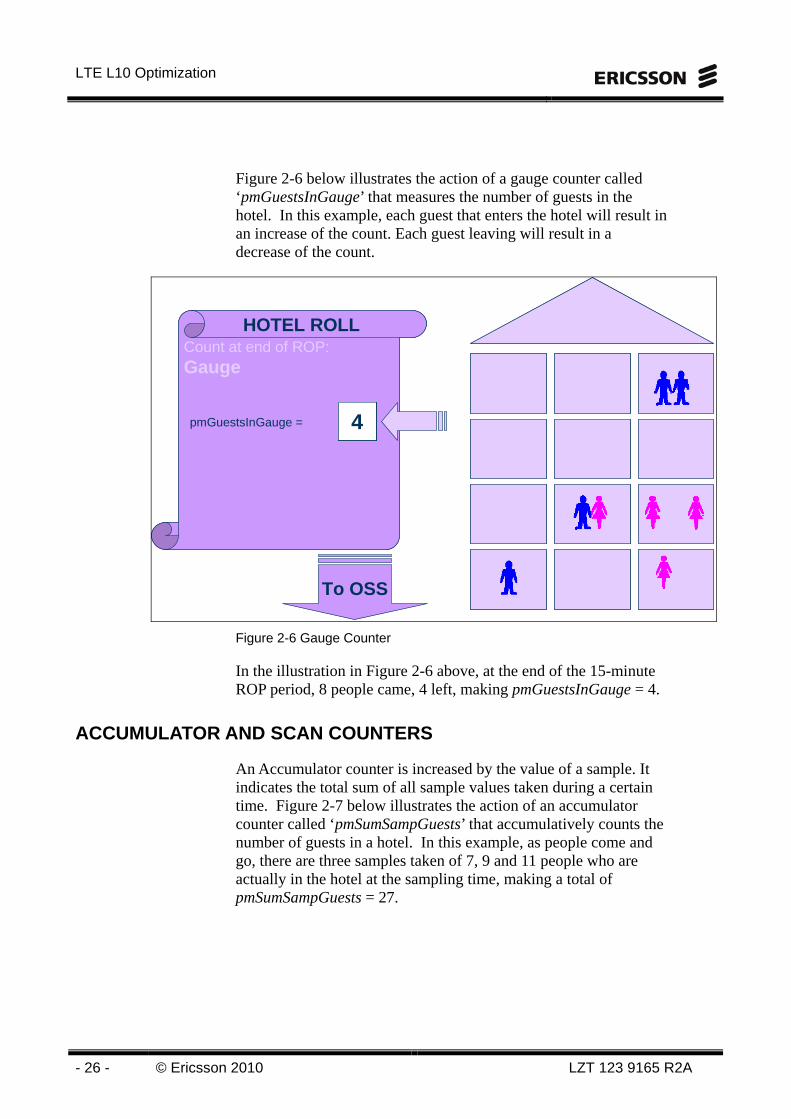
A Gauge counter is a counter that can be increased or decreased depending on the activity in the system.
LTE L10 Optimization
- 26 - © Ericsson 2010 LZT 123 9165 R2A
Figure 2-6 below illustrates the action of a gauge counter called ‘pmGuestsInGauge’ that measures the number of guests in the hotel. In this example, each guest that enters the hotel will result in an increase of the count. Each guest leaving will result in a decrease of the count.
Count at end of ROP:Gauge
HOTEL ROLLCount at end of ROP:Gauge
HOTEL ROLL
pmGuestsInGauge = 0
To OSS
1234554
Figure 2-6 Gauge Counter
In the illustration in Figure 2-6 above, at the end of the 15-minute ROP period, 8 people came, 4 left, making pmGuestsInGauge = 4.
ACCUMULATOR AND SCAN COUNTERS
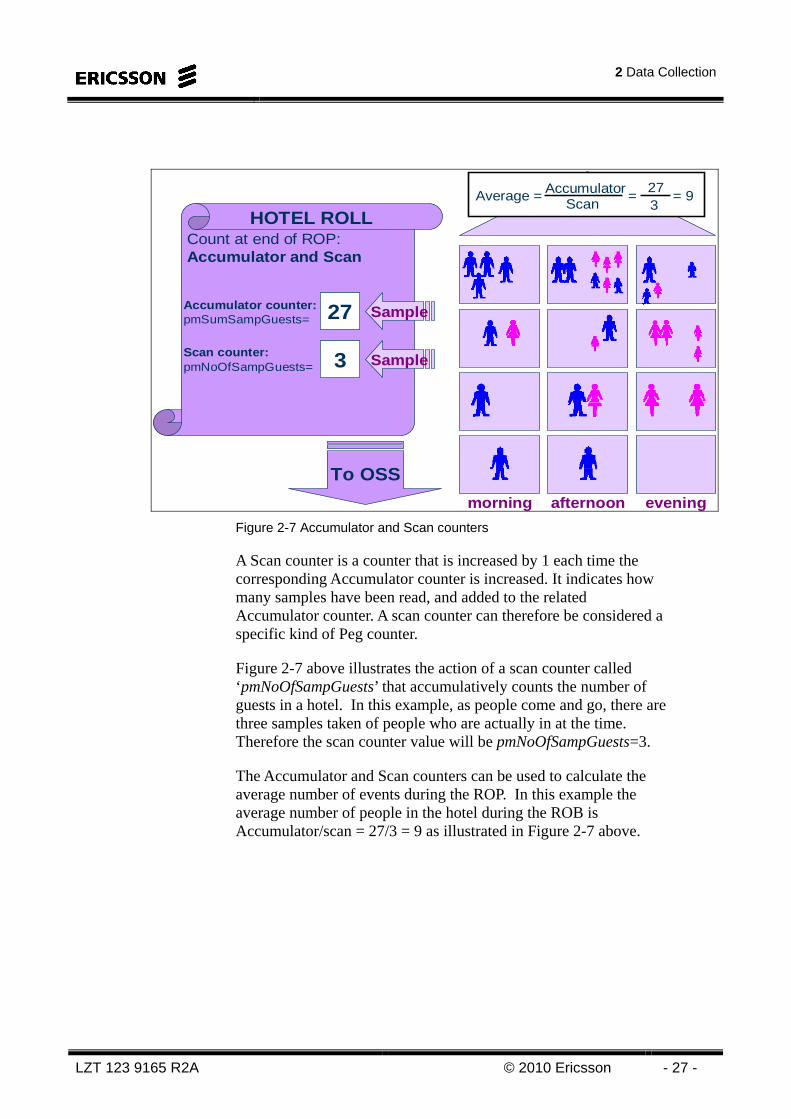
An Accumulator counter is increased by the value of a sample. It indicates the total sum of all sample values taken during a certain time. Figure 2-7 below illustrates the action of an accumulator counter called ‘pmSumSampGuests’ that accumulatively counts the number of guests in a hotel. In this example, as people come and go, there are three samples taken of 7, 9 and 11 people who are actually in the hotel at the sampling time, making a total of pmSumSampGuests = 27.
2 Data Collection
LZT 123 9165 R2A © 2010 Ericsson - 27 -
Count at end of ROP:Accumulator and Scan
HOTEL ROLL
Accumulator counter:pmSumSampGuests=
Scan counter:pmNoOfSampGuests=
0 Sample
0 Sample
71627
123
To OSS
mornin g afternoon evenin g
= = 9Average = AccumulatorScan
273
Figure 2-7 Accumulator and Scan counters
A Scan counter is a counter that is increased by 1 each time the corresponding Accumulator counter is increased. It indicates how many samples have been read, and added to the related Accumulator counter. A scan counter can therefore be considered a specific kind of Peg counter.
Figure 2-7 above illustrates the action of a scan counter called ‘pmNoOfSampGuests’ that accumulatively counts the number of guests in a hotel. In this example, as people come and go, there are three samples taken of people who are actually in at the time. Therefore the scan counter value will be pmNoOfSampGuests=3.
The Accumulator and Scan counters can be used to calculate the average number of events during the ROP. In this example the average number of people in the hotel during the ROB is Accumulator/scan = 27/3 = 9 as illustrated in Figure 2-7 above.
LTE L10 Optimization
- 28 - © Ericsson 2010 LZT 123 9165 R2A
PROBABILITY DENSITY FUNCTION (PDF)
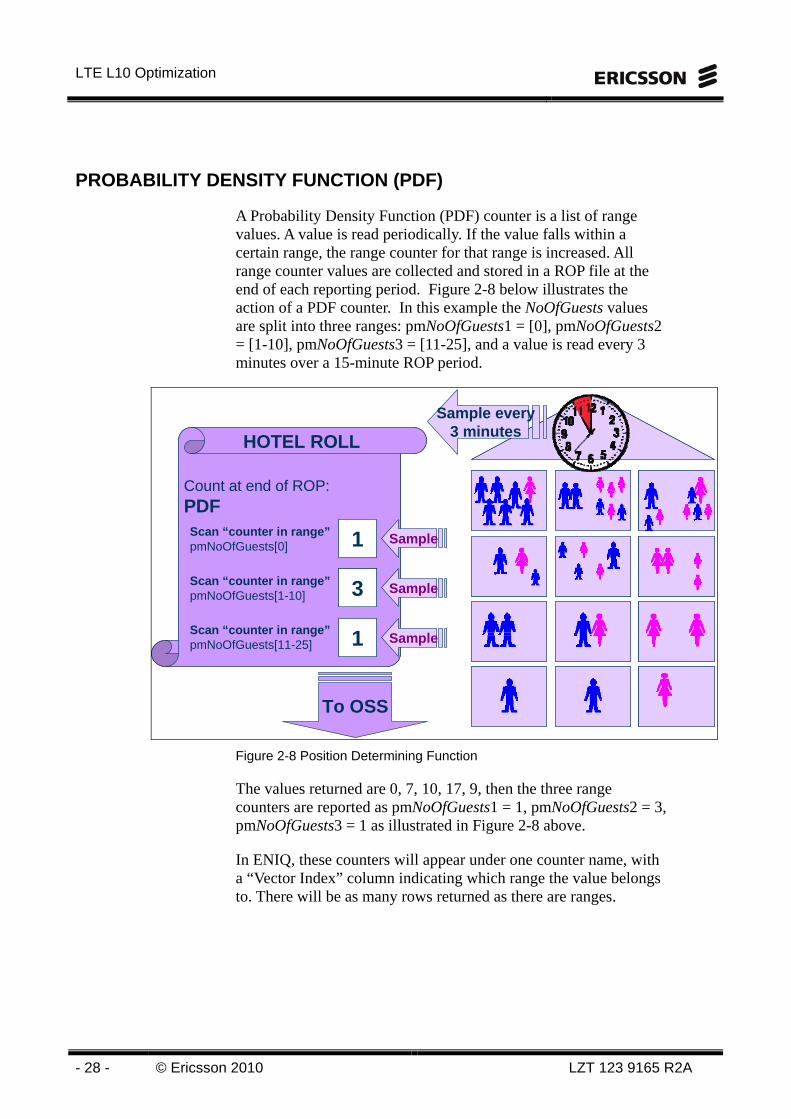
A Probability Density Function (PDF) counter is a list of range values. A value is read periodically. If the value falls within a certain range, the range counter for that range is increased. All range counter values are collected and stored in a ROP file at the end of each reporting period. Figure 2-8 below illustrates the action of a PDF counter. In this example the NoOfGuests values are split into three ranges: pmNoOfGuests1 = [0], pmNoOfGuests2 = [1-10], pmNoOfGuests3 = [11-25], and a value is read every 3 minutes over a 15-minute ROP period.
Count at end of ROP:PDF
HOTEL ROLL
Count at end of ROP:PDF
HOTEL ROLL
Scan “counter in range”pmNoOfGuests[0]
Scan “counter in range”pmNoOfGuests[1-10]
Scan “counter in range”pmNoOfGuests[11-25]
0 Sample
0 Sample
0 Sample
To OSS
1
1
123
Sample every3 minutes
Figure 2-8 Position Determining Function
The values returned are 0, 7, 10, 17, 9, then the three range counters are reported as pmNoOfGuests1 = 1, pmNoOfGuests2 = 3, pmNoOfGuests3 = 1 as illustrated in Figure 2-8 above.
In ENIQ, these counters will appear under one counter name, with a “Vector Index” column indicating which range the value belongs to. There will be as many rows returned as there are ranges.
2 Data Collection
LZT 123 9165 R2A © 2010 Ericsson - 29 -
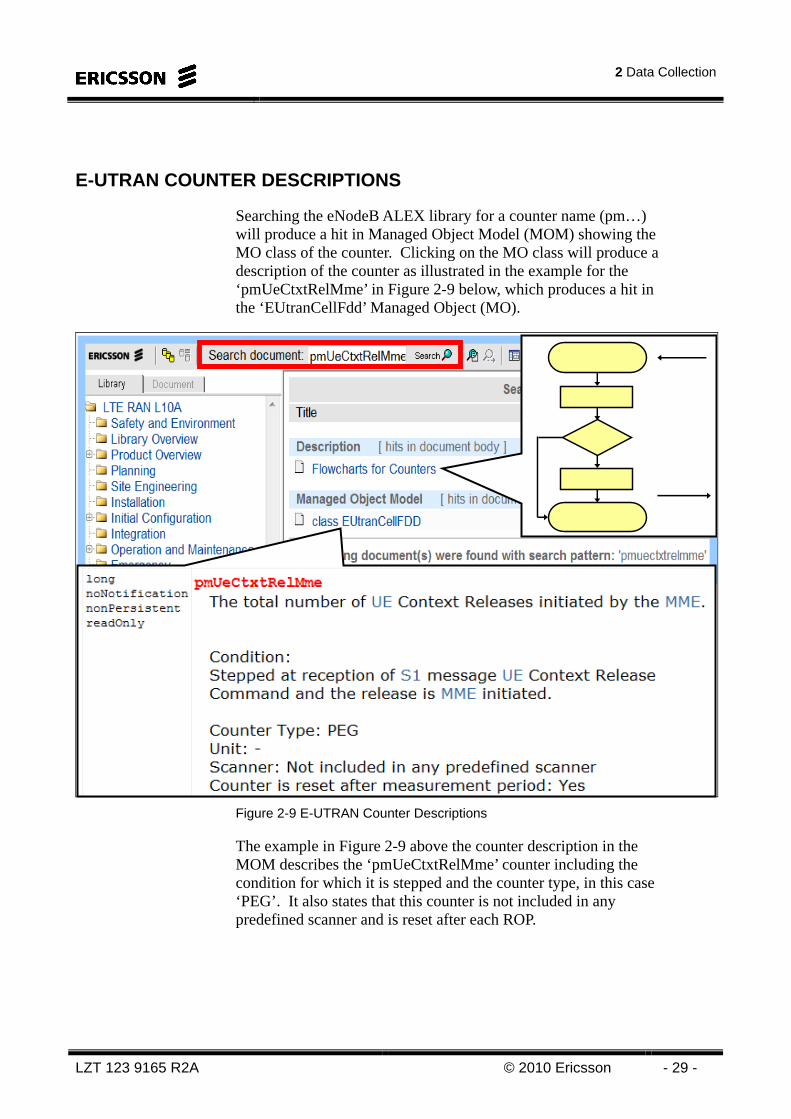
E-UTRAN COUNTER DESCRIPTIONS
Searching the eNodeB ALEX library for a counter name (pm…) will produce a hit in Managed Object Model (MOM) showing the MO class of the counter. Clicking on the MO class will produce a description of the counter as illustrated in the example for the ‘pmUeCtxtRelMme’ in Figure 2-9 below, which produces a hit in the ‘EUtranCellFdd’ Managed Object (MO).
Figure 2-9 E-UTRAN Counter Descriptions
The example in Figure 2-9 above the counter description in the MOM describes the ‘pmUeCtxtRelMme’ counter including the condition for which it is stepped and the counter type, in this case ‘PEG’. It also states that this counter is not included in any predefined scanner and is reset after each ROP.
LTE L10 Optimization
- 30 - © Ericsson 2010 LZT 123 9165 R2A
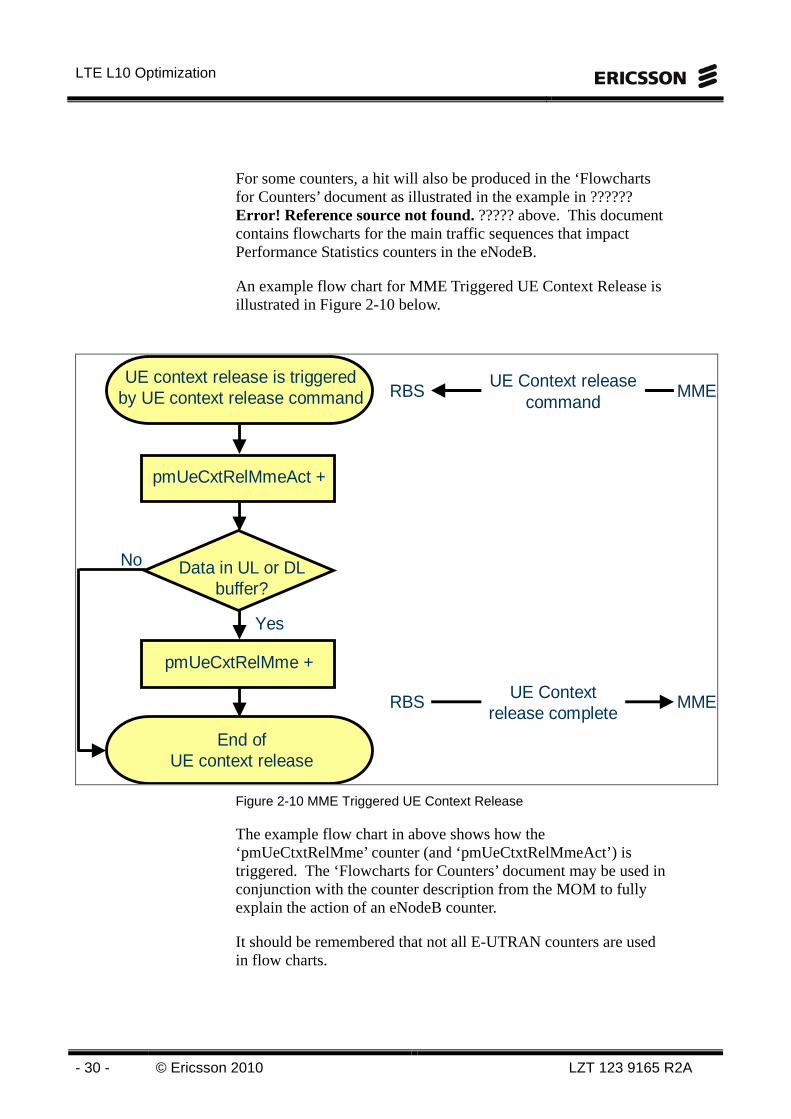
For some counters, a hit will also be produced in the ‘Flowcharts for Counters’ document as illustrated in the example in ?????? Error! Reference source not found. ????? above. This document contains flowcharts for the main traffic sequences that impact Performance Statistics counters in the eNodeB.
An example flow chart for MME Triggered UE Context Release is illustrated in Figure 2-10 below.
UE context release is triggered by UE context release command
End ofUE context release
Data in UL or DL buffer?
pmUeCxtRelMmeAct +
pmUeCxtRelMme +
No
RBS MMEUE Context release
command
Yes
RBS MMEUE Context release complete
Figure 2-10 MME Triggered UE Context Release
The example flow chart in above shows how the ‘pmUeCtxtRelMme’ counter (and ‘pmUeCtxtRelMmeAct’) is triggered. The ‘Flowcharts for Counters’ document may be used in conjunction with the counter description from the MOM to fully explain the action of an eNodeB counter.
It should be remembered that not all E-UTRAN counters are used in flow charts.
2 Data Collection
LZT 123 9165 R2A © 2010 Ericsson - 31 -
COUNTERS IN XML FILES
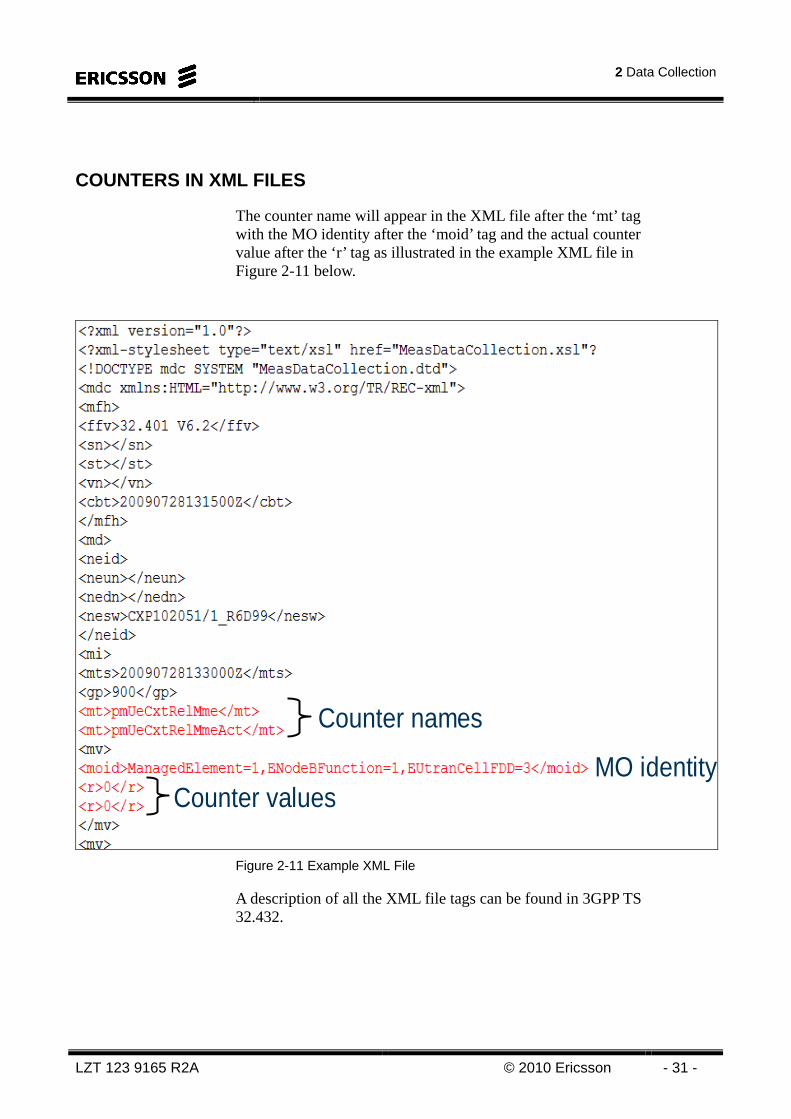
The counter name will appear in the XML file after the ‘mt’ tag with the MO identity after the ‘moid’ tag and the actual counter value after the ‘r’ tag as illustrated in the example XML file in Figure 2-11 below.
Counter names
MO identityCounter values
Figure 2-11 Example XML File
A description of all the XML file tags can be found in 3GPP TS 32.432.
LTE L10 Optimization
- 32 - © Ericsson 2010 LZT 123 9165 R2A
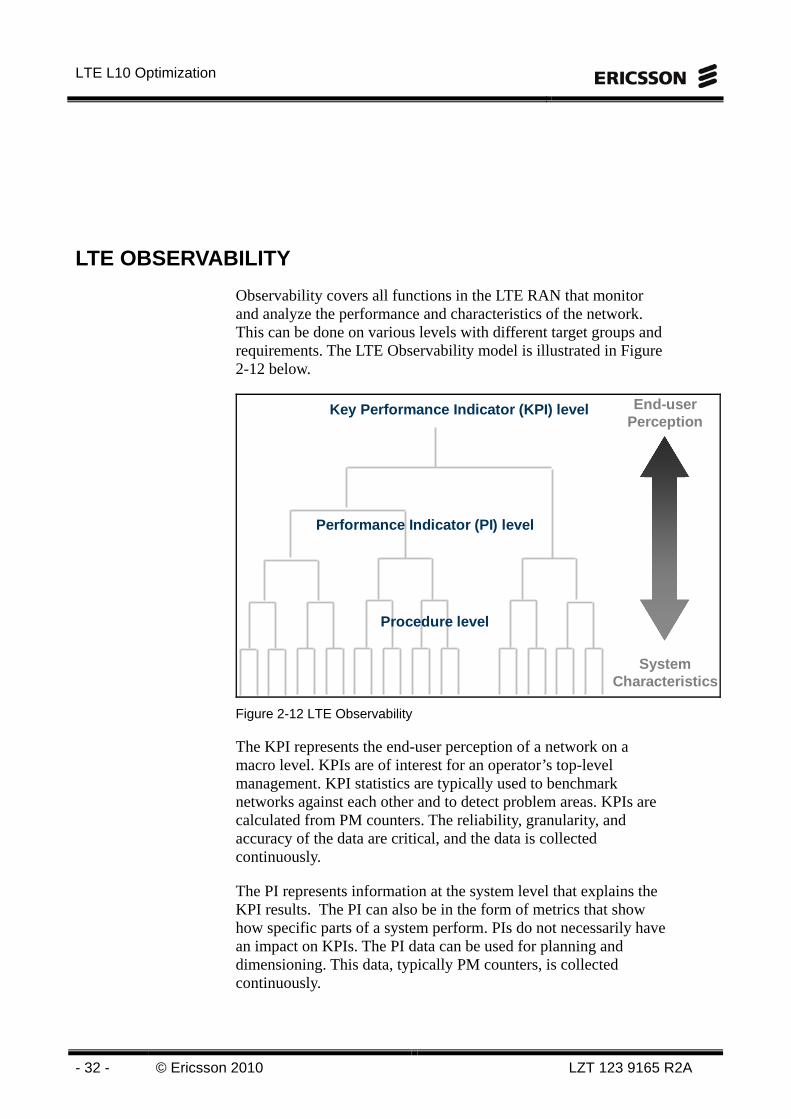
LTE OBSERVABILITY
Observability covers all functions in the LTE RAN that monitor and analyze the performance and characteristics of the network. This can be done on various levels with different target groups and requirements. The LTE Observability model is illustrated in Figure 2-12 below.
Key Performance Indicator (KPI) level
Performance Indicator (PI) level
Procedure level
SystemCharacteristics
End-userPerception
Figure 2-12 LTE Observability
The KPI represents the end-user perception of a network on a macro level. KPIs are of interest for an operator’s top-level management. KPI statistics are typically used to benchmark networks against each other and to detect problem areas. KPIs are calculated from PM counters. The reliability, granularity, and accuracy of the data are critical, and the data is collected continuously.
The PI represents information at the system level that explains the KPI results. The PI can also be in the form of metrics that show how specific parts of a system perform. PIs do not necessarily have an impact on KPIs. The PI data can be used for planning and dimensioning. This data, typically PM counters, is collected continuously.
2 Data Collection
LZT 123 9165 R2A © 2010 Ericsson - 33 -
The Procedure level represents in-depth troubleshooting and measurement system characteristics. It involves measurements on signaling, and procedure and function levels to investigate problems detected at higher levels.
The amount of data at the Procedure level is enormous and the measurements are generally user-initiated for a specific purpose and area of the network to limit the scope of the measurements. The typical source for this data is the UE Trace and the Cell Trace recording functions.
The E-UTRAN performance can be divided up into the five Key Performance Indicator (KPI) categories according to 3GPP TS 32.450 and TS 32.451 as illustrated in Figure 2-13 below.
Accessibility
Retainability
Integrity
Mobility
Availability
System Utilization
TS 32.450 Key Performance Indicators (KPI) for E-UTRAN:Definitions
TS 32.451 Key Performance Indicators (KPI) for E-UTRAN:Requirements
Performance Indicators (PIs)
Figure 2-13 E-UTRAN Observability
Ericsson also recommends a number of Performance Indicators designed to measure the System Utilization performance to assist the operator with E-UTRAN planning and dimensioning.
LTE L10 Optimization
- 34 - © Ericsson 2010 LZT 123 9165 R2A
SUMMARY
The participants should now be able to:
Show the collection and storage of the performance statistics
Learn how to setup formulas and statistic for the RAN used in the analysis of counters
Figure 2-14. Summary
.
3 Traffic
LZT 123 9165 R2A © 2010 Ericsson - 35 -
3 Traffic
Objectives After this chapter the participants will be able to:Perform a Throughput and Busy hour calculationCalculate traffic volume over the dayShow the different rates available in the Ran used in the analysis of counters
Figure 3-1 Objectives of Chapter 3
LTE L10 Optimization
- 36 - © Ericsson 2010 LZT 123 9165 R2A
INTRODUCTION
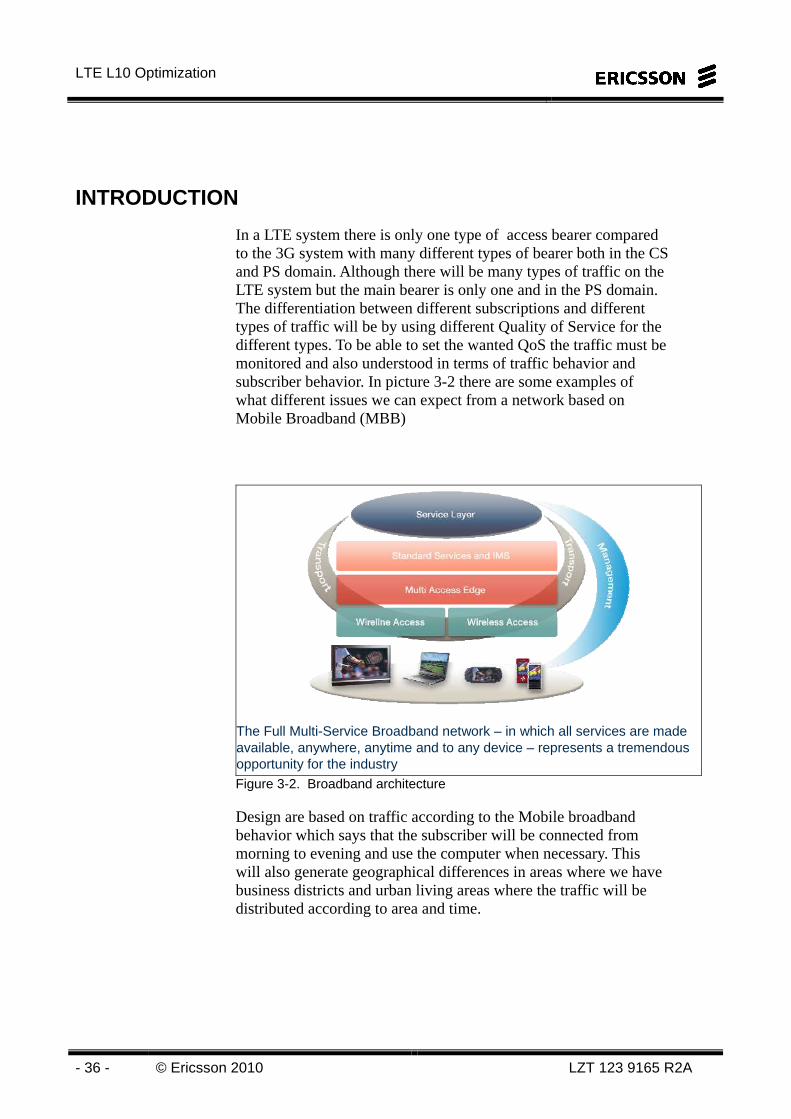
In a LTE system there is only one type of access bearer compared to the 3G system with many different types of bearer both in the CS and PS domain. Although there will be many types of traffic on the LTE system but the main bearer is only one and in the PS domain. The differentiation between different subscriptions and different types of traffic will be by using different Quality of Service for the different types. To be able to set the wanted QoS the traffic must be monitored and also understood in terms of traffic behavior and subscriber behavior. In picture 3-2 there are some examples of what different issues we can expect from a network based on Mobile Broadband (MBB)
The Full Multi-Service Broadband network – in which all services are made available, anywhere, anytime and to any device – represents a tremendous opportunity for the industryFigure 3-2. Broadband architecture
Design are based on traffic according to the Mobile broadband behavior which says that the subscriber will be connected from morning to evening and use the computer when necessary. This will also generate geographical differences in areas where we have business districts and urban living areas where the traffic will be distributed according to area and time.
3 Traffic
LZT 123 9165 R2A © 2010 Ericsson - 37 -
The services we can expect are divided into groups with different traffic behavior and demands. These demand have to be the basis of the QoS concept for traffic. The other part of the matrix is the subscription we want to sell. We are not going to go through the QoS since this is a part of another course , but still it is needed to understand the behavior of the traffic towards the system to be able to optimize the performance. To understand the traffic we also must understand the behavior of the different services and try to see what traffic we can expect from the different services. Different services will have different demand on the bandwidth.
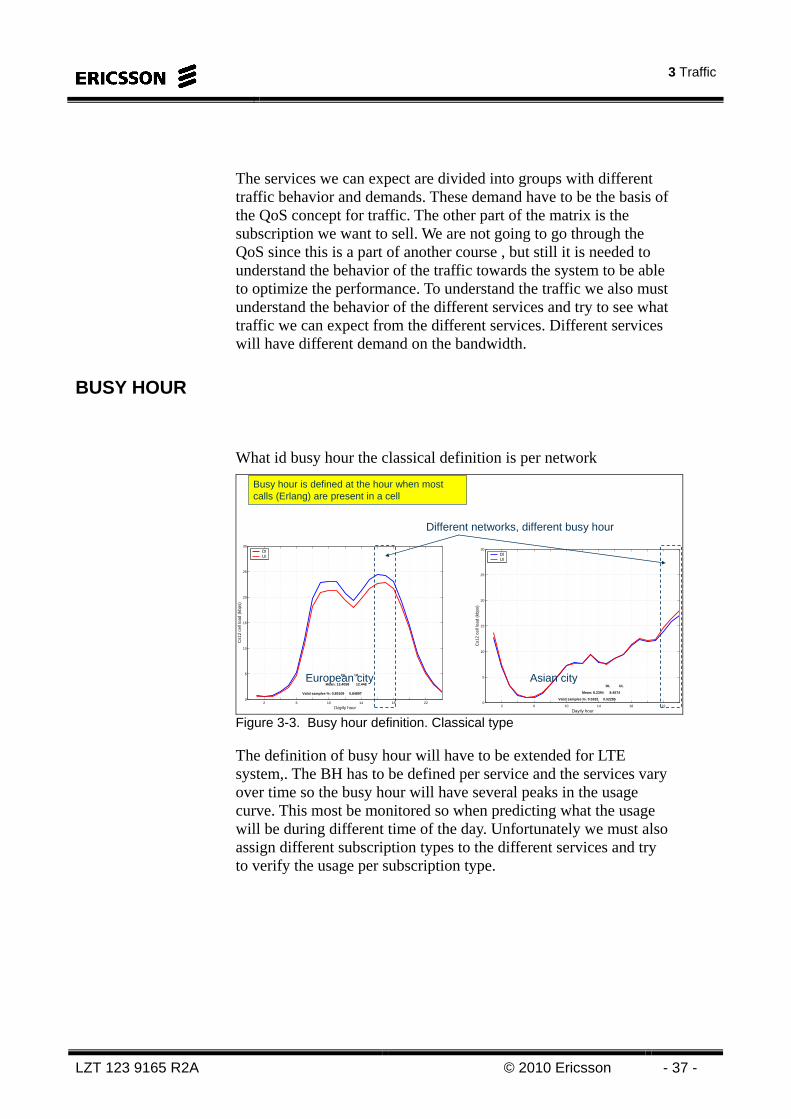
BUSY HOUR
What id busy hour the classical definition is per network
2 6 10 14 18 220
5
10
15
20
25
30
Cs1
2 ce
ll lo
ad (
kbps
)
Dayily hour
DL UL
Mean: 13.4058 12.448
Valid samples %: 0.85109 0.84897
DlUl
2 6 10 14 18 220
5
10
15
20
25
30
Cs1
2 ce
ll lo
ad (
kbps
)
Dayily hour
DL UL
Mean: 8.2394 8.4574
Valid samples %: 0.5332 0.52285
DlUl
European city Asian city
Busy hour is defined at the hour when most calls (Erlang) are present in a cell
Different networks, different busy hour
Figure 3-3. Busy hour definition. Classical type
The definition of busy hour will have to be extended for LTE system,. The BH has to be defined per service and the services vary over time so the busy hour will have several peaks in the usage curve. This most be monitored so when predicting what the usage will be during different time of the day. Unfortunately we must also assign different subscription types to the different services and try to verify the usage per subscription type.
LTE L10 Optimization
- 38 - © Ericsson 2010 LZT 123 9165 R2A
.
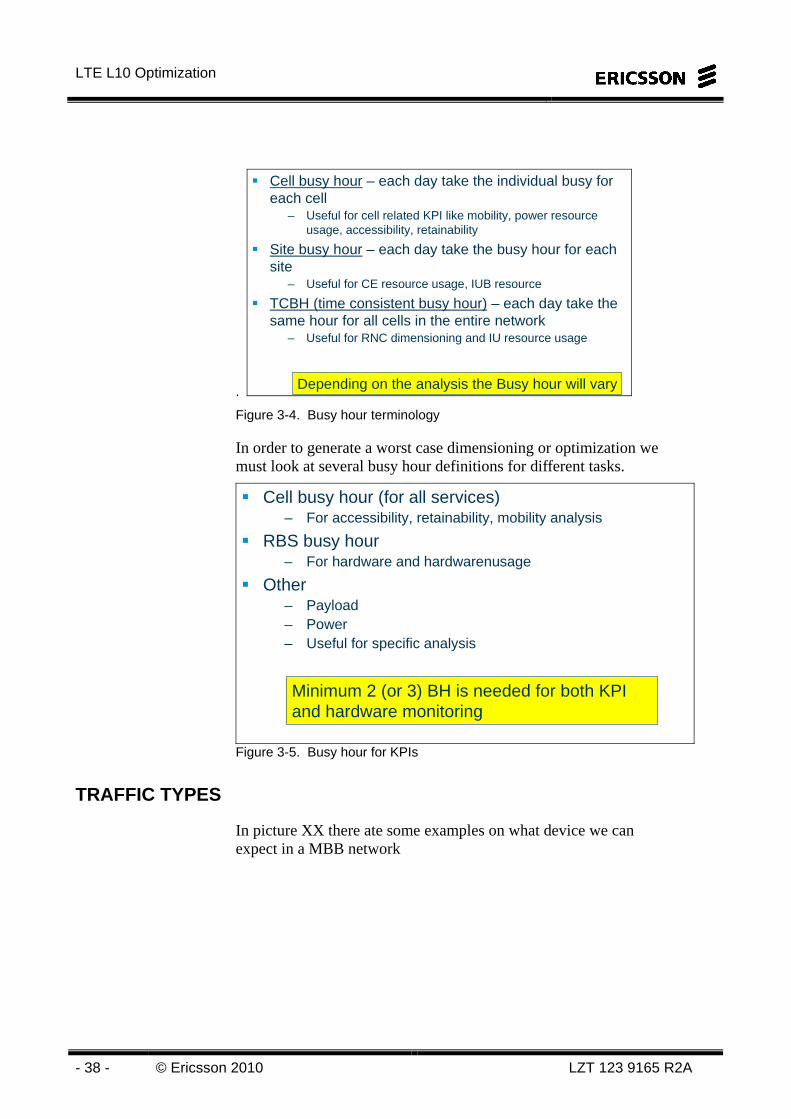
Cell busy hour – each day take the individual busy for each cell
– Useful for cell related KPI like mobility, power resource usage, accessibility, retainability
Site busy hour – each day take the busy hour for each site
– Useful for CE resource usage, IUB resource
TCBH (time consistent busy hour) – each day take the same hour for all cells in the entire network
– Useful for RNC dimensioning and IU resource usage
Depending on the analysis the Busy hour will vary
Figure 3-4. Busy hour terminology
In order to generate a worst case dimensioning or optimization we must look at several busy hour definitions for different tasks.
Cell busy hour (for all services)– For accessibility, retainability, mobility analysis
RBS busy hour– For hardware and hardwarenusage
Other– Payload– Power– Useful for specific analysis
Minimum 2 (or 3) BH is needed for both KPI and hardware monitoring
Figure 3-5. Busy hour for KPIs
TRAFFIC TYPES
In picture XX there ate some examples on what device we can expect in a MBB network

3 Traffic
LZT 123 9165 R2A © 2010 Ericsson - 39 -
.
Fixed Telephony
MobileTelephony
Fixed Broadband
Smartphones
Connecteddevices
NotebooksNetbooks
Figure 3-6. Mobile Broadband. From households to individuals and devices
The most demanding traffic will be streaming TV, video or music. This services will demand high QoS to maintain the streaming properties. How high this demands will be is dependent on the quality demand but also on the buffer size on service layer. The HARQ will not have such a great impact on the delay as RTT from higher layer. The traffic pattern is very simple large and continuous in one direction and rather small in the other direction. What service that will use streaming properties will vary.
Web browsing has other demands. This service will be used all over the day and is normal with traffic in both ways. A typical pattern is that the request traffic is much smaller than the respond traffic. For example a web browsing service is used when the user is requesting a page from the web and under the reading time of that page there will be now traffic.
Another example could be for ex another web based service like Facebook where the user subscribes on updates made by your friends. To get this update there are a subscriber base which records changes and sends it down to the user, this will give another traffic profile compared to what we see as a regular web service.
A third example could be youtube which are very close to a streaming service i.e. it can be a streaming service if the UE can handle secondary PDP contexts, the this will generate a high demand on the radio interface QoS during the download, if it doesn’t support secondary PDP contexts it will still generate a rather high demand on bandwidth.
LTE L10 Optimization
- 40 - © Ericsson 2010 LZT 123 9165 R2A
A fourth example could be E-mail which has a very low demand in terms of QoS. This is traffic that we don’t know when to arrive and that gives a lot of freedom for the operator. E-mail will also be coming all day so there is no specific time of the day that can be seen as e-mail time, and probably the same traffic in different areas independent of business or resident area.
TRAFFIC MIX
Here it becomes just as hard to decide what to use . This will be dependent on geographical as well as population and demographical types. The best is of course if we can get the traffic mixes that are used in HSPA and /or for the fixed network if such data are available,
SUMMARY
After this chapter the participants will be able to:Perform a Throughput and Busy hour calculationCalculate traffic volume over the dayShow the different rates available in the Ran used in the analysis of counters
Figure 3-7. Objectives of chapter 3
4 Service Accessibility Optimization
LZT 123 9165 R2A © 2010 Ericsson - 41 -
4 Service Accessibility Optimization
Objectives After this chapter the participants will be able to:
Perform Accessibility data analysis according to collected data
Describe formulas for accessibility accord ing to the defined KPI’s and available counters
Perform data analysis of counter statistics
Porpose changes to enhance accessibility
Figure 4-1 Objectives of Chapter 4

LTE L10 Optimization
- 42 - © Ericsson 2010 LZT 123 9165 R2A
Intentionally Blank
4 Service Accessibility Optimization
LZT 123 9165 R2A © 2010 Ericsson - 43 -
INTRODUCTION
What is accessibility and what can we optimize? These are the questions this chapter will try to answer.
Accessibility is defined as: The ability of a user to obtain a requested service from the system.
First we need to define “service”. Service pertains to many different issues depending on where we are probing the system. The definition mostly used normally addresses the E2E services, but here we are probing the RAN interface so we must use another definition: the E-RAB. There is only one E_RAB in LTE, compared to very many in 3G. However, the E-RAB can be used in many different ways and different E2E services will be capable of occupying the E-RAB differently, depending on the expected QoS for the service.
There is also a problem with the definition of time or the duration of a session. From 2G, we very often consider a session/connection as the time we are connected to the system while using it; see CS call, for example. This became a little more tricky when it came to 3G were a call could be either CS or PS. The call definition is valid for CS but for PS there will be a more dubious definition of a call. The basic idea in LTE is that the UE should always be connected so there will be one session that will be kept for a long time. Furthermore, under that session, there will be many data exchanges and also many periods in idle mode (normal usage, for example WWW).
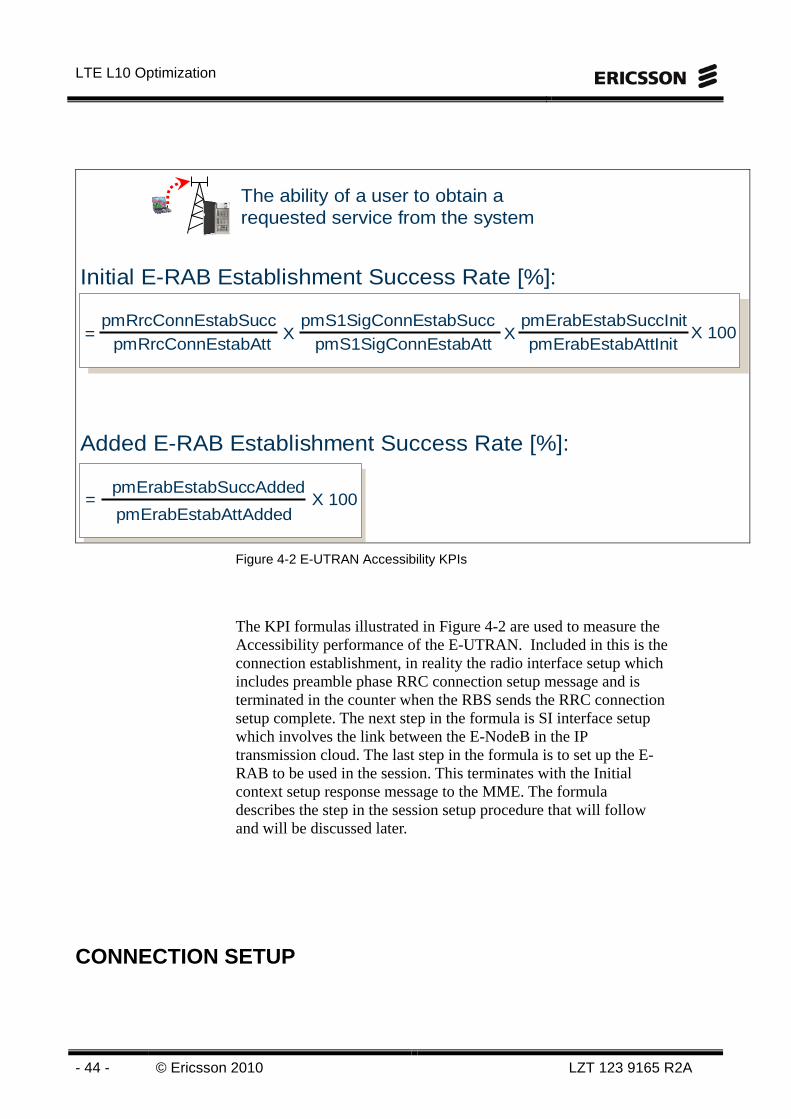
E-UTRAN ACCESSIBILITY KPIS
The RRC, S1 and E-RAB connection establishment counters are used to create the E-UTRAN Accessibility KPI formulas illustrated in Figure 4-2 below.
LTE L10 Optimization
- 44 - © Ericsson 2010 LZT 123 9165 R2A
Initial E-RAB Establishment Success Rate [%]:
Added E-RAB Establishment Success Rate [%]:
The ability of a user to obtain a requested service from the system
pmErabEstabAttInitpmErabEstabSuccInitpmS1SigConnEstabSucc
pmRrcConnEstabAttpmRrcConnEstabSucc
= X XpmS1SigConnEstabAtt
X 100
pmErabEstabAttAdded
pmErabEstabSuccAdded= X 100
Figure 4-2 E-UTRAN Accessibility KPIs
The KPI formulas illustrated in Figure 4-2 are used to measure the Accessibility performance of the E-UTRAN. Included in this is the connection establishment, in reality the radio interface setup which includes preamble phase RRC connection setup message and is terminated in the counter when the RBS sends the RRC connection setup complete. The next step in the formula is SI interface setup which involves the link between the E-NodeB in the IP transmission cloud. The last step in the formula is to set up the E-RAB to be used in the session. This terminates with the Initial context setup response message to the MME. The formula describes the step in the session setup procedure that will follow and will be discussed later.
CONNECTION SETUP
4 Service Accessibility Optimization
LZT 123 9165 R2A © 2010 Ericsson - 45 -
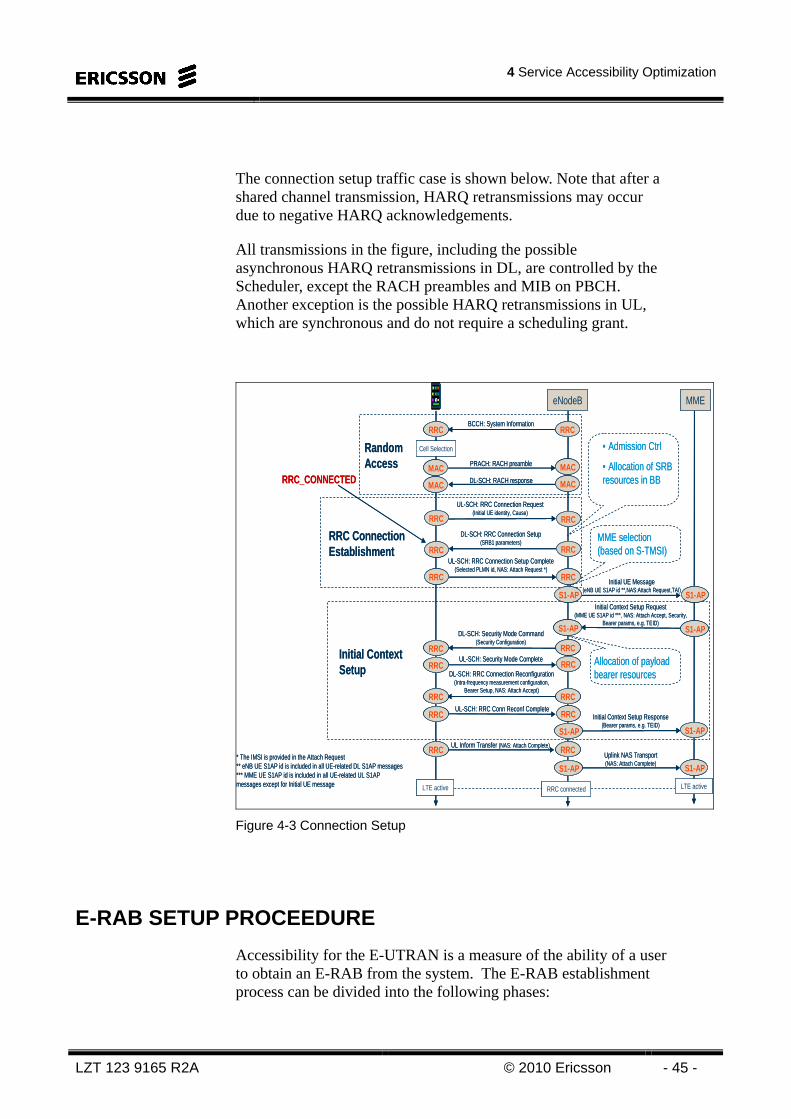
The connection setup traffic case is shown below. Note that after a shared channel transmission, HARQ retransmissions may occur due to negative HARQ acknowledgements.
All transmissions in the figure, including the possible asynchronous HARQ retransmissions in DL, are controlled by the Scheduler, except the RACH preambles and MIB on PBCH. Another exception is the possible HARQ retransmissions in UL, which are synchronous and do not require a scheduling grant.
eNodeB MME
BCCH: System Information
UL-SCH: RRC Connection Request(Initial UE identity, Cause)
Cell Selection
DL-SCH: RRC Connection Setup(SRB1 parameters)
Initial UE Message(eNB UE S1AP id **,NAS:Attach Request,TAI)
Initial Context Setup Request(MME UE S1AP id ***, NAS: Attach Accept, Security,
Bearer params, e.g. TEID)
DL-SCH: Security Mode Command(Security Configuration)
UL-SCH: Security Mode Complete
Initial Context Setup Response(Bearer params, e.g. TEID)
UL-SCH: RRC Connection Setup Complete(Selected PLMN id, NAS: Attach Request *)
PRACH: RACH preamble
DL-SCH: RACH response
DL-SCH: RRC Connection Reconfiguration(Intra-frequency measurement configuration,
Bearer Setup, NAS: Attach Accept)
UL-SCH: RRC Conn Reconf Complete
* The IMSI is provided in the Attach Request** eNB UE S1AP id is included in all UE-related DL S1AP messages*** MME UE S1AP id is included in all UE-related UL S1AP messages except for Initial UE message
Uplink NAS Transport(NAS: Attach Complete)
UL Inform Transfer (NAS: Attach Complete)
LTE active LTE activeRRC connected
Random Access
RRC Connection Establishment
Initial Context Setup
• Admission Ctrl
• Allocation of SRB resources in BB
MME selection (based on S-TMSI)
Allocation of payload bearer resources
RRC_CONNECTED MAC
S1-AP
RRC RRC
MAC
MAC MAC
RRC RRC
RRC RRC
RRC RRC
S1-AP
S1-AP S1-AP
RRCRRC
RRC RRC
RRCRRC
RRC RRC
S1-AP S1-AP
RRC RRC
S1-APS1-AP
eNodeB MME
BCCH: System Information
UL-SCH: RRC Connection Request(Initial UE identity, Cause)
Cell Selection
DL-SCH: RRC Connection Setup(SRB1 parameters)
Initial UE Message(eNB UE S1AP id **,NAS:Attach Request,TAI)
Initial Context Setup Request(MME UE S1AP id ***, NAS: Attach Accept, Security,
Bearer params, e.g. TEID)
DL-SCH: Security Mode Command(Security Configuration)
UL-SCH: Security Mode Complete
Initial Context Setup Response(Bearer params, e.g. TEID)
UL-SCH: RRC Connection Setup Complete(Selected PLMN id, NAS: Attach Request *)
PRACH: RACH preamble
DL-SCH: RACH response
DL-SCH: RRC Connection Reconfiguration(Intra-frequency measurement configuration,
Bearer Setup, NAS: Attach Accept)
UL-SCH: RRC Conn Reconf Complete
* The IMSI is provided in the Attach Request** eNB UE S1AP id is included in all UE-related DL S1AP messages*** MME UE S1AP id is included in all UE-related UL S1AP messages except for Initial UE message
Uplink NAS Transport(NAS: Attach Complete)
UL Inform Transfer (NAS: Attach Complete)
LTE active LTE activeRRC connected
Random Access
RRC Connection Establishment
Initial Context Setup
• Admission Ctrl
• Allocation of SRB resources in BB
MME selection (based on S-TMSI)
Allocation of payload bearer resources
RRC_CONNECTED MACMAC
S1-APS1-AP
RRCRRC RRCRRC
MACMAC
MACMAC MACMAC
RRCRRC RRCRRC
RRCRRC RRCRRC
RRCRRC RRCRRC
S1-APS1-AP
S1-APS1-AP S1-APS1-AP
RRCRRCRRCRRC
RRCRRC RRCRRC
RRCRRCRRCRRC
RRCRRC RRCRRC
S1-APS1-AP S1-APS1-AP
RRCRRC RRCRRC
S1-APS1-APS1-APS1-AP
Figure 4-3 Connection Setup
E-RAB SETUP PROCEEDURE
Accessibility for the E-UTRAN is a measure of the ability of a user to obtain an E-RAB from the system. The E-RAB establishment process can be divided into the following phases:
LTE L10 Optimization
- 46 - © Ericsson 2010 LZT 123 9165 R2A
• RRC Connection Establishment
• S1 Signaling Connection Establishment
• Initial E-RAB Establishment or E-RAB Addition
RRC CONNECTION ESTABLISHMENT
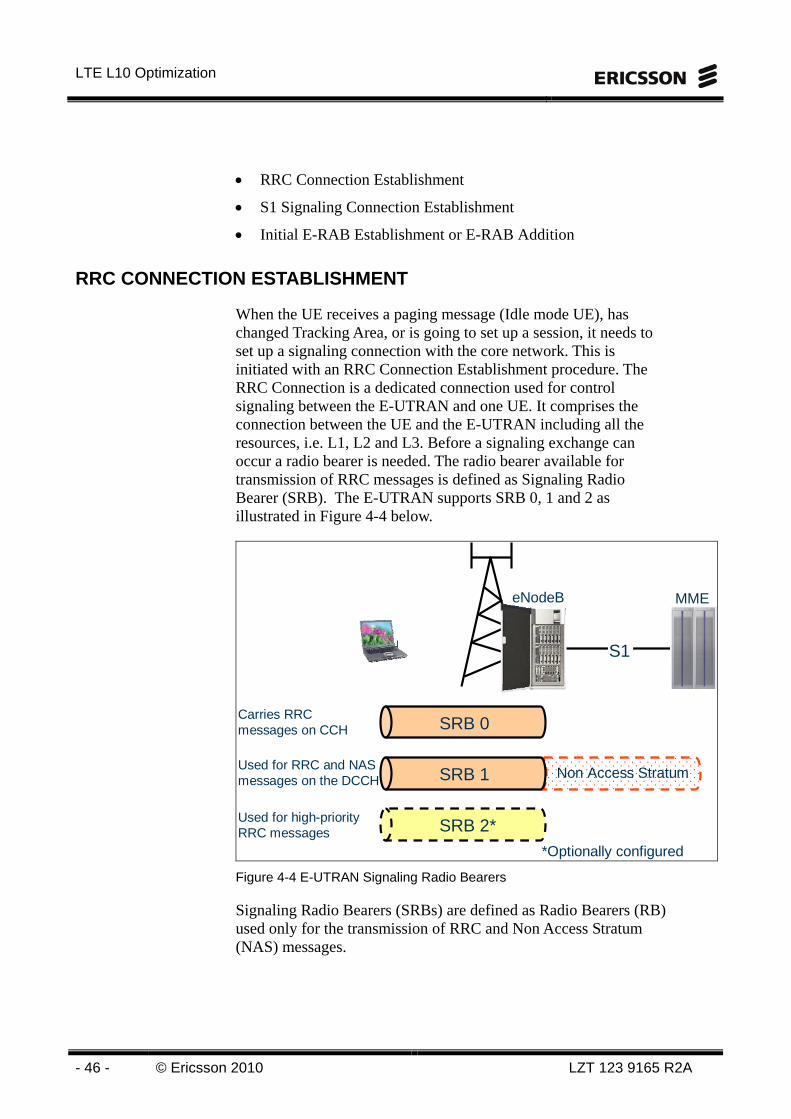
When the UE receives a paging message (Idle mode UE), has changed Tracking Area, or is going to set up a session, it needs to set up a signaling connection with the core network. This is initiated with an RRC Connection Establishment procedure. The RRC Connection is a dedicated connection used for control signaling between the E-UTRAN and one UE. It comprises the connection between the UE and the E-UTRAN including all the resources, i.e. L1, L2 and L3. Before a signaling exchange can occur a radio bearer is needed. The radio bearer available for transmission of RRC messages is defined as Signaling Radio Bearer (SRB). The E-UTRAN supports SRB 0, 1 and 2 as illustrated in Figure 4-4 below.
eNodeB MME
S1
SRB 0
SRB 1
Carries RRC messages on CCH
SRB 2*
Used for RRC and NAS messages on the DCCH
Used for high-priority RRC messages
Non Access Stratum
*Optionally configured Figure 4-4 E-UTRAN Signaling Radio Bearers
Signaling Radio Bearers (SRBs) are defined as Radio Bearers (RB) used only for the transmission of RRC and Non Access Stratum (NAS) messages.
4 Service Accessibility Optimization
LZT 123 9165 R2A © 2010 Ericsson - 47 -
The three SRBs used in the E-UTRAN are explained in more detail below: • SRB0 is for RRC messages using the Common Control
Channel (CCCH) logical channel.
• SRB1 is for RRC messages (which may include a piggybacked NAS message) as well as for NAS messages prior to the establishment of SRB2, all using Dedicated Control Channel (DCCH) logical channel.
• SRB2 is for NAS messages, using DCCH logical channel. SRB2 has a lower-priority than SRB1 and is always configured by E-UTRAN after security activation.
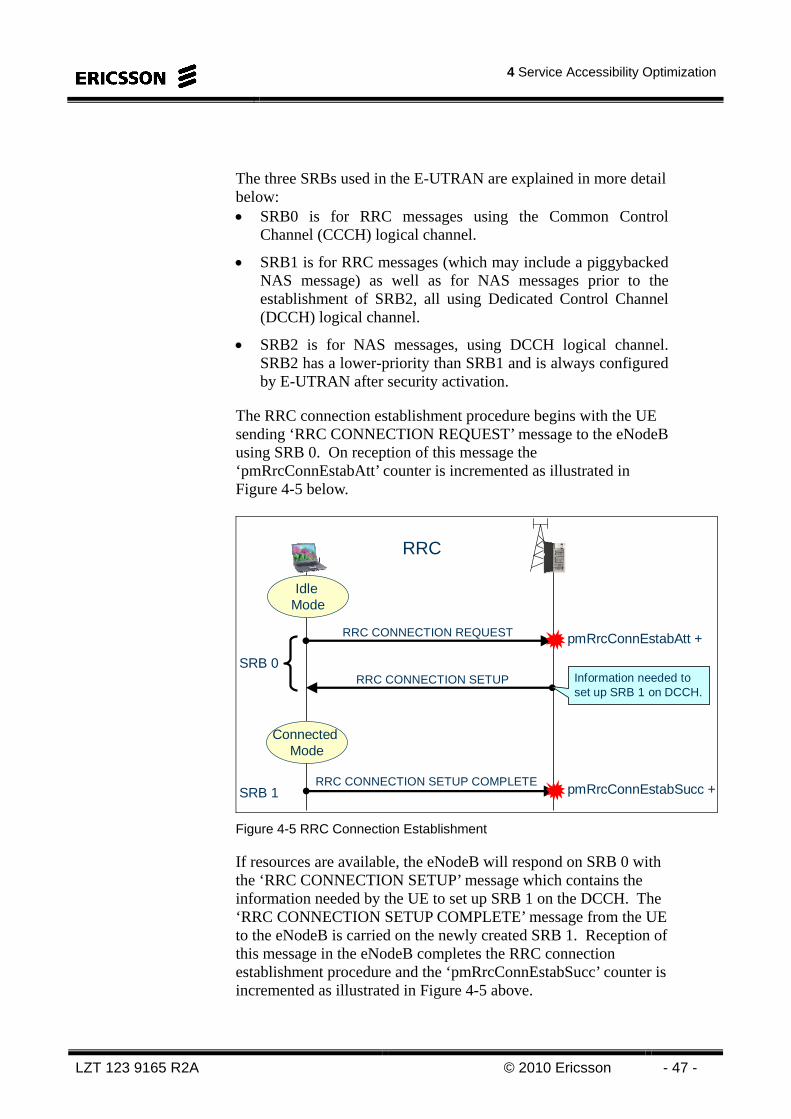
The RRC connection establishment procedure begins with the UE sending ‘RRC CONNECTION REQUEST’ message to the eNodeB using SRB 0. On reception of this message the ‘pmRrcConnEstabAtt’ counter is incremented as illustrated in Figure 4-5 below.
RRC CONNECTION REQUEST
Idle Mode
Connected Mode
RRC CONNECTION SETUP Information needed to set up SRB 1 on DCCH.
RRC CONNECTION SETUP COMPLETESRB 1
SRB 0
pmRrcConnEstabAtt +
pmRrcConnEstabSucc +
RRC
Figure 4-5 RRC Connection Establishment
If resources are available, the eNodeB will respond on SRB 0 with the ‘RRC CONNECTION SETUP’ message which contains the information needed by the UE to set up SRB 1 on the DCCH. The ‘RRC CONNECTION SETUP COMPLETE’ message from the UE to the eNodeB is carried on the newly created SRB 1. Reception of this message in the eNodeB completes the RRC connection establishment procedure and the ‘pmRrcConnEstabSucc’ counter is incremented as illustrated in Figure 4-5 above.
LTE L10 Optimization
- 48 - © Ericsson 2010 LZT 123 9165 R2A
The details of the counters that are triggered during the RRC Connection Establishment phase are given in Figure 4-6 below.
Counter Name Managed Object Description Counter Type
pmRrcConnEstabAtt EutranCellFDD
The total number of RRC Connection Request attempts per cell.
This counter is stepped at the reception of an ‘RRC CONNECTION REQUEST’ message.
PEG
pmRrcConnEstabSucc EutranCellFDD
The total number of successful RRC Connection Establishments per cell.
This counter is stepped at the reception of an ‘RRC CONNECTION SETUP COMPLETE’ message.
PEG
Figure 4-6 RRC Connection Establishment Counters
The counters in Figure 4-6 above are reset at the end of each ROP, collected by the Primary scanner on the eNodeB and used to create the Accessibility KPI formulas.
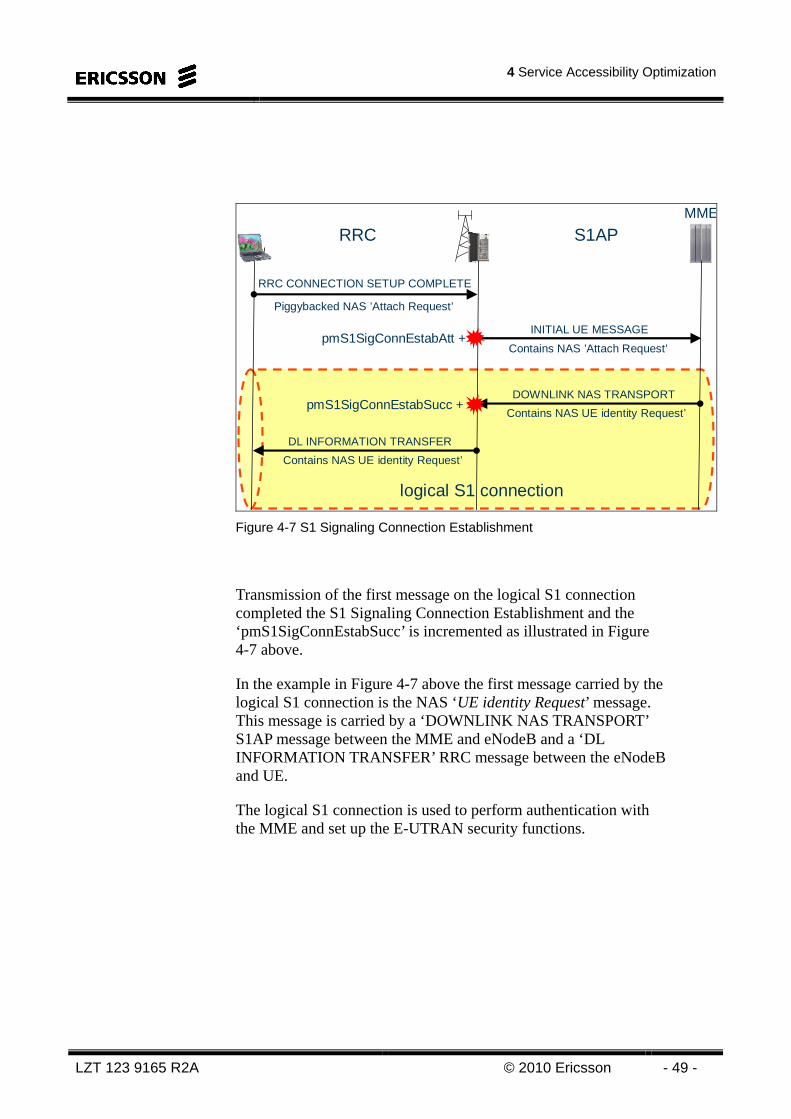
S1 SIGNALING CONNECTION ESTABLISHMENT
When setting up the E-RAB the ‘RRC CONNECTION SETUP COMPLETE’ message contains a piggybacked NAS ‘Attach Request’ message. The eNodeB will send this message to the MME in the S1AP ‘INITIAL UE MESSAGE’ and increment the ‘pmS1SigConnEstabAtt’ counter as illustrated in Figure 4-7 below.
4 Service Accessibility Optimization
LZT 123 9165 R2A © 2010 Ericsson - 49 -
logical S1 connection
MME
RRC CONNECTION SETUP COMPLETE
Piggybacked NAS ’Attach Request’
INITIAL UE MESSAGE
Contains NAS ’Attach Request’
RRC S1AP
DOWNLINK NAS TRANSPORT
Contains NAS UE identity Request’
DL INFORMATION TRANSFER
Contains NAS UE identity Request’
pmS1SigConnEstabAtt +
pmS1SigConnEstabSucc +
Figure 4-7 S1 Signaling Connection Establishment
Transmission of the first message on the logical S1 connection completed the S1 Signaling Connection Establishment and the ‘pmS1SigConnEstabSucc’ is incremented as illustrated in Figure 4-7 above.
In the example in Figure 4-7 above the first message carried by the logical S1 connection is the NAS ‘UE identity Request’ message. This message is carried by a ‘DOWNLINK NAS TRANSPORT’ S1AP message between the MME and eNodeB and a ‘DL INFORMATION TRANSFER’ RRC message between the eNodeB and UE.
The logical S1 connection is used to perform authentication with the MME and set up the E-UTRAN security functions.
LTE L10 Optimization
- 50 - © Ericsson 2010 LZT 123 9165 R2A
The details of the counters that are triggered during the S1 Signaling Establishment phase are given in Figure 4-8 below.
Counter Name Managed Object
Description Counter Type
pmS1SigConnEstabAtt EutranCellFDD This measurement provides the number of S1 Signaling connection establishment attempts for any establishment cause per cell.
This counter is stepped at the transmission of the ‘INITIAL UE MESSAGE’.
PEG
pmS1SigConnEstabSucc EutranCellFDD The total number of successful S1 signaling connection establishments per cell.
This counter is stepped when the first message is carried by the S1 logical connection.
PEG
Figure 4-8 S1 Connection Establishment Counters
The counters in Figure 4-8 above are reset at the end of each ROP, collected by the Primary scanner on the eNodeB and used to create the Accessibility KPI formulas.
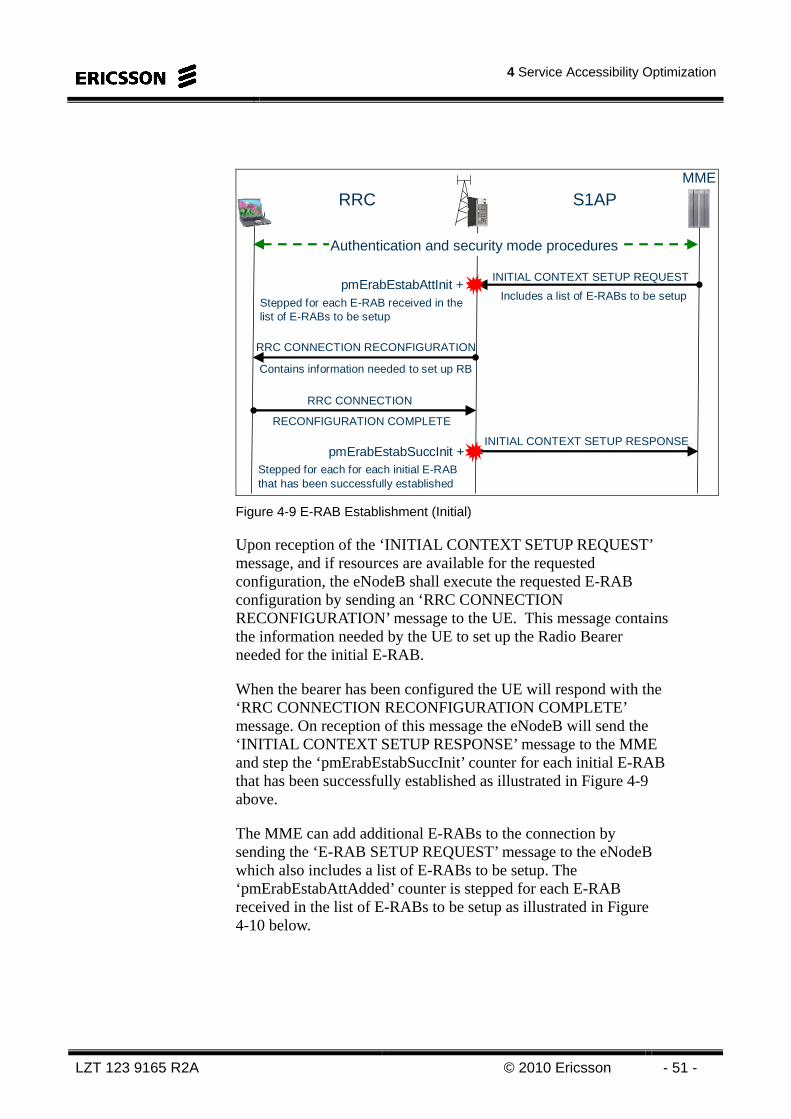
E-RAB ESTABLISHMENT
After successful authentication and security mode procedures the MME will send the ‘INITIAL CONTEXT SETUP REQUEST’ to the eNodeB which includes a list of E-RABs to be setup. The ‘pmErabEstabAttInit’ counter is stepped for each E-RAB received in the list of E-RABs to be setup as illustrated in Figure 4-9 below.
4 Service Accessibility Optimization
LZT 123 9165 R2A © 2010 Ericsson - 51 -
MME
RRC CONNECTION
RECONFIGURATION COMPLETE
INITIAL CONTEXT SETUP REQUEST
Includes a list of E-RABs to be setup
RRC S1AP
RRC CONNECTION RECONFIGURATION
Contains information needed to set up RB
pmErabEstabAttInit +Stepped for each E-RAB received in the list of E-RABs to be setup
INITIAL CONTEXT SETUP RESPONSE
Authentication and security mode procedures
pmErabEstabSuccInit +Stepped for each for each initial E-RAB that has been successfully established
Figure 4-9 E-RAB Establishment (Initial)
Upon reception of the ‘INITIAL CONTEXT SETUP REQUEST’ message, and if resources are available for the requested configuration, the eNodeB shall execute the requested E-RAB configuration by sending an ‘RRC CONNECTION RECONFIGURATION’ message to the UE. This message contains the information needed by the UE to set up the Radio Bearer needed for the initial E-RAB.
When the bearer has been configured the UE will respond with the ‘RRC CONNECTION RECONFIGURATION COMPLETE’ message. On reception of this message the eNodeB will send the ‘INITIAL CONTEXT SETUP RESPONSE’ message to the MME and step the ‘pmErabEstabSuccInit’ counter for each initial E-RAB that has been successfully established as illustrated in Figure 4-9 above.
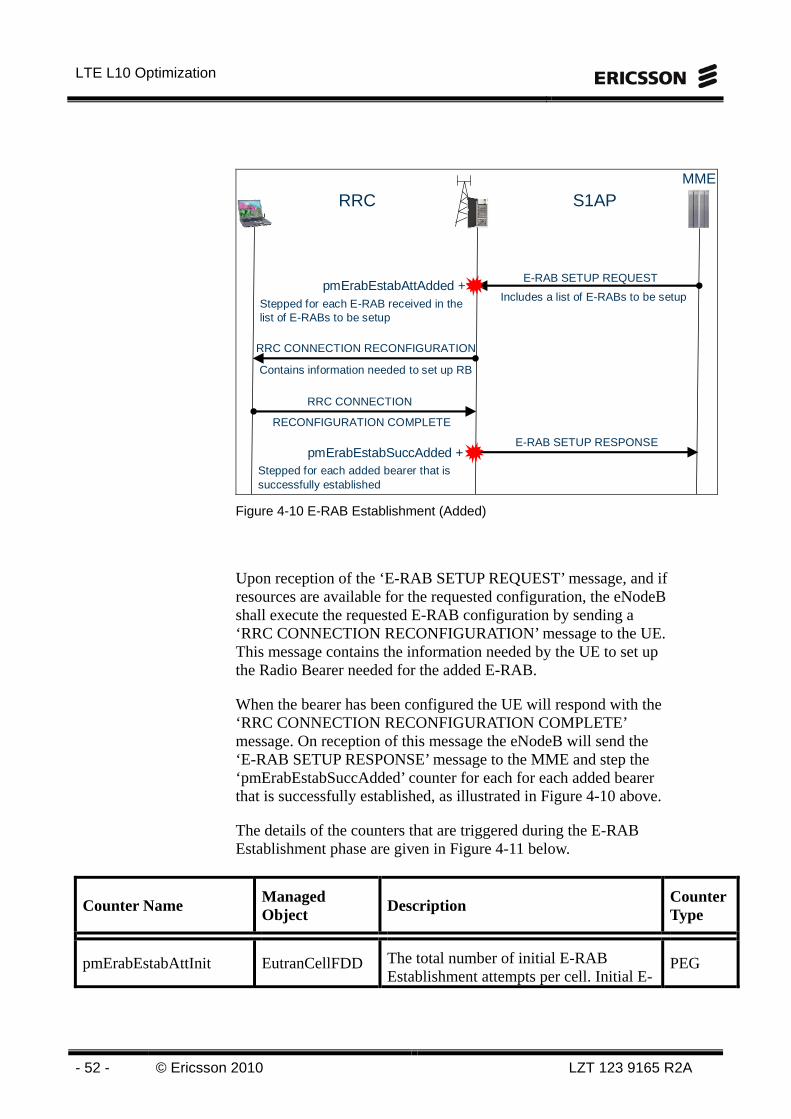
The MME can add additional E-RABs to the connection by sending the ‘E-RAB SETUP REQUEST’ message to the eNodeB which also includes a list of E-RABs to be setup. The ‘pmErabEstabAttAdded’ counter is stepped for each E-RAB received in the list of E-RABs to be setup as illustrated in Figure 4-10 below.
LTE L10 Optimization
- 52 - © Ericsson 2010 LZT 123 9165 R2A
MME
RRC CONNECTION
RECONFIGURATION COMPLETE
E-RAB SETUP REQUEST
Includes a list of E-RABs to be setup
RRC S1AP
RRC CONNECTION RECONFIGURATION
Contains information needed to set up RB
pmErabEstabAttAdded +Stepped for each E-RAB received in the list of E-RABs to be setup
E-RAB SETUP RESPONSEpmErabEstabSuccAdded +
Stepped for each added bearer that is successfully established
Figure 4-10 E-RAB Establishment (Added)
Upon reception of the ‘E-RAB SETUP REQUEST’ message, and if resources are available for the requested configuration, the eNodeB shall execute the requested E-RAB configuration by sending a ‘RRC CONNECTION RECONFIGURATION’ message to the UE. This message contains the information needed by the UE to set up the Radio Bearer needed for the added E-RAB.
When the bearer has been configured the UE will respond with the ‘RRC CONNECTION RECONFIGURATION COMPLETE’ message. On reception of this message the eNodeB will send the ‘E-RAB SETUP RESPONSE’ message to the MME and step the ‘pmErabEstabSuccAdded’ counter for each for each added bearer that is successfully established, as illustrated in Figure 4-10 above.
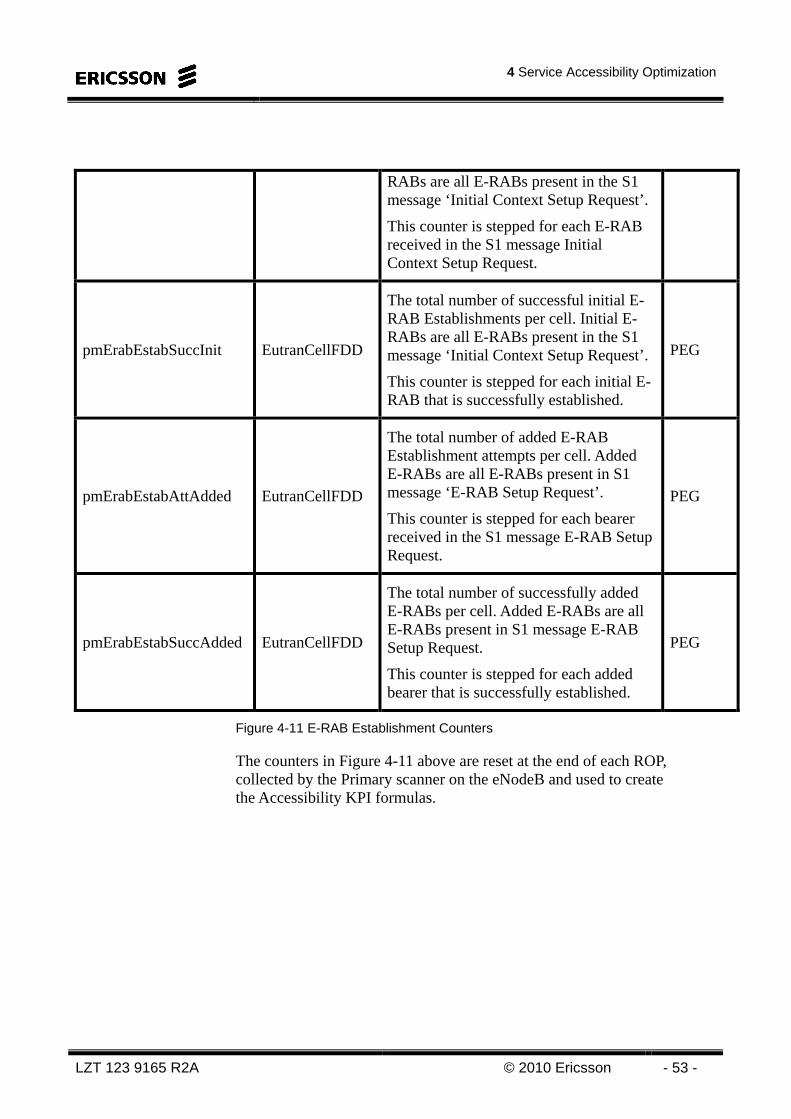
The details of the counters that are triggered during the E-RAB Establishment phase are given in Figure 4-11 below.
Counter Name Managed Object
Description Counter Type
pmErabEstabAttInit EutranCellFDD The total number of initial E-RAB Establishment attempts per cell. Initial E-
PEG
4 Service Accessibility Optimization
LZT 123 9165 R2A © 2010 Ericsson - 53 -
RABs are all E-RABs present in the S1 message ‘Initial Context Setup Request’.
This counter is stepped for each E-RAB received in the S1 message Initial Context Setup Request.
pmErabEstabSuccInit EutranCellFDD
The total number of successful initial E-RAB Establishments per cell. Initial E-RABs are all E-RABs present in the S1 message ‘Initial Context Setup Request’.
This counter is stepped for each initial E-RAB that is successfully established.
PEG
pmErabEstabAttAdded EutranCellFDD
The total number of added E-RAB Establishment attempts per cell. Added E-RABs are all E-RABs present in S1 message ‘E-RAB Setup Request’.
This counter is stepped for each bearer received in the S1 message E-RAB Setup Request.
PEG
pmErabEstabSuccAdded EutranCellFDD
The total number of successfully added E-RABs per cell. Added E-RABs are all E-RABs present in S1 message E-RAB Setup Request.
This counter is stepped for each added bearer that is successfully established.
PEG
Figure 4-11 E-RAB Establishment Counters
The counters in Figure 4-11 above are reset at the end of each ROP, collected by the Primary scanner on the eNodeB and used to create the Accessibility KPI formulas.
LTE L10 Optimization
- 54 - © Ericsson 2010 LZT 123 9165 R2A
ANALYSIS
Intro
What shall we look for first? We will probably expect a low numeric count on the accessibility since this is an initial access and the UE is expected to be connected for a long time (10 hours a day according to planning) and that would only require one access.
RRC connection request
The RRC connection Request is the first message sent by the UE. Prior to that, the UE would have sent preambles to ramp up the transmission power. If there is any problem before the RRC connection request there will be no way of noticing this from the system point of view other than complaints from the customers. If this happens then the parameters for the power ramping have to be optimized (not possible in L10A) to maximize the performance of the power ramping.
When the RRC Connection Request is received in the RBS the counter pmRrcConnEstabAtt will increment by one. If the UE sends back an RRC connection setup complete message the counter pmRrcConnEstabSucc will be incremented.
If these counters have different values it could be because of several reasons, such as admission control problem. This has to be investigated further with the protocol analyzer to see why it was rejected.
S1 signaling connection establishment
If there is a discrepancy between the two counters pmS1SigConnEstabAtt and pmS1SigConnEstabSucc, the problem could be in the MME or in the link between RBS and MME, S1 CP, so the protocol analyzer has to be used again.
4 Service Accessibility Optimization
LZT 123 9165 R2A © 2010 Ericsson - 55 -
PAGING CAPACITY
A small number of cells in the TA (or TA list) lead to frequent TA updates which in turn increases the MME load and UE battery consumption. Also, frequent TA updates may lead to reduced paging capacity since the UE may be busy making TA updates and therefore not able to respond to a paging simultaneously.
A large number of cells in the TA (or TA list) reduces the TA update frequency, but increases the paging load, since more cells are being paged simultaneously. The bottleneck in this case may be the MME paging capacity and the RBS paging capacity.
MME paging capacity
The number of SCTP/S1 boards in the MME determines the MME paging capacity. Each board should not exceed 1500 pages per second.
Therefore the MME paging capacity can be expressed as:
CMME = 1500 · nSCTP,
where nSCTP is the number of SCTP boards in the MME.
RBS paging capacity
The RBS paging capacity depends on the • RBS CPU load, which leads to a certain paging capacity (CCPU) in relation to CPU load caused by paging
• PDSCH load, which leads to a certain paging capacity (CPDSCHload) in relation to PDSCH load caused by paging
• Blocking, which leads to a certain paging capacity (Cblocking) in relation to blocking caused by paging
• PDCCH load, which leads to a certain paging capacity (CPDCCHload) in relation to PDCCH load caused by paging
LTE L10 Optimization
- 56 - © Ericsson 2010 LZT 123 9165 R2A
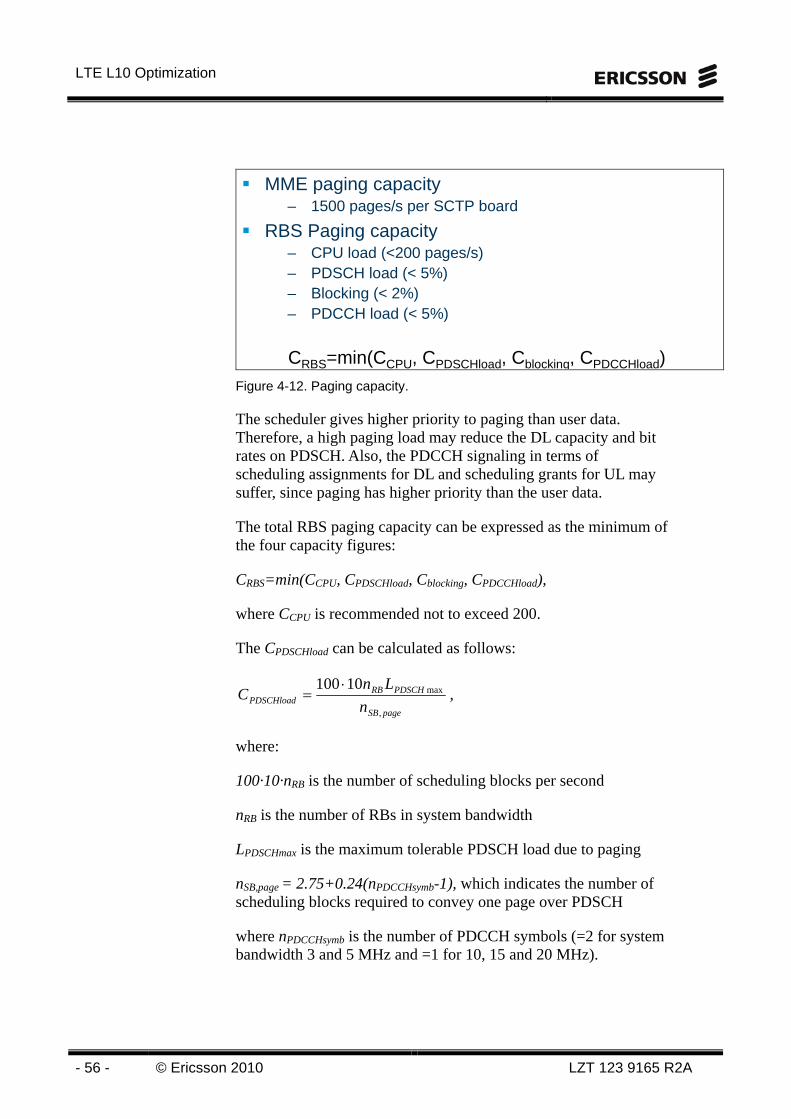
MME paging capacity– 1500 pages/s per SCTP board
RBS Paging capacity– CPU load (<200 pages/s)– PDSCH load (< 5%)– Blocking (< 2%)– PDCCH load (< 5%)
CRBS=min(CCPU, CPDSCHload, Cblocking, CPDCCHload) Figure 4-12. Paging capacity.
The scheduler gives higher priority to paging than user data. Therefore, a high paging load may reduce the DL capacity and bit rates on PDSCH. Also, the PDCCH signaling in terms of scheduling assignments for DL and scheduling grants for UL may suffer, since paging has higher priority than the user data.
The total RBS paging capacity can be expressed as the minimum of the four capacity figures:
CRBS=min(CCPU, CPDSCHload, Cblocking, CPDCCHload),
where CCPU is recommended not to exceed 200.
The CPDSCHload can be calculated as follows:
pageSB
PDSCHRBPDSCHload n
LnC
,
max10100⋅= ,
where:
100·10·nRB is the number of scheduling blocks per second
nRB is the number of RBs in system bandwidth
LPDSCHmax is the maximum tolerable PDSCH load due to paging
nSB,page = 2.75+0.24(nPDCCHsymb-1), which indicates the number of scheduling blocks required to convey one page over PDSCH
where nPDCCHsymb is the number of PDCCH symbols (=2 for system bandwidth 3 and 5 MHz and =1 for 10, 15 and 20 MHz).
4 Service Accessibility Optimization
LZT 123 9165 R2A © 2010 Ericsson - 57 -
100·10·nRB is the number of scheduling blocks per second
nRB is the number of RBs in system bandwidth
LPDSCHmax is the maximum tolerable PDSCH load due to paging
nSB,page = 2.75+0.24(nPDCCHsymb-1), which indicates the number of scheduling blocks required to convey one page over PDSCH
where nPDCCHsymb is the number of PDCCH symbols (=2 for system bandwidth 3 and 5 MHz and =1 for 10, 15 and 20 MHz).
)1(24.075.2
10100
,,
,
max
−+=
⋅=
symbPDCCHpageSB
pageSB
PDSCHRBPDSCHload
nn
n
LnC
Figure 4-13. Calculation of PDSCH paging capacity.
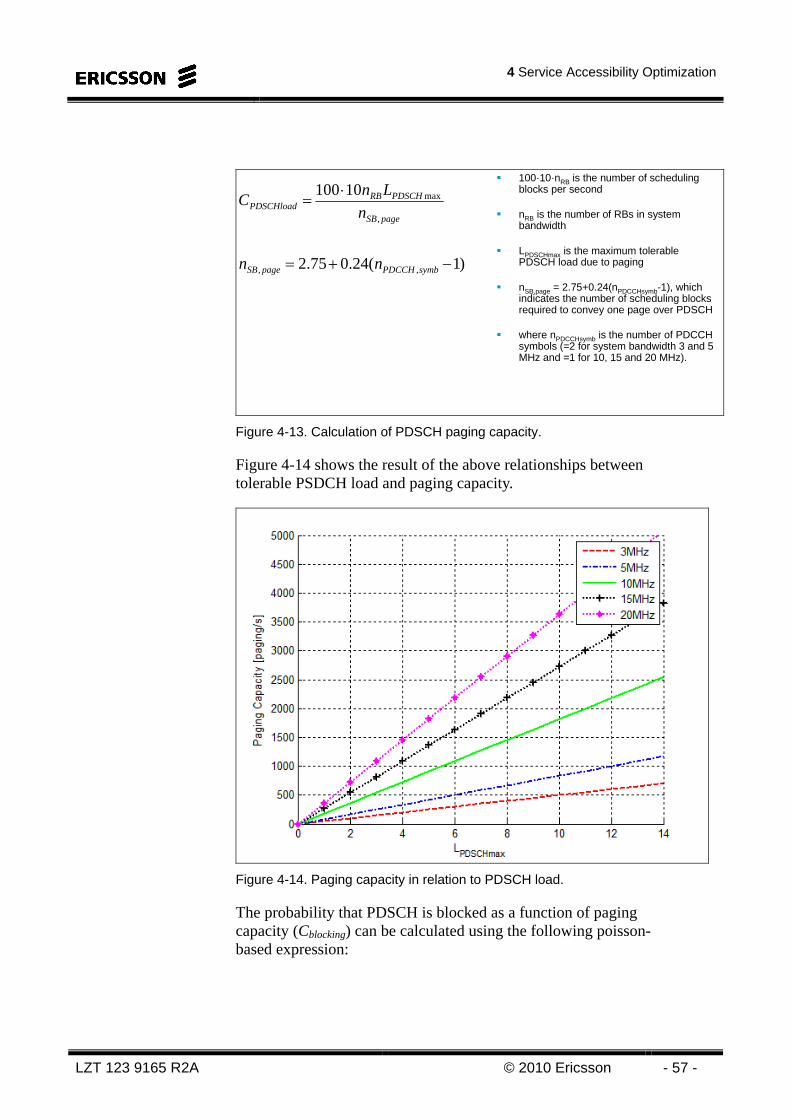
Figure 4-14 shows the result of the above relationships between tolerable PSDCH load and paging capacity.
Figure 4-14. Paging capacity in relation to PDSCH load.
The probability that PDSCH is blocked as a function of paging capacity (Cblocking) can be calculated using the following poisson-based expression:
LTE L10 Optimization
- 58 - © Ericsson 2010 LZT 123 9165 R2A
POblocking
R
R
RPOblockingC
blocking CR
CRReR
P
POblocking
,
0
,max
max,
max,
!)(max
1∑= −×−
−=
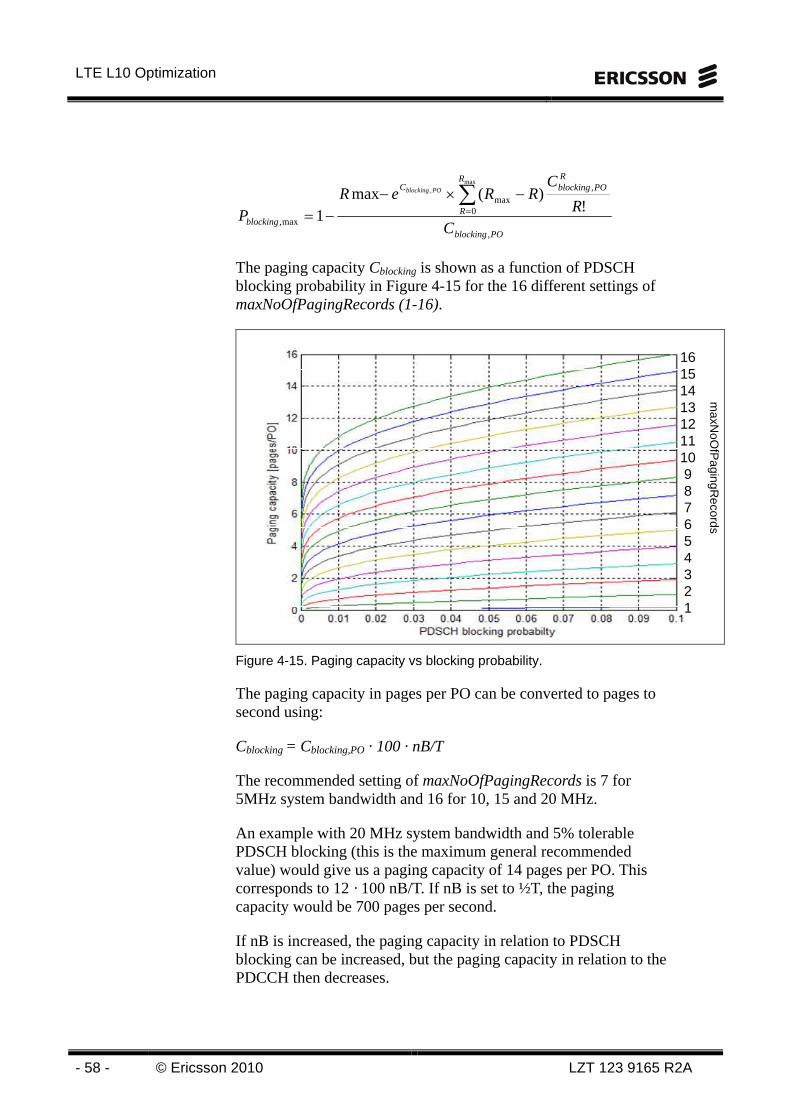
The paging capacity Cblocking is shown as a function of PDSCH blocking probability in Figure 4-15 for the 16 different settings of maxNoOfPagingRecords (1-16).
maxN
oOfP
agingRecords
16151413121110987654321
Figure 4-15. Paging capacity vs blocking probability.
The paging capacity in pages per PO can be converted to pages to second using:
Cblocking = Cblocking,PO · 100 · nB/T
The recommended setting of maxNoOfPagingRecords is 7 for 5MHz system bandwidth and 16 for 10, 15 and 20 MHz.
An example with 20 MHz system bandwidth and 5% tolerable PDSCH blocking (this is the maximum general recommended value) would give us a paging capacity of 14 pages per PO. This corresponds to 12 · 100 nB/T. If nB is set to ½T, the paging capacity would be 700 pages per second.
If nB is increased, the paging capacity in relation to PDSCH blocking can be increased, but the paging capacity in relation to the PDCCH then decreases.
4 Service Accessibility Optimization
LZT 123 9165 R2A © 2010 Ericsson - 59 -
The probability that a scheduling assignment for a paging arrives is poisson distributed and can be expressed as:
PSA = 1 – e-Ipage,PO
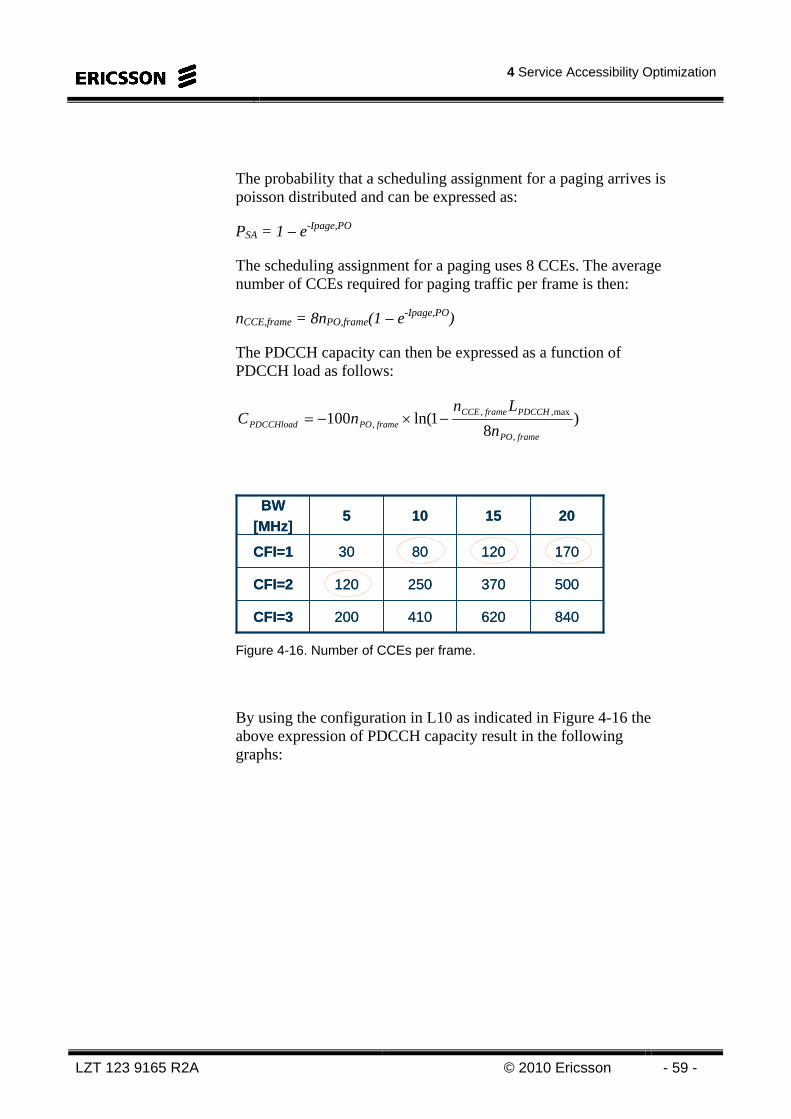
The scheduling assignment for a paging uses 8 CCEs. The average number of CCEs required for paging traffic per frame is then:
nCCE,frame = 8nPO,frame(1 – e-Ipage,PO)
The PDCCH capacity can then be expressed as a function of PDCCH load as follows:
)8
1ln(100,
max,,,
framePO
PDCCHframeCCEframePOPDCCHload n
LnnC −×−=
840620410200CFI=3
500370250120CFI=2
1701208030CFI=1
2015105BW
[MHz]
840620410200CFI=3
500370250120CFI=2
1701208030CFI=1
2015105BW
[MHz]
Figure 4-16. Number of CCEs per frame.
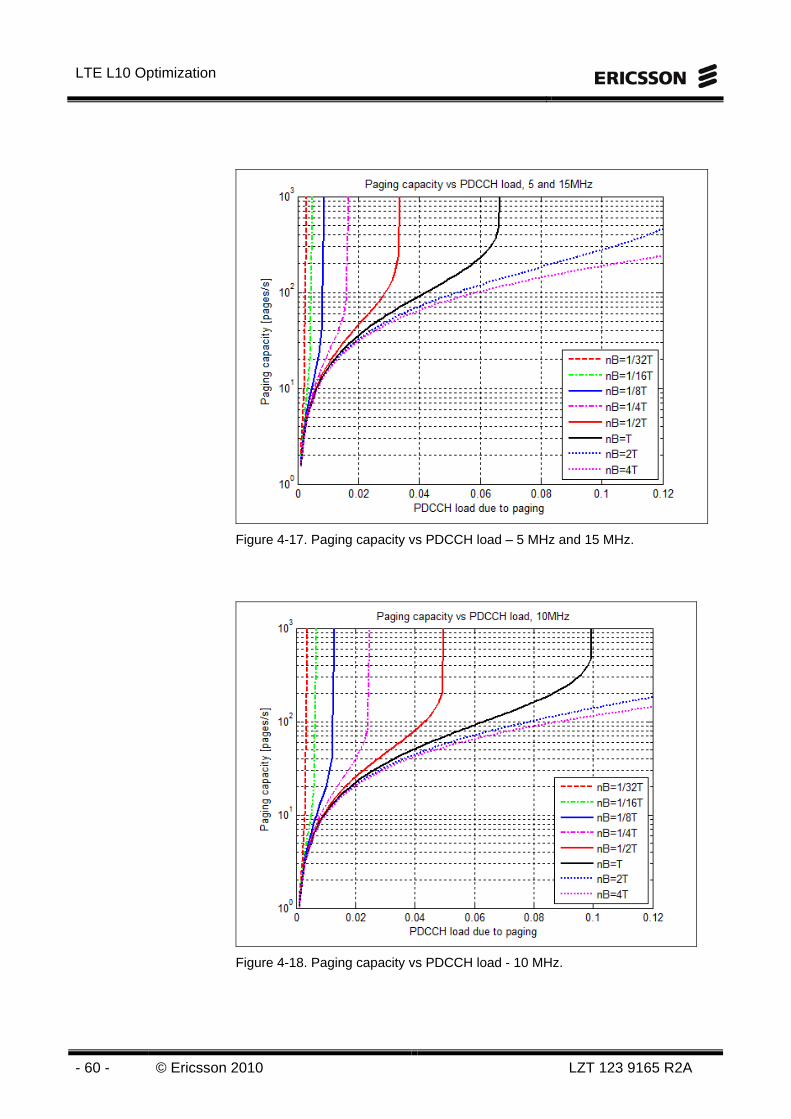
By using the configuration in L10 as indicated in Figure 4-16 the above expression of PDCCH capacity result in the following graphs:
LTE L10 Optimization
- 60 - © Ericsson 2010 LZT 123 9165 R2A
Figure 4-17. Paging capacity vs PDCCH load – 5 MHz and 15 MHz.
Figure 4-18. Paging capacity vs PDCCH load - 10 MHz.
4 Service Accessibility Optimization
LZT 123 9165 R2A © 2010 Ericsson - 61 -
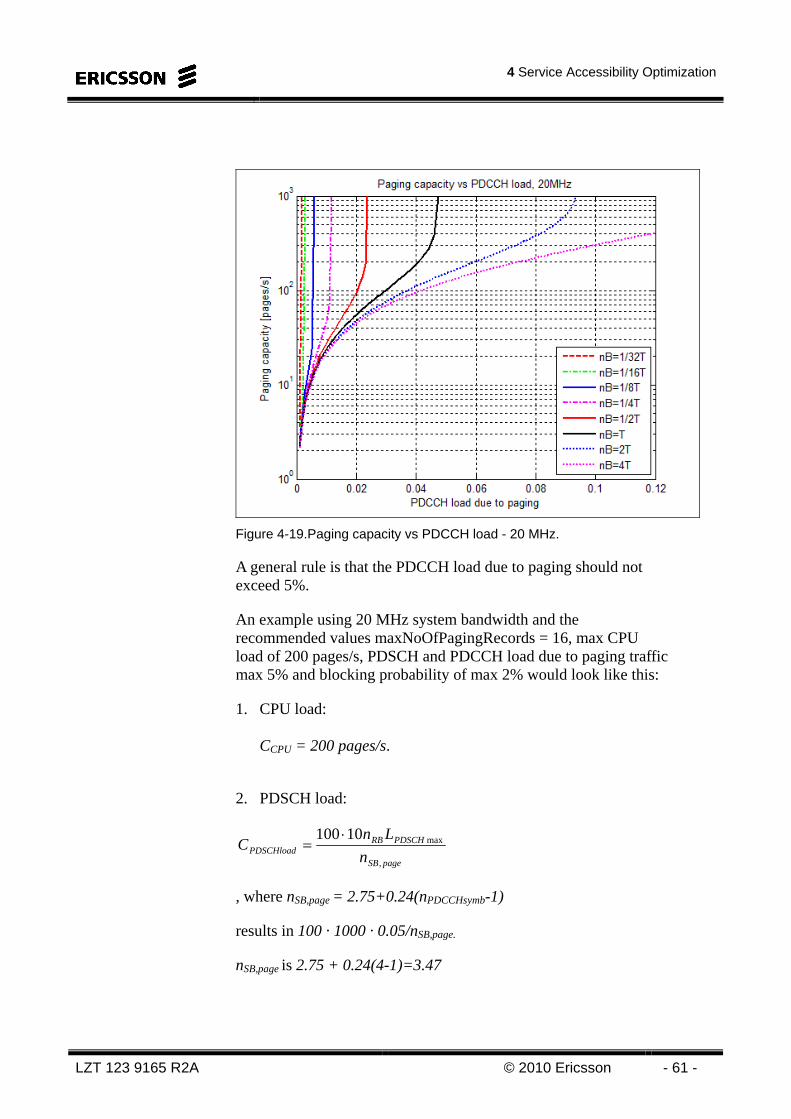
Figure 4-19.Paging capacity vs PDCCH load - 20 MHz.
A general rule is that the PDCCH load due to paging should not exceed 5%.
An example using 20 MHz system bandwidth and the recommended values maxNoOfPagingRecords = 16, max CPU load of 200 pages/s, PDSCH and PDCCH load due to paging traffic max 5% and blocking probability of max 2% would look like this:
1. CPU load: CCPU = 200 pages/s.
2. PDSCH load:
pageSB
PDSCHRBPDSCHload n
LnC
,
max10100⋅=
, where nSB,page = 2.75+0.24(nPDCCHsymb-1)
results in 100 · 1000 · 0.05/nSB,page.
nSB,page is 2.75 + 0.24(4-1)=3.47

LTE L10 Optimization
- 62 - © Ericsson 2010 LZT 123 9165 R2A
so, 100 · 1000 · 0.05/3.47 = 1440.9 pages/s.
3. Blocking:
From Figure 4-15, we can see that for 2% blocking probability, the paging capacity is 12 pages/PO (using maxNoOfPagingRecords = 16 according to the recommendation for 20 MHz).
This is converted to pages per second:
Cblocking = Cblocking,PO · 100 · nB/T =16 · 100 · nB/T.
By setting nB = ½T, Cblocking equals 800 pages/s and with nB = T we get 1600 pages/s. This setting clearly exceeds the CPU capacity in step 1, so instead a setting of nB to 1/8T which yields 200 pages/s would better fit the CPU capacity.
4. PDCCH load: In Figure 4-19, we can see that the paging capacity is around 140 pages/s for a load of 5%, nB=2T and infinity for all lower settings of nB.
5. In order to optimize all steps in this procedure, a setting of nB to 1/8T seems to be the optimum and results in a paging capacity of 200 pages/s.
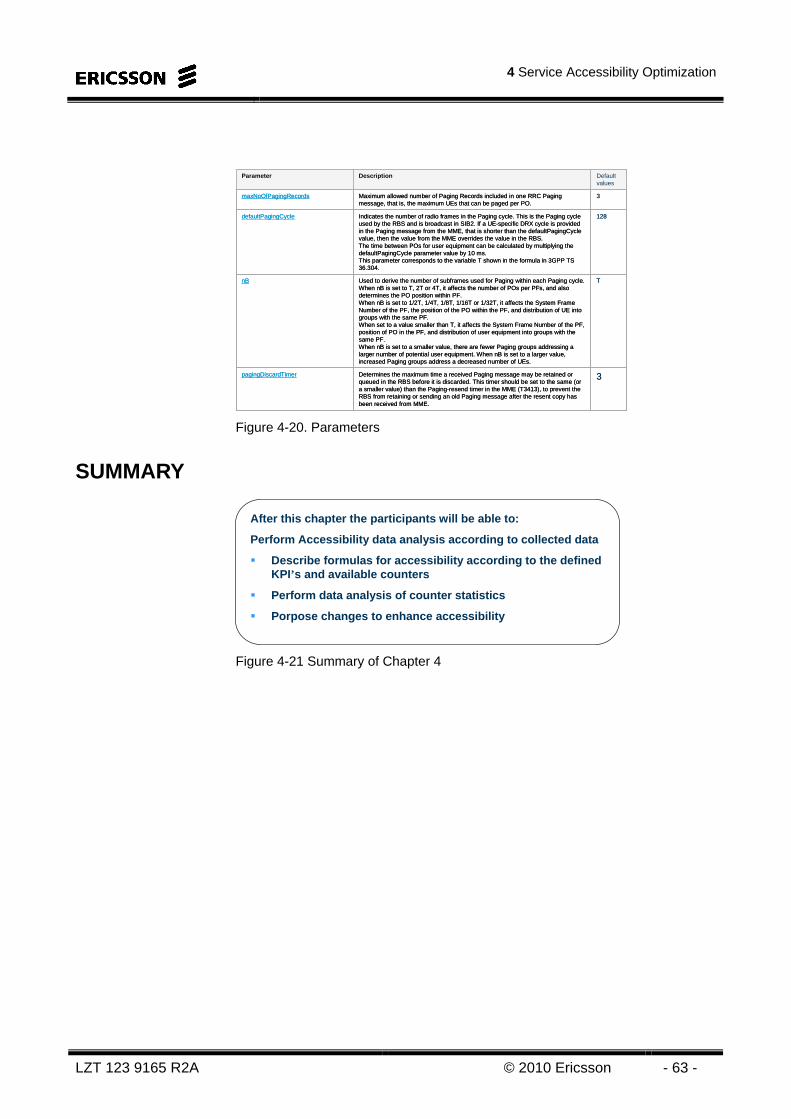
PARAMETERS
The parameters involved in the paging procedure is
4 Service Accessibility Optimization
LZT 123 9165 R2A © 2010 Ericsson - 63 -
Determines the maximum time a received Paging message may be retained or queued in the RBS before it is discarded. This timer should be set to the same (or a smaller value) than the Paging-resend timer in the MME (T3413), to prevent the RBS from retaining or sending an old Paging message after the resent copy has been received from MME.
Used to derive the number of subframes used for Paging within each Paging cycle. When nB is set to T, 2T or 4T, it affects the number of POs per PFs, and also determines the PO position within PF.When nB is set to 1/2T, 1/4T, 1/8T, 1/16T or 1/32T, it affects the System Frame Number of the PF, the position of the PO within the PF, and distribution of UE into groups with the same PF.When set to a value smaller than T, it affects the System Frame Number of the PF, position of PO in the PF, and distribution of user equipment into groups with the same PF.When nB is set to a smaller value, there are fewer Paging groups addressing a larger number of potential user equipment. When nB is set to a larger value, increased Paging groups address a decreased number of UEs.
Indicates the number of radio frames in the Paging cycle. This is the Paging cycle used by the RBS and is broadcast in SIB2. If a UE-specific DRX cycle is provided in the Paging message from the MME, that is shorter than the defaultPagingCyclevalue, then the value from the MME overrides the value in the RBS.The time between POs for user equipment can be calculated by multiplying the defaultPagingCycle parameter value by 10 ms.This parameter corresponds to the variable T shown in the formula in 3GPP TS 36.304.
Maximum allowed number of Paging Records included in one RRC Paging message, that is, the maximum UEs that can be paged per PO.
Description
3pagingDiscardTimer
TnB
128defaultPagingCycle
3maxNoOfPagingRecords
Default values
Parameter
Figure 4-20. Parameters
SUMMARY
After this chapter the participants will be able to:
Perform Accessibility data analysis according to collected data
Describe formulas for accessibility according to the defined KPI’s and available counters
Perform data analysis of counter statistics
Porpose changes to enhance accessibility
Figure 4-21 Summary of Chapter 4

LTE L10 Optimization
- 64 - © Ericsson 2010 LZT 123 9165 R2A
Intentionally Blank
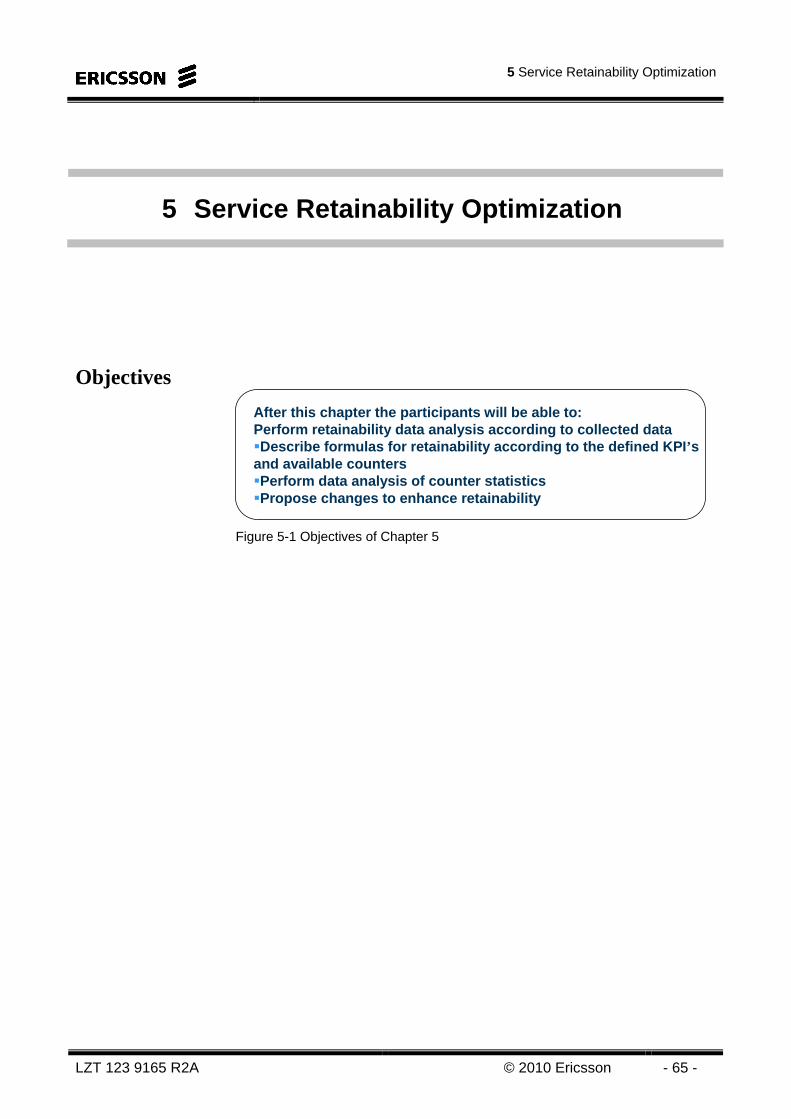
5 Service Retainability Optimization
LZT 123 9165 R2A © 2010 Ericsson - 65 -
5 Service Retainability Optimization
Objectives
After this chapter the participants will be able to:Perform retainability data analysis according to collected dataDescribe formulas for retainability according to the defined KPI ’sand available countersPerform data analysis of counter statisticsPropose changes to enhance retainability
Figure 5-1 Objectives of Chapter 5

LTE L10 Optimization
- 66 - © Ericsson 2010 LZT 123 9165 R2A
Intentionally Blank
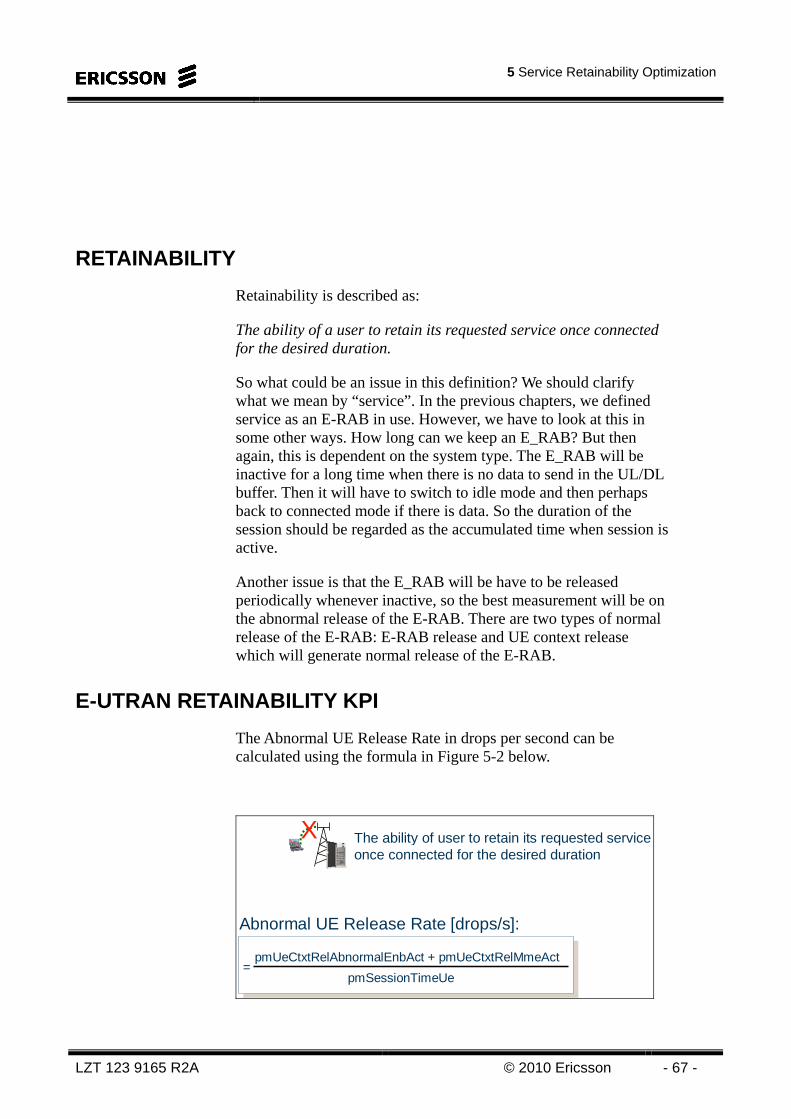
5 Service Retainability Optimization
LZT 123 9165 R2A © 2010 Ericsson - 67 -
RETAINABILITY
Retainability is described as:
The ability of a user to retain its requested service once connected for the desired duration.
So what could be an issue in this definition? We should clarify what we mean by “service”. In the previous chapters, we defined service as an E-RAB in use. However, we have to look at this in some other ways. How long can we keep an E_RAB? But then again, this is dependent on the system type. The E_RAB will be inactive for a long time when there is no data to send in the UL/DL buffer. Then it will have to switch to idle mode and then perhaps back to connected mode if there is data. So the duration of the session should be regarded as the accumulated time when session is active.
Another issue is that the E_RAB will be have to be released periodically whenever inactive, so the best measurement will be on the abnormal release of the E-RAB. There are two types of normal release of the E-RAB: E-RAB release and UE context release which will generate normal release of the E-RAB.
E-UTRAN RETAINABILITY KPI
The Abnormal UE Release Rate in drops per second can be calculated using the formula in Figure 5-2 below.
The ability of user to retain its requested service once connected for the desired duration
X
Abnormal UE Release Rate [drops/s]:
pmUeCtxtRelAbnormalEnbAct + pmUeCtxtRelMmeAct=
pmSessionTimeUe
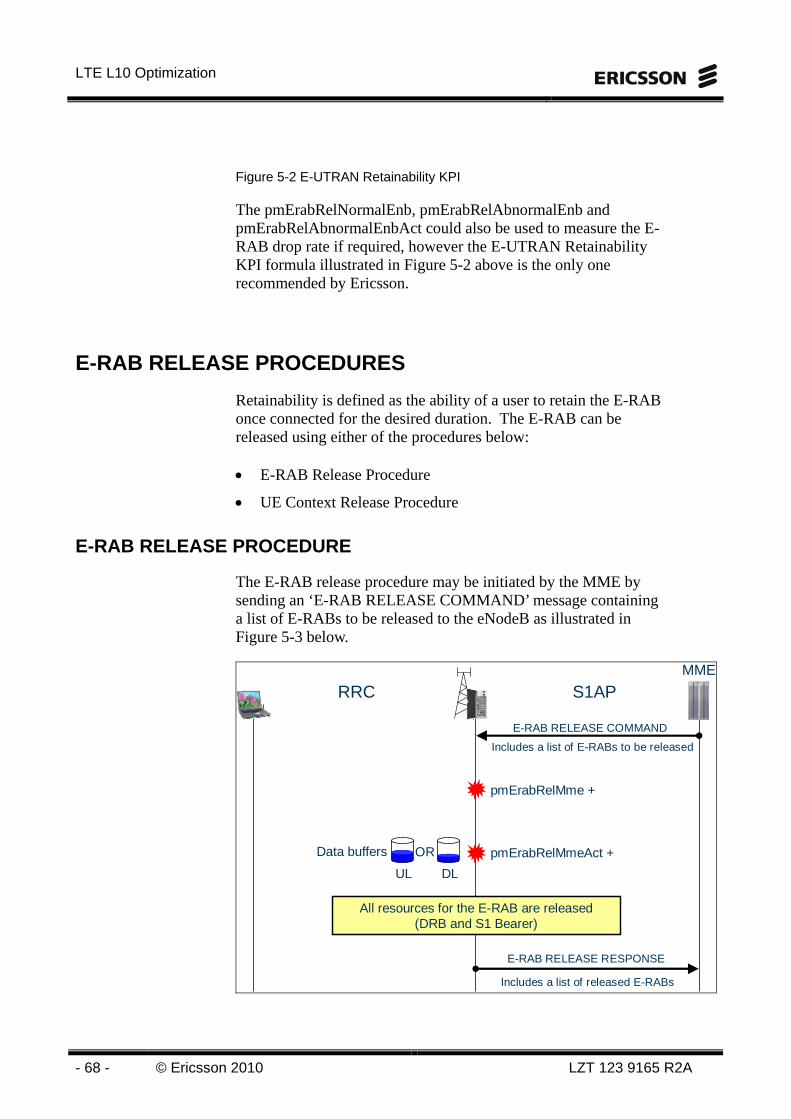
LTE L10 Optimization
- 68 - © Ericsson 2010 LZT 123 9165 R2A
Figure 5-2 E-UTRAN Retainability KPI
The pmErabRelNormalEnb, pmErabRelAbnormalEnb and pmErabRelAbnormalEnbAct could also be used to measure the E-RAB drop rate if required, however the E-UTRAN Retainability KPI formula illustrated in Figure 5-2 above is the only one recommended by Ericsson.
E-RAB RELEASE PROCEDURES
Retainability is defined as the ability of a user to retain the E-RAB once connected for the desired duration. The E-RAB can be released using either of the procedures below: • E-RAB Release Procedure
• UE Context Release Procedure
E-RAB RELEASE PROCEDURE
The E-RAB release procedure may be initiated by the MME by sending an ‘E-RAB RELEASE COMMAND’ message containing a list of E-RABs to be released to the eNodeB as illustrated in Figure 5-3 below.
MME
RRC S1AP
pmErabRelMme +
Data buffers
UL DL
OR pmErabRelMmeAct +
All resources for the E-RAB are released (DRB and S1 Bearer)
E-RAB RELEASE COMMAND
Includes a list of E-RABs to be released
E-RAB RELEASE RESPONSE
Includes a list of released E-RABs
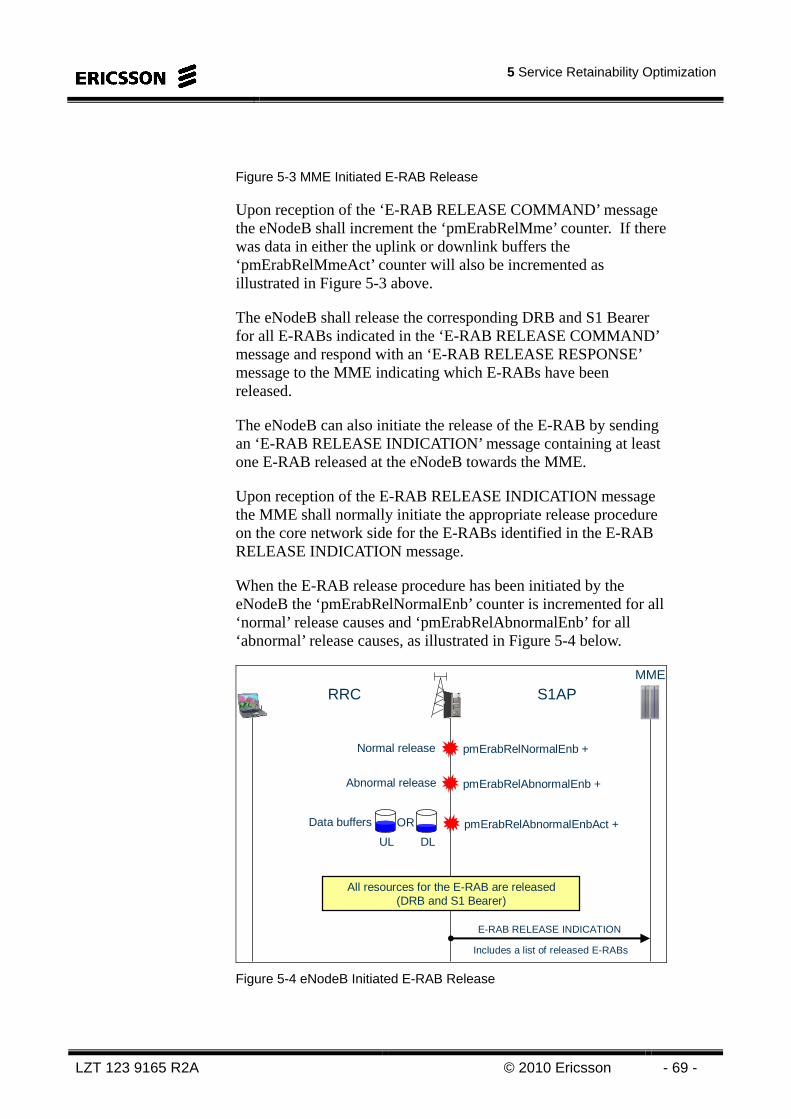
5 Service Retainability Optimization
LZT 123 9165 R2A © 2010 Ericsson - 69 -
Figure 5-3 MME Initiated E-RAB Release
Upon reception of the ‘E-RAB RELEASE COMMAND’ message the eNodeB shall increment the ‘pmErabRelMme’ counter. If there was data in either the uplink or downlink buffers the ‘pmErabRelMmeAct’ counter will also be incremented as illustrated in Figure 5-3 above.
The eNodeB shall release the corresponding DRB and S1 Bearer for all E-RABs indicated in the ‘E-RAB RELEASE COMMAND’ message and respond with an ‘E-RAB RELEASE RESPONSE’ message to the MME indicating which E-RABs have been released.
The eNodeB can also initiate the release of the E-RAB by sending an ‘E-RAB RELEASE INDICATION’ message containing at least one E-RAB released at the eNodeB towards the MME.
Upon reception of the E-RAB RELEASE INDICATION message the MME shall normally initiate the appropriate release procedure on the core network side for the E-RABs identified in the E-RAB RELEASE INDICATION message.
When the E-RAB release procedure has been initiated by the eNodeB the ‘pmErabRelNormalEnb’ counter is incremented for all ‘normal’ release causes and ‘pmErabRelAbnormalEnb’ for all ‘abnormal’ release causes, as illustrated in Figure 5-4 below.
MME
RRC S1AP
E-RAB RELEASE INDICATION
Includes a list of released E-RABs
pmErabRelNormalEnb +Normal release
pmErabRelAbnormalEnb +Abnormal release
Data buffers
UL DL
OR pmErabRelAbnormalEnbAct +
All resources for the E-RAB are released (DRB and S1 Bearer)
Figure 5-4 eNodeB Initiated E-RAB Release
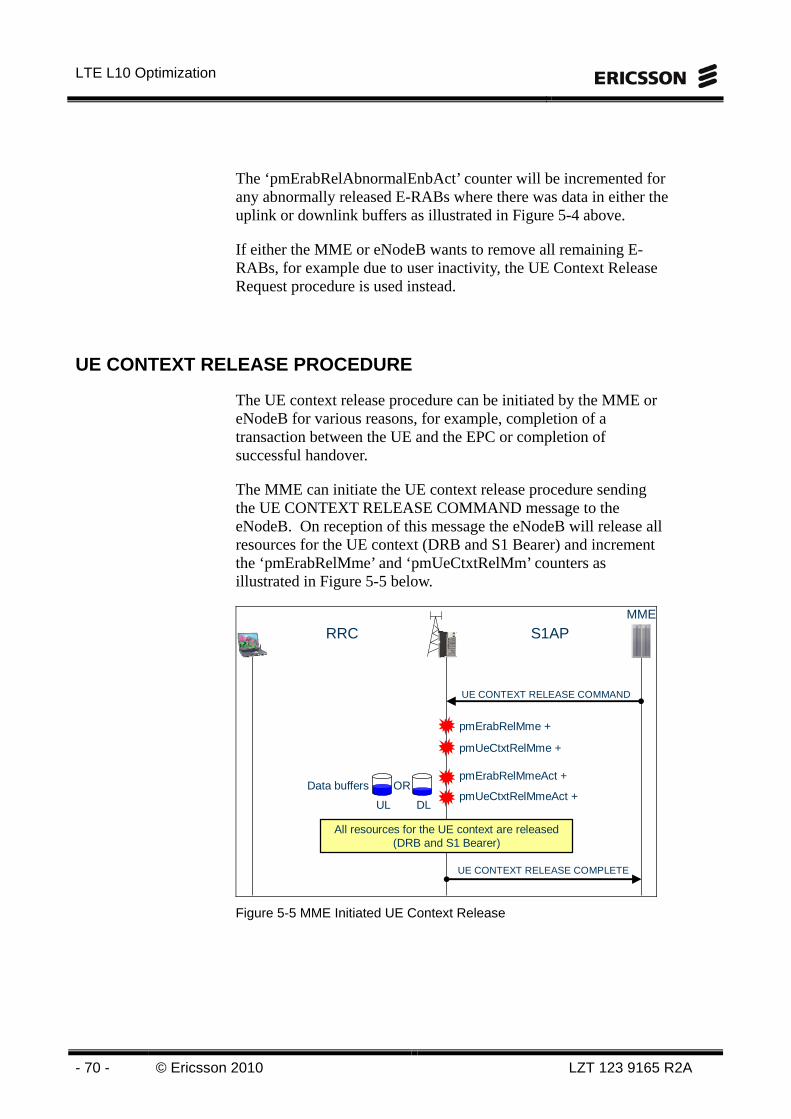
LTE L10 Optimization
- 70 - © Ericsson 2010 LZT 123 9165 R2A
The ‘pmErabRelAbnormalEnbAct’ counter will be incremented for any abnormally released E-RABs where there was data in either the uplink or downlink buffers as illustrated in Figure 5-4 above.
If either the MME or eNodeB wants to remove all remaining E-RABs, for example due to user inactivity, the UE Context Release Request procedure is used instead.
UE CONTEXT RELEASE PROCEDURE
The UE context release procedure can be initiated by the MME or eNodeB for various reasons, for example, completion of a transaction between the UE and the EPC or completion of successful handover.
The MME can initiate the UE context release procedure sending the UE CONTEXT RELEASE COMMAND message to the eNodeB. On reception of this message the eNodeB will release all resources for the UE context (DRB and S1 Bearer) and increment the ‘pmErabRelMme’ and ‘pmUeCtxtRelMm’ counters as illustrated in Figure 5-5 below.
MME
RRC S1AP
UE CONTEXT RELEASE COMMAND
UE CONTEXT RELEASE COMPLETE
All resources for the UE context are released (DRB and S1 Bearer)
Data buffers
UL DL
ORpmErabRelMmeAct +
pmUeCtxtRelMmeAct +
pmErabRelMme +
pmUeCtxtRelMme +
Figure 5-5 MME Initiated UE Context Release
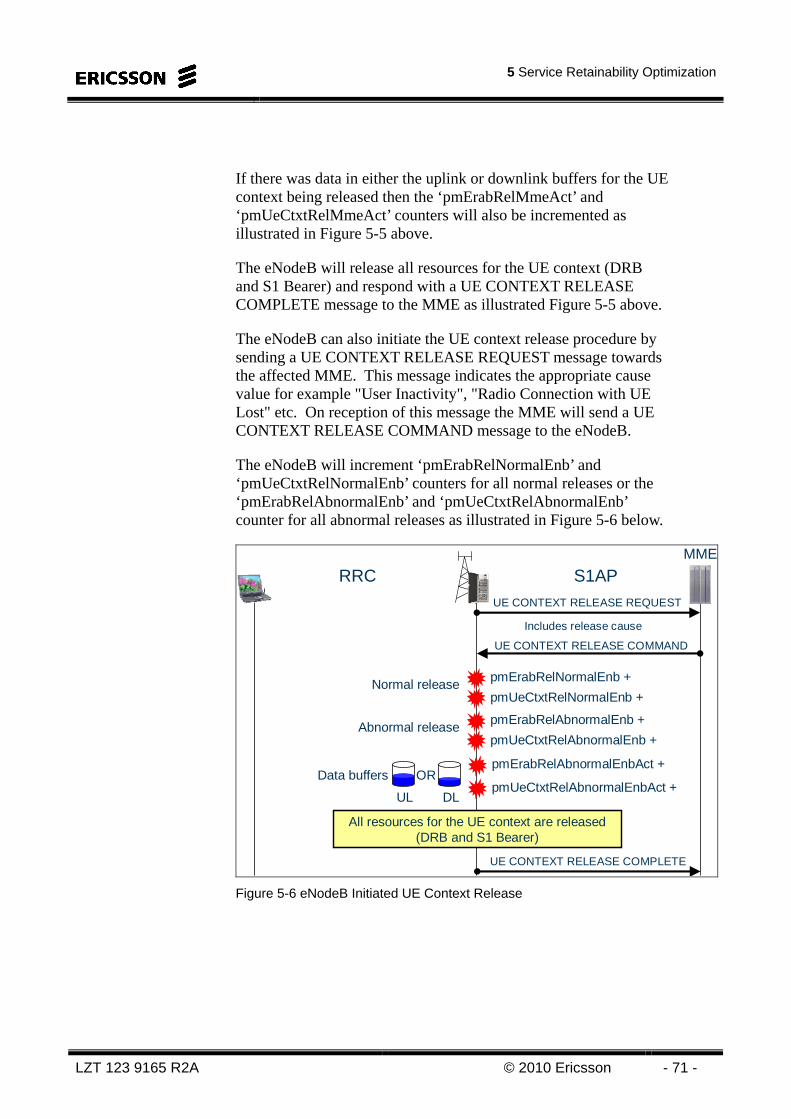
5 Service Retainability Optimization
LZT 123 9165 R2A © 2010 Ericsson - 71 -
If there was data in either the uplink or downlink buffers for the UE context being released then the ‘pmErabRelMmeAct’ and ‘pmUeCtxtRelMmeAct’ counters will also be incremented as illustrated in Figure 5-5 above.
The eNodeB will release all resources for the UE context (DRB and S1 Bearer) and respond with a UE CONTEXT RELEASE COMPLETE message to the MME as illustrated Figure 5-5 above.
The eNodeB can also initiate the UE context release procedure by sending a UE CONTEXT RELEASE REQUEST message towards the affected MME. This message indicates the appropriate cause value for example "User Inactivity", "Radio Connection with UE Lost" etc. On reception of this message the MME will send a UE CONTEXT RELEASE COMMAND message to the eNodeB.
The eNodeB will increment ‘pmErabRelNormalEnb’ and ‘pmUeCtxtRelNormalEnb’ counters for all normal releases or the ‘pmErabRelAbnormalEnb’ and ‘pmUeCtxtRelAbnormalEnb’ counter for all abnormal releases as illustrated in Figure 5-6 below.
MME
RRC S1AP
UE CONTEXT RELEASE COMMAND
UE CONTEXT RELEASE COMPLETE
All resources for the UE context are released (DRB and S1 Bearer)
Data buffers
UL DL
ORpmErabRelAbnormalEnbAct +
pmUeCtxtRelAbnormalEnbAct +
UE CONTEXT RELEASE REQUEST
Includes release cause
pmErabRelNormalEnb +
pmUeCtxtRelNormalEnb +Normal release
pmErabRelAbnormalEnb +
pmUeCtxtRelAbnormalEnb +Abnormal release
Figure 5-6 eNodeB Initiated UE Context Release
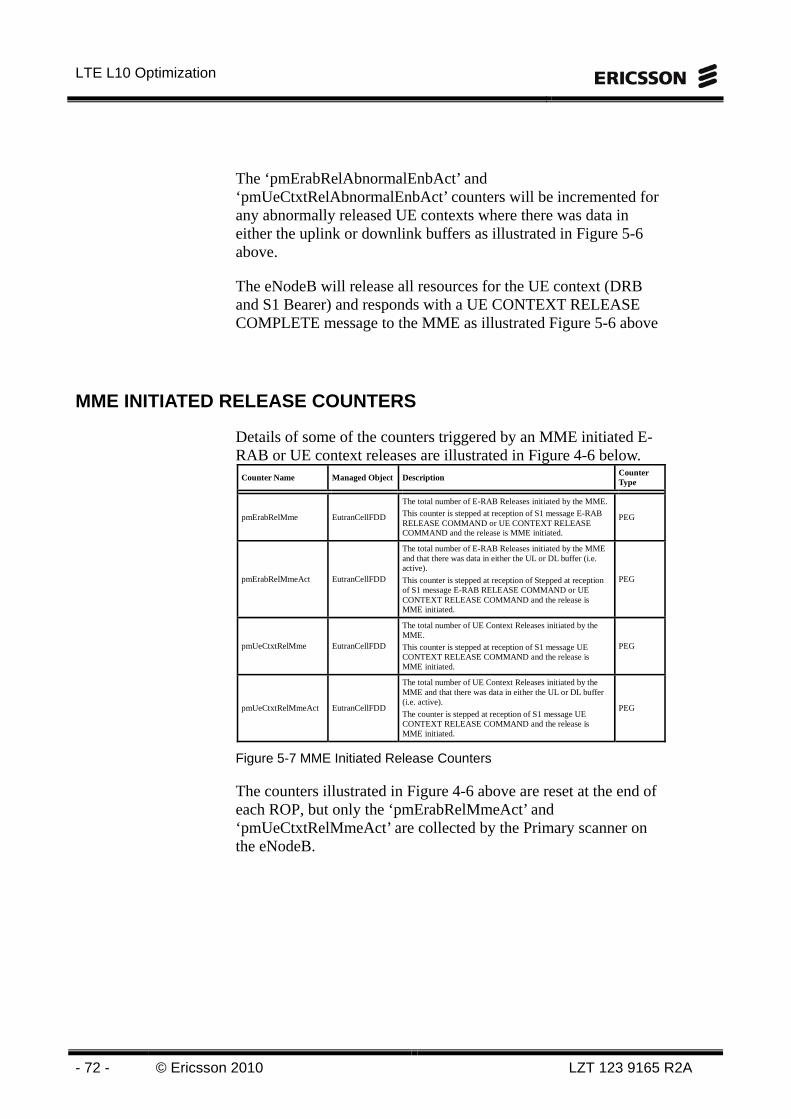
LTE L10 Optimization
- 72 - © Ericsson 2010 LZT 123 9165 R2A
The ‘pmErabRelAbnormalEnbAct’ and ‘pmUeCtxtRelAbnormalEnbAct’ counters will be incremented for any abnormally released UE contexts where there was data in either the uplink or downlink buffers as illustrated in Figure 5-6 above.
The eNodeB will release all resources for the UE context (DRB and S1 Bearer) and responds with a UE CONTEXT RELEASE COMPLETE message to the MME as illustrated Figure 5-6 above
MME INITIATED RELEASE COUNTERS
Details of some of the counters triggered by an MME initiated E-RAB or UE context releases are illustrated in Figure 4-6 below.
Counter Name Managed Object Description Counter Type
pmErabRelMme EutranCellFDD
The total number of E-RAB Releases initiated by the MME.
This counter is stepped at reception of S1 message E-RAB RELEASE COMMAND or UE CONTEXT RELEASE COMMAND and the release is MME initiated.
PEG
pmErabRelMmeAct EutranCellFDD
The total number of E-RAB Releases initiated by the MME and that there was data in either the UL or DL buffer (i.e. active).
This counter is stepped at reception of Stepped at reception of S1 message E-RAB RELEASE COMMAND or UE CONTEXT RELEASE COMMAND and the release is MME initiated.
PEG
pmUeCtxtRelMme EutranCellFDD
The total number of UE Context Releases initiated by the MME.
This counter is stepped at reception of S1 message UE CONTEXT RELEASE COMMAND and the release is MME initiated.
PEG
pmUeCtxtRelMmeAct EutranCellFDD
The total number of UE Context Releases initiated by the MME and that there was data in either the UL or DL buffer (i.e. active).
The counter is stepped at reception of S1 message UE CONTEXT RELEASE COMMAND and the release is MME initiated.
PEG
Figure 5-7 MME Initiated Release Counters
The counters illustrated in Figure 4-6 above are reset at the end of each ROP, but only the ‘pmErabRelMmeAct’ and ‘pmUeCtxtRelMmeAct’ are collected by the Primary scanner on the eNodeB.
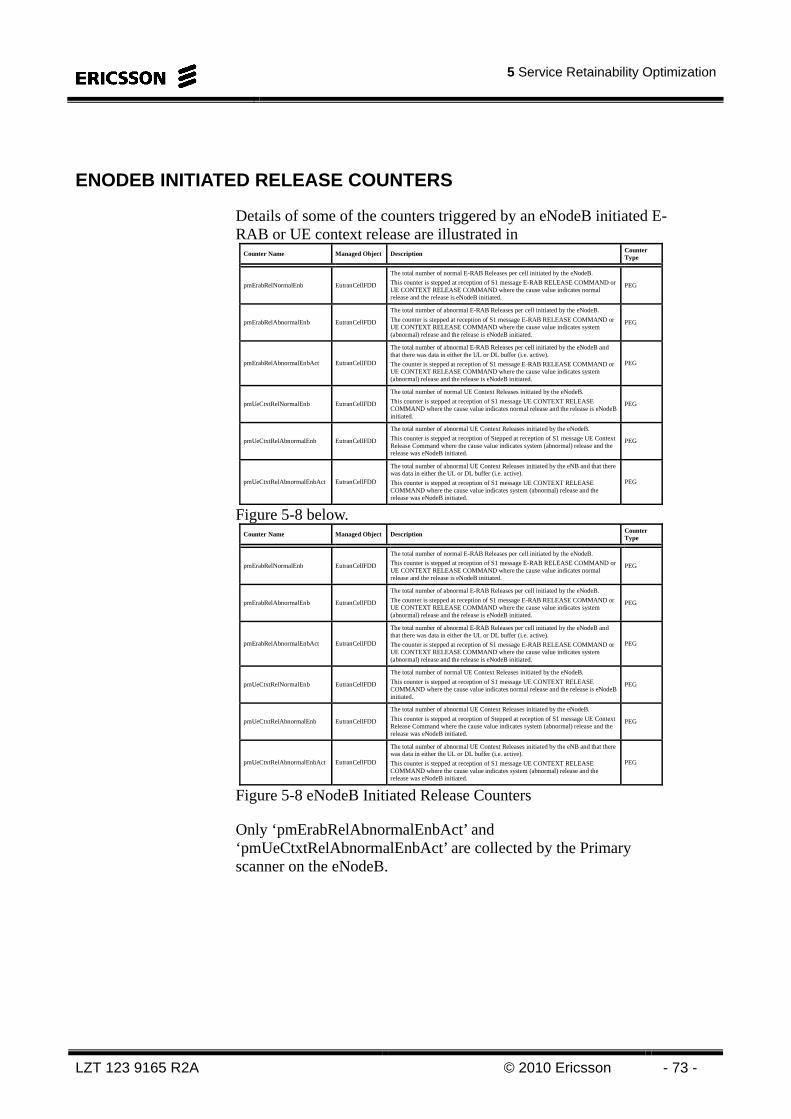
5 Service Retainability Optimization
LZT 123 9165 R2A © 2010 Ericsson - 73 -
ENODEB INITIATED RELEASE COUNTERS
Details of some of the counters triggered by an eNodeB initiated E-RAB or UE context release are illustrated in
Counter Name Managed Object Description Counter Type
pmErabRelNormalEnb EutranCellFDD
The total number of normal E-RAB Releases per cell initiated by the eNodeB.
This counter is stepped at reception of S1 message E-RAB RELEASE COMMAND or UE CONTEXT RELEASE COMMAND where the cause value indicates normal release and the release is eNodeB initiated.
PEG
pmErabRelAbnormalEnb EutranCellFDD
The total number of abnormal E-RAB Releases per cell initiated by the eNodeB.
The counter is stepped at reception of S1 message E-RAB RELEASE COMMAND or UE CONTEXT RELEASE COMMAND where the cause value indicates system (abnormal) release and the release is eNodeB initiated.
PEG
pmErabRelAbnormalEnbAct EutranCellFDD
The total number of abnormal E-RAB Releases per cell initiated by the eNodeB and that there was data in either the UL or DL buffer (i.e. active).
The counter is stepped at reception of S1 message E-RAB RELEASE COMMAND or UE CONTEXT RELEASE COMMAND where the cause value indicates system (abnormal) release and the release is eNodeB initiated.
PEG
pmUeCtxtRelNormalEnb EutranCellFDD
The total number of normal UE Context Releases initiated by the eNodeB.
This counter is stepped at reception of S1 message UE CONTEXT RELEASE COMMAND where the cause value indicates normal release and the release is eNodeB initiated.
PEG
pmUeCtxtRelAbnormalEnb EutranCellFDD
The total number of abnormal UE Context Releases initiated by the eNodeB.
This counter is stepped at reception of Stepped at reception of S1 message UE Context Release Command where the cause value indicates system (abnormal) release and the release was eNodeB initiated.
PEG
pmUeCtxtRelAbnormalEnbAct EutranCellFDD
The total number of abnormal UE Context Releases initiated by the eNB and that there was data in either the UL or DL buffer (i.e. active).
This counter is stepped at reception of S1 message UE CONTEXT RELEASE COMMAND where the cause value indicates system (abnormal) release and the release was eNodeB initiated.
PEG
Figure 5-8 below. Counter Name Managed Object Description Counter
Type
pmErabRelNormalEnb EutranCellFDD
The total number of normal E-RAB Releases per cell initiated by the eNodeB.
This counter is stepped at reception of S1 message E-RAB RELEASE COMMAND or UE CONTEXT RELEASE COMMAND where the cause value indicates normal release and the release is eNodeB initiated.
PEG
pmErabRelAbnormalEnb EutranCellFDD
The total number of abnormal E-RAB Releases per cell initiated by the eNodeB.
The counter is stepped at reception of S1 message E-RAB RELEASE COMMAND or UE CONTEXT RELEASE COMMAND where the cause value indicates system (abnormal) release and the release is eNodeB initiated.
PEG
pmErabRelAbnormalEnbAct EutranCellFDD
The total number of abnormal E-RAB Releases per cell initiated by the eNodeB and that there was data in either the UL or DL buffer (i.e. active).
The counter is stepped at reception of S1 message E-RAB RELEASE COMMAND or UE CONTEXT RELEASE COMMAND where the cause value indicates system (abnormal) release and the release is eNodeB initiated.
PEG
pmUeCtxtRelNormalEnb EutranCellFDD
The total number of normal UE Context Releases initiated by the eNodeB.
This counter is stepped at reception of S1 message UE CONTEXT RELEASE COMMAND where the cause value indicates normal release and the release is eNodeB initiated.
PEG
pmUeCtxtRelAbnormalEnb EutranCellFDD
The total number of abnormal UE Context Releases initiated by the eNodeB.
This counter is stepped at reception of Stepped at reception of S1 message UE Context Release Command where the cause value indicates system (abnormal) release and the release was eNodeB initiated.
PEG
pmUeCtxtRelAbnormalEnbAct EutranCellFDD
The total number of abnormal UE Context Releases initiated by the eNB and that there was data in either the UL or DL buffer (i.e. active).
This counter is stepped at reception of S1 message UE CONTEXT RELEASE COMMAND where the cause value indicates system (abnormal) release and the release was eNodeB initiated.
PEG
Figure 5-8 eNodeB Initiated Release Counters
Only ‘pmErabRelAbnormalEnbAct’ and ‘pmUeCtxtRelAbnormalEnbAct’ are collected by the Primary scanner on the eNodeB.
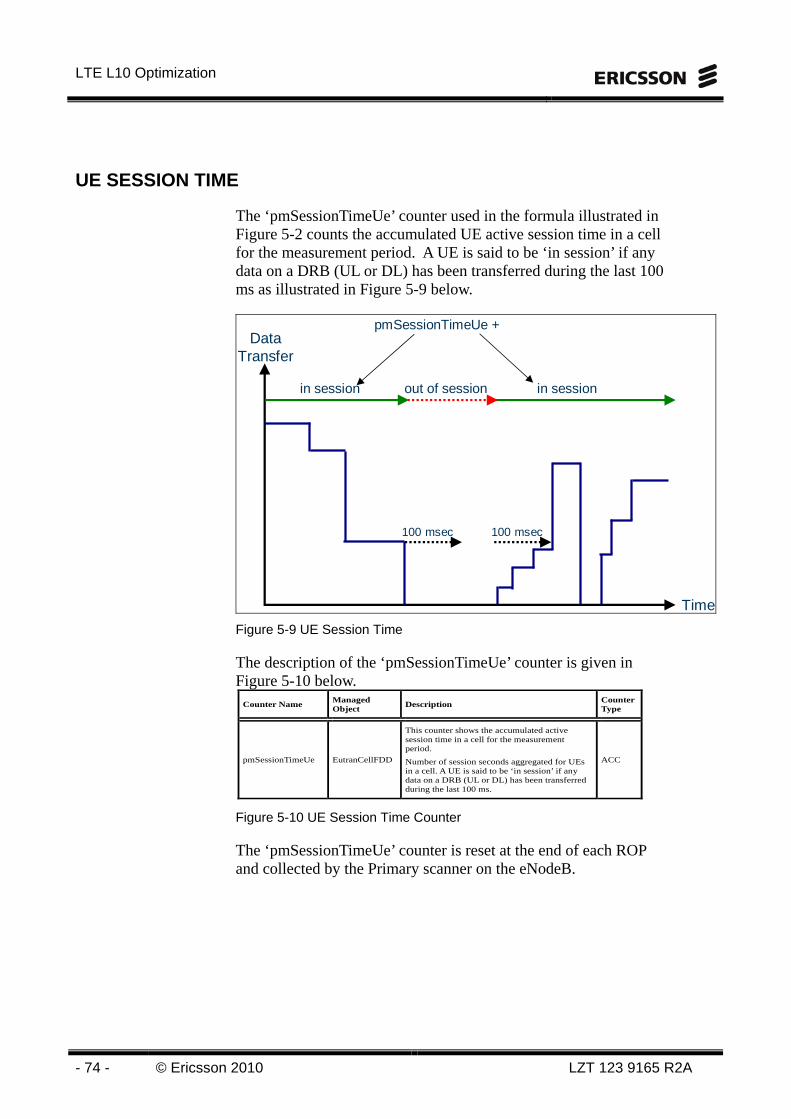
LTE L10 Optimization
- 74 - © Ericsson 2010 LZT 123 9165 R2A
UE SESSION TIME
The ‘pmSessionTimeUe’ counter used in the formula illustrated in Figure 5-2 counts the accumulated UE active session time in a cell for the measurement period. A UE is said to be ‘in session’ if any data on a DRB (UL or DL) has been transferred during the last 100 ms as illustrated in Figure 5-9 below.
Data Transfer
Time
in session out of session in session
100 msec 100 msec
pmSessionTimeUe +
Figure 5-9 UE Session Time
The description of the ‘pmSessionTimeUe’ counter is given in Figure 5-10 below.
Counter Name Managed Object Description Counter
Type
pmSessionTimeUe EutranCellFDD
This counter shows the accumulated active session time in a cell for the measurement period.
Number of session seconds aggregated for UEs in a cell. A UE is said to be ‘in session’ if any data on a DRB (UL or DL) has been transferred during the last 100 ms.
ACC
Figure 5-10 UE Session Time Counter
The ‘pmSessionTimeUe’ counter is reset at the end of each ROP and collected by the Primary scanner on the eNodeB.
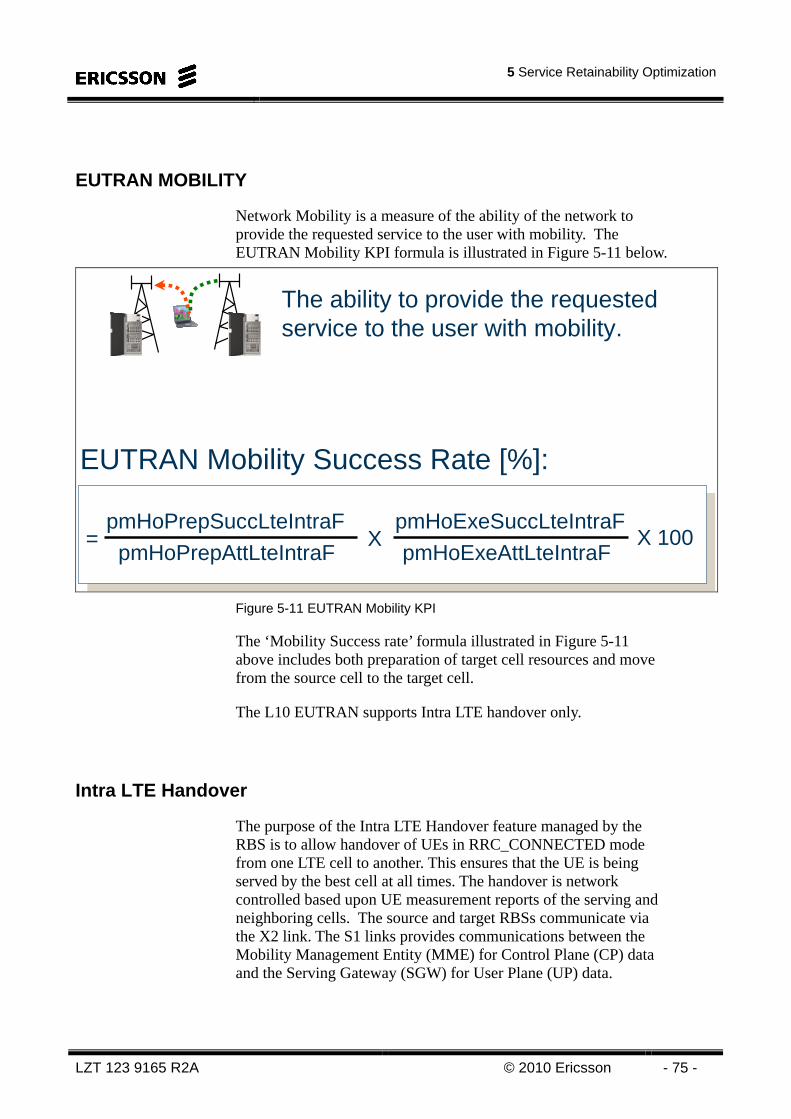
5 Service Retainability Optimization
LZT 123 9165 R2A © 2010 Ericsson - 75 -
EUTRAN MOBILITY
Network Mobility is a measure of the ability of the network to provide the requested service to the user with mobility. The EUTRAN Mobility KPI formula is illustrated in Figure 5-11 below.
EUTRAN Mobility Success Rate [%]:
The ability to provide the requested service to the user with mobility.
pmHoExeSuccLteIntraF
pmHoPrepAttLteIntraF
pmHoPrepSuccLteIntraF= X
pmHoExeAttLteIntraFX 100
Figure 5-11 EUTRAN Mobility KPI
The ‘Mobility Success rate’ formula illustrated in Figure 5-11 above includes both preparation of target cell resources and move from the source cell to the target cell.
The L10 EUTRAN supports Intra LTE handover only.
Intra LTE Handover
The purpose of the Intra LTE Handover feature managed by the RBS is to allow handover of UEs in RRC_CONNECTED mode from one LTE cell to another. This ensures that the UE is being served by the best cell at all times. The handover is network controlled based upon UE measurement reports of the serving and neighboring cells. The source and target RBSs communicate via the X2 link. The S1 links provides communications between the Mobility Management Entity (MME) for Control Plane (CP) data and the Serving Gateway (SGW) for User Plane (UP) data.
LTE L10 Optimization
- 76 - © Ericsson 2010 LZT 123 9165 R2A
The serving RBS System Information Broadcast (SIB) messages contain a number of parameters used by the UE to evaluate the surrounding cells in idle mode. When the UE enters connected mode it is sent the RRC CONNECTION RECONFIGURATION message with similar parameters to use in active mode. These parameters include a hysteresis and offset values, a time to trigger counter, and optionally cell specific offset margins. After HO the UE is sent a new RRC CONNECTION RECONFIGURATION message if any of the parameters change.
The UE measurements are reported to the serving RBS which makes the ultimate decision on the inter cell handover. Two types of measurements are used in the handover evaluation process: • RSRP (Reference Symbol Received Power) which represents
the mean measured power per reference symbol
• RSRQ (Reference Symbol Received Quality) which provides an indication of the reference signal quality
The intra LTE handover can be set to trigger on the RSRP value or the RSRQ value and the measurement reports sent by the UE contain either or both of these values.
There are three types of mobility procedures for intra LTE handover: • Intra-RBS Handover
Used when both the source and target cells reside in the same RBS.
• X2 based Inter-RBS Handover Used when an X2 relation exists between source and target cell. Usually this occurs when both cells are served by the same MME.
• S1 based Inter-RBS Handover Used when no X2 relation exists between source and target cell.
The Intra LTE handover types are illustrated in Figure 5-12 below.
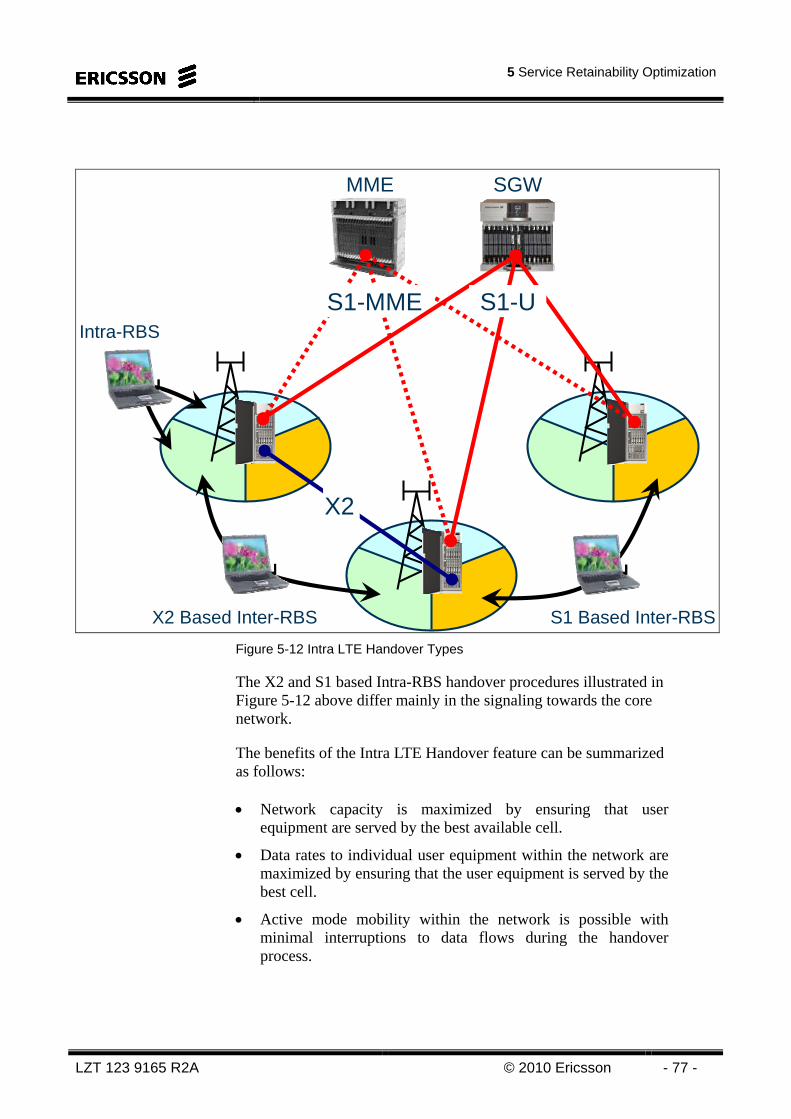
5 Service Retainability Optimization
LZT 123 9165 R2A © 2010 Ericsson - 77 -
X2
S1-MMEIntra-RBS
X2 Based Inter-RBS S1 Based Inter-RBS
MME SGW
S1-U
Figure 5-12 Intra LTE Handover Types
The X2 and S1 based Intra-RBS handover procedures illustrated in Figure 5-12 above differ mainly in the signaling towards the core network.
The benefits of the Intra LTE Handover feature can be summarized as follows: • Network capacity is maximized by ensuring that user
equipment are served by the best available cell.
• Data rates to individual user equipment within the network are maximized by ensuring that the user equipment is served by the best cell.
• Active mode mobility within the network is possible with minimal interruptions to data flows during the handover process.
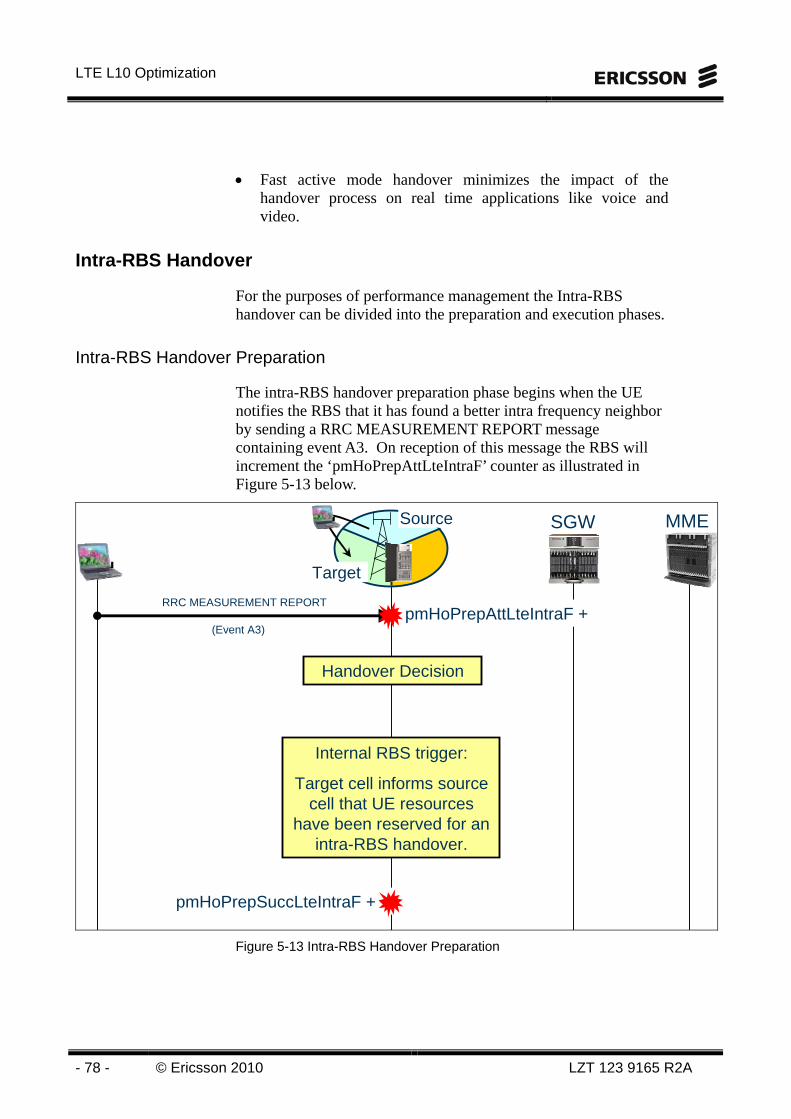
LTE L10 Optimization
- 78 - © Ericsson 2010 LZT 123 9165 R2A
• Fast active mode handover minimizes the impact of the handover process on real time applications like voice and video.
Intra-RBS Handover
For the purposes of performance management the Intra-RBS handover can be divided into the preparation and execution phases.
Intra-RBS Handover Preparation
The intra-RBS handover preparation phase begins when the UE notifies the RBS that it has found a better intra frequency neighbor by sending a RRC MEASUREMENT REPORT message containing event A3. On reception of this message the RBS will increment the ‘pmHoPrepAttLteIntraF’ counter as illustrated in Figure 5-13 below.
p
RRC MEASUREMENT REPORT
(Event A3) pmHoPrepAttLteIntraF +
Handover Decision
Internal RBS trigger:
Target cell informs source cell that UE resources
have been reserved for an intra-RBS handover.
pmHoPrepSuccLteIntraF +
Source
Target
MMESGW
Figure 5-13 Intra-RBS Handover Preparation
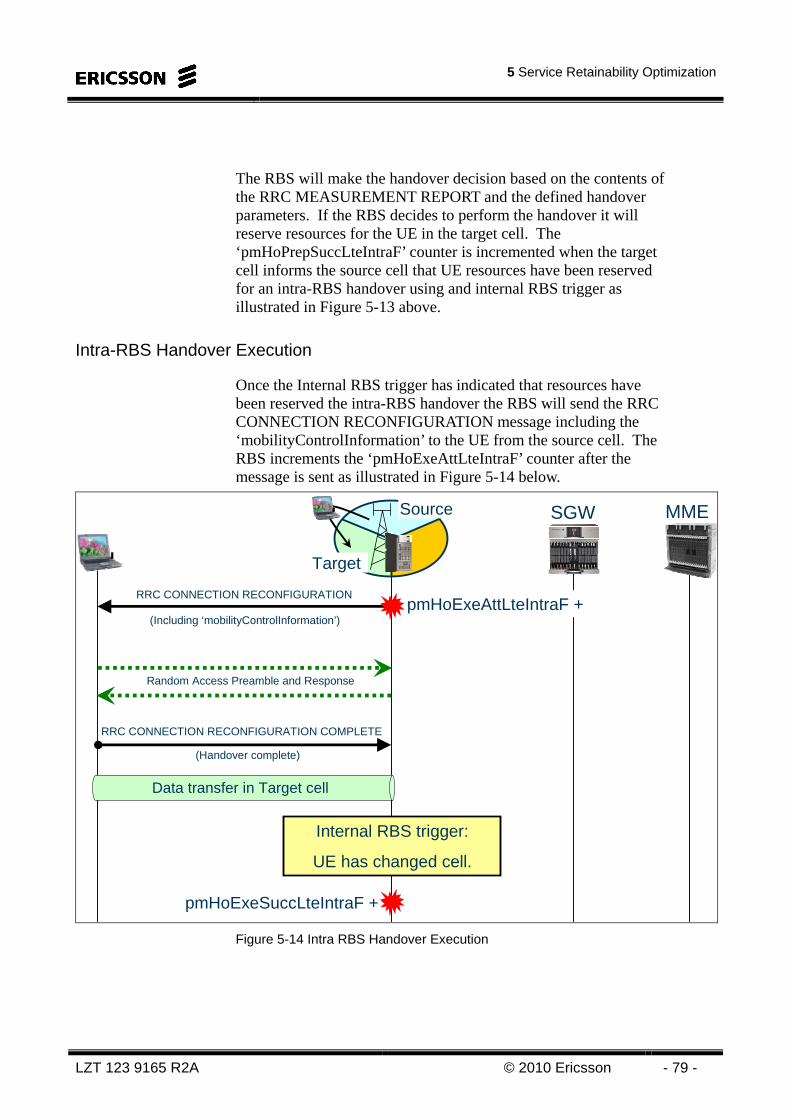
5 Service Retainability Optimization
LZT 123 9165 R2A © 2010 Ericsson - 79 -
The RBS will make the handover decision based on the contents of the RRC MEASUREMENT REPORT and the defined handover parameters. If the RBS decides to perform the handover it will reserve resources for the UE in the target cell. The ‘pmHoPrepSuccLteIntraF’ counter is incremented when the target cell informs the source cell that UE resources have been reserved for an intra-RBS handover using and internal RBS trigger as illustrated in Figure 5-13 above.
Intra-RBS Handover Execution
Once the Internal RBS trigger has indicated that resources have been reserved the intra-RBS handover the RBS will send the RRC CONNECTION RECONFIGURATION message including the ‘mobilityControlInformation’ to the UE from the source cell. The RBS increments the ‘pmHoExeAttLteIntraF’ counter after the message is sent as illustrated in Figure 5-14 below.
Random Access Preamble and Response
pmHoExeSuccLteIntraF +
RRC CONNECTION RECONFIGURATION
(Including ‘mobilityControlInformation’) pmHoExeAttLteIntraF +
RRC CONNECTION RECONFIGURATION COMPLETE
(Handover complete)
Internal RBS trigger:
UE has changed cell.
Source
Target
Data transfer in Target cell
MMESGW
Figure 5-14 Intra RBS Handover Execution
LTE L10 Optimization
- 80 - © Ericsson 2010 LZT 123 9165 R2A
After receiving the RRC CONNECTION RECONFIGURATION message the UE performs synchronization to the target cell and accesses it by sending a Random Access Preamble. If successful the UE will receive a Random Access Response from the target cell giving it an uplink allocation and Timing Advance.
When the UE has successfully accessed the target cell it sends the RRC CONNECTION RECONFIGURATION COMPLETE message indicating that the handover is complete and data transfer can begin in the target cell. Reception of this message will let the RBS know that the UE has changed cell. The ‘pmHoExeSuccLteIntraF’ counter is incremented on this internal RBS trigger as illustrated in Figure 5-14 above.
X2 Based Inter-RBS Handover
For the purposes of performance management the X2 based inter-RBS handover can be divided into the preparation and execution phases.
X2 Based Inter-RBS Handover Preparation
The X2 based inter-RBS handover preparation phase begins when the UE notifies the RBS that it has found a better intra frequency neighbor by sending a RRC MEASUREMENT REPORT message containing event A3. On reception of this message the RBS will increment the ‘pmHoPrepAttLteIntraF’ counter as illustrated in Figure 5-15 below.
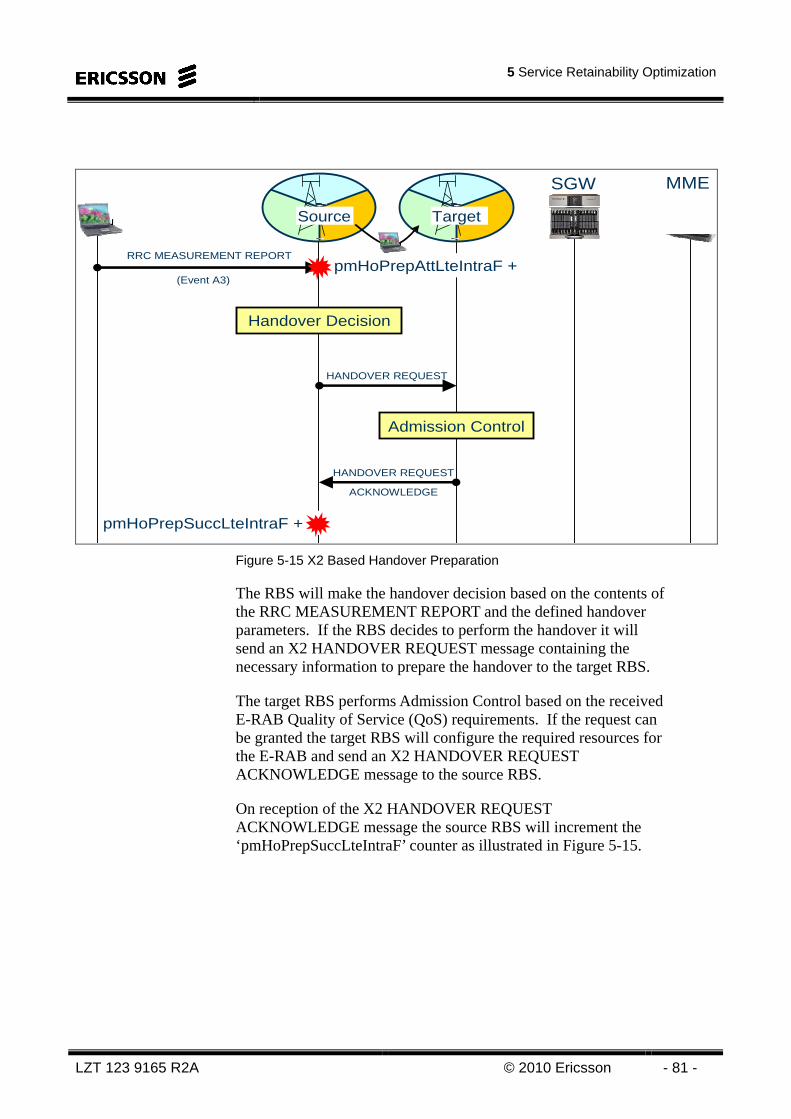
5 Service Retainability Optimization
LZT 123 9165 R2A © 2010 Ericsson - 81 -
HANDOVER REQUEST
RRC MEASUREMENT REPORT
(Event A3) pmHoPrepAttLteIntraF +
Handover Decision
HANDOVER REQUEST
ACKNOWLEDGE
pmHoPrepSuccLteIntraF +
Admission Control
Source Target
MMESGW
Figure 5-15 X2 Based Handover Preparation
The RBS will make the handover decision based on the contents of the RRC MEASUREMENT REPORT and the defined handover parameters. If the RBS decides to perform the handover it will send an X2 HANDOVER REQUEST message containing the necessary information to prepare the handover to the target RBS.
The target RBS performs Admission Control based on the received E-RAB Quality of Service (QoS) requirements. If the request can be granted the target RBS will configure the required resources for the E-RAB and send an X2 HANDOVER REQUEST ACKNOWLEDGE message to the source RBS.
On reception of the X2 HANDOVER REQUEST ACKNOWLEDGE message the source RBS will increment the ‘pmHoPrepSuccLteIntraF’ counter as illustrated in Figure 5-15.
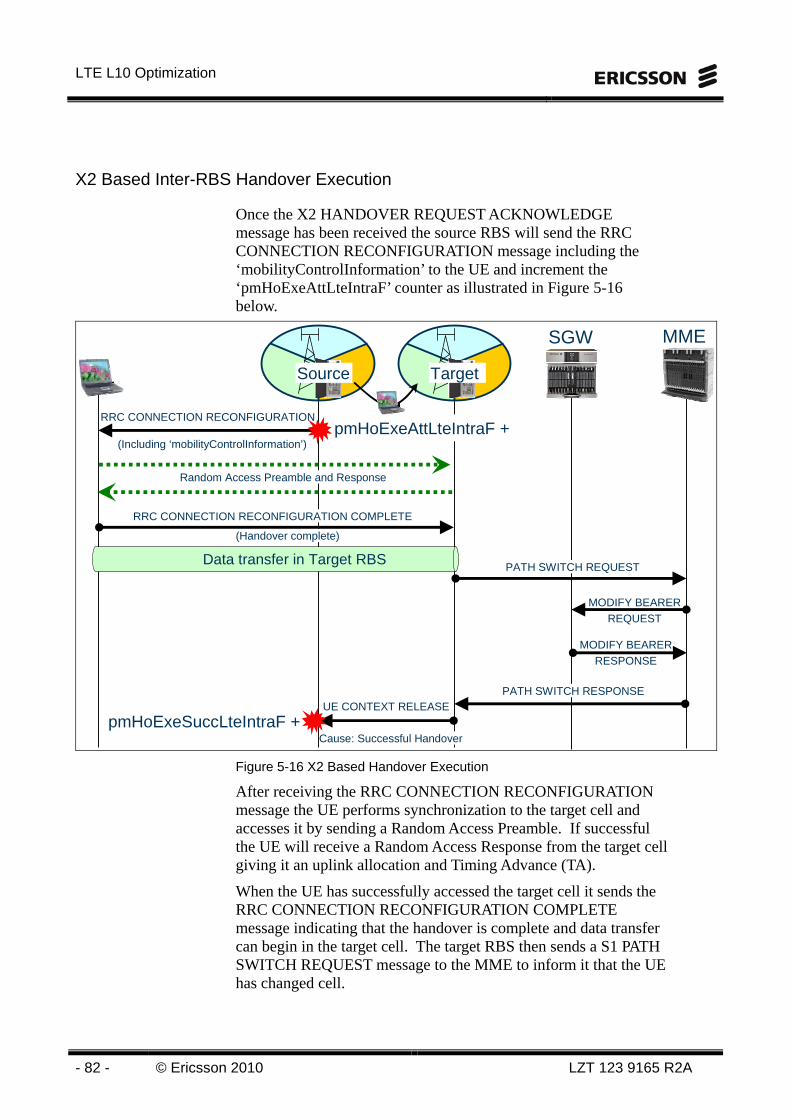
LTE L10 Optimization
- 82 - © Ericsson 2010 LZT 123 9165 R2A
X2 Based Inter-RBS Handover Execution
Once the X2 HANDOVER REQUEST ACKNOWLEDGE message has been received the source RBS will send the RRC CONNECTION RECONFIGURATION message including the ‘mobilityControlInformation’ to the UE and increment the ‘pmHoExeAttLteIntraF’ counter as illustrated in Figure 5-16 below.
Random Access Preamble and Response
MODIFY BEARER REQUEST
RRC CONNECTION RECONFIGURATION
(Including ‘mobilityControlInformation’) pmHoExeAttLteIntraF +
PATH SWITCH REQUEST
RRC CONNECTION RECONFIGURATION COMPLETE
(Handover complete)
PATH SWITCH RESPONSEUE CONTEXT RELEASE
Cause: Successful HandoverpmHoExeSuccLteIntraF +
Data transfer in Target RBS
Source Target
MMESGW
MODIFY BEARER RESPONSE
Figure 5-16 X2 Based Handover Execution
After receiving the RRC CONNECTION RECONFIGURATION message the UE performs synchronization to the target cell and accesses it by sending a Random Access Preamble. If successful the UE will receive a Random Access Response from the target cell giving it an uplink allocation and Timing Advance (TA).
When the UE has successfully accessed the target cell it sends the RRC CONNECTION RECONFIGURATION COMPLETE message indicating that the handover is complete and data transfer can begin in the target cell. The target RBS then sends a S1 PATH SWITCH REQUEST message to the MME to inform it that the UE has changed cell.
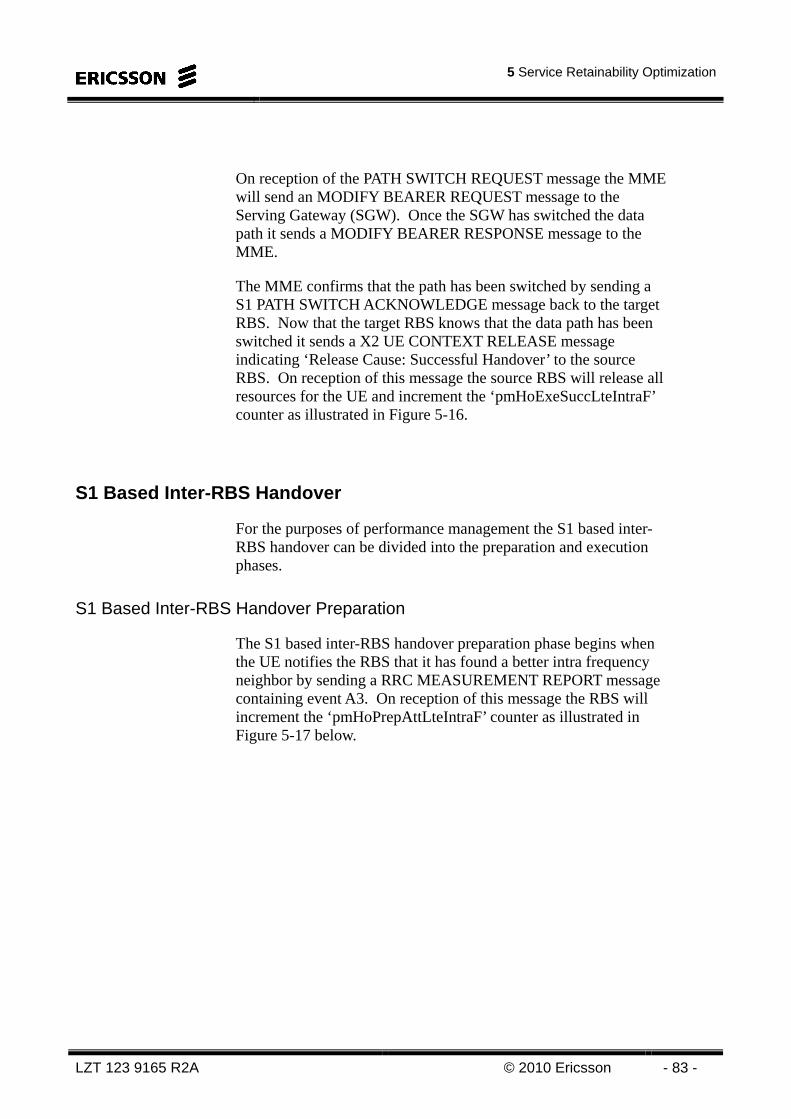
5 Service Retainability Optimization
LZT 123 9165 R2A © 2010 Ericsson - 83 -
On reception of the PATH SWITCH REQUEST message the MME will send an MODIFY BEARER REQUEST message to the Serving Gateway (SGW). Once the SGW has switched the data path it sends a MODIFY BEARER RESPONSE message to the MME.
The MME confirms that the path has been switched by sending a S1 PATH SWITCH ACKNOWLEDGE message back to the target RBS. Now that the target RBS knows that the data path has been switched it sends a X2 UE CONTEXT RELEASE message indicating ‘Release Cause: Successful Handover’ to the source RBS. On reception of this message the source RBS will release all resources for the UE and increment the ‘pmHoExeSuccLteIntraF’ counter as illustrated in Figure 5-16.
S1 Based Inter-RBS Handover
For the purposes of performance management the S1 based inter-RBS handover can be divided into the preparation and execution phases.
S1 Based Inter-RBS Handover Preparation
The S1 based inter-RBS handover preparation phase begins when the UE notifies the RBS that it has found a better intra frequency neighbor by sending a RRC MEASUREMENT REPORT message containing event A3. On reception of this message the RBS will increment the ‘pmHoPrepAttLteIntraF’ counter as illustrated in Figure 5-17 below.
LTE L10 Optimization
- 84 - © Ericsson 2010 LZT 123 9165 R2A
p
RRC MEASUREMENT REPORT
(Event A3) pmHoPrepAttLteIntraF +
Handover DecisionHANDOVER REQUIRED
Allocate resources
in target SGW
FORWARD
RELOCATIONREQUEST
HANDOVER REQUEST
HANDOVER REQUEST ACKNOWLEDGE
FORWARD
RELOCATIONRESPONSEHANDOVER COMMAND
Admission Control
pmHoPrepSuccLteIntraF +
Source Target
MMESGW
Target Source TargetSource
Figure 5-17 S1 Based Handover Preparation
The RBS will make the handover decision based on the contents of the RRC MEASUREMENT REPORT and the defined handover parameters. If the RBS decides to perform the handover it will send a S1 HANDOVER REQUIRED message containing the necessary information to prepare the handover to the MME. The target cell may or may not be controlled by this MME. In the example in Figure 5-17 above it is controlled by another MME meaning that there is a source and target MME.
The source MME identifies the target MME and sends it a FORWARD RELOCATION REQUEST message. At the reception of this message the target MME checks if the same SGW can be used. In the example in Figure 5-17 a new target SGW is needed and as such the target MME must allocate resources in the target SGW.
5 Service Retainability Optimization
LZT 123 9165 R2A © 2010 Ericsson - 85 -
Once SGW resources are ordered the target MME sends a S1 HANDOVER REQUEST message to the target RBS. On reception of this message the target RBS performs Admission Control based on the received E-RAB Quality of Service (QoS) requirements. If the request can be granted the target RBS will configure the required resources for the E-RAB and send a S1 HANDOVER REQUEST ACKNOWLEDGE message to the target MME. On reception of this message the target MME will respond to the source MME with a FORWARD RELOCATION RESPONSE message.
The source MME will then send a S1 HANDOVER COMMAND message to the source RBS. On reception of this message the source RBS will increment the ‘pmHoPrepSuccLteIntraF’ counter as illustrated in Figure 5-17.
S1 Based Inter-RBS Handover Execution
After receiving the S1 HANDOVER COMMAND message the source RBS will send the RRC CONNECTION RECONFIGURATION message including the ‘mobilityControlInformation’ the UE and increment the ‘pmHoExeAttLteIntraF’ counter as illustrated in Figure 5-18 below.
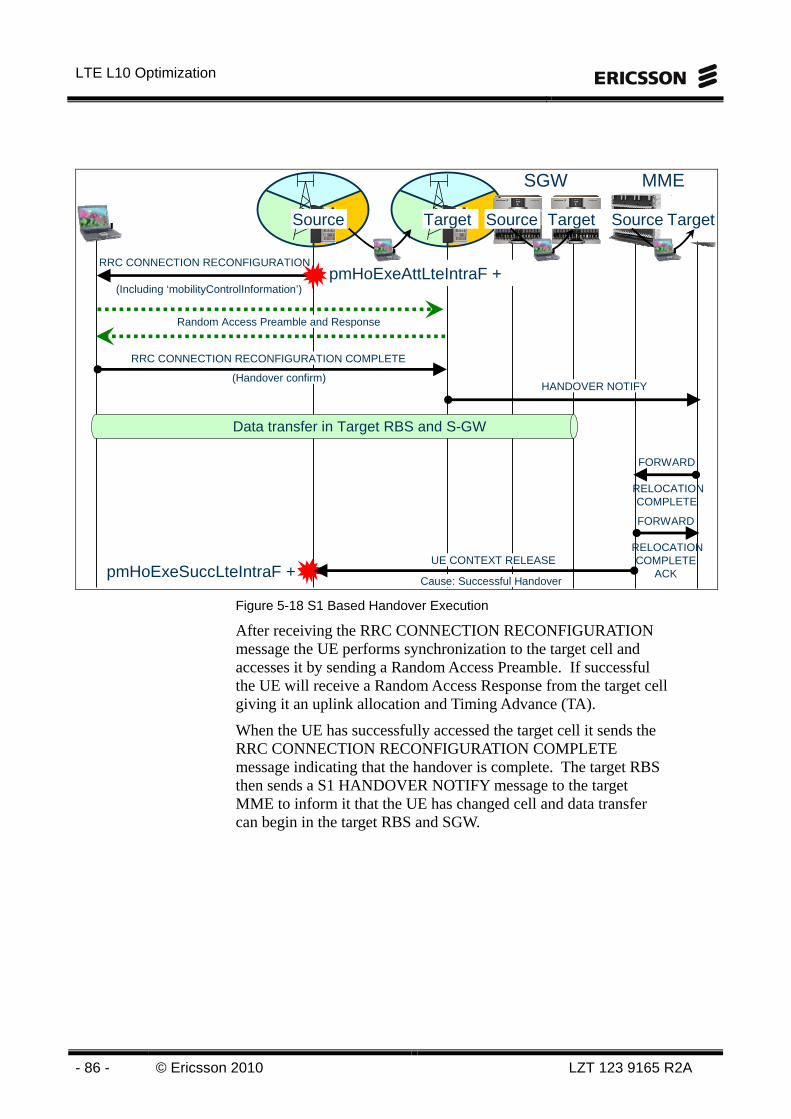
LTE L10 Optimization
- 86 - © Ericsson 2010 LZT 123 9165 R2A
Random Access Preamble and Response
FORWARD
RELOCATION COMPLETE
pmHoExeSuccLteIntraF +
RRC CONNECTION RECONFIGURATION
(Including ‘mobilityControlInformation’) pmHoExeAttLteIntraF +
HANDOVER NOTIFY
FORWARD
RELOCATION COMPLETE
ACKUE CONTEXT RELEASE
Cause: Successful Handover
Data transfer in Target RBS and S-GW
RRC CONNECTION RECONFIGURATION COMPLETE
(Handover confirm)
Source Target
MMESGW
Target Source TargetSource
Figure 5-18 S1 Based Handover Execution
After receiving the RRC CONNECTION RECONFIGURATION message the UE performs synchronization to the target cell and accesses it by sending a Random Access Preamble. If successful the UE will receive a Random Access Response from the target cell giving it an uplink allocation and Timing Advance (TA).
When the UE has successfully accessed the target cell it sends the RRC CONNECTION RECONFIGURATION COMPLETE message indicating that the handover is complete. The target RBS then sends a S1 HANDOVER NOTIFY message to the target MME to inform it that the UE has changed cell and data transfer can begin in the target RBS and SGW.
5 Service Retainability Optimization
LZT 123 9165 R2A © 2010 Ericsson - 87 -
The target MME informs the source MME that the handover was successful by sending a FORWARD RELOCATION COMPLETE message. When the source MME receives the FORWARD RELOCATION COMPLETE ACKNOWLEDGEMENT message it sends a S1 UE CONTEXT RELEASE message indicating ‘Release Cause: Successful Handover’ to the source RBS. On reception of this message the source RBS will release all resources for the UE and increment the ‘pmHoExeSuccLteIntraF’ counter as illustrated in Figure 5-18.
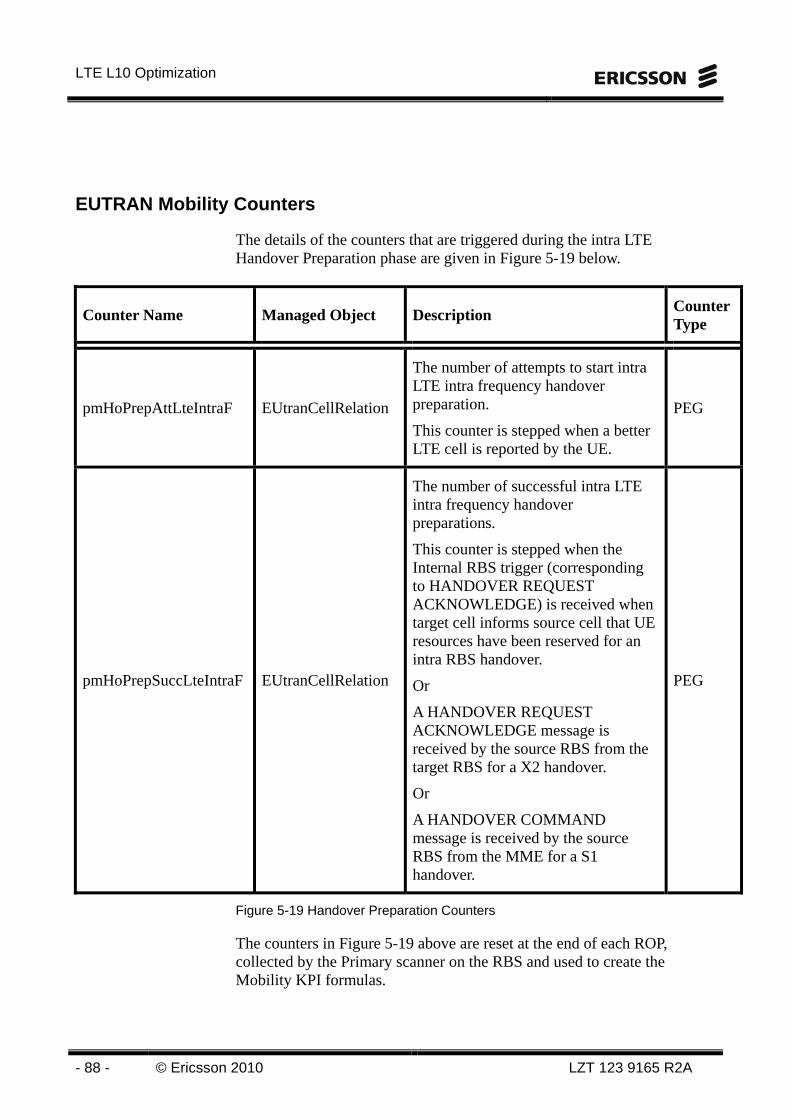
LTE L10 Optimization
- 88 - © Ericsson 2010 LZT 123 9165 R2A
EUTRAN Mobility Counters
The details of the counters that are triggered during the intra LTE Handover Preparation phase are given in Figure 5-19 below.
Counter Name Managed Object Description Counter Type
pmHoPrepAttLteIntraF EUtranCellRelation
The number of attempts to start intra LTE intra frequency handover preparation.
This counter is stepped when a better LTE cell is reported by the UE.
PEG
pmHoPrepSuccLteIntraF EUtranCellRelation
The number of successful intra LTE intra frequency handover preparations.
This counter is stepped when the Internal RBS trigger (corresponding to HANDOVER REQUEST ACKNOWLEDGE) is received when target cell informs source cell that UE resources have been reserved for an intra RBS handover.
Or
A HANDOVER REQUEST ACKNOWLEDGE message is received by the source RBS from the target RBS for a X2 handover.
Or
A HANDOVER COMMAND message is received by the source RBS from the MME for a S1 handover.
PEG
Figure 5-19 Handover Preparation Counters
The counters in Figure 5-19 above are reset at the end of each ROP, collected by the Primary scanner on the RBS and used to create the Mobility KPI formulas.
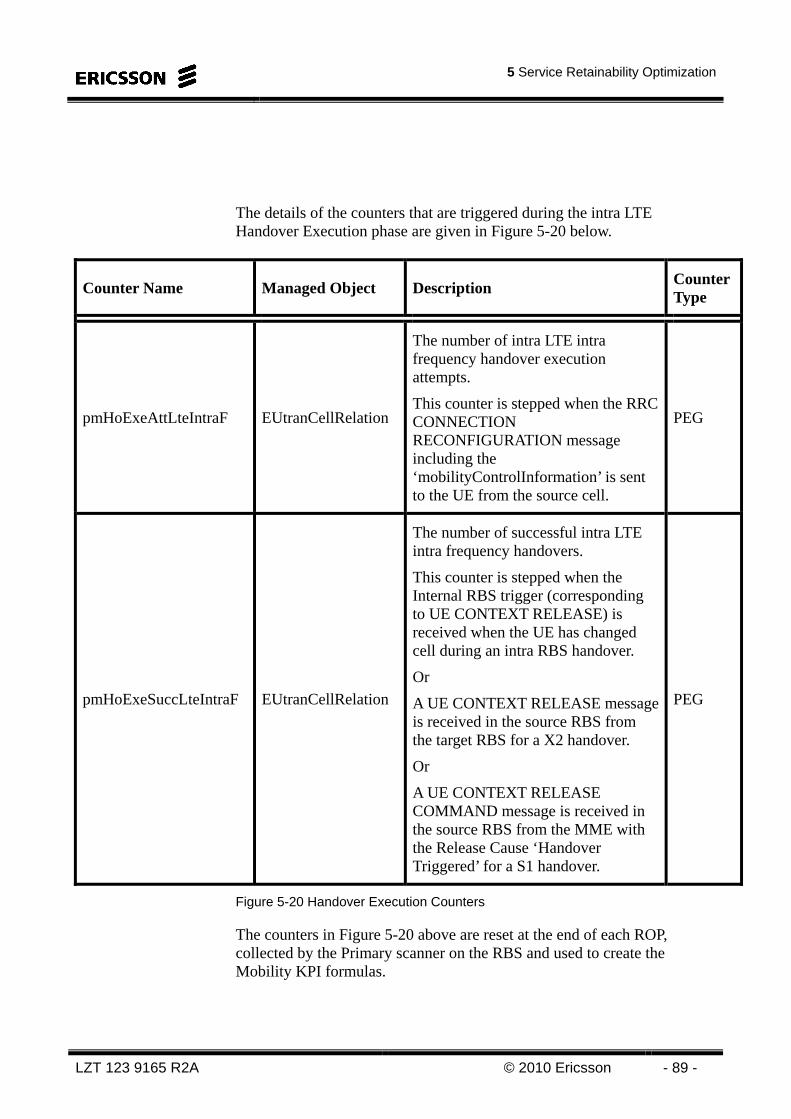
5 Service Retainability Optimization
LZT 123 9165 R2A © 2010 Ericsson - 89 -
The details of the counters that are triggered during the intra LTE Handover Execution phase are given in Figure 5-20 below.
Counter Name Managed Object Description Counter Type
pmHoExeAttLteIntraF EUtranCellRelation
The number of intra LTE intra frequency handover execution attempts.
This counter is stepped when the RRC CONNECTION RECONFIGURATION message including the ‘mobilityControlInformation’ is sent to the UE from the source cell.
PEG
pmHoExeSuccLteIntraF EUtranCellRelation
The number of successful intra LTE intra frequency handovers.
This counter is stepped when the Internal RBS trigger (corresponding to UE CONTEXT RELEASE) is received when the UE has changed cell during an intra RBS handover.
Or
A UE CONTEXT RELEASE message is received in the source RBS from the target RBS for a X2 handover.
Or
A UE CONTEXT RELEASE COMMAND message is received in the source RBS from the MME with the Release Cause ‘Handover Triggered’ for a S1 handover.
PEG
Figure 5-20 Handover Execution Counters
The counters in Figure 5-20 above are reset at the end of each ROP, collected by the Primary scanner on the RBS and used to create the Mobility KPI formulas.
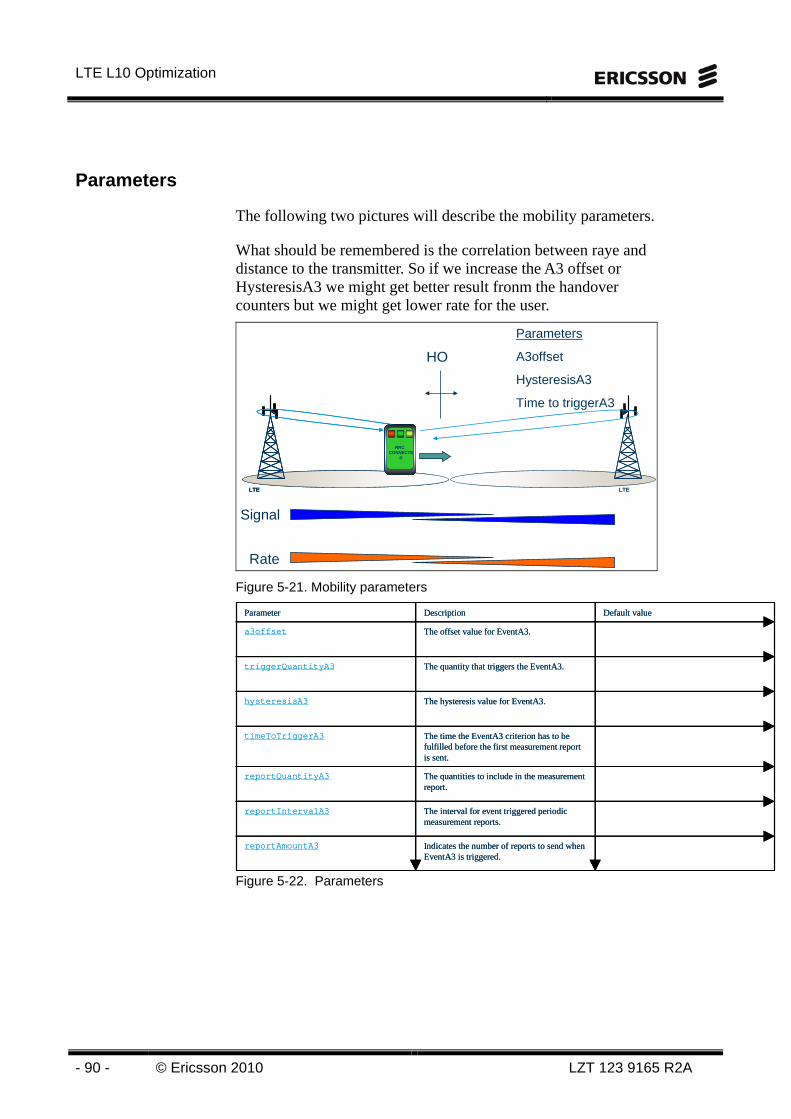
LTE L10 Optimization
- 90 - © Ericsson 2010 LZT 123 9165 R2A
Parameters
The following two pictures will describe the mobility parameters.
What should be remembered is the correlation between raye and distance to the transmitter. So if we increase the A3 offset or HysteresisA3 we might get better result fronm the handover counters but we might get lower rate for the user.
S
LTE
RRC_CONNECTE
D
LTE
RRC_CONNECTE
D
RRC_CONNECTE
D
LTE
Signal
Rate
HO
Parameters
A3offset
HysteresisA3
Time to triggerA3
Figure 5-21. Mobility parameters
Indicates the number of reports to send when EventA3 is triggered.
reportAmountA3
The interval for event triggered periodic measurement reports.
reportIntervalA3
The quantities to include in the measurement report.
reportQuantityA3
The time the EventA3 criterion has to be fulfilled before the first measurement report is sent.
timeToTriggerA3
The hysteresis value for EventA3.hysteresisA3
The quantity that triggers the EventA3.triggerQuantityA3
The offset value for EventA3. a3offset
Default valueDescriptionParameter
Figure 5-22. Parameters
5 Service Retainability Optimization
LZT 123 9165 R2A © 2010 Ericsson - 91 -
SUMMARY
After this chapter the participants will be able to:Perform retainability data analysis according to collected dataDescribe formulas for retainabili ty according to the defined KPI ’sand available countersPerform data analysis of counter statisticsPropose changes to enhance retainability
Figure 5-23 Summary of Chapter 5

LTE L10 Optimization
- 92 - © Ericsson 2010 LZT 123 9165 R2A
Intentionally Blank
6 Service Integrity Optimization
LZT 123 9165 R2A © 2010 Ericsson - 93 -
6 Service Integrity Optimization
Objectives After this chapter the partic ipants will be able to:Perform Integrity data analysis according to collected dataDescribe formulas for Integrity according to the defined KPI ’sand available countersPerform data analysis of counter statisticsPropose changes to enhance integrity
Figure 6-1. Objectives of chapter 6

LTE L10 Optimization
- 94 - © Ericsson 2010 LZT 123 9165 R2A
Intentionally Blank
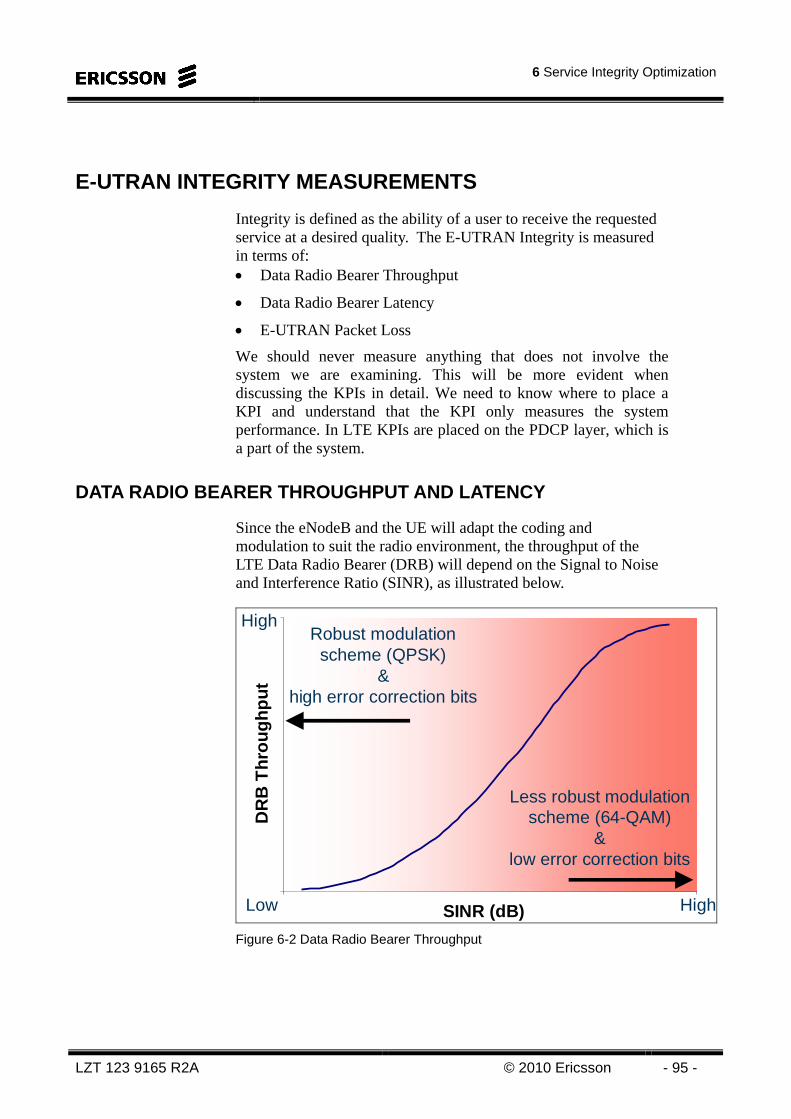
6 Service Integrity Optimization
LZT 123 9165 R2A © 2010 Ericsson - 95 -
E-UTRAN INTEGRITY MEASUREMENTS
Integrity is defined as the ability of a user to receive the requested service at a desired quality. The E-UTRAN Integrity is measured in terms of: • Data Radio Bearer Throughput
• Data Radio Bearer Latency
• E-UTRAN Packet Loss
We should never measure anything that does not involve the system we are examining. This will be more evident when discussing the KPIs in detail. We need to know where to place a KPI and understand that the KPI only measures the system performance. In LTE KPIs are placed on the PDCP layer, which is a part of the system.
DATA RADIO BEARER THROUGHPUT AND LATENCY
Since the eNodeB and the UE will adapt the coding and modulation to suit the radio environment, the throughput of the LTE Data Radio Bearer (DRB) will depend on the Signal to Noise and Interference Ratio (SINR), as illustrated below.
DR
B T
hrou
ghpu
t
SINR (dB)
High
Low High
Robust modulation scheme (QPSK)
& high error correction bits
Less robust modulation scheme (64-QAM)
& low error correction bits
Figure 6-2 Data Radio Bearer Throughput
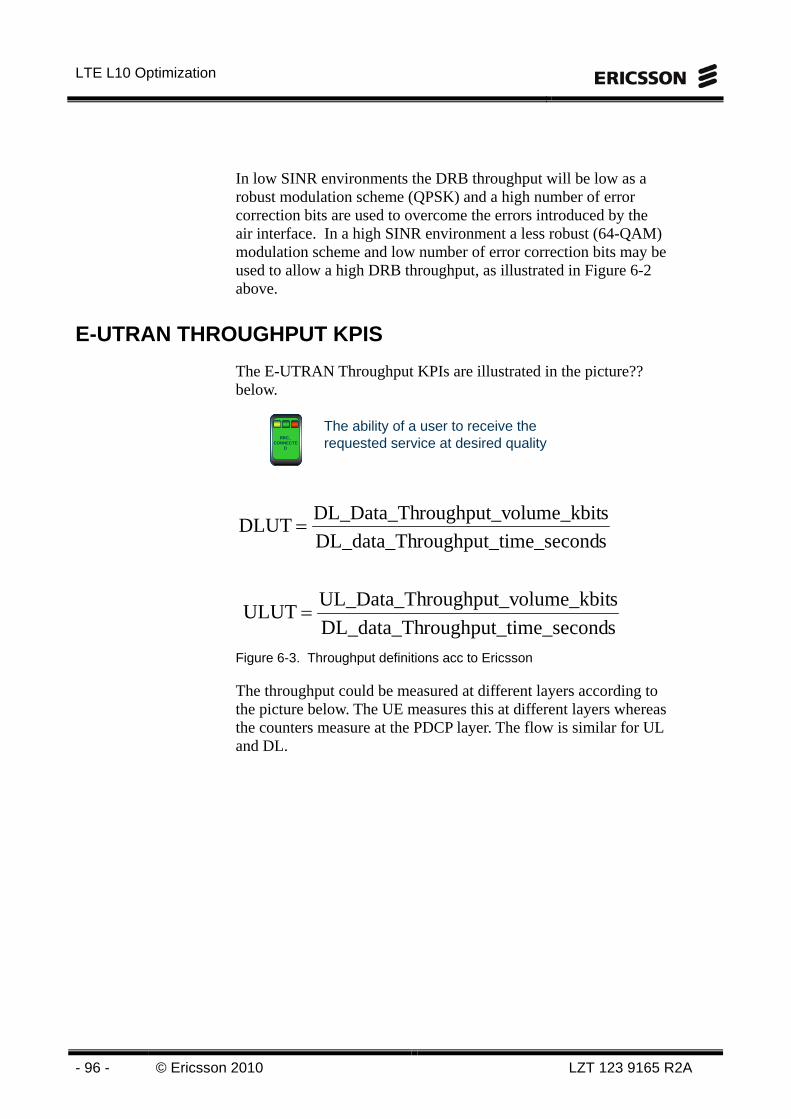
LTE L10 Optimization
- 96 - © Ericsson 2010 LZT 123 9165 R2A
In low SINR environments the DRB throughput will be low as a robust modulation scheme (QPSK) and a high number of error correction bits are used to overcome the errors introduced by the air interface. In a high SINR environment a less robust (64-QAM) modulation scheme and low number of error correction bits may be used to allow a high DRB throughput, as illustrated in Figure 6-2 above.
E-UTRAN THROUGHPUT KPIS
The E-UTRAN Throughput KPIs are illustrated in the picture?? below.
sime_secondroughput_tDL_data_Th
solume_kbitroughput_vUL_Data_ThULUT =
sime_secondroughput_tDL_data_Th
solume_kbitroughput_vDL_Data_ThDLUT =
The ability of a user to receive the requested service at desired quality
RRC_CONNECTE
D
RRC_CONNECTE
D
Figure 6-3. Throughput definitions acc to Ericsson
The throughput could be measured at different layers according to the picture below. The UE measures this at different layers whereas the counters measure at the PDCP layer. The flow is similar for UL and DL.
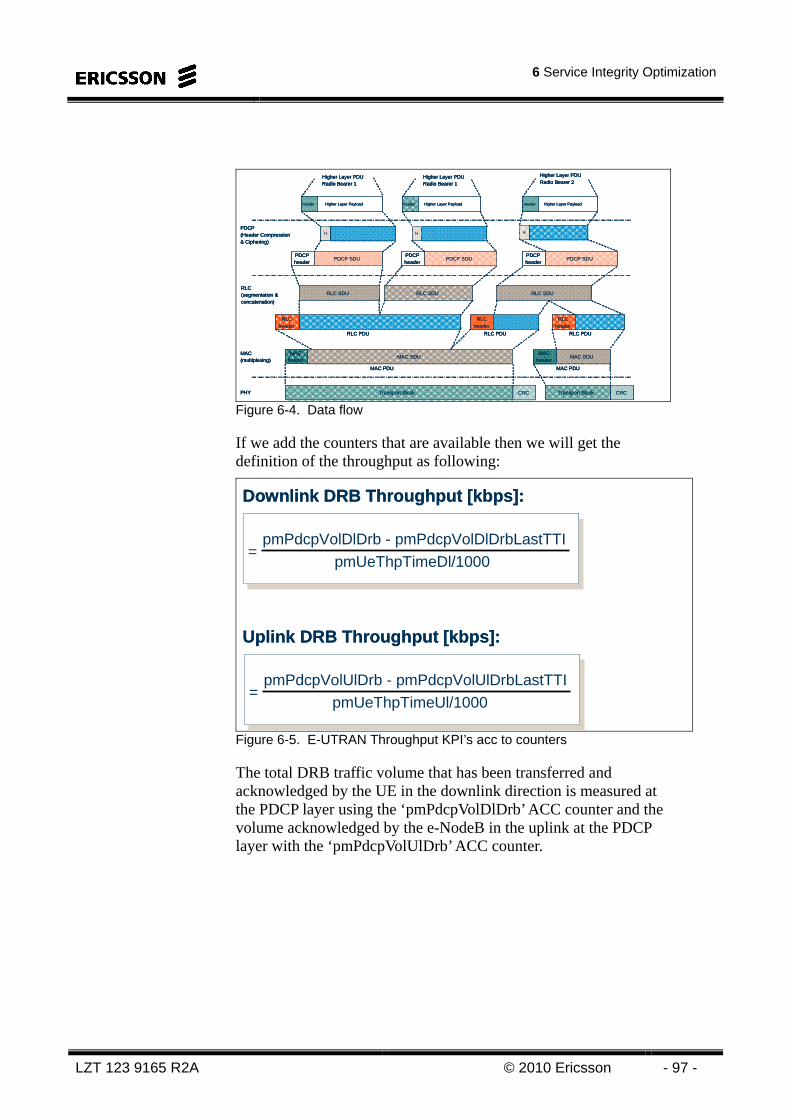
6 Service Integrity Optimization
LZT 123 9165 R2A © 2010 Ericsson - 97 -
PDCP SDU
Higher Layer Payloadheader
HPDCP(Header Compression& Ciphering)
PDCPheader
Higher Layer PDURadio Bearer 1
RLC SDU
MAC(multiplexing)
MAC SDU
CRCPHY Transport Block
MACheader
Higher Layer Payloadheader Higher Layer Payloadheader
Higher Layer PDURadio Bearer 1
Higher Layer PDURadio Bearer 2
H H
PDCP SDUPDCPheader
PDCP SDUPDCPheader
RLCheader
RLCheader
RLC SDU
RLCheader
RLC SDU
MAC SDUMAC
header
CRCTransport Block
RLC PDU RLC PDU RLC PDU
MAC PDU MAC PDU
RLC(segmentation & concatenation)
Figure 6-4. Data flow
If we add the counters that are available then we will get the definition of the throughput as following:
Downlink DRB Throughput [kbps]:
pmUeThpTimeDl/1000
pmPdcpVolDlDrb - pmPdcpVolDlDrbLastTTI=
Uplink DRB Throughput [kbps]:
pmUeThpTimeUl/1000
pmPdcpVolUlDrb - pmPdcpVolUlDrbLastTTI=
Downlink DRB Throughput [kbps]:
pmUeThpTimeDl/1000
pmPdcpVolDlDrb - pmPdcpVolDlDrbLastTTI=
Uplink DRB Throughput [kbps]:
pmUeThpTimeUl/1000
pmPdcpVolUlDrb - pmPdcpVolUlDrbLastTTI=
Figure 6-5. E-UTRAN Throughput KPI’s acc to counters
The total DRB traffic volume that has been transferred and acknowledged by the UE in the downlink direction is measured at the PDCP layer using the ‘pmPdcpVolDlDrb’ ACC counter and the volume acknowledged by the e-NodeB in the uplink at the PDCP layer with the ‘pmPdcpVolUlDrb’ ACC counter.
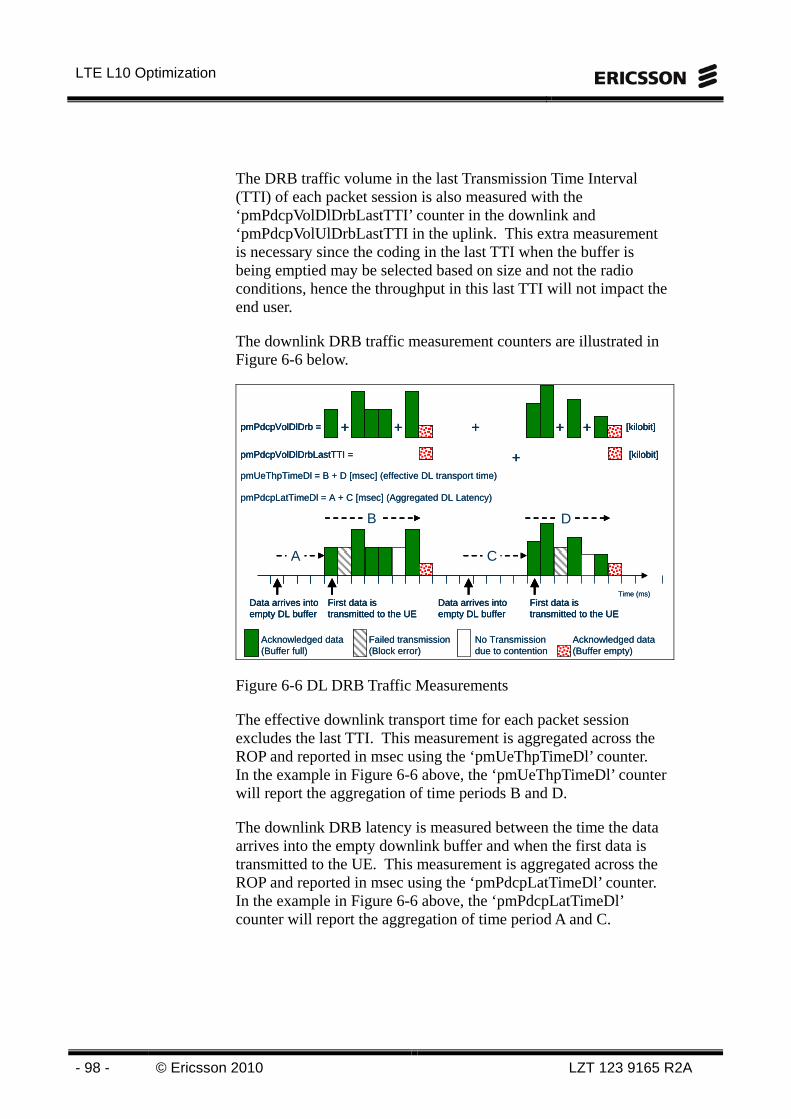
LTE L10 Optimization
- 98 - © Ericsson 2010 LZT 123 9165 R2A
The DRB traffic volume in the last Transmission Time Interval (TTI) of each packet session is also measured with the ‘pmPdcpVolDlDrbLastTTI’ counter in the downlink and ‘pmPdcpVolUlDrbLastTTI in the uplink. This extra measurement is necessary since the coding in the last TTI when the buffer is being emptied may be selected based on size and not the radio conditions, hence the throughput in this last TTI will not impact the end user.
The downlink DRB traffic measurement counters are illustrated in Figure 6-6 below.
Time (ms)Data arrives into empty DL buffer
Acknowledged data (Buffer full)
Failed transmission(Block error)
No Transmissiondue to contention
Acknowledged data (Buffer empty)
A C
B
pmPdcpVolDlDrb = + + + ++ [kilobit]
pmPdcpVolDlDrbLastTTI = + [kilobit]
pmPdcpLatTimeDl = A + C [msec] (Aggregated DL Latency)
pmUeThpTimeDl = B + D [msec] (effective DL transport time)
First data is transmitted to the UE
Data arrives into empty DL buffer
D
First data is transmitted to the UE
Time (ms)Data arrives into empty DL bufferData arrives into empty DL buffer
Acknowledged data (Buffer full)
Failed transmission(Block error)
No Transmissiondue to contention
Acknowledged data (Buffer empty)
AA CC
BB
pmPdcpVolDlDrb = + + + ++ [kilobit]pmPdcpVolDlDrb = + + + ++ [kilobit]
pmPdcpVolDlDrbLastTTI = + [kilobit]pmPdcpVolDlDrbLastTTI = + [kilobit]
pmPdcpLatTimeDl = A + C [msec] (Aggregated DL Latency)
pmUeThpTimeDl = B + D [msec] (effective DL transport time)
First data is transmitted to the UEFirst data is transmitted to the UE
Data arrives into empty DL bufferData arrives into empty DL buffer
DD
First data is transmitted to the UEFirst data is transmitted to the UE
Figure 6-6 DL DRB Traffic Measurements
The effective downlink transport time for each packet session excludes the last TTI. This measurement is aggregated across the ROP and reported in msec using the ‘pmUeThpTimeDl’ counter. In the example in Figure 6-6 above, the ‘pmUeThpTimeDl’ counter will report the aggregation of time periods B and D.
The downlink DRB latency is measured between the time the data arrives into the empty downlink buffer and when the first data is transmitted to the UE. This measurement is aggregated across the ROP and reported in msec using the ‘pmPdcpLatTimeDl’ counter. In the example in Figure 6-6 above, the ‘pmPdcpLatTimeDl’ counter will report the aggregation of time period A and C.
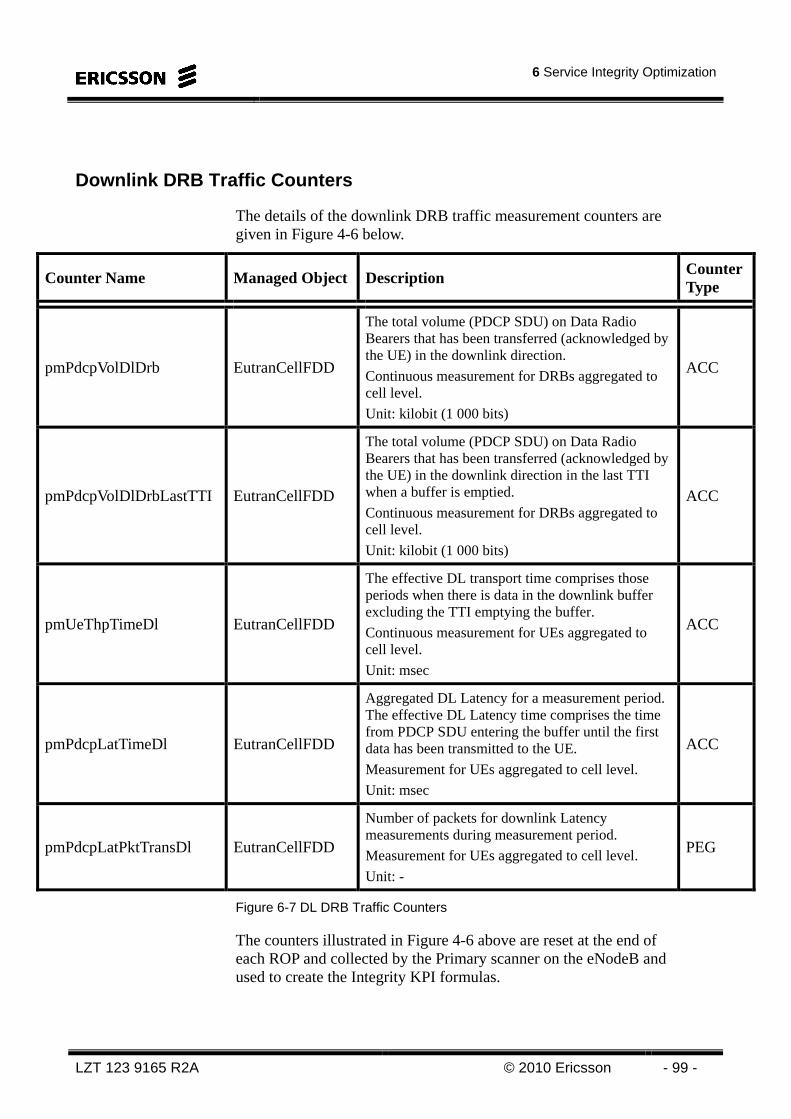
6 Service Integrity Optimization
LZT 123 9165 R2A © 2010 Ericsson - 99 -
Downlink DRB Traffic Counters
The details of the downlink DRB traffic measurement counters are given in Figure 4-6 below.
Counter Name Managed Object Description Counter Type
pmPdcpVolDlDrb EutranCellFDD
The total volume (PDCP SDU) on Data Radio Bearers that has been transferred (acknowledged by the UE) in the downlink direction.
Continuous measurement for DRBs aggregated to cell level.
Unit: kilobit (1 000 bits)
ACC
pmPdcpVolDlDrbLastTTI EutranCellFDD
The total volume (PDCP SDU) on Data Radio Bearers that has been transferred (acknowledged by the UE) in the downlink direction in the last TTI when a buffer is emptied.
Continuous measurement for DRBs aggregated to cell level.
Unit: kilobit (1 000 bits)
ACC
pmUeThpTimeDl EutranCellFDD
The effective DL transport time comprises those periods when there is data in the downlink buffer excluding the TTI emptying the buffer.
Continuous measurement for UEs aggregated to cell level.
Unit: msec
ACC
pmPdcpLatTimeDl EutranCellFDD
Aggregated DL Latency for a measurement period. The effective DL Latency time comprises the time from PDCP SDU entering the buffer until the first data has been transmitted to the UE.
Measurement for UEs aggregated to cell level.
Unit: msec
ACC
pmPdcpLatPktTransDl EutranCellFDD
Number of packets for downlink Latency measurements during measurement period.
Measurement for UEs aggregated to cell level.
Unit: -
PEG
Figure 6-7 DL DRB Traffic Counters
The counters illustrated in Figure 4-6 above are reset at the end of each ROP and collected by the Primary scanner on the eNodeB and used to create the Integrity KPI formulas.
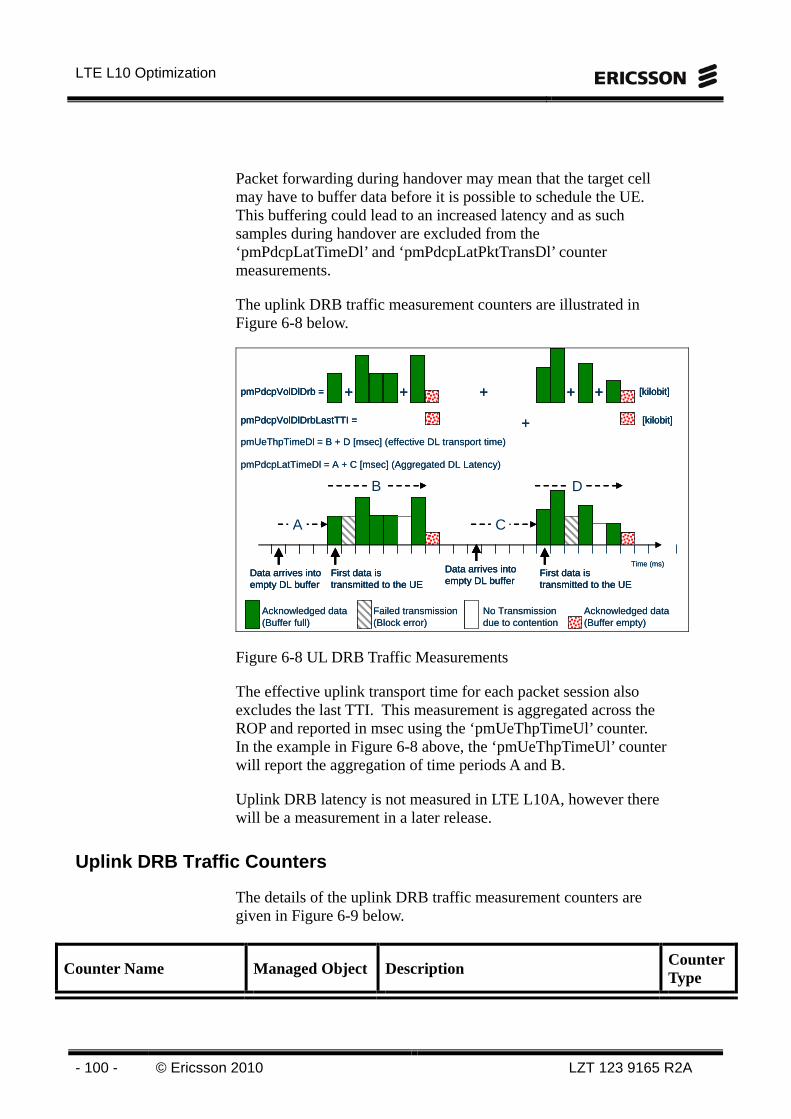
LTE L10 Optimization
- 100 - © Ericsson 2010 LZT 123 9165 R2A
Packet forwarding during handover may mean that the target cell may have to buffer data before it is possible to schedule the UE. This buffering could lead to an increased latency and as such samples during handover are excluded from the ‘pmPdcpLatTimeDl’ and ‘pmPdcpLatPktTransDl’ counter measurements.
The uplink DRB traffic measurement counters are illustrated in Figure 6-8 below.
Time (ms)Data arrives into empty DL buffer
Acknowledged data (Buffer full)
Failed transmission(Block error)
No Transmissiondue to contention
Acknowledged data (Buffer empty)
A C
B
pmPdcpVolDlDrb = + + + ++ [kilobit]
pmPdcpVolDlDrbLastTTI = + [kilobit]
pmPdcpLatTimeDl = A + C [msec] (Aggregated DL Latency)
pmUeThpTimeDl = B + D [msec] (effective DL transport time)
First data is transmitted to the UE
Data arrives into empty DL buffer
D
First data is transmitted to the UE
Time (ms)Data arrives into empty DL bufferData arrives into empty DL buffer
Acknowledged data (Buffer full)
Failed transmission(Block error)
No Transmissiondue to contention
Acknowledged data (Buffer empty)
AA CC
BB
pmPdcpVolDlDrb = + + + ++ [kilobit]pmPdcpVolDlDrb = + + + ++ [kilobit]
pmPdcpVolDlDrbLastTTI = + [kilobit]pmPdcpVolDlDrbLastTTI = + [kilobit]
pmPdcpLatTimeDl = A + C [msec] (Aggregated DL Latency)
pmUeThpTimeDl = B + D [msec] (effective DL transport time)
First data is transmitted to the UEFirst data is transmitted to the UE
Data arrives into empty DL bufferData arrives into empty DL buffer
DD
First data is transmitted to the UEFirst data is transmitted to the UE
Figure 6-8 UL DRB Traffic Measurements
The effective uplink transport time for each packet session also excludes the last TTI. This measurement is aggregated across the ROP and reported in msec using the ‘pmUeThpTimeUl’ counter. In the example in Figure 6-8 above, the ‘pmUeThpTimeUl’ counter will report the aggregation of time periods A and B.
Uplink DRB latency is not measured in LTE L10A, however there will be a measurement in a later release.
Uplink DRB Traffic Counters
The details of the uplink DRB traffic measurement counters are given in Figure 6-9 below.
Counter Name Managed Object Description Counter Type
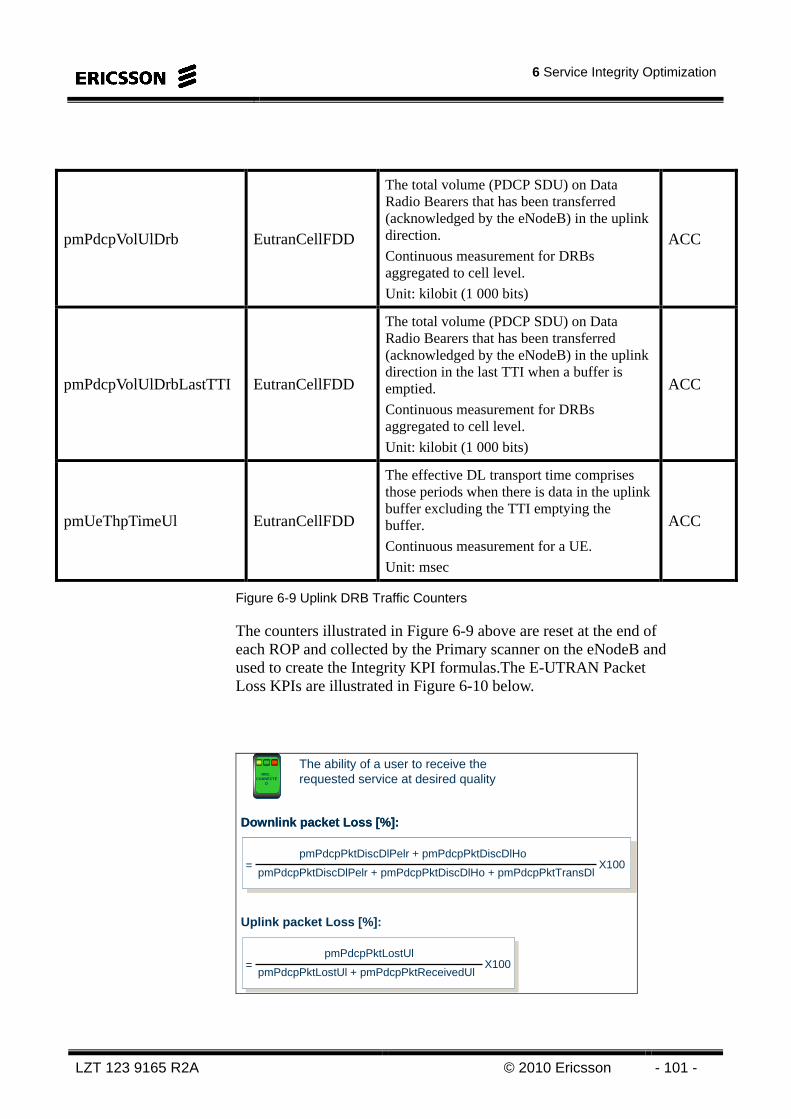
6 Service Integrity Optimization
LZT 123 9165 R2A © 2010 Ericsson - 101 -
pmPdcpVolUlDrb EutranCellFDD
The total volume (PDCP SDU) on Data Radio Bearers that has been transferred (acknowledged by the eNodeB) in the uplink direction.
Continuous measurement for DRBs aggregated to cell level.
Unit: kilobit (1 000 bits)
ACC
pmPdcpVolUlDrbLastTTI EutranCellFDD
The total volume (PDCP SDU) on Data Radio Bearers that has been transferred (acknowledged by the eNodeB) in the uplink direction in the last TTI when a buffer is emptied.
Continuous measurement for DRBs aggregated to cell level.
Unit: kilobit (1 000 bits)
ACC
pmUeThpTimeUl EutranCellFDD
The effective DL transport time comprises those periods when there is data in the uplink buffer excluding the TTI emptying the buffer.
Continuous measurement for a UE.
Unit: msec
ACC
Figure 6-9 Uplink DRB Traffic Counters
The counters illustrated in Figure 6-9 above are reset at the end of each ROP and collected by the Primary scanner on the eNodeB and used to create the Integrity KPI formulas.The E-UTRAN Packet Loss KPIs are illustrated in Figure 6-10 below.
Downlink packet Loss [%]:
pmPdcpPktDiscDlPelr + pmPdcpPktDiscDlHo + pmPdcpPktTransDl=
pmPdcpPktDiscDlPelr + pmPdcpPktDiscDlHoX100
Downlink packet Loss [%]:
pmPdcpPktDiscDlPelr + pmPdcpPktDiscDlHo + pmPdcpPktTransDl=
pmPdcpPktDiscDlPelr + pmPdcpPktDiscDlHoX100
The ability of a user to receive the requested service at desired quality
Uplink packet Loss [%]:
pmPdcpPktLostUl + pmPdcpPktReceivedUl=
pmPdcpPktLostUlX100
RRC_CONNECTE
D
RRC_CONNECTE
D
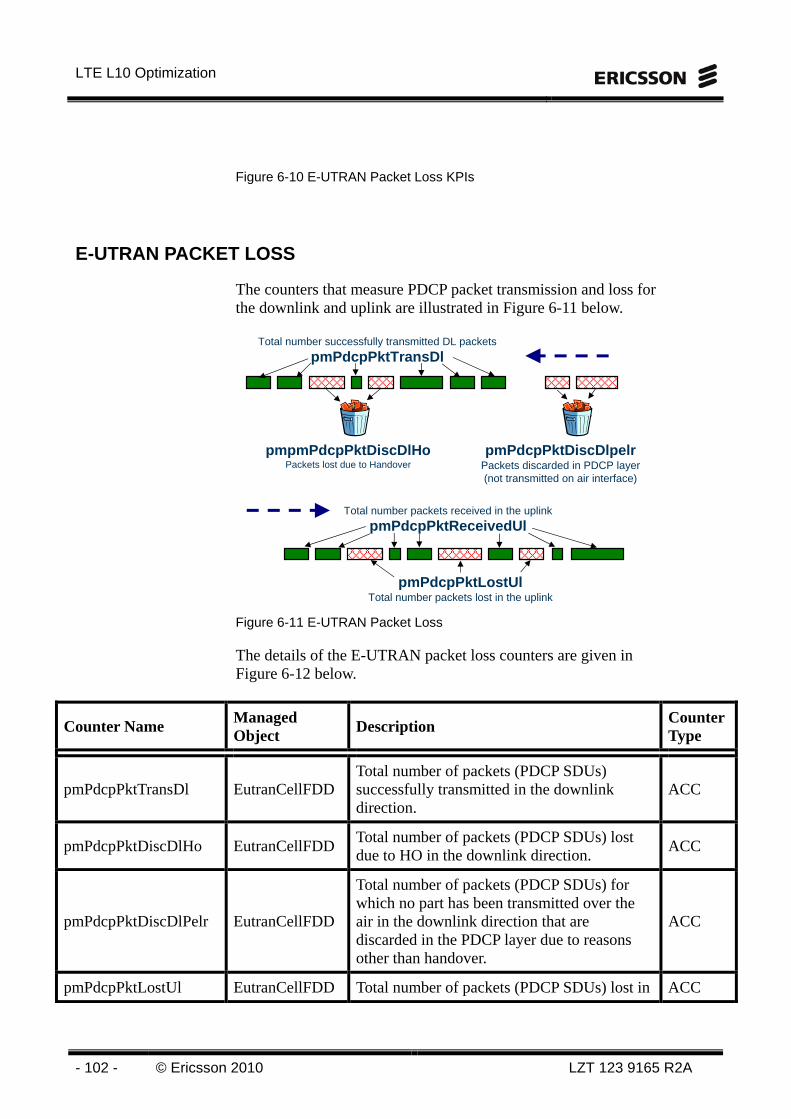
LTE L10 Optimization
- 102 - © Ericsson 2010 LZT 123 9165 R2A
Figure 6-10 E-UTRAN Packet Loss KPIs
E-UTRAN PACKET LOSS
The counters that measure PDCP packet transmission and loss for the downlink and uplink are illustrated in Figure 6-11 below.
Total number successfully transmitted DL packets
pmPdcpPktTransDl
pmpmPdcpPktDiscDlHoPackets lost due to Handover
pmPdcpPktDiscDlpelrPackets discarded in PDCP layer (not transmitted on air interface)
Total number packets received in the uplink
pmPdcpPktReceivedUl
pmPdcpPktLostUlTotal number packets lost in the uplink
Figure 6-11 E-UTRAN Packet Loss
The details of the E-UTRAN packet loss counters are given in Figure 6-12 below.
Counter Name Managed Object
Description Counter Type
pmPdcpPktTransDl EutranCellFDD Total number of packets (PDCP SDUs) successfully transmitted in the downlink direction.
ACC
pmPdcpPktDiscDlHo EutranCellFDD Total number of packets (PDCP SDUs) lost due to HO in the downlink direction.
ACC
pmPdcpPktDiscDlPelr EutranCellFDD
Total number of packets (PDCP SDUs) for which no part has been transmitted over the air in the downlink direction that are discarded in the PDCP layer due to reasons other than handover.
ACC
pmPdcpPktLostUl EutranCellFDD Total number of packets (PDCP SDUs) lost in ACC
6 Service Integrity Optimization
LZT 123 9165 R2A © 2010 Ericsson - 103 -
the uplink direction.
pmPdcpPktReceivedUl EutranCellFDD Total number of packets (PDCP SDUs) received in the uplink direction.
ACC
Figure 6-12 E-UTRAN Packet Loss Counters
The counters illustrated in Figure 6-12 are reset at the end of each ROP and all but ‘pmPdcpPktDiscDlHo’ are collected by the Primary scanner on the eNodeB and used to create the Integrity KPI formulas.
The E-UTRAN Latency KPIs are illustrated in Figure 6-13 below.
Downlink DRB Latency [ms]:
pmPdcpLatPktTransDl
pmPdcpLatTimeDl=
Uplink DRB Latency [ms]:
Not measuredin LTE L10A
The ability of a user to receive the requested service at desired qualityRRC_
CONNECTED
RRC_CONNECTE
D
Figure 6-13 E-UTRAN Latency KPIs
The Downlink Latency is defined as the time between reception of IP packets in an empty DL buffer in the RBS and the time when the RBS transmits the first block on the air interface to the UE.
The Uplink DRB Latency is not measured in LTE L10A and Ericsson does not recommend this as a measurement in LTE acceptance tests since this will only measure the performance of the UE. Round Trip Time is a much better measurement for LTE acceptance.
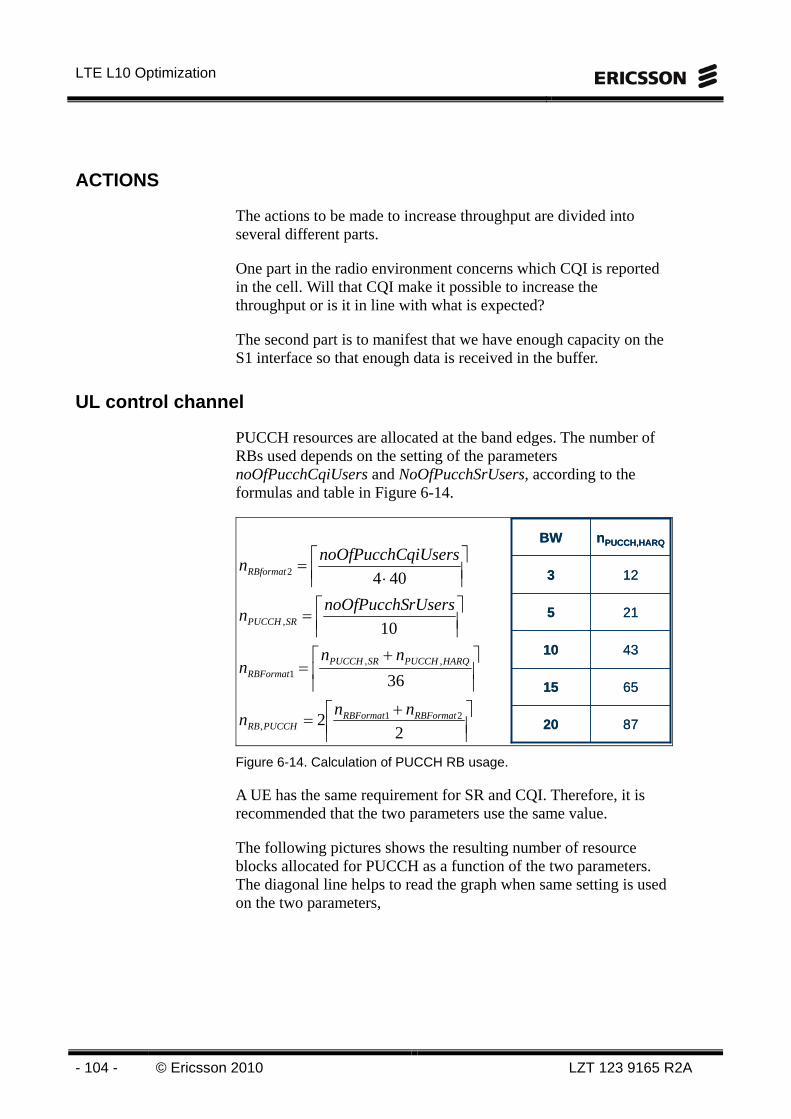
LTE L10 Optimization
- 104 - © Ericsson 2010 LZT 123 9165 R2A
ACTIONS
The actions to be made to increase throughput are divided into several different parts.
One part in the radio environment concerns which CQI is reported in the cell. Will that CQI make it possible to increase the throughput or is it in line with what is expected?
The second part is to manifest that we have enough capacity on the S1 interface so that enough data is received in the buffer.
UL control channel
PUCCH resources are allocated at the band edges. The number of RBs used depends on the setting of the parameters noOfPucchCqiUsers and NoOfPucchSrUsers, according to the formulas and table in Figure 6-14.
⎥⎥⎤⎢⎢
⎡ +=⎥⎥⎤⎢⎢
⎡ +=⎥⎥⎤⎢⎢
⎡=⎥⎥⎤⎢⎢
⎡⋅=
22
36
10
404
21,
,,1
,
2
RBFormatRBFormatPUCCHRB
HARQPUCCHSRPUCCHRBFormat
SRPUCCH
RBformat
nnn
nnn
rUsersnoOfPucchSn
qiUsersnoOfPucchCn
8720
6515
4310
215
123
nPUCCH,HARQBW
8720
6515
4310
215
123
nPUCCH,HARQBW
Figure 6-14. Calculation of PUCCH RB usage.
A UE has the same requirement for SR and CQI. Therefore, it is recommended that the two parameters use the same value.
The following pictures shows the resulting number of resource blocks allocated for PUCCH as a function of the two parameters. The diagonal line helps to read the graph when same setting is used on the two parameters,
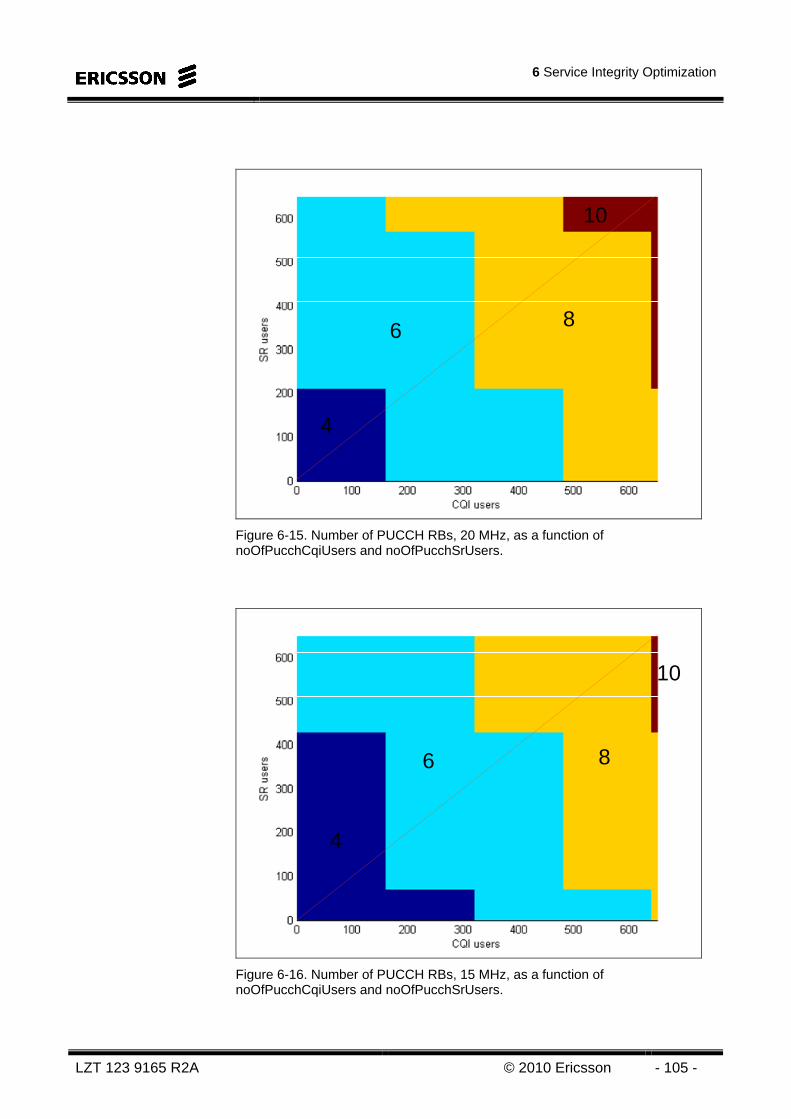
6 Service Integrity Optimization
LZT 123 9165 R2A © 2010 Ericsson - 105 -
4
6 8
10
Figure 6-15. Number of PUCCH RBs, 20 MHz, as a function of noOfPucchCqiUsers and noOfPucchSrUsers.
4
6 8
10
Figure 6-16. Number of PUCCH RBs, 15 MHz, as a function of noOfPucchCqiUsers and noOfPucchSrUsers.
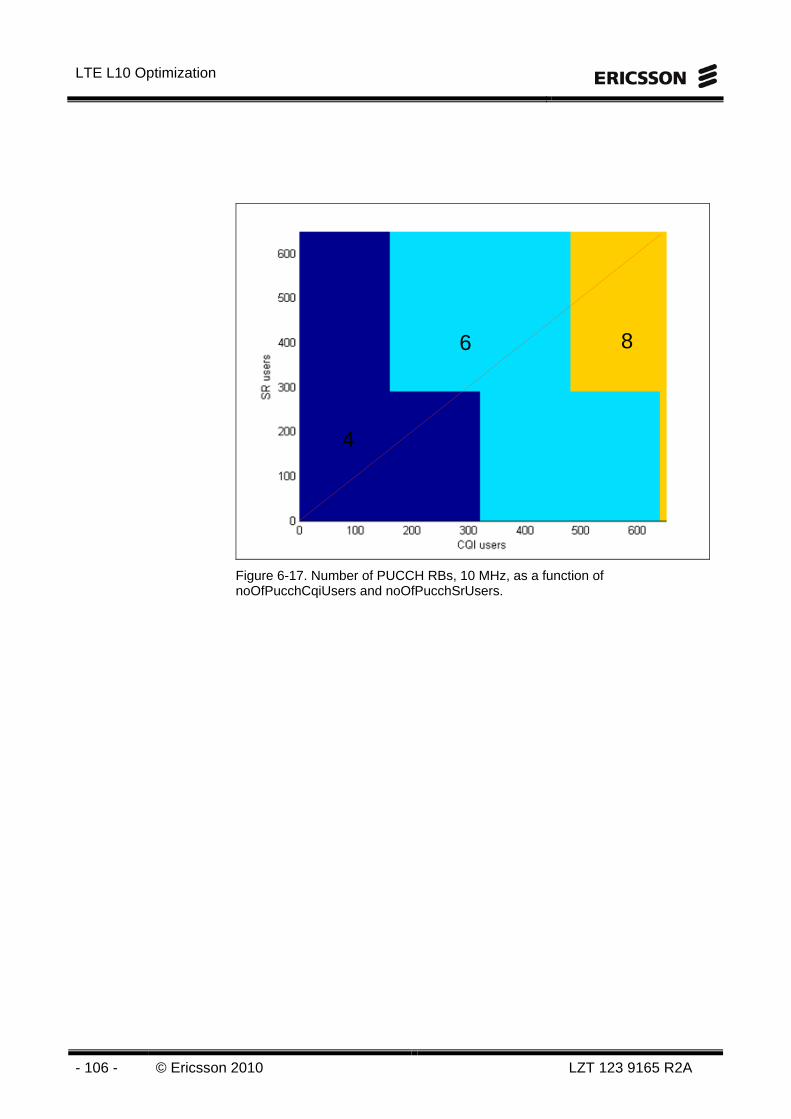
LTE L10 Optimization
- 106 - © Ericsson 2010 LZT 123 9165 R2A
4
6 8
Figure 6-17. Number of PUCCH RBs, 10 MHz, as a function of noOfPucchCqiUsers and noOfPucchSrUsers.
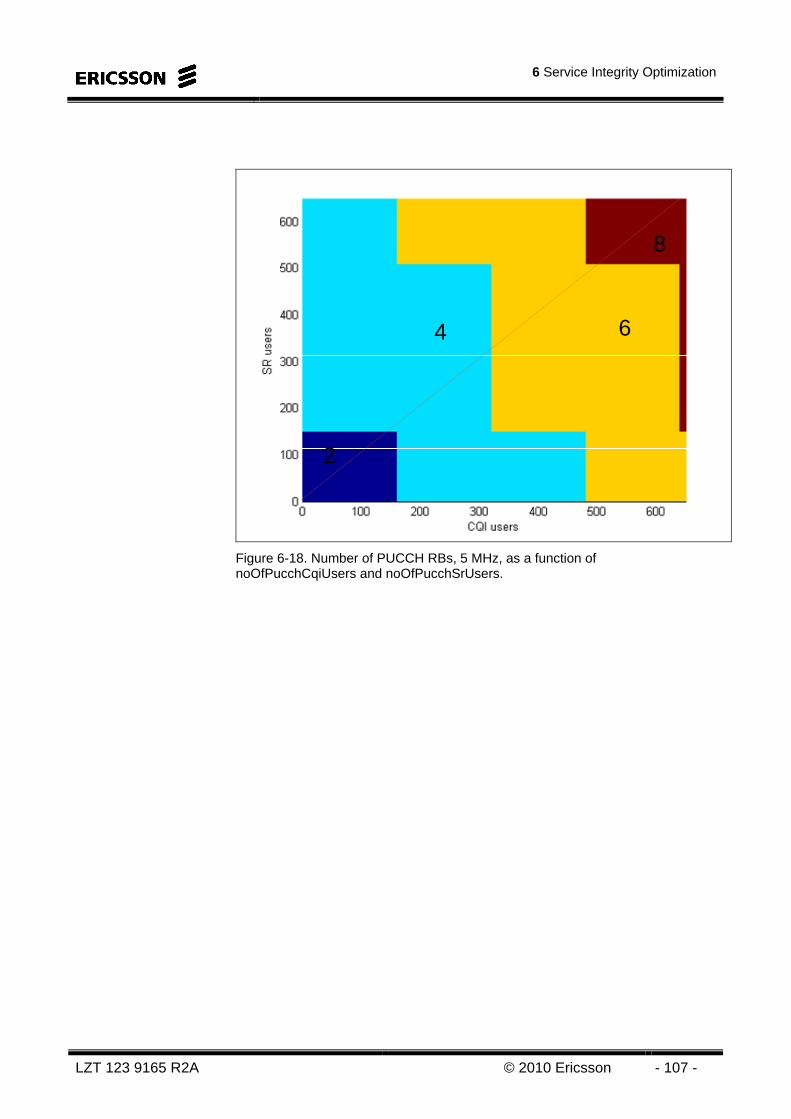
6 Service Integrity Optimization
LZT 123 9165 R2A © 2010 Ericsson - 107 -
2
4 6
8
Figure 6-18. Number of PUCCH RBs, 5 MHz, as a function of noOfPucchCqiUsers and noOfPucchSrUsers.
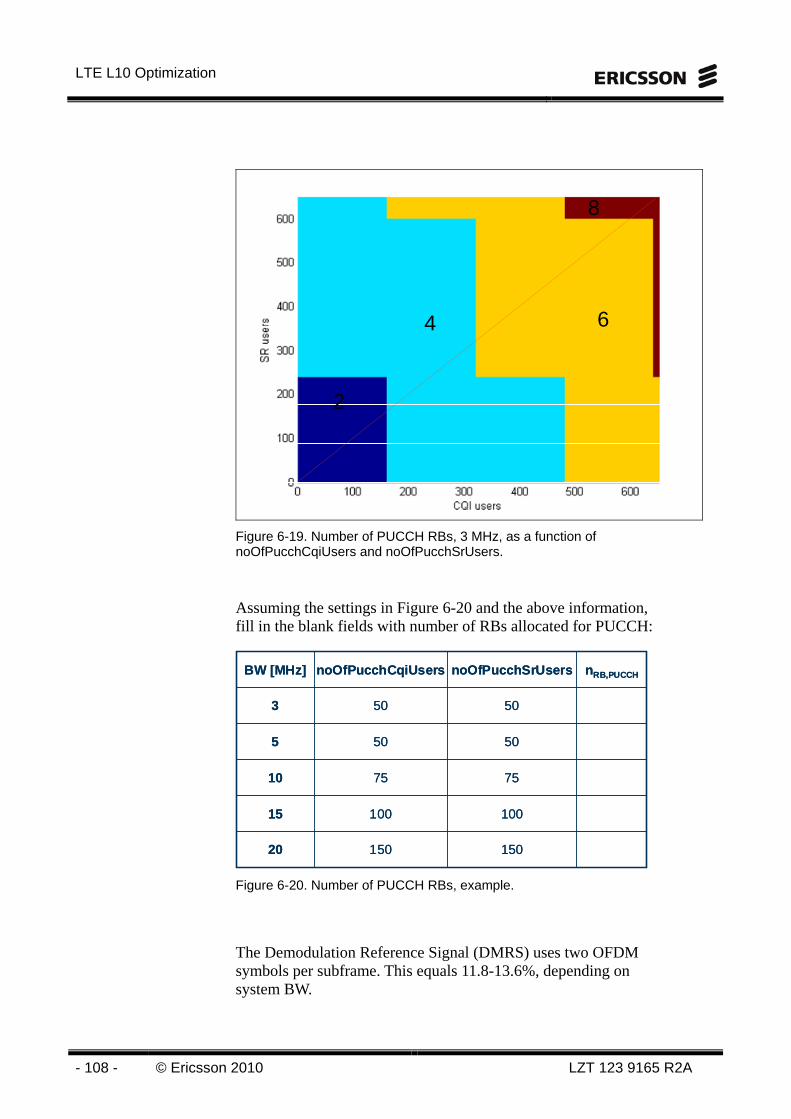
LTE L10 Optimization
- 108 - © Ericsson 2010 LZT 123 9165 R2A
2
4 6
8
Figure 6-19. Number of PUCCH RBs, 3 MHz, as a function of noOfPucchCqiUsers and noOfPucchSrUsers.
Assuming the settings in Figure 6-20 and the above information, fill in the blank fields with number of RBs allocated for PUCCH:
150
100
75
50
50
noOfPucchSrUsers
15020
10015
7510
505
503
nRB,PUCCHnoOfPucchCqiUsersBW [MHz]
150
100
75
50
50
noOfPucchSrUsers
15020
10015
7510
505
503
nRB,PUCCHnoOfPucchCqiUsersBW [MHz]
Figure 6-20. Number of PUCCH RBs, example.
The Demodulation Reference Signal (DMRS) uses two OFDM symbols per subframe. This equals 11.8-13.6%, depending on system BW.
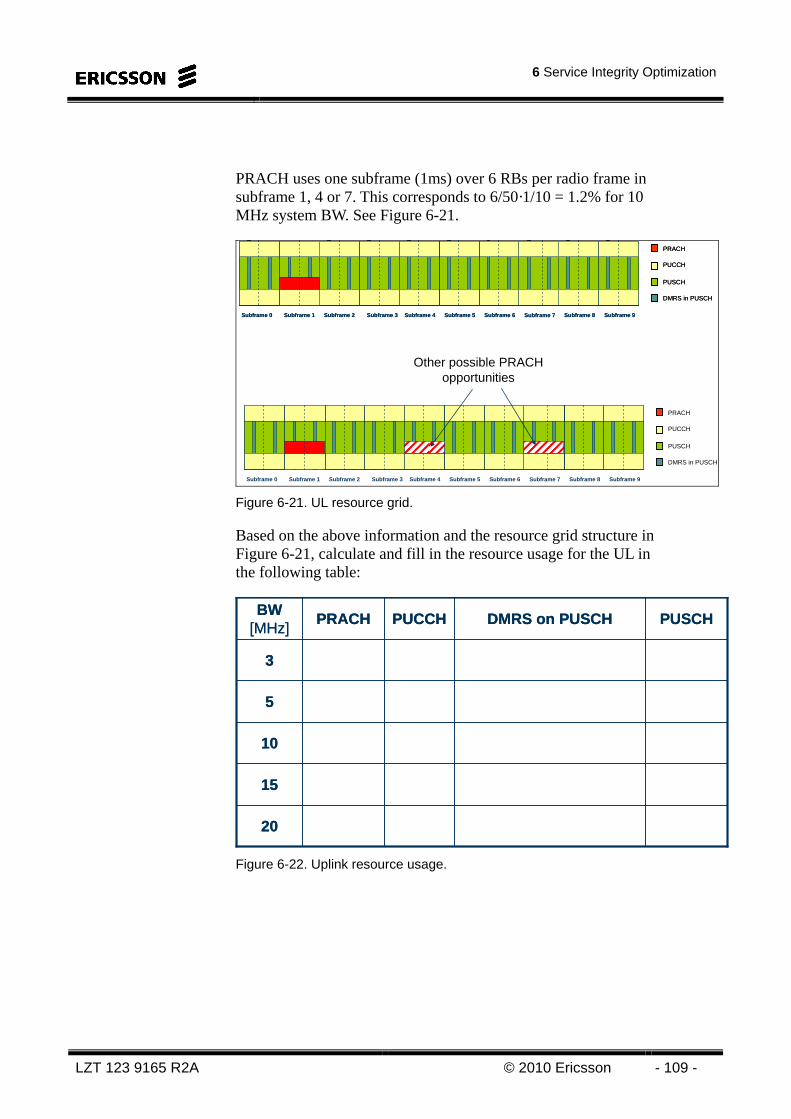
6 Service Integrity Optimization
LZT 123 9165 R2A © 2010 Ericsson - 109 -
PRACH uses one subframe (1ms) over 6 RBs per radio frame in subframe 1, 4 or 7. This corresponds to 6/50·1/10 = 1.2% for 10 MHz system BW. See Figure 6-21.
PRACH
PUCCH
PUSCH
Subframe 0 Subframe 1 Subframe 9Subframe 2 Subframe 4 Subframe 5 Subframe 6 Subframe 7 Subframe 8Subframe 3
DMRS in PUSCH
PRACH
PUCCH
PUSCH
Subframe 0 Subframe 1 Subframe 9Subframe 2 Subframe 4 Subframe 5 Subframe 6 Subframe 7 Subframe 8Subframe 3
DMRS in PUSCH
PRACH
PUCCH
PUSCH
Subframe 0 Subframe 1 Subframe 9Subframe 2 Subframe 4 Subframe 5 Subframe 6 Subframe 7 Subframe 8Subframe 3
DMRS in PUSCH
Other possible PRACH opportunities
Figure 6-21. UL resource grid.
Based on the above information and the resource grid structure in Figure 6-21, calculate and fill in the resource usage for the UL in the following table:
20
15
10
5
3
PUSCHDMRS on PUSCH PUCCHPRACHBW
[MHz]
20
15
10
5
3
PUSCHDMRS on PUSCH PUCCHPRACHBW
[MHz]
Figure 6-22. Uplink resource usage.
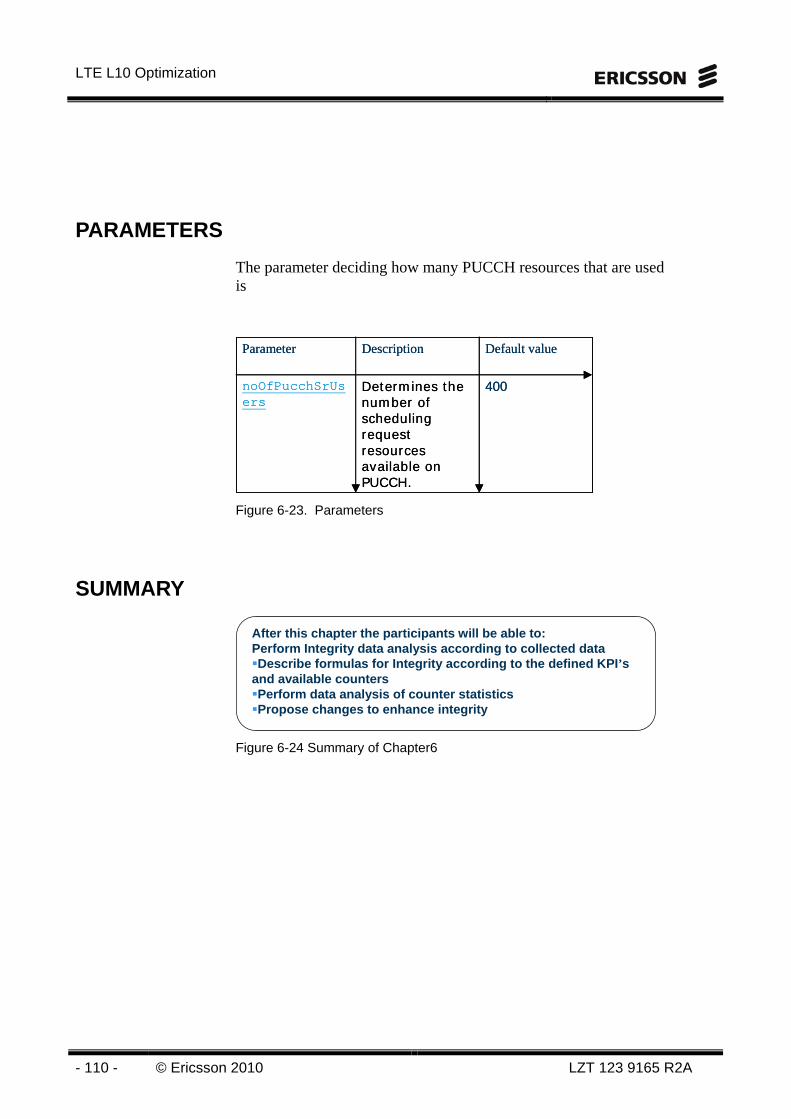
LTE L10 Optimization
- 110 - © Ericsson 2010 LZT 123 9165 R2A
PARAMETERS
The parameter deciding how many PUCCH resources that are used is
400Determ ines the number of scheduling request resources available on PUCCH.
noOfPucchSrUsers
Default valueDescriptionParameter
400Determ ines the number of scheduling request resources available on PUCCH.
noOfPucchSrUsers
Default valueDescriptionParameter
Figure 6-23. Parameters
SUMMARY
After this chapter the participants will be able to:Perform Integrity data analysis according to collected dataDescribe formulas for Integrity according to the defined KPI ’sand available countersPerform data analysis of counter statisticsPropose changes to enhance integrity
Figure 6-24 Summary of Chapter6
7 Traces
LZT 123 9165 R2A © 2010 Ericsson - 111 -
7 Traces
Objectives
Figure 7-1 Objectives of Chapter 7

LTE L10 Optimization
- 112 - © Ericsson 2010 LZT 123 9165 R2A
Intentionally Blank
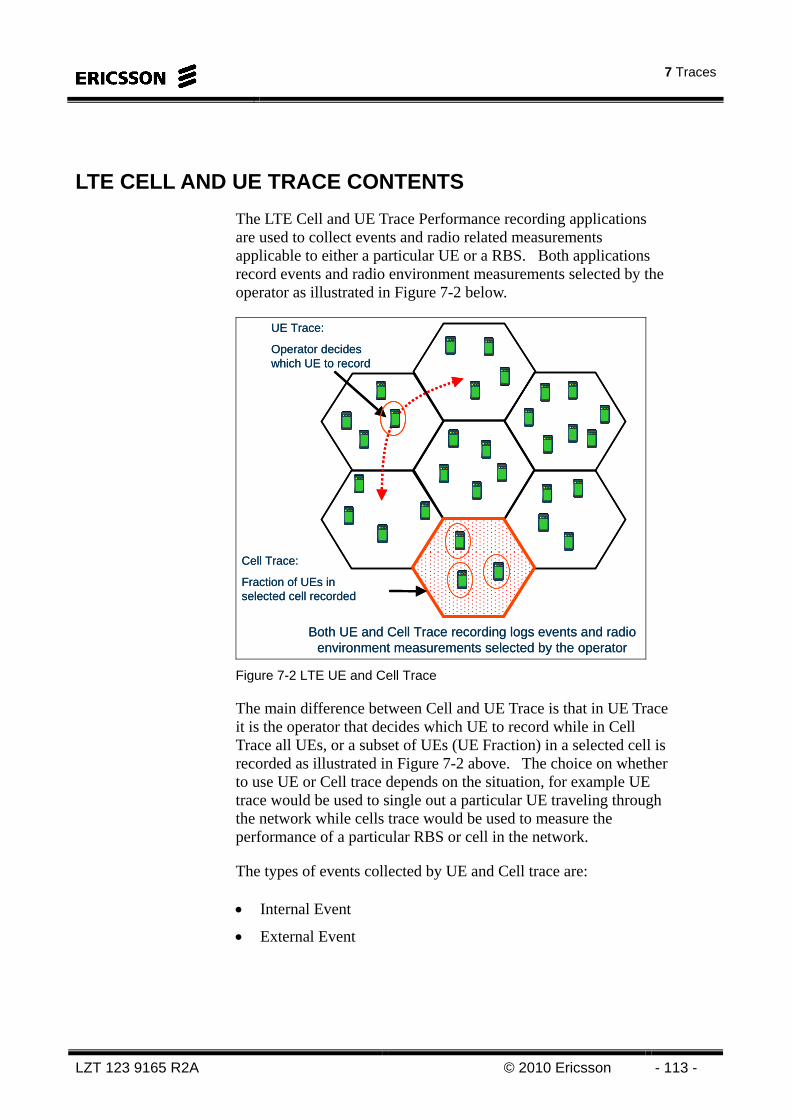
7 Traces
LZT 123 9165 R2A © 2010 Ericsson - 113 -
LTE CELL AND UE TRACE CONTENTS
The LTE Cell and UE Trace Performance recording applications are used to collect events and radio related measurements applicable to either a particular UE or a RBS. Both applications record events and radio environment measurements selected by the operator as illustrated in Figure 7-2 below.
UE Trace:
Operator decides which UE to record
Cell Trace:
Fraction of UEs in selected cell recorded
Both UE and Cell Trace recording logs events and radio environment measurements selected by the operator
UE Trace:
Operator decides which UE to record
Cell Trace:
Fraction of UEs in selected cell recorded
Both UE and Cell Trace recording logs events and radio environment measurements selected by the operator
Figure 7-2 LTE UE and Cell Trace
The main difference between Cell and UE Trace is that in UE Trace it is the operator that decides which UE to record while in Cell Trace all UEs, or a subset of UEs (UE Fraction) in a selected cell is recorded as illustrated in Figure 7-2 above. The choice on whether to use UE or Cell trace depends on the situation, for example UE trace would be used to single out a particular UE traveling through the network while cells trace would be used to measure the performance of a particular RBS or cell in the network.
The types of events collected by UE and Cell trace are: • Internal Event
• External Event
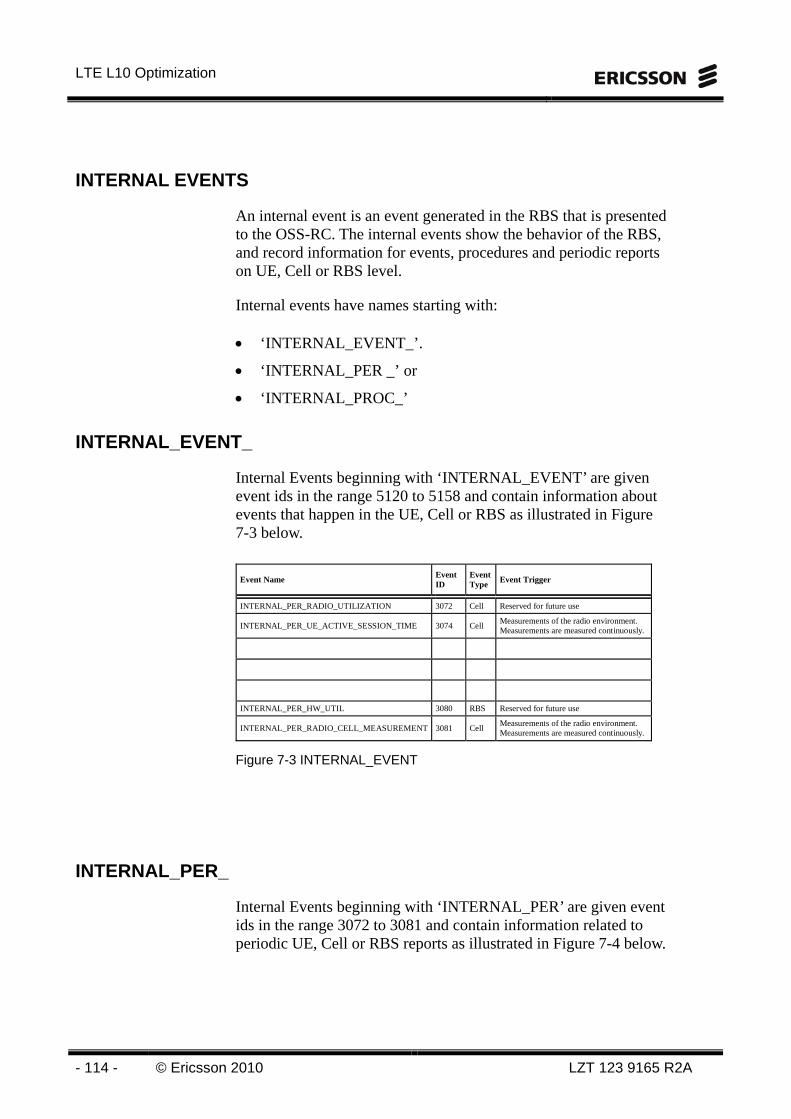
LTE L10 Optimization
- 114 - © Ericsson 2010 LZT 123 9165 R2A
INTERNAL EVENTS
An internal event is an event generated in the RBS that is presented to the OSS-RC. The internal events show the behavior of the RBS, and record information for events, procedures and periodic reports on UE, Cell or RBS level.
Internal events have names starting with: • ‘INTERNAL_EVENT_’.
• ‘INTERNAL_PER _’ or
• ‘INTERNAL_PROC_’
INTERNAL_EVENT_
Internal Events beginning with ‘INTERNAL_EVENT’ are given event ids in the range 5120 to 5158 and contain information about events that happen in the UE, Cell or RBS as illustrated in Figure 7-3 below.
Event Name Event ID
Event Type
Event Trigger
INTERNAL_PER_RADIO_UTILIZATION 3072 Cell Reserved for future use
INTERNAL_PER_UE_ACTIVE_SESSION_TIME 3074 Cell Measurements of the radio environment. Measurements are measured continuously.
INTERNAL_PER_HW_UTIL 3080 RBS Reserved for future use
INTERNAL_PER_RADIO_CELL_MEASUREMENT 3081 Cell Measurements of the radio environment. Measurements are measured continuously.
Figure 7-3 INTERNAL_EVENT
INTERNAL_PER_
Internal Events beginning with ‘INTERNAL_PER’ are given event ids in the range 3072 to 3081 and contain information related to periodic UE, Cell or RBS reports as illustrated in Figure 7-4 below.
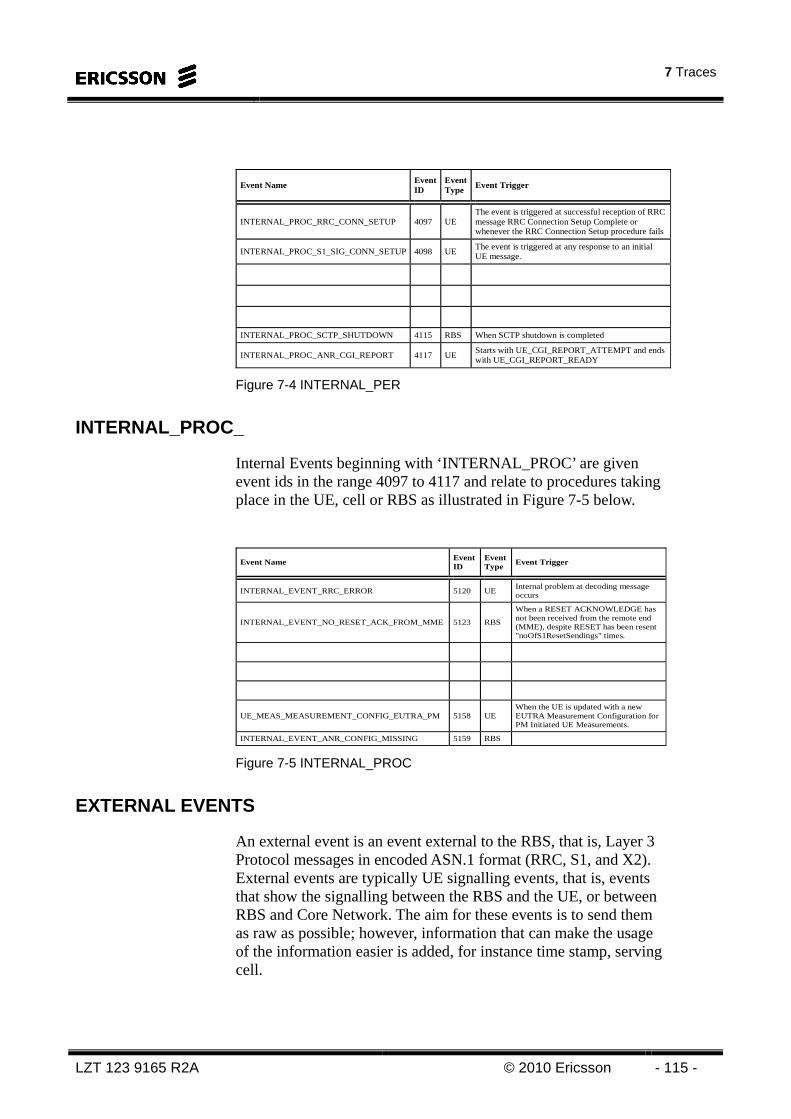
7 Traces
LZT 123 9165 R2A © 2010 Ericsson - 115 -
Event Name Event ID
Event Type
Event Trigger
INTERNAL_PROC_RRC_CONN_SETUP 4097 UE The event is triggered at successful reception of RRC message RRC Connection Setup Complete or whenever the RRC Connection Setup procedure fails
INTERNAL_PROC_S1_SIG_CONN_SETUP 4098 UE The event is triggered at any response to an initial UE message.
INTERNAL_PROC_SCTP_SHUTDOWN 4115 RBS When SCTP shutdown is completed
INTERNAL_PROC_ANR_CGI_REPORT 4117 UE Starts with UE_CGI_REPORT_ATTEMPT and ends with UE_CGI_REPORT_READY
Figure 7-4 INTERNAL_PER
INTERNAL_PROC_
Internal Events beginning with ‘INTERNAL_PROC’ are given event ids in the range 4097 to 4117 and relate to procedures taking place in the UE, cell or RBS as illustrated in Figure 7-5 below.
Event Name Event ID
Event Type
Event Trigger
INTERNAL_EVENT_RRC_ERROR 5120 UE Internal problem at decoding message occurs
INTERNAL_EVENT_NO_RESET_ACK_FROM_MME 5123 RBS
When a RESET ACKNOWLEDGE has not been received from the remote end (MME), despite RESET has been resent "noOfS1ResetSendings" times.
UE_MEAS_MEASUREMENT_CONFIG_EUTRA_PM 5158 UE When the UE is updated with a new EUTRA Measurement Configuration for PM Initiated UE Measurements.
INTERNAL_EVENT_ANR_CONFIG_MISSING 5159 RBS Figure 7-5 INTERNAL_PROC
EXTERNAL EVENTS
An external event is an event external to the RBS, that is, Layer 3 Protocol messages in encoded ASN.1 format (RRC, S1, and X2). External events are typically UE signalling events, that is, events that show the signalling between the RBS and the UE, or between RBS and Core Network. The aim for these events is to send them as raw as possible; however, information that can make the usage of the information easier is added, for instance time stamp, serving cell.
LTE L10 Optimization
- 116 - © Ericsson 2010 LZT 123 9165 R2A
The external events have names starting with: • ‘RRC_’
• ‘S1_’ or
• ‘X2_’
LTE CELL AND UE TRACE COLLECTION AND STORAGE
Since it is not possible to single out a particular UE with the Cell Trace allocation that is, in Cell Trace it is possible to record all UEs in a cell but not possible to single out a particular one. To be able to check one specific UE, UE Trace is needed. The differences between UE and Cell Trace are illustrated in Figure 7-2 below.
The Cell Trace function is used to troubleshoot issues on a particular cell or RBS. It gives visibility of air interface quality and UE performance of all (or a selected percentage) of UE within these cells and RBSs. It allows for network optimization when a new RBS is deployed or a new feature or frequency is deployed within an existing RBS.
The Cell Trace function is a most flexible recording function allowing operators to freely create subscriptions on various system levels. From basically few selective events involved in a particular traffic scenario all the way to full system recording including most or all LTE supported events.
By analyzing the event based information, the Cell Trace function provides monitoring and evaluation capability of any traffic scenario taking place in the LTE RAN. The Cell Trace function recordings are specifically suited for detailed analysis and troubleshooting support of a network, including:
• Detecting unacceptable performance degradation in the network, enabling the operator to take immediate actions to preserve quality of the network.
• Advanced troubleshooting of any traffic related function.
• Detailed performance monitoring and network optimization in order to further improve subscriber-perceived quality or a better utilization of the installed resources.
7 Traces
LZT 123 9165 R2A © 2010 Ericsson - 117 -
The UE Trace function enables the network operator to record important events and measurements for a selected UE, traveling through a network. Only one UE can be selected for recording for each UE trace, but up to 16 simultaneous UE trace recordings can run in parallel for one RBS. The selected UE are identified by the network operator using the UE's International Mobile Subscriber Identity (IMSI) or International Mobile Equipment Identity (IMEI).
The operator can send out a test mobile (in particular, after changes or extensions to the network) or record a UE conducting live traffic to investigate network performance in a specific area. Typically recording UE related signaling, and UE related measurement data either provided by the RBS or the UE itself. Radio measurements and events can be recorded for both the uplink and the downlink.
Each UE trace which generates an event during a ROP period creates its own file with a trace reference in the name of the file. Even if only 16 simultaneous UE trace recordings can run in parallel for one RBS, there can be more than 16 files generated by the UE trace feature in one ROP, since a rejected UE trace file is closed and a new UE trace can be started within the same ROP. For each UE trace which does not have an active scanner the UE trace data is stored and passed on to the target RBS in case of X2 handover.
With this function the operator can monitor specific information that is sent to and from the UE. For example, the operator can monitor signalling data that is used to make handover decisions. This enables the operator to identify parameters that need to be adjusted, leading to improved performance.
Providing network planners with the detailed information related to dimensioning and configuration of the network.
The Cell Trace function is used to troubleshoot issues on a particular cell or RBS. It gives visibility of air interface quality and UE performance of all (or a selected percentage) of UE within these cells and RBSs. It allows for network optimization when a new RBS is deployed or a new feature or frequency is deployed within an existing RBS.
LTE L10 Optimization
- 118 - © Ericsson 2010 LZT 123 9165 R2A
The Cell Trace function is a most flexible recording function allowing operators to freely create subscriptions on various system levels. From basically few selective events involved in a particular traffic scenario all the way to full system recording including most or all LTE supported events.
By analyzing the event based information, the Cell Trace function provides monitoring and evaluation capability of any traffic scenario taking place in the LTE RAN. The Cell Trace function recordings are specifically suited for detailed analysis and troubleshooting support of a network, including: • Detecting unacceptable performance degradation in the
network, enabling the operator to take immediate actions to preserve quality of the network.
• Advanced troubleshooting of any traffic related function.
• Detailed performance monitoring and network optimization in order to further improve subscriber-perceived quality or a better utilization of the installed resources.
The UE Trace function enables the network operator to record important events and measurements for a selected UE, traveling through a network. Only one UE can be selected for recording for each UE trace, but up to 16 simultaneous UE trace recordings can run in parallel for one RBS. The selected UE are identified by the network operator using the UE's International Mobile Subscriber Identity (IMSI) or International Mobile Equipment Identity (IMEI).
The operator can send out a test mobile (in particular, after changes or extensions to the network) or record a UE conducting live traffic to investigate network performance in a specific area. Typically recording UE related signaling, and UE related measurement data either provided by the RBS or the UE itself. Radio measurements and events can be recorded for both the uplink and the downlink.
Each UE trace which generates an event during a ROP period creates its own file with a trace reference in the name of the file. Even if only 16 simultaneous UE trace recordings can run in parallel for one RBS, there can be more than 16 files generated by the UE trace feature in one ROP, since a rejected UE trace file is closed and a new UE trace can be started within the same ROP. For each UE trace which does not have an active scanner the UE trace data is stored and passed on to the target RBS in case of X2 handover.
7 Traces
LZT 123 9165 R2A © 2010 Ericsson - 119 -
With this function the operator can monitor specific information that is sent to and from the UE. For example, the operator can monitor signalling data that is used to make handover decisions. This enables the operator to identify parameters that need to be adjusted, leading to improved performance.
Providing network planners with the detailed information related to dimensioning and configuration of the network.
The RBS puts each event received into the Cell Trace file, the UE Trace file, or in both files, depending on what is activated. All recordings are accumulated into files for the duration of the ROP. In UE Trace, the recorded events are reported separately and written to a separate file for each UE being recorded, while in Cell Trace all events are reported into the same file.
SUMMARY
Figure 7-6 Summary of Chapter 7

LTE L10 Optimization
- 120 - © Ericsson 2010 LZT 123 9165 R2A