LSST and Dark Energy Dark Energy - STScI May 7, 2008 Tony Tyson, UC Davis Outline: 1.LSST Project...
26
LSST and Dark Energy LSST and Dark Energy Dark Energy - STScI May 7, 2008 Tony Tyson, UC Davis Outline: 1.LSST Project 2.Dark Energy Measurements 3.Controlling Systematic Errors
-
Upload
flora-snow -
Category
Documents
-
view
213 -
download
0
Transcript of LSST and Dark Energy Dark Energy - STScI May 7, 2008 Tony Tyson, UC Davis Outline: 1.LSST Project...

LSST and Dark EnergyLSST and Dark Energy
Dark Energy - STScIMay 7, 2008
Tony Tyson, UC Davis
Outline:
1. LSST Project2. Dark Energy Measurements3. Controlling Systematic Errors


LSST Primary/Tertiairy Mirror Fabriacation

3200 megapixel camera3200 megapixel camera

Wavefront Sensor Layout
Guide Sensors (8 locations)
Wavefront Sensors (4 locations)
3.5 degree Field of View (634 mm diameter)
Curvature Sensor Side View Configuration
Focal plane2d
40 mm
Sci CCD
The LSST Focal PlaneThe LSST Focal Plane

The LSST CCD SensorThe LSST CCD Sensor
16 segments/CCD200 CCDs total3200 Total Outputs

There are 23 LSSTC US Institutional There are 23 LSSTC US Institutional MembersMembers
Brookhaven National Laboratory California Institute of Technology Carnegie Mellon University Columbia University Google Inc. Harvard-Smithsonian Center for
Astrophysics Johns Hopkins University Las Cumbres Observatory Lawrence Livermore National
Laboratory National Optical Astronomy
Observatory Princeton University Purdue University
Research Corporation Stanford Linear Accelerator
Center Stanford University –KIPAC The Pennsylvania State
University University of Arizona University of California, Davis University of California, Irvine University of Illinois at
Champaign-Urbana University of Pennsylvania University of Pittsburgh University of Washington
Funding: Public-Private Partnership NSF, DOE, PrivateFunding: Public-Private Partnership NSF, DOE, Private
+ IN2P3 in France

The LSST site in ChileThe LSST site in Chile
1.5m photometriccalibration telescope

LSST SurveyLSST Survey
6-band Survey: ugrizy 320–1100 nm Frequent revisits: grizy
Sky area covered: >20,000 deg2 0.2 arcsec / pixel
Each 10 sq.deg field revisited ~2000 times
Limiting magnitude: 27.6 AB magnitude @5 25 AB mag /visit = 2x15 seconds Photometry precision: 0.01 mag requirement, 0.001 mag goal

LSST imaging & operations simulationsLSST imaging & operations simulations
Sheared HDF raytraced + perturbation + atmosphere + wind + optics + pixel
LSST Operations, including real weather data: coverage + depth
Performance verification using Subaru imagingPerformance verification using Subaru imaging
Figure : Visits numbers per field for the 10 year simulated survey

Comparing HST with SubaruComparing HST with Subaru
ACS: 34 min (1 orbit)PSF: 0.1 arcsec (FWHM)
2 arcmin

Comparing HST with SubaruComparing HST with Subaru
Suprime-Cam: 20 minPSF: 0.52 arcsec (FWHM)

HST ACS data
LSST:LSST:~50 galaxies~50 galaxiesper sq.arcminper sq.arcmin

• 3 billion galaxies with redshifts3 billion galaxies with redshifts• Time domain: Time domain: 1 million supernovae1 million supernovae 1 million galaxy lenses1 million galaxy lenses 5 million asteroids5 million asteroids new phenomenanew phenomena
LSST survey of 20,000 sq LSST survey of 20,000 sq degdeg

Key LSST Mission: Dark Key LSST Mission: Dark EnergyEnergy
Precision measurements of all four dark energy signatures in a single data set. Separately measure geometry and growth of dark matter structure vs cosmic time.
Weak gravitational lensing correlations
(multiple lensing probes!) Baryon acoustic oscillations (BAO) Counts of dark matter clusters Supernovae to redshift 0.8
(complementary to JDEM)

LSST and Cosmic ShearLSST and Cosmic Shear
Ten redshift bins yield 55 auto and cross spectra
+ higher order
useful rangeuseful rangebaryonsbaryons

RS~150 Mpc
Standard Ruler
Two Dimensions on the Sky Angular Diameter Distances
2-D Baryon Acoustic 2-D Baryon Acoustic OscillationsOscillations
CMB (z = 1100) BAO
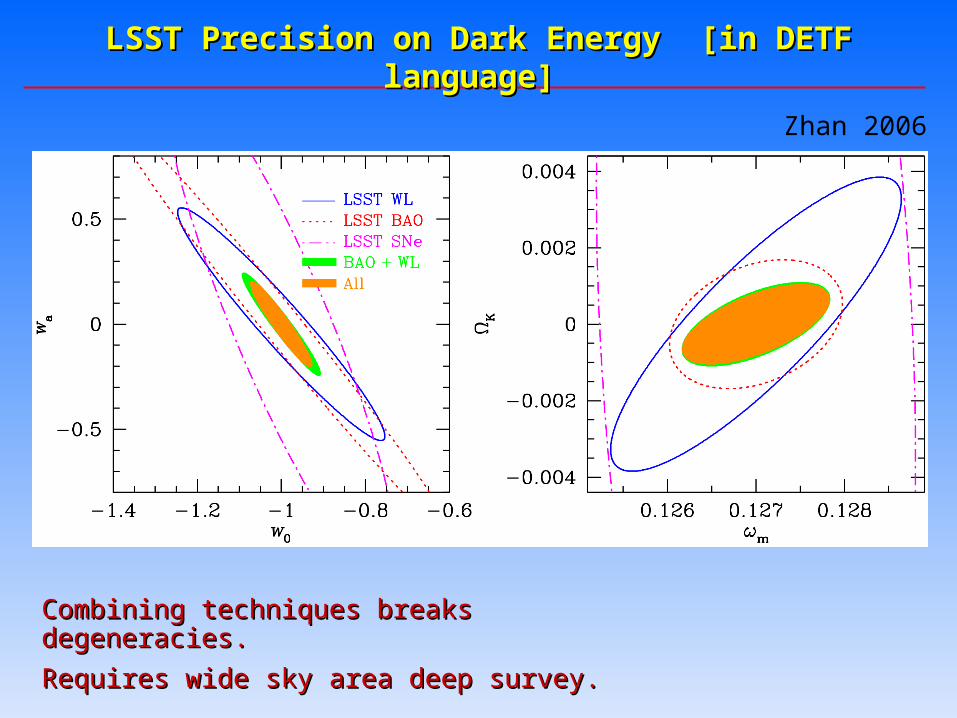
LSST Precision on Dark Energy [in DETF LSST Precision on Dark Energy [in DETF language]language]
Combining techniques breaks degeneracies. Combining techniques breaks degeneracies.
Requires wide sky area deep survey.Requires wide sky area deep survey.
Zhan 2006

Critical IssuesCritical Issues
WL shear reconstruction errors Show control to better than required precision Show control to better than required precision
using existing new facilitiesusing existing new facilities Photometric redshift errors
Develop robust photo-z calibration planDevelop robust photo-z calibration plan Undertake world campaign for spectroscopyUndertake world campaign for spectroscopy ()
Photometry errors Develop and test precision flux calibration Develop and test precision flux calibration
techniquetechnique

Residual shear correlationResidual shear correlation
Cosmic shear signalTest of shear systematics: Use faint stars as proxies for galaxies, and calculate the shear-shear correlation after correcting for PSF ellipticity via a different set of stars.
Compare with expected cosmic shear signal.
Conclusion: 200 exposures per sky patch will yield negligible PSF induced shear systematics. Wittman (2005)
Stars

ellipticity correlation of the residual PSF: single ellipticity correlation of the residual PSF: single exposureexposure
Simulation of 0.6” seeing.J. Jee 2007
Averages down Averages down like 1 / number like 1 / number of exposuresof exposures

Calibrating photometric Calibrating photometric redshifts redshifts
Cross-correlation LSS-based techniques can reconstruct the true z distribution of a photo-z bin, even with spectroscopy of only the brightest galaxies at each z.
These techniques meet LSST requirements with easily attainable spectroscopic samples, ~104 galaxies per unit z. See Jeff Newman’s poster

DETF FOM vs Etendue-TimeDETF FOM vs Etendue-Time
CombinedCombinedSeparate DE ProbesSeparate DE Probes
First light 2014 Survey commissioning & operations 2015-2025

LSST probes of dark energyLSST probes of dark energy
• WL shear-shear tomography• WL bi-spectrum tomography• Distribution of 250,000 shear peaks• Baryon acoustic oscillations• 1 million SNe Ia, z<1 per year• Low l, 2sky coverage 3x10⁹ galaxy sources• probe growth(z) and d(z) separately• multiply lensed AGNs and SNe

See posters by Jeff Newman and Hu Zhan
lsst.org