LRRK2 is a regulator of NFAT that modulates the severity of … · Densitometry of each NFAT band...
13
1 Supplementary Material: 12 supplementary figures LRRK2 is a regulator of NFAT that modulates the severity of inflammatory bowel disease. Zhihua Liu 1 , Jinwoo Lee 1 , Scott Krummey 1 , Wei Lu 1 , Huaibin Cai 2 , Michael J. Lenardo 1, * Nature Immunology doi:10.1038/ni.2113
Transcript of LRRK2 is a regulator of NFAT that modulates the severity of … · Densitometry of each NFAT band...

1
Supplementary Material: 12 supplementary figures
LRRK2 is a regulator of NFAT that modulates the severity of
inflammatory bowel disease.
Zhihua Liu1, Jinwoo Lee1, Scott Krummey1, Wei Lu1, Huaibin Cai2, Michael J. Lenardo1, *
Nature Immunology doi:10.1038/ni.2113

2
Supplementary Figure 1
Supplementary Fig. 1. Lrrk2−/− mice have normal colonic morphology. Representative
images of hematoxylin and eosin (H&E) staining of colonic sections from unmanipulated
wild type (WT) and Lrrk2−/− mice. Scale bar, 100 µm. Data are representative of three
independent experiments.
Nature Immunology doi:10.1038/ni.2113

3
Supplementary Figure 2
Supplementary Fig. 2. Expression of LRRK2. (a) Immunoblot analysis of LRRK2 and
hsp90 in bone marrow derived macrophages (BMDM) from wild-type or LRRK2−/− mice.
(b) Quantitative real-time PCR analysis (mean ± SEM of triplicates) of LRRK2 in
BMDM, BMDC and CD4+ T cells from wild-type cells, presented as the percent to that in
BMDM cells. Actin was used for total mRNA normalization. Data are representative of
two independent experiments.
Nature Immunology doi:10.1038/ni.2113

4
Supplementary Figure 3
Supplementary Fig. 3. LRRK2 deficiency exacerbates DSS colitis in mice. Mean body
weight as a percent of starting weight (a) and mean clinical scores (b) of wild-type (blue,
n=5) and LRRK2−/− (red, n=5) mice with 6 day treatment of 5% DSS followed by
regularu drinking water. * P < 0.05. ** P < 0.02. Data are representative of two
independent experiments (mean and SEM).
Nature Immunology doi:10.1038/ni.2113
5
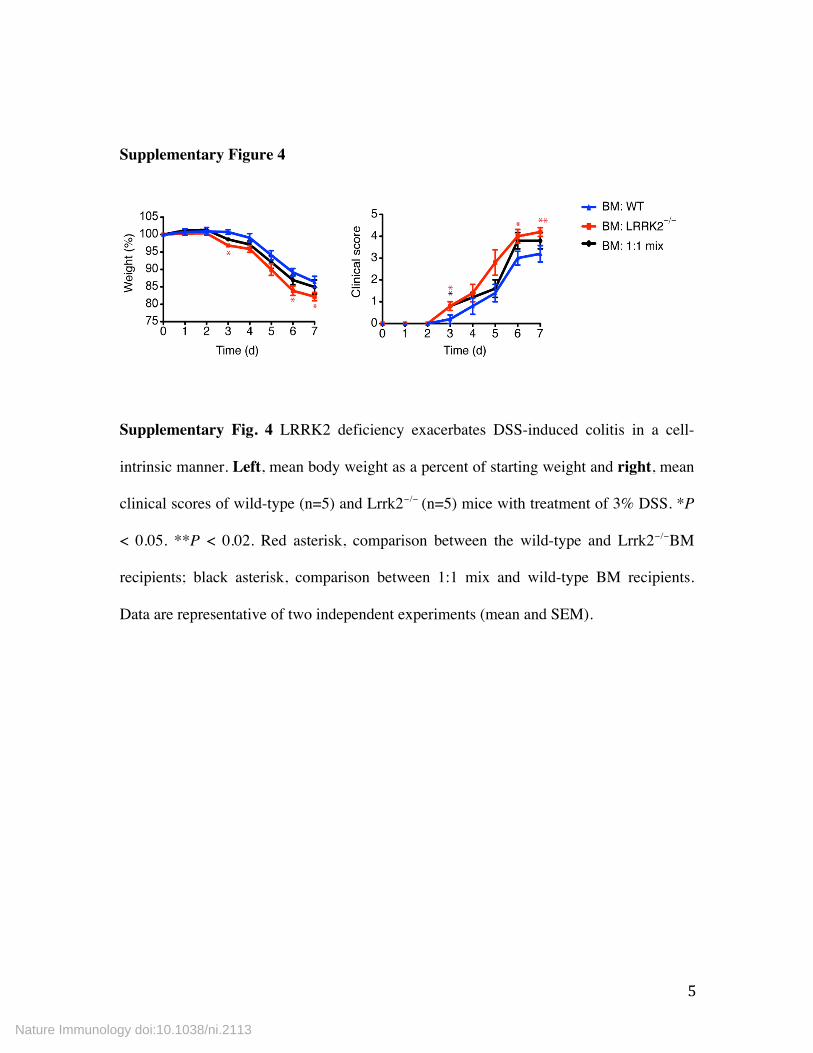
Supplementary Figure 4
Supplementary Fig. 4 LRRK2 deficiency exacerbates DSS-induced colitis in a cell-
intrinsic manner. Left, mean body weight as a percent of starting weight and right, mean
clinical scores of wild-type (n=5) and Lrrk2−/− (n=5) mice with treatment of 3% DSS. *P
< 0.05. **P < 0.02. Red asterisk, comparison between the wild-type and Lrrk2−/−BM
recipients; black asterisk, comparison between 1:1 mix and wild-type BM recipients.
Data are representative of two independent experiments (mean and SEM).
Nature Immunology doi:10.1038/ni.2113

6
Supplementary Figure 5
Supplementary Fig. 5. LRRK2 inhibits nuclear translocation of NFAT. Immunoblot
analysis of cytosolic (Cyt) and Nuclear (Nucl) fractions from 293T cells transfected with
NFAT1-GFP (a), HA-NFAT2 (b), HA-NFAT3 (c) and HA-NFAT4 (d) along with vector
Nature Immunology doi:10.1038/ni.2113

7
control or Myc-LRRK2 after 1 µM ionomycin (Iono) treatment for 30 min. Hsp90 and
PARP were used as controls for the purity of cytosolic and nuclear fractions,
respectively. Densitometry of each NFAT band is indicated at the bottom of the blots.
The relative intensity of NFAT bands is indicated at the bottom of the blots, presented as
relative to that in cytosolic fraction without Myc-LRRK2 untreated with Iono. Data are
representative of two independent experiments.
Supplementary Figure 6
Supplementary Fig. 6. LRRK2 interacts with multiple components in the NRON
complex. Immunoprecipitation (IP) and immunoblot analysis of 293T cells transfected
with a plasmid expressing myc-LRRK2. Iso, isotype control for immunoprecipitation.
Sizes of proteins are indicated on the left. Data are representative of three independent
experiments.
Nature Immunology doi:10.1038/ni.2113

8
Supplementary Figure 7
Supplementary Fig. 7. LRRK2 inhibition on NFAT1 depends on NRON. (a) Left,
immunoprecipitation (IP) and immunoblotting analysis of 293T cells transfected with
Myc-LRRK2 and NFAT1-GFP with NRON knockdown or nonspecific control (NS), and
right, quantitative real-time PCR analysis (mean ± SEM of triplicates) of NRON,
presented as the percent of that of NS sample. Actin was used for total mRNA
normalization (B) Immunoblot analysis of cytosolic and nuclear fractions of 293T cells
transfected with Myc-LRRK2 and NFAT1-GFP with NRON knockdown or nonspecific
control treated or untreated with 1 µM Iono for 30 min. Data are representative of two
independent experiments.
Nature Immunology doi:10.1038/ni.2113

9
Supplementary Figure 8
Supplementary Fig. 8. Cytokine production by wild-type and Lrrk2−/− macrophages.
ELISA analysis (mean ± SEM of triplicates) of IL-6 (a) and IL-12p40 (b) secretion in
supernatants in BMDMs cultures stimulated for 18 hours with 5 µg/ml flagellin, 10
Nature Immunology doi:10.1038/ni.2113

10
µg/ml E. coli single stranded DNA (ssDNA), 2.5 µM oligodeoxynucleotides (ODN)
control, 2.5 µM ODN 1585, 2.5 µM polyinosinic-polycytidylic acid (poly I:C), 10 µg/ml
lipopolysaccharide (LPS) and 10 µM muramyl dipeptide (MDP). (c) Quantitative real-
time PCR analysis (mean ± SEM of triplicates) of IL-6 and IL-12p40 in purified
peritoneal macrophages from WT and Lrrk2−/− 6 hours after intraperitoneally receiving1
mg zymosan (left) or 1 mg Pam3CSK4 (right), presented as relative to actin levels. N.D.
not determined. Data are representative of three independent experiments.
Supplementary Figure 9
Supplementary Fig. 9. LRRK2 deficiency does not affect NF-κB and MAPK activation
by zymosan. Immunoblotting analysis of p-IκBα, p-JNK, p-Erk1/2 and p-p38 in wild-
type and Lrrk2−/− BMDM cells treated with 100 µg/ml zymosan for 0-120 min. Hsp90
was used as a loading control for cell lysates. Data are representative of three
independent experiments.
Nature Immunology doi:10.1038/ni.2113

11
Supplementary Figure 10
Supplementary Fig. 10. CsA treatment suppresses the worsened colitis in Lrrk2−/− mice.
(a) Left, mean body weight as a percent of starting weight and right, mean clinical
scores of wild-type and Lrrk2−/− receiving 3% DSS with or without 1 mg/mouse/day CsA
treatment (n=5 per group). **P < 0.02. P values were calculated between vehicle treated
and CsA treated groups. (b) Left, immunohistochemistry analysis of NFAT1 (brown) in
paraffin-embedded colonic sections from Lrrk2−/− (n=5 per group) mice receiving vehicle
(Mock) or CsA treatment as in (a). Nuclei were counterstained with hematoxylin (blue).
Nature Immunology doi:10.1038/ni.2113

12
Scale bar, 25 µm. Right, percent of cells with nuclear NFAT1 among approximately 100
NFAT1-positive cells for each group. Data are representative of two independent
experiments (mean and SEM in a).
Supplementary Figure 11
Supplementary Fig. 11. LRRK2 mRNA levels are not significantly different in
peripheral lymphocytes from 2397M/M and 2397T/T carriers. Quantitative RT-PCR analysis
of LRRK2 and actin mRNA levels in human peripheral B cells, presented as the ratio
between LRRK2 and actin. N.S. not significant. Data are representative of two
independent experiments (mean and SEM).
Nature Immunology doi:10.1038/ni.2113

13
Supplementary Figure 12
Supplementary Fig. 12. Cytokine production in primary macrophages from 2397M/M and
2397T/T carriers. Quantitative RT-PCR analysis of IL-6 (a) or IL-12p40 (b) mRNA levels
in primary macrophages stimulated with 50 µg/ml zymosan (Zym) or 5 µg/ml
Pam3CSK4 (Pam) for 2 hours, presented as the ratio of IL-6 or IL-12p40 to actin. Each
symbol represents an individual. N.S. not significant. Data are pooled analysis of one
experiment (mean and SEM).
Nature Immunology doi:10.1038/ni.2113