LRFD BOX CULVERT DESIGN AND RATING (BXLRFD) Manual/BXLRFD Users... · user's manual for lrfd box...
378
USER'S MANUAL FOR LRFD BOX CULVERT DESIGN AND RATING (BXLRFD) Version 2.8.0.0
-
Upload
nguyenliem -
Category
Documents
-
view
291 -
download
8
Transcript of LRFD BOX CULVERT DESIGN AND RATING (BXLRFD) Manual/BXLRFD Users... · user's manual for lrfd box...

USER'S MANUAL FOR
LRFD BOX CULVERT DESIGN AND RATING
(BXLRFD)
Version 2.8.0.0


USER’S MANUAL FOR
COMPUTER PROGRAM BXLRFD
LRFD BOX CULVERT DESIGN AND RATING
VERSION 2.8.0.0
Prepared by: Imbsen & Associates, Inc. for
Pennsylvania Department of Transportation
September 2018
Copyright © 1997-2018 Commonwealth of Pennsylvania Department of Transportation

ii
This page is intentionally left blank.

LRFD BOX CULVERT DESIGN AND RATING
iii
TABLE OF CONTENTS
CHAPTER 1 - GENERAL DESCRIPTION ............................................................................................................. 1-1
1.1 PROGRAM IDENTIFICATION ............................................................................................................ 1-1 1.2 ABBREVIATIONS ............................................................................................................................... 1-2
CHAPTER 2 - PROGRAM DESCRIPTION .......................................................................................................... 2-1
2.1 GENERAL ........................................................................................................................................... 2-1 2.2 CULVERT TYPES ............................................................................................................................... 2-1 2.3 PROGRAM FUNCTIONS .................................................................................................................... 2-1 2.4 LIVE LOADINGS ................................................................................................................................. 2-6 2.5 RATINGS DEFINITION ..................................................................................................................... 2-12 2.6 ASSUMPTIONS AND LIMITATIONS ................................................................................................ 2-13
CHAPTER 3 - METHOD OF SOLUTION .............................................................................................................. 3-1 3.1 NOTATION .......................................................................................................................................... 3-2 3.2 GEOMETRY/STRUCTURAL MODEL ................................................................................................. 3-6
3.2.1 Analysis Points.................................................................................................................... 3-7 3.2.2 Cross Sections .................................................................................................................... 3-7
3.3 LOADS AND STRUCTURAL ANALYSIS .......................................................................................... 3-15 3.3.1 Dead Load DC .................................................................................................................. 3-16
3.3.1.1 Precast Culverts ............................................................................................... 3-16 3.3.1.2 Cast In Place Culverts ...................................................................................... 3-16
3.3.2 Dead Load DCB ................................................................................................................ 3-16 3.3.3 Dead Load DW ................................................................................................................. 3-16 3.3.4 Dead Load EV................................................................................................................... 3-17 3.3.5 Earth Horizontal EH .......................................................................................................... 3-22 3.3.6 Live Load Surcharge LS ................................................................................................... 3-23 3.3.7 Approach Slab Loads ....................................................................................................... 3-23 3.3.8 Loading for Influence Lines ............................................................................................... 3-24 3.3.9 Live Loading...................................................................................................................... 3-25 3.3.10 HL-93 Loading and PHL-93 Loading ................................................................................ 3-26 3.3.11 Variable Axle Spacing of Design Truck ............................................................................ 3-26 3.3.12 Variable Spacing of Design Tandem Pair ......................................................................... 3-26 3.3.13 Truck Load Effect .............................................................................................................. 3-27 3.3.14 Lane Load Effect ............................................................................................................... 3-32 3.3.15 Fatigue Load Effect ........................................................................................................... 3-32 3.3.16 Special Live Load ............................................................................................................. 3-33 3.3.17 Live Load Envelopes ........................................................................................................ 3-33
3.3.17.1 On Deck Live Loads ......................................................................................... 3-33 3.3.17.2 Thru Fill Live Loads .......................................................................................... 3-35
3.4 LOAD COMBINATIONS AND STRESSES ....................................................................................... 3-37 3.4.1 Maximum Effect Cases ..................................................................................................... 3-40 3.4.2 Limit States and Load Factors .......................................................................................... 3-40
3.5 FACTORED RESISTANCE............................................................................................................... 3-41 3.5.1 Section Design .................................................................................................................. 3-41
3.5.1.1 Member Thickness for Flexure ......................................................................... 3-43 3.5.1.2 Flexural Reinforcement .................................................................................... 3-44 3.5.1.3 Phi Factor and Over-reinforced Sections ......................................................... 3-54
3.5.2 Service Load Stress .......................................................................................................... 3-56 3.5.3 Serviceability Check ......................................................................................................... 3-58
3.5.3.1 Maximum and Minimum Allowable Spacing Check ......................................... 3-58 3.5.3.2 Temperature and Shrinkage Spacing Check ................................................... 3-58 3.5.3.3 Crack Control Check ........................................................................................ 3-61 3.5.3.4 Development Length ........................................................................................ 3-61 3.5.3.5 Development Length Correction Factors.......................................................... 3-62

LRFD BOX CULVERT DESIGN AND RATING
iv
3.5.4 Design For Fatigue ........................................................................................................... 3-62 3.5.5 Design For Shear .............................................................................................................. 3-62
3.6 LIVE LOAD RATINGS ....................................................................................................................... 3-66 3.6.1 Strength Limit State Ratings ............................................................................................. 3-66
3.7 SERVICEABILITY CHECK................................................................................................................ 3-69 3.8 FATIGUE ANALYSIS ........................................................................................................................ 3-69 3.9 STRIP FOOTINGS ............................................................................................................................ 3-70
3.9.1 Loading ............................................................................................................................. 3-70 3.9.2 Foundation Pressure and Eccentricity .............................................................................. 3-70 3.9.3 Forces at Critical Sections ................................................................................................ 3-75 3.9.4 Section Resistance and Performance Ratios ................................................................... 3-78 3.9.5 Reinforcement Design ...................................................................................................... 3-80
3.10 FOUNDATION PRESSURE FOR BOX CULVERTS AND U-CHANNELS ........................................ 3-82 3.10.1 Self Weight for Bottom Slab .............................................................................................. 3-83 3.10.2 Pressure Due to Water, WA ............................................................................................. 3-84
3.11 EDGE BEAM DESIGN ...................................................................................................................... 3-85
CHAPTER 4 - GETTING STARTED ..................................................................................................................... 4-1
4.1 INSTALLATION ................................................................................................................................... 4-1 4.2 PREPARING INPUT ........................................................................................................................... 4-2 4.3 ENGINEERING ASSISTANT .............................................................................................................. 4-3 4.4 RUNNING THE PROGRAM WITHOUT ENGASST ............................................................................ 4-4
CHAPTER 5 - INPUT DESCRIPTION ................................................................................................................... 5-1
5.1 INPUT DATA REQUIREMENTS ......................................................................................................... 5-1 5.2 ORDER OF COMMANDS ................................................................................................................... 5-4 5.3 CFG - CONFIGURATION COMMAND .............................................................................................. 5-10 5.4 TTL - TITLE COMMAND ................................................................................................................... 5-11 5.5 CTL - CONTROL COMMAND ........................................................................................................... 5-12 5.6 SID - STRUCTURE IDENTIFICATION COMMAND .......................................................................... 5-14 5.7 MAT - MATERIAL COMMAND .......................................................................................................... 5-15 5.8 DIM - DIMENSIONS COMMAND ...................................................................................................... 5-17 5.9 FTG - FOOTING COMMAND ............................................................................................................ 5-21 5.10 LDC - LOAD CONTROL COMMAND ................................................................................................ 5-23 5.11 SLL - SPECIAL LIVE LOADING COMMAND .................................................................................... 5-28 5.12 SAL - SPECIAL AXLE LOADS COMMAND ...................................................................................... 5-29 5.13 HCH - HAUNCH COMMAND ............................................................................................................ 5-30 5.14 FSH - FISH CHANNEL COMMAND .................................................................................................. 5-33 5.15 CVR - COVER COMMAND .............................................................................................................. 5-36 5.16 TSA - TOP SLAB REINFORCEMENT AREAS COMMAND .............................................................. 5-39 5.17 TSR - TOP SLAB REINFORCEMENT COMMAND .......................................................................... 5-42 5.18 BSA - BOTTOM SLAB REINFORCEMENT AREAS COMMAND ..................................................... 5-43 5.19 BSR - BOTTOM SLAB REINFORCEMENT COMMAND .................................................................. 5-44 5.20 WLA - WALL REINFORCEMENT AREAS COMMAND .................................................................... 5-45 5.21 WLR - WALL REINFORCEMENT COMMAND ................................................................................. 5-46 5.22 FTA - FOOTING REINFORCEMENT AREAS COMMAND ............................................................... 5-47 5.23 FTR - FOOTING REINFORCEMENT COMMAND ............................................................................ 5-49 5.24 TVA - TOP SLAB SHEAR REINFORCEMENT AREAS COMMAND ................................................ 5-50 5.25 BVA - BOTTOM SLAB SHEAR REINFORCEMENT AREAS ............................................................ 5-52 5.26 WVA - WALL SHEAR REINFORCEMENT AREAS ........................................................................... 5-53 5.27 OIN - OUTPUT OF INPUT COMMAND ............................................................................................. 5-54 5.28 OUR - OUTPUT OF RESULTS ......................................................................................................... 5-55 5.29 OUI - OUTPUT OF INTERMEDIATE DATA COMMAND .................................................................. 5-56
CHAPTER 6 - DETAILED INPUT DESCRIPTION ............................................................................................... 6-1
6.5 CTL - CONTROL COMMAND ............................................................................................................. 6-1 6.5.3 Type of Run ........................................................................................................................ 6-1 6.5.7 Frame Support .................................................................................................................... 6-1

LRFD BOX CULVERT DESIGN AND RATING
v
6.7 MAT – MATERIAL COMMAND ........................................................................................................... 6-3 6.7.2 f’c for Top Slab .................................................................................................................... 6-3 6.7.3 Reinforcement Grade ......................................................................................................... 6-3 6.7.4 Reinforcement Type ........................................................................................................... 6-3 6.7.5 Alpha ................................................................................................................................... 6-4 6.7.6 Rebar Size or Wire Diameter .............................................................................................. 6-4
6.8 DIM – DIMENSION COMMAND .......................................................................................................... 6-5 6.8.3 Top Slab Thickness ............................................................................................................ 6-5
6.10 LDC – LOAD CONTROL COMMAND ................................................................................................. 6-6 6.10.3 Number of Lanes ................................................................................................................ 6-6 6.10.6 Overlay Weight/Density ...................................................................................................... 6-6 6.10.7 Overlay Thickness .............................................................................................................. 6-6 6.10.8 Future Wearing Surface ...................................................................................................... 6-7 6.10.9 Maximum Live Load Distribution Length ............................................................................ 6-7 6.10.10 Segment Length ................................................................................................................. 6-7 6.10.18 Live Load Override ............................................................................................................. 6-8
6.23 FTR – FOOTING REINFORCEMENT COMMAND ........................................................................... 6-11 6.24 TVA – TOP SLAB SHEAR REINFORCEMENT COMMAND ............................................................. 6-12 6.25 BVA – BOTTOM SLAB SHEAR REINFORCEMENT COMMAND .................................................... 6-18 6.26 WVA – BOTTOM SLAB SHEAR REINFORCEMENT COMMAND ................................................... 6-18 6.27 OIN - OUTPUT OF INPUT COMMAND ............................................................................................. 6-19 6.28 OUR - OUTPUT OF RESULTS COMMAND ..................................................................................... 6-20 6.29 OUI - OUTPUT OF INTERMEDIATE DATA COMMAND .................................................................. 6-21
CHAPTER 7 - OUTPUT DESCRIPTION ............................................................................................................... 7-1
7.1 GENERAL OUTPUT INFORMATION ................................................................................................. 7-1 7.1.1 Output Table Controls ......................................................................................................... 7-1 7.1.2 Page Format ....................................................................................................................... 7-1 7.1.3 Page Numbering ................................................................................................................. 7-2 7.1.4 Page Header ....................................................................................................................... 7-2 7.1.5 Units .................................................................................................................................... 7-3 7.1.6 Sign Conventions ................................................................................................................ 7-4
7.2 COVER PAGE ..................................................................................................................................... 7-6 7.3 INPUT DATA ....................................................................................................................................... 7-8
7.3.1 Input File Echo .................................................................................................................... 7-8 7.3.2 Input Commands .............................................................................................................. 7-10 7.3.3 Input Summary.................................................................................................................. 7-11
7.4 RESULTS .......................................................................................................................................... 7-14 7.4.1 Additional Information ....................................................................................................... 7-14 7.4.2 Gross Section Properties .................................................................................................. 7-16 7.4.3 Live Load ELAT and IM Table .......................................................................................... 7-17 7.4.4 Serviceability Check Table ............................................................................................... 7-19 7.4.5 Serviceability Summary Table .......................................................................................... 7-21 7.4.6 Live Load Rating ............................................................................................................... 7-22 7.4.7 Strip Footing Performance Ratios..................................................................................... 7-26 7.4.8 Rating Summary ............................................................................................................... 7-29 7.4.9 Dead Load Effects and Capacities ................................................................................... 7-31 7.4.10 Flexural Reinforcement Design - Reinforcement Bar ....................................................... 7-35 7.4.11 Flexural Reinforcement Design - Wire Mesh .................................................................... 7-39 7.4.12 Development Length Check Table ................................................................................... 7-41 7.4.13 Shear Design .................................................................................................................... 7-42 7.4.14 Strip Footing Shear Design ............................................................................................... 7-46 7.4.15 Foundation Pressure ........................................................................................................ 7-47 7.4.16 Foundation Pressure Summary Table .............................................................................. 7-50 7.4.17 Strip Footing Bearing Pressure ......................................................................................... 7-50 7.4.18 Quantities .......................................................................................................................... 7-52
7.5 INTERMEDIATE DATA ..................................................................................................................... 7-53 7.5.1 General POI Data Table ................................................................................................... 7-53

LRFD BOX CULVERT DESIGN AND RATING
vi
7.5.2 Non-Live Results .............................................................................................................. 7-54 7.5.3 Influence Lines .................................................................................................................. 7-55 7.5.4 Truck Response ................................................................................................................ 7-55 7.5.5 Truck Thru Fill Response .................................................................................................. 7-56 7.5.6 Lane Response ................................................................................................................. 7-56 7.5.7 Envelope Response .......................................................................................................... 7-56 7.5.8 Limit State Dead Load Response ..................................................................................... 7-57 7.5.9 Limit State Live Load and Total Responses ..................................................................... 7-57 7.5.10 Bar Table Results ............................................................................................................. 7-57 7.5.11 Limit State Section Capacities .......................................................................................... 7-58 7.5.12 Limit State Rating Factors ................................................................................................ 7-58 7.5.13 Limit State Resistance/Demand Ratios ............................................................................ 7-58 7.5.14 Limit State Allowable Spacings ......................................................................................... 7-58 7.5.15 Limit State Service Stresses ............................................................................................. 7-58 7.5.16 Stiffness Analysis Model Report (.FEM Output File) ........................................................ 7-58 7.5.17 Stiffness Analysis Results Report (.FER Output File) ...................................................... 7-59 7.5.18 CMO1 (Non-Live Load) (.MM Output File) ....................................................................... 7-59 7.5.19 CMO2 (Envelopes) (.MM Output File) .............................................................................. 7-59 7.5.20 ASC1 (Influence Lines) (.ANN Output File) ...................................................................... 7-59 7.5.21 Soil Pressures ................................................................................................................... 7-59
7.6 FORMATTED OUTPUT TABLES ..................................................................................................... 7-74 7.6.1 INPUT FILE ECHO Report Format ................................................................................... 7-74 7.6.2 INPUT COMMANDS Report Format ................................................................................ 7-75 7.6.3 INPUT SUMMARY Report Format ................................................................................... 7-76 7.6.4 ADDITIONAL INFORMATION Report Format .................................................................. 7-81 7.6.5 GROSS SECTION PROPERTIES Report Format ........................................................... 7-81 7.6.6 LIVE LOAD ELAT & IM Report Format ............................................................................ 7-82 7.6.7 SERVICEABILITY CHECK Report Format ....................................................................... 7-82 7.6.8 SERVICEABILITY SUMMARY Report Format ................................................................. 7-83 7.6.9 LIVE LOAD RATING Report Format ................................................................................ 7-83 7.6.10 STRIP FOOTING PERFORMANCE RATIOS Report Format .......................................... 7-85 7.6.11 RATING SUMMARY Report Format................................................................................. 7-85 7.6.12 DEAD LOAD EFFECTS AND CAPACITIES Report Format ............................................ 7-86 7.6.13 FLEXURAL REINFORCEMENT DESIGN Report Format ............................................... 7-88 7.6.14 DEVELOPMENT LENGTH CHECK Report Format ......................................................... 7-91 7.6.15 SHEAR DESIGN Report Format ...................................................................................... 7-91 7.6.16 STRIP FOOTING SHEAR DESIGN Report Format ......................................................... 7-92 7.6.17 FOUNDATION PRESSURE Report Format ..................................................................... 7-93 7.6.18 FOUNDATION PRESSURE SUMMARY Report Format ................................................. 7-93 7.6.19 STRIP FOOTING BEARING PRESSURE Report Format ............................................... 7-94 7.6.20 QUANTITIES Report Format ............................................................................................ 7-95
7.7 SPECIFICATION CHECK FAILURES ............................................................................................... 7-96
CHAPTER 8 - EXAMPLE PROBLEMS ................................................................................................................ 8-1 8.1 EXAMPLE PROBLEMS ...................................................................................................................... 8-1 8.2 EXAMPLE 1 ........................................................................................................................................ 8-8 8.3 EXAMPLE 2 ...................................................................................................................................... 8-11 8.4 EXAMPLE 3 ...................................................................................................................................... 8-14 8.5 EXAMPLE 4 ...................................................................................................................................... 8-17 8.6 EXAMPLE 5 ...................................................................................................................................... 8-20 8.7 EXAMPLE 6 ...................................................................................................................................... 8-23 8.8 EXAMPLE 7 ...................................................................................................................................... 8-24 8.9 EXAMPLE 8 ...................................................................................................................................... 8-27 8.10 EXAMPLE 9 ...................................................................................................................................... 8-30 8.11 EXAMPLE 10 .................................................................................................................................... 8-33 8.12 EXAMPLE 11 .................................................................................................................................... 8-36 8.13 EXAMPLE 12 .................................................................................................................................... 8-39 8.14 EXAMPLE 13 .................................................................................................................................... 8-42

LRFD BOX CULVERT DESIGN AND RATING
vii
CHAPTER 9 - TECHNICAL QUESTIONS AND REVISION REQUESTS .......................................................... 9-45
9.1 TECHNICAL QUESTIONS ................................................................................................................ 9-45 9.2 REVISION REQUEST ....................................................................................................................... 9-45
LRFD BOX CULVERT DESIGN AND RATING
viii
LIST OF FIGURES Figure 2.2-1 Types of Culverts ......................................................................................................... 2-2 Figure 2.2-2 Types of Culverts (cont.) .............................................................................................. 2-3 Figure 2.4-1 LRFD and ML-80 Live Loading .................................................................................... 2-8 Figure 2.4-2 P-82, HS20, H20, and TK527 Live Loading ................................................................. 2-9 Figure 2.4-3 EV2, EV3, and SU6TV Live Loading ......................................................................... 2-10 Figure 2.4-4 PA2016-13 Live Loading ............................................................................................ 2-10 Figure 3.2-1 Structural Model Boundary Conditions ........................................................................ 3-8 Figure 3.2-2 Structural Model for Simply Supported Top Slab ......................................................... 3-9 Figure 3.2.1-1 Typical Points-Of-Interest (POI’s) ............................................................................... 3-9 Figure 3.2.1-2 POI Classifications for Members Without Haunches ................................................. 3-10 Figure 3.2.1-3 POI Classifications for Members With Haunches ...................................................... 3-11 Figure 3.2.1-4 POI Classifications for Bottom Slab Members with a Fish Channel .......................... 3-12 Figure 3.2.2-1 Basic Finite Element Model ....................................................................................... 3-13 Figure 3.2.2-2 Cross Sections for A Fish Channel ............................................................................ 3-14 Figure 3.3.1-1 Loadings - Weight of Structure for One-Cell Culverts ................................................ 3-18 Figure 3.3.1-2 DC Loadings - Weight for Two-Cell Culverts ............................................................. 3-19 Figure 3.3.1-3 DC Loadings - Weight for U-channels ....................................................................... 3-20 Figure 3.3.2-1 DCB Loading (Barrier Dead Load) ............................................................................. 3-20 Figure 3.3.3-1 DW Loading ............................................................................................................... 3-21 Figure 3.3.4-1 EV Loading (Earth Vertical) ....................................................................................... 3-21 Figure 3.3.5-1 EH - Horizontal Earth Loading ................................................................................... 3-22 Figure 3.3.6-1 LS Loading (Live Load Surcharge) ............................................................................ 3-23 Figure 3.3.7-1 Approach Slab Loading .............................................................................................. 3-24 Figure 3.3.8-1 Loadings for Influence Lines ...................................................................................... 3-25 Figure 3.3.12-1 Notional Truck Concept Showing Axles That Do Not Contribute To The Effect ........ 3-28 Figure 3.3.12-2 Separating Influence Lines Into Positive and Negative Parts .................................... 3-29 Figure 3.3.12-3 Combination of Effects For a Variable Axle Notional Truck ....................................... 3-30 Figure 3.3.12-4 Total Effect For A Variable Axle Notional Truck ........................................................ 3-31 Figure 3.3.12-5 Loading Influence Lines for the Through Fill Effect ................................................... 3-31 Figure 3.3.17.2-1 Case 2–- Live Load Distribution Distances for Thru Fill Effect .................................. 3-36 Figure 3.5-1 Cross Section Dimensions ......................................................................................... 3-42 Figure 3.5.1.2-1 Two Face Moment-Axial Interaction Curve Showing Load Line ................................ 3-45 Figure 3.5.3.1-1 Temperature and Shrinkage Dimensions .................................................................. 3-60 Figure 3.9.1-1 Strip Footing Definitions And Loads........................................................................... 3-72 Figure 3.9.2-1 Strip Footing Force Resultants and Eccentricity ........................................................ 3-72 Figure 3.9.2-3 Strip Footing Soil Pressure Distribution When Resultant Not In Middle Third ........... 3-74 Figure 3.9.2-4 Strip Footing Settlement Pressure, qb, for soil ........................................................... 3-75 Figure 3.9.3-1 POI Locations and Type Definitions for Strip Footings .............................................. 3-77 Figure 3.9.3-2 Strip Footing Shear And Moment ............................................................................... 3-77 Figure 5.2-1 Overall View of Input File ............................................................................................. 5-6 Figure 5.8-1 Culvert Dimensions .................................................................................................... 5-19 Figure 5.8-2 U-channel Dimensions ............................................................................................... 5-20 Figure 5.9-1 Footing Dimensions ................................................................................................... 5-22 Figure 5.10-1 Maximum Live Load Distribution Length .................................................................... 5-27 Figure 5.13-1 Haunch Dimensions ................................................................................................... 5-32 Figure 5.14-1 Standard Fish Channel .............................................................................................. 5-34 Figure 5.14-2 Non-Standard Fish Channel ...................................................................................... 5-35 Figure 5.15-1 Reinforcement Covers ............................................................................................... 5-37 Figure 5.16-1 Reinforcement Locations ........................................................................................... 5-40 Figure 5.16-2 Reinforcement Range Distances ............................................................................... 5-41 Figure 5.22-1 Footing Reinforcement Locations .............................................................................. 5-48 Figure 5.24-1 Shear Reinforcement ................................................................................................. 5-51 Figure 7.1.4-1 Page Header ................................................................................................................ 7-2

LRFD BOX CULVERT DESIGN AND RATING
ix
Figure 7.1.6-1 Positive Sign Convention for Axial/Shear/Moments .................................................... 7-5 Figure 7.2-1 Cover Page .................................................................................................................. 7-7 Figure 7.3.1-1 Input Echo .................................................................................................................... 7-9 Figure 7.3.2-1 Sample Input Command Report ................................................................................ 7-10 Figure 7.3.3-1 Sample Summary of Input Commands Report .......................................................... 7-12 Figure 7.4.1-1 Sample Additional Information Report ....................................................................... 7-14 Figure 7.4.1-2 Sample Additional Geometry Report ......................................................................... 7-15 Figure 7.4.2-1 Sample Gross Section Properties Report .................................................................. 7-17 Figure 7.4.3-1 Sample Live Load ELAT & IM Table .......................................................................... 7-18 Figure 7.4.4-1 Sample Serviceability Check Report for slabs and walls ........................................... 7-20 Figure 7.4.4-2 Sample Serviceability Check Report for strip footings ............................................... 7-21 Figure 7.4.5-1 Sample Serviceability Summary Report .................................................................... 7-22 Figure 7.4.6-1 Sample Live Load Rating Report ............................................................................... 7-25 Figure 7.4.7-1 Sample Strip Footing Performance Ratios Report ..................................................... 7-28 Figure 7.4.8-1 Sample Rating Summary Report ............................................................................... 7-30 Figure 7.4.8-2 Sample Combined Rating Summary.......................................................................... 7-31 Figure 7.4.9-1 Sample Dead Load and Capacities Report ............................................................... 7-34 Figure 7.4.10-1 Sample Design of Flexural Reinforcement Report – Reinforcement Bar .................. 7-38 Figure 7.4.11-1 Sample Design of Flexural Reinforcement Report – Wire Mesh ............................... 7-41 Figure 7.4.12-1 Sample Design of Development Length Check Report ............................................. 7-42 Figure 7.4.13-1 Sample Design of Shear Reinforcement Report ........................................................ 7-45 Figure 7.4.14-1 Sample Strip Footing Design Report ......................................................................... 7-47 Figure 7.4.15-1 Sample Reinforcment Check Report ......................................................................... 7-48 Figure 7.4.16-1 Sample Foundation Pressure Report ......................................................................... 7-49 Figure 7.4.17-1 Sample Foundation Pressure Summary Report ........................................................ 7-50 Figure 7.4.18-1 Sample Strip Footing Bearing Pressure Report ......................................................... 7-51 Figure 7.4.19-1 Sample Quantities Report .......................................................................................... 7-52 Figure 7.5.1-1 POI Information .......................................................................................................... 7-61 Figure 7.5.2-1 Non-Live Load Results ............................................................................................... 7-61 Figure 7.5.2-2 Non-Live Load Results – Connection Object ............................................................. 7-62 Figure 7.5.3-1 Influence Lines ........................................................................................................... 7-62 Figure 7.5.3-2 Influence Lines - Connection Object .......................................................................... 7-62 Figure 7.5.4-1 Truck Responses ....................................................................................................... 7-63 Figure 7.5.4-2 Truck Responses – Connection Object ..................................................................... 7-63 Figure 7.5.5-1 Truck Thru Fill Responses ......................................................................................... 7-63 Figure 7.5.5-2 Truck Thru Fill Responses – Connection Object ....................................................... 7-64 Figure 7.5.6-1 Lane Responses ........................................................................................................ 7-64 Figure 7.5.6-2 Lane Responses – Connection Object ...................................................................... 7-64 Figure 7.5.7-1 Envelope Responses ................................................................................................. 7-65 Figure 7.5.7-2 Envelope Responses – Connection Object ............................................................... 7-65 Figure 7.5.8-1 Limit State Dead Load Responses ............................................................................ 7-65 Figure 7.5.8-2 Limit State Dead Load Responses – Connection Object........................................... 7-66 Figure 7.5.9-1 Limit State Live Load and Total Responses .............................................................. 7-66 Figure 7.5.10-1 Reinforcement Design ............................................................................................... 7-67 Figure 7.5.11-1 Limit State Section Capacities ................................................................................... 7-68 Figure 7.5-12-1 Limit State Rating Factors .......................................................................................... 7-68 Figure 7.5.13-1 Limit State Resistance/Demand Ratios ..................................................................... 7-68 Figure 7.5.14-1 Limit State Allowable Spacings .................................................................................. 7-69 Figure 7.5.15-1 Limit State Service Stresses ...................................................................................... 7-69 Figure 7.5.16-1 Stiffness Analysis Model Report (.FEM Output File) ................................................. 7-70 Figure 7.5.21-1 Soil Pressures ............................................................................................................ 7-73 Figure 8.2-1 Example 1 Culvert Geometry ....................................................................................... 8-8 Figure 8.3-1 Example 2 Culvert Geometry ..................................................................................... 8-11 Figure 8.4-1 Example 3 Culvert Geometry ..................................................................................... 8-14 Figure 8.5-1 Example 4 Culvert Geometry ..................................................................................... 8-17 Figure 8.6-1 Example 5 Culvert Geometry ..................................................................................... 8-20 Figure 8.8-1 Example 7 Culvert Geometry ..................................................................................... 8-24

LRFD BOX CULVERT DESIGN AND RATING
x
Figure 8.9-1 Example 8 Culvert Geometry ..................................................................................... 8-27 Figure 8.10-1 Example 9 Culvert Geometry ..................................................................................... 8-30 Figure 8.11-1 Example 10 Culvert Geometry ................................................................................... 8-33 Figure 8.12-1 Example 11 Culvert Geometry ................................................................................... 8-36 Figure 8.13-1 Example 12 Culvert Geometry ................................................................................... 8-39 Figure 8.14-1 Example 13 U-channel Geometry .............................................................................. 8-42

LRFD BOX CULVERT DESIGN AND RATING
xi
LIST OF TABLES Table 2.4-1 Live Loadings for Design ........................................................................................... 2-11 Table 2.4-2 Live Loadings for Analysis/Rating .............................................................................. 2-11 Table 2.5-1 Live Loading Ratings.................................................................................................. 2-12 Table 3.3-1 Box Culvert Applied Loads ......................................................................................... 3-15 Table 3.3-2 U-channel Applied Loads ........................................................................................... 3-15 Table 3.4-1 Load Modifier ............................................................................................................. 3-38 Table 5.2-1 Recommended Order of Commands ........................................................................... 5-6 Table 5.2-2 Commands in Alphabetical Order ................................................................................ 5-8 Table 5.7-1 Limits and Defaults for f 'c for All Members ................................................................ 5-16 Table 5.7-2 Rebar Size or Wire Diameter Units, Limits and Defaults ........................................... 5-16 Table 5.7-3 Valid Rebar Sizes ....................................................................................................... 5-16 Table 5.8-1 Minimum Design Thicknesses ................................................................................... 5-20 Table 5.15-1 DM-4 Minimum Values of Reinforcement Covers ...................................................... 5-38 Table 6.27-1 Summary of Defaults for OIN Command ................................................................... 6-19 Table 6.28-1 Summary of Defaults for OUR Command.................................................................. 6-20 Table 6.29-1 Summary of Defaults for OUI Command ................................................................... 6-21 Table 6.29-1 Summary of Defaults for OUI Command (Cont.) ....................................................... 6-22 Table 7.1.5-1 Units ............................................................................................................................. 7-3 Table 8.1-1 Example Problem Matrix .............................................................................................. 8-2

LRFD BOX CULVERT DESIGN AND RATING
xii
This page is intentionally left blank.

LRFD BOX CULVERT DESIGN AND RATING
xiii
SUMMARY OF JUNE 1999 REVISIONS - VERSION 1.1
Since the release of BXLRFD Version 1.0 some error reports and user requested enhancements have been received. This release of BXLRFD Version 1.1 contains the following error corrections and enhancements: 1. The strip footing bearing pressure calculation was corrected. 2. The OUI input command was fixed so Parameter 21 SP (Soil Pressure) will print soil pressure results in the
intermediate data reports when it is entered by itself. 3. The Shear Reinforcement calculation for SI runs was corrected and now properly displays in the Shear Design
output table. Also, the Concrete Shear Capacity calculation was corrected for both SI and US runs so it is no longer reduced by the Phi factor.
4. The Future Wearing Surface output field in the input summary table under the Load Control input card was
increased to eliminate it occasionally appearing with asterisks for SI units. 5. The program was corrected to display a Foundation Pressure Report when there is no live load. 6. All dates were modified to display a 4 digit year in the output file. 7. The default value for reinforcement grade in SI units was changed to 420 MPa and the upper limit for
reinforcement grade was changed to 450 MPa.
8. The program now uses soft metric reinforcement (the dimensions and data of US units bars converted to SI units) as per PennDOT standard drawing BC-736M-1-A. The true SI units reinforcement that was allowed in the previous version has been disabled.
9. The program was converted to the Digital Visual Fortran Version 6.0B compiler as a Win32 application. It will
run on Windows 95, Windows 98 and Windows NT Version 4.0 operating systems. It will NOT run under the DOS 6.22 and below operating system.

LRFD BOX CULVERT DESIGN AND RATING
xiv
SUMMARY OF AUGUST 2000 REVISIONS - VERSION 1.2
Since the release of BXLRFD Version 1.1 several error reports and user requested enhancements have been received. This release of BXLRFD Version 1.2 contains these error corrections and user requested enhancements. BXLRFD Version 1.2 contains the following revisions: 1. Fixed a problem that caused the program to crash when designing a frame culvert without shear reinforcement. 2. Fixed the program to prevent it from crashing while printing intermediate output files for a culvert with no live
load. 3. Parameter file validation is now independent of daylight savings time change. 4. The program now produces a bearing pressure report for culverts that have strip footings and no live load. 5. Revised the Truck Axle distribution for Precast Culverts under 2 feet of fill so that results are more comparable
to the Load Factor Method. 6. Revised the lower and upper limits for the input parameter Segment Length on the LDC command based on
the Precast versus Cast-In-Place culverts. 7. Revised the program so that it can run under Windows 2000. It should also run under Windows 9x, and Windows
NT. 8. Revised the calculations of shear depth dv for Design and Analysis runs so that, when Design results are
entered as an Analysis, the culvert will rate okay. 9. The input parameter f’c for Top Slab is now called f’c for Top Slab At Grade. Added a warning message to
indicate when this input parameter is ignored. It is only used for Cast-In-Place culverts at grade. 10. Enhanced the program so input files do not have to reside in the same directory as the executable file. 11. Example problems have been revised to reflect above revisions. 12. User’s Manual pages have been revised to reflect above revisions. The revised pages are identified as "Revised
8/00".

LRFD BOX CULVERT DESIGN AND RATING
xv
SUMMARY OF MAY 2003 REVISIONS - VERSION 1.3
Since the release of BXLRFD Version 1.2 several revision requests and user requested enhancements have been received. This release of BXLRFD Version 1.3 corrects the following known problems and provides enhancements. There are still several outstanding enhancements and problems that will be addressed in the future releases of BXLRFD. What follows are two lists, one containing the revisions included in Version 1.3 and the other containing revisions that have yet to be included in the BXLRFD program. BXLRFD Version 1.3 contains the following revisions:
1. The output routines have been revamped to decrease program size and to allow easier modification. A blank page that appears when no warnings are present at the end of the input echo has been removed. (Request 014)
2. Revised program to show HL-93 rating information during an Analysis run for Live Load Code “B”. (Request
020)
3. Revised how the program calculates bearing pressure to resolve a negative pressure (uplift) issue. Revised the foundation pressure output to show a corresponding pressure for each wall and the effective foundation bearing width. Created a new foundation pressure summary output table that shows the maximum foundation pressure under each wall for each limit state. (Request 021)
4. Added information to the User Manual stating which components in the culvert have impact applied.
(Request 022)
5. The parameter definition file is now named BXLRFD.PD, previously it was using the .PDF file extension that would cause confusion with Adobe Acrobat Files. (Request 024)
6. Updated contact information in Chapter 9 of the User Manual. (Request 025)
7. Added Rating Tonnage to the output. (Request 026)
8. Added Live Load option “D” for design that is the same as “A” except the ML-80 vehicle is included.
(Request 028)
9. Added a pause to the program that prevents automatic closing of the run-time window after the program has executed. (Request 030)
10. Provided the User Manual in an Adobe Acrobat PDF file. (Request 031)
11. Added the Total Weight of Culvert based on segment length to the Quantities Table in the output.
(Request 032)
12. Revised the PHL-93 dual tandem axle weight to 110 kN (25 kips) to get maximum negative moment at the interior wall of a twin cell culvert. (Request 035)

LRFD BOX CULVERT DESIGN AND RATING
xvi
13. Revised tire patch calculation as per DM4 2000 Section 3.6.1.2.5. (Request 036)
14. Added c/de check for calculation of dv for compliance with DM-4 2000 Section 5.8.2.9P. (Request 039)
15. Revised the User Manual to describe how the program locates shear regions. Added new input check to
make certain all haunches are 45 degrees, excluding fish channels. (Request 044)
16. Added new Serviceability Tables to the program that check maximum and minimum spacing, temperature and shrinkage, and crack control criteria for an Analysis run. (Request 047)
17. Revised the program to use the average height of fill to identify which shear equations to use and then use
the average height of fill in the equations. (Request 048)
18. Revised how the program calculates section properties for the haunch when a shear region extends into it. (Request 049)
19. Revised the User Manual for the TVA and BVA commands so that the Shear steel information is consistent
with the program. (Request 050)
20. Revised the Limit State Table (Table 3.4-2) in the User Manual to clarify which limit states the program uses. (Request 054)
21. Revised the program to allow negative rating values that indicate a failure. Also a footnote was added to
describe the significance of the negative rating factor.(Request 055)
22. Revised Maximum Temperature and Spacing limits to meet DM-4 2000 Section 5.10.3 standards. (Request 056)
23. Added a new input parameter for the Maximum Impact Factor for the P-82 Truck Load. (Request 057)
24. Revised the User Manual for the minimum strip width used by the program for precast culverts under a fill
of less than 2 feet. The minimum strip width for precast culverts under a fill of less than 2 feet is now taken as either maximum of ELAT or two times the segment length. Also application of impact in bearing pressure calculations was removed. (Request 059)
25. Revised program to not require a maximum bar or wire size for an analysis run. (Request 60)
The following is a list of reported problems, user requests and clarifications that have not been addressed in Version 1.3
1. Add a U-channel design/Analysis capability to the program. (Request 027) 2. Add shear reinforcement design capabilities to the program with detailed design including bar sizes and
spacing. ( Request 037, 038)

LRFD BOX CULVERT DESIGN AND RATING
xvii
3. Revise program to display Resistance Demand Ratios in the OUI file when they are displayed in the output.
(Request 046)
4. Revise headings in the OUI file to be more meaningful. (Request 051)
5. Add shear region geometry checks and warnings to program for an analysis run when a single bar is entered. (Request 052)
6. Add TK527 Truck Load to the program and use when ML-80 is used. (Request 058) 7. Eta Factor values will set to 1.0 by default. (Request 062) 8. Locations where shear is evaluated will be revised. (Request 069)
LRFD BOX CULVERT DESIGN AND RATING
xviii
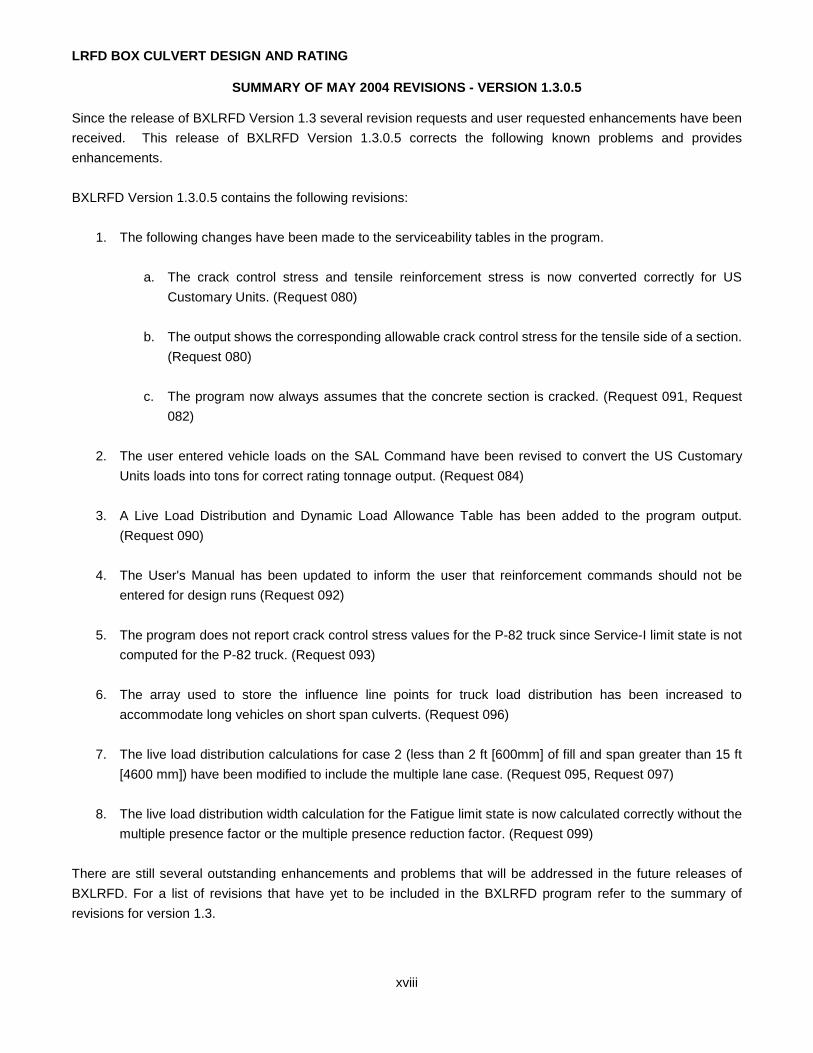
SUMMARY OF MAY 2004 REVISIONS - VERSION 1.3.0.5 Since the release of BXLRFD Version 1.3 several revision requests and user requested enhancements have been received. This release of BXLRFD Version 1.3.0.5 corrects the following known problems and provides enhancements. BXLRFD Version 1.3.0.5 contains the following revisions:
1. The following changes have been made to the serviceability tables in the program.
a. The crack control stress and tensile reinforcement stress is now converted correctly for US Customary Units. (Request 080)
b. The output shows the corresponding allowable crack control stress for the tensile side of a section.
(Request 080) c. The program now always assumes that the concrete section is cracked. (Request 091, Request
082) 2. The user entered vehicle loads on the SAL Command have been revised to convert the US Customary
Units loads into tons for correct rating tonnage output. (Request 084)
3. A Live Load Distribution and Dynamic Load Allowance Table has been added to the program output. (Request 090)
4. The User's Manual has been updated to inform the user that reinforcement commands should not be
entered for design runs (Request 092)
5. The program does not report crack control stress values for the P-82 truck since Service-I limit state is not computed for the P-82 truck. (Request 093)
6. The array used to store the influence line points for truck load distribution has been increased to
accommodate long vehicles on short span culverts. (Request 096) 7. The live load distribution calculations for case 2 (less than 2 ft [600mm] of fill and span greater than 15 ft
[4600 mm]) have been modified to include the multiple lane case. (Request 095, Request 097) 8. The live load distribution width calculation for the Fatigue limit state is now calculated correctly without the
multiple presence factor or the multiple presence reduction factor. (Request 099)
There are still several outstanding enhancements and problems that will be addressed in the future releases of BXLRFD. For a list of revisions that have yet to be included in the BXLRFD program refer to the summary of revisions for version 1.3.

LRFD BOX CULVERT DESIGN AND RATING
xix
SUMMARY OF OCTOBER 2006 REVISIONS - VERSION 1.4.0.0 Since the release of BXLRFD Version 1.3.0.5 several revision requests and user requested enhancements have
been received. This release of BXLRFD Version 1.4.0.0 corrects the following known problems and provides
enhancements.
General Revisions
1. The BXLRFD program has been enhanced to support long file names. (Request 086)
Input Revisions
2. The character limit for the SAL command has been increased 512 characters. (Request 108)
Output Revisions
3. The program has been revised to display a more meaningful warning message when the thickness of a
strip footing is greater than the left or right projection. (Request 128)
Earth Load Revisions
4. The Vertical Earth Load during the construction limit state has been modified to apply force on strip footings.
The Horizontal Earth Pressure during the Construction limit state has also been revised so the height of fill
is limited to the top of the culvert. (Request 078)
5. A warning message when the vertical resultant eccentricity is outside the strip footing has been modified to
provide the user with more detailed information. (Request 078b)
Live Load and Live Load Distribution Revisions
6. The TK-527 load has been added to the design and analysis load options. (Request 058,131)
7. The default values for the Eta factors in the program have been changed to 1.0 and the program has been
revised to prevent a value other than 1.0 from being used. (Request 062)
8. The live load distribution factor equations for less than 2 ft (600 mm) of fill have been revised to conform to
DM-4 Section 4.6.2.12.1P (Request 124)
9. The program has been revised so the user may override the live load application criteria for multi-cell culvert

LRFD BOX CULVERT DESIGN AND RATING
xx
installations. (Request 125)
10. Lane load has been removed from the top slab of box culverts during design and analysis runs as per
D3.6.1.3.3. Lane load is still applied to the other components of the culvert. (Request 134)
11. The gross vehicle weight of the ML-80 vehicle has been revised within the program to not include the 3%
scale tolerance when calculating rating tonnage. The Special Live Load command gross vehicle weight no
longer includes the user entered percent scale tolerance for rating tonnage calculations. (Request 137)
Shear Revisions
12. The shear reinforcement location warning messages have been revised to warn of a non-reinforced shear
point of interest (POI) when shear reinforcement is specified. Also when checking if a warning message
should be printed a tolerance has been added to the calculation of the first and last analyzed shear POI.
(Request 110)
Crack Control and Temperature &Shrinkage Revisions
13. The Maximum Temperature and Shrinkage Spacing Values for the Right/Bottom side of walls has been
modified to display the correct maximum spacing value. (Request 122)
14. The crack control equations have been revised in the program to conform to DM-4 Section 5.7.3.4. (Request
123)
User Manual Revisions
15. Miscellaneous typographical corrections have been made to the User’s Manual. (Request 101,139)
16. The format of the example input file details in Chapter 8 have been changed to match the input summary
table from the output. The example files have been modified so warning messages are no longer produced
during processing. (Request 109)
17. The LRFD and ML-80 Live Loading figure in Chapter 2 has been modified to reflect the correct front axle
load for the ML-80 vehicle. (Request 121)
Engineering Assistant Revisions
18. The Engineering Assistant figures have been modified to include descriptive captions (Request 105).

LRFD BOX CULVERT DESIGN AND RATING
xxi
Programming Revisions
19. The program is now compatible with APRAS. (Request 034)
20. The program has been converted to a Windows DLL based application. (Request 094)
21. The Box Culvert program has been upgraded to the Intel Fortran compiler (v9.0.025) (Request 118)
There are still several outstanding enhancements and problems that will be addressed in the future releases of
BXLRFD. For a list of revisions that have yet to be included in the BXLRFD program refer to the summary of
revisions for version 1.3.

LRFD BOX CULVERT DESIGN AND RATING
xxii
SUMMARY OF APRIL 2008 REVISIONS - VERSION 2.0.0.0 Since the release of BXLRFD Version 1.4.0.0 several revision requests and user requested enhancements have
been received. This release of BXLRFD Version 2.0.0.0 corrects the following known problems and provides
enhancements.
Input Revisions
1. The Fatigue Dynamic Live Load allowance Lower limit has been revised on the LDC command from 0.75
to 1.0 (Request 117).
2. The number of special live load axles allowed in the program has been increased to 80 axles with 79
spacings. (Request 120)
3. The program has been revised so the fill height of a culvert may be left blank. The fill height will be
interpreted as zero if left blank. (Request 144)
Output Revisions
4. The description of the axle loads in the “Summary of Input File” report has been revised to no longer indicate
a “1” or an “n” after the axle load. (Request 141)
5. The “Serviceability Spacing Summary” output table has been revised to prevent a failure indicator from
appearing when no failure actually occurs. (Request 148)
6. The foundation pressure tables have been revised to show limit state information and foundation pressure
for the case when live load was not present. Previously the program only displayed the Strength-I
foundation pressure and the limit state was not identified. (Request 149)
7. A footnote indicating the design thickness of the slab has been added to the Gross Section Properties table.
It will appear beneath the bottom slab output when a fish channel is present. (Request 153)
8. The Concrete Shear Capacity on the Shear Design output table is now displayed as the factored concrete
shear capacity. Previously the program showed the gross concrete section shear capacity. (Request 154)

LRFD BOX CULVERT DESIGN AND RATING
xxiii
Calculation Revisions
9. A U-channel design and analysis capability has been added to the BXLRFD program. (Request 027)
10. The program has been revised to include fish channel concrete in the calculation of dead loads in the
program. Previously the program would ignore the weight of the fish channel concrete. Also an issue has
been fixed where the full wall weight was not being considered in the foundation pressure calculation when
a fish channel is present. In addition the FSH command input checks have been revised so a user can
leave the Segment Width and Height Dimensions blank for a Standard Fish Channel. Previously, the
program would halt with an error if these parameters were left blank for a Standard Fish Channel. (Request
151)
User Manual Revisions
11. The Shear Design parameter name on the OUR command has been modified to be consistent in the User’s
Manual and the parameter definition file. (Request 116)
12. A service load stress calculation procedure has been added to the Users Manual to document how the
program computes the tension stress in the reinforcement. (Request 146)
13. The crack width parameter assumption for the obsolete allowable crack control stress calculation has been
removed from Chapter 2. (Request 147)
Engineering Assistant Revisions
14. The number of walls allowed on the WLR command in Engineering Assistant has been revised to three
walls. Previously the WLR would incorrectly only allow data entry for two walls. (Request 160)

LRFD BOX CULVERT DESIGN AND RATING
xxiv
SUMMARY OF FEBRUARY 2009 REVISIONS - VERSION 2.1.0.0
Since the release of BXLRFD Version 2.0.0.0 several revision requests and user requested enhancements have
been received. This release of BXLRFD Version 2.1.0.0 corrects the following known problems and provides
enhancements.
Input Revisions
1. A new input load has been added to the LDC command to account for a concrete barrier placed atop the
culvert. (Request 155)
2. The parameters on the SID command have been modified so State Route, Segment and Offset parameters
can be entered as zeros. (Request 156)
Output Revisions 3. The OUI file headings for connection objects have been clarified to reflect that bearing pressure values are
reported and the pressure corresponds to walls in the culvert. Previously the program would provide
information with generic headers. Also the strip footing OUI information has been revised to provide more
complete information regarding the calculation of bearing pressure at each POI. (Request 075) 4. The program has been revised so the correct corresponding response values for the construction limit site
in the OUI file are now being correctly reported. Previously, the program was incorrectly calculating the
corresponding response value for the EV load for the construction limit state by using the full height of fill
instead of the construction height of fill. (Request 127)
5. The Serviceability Spacing Summary table has been modified to prevent a failure footnote from appearing
when there are no failures in the Serviceability Spacing Check table. (Request 172)
Calculation Revisions
6. The program has been modified to re-analyze a culvert with strip footings during a design run when only
one external wall requires an increase in thickness. Previously, the program would crash due to adjustments
made in footing geometry which had not been re-analyzed. (Request 152)
User Manual Revisions
7. The equation for the strip footing force resultant N in User Manual Section 3.9.2 has been revised to fix a
typographical error. The equation used in the program was correct. (Request 150)

LRFD BOX CULVERT DESIGN AND RATING
xxv
8. The DIM command has been revised to indicate that the lower limit for section thicknesses can be equal to
zero and minimum thickness checks are only enforced when the parameter is left blank. (Request 157)
9. The contact information in Chapter 9 has been updated to reflect the new organizational name changes at
PennDOT. (Request 163)
10. A typographical error in the equations for Influence Line Loading in User Manual Section 3.3.7 has been
corrected. (Request 167)

LRFD BOX CULVERT DESIGN AND RATING
xxvi
SUMMARY OF AUGUST 2009 REVISIONS - VERSION 2.1.0.1 Since the release of BXLRFD Version 2.1.0.0 several revision requests and user requested enhancements have
been received. This release of BXLRFD Version 2.1.0.1 corrects the following known problems and provides
enhancements.
Calculation Revisions
1. The program has been modified to correctly apply the Barrier Dead Load from the LDC command to Cast-
In-Place culverts. Previously, the program would return incorrect live load results for Cast-In-Place culvert
runs that included Barrier Dead Load input. This revision only affects Cast-In-Place culverts. (Request 152)

LRFD BOX CULVERT DESIGN AND RATING
xxvii
SUMMARY OF MAY 2010 REVISIONS - VERSION 2.2.0.0 Since the release of BXLRFD Version 2.1.0.1 several revision requests and user requested enhancements have
been received. This release of BXLRFD Version 2.2.0.0 corrects the following known problems and provides
enhancements.
Input Revisions
1. A new load has been added to the program to account for approach slabs supported by culverts. Dead load
and Live load can be entered independently for each wall. (Request 179)
2. Minimum toe and heel projection checks have been added to the program for frame culverts. (Request
182)
Output Revisions
3. The output has been modified to now indicate the origins where the slab and wall distances are referenced
from. (Request 175)
4. The Allowable Crack Control Spacing has been added to the Output of Intermediate Data file. Previously,
the now obsolete Allowable Crack Control Stress was shown. (Request 169)
5. The program has been enhanced to generate a PDF file for each output file. When possible, the PDF file
contains bookmarks for easier navigation of the output. The PDF file also makes it easier to print and
paginate the program output. (Request 170)
6. The Bottom Slab Steel Area Range values on the Input Summary Table have been revised to show the
correct values. Previously, the program would incorrectly show the range values for the Top Slab. (Request
180)
7. The Output of Results parameters shown in the Input Summary table have been corrected. Previously,
the Rating Summary and Dead Load Effects and Capacities parameters were shown in the wrong order.
(Request 189)
Reinforcement Revisions
8. The program has been revised to prevent the design of shear reinforcement within the walls of a culvert.
The program will now increase the wall thickness if the shear capacity is not adequate for DR run types.
Previously, the program could potentially design shear steel in the walls of a culvert during a design run,
but for an analysis run there was no way to enter the shear steel for the wall. (Request 176)

LRFD BOX CULVERT DESIGN AND RATING
xxviii
9. The program has been enhanced to check the development length of wall bars which extend into a strip
footing for the controlling face of the wall during design runs. (Request 177)
10. The allowable crack control spacing calculation has been revised to return a large reinforcement spacing
when the tensile stress within the reinforcement is less than zero (i.e. bar is in compression). Previously,
the program would calculate the allowable crack control spacing with the negative tensile reinforcement
stress and incorrectly return a design controlling spacing of zero. (Request 195)
General Program Revisions
11. The BXLRFD program has been revised to no longer support SI unit input files. This is based on a decision
by AASHTO Subcommittee on Bridges and Structures to no longer publish updates to the SI unit version
2007 AASHTO LRFD Bridge Design Specifications. (Request 188)
User Manual Revisions
12. The On-Deck Live Load Distribution equation reference in Chapter 3 has been updated to cite the 2007
AASHTO LRFD Bridge Design Specifications. Previously, the equation cited a section of DM-4 that does
not exist. (Request 166)

LRFD BOX CULVERT DESIGN AND RATING
xxix
SUMMARY OF MARCH 2011 REVISIONS - VERSION 2.3.0.0
Since the release of BXLRFD Version 2.2.0.0 several revision requests and user requested enhancements have
been received. This release of BXLRFD Version 2.3.0.0 corrects the following known problems and provides
enhancements.
Input Revisions
1. The program has been enhanced to now design and analyze precast frame culverts which are placed on
cast-in-place strip footings. Previously the program could only design and analyze cast-in-place frame
culverts with strip footings. (Request 174)
Output Revisions
2. The headers for the Finite Element Model Output File (.FEM) have been revised to be more descriptive and
provide units. (Request 197)
Strip Footing Revisions
3. The Strip Footing Shear Design table has been revised to include the TK527 live load code. Previously, if
the TK527 load would control for the shear design in a strip footing, the program would stop with an error.
(Request 198)
4. The Serviceability Spacing Check for Strip Footings has been revised to use the correct load cases when
determining the tensile reinforcement stress in the footing under the right wall. Previously, the program was
incorrectly accessing the positive load case instead of the negative load case. Also, the Serviceability
Summary Table has been revised to prevent the program from erroneously indicating a fault with a
component when no fault is present. (Revision 199)
5. The Development Length Table has been revised to correctly select the controlling face of the wall when
the Required Area of Steel for each face at the bottom of the wall is equal. Previously, the program would
only select the left face if the Area of Steel Required was equal for both faces. (Request 202)
Finite Element Revisions
6. The program was revised to provide better symmetry within the finite element model results and more
closely matches the results from the BOX5 program. This was accomplished, as a temporary workaround,
by increasing the axial areas within the finite element model to a large value so the axial deformations will
be negligible. (Request 193)
General Program Revisions

LRFD BOX CULVERT DESIGN AND RATING
xxx
7. An erroneous program crash has been resolved related to the lack of shear steel in external walls during a
design run. Previously, for certain input files, during an iterative design run the program would halt with an
error when attempting to clear out memory for shear reinforcement in the external and internal walls during
an iterative design run. Due to a recent change, the program no longer designs shear reinforcement in the
walls and therefore should not try to clear out memory for reinforcement in walls. (Request 200)
User Manual Revisions
8. The User Manual has been modified to describe efficient design of walls when the top slab thickness is
incremented during a design run. (Request 171)
Engineering Assistant Revisions
9. The Fill Grade field on the DIM command in Engineering Assistant has been revised to allow negative
numbers to be entered. Previously, only positive values could be entered using Engineering Assistant.
(Revision 186)

LRFD BOX CULVERT DESIGN AND RATING
xxxi
SUMMARY OF SEPTEMBER 2012 REVISIONS - VERSION 2.4.0.0
Since the release of BXLRFD Version 2.3.0.0 several revision requests and user requested enhancements have
been received. This release of BXLRFD Version 2.4.0.0 contains the following revisions and enhancements.
General
1. The BXLRFD program has been updated to the AASHTO LRFD Bridge Design Specifications Fifth Edition
2010 and the 2012 PennDOT Design Manual Part 4.
2. The program has been revised to no longer evaluate the Fatigue limit state based on the 2010 AASHTO
LRFD Specification section 5.5.3.1. (Request 215)
Flexural Revisions
3. The Flexural Phi factor has been revised to comply with the 2010 AASHTO LRFD Specifications. The phi
factor now varies linearly based on the strain in the section. Also, the moment axial interaction envelope
has been revised to include the tension controlled strain point and the point based on 0.1Agrossf’c. has been
removed.(Request 218)
4. The temperature and shrinkage reinforcement calculations for Serviceability have been revised to comply
with new shrinkage and temperature reinforcement specifications In the 2012 DM-4 Article 5.10.8 and the
2010 AASHTO LRFD Specification. (Request 217)
Program Source Revisions
5. The BXLRFD program has been updated to the Intel Fortran Composer XE 2011 Compiler. (Request 207)
User Manual Revisions
6. The two right most axle loads in User Manual Figure 2.4-2 for the TK527 vehicle have been corrected.
(Request 211)

LRFD BOX CULVERT DESIGN AND RATING
xxxii
SUMMARY OF MAY 2013 REVISIONS - VERSION 2.5.0.0
Since the release of BXLRFD Version 2.4.0.0 several revision requests and user requested enhancements have
been received. This release of BXLRFD Version 2.5.0.0 contains the following revisions and enhancements.
Input Revisions
1. The upper limit for f’c of All Members on the MAT command has been revised to provide input warnings
based on whether the structure is Cast-In-Place or Precast. Previously, the program would only issue a
warning if the entered f’c would exceed the upper value for Precast only. (Request 214)
2. The default value for "Live Load Code" for design runs of the program has been changed to "E" to ensure
inventory rating factors for the ML-80 and TK527 vehicles > 1.0 as specified by DM-4 Sections 3.6.1.2.8P
and 3.6.1.2.9P. Additionally, if the user specifies a live load code other than "E" for a design run, a warning
message will appear in the program output The default live load code for analysis runs remains unchanged
as code “A”. (Request 225)
Output Revisions
3. The program has been revised to generate Live Load Ratings for an analysis run with and without Future
Wearing Surface in a single run. Previously, the user would have to generate two sets of rating values by
running the program twice. (Request 206)
4. The program has been revised to generate a new output table, named Combined Load Ratings Summary,
that shows in one table the controlling rating for each of the different live loads. The table also includes the
component and location where the controlling rating occurs. Previously, the user had to review multiple
tables to determine the controlling rating for each live load. (Request 210)
Reinforcement Revisions
5. The program has been revised to accommodate the use of high strength reinforcement. When the
reinforcement grade exceeds 60 ksi, Chief Bridge Engineer approval is required and limitations are placed
on fy for flexure, axial and shear based on the AASHTO LRFD Section C5.4.3.3. Previously, the user could
enter values larger than 60 ksi for fy and the program would perform all calculations with the entered
reinforcement grade. (Request 204)
Serviceability Revisions
6. The program has been revised to prevent an erroneous serviceability failure on the Serviceability Spacing

LRFD BOX CULVERT DESIGN AND RATING
xxxiii
Summary table which was occurring when the Serviceability Spacing Check table was turned off on the
OUR command. (Request 213)

LRFD BOX CULVERT DESIGN AND RATING
xxxiv
SUMMARY OF MAY 2014 REVISIONS - VERSION 2.6.0.0
Since the release of BXLRFD Version 2.5.0.0 several revision requests and user requested enhancements have
been received. This release of BXLRFD Version 2.6.0.0 contains the following revisions and enhancements.
General Program Revisions
1. The method of calling the engineering program DLL from the Engineering Assistant has been changed for
compatibility with EngAsst v2.5.0.0 which uses Microsoft's .NET Framework, version 4.5. Because of this,
BXLRFD will no longer work with EngAsst v2.4.0.6 or v2.4.0.9 unless the EngAsst “Edit / Run EXE –
Command Window” option is selected. BXLRFD will no longer work with EngAsst v2.4.0.0 and earlier.
(Request 230)
2. The BXLRFD program has been updated to compile with Intel Fortran XE 2013 SP1 Update 1 using Visual
Studio 2012 Update 4. (Request 226)
3. The BXLRFD program finite element model generation has been revised so the results more closely match
those found in STAAD.Pro V8i. Previously, the results of the BXLRFD finite element models had been set
up to replicate the force results for PennDOT’s BOX5 culvert analysis program. (Request 201)
Input Revisions
4. The concrete density has been converted into a user specified input item. The user now has the ability to
specify two concrete densities. One for calculating the Modulus of Elasticity and the other for calculating
the concrete dead load. Previously the program always used a concrete density of 150 pcf for deal load
and 145 pcf for Modulus of Elasticity. (Request 033)
5. The program has been revised to allow for the analysis of a single axle load input through the SLL
command. Previously, the program would require a minimum of two axle loads. (Request 159)
6. A new input for Backfill Type has been added to the LDC command. The Backfill Type input is used by the
program per A3.6.1.2.6 to determine the distribution of wheel loads through earth fills. For select granular
backfill the wheel load is distributed by the tire contact area increased by 1.15 times the depth of fill. For
other backfill materials the wheel load is distributed by the tire contact area increased by 1.0 times the depth
of fill. Previously, the program never considered select granular backfill material when calculation the wheel
distribution through earth fills. (Request 221)

LRFD BOX CULVERT DESIGN AND RATING
xxxv
Output Revisions
7. A new Geometry Output table has been added to the Additional Information section of the output. The new
table displays a concise list of all final component thicknesses for both analysis and design runs. Previously,
the user would have to search the Gross Section Properties table to assemble a list of the same information.
(Request 194)
8. The Flexure Design Output Tables have been modified to now provide the Factored Resisting Thrust and
Moment based on the Design Area of Steel. In addition, the table now provides the applicable bending Phi
Factor controlling zone used to calculate the Resisting Moment. Previously, the program would only show
the Applied Factored Forces and the Designed Area of Steel.(Request 220)
9. The Live Load Ratings and Dead Load Effects and Capacities Output tables for analysis runs have been
revised to now check that the provided area of steel, for each POI, is not less than the minimum required
area of steel. Previously, the program would only show the Provided Area of Steel in the output and would
not perform any minimum area of steel check for analysis runs. (Request 223)
User Manual Revisions
10. The Height of Fill parameter description on the LDC command in Chapter 5 and the Overlay Weight/Density
and Overlay Thickness input parameter descriptions on the LDC command in Chapter 6 have been updated
to provide more information on the modeling of an Overlay slab in the BXLRFD program. Previously, the
command descriptions did not address how to model an Overlay slab within BXLRFD.(Request 196)

LRFD BOX CULVERT DESIGN AND RATING
xxxvi
SUMMARY OF JULY 2016 REVISIONS - VERSION 2.7.0.0
Since the release of BXLRFD Version 2.6.0.0 several revision requests and user requested enhancements have
been received. This release of BXLRFD Version 2.7.0.0 contains the following revisions and enhancements.
Input Revisions
1. The Lower Limit for the LDC command “Minimum Equivalent Fluid Pressure” parameter has been changed
from 0 to 1 to prevent a divide-by-zero error. The Lower Limit for the LDC command “Maximum Equivalent
Fluid Pressure” parameter has also been changed from 0 to 1 for consistency. (Request 246)
Output Revisions
2. The format of the COMBINED RATING SUMMARY table has been revised to the program to report rating
information similar to DM-4 Part A Table 1.8.3-1. (Request 228)
3. For certain input files using the minimum required reinforcement (#4 @ 12”), the LIVE LOAD RATING
output table displays an incorrect warning indicating that the provided reinforcement is less than the
required minimum when the values are actually equal. The program has been revised so the provided
reinforcement can be equal to the minimum required reinforcement which prevents this erroneous warning
from appearing. (Request 234)
4. The page layout of the output file has been enhanced to allow for more characters per page width and more
lines per page in the PDF output file. The new layout has 102 characters per page width and 83 lines per
page. (Request 240)
5. The column headings have been corrected for the three Load Modification Factor parameters which appear
in the Input Summary output table for the LDC command. The headings are now correctly labelled in order
of, Ductility Factor, Redundancy Factor and Importance Factor. (Request 248)
Specification Revisions
6. A fix has been made to the Crack Control Spacing value displayed in the SERVICEABILITY SPACING
CHECK output table to prevent the Crack Control Spacing column from displaying “99.99” when the actual
Crack Control Spacing is computed as a negative number. The program will now display the Crack Control
Spacing as 0.00 when the calculated value is negative. (Request 233)
7. The program has been revised to allow the user to enter the number of precast segments that provide shear
transfer as defined in DM-4 Section 4.6.2.10.4. The program uses this new input to compute the lateral
distribution width. Previously, the program always assumed that 2 precast segments provided shear

LRFD BOX CULVERT DESIGN AND RATING
xxxvii
transfer. (Request 235B)
8. The program has been revised to follow the 2014 AASHTO Section 3.6.1.2.6 for the distribution of wheel
loads through fill by always using a 2:1.15 slope (approximately 60 degree angle) regardless of the backfill
type. See User Manual Section 3.3.17.2 for details. Previously, the program would use 2:1.15 slope for
granular backfill and 2:1 slope for other backfill types. (Request 238)
9. The calculation of Cracking Moment has been revised to use a new equation from the 2015 DM-4 Section
5.7.3.3.2 which applies multiple factors. Previously, the program would calculate the Cracking Moment
using a constant 1.2 factor. (Request 242)
10. The Crack Control spacing calculation has been revised to limit the calculated tensile stress in the
reinforcement to be no greater than 0.6*fy based on the 2014 AASHTO LRFD A5.7.3.4. Previously, the
program would use the computed tensile stress in the calculation of the Crack Control spacing without
limitation. (Request 243)
General Program Revisions
11. The program is now compatible with APRAS NextGen. The CTL Type of Run “AP” has been removed
from the program for consistency with the STLRFD and PSLRFD programs. (Request 164)
12. A problem has been fixed for certain input files, representing symmetrical two cell box culverts with no live
load, which would stop with an error while writing the Interior Wall results for the SHEAR DESIGN output
table. (Request 236)
13. The concrete quantity that appears in the output for the strip footing has been corrected to use the correct
footing thickness. (Request 245)
14. The program has been revised to provide a new WVA input command to allow for the definition of shear
reinforcement areas in the walls when performing an Analysis (Type AR) run. This new command enables
the user to take the required wall shear reinforcement calculated from a Design run and enter it into an
Analysis run input file for processing. (Request 237)
User Manual Revisions
15. The BXLRFD User Manual title page has been revised to use a new format and a new logo.(Request 235A)
The following is a list of enhancements from the 2014 AASHTO LRFD Specifications that are not included in
this version but will be implemented in a later version:

LRFD BOX CULVERT DESIGN AND RATING
xxxviii
1. The 2014 AASHTO LRFD Specifications include the variation of the resistance factor, φ, for sections in the
transition zone between tension-controlled and compression-controlled defined by the net tensile strain in
the extreme tension steel and the compression-controlled and tension-controlled strain limits. Previously,
the variation in the resistance factor was expressed in terms of the ratio dt/c. (Request 244)

LRFD BOX CULVERT DESIGN AND RATING
xxxix
SUMMARY OF SEPTEMBER 2018 REVISIONS - VERSION 2.8.0.0
Since the release of BXLRFD Version 2.7.0.0 several revision requests and user requested enhancements have
been received. This release of BXLRFD Version 2.7.1.0 contains the following revisions and enhancements.
Input Revisions
1. A problem was fixed with the WVA command where an error was returned when more than one shear
reinforcement range was entered. (Request 258)
2. An inconsistency between the valid MAT Alpha parameter values and the BXLRFD User Manual
documentation was corrected. The LOWER LIMIT for Alpha was changed from 0.0 to 1.0 degree. A default
value of 90 degrees for Alpha was added. (Request 268)
Output Revisions
3. A new output table called MINIMUM REINFORCEMENT CHECK has been added to the program for both
Analysis and Design runs to report the various reinforcement steel areas at each POI that are used to
determine the minimum required reinforcement area. Reinforcement areas reported are: cracking moment, 43*ultimate moment, ρmin area, temperature and shrinkage area, and 0.002*gross concrete area
(A12.11.4.3.2). (Request 065)
4. A problem which caused some incorrect phi-factor 'Zone' values to be displayed in the LIVE LOAD RATING
output tables for certain Wall components has been fixed. (Request 282, also see Request 253 below)
Specification Revisions
5. The calculation of 𝜙𝜙 factor has been revised to use the new strain-based equation from AASHTO Section
5.5.4.2 for the situations where loading causes the strain in the section to be between the tension-controlled
and compression-controlled regions. Also, calculations for computing and considering the moment
resistance and axial resistance for the compression-controlled strain condition of the section have been
added to BXLRFD moment axial interaction calculations. (Request 244)
6. The program no longer considers sections to be under-reinforced or over-reinforced. Previously, sections
having a “c/de” ratio greater than 0.42 were considered to be over-reinforced as defined in AASHTO Article
5.7.3.3.1. AASHTO Article 5.7.3.3 notes that Article 5.7.3.3.1 was deleted in 2005. The 𝜙𝜙 factor value
computed by the program to determine if the reinforcement is sufficient, has been added for each POI to
the LIVE LOAD RATING and FLEXURAL REINFORCEMENT DESIGN output tables. The current column
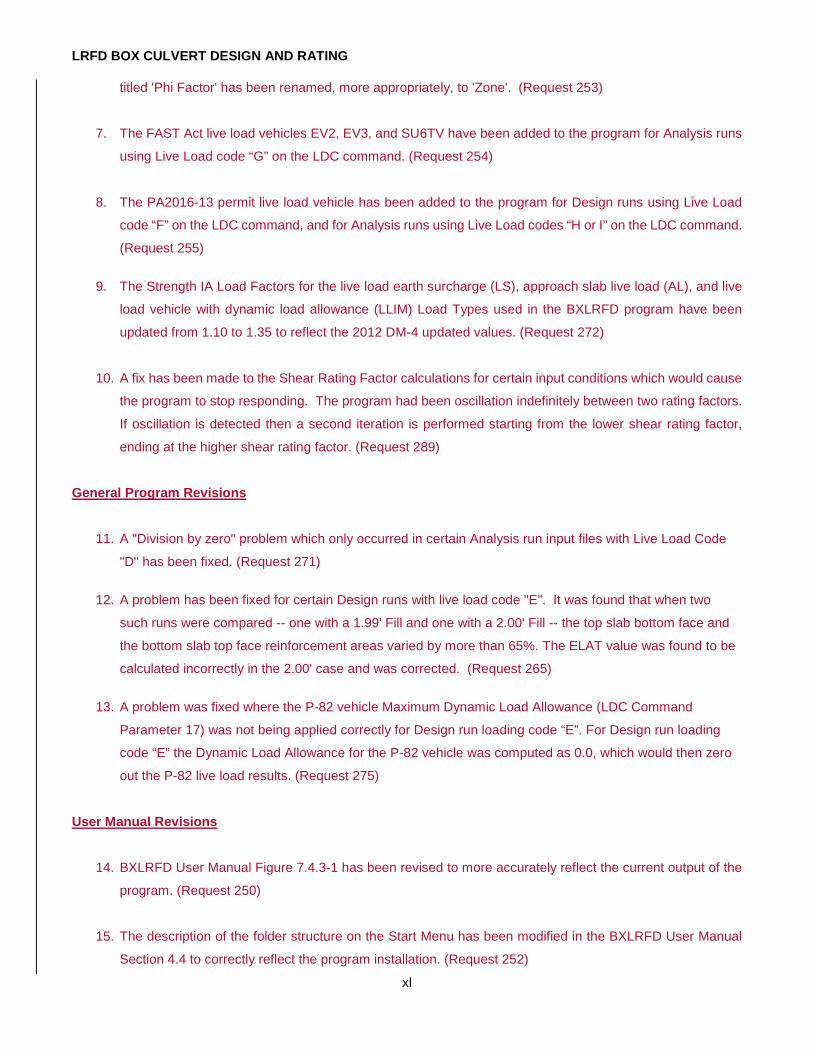
LRFD BOX CULVERT DESIGN AND RATING
xl
titled 'Phi Factor' has been renamed, more appropriately, to 'Zone'. (Request 253)
7. The FAST Act live load vehicles EV2, EV3, and SU6TV have been added to the program for Analysis runs
using Live Load code “G” on the LDC command. (Request 254)
8. The PA2016-13 permit live load vehicle has been added to the program for Design runs using Live Load
code “F” on the LDC command, and for Analysis runs using Live Load codes “H or I” on the LDC command.
(Request 255)
9. The Strength IA Load Factors for the live load earth surcharge (LS), approach slab live load (AL), and live
load vehicle with dynamic load allowance (LLIM) Load Types used in the BXLRFD program have been
updated from 1.10 to 1.35 to reflect the 2012 DM-4 updated values. (Request 272)
10. A fix has been made to the Shear Rating Factor calculations for certain input conditions which would cause
the program to stop responding. The program had been oscillation indefinitely between two rating factors.
If oscillation is detected then a second iteration is performed starting from the lower shear rating factor,
ending at the higher shear rating factor. (Request 289)
General Program Revisions
11. A "Division by zero" problem which only occurred in certain Analysis run input files with Live Load Code
"D" has been fixed. (Request 271)
12. A problem has been fixed for certain Design runs with live load code "E". It was found that when two
such runs were compared -- one with a 1.99' Fill and one with a 2.00' Fill -- the top slab bottom face and
the bottom slab top face reinforcement areas varied by more than 65%. The ELAT value was found to be
calculated incorrectly in the 2.00' case and was corrected. (Request 265)
13. A problem was fixed where the P-82 vehicle Maximum Dynamic Load Allowance (LDC Command
Parameter 17) was not being applied correctly for Design run loading code “E”. For Design run loading
code “E” the Dynamic Load Allowance for the P-82 vehicle was computed as 0.0, which would then zero
out the P-82 live load results. (Request 275)
User Manual Revisions
14. BXLRFD User Manual Figure 7.4.3-1 has been revised to more accurately reflect the current output of the
program. (Request 250)
15. The description of the folder structure on the Start Menu has been modified in the BXLRFD User Manual
Section 4.4 to correctly reflect the program installation. (Request 252)

LRFD BOX CULVERT DESIGN AND RATING
xli
16. Sections 5.10.21 and 6.10.21 of the BXLRFD User Manual have been updated to clarify how the user may
distribute the barrier dead load over the culvert design width. (Request 256)
17. Additional explanation has been added to BXLRFD User Manual Section 5.10.26, LDC command, Number
of Precast Shear Transfer Segments providing direction on what value the user should enter. (Request
259)
18. A reference to the obsolete "Example Problem Manual" was removed from BXLRFD User Manual Section
8.1. (Request 260)
Programming Revisions
19. The BXLRFD program is now compiled with the Intel FORTRAN Parallel Studio XE 2017 Update 5
Composer Edition using Microsoft Visual Studio 2017. (Request 264)

LRFD BOX CULVERT DESIGN AND RATING
xlii
This page is intentionally left blank.

1-1
1. GENERAL DESCRIPTION
1.1 PROGRAM IDENTIFICATION
Program Title: LRFD Box Culvert Design and Rating Program Name: BXLRFD Version: 2.8.0.0 Subsystem: Substructure Authors: Pennsylvania Department of Transportation,
Imbsen and Associates, Inc., and Modjeski and Masters, Inc.
ABSTRACT: The LRFD Box Culvert Design and Rating program (BXLRFD) performs an analysis and specifications check in
accordance with the AASHTO LRFD Bridge Design Specifications and the Pennsylvania Department of
Transportation Design Manual Part 4, for cast-in-place and precast box culverts and U-channels. As result of a
decision by the AASHTO Subcommittee on Bridges and Structures to longer publish System International (SI) unit
specifications, the program only supports US customary (US) units.
The program can perform an analysis or design of a one or two cell, reinforced concrete precast or cast-in-place
box culvert, with or without haunches, and a fish channel, and of a one or two cell reinforced concrete cast-in-place
or precast rigid frame culvert. A variable top slab, sloped fill, and/or a variety of live loads, including a user specified
special live load, can be specified and analyzed.
The program can perform an analysis or design of a one cell, reinforced concrete precast or cast-in-place U-
channel, with or without haunches, and a fish channel.
The loads applied to the structure are based on the LRFD limit state combinations that have been adjusted to
incorporate PennDOT policies. The limit state combinations include strength, service and construction limit states
for final and temporary construction stages. The program uses a 2-dimensional finite - element frame model to
analyze the culvert for all load effects.
The program can perform analysis (rating) or design. For analysis, the program performs specifications checking
and rates the sections for moment and shear at 10th points, other critical sections, and user defined points. For

Chapter 1 General Description
1-2
design, the program can size member thicknesses, compute the required flexural reinforcement, and compute the
bar size and spacings for strength and crack control at 10th points, and other critical sections. Shear reinforcement
can also be computed for design or specified for analyses in the top slab, bottom slab and walls.
1.2 ABBREVIATIONS
This section provides definitions that are commonly used throughout this User's Manual.
AASHTO - American Association of State Highway and Transportation Officials.
BXLRFD - LRFD Box Culvert Design and Rating program.
DM-4 - Pennsylvania Department of Transportation Design Manual Part 4, April 2015 This
publication can be ordered from:
Pennsylvania Department of Transportation1-1- Publication Sales P.O. Box 2028 Harrisburg, PA 17105
This publication can also be downloaded free of charge from PennDOT’s website. LRFD specifications - AASHTO LRFD Bridge Design Specifications. Seventh Edition, 2014, published by:
American Association of State Highway and Transportation Officials 444 North Capitol Street, N.W., Suite 249 Washington, D.C. 2001
PennDOT - Pennsylvania Department of Transportation.

2-1
2. PROGRAM DESCRIPTION 2.1 GENERAL
The purpose of the LRFD Box Culvert Design and Rating program (BXLRFD) is to provide bridge engineers with a
tool to design or analyze single or two cell reinforced concrete boxes, rigid frame culverts and U-channels in
accordance with the AASHTO LRFD Bridge Design Specifications and the Pennsylvania Department of
Transportation Design Manual Part 4.
The structural analysis is based on a 1 ft length of the culvert, and uses the direct stiffness method to compute all
member forces produced by the dead, earth, and live loads. The live load can be an LRFD loading or a user -
defined loading, including a combination of truck and lane loading.
After the structural analysis is performed and the limit state combinations computed, the program checks for
compliance with the specifications for shear, moment and moment-axial interaction stresses. The live load ratings
are also produced if applicable.
2.2 CULVERT TYPES
Single and two cell box and rigid frame culverts or single cell U-channels can be analyzed or designed by this
program. Examples of these types are shown in Figure 1. Box culverts and U-channels may be either cast-in-place
or precast. Rigid Frame culverts can either be cast-in-place or precast. The top slab of the culvert may be analyzed
as monolithic or simply supported, and may be at grade or under fill. The culvert may be analyzed with or without
monolithic haunches. Standard or nonstandard fish channels can be defined in the bottom slab of box culverts and
U-channels. Fish channels in two cell box culverts are permitted to be in the left cell only.
2.3 PROGRAM FUNCTIONS
BXLRFD performs the following functions:
1. Input Processing - The program prompts the users for the name of input and output files and then processes
the input. The program checks the user-entered input values and compares them with lower and upper limits
stored in the program. If the user value is less than the lower limit, or greater than the upper limit, an error or
warning is issued. If an error is detected, the program will stop processing; otherwise, the program will continue
to the calculations concerning the geometry. The program inserts default values for items for which default
values are available and for which no user values were entered.

Chapter 2 Program Description
2-2
% Grade
(a) Single Cell - Level FillNo Fish Channel
(b) Single Cell - Under FillStandard Fish Channel
(c) U-channel – No Fish Channel
(d) U-channel – Standard Fish Channel
Figure 2.2-1 Types of Culverts

Chapter 2 Program Description
2-3
Roadway
(e) Twin Cell - Top Slab at GradeNon-Standard Fish Channel
Roadway
(f) Cast-in-place Twin Cell Rigid Frame - Top Slab at Grade(No Bottom Slab)
Roadway
(g) Precast Twin Cell Rigid Frame - Top Slab at Grade(No Bottom Slab – User Designed Footings)
Figure 2.2-2 Types of Culverts (cont.)
2. Structural Modeling / Geometry - From the input values of culvert dimensions and thicknesses, the program
builds a plane frame model by assuming a joint at the intersection of the culvert slab and wall center lines.
Each culvert slab and wall is divided into a number of members such that the analysis points can be obtained
at the tenth points of the clear length of the slab or wall and other points such as transition of the haunches
and the fish channel. For box culverts, a pinned support is assumed at the left bottom corner of the model
and roller supports are assumed at the left top corner and the right bottom corner of the model. For cast in
place frame culverts, fixed connections are assumed at the bottom of each wall and a roller support is

Chapter 2 Program Description
2-4
assumed at the top left corner. For precast frame culverts, pinned connections are assumed at the bottom of
each wall and a roller support is assumed at the top left corner. Each member of the model is assumed to
have a constant cross section. The finite element model cross section is set to a large value to minimize the
effects of axial deformation in the finite element model to more closely match the results of the Pennsylvania
Department of Transportation’s BOX5 program, which utilizes the slope deflection method and does not
consider axial deformation. The joint coordinates, member connectivity, and member properties are used for
the direct stiffness method of analysis for the model.
3. Structural Analysis - The plane frame model described above is analyzed for a variety of dead, earth and live
loadings to get the effects (moments, shears and axial forces) at all analysis points. The loads applied are the
self weight of components (DC), wearing surface (DW), weight of earth (EV), earth pressure (EH), live load
surcharge (LS), weight of water (WA), and live loading (LL). For live loading effects, influence lines for
moments, shears and axial forces at analysis points are generated first and then these influence lines are
processed to produce the positive and negative live load effects.
4. Load Combination - The culvert load effects from all applied loads are factored by maximum and minimum load
factors and combined into the following limit states:
• Strength I
• Strength IA
• Strength II
• Construction
• Service I
The same load factor is applied to both the horizontal and vertical components of EH and/or LS since the
resultants of those loads each represent inclined forces.
5. Analyze / Design Section - The program operates in two modes: Analysis (Rating) or Design. For Analysis, the
member thicknesses and reinforcement are known and the program performs specifications checking, and then
rates the sections for moment and shear. For Design, three options are available. In the first design option,
the program designs the flexural reinforcement and shear reinforcement (if required) for known member
thicknesses. In the second design option, the program designs both the member thicknesses for flexure and
shear (without shear reinforcement) and the flexural reinforcement. In the third design option, the program
designs the member thickness for flexure and both the flexural reinforcement and the shear reinforcement (if
required). Ratings are not provided in design runs.
6. Culvert Reinforcement - The culvert reinforcement consists of flexural and shear reinforcement for each
component, i.e., top slab, bottom slab, walls, and strip footings. For analysis, all strength and serviceability
requirements for the reinforcement entered by the user are checked, including minimum steel area, and
minimum and maximum spacing. However, the calculated rating factors are based on the strength
requirements only. For design, the program calculates the required reinforcement. The reinforcement

Chapter 2 Program Description
2-5
requirements are based on strength and serviceability for crack control for bars, and based only on strength for
wires. Minimum and maximum bar spacing, and minimum area of steel are checked for all components. The
development length is not checked.
7. Footing Reinforcement - The strip footing of a rigid frame culvert is assumed to have flexural reinforcement
only; i.e., no shear reinforcement is allowed. For analysis, all reinforcement must be entered by the user. For
design, the program calculates the required flexural reinforcement in the user defined strip footings to satisfy
all strength and serviceability requirements. The development length is not checked.
8. Bearing Pressure - The actual bearing pressure is calculated for the strip footings of rigid frame culverts and
the bottom slab of box culverts. The maximum actual bearing pressure under each wall of a rigid frame culvert
and under the bottom slab of a box culvert is reported. The program does not check the maximum actual
bearing pressure against an allowable bearing pressure.
9. Quantity - The volume of concrete for each component is reported by the program.

Chapter 2 Program Description
2-6
2.4 LIVE LOADINGS
The user has several live load options for performing an analysis or design. The following live loadings may be
considered:
HL-93 - AASHTO LRFD live loading
PHL-93 - PennDOT LRFD live loading
ML-80 - PennDOT maximum legal live loading
P-82 - PennDOT permit live loading
HS20 - AASHTO HS20 live loading
H20 - AASHTO H20 live loading
SLL - User-defined special live loading
TK527 - PennDOT TK527 live loading
EV2 - FAST Act EV2 live loading
EV3 - FAST Act EV3 live loading
SU6TV - FAST Act SU6TV live loading
PA2016-13 - PA2016-13 permit live loading
The HL-93 loading is the vehicular live load consisting of the design truck, design tandem, and design lane load as
defined in the LRFD Specifications. The PHL-93 loading is the same as the HL-93 loading except that the axle
loads on the design tandem for the PHL-93 loading are multiplied by a factor of 1.25.
The PennDOT maximum legal live loading (ML-80) is the maximum legal truck allowed in Pennsylvania. The
PennDOT permit live loading (P-82) is a notional load used to check the Strength II limit state. The AASHTO HS20
live loading and AASHTO H20 live loading are in accordance with the AASHTO Standard Specifications for Highway
Bridges. For the special live loading (SLL), the user can input the axle loads, the axle spacings, uniform lane
loading, and the corresponding load factors for each limit state.
The axle loads and axle spacings for the HL-93 and PHL-93 design truck, HL-93 design tandem, PHL-93 design
tandem, and ML-80 rating truck are presented in Figure 1. The P-82 permit truck, TK527 truck, HS20 truck and
H20 truck loadings are presented in Figure 2. (Note: This program does not apply the HS20 or H20 lane loading
to the culverts since it is assumed that these loadings will not control over the HS20 or H20 truck loadings for a
culvert.) Figure 3 presents the FAST Act EV2, EV3, and SU6TV vehicle loadings. The FAST Act vechicles are not
considered notional loads. The design lane load for both the HL-93 and PHL-93 loading is taken as 0.64 kips per
linear foot. However, design lane loads will not be applied to the top slab(s) of culverts as required by D3.6.1.3.3.
The PA2016-13 special design permit vehicle shown in Figure 4 is considered a notional load and the vehcile has
two variable spaced axles. The first variable spaced axle is between axles 7 and 8 with a spacing that varies from
a minimum of 30 ft. to a maximun of 50 ft.. The second variable axle between axles 10 and 11 varies from 5 ft. to
14 ft.. Vehicle definitions in BXLRFD are limited to vehicles with a single variable axle. Because of this limitation,

Chapter 2 Program Description
2-7
the vehicular loading for the PA2016-13 vehicle was modeled as a live load envelope in the program. The PA2016-
13 live load envelope consists of ten vehicles, each with a single variable axle spacing between axles 7 and 8. For
each of the ten vehicles the other variable axle is held constant. The first vehicle consists of a 5 ft. axle spacing
between axles 10 and 11; the second vehicle consists of a 6 ft. axle spacing between axles 10 and 11; and so on
until the last vehicle which consists of a 14 ft. axle spacing between axles 10 and 11.
In place of the above live loadings, the culvert can be analyzed for a special live loading (SLL) by specifying the
axle loads, axle spacings, and/or the uniform lane load. The SLL command can be used to analyze a permit load,
analyze more than one truck unit on the structure, or to check the combination of a truck load and a lane load. A
special live load may have up to a maximum of 24 axles.
The live loads to be used for an analysis or design are designated by the user by entering a live load code. The
live load designations used for each live load code and each load case are summarized in Tables 1 and 2.

Chapter 2 Program Description
2-8
8.0 KIP 32.0 KIP 32.0 KIPHL-93 and PHL-93)
14 FT 14 to 30 FT
25.0 KIP 25.0 KIP
4 FT
31.25 KIP 31.25 KIP
4 FT
HL-93 and PHL-93Design Tandem Pair
4 FT
20.6 KIP13.7 KIP 20.6 KIP 20.6 KIP
10 FT 4 FT 4 FT
Design Truck
HL-93 Design Tandem
PHL-93 Design Tandem
ML-80Rating Truck
25 KIP 25 KIP 25 KIP 25 KIP
26 to 40 FT 4 FT
Figure 2.4-1 LRFD and ML-80 Live Loading

Chapter 2 Program Description
2-9
11 FT
27 KIP 27 KIP
4 FT 4 FT
27 KIP15 KIP
24 FT
27 KIP 27 KIP
4 FT 4 FT
27 KIP
P-82 Permit Load
4 FT
27 KIP
14 FT
32.0 KIP
14 to 30 FT
32.0 KIP8.0 KIPHS20 Truck
14 FT
32.0 KIP8.0 KIP
H20 Truck
14 FT
8.24 KIP 8.24 KIP
4 FT 4 FT
8.24 KIP8.24 KIP 8.24 KIP 20.6 KIP
4 FT
20.6 KIP
TK527 Load
4 FT 4 FT
Figure 2.4-2 P-82, HS20, H20, and TK527 Live Loading

Chapter 2 Program Description
2-10
4 FT
31.0 KIP
15 FT
24.0 KIP31.0 KIP
EV2 Emergency Vehicle
15 FT
33.5 KIP24.0 KIP
EV3 Emergency Vehicle
4 FT4 FT4 FT4 FT 4 FT 4 FT10 FT 4 FT 4 FT14 FT
SU6TV Heavy-Duty Tow and Recovery Vehicle
8 KIP5.75 KIP 25.63 KIP25.63 KIP
8 KIP8 KIP
8 KIP8 KIP
8 KIP17 KIP
17 KIP
Figure 2.4-3 EV2, EV3, and SU6TV Live Loading
14 FT 18 FT
PS2016-13 Pennsylvania Design Permit Vehicle 165 tons, 13-Axle
26 KIP18 KIP
4.5 FT 4.5 FT
VARIABLE:5 FT to 14 FT
26 KIP 26 KIP 26 KIP26 KIP 26 KIP 26 KIP26 KIP 26 KIP 26 KIP26 KIP 26 KIP
4.5 FT 4.5 FT4.5 FT 4.5 FT4.5 FT 4.5 FT
VARIABLE:30 FT to 50 FT
Figure 2.4-4 PA2016-13 Live Loading

Chapter 2 Program Description
2-11
Table 2.4-1 Live Loadings for Design
Load Case
Live Load Code for Design
A B C D E F Strength I Limit State
PHL-93
HL-93
HL-93 PHL-93, ML-
80 PHL-93, ML-80, TK527
PHL-93, ML-80, TK527
Strength II Limit State
P-82
P-82
none
P-82, ML-80 P-82, ML-80, TK527
P-82, ML-80, TK527,
PA2016-13 Service I Limit State
PHL-93
HL-93
HL-93 PHL-93,ML-
80 PHL-93, ML-80, TK527
PHL-93, ML-80, TK527
Table 2.4-2 Live Loadings for Analysis/Rating
Load Case
Live Load Code for Analysis
A
B
C
D
E
F
G
H
I Strength I Limit State
PHL-93
H20 HS20 ML-80 TK527
HL-93 H20
HS20
ML-80
none SLL TK527
none none
PHL-93
H20 HS20 ML-80 TK527
Strength IA Limit State
PHL-93
HL-93
none
none none none
none none
PHL-93
Strength II Limit State
P-82 H20
HS20 ML-80 TK527
H20
HS20
ML-80
P-82 SLL TK527
EV2 EV3
SU6TV
PA2016-13
P-82 H20
HS20 ML-80 TK527
PA2016-13 Service I Limit State
PHL-93
H20 HS20 ML-80 TK527
HL-93 H20
HS20
ML-80
P-82 SLL TK527
EV2 EV3
SU6TV
PA2016-13
PHL-93 H20
HS20 ML-80 TK527
Notes:
1. "none" denotes that the specified live load designation does not apply for the live load code.

Chapter 2 Program Description
2-12
2.5 RATINGS DEFINITION
The program computes the live loading rating factors for flexure and shear for the Strength I, Strength IA, and
Strength II limit states. The live load rating factor is the ratio of the live load reserve capacity divided by the factored
live load effect. The program computes inventory and operating ratings for the appropriate live loadings and limit
states as shown in Table 1. The inventory rating is the load that can be carried by the structure for an infinite period
of time. The operating rating is the load that may produce the absolute maximum permissible stress, and it is the
maximum load allowed on the structure. By specifying an input value, the program is able to generate ratings with
and without Future Wearing Surface loading in a single run of the program.
When a live load is not applicable, the program computes the resistance to demand ratios in lieu of the live load
rating factors. This provides a measure of performance of the culvert when only the dead loads and earth loads
are present.
Table 2.5-1 Live Loading Ratings
Live Loading
Limit States
Strength I
Strength IA
Strength II
PHL-93/HL-93
I
O
--
P-82
--
--
O
ML-80
I
--
O
HS20
I
--
O
H20
I
--
O
Special Live Load
I
--
O
TK527
I
--
O
EV2, EV3, SU6TV
--
--
O
PA2016-13
--
--
O
Notes: I=Inventory O=Operating

Chapter 2 Program Description
2-13
2.6 ASSUMPTIONS AND LIMITATIONS
The following assumptions are made by BXLRFD for the analysis or design of box culverts:
1. A one ft (one m) length of culvert is considered for analysis and design.
2. The concrete modulus of elasticity Ec, is computed by the following formula:
)(')(033.0 5.1 ksifwE ccc = wc = Density of Concrete
3. The modulus of elasticity of reinforcement, Es, is assumed to be 29,000 ksi.
4. When the top slab is at grade, a 0.5 inch thickness for integral wearing surface is included in the total slab
thickness. This integral wearing surface is considered in calculating the culvert self weight, but is ignored
for calculating the strength of the slab. It is however considered in the determination of section stiffness
properties. Applicable to box culverts only.
5. For all culverts and U-channels, the bottom slab total thickness includes a 0.5 in thickness for scouring
effects. This thickness is considered in the culvert self weight, but is ignored for calculating the strength of
the slab. The thickness is however considered in the determination of section stiffness properties.
6. For cast-in-place culverts and U-channels, the bottom slab total thickness includes a 1.0 in thickness for
foundation unevenness. The thickness is considered in the culvert self weight, but is ignored for calculating
the strength of the slab. It is, however, considered in the determination of section stiffness properties.
7. For design, member thicknesses are increased using 0.5 inch increments.
8. For design, reinforcement spacing is determined using 0.5 inch increments.
9. For two cell culverts with fish channels, the minimum thickness of the bottom slab with a fish channel is
equal to the thickness of the bottom slab without a fish channel.
10. All bar covers are clear distances, measured from the outside concrete face (or assumed structural face)
to the face of the bar.
11. When checking the crack control criteria (LRFD 5.7.3.4), the program limits the clear cover to 2 inches.
The clear cover is the distance from the extreme tension face to the face of bar or wire. The scour,

Chapter 2 Program Description
2-14
foundation unevenness and wearing surface thicknesses are considered sacrificial, and therefore, are
ignored.
12. Haunch thickness is considered for calculation of section stiffness properties. Haunches are not considered
for strength calculations and the haunch self weight is ignored in the dead load calculations.
13. Slab thickness variations in the top slab due to grade and in the bottom slab with a fish channel are
considered for stiffness calculations and member flexure and shear design.
14. For variable thickness slabs, the reinforcement is considered to be at a constant distance from the face of
the member.
15. The maximum size (diameter) of aggregate is 1 inch. This data item is used to calculate minimum rebar
spacing per LRFD5.10.3.1.1 (CIP) and LRFD5.10.3.1.2 (PC).
16. If a future wearing surface is not specified, a default load of 30 lbs/ft2 is placed on the culvert for design.
This default wearing surface is not placed on the culvert for rating. If a future wearing surface is specified,
it is used for both design and rating.
17. For the calculation of Fe, the structure type is CULVERT and the backfill condition is COMPACTED
(LRFD12.11.2.1). The structure type is CULVERT for φ in flexure and shear (LRFD12.5.5), and is RC for φ
in axial compression (LRFD5.5.4.2).
18. The concrete type is NORMAL DENSITY for the calculation of modulus of rupture, Fr, (D5.4.2.6).
19. The value of beta, the factor indicating the ability of diagonally cracked concrete to transmit tension
(LRFD5.8.3.4.1) is 2.0.
20. The value of theta, the angle of inclination of diagonally compressive stresses (LRFD5.8.3.4.1), is 45.0
degrees.
21. Shear reinforcement is not considered for U-channels.
22. Approach slab loads are only applied at the top of the centerline of the exterior walls.
23. The live load vehicle effects are not calculated for approach slabs by the program. The user must calculated
the live load from the approach slab to be applied to the culvert.
24. For Frame Culverts the minimum footing toe and heel projection is 1 foot.

Chapter 2 Program Description
2-15
25. The program does not consider Fatigue when designing or analyzing culverts or frames.
26. The BXLRFD program does not automatically design or analyze an edge beam, if one is required per DM-
4 Section 12.11.2.1. See User Manual Section 3.11 and Elat, Section 6.6.6.

Chapter 2 Program Description
2-16
This page is intentionally left blank.

3-1
3. METHOD OF SOLUTION
The primary purpose of this program is to design or analyze and rate a single or two cell reinforced concrete box or
frame culverts and U-channels following the LRFD specifications and DM-4. This chapter provides detailed
information regarding the method of solution used in the program.
In the design and rating of reinforced concrete box culverts and U-channels, the following steps are generally
required:
1. Generate structural model using geometry
2. Determine loads and calculate load effects
3. Determine combined load effects
4. Determine member thickness
5. Calculate section resistance
6. Calculate reinforcement
7. Check resistance against load effects
8. Adjust section for adequate shear resistance
9. Calculate ratings
10. Calculate foundation pressure
The program performs the above calculations using the direct stiffness method of structural analysis and following
the specifications provided in the LRFD and DM-4. For this program, two types of runs can be made: Analysis
(Rating) and Design. For Analysis, all member thicknesses and reinforcements are known and the program
performs all calculations mentioned above except Steps 4, 6 and 8. For Design, the program performs all
calculations mentioned above except Step 9.
The following sections describe the above calculations in detail. Refer to any standard textbook on structural
analysis and the appropriate sections of this manual for calculations performed in Steps 1 and 2. Refer to the LRFD
Specifications and DM-4 for calculations performed in Steps 3, 5, and 6. Refer to appropriate sections of this
manual for calculations performed in Steps 4, 5, 6, 7, 8 and 9.

Chapter 3 Method of Solution
3-2
3.1 NOTATION
The following notations are used in this chapter:
Ab = area of individual bar
Ag = gross area of a cross section
As = flexure reinforcement per unit length of culvert for a face of a cross section
As,min2 = minimum allowed reinforcement for flexure
As,min1 = minimum allowed reinforcement for temperature and shrinkage
As,min = minimum allowed reinforcement
Av = required area of shear steel per unit length
At = area of concrete having the same centroid as the principle tensile reinforcement and bounded by the
surfaces of the cross-section and a straight line parallel to the neutral axis, divided by the number of
bars or wire.
b = unit width of culvert section resisting M, N, V, (1 ft)
B = width of the footing
Bc = contact width of the footing
botc = clear cover for bottom/right face reinforcement
bv = effective web width for shear
c = distance from extreme compression fiber to the neutral axis
db = nominal diameter of reinforcement bar and wire
dc = thickness of concrete cover measured from extreme tension fiber to center of bar or wire
DC = dead load of structural and non-structural components
DC0 = dead load of components for bottom slab only effects
DC1 = dead load of components for stage 1 of a cast-in-place culvert
DC2 = dead load of components for stage 2 of a cast-in-place culvert
de = effective depth from extreme compression fiber to the centroid of the tensile force in the tensile
reinforcement
DE = minimum depth of earth cover
dneg = effective depth from extreme compression fiber to the centroid of the tensile force in the tensile
reinforcement for negative moment
dpos = effective depth from extreme compression fiber to the centroid of the tensile force in the tensile
reinforcement for positive moment
dv = effective shear depth
dw = width of lane loading assumed to be equal to 10.0 ft.
DW = dead load of wearing surface and utilities
e = eccentricity of the load resultant, N, relative to the centerline of the footing
E = earth loadings
Ec = modulus of elasticity of concrete
EH = horizontal earth pressure load
Elat = equivalent strip width for lateral distribution, LRFD 4.6.2.1.3 or 4.6.2.3

Chapter 3 Method of Solution
3-3
EV = vertical pressure from dead load of earth fill
f’c = minimum specified compressive strength of concrete at 28 days
Fe = soil-structure interaction factor for embankment installation
fr = modulus of rupture of concrete
fs = service stress in the reinforcement
fss = tensile strength in rebar for crack control calculation
fsa = allowable service stress in reinforcement
fu = ultimate tensile strength of reinforcement bars
fy = specified minimum yield strength of reinforcement bars
Hend = height of fill at the end of the culvert
Hfill = height of fill at left edge of the culvert
HEV = height of fill for EV loading
HLs = height of live load surcharge
I = effect due to dynamic load allowance
IM = vehicle Dynamic Load Allowance
IR = inventory rating factor
LLIM = live load + dynamic load allowance effect
L1 = modified span length
LS = live load surcharge load
= length used in computing tire contact area
Mb = nominal flexure resistance in pure bending
Mcr = cracking moment
MDL = dead load moment
Mnb = nominal flexure capacity at balanced strain condition
Mo = moment of all footing external loadings about point of interest
MPF = multiple presence factor
Mr = factored flexural resistance of a section in bending
MRF = moment rating factor
MT = total (dead + live) moment
Mu = factored moment at a section
N = footing vertical force resultant
OR = operating rating factor
OV = overlay loading
Paxle,max = maximum axle load
Pb = nominal axial resistance at balanced strain condition
PDL = dead load axial force
Po,ten = nominal axial resistance in pure tension
Po,comp = nominal axial resistance in pure compression
POI = points-of-interest or analysis point
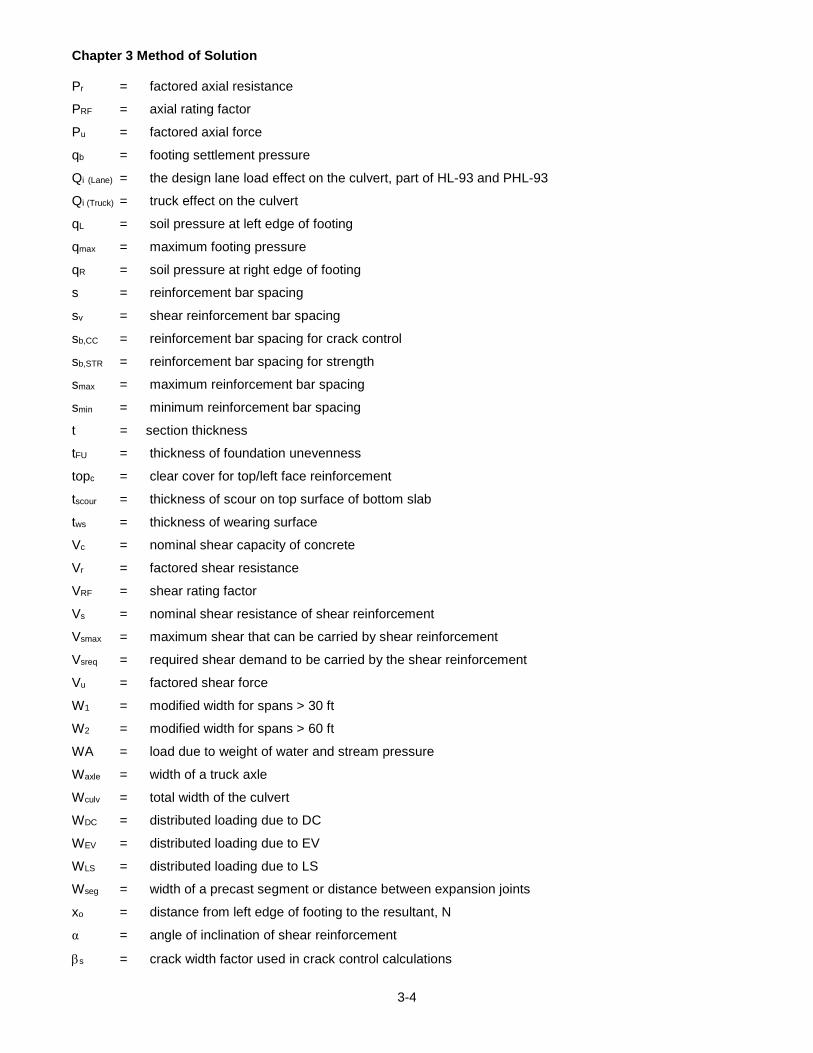
Chapter 3 Method of Solution
3-4
Pr = factored axial resistance
PRF = axial rating factor
Pu = factored axial force
qb = footing settlement pressure
Qi (Lane) = the design lane load effect on the culvert, part of HL-93 and PHL-93
Qi (Truck) = truck effect on the culvert
qL = soil pressure at left edge of footing
qmax = maximum footing pressure
qR = soil pressure at right edge of footing
s = reinforcement bar spacing
sv = shear reinforcement bar spacing
sb,CC = reinforcement bar spacing for crack control
sb,STR = reinforcement bar spacing for strength
smax = maximum reinforcement bar spacing
smin = minimum reinforcement bar spacing
t = section thickness
tFU = thickness of foundation unevenness
topc = clear cover for top/left face reinforcement
tscour = thickness of scour on top surface of bottom slab
tws = thickness of wearing surface
Vc = nominal shear capacity of concrete
Vr = factored shear resistance
VRF = shear rating factor
Vs = nominal shear resistance of shear reinforcement
Vsmax = maximum shear that can be carried by shear reinforcement
Vsreq = required shear demand to be carried by the shear reinforcement
Vu = factored shear force
W1 = modified width for spans > 30 ft
W2 = modified width for spans > 60 ft
WA = load due to weight of water and stream pressure
Waxle = width of a truck axle
Wculv = total width of the culvert
WDC = distributed loading due to DC
WEV = distributed loading due to EV
WLS = distributed loading due to LS
Wseg = width of a precast segment or distance between expansion joints
xo = distance from left edge of footing to the resultant, N
α = angle of inclination of shear reinforcement
βs = crack width factor used in crack control calculations

Chapter 3 Method of Solution
3-5
θ = angle of inclination of diagonal compressive stresses
ρ soil = density of soil
ρ c = density of concrete
γe = exposure factor used in crack control calculations
γ eq = equivalent fluid density
γ EV = load factor for EV loading
γ EH = load factor for EH loading
γ i = load factor as per DM4 η = general load factor φ = resistance factor
φ v = resistance factor for shear
ρ min = minimum allowed reinforcement ratio
ρ b = reinforcement ratio at balanced strain condition
β1 = ratio of the depth of the equivalent uniformly stressed compression zone assumed in the strength limit
state to the depth of the actual compression zone, i.e., Whitney stress block factor

Chapter 3 Method of Solution
3-6
3.2 GEOMETRY/STRUCTURAL MODEL
The type of structure, structure geometry and other dimensions are entered by the user. These input values are
used to generate the structural model and the loads acting on a culvert or U-channel. The type of structure, precast,
or cast-in-place, is used to determine the loading conditions for which the structure is to be analyzed. Structure
geometry, clear span and clear height of the culvert, or height of walls for a U-channel, and member thicknesses
are used to generate the geometric properties of the structural model. The presence or absence of haunches (fillets
at the interior corners of the cell) or fish channel is used to calculate additional analysis points and the stiffness of
slabs and walls. The presence or absence of the bottom slab is used to determine whether a culvert is a box culvert
or a frame culvert (no bottom slab). The top slab support (monolithic or simply supported) is used to generate the
correct type of structural model, i.e., whether there is a transfer of moment between the top of the wall and the top
slab. The grade of the top slab is used to determine the stiffness of the non-prismatic top slab.
Based on the information provided by the user, the program generates a plane frame structural model. For this, the
program finds the centerlines of each wall and the top and bottom slabs. These centerlines and their intersections
form a plane frame structural model as shown in Figure 1. The bottom slab centerline is always taken as a horizontal
line (even for a fish channel). The wall centerlines are always taken as a vertical line. Thus, the wall centerlines
and the bottom slab centerline are always perpendicular to each other. The bottom slab centerline is assumed to
pass through the centroid of the cross section at the lowest point of the fish channel, and is assumed to pass through
the centroid of the bottom slab without a fish channel. The top slab centerline may be horizontal or sloping
depending on whether the top surface of the top slab is level or has a grade. The plane frame is assumed to be
supported as shown in Figure 1. A roller support is assumed at the bottom of the interior wall centerline and at the
bottom of the right wall centerline. A pinned support is assumed at the bottom left corner of the frame. If the top
slab is simply supported, a pinned end is also assumed at the top of each wall clear height as shown Figure 2. For
a cast in place frame culvert (culvert without a bottom slab) a fixed support is assumed at the bottom of each wall
and a roller support is assumed at the top left corner as shown in Figure 1. For a precast frame culvert (culvert
without a bottom slab) a pinned support is assumed at the bottom of each wall and a roller support is assumed at
the top left corner as shown in Figure1. For a U-channel a fixed support is located at the bottom of Wall 1 with a
roller support located under Wall 2 as shown in Figure 1.

Chapter 3 Method of Solution
3-7
3.2.1 Analysis Points
Once the basic plane frame model as explained above is generated, the program establishes the analysis
points or the points-of-interest (POI's). These POI's are located at the tenth points of clear span of each
top slab and each bottom slab and the tenth points of the clear wall height. Also, a POI is defined at the
beginning of each haunch, and at an abrupt change in the section in the bottom slab with a fish channel.
Each POI is classified as a moment only (M) POI or a Shear and Moment (V/M) POI. The first POI which
is to be classified as a shear and moment (V/M) POI depends on whether the member is prismatic or non-
prismatic. If the member has haunches, the first moment POI is located at the end of the haunch. For a
prismatic member, the first V/M POI does not start until the effective depth of the member. For a non-
prismatic member, the first V/M POI does not start until the one-half the effective depth of the member.
Refer to Figures 1, 2, 3 and 4 for POI's and their classifications. For a precast frame culvert, the POIs at
the bottom of each wall at the pinned connections are classified as V/M POI’s.
The specification checks are performed at these POI's according to their classification, i.e., flexural checks
are done at all M and V/M POI's, but shear checks are performed only at V/M POI's. The shear and moment
check locations are in conformance with the provisions of LRFD 5.13.3.6.1 and 12.11.4.2.
3.2.2 Cross Sections
To perform a structural analysis, the program must determine the stiffness of members. A joint (node) is
assumed at each POI and at the intersections of slab and wall centerlines. A member (element) is assumed
between the two adjacent joints, and member properties (cross sectional area and moment of inertia) are
calculated. For section design member property calculations, it is assumed that the member (element) has
a constant cross section which is the average thickness of the two cross sections at the ends of each
member. The plane frame model showing joints, average cross sections, and sections considered for
special cases (fish channel and haunches) are shown in Figures 1 and 2.

Chapter 3 Method of Solution
3-8
Single Cell Box Culvert
Twin Cell Box Culvert
Twin Cell Cast-In-Place Frame
Note: Structural models shown are with member centerlines
U-channel
Twin Cell Precast Frame
Figure 3.2-1 Structural Model Boundary Conditions

Chapter 3 Method of Solution
3-9
Pinned End in Wall
Pinned End in Wall
Pinned End in Wall
Figure 3.2-2 Structural Model for Simply Supported Top Slab
Figure 3.2.1-1 Typical Points-Of-Interest (POI’s)
dneg
dneg dneg
dneg
½dneg½dneg
dneg
½dnegdneg
dneg dneg
dneg
dneg
End and 10 th point Nodes
Special Points: at haunches, distance-d and ½ distance-d (non-prismatic members only)
Note: For a Design, distance-d's are computed using the maximum barsize or diameter.

Chapter 3 Method of Solution
3-10
Figure 3.2.1-2 POI Classifications for Members Without Haunches
dneg
dneg dneg
dneg
Flexure Range
Shear Range
M M V/M V/M V/M V/M V/M V/M V/M M M
dneg
dneg
½dneg ½dneg
Flexure Range
Shear Range
MM
V/M V/M V/M V/M V/M V/M V/M
M - Consider the POI for Moment only
V/M - Consider the POI for Shear and Moment
Face ofWall
Face ofWall
10th POI
Special POI
V/MV/M

Chapter 3 Method of Solution
3-11
M M MMV/M V/M V/M
Flexure RangeShearRange
dneg dneg
dnegdneg
dneg
dneg
MM
V/M V/M V/M V/M V/M
Flexure Range
Shear Range½dneg ½dneg
M - Consider the POI for Moment only
V/M - Consider the POI for Shear and Moment
Horizontal
Sloped
Faceof Wall
10th POI
Special POI
Faceof Wall
Figure 3.2.1-3 POI Classifications for Members With Haunches

Chapter 3 Method of Solution
3-12
Figure 3.2.1-4 POI Classifications for Bottom Slab Members with a Fish Channel
½dneg
dneg
dneg
½dneg
Flexure Range
Shear Range45º
M M MV/M V/MV/MV/MV/M
½dneg ½dneg
Flexure Range
Shear Range
M M MV/M V/MV/MV/MV/M
dneg dneg
V/M V/M M
M - Consider the POI For Moment Only
V/M - Consider the POI For Shear and Moment
Standard Fish Channel
Non-Standard Fish Channel
Faceof
Wall
10th POI
Special POI
V/M
Faceof
Wall

Chapter 3 Method of Solution
3-13
Node Points
Plane Frame Elements
Cross Sections
Roller Boundary Condition
Pinned Boundary Condition
Y
X
Figure 3.2.2-1 Basic Finite Element Model

Chapter 3 Method of Solution
3-14
Fish Channel With 45ºSloped End Segment
Cross Sections
Figure 3.2.2-2 Cross Sections for A Fish Channel

Chapter 3 Method of Solution
3-15
3.3 LOADS AND STRUCTURAL ANALYSIS
Once the Plane Frame Model described in Section 3.2 is generated, the program considers different loading
conditions and solves for moments, shears and axial forces at analysis points. The program uses the direct stiffness
method to solve for load effects for each loading condition described below. For the direct stiffness method, refer
to any standard text book on structural analysis. The program calculates moments, shears and axial forces at all
analysis points for the following loading conditions. Tables 1 and 2 list the applicable loads for each structure type
in the program.
Table 3.3-1 Box Culvert Applied Loads
Load
Description
DC
Loading due to self weight of structural components
DW
Loading due to wearing surface
EV
Loading due to vertically applied earth pressure
OV Loading due to vertically applied overlay material EH
Loading due to horizontally applied earth pressure
LS
Loading due to live load earth surcharge
LLIM Loading due to Live Load with Dynamic Load Allowance WA
Pressure due to water weight (Used for Foundation Pressure Only)
AD & AL
Loading due to Approach Slab ( Dead and Live Load)
Table 3.3-2 U-channel Applied Loads
Load
Description
DC
Loading due to self weight of structural components
EH
Loading due to horizontally applied earth pressure
LS
Loading due to live load earth surcharge
WA
Pressure due to water weight (Used for Foundation Pressure Only)

Chapter 3 Method of Solution
3-16
3.3.1 Dead Load DC
DC is the self weight of structural components (walls and slabs). In Figures 1 and 2, R1, R2 and R3 are
reaction forces, W1, W2 and W3 are the weights of the walls, and qb and qe are beginning and ending
pressures. The weight of a fish channel is approximated as a uniform load and is only included in the dead
load calculation of the foundation pressure applied to the bottom slab. The foundation pressure due to the
fish channel for a twin cell culvert is distributed to all three walls using the pressure equations in section
3.10. For a one cell culvert or u-channel it is evenly distributed between the two walls.
3.3.1.1 Precast Culverts
DC loadings for a precast culvert are shown in the lower portions of Figures 1 and 2. A reaction loading
acting on the bottom slab is calculated considering vertically distributed loads applied to the walls and the
top slab as shown in Figures 1 and 2.
3.3.1.2 Cast In Place Culverts
The DC loading is separated into DC1 and DC2 loadings for cast-in-place culverts because a cast-in-place
culvert is constructed in stages. The upper portions of Figures 1 and 2 show DC loadings for cast in place
culverts. DC1 is the weight of uncured top slab and walls acting on the cured bottom slab which is assumed
to act as an infinitely stiff beam resting on an unyielding foundation. The DC1 effects are stored for the
bottom slab. The weight of the top slab acts on the plane frame when concrete in the top slab and walls
has cured, and the forms are removed. To simulate the effect of removing the forms (DC2), the point loads
acting on the bottom slab for the DC1 loading are applied in the opposite direction to keep the system in
equilibrium with the weight of the top slab applied as shown in Figures 1 and 2. The effects of DC1 and
DC2 are added to get the DC effects. The bottom slab for a cast-in-place culvert is checked for both the
DC1 and DC loadings.
3.3.2 Dead Load DCB
DCB is a uniform dead load due to a traffic barrier placed atop the culvert. Figure 1 shows the application
of the DCB loading for cast-in-place and precast culverts. In this figure, w is the uniformly distributed barrier
dead load applied to the top slab and it is assumed to produce a uniformly applied reaction loading on the
bottom slab.
3.3.3 Dead Load DW
DW is the dead load due to wearing surface and overlay. Figure 1 shows the DW loading for both precast
and cast-in-place culverts. In this figure, w is the uniformly distributed wearing surface loading. A uniformly

Chapter 3 Method of Solution
3-17
distributed loading is applied to the top slab and it is assumed to produce a uniformly applied reaction
loading on the bottom slab.
3.3.4 Dead Load EV
EV is the vertically applied weight of earth acting on the culvert. Figure 1 shows the EV loading which is
applied to both the cast-in-place and precast culverts. In this figure, HB and HE are the heights of fill at the
beginning and end of the culvert, and wB and w E are the beginning and ending values of the trapezoidal
loading due to HB and HE. A trapezoidal loading due to weight of fill is applied to the top slab and an equal
and opposite reaction loading is applied to the bottom slab. The magnitude of intensity of trapezoidal
loading is determined by calculating the height of fill above the centerline of the external walls. The weight
of fill beyond the centerlines of exterior walls is neglected; however, this load is further adjusted by the soil-
structure interaction coefficient, Fe, based on an assumed embankment construction. For culverts with strip
footings during the Construction Limit State, the program applies an EV force by setting the fill height to
zero for the Construction Limit State. This force is applied to the exterior projection of the strip footing.

Chapter 3 Method of Solution
3-18
P
R1 R2
Q1 = R1 + W1 Q2 = R2 + W2
W1 W2
Neglected
qb qe
Loading DC1Cast-in-place
qb qe
Loading DC2Cast-in-placeR1 R2
q1 q1
q2 q2
Weightof Wall
Weightof Wall
Weight of top slab
Loading DCPrecast Culvert
weight of haunchesis neglected
q2 = soil reactiondue to q1 andweight of walls(weight of bottomslab not included)
Figure 3.3.1-1 Loadings - Weight of Structure for One-Cell Culverts

Chapter 3 Method of Solution
3-19
P
R1 R2
Q1 = R1 + W1 Q2 = R2 + W2
W1 W2
Neglected
qb qe
Loading DC1Cast-in-place
qb qe
Loading DC2Cast-in-place
R1 R2
q1 q1
q2 q2
Weightof Wall
Weightof Wall
Weight of top slab
Loading DCPrecast Culvert
weight of haunchesis neglected
q2 = soil reactiondue to q1 andweight of walls(weight of bottomslab not included)
R3
Q3 = R3 + W3
W3
R3
Figure 3.3.1-2 DC Loadings - Weight for Two-Cell Culverts

Chapter 3 Method of Solution
3-20
q1 q2
Weightof Wall
Weightof Wall
Soil Pressure Due to DC Wall Loads
weight of haunchesis neglected
q2 = soil reaction due to q1 and weight of walls (weight of bottom slab not included)
Figure 3.3.1-3 DC Loadings - Weight for U-channels
w
w
Reaction Loading
Figure 3.3.2-1 DCB Loading (Barrier Dead Load)

Chapter 3 Method of Solution
3-21
w
w
Reaction Loading
Figure 3.3.3-1 DW Loading
wE
Reaction Loading
wB
wEwB
Soil Slope
Top Slab SlopeHB
HE
Figure 3.3.4-1 EV Loading (Earth Vertical)

Chapter 3 Method of Solution
3-22
3.3.5 Earth Horizontal EH
EH is the loading due to earth pressure acting on the exterior walls. Figure 1 shows the EH loading which
is applied to both the cast-in-place and precast culverts and U-channels. The intensity of earth pressure is
the function of the height of fill and equivalent fluid density, γeq. The program uses the minimum and
maximum values of the equivalent fluid density, from user input entered on the LDC command, in
combinations with the minimum and maximum load factors for EH (see Table 3.4-3) to produce the extreme
force effects.. For a culvert under sloping fill, a top slab at grade or a U-channel of unequal wall heights
the exterior walls of culvert may be subjected to different horizontal earth pressures. For this case the
pressure on the wall having the lower earth pressure is adjusted by applying an additional pressure to keep
the culvert in equilibrium. The calculation of this pressure is shown in Figure 1. In this figure, qb1 and q e1
are the beginning and ending lateral pressures on the left side (with associated resultant, P1, and
eccentricity, h1), qb2 and q e2 are the beginning and ending lateral pressures on the right side (with associated
resultant, P2 and eccentricity, h2), and qb3 and qe3 are computed lateral pressures to keep the structure in
equilibrium. For the Construction Limit State the program temporarily sets the height of fill equal to zero.
Figure 3.3.5-1 EH - Horizontal Earth Loading
Fill
qe2
qb2qb1qb3
qe1qe3
P3P1
h3 h1
PassivePressure
P1, h1, P2 & h2 are calculated from qb1, qe1, qb2 & qe2
P3 and h3 are calculated using: P1h1 - P2h2 + P3h3 = 0
P1 - P2 + P3 = 0
P2
h2

Chapter 3 Method of Solution
3-23
3.3.6 Live Load Surcharge LS
LS is the loading due to live load surcharge. If the live load is applicable a horizontal pressure equal to an
equivalent height of fill is applied to the exterior walls. The distributed load is uniform and its magnitude is
a function of Live Load Surcharge Height specified in the input and the equivalent fluid density, γeq. Figure
1 shows the LS loading which is applied to both precast and cast-in-place culverts and U-channels. For a
culvert under sloping fill, a top slab at grade or a U-channel with unequal wall heights the difference in
horizontal pressure is adjusted in the same manner as explained under the EH loading.
SurchargeHeight
q q
q = Surcharge Height x Equivalent Fluid Pressure
Figure 3.3.6-1 LS Loading (Live Load Surcharge)
3.3.7 Approach Slab Loads
The approach slab load consists of a dead and live load component which both act on the exterior walls of
a culvert. Figure 1 shows the application of approach slab loading for cast-in-place and precast culverts. In
this figure AD1 ,AL1, AD2 and AL2 are concentrated loads that are applied at the top slab of the culvert at
the centerline of each exterior wall and is assumed to produce a uniformly applied reaction loading on the
bottom slab. All approach slab loads should be calculated based on the 1 foot design section width of the
culvert. The approach slab loads are only applicable when the culvert is at grade. The program does not
determine the live load vehicle position for the culvert with any consideration for the effects on approach
slabs. The AL is a user determined live load reaction.

Chapter 3 Method of Solution
3-24
w
Reaction Loading
AL1
AL2AD1
AD2
Figure 3.3.7-1 Approach Slab Loading
3.3.8 Loading for Influence Lines
To obtain the live load effects the program uses influence lines. These influence lines for various effects
at analysis points are generated by placing a unit vertical load at each analysis point, one at a time and
calculating its effects at other analysis points. For a typical loading a unit vertical load is applied at the
analysis point on the top slab and a reaction loading on the bottom slab is calculated. The reaction loading
is computed differently for a single cell culvert or U-channel versus a two cell culvert. The reaction for the
single cell structure is based on the assumption that the structure is rigid. The reaction force intensities for
the two cell culvert are based on load intensities that produce appropriate reactions at the centerlines of
walls. The wall centerline reaction is a function of the location of the unit load on the top slab. The
distributed load reactions are computed as follows:

Chapter 3 Method of Solution
3-25
L
eP = 1
LL
eP = 1
WB WE
Qa Qb Qc
Ra Rb RcReaction Loading
L/2
Figure 3.3.8-1 Loadings for Influence Lines
The equations for Ra, Rb and Rc are based on a derivation of the “Continuous Beam – Two Equal Spans
Concentrated Load At Any Point” equations for reactions in the “Beam Diagrams and Formulas” Section of
the AISC steel manual.
3.3.9 Live Loading
The effect of a live loading at a given POI is calculated by loading the influence line for that effect at a POI
under consideration. The truck is marched over the influence line and the maximum load effect is obtained.
This effect is referred to as "On Deck" effect. If the culvert is under fill the axle loads are replaced by patch
loads and these patch loads are marched across the influence line to get the effect referred to as "Thru Fill"
effect.
The program calculates the moments, shears and axial forces due to live loadings at appropriate POI's as
defined earlier. The live loadings used for design are: PHL-93, HL-93, P-82, and PA2016-13. The live
loadings used for analysis (rating) are: PHL-93, HL-93, and P-82, PA2016-13, ML-80, TK527, EV2, EV3,
SU6TV, PA2013-13, HS20, H20, and SLL. Live loadings are shown in Figures 2.4-1, 2.4-2, 2.4-3, and 2.4-
4.
12L
2LPe
+ LP = W
12L
2LPe
- LP = W
3E
3B
Q
Q
R
R
R
) e ( = R
L/6)/(L/3) Q - R ( = L/6)/(L/3) Q - R ( =
)/L R - R - R (2 = Q
P/4 ) R - R 3 + (-2R = P/4 ) R 2 + R 6 - (4 = P/4 ) R - R 3 + (2R =
L
b c c
b a a
c a b b
3 2 c
3 2 b
3 2 a

Chapter 3 Method of Solution
3-26
BXLRFD first determines if the live load should be considered. It applies the provisions of A3.6.1.2.6 as
follows. If the user has entered the number of design lanes equal to zero, the program does not calculate
the live load effect. Otherwise, if the height of fill is greater than 8 ft. and is greater than the center to center
distance of the exterior walls, the program does not calculate the live load effects. Also, if the height of fill
is greater than or equal to 2 ft. and if the live load is applicable by the above definition, the program also
considers the "Thru Fill" effect.
If the top slab is at grade or under less than 2.0 ft. of fill, then the culvert is analyzed as if the Live Load
applied directly on the deck. However, if the culvert is under 2.0 ft. of fill or greater, and if the Live Load is
applicable according to A3.6.1.2.6, the culvert is analyzed for both conditions as if the live load is applied
directly on the deck, and the live load is applied through the fill. The lesser of the two effects is considered
as per A3.6.1.2.6.
The program also has a Live Load Override feature which may be selected to design or analyze culvert
with live load regardless of fill height. This feature allows for program compliance with D12.11.4.9P See
Section 6.10.18 for more information on this feature.
3.3.10 HL-93 Loading and PHL-93 Loading
For this program, the vehicular live loading consisting of the Design Truck, Design Tandem, and Design
Lane Load, as defined in the LRFD Specifications, is referred to as the HL-93 loading. For the design of
its structures, PennDOT has modified the HL-93 loading, and it is called the PHL-93 loading. Refer to
Figures 2.4-1 and 2.4-2 for a summary of the live loads stored in the program. The PHL-93 loading is the
same as the HL-93 loading except that the axle loads on the Design Tandem for the PHL-93 loading are
multiplied by a factor of 1.25. In addition, for negative moment between points of dead load contraflexure
and for axial force at the interior walls only, PHL-93 includes the effect of two design tandems separated
by a variable spacing of 26.0 to 40.0 ft which is combined with the lane load at 100%. The 1.25 factor is
not applied to the design tandem pair for the PHL-93 loading. H20 and HS20 loadings are as defined in the
current AASHTO Standard Specifications for Highway Bridges.
3.3.11 Variable Axle Spacing of Design Truck
BXLRFD also loads influence lines with live load vehicles having a variable axle spacing. For example, the
second and third axles of the HS-20 vehicle have a variable spacing from 14 to 30 ft.
3.3.12 Variable Spacing of Design Tandem Pair
In accordance with D3.6.1.3.1, two Design Tandems are used to calculate the live load effects at POI’s
placed between the points of dead load contraflexure. The maximum effects are calculated for the top and

Chapter 3 Method of Solution
3-27
bottom slabs and the interior wall. The optimum effect can be obtained by varying spacing between the
design Tandems from 26.0 to 40.0 feet. Note that the pair of Design Trucks is not considered for culverts
as the minimum distance between the two Design Trucks is to be kept at 50 feet which is on the upper limit
of a total width for a twin cell culvert.
3.3.13 Truck Load Effect
For the On Deck loading, the effect is obtained by stepping point loads, representing the live load axles of
a vehicle, over the axial, shear, and moment influence lines. For Thru Fill, the live load vehicle axle loads
are distributed through the Fill, resulting in a series of patch loadings. The patch loadings are then stepped
over the influence lines generating the vehicle live load effect.
The On Deck effect is calculated using the LRFD concept of notional loading. Notional loading stipulates
that when an effect is being optimized (i.e., maximized or minimized), if a particular axle decreases the
effect, then that axle should be ignored. In essence, different live load configurations from a single live load
can be used to optimize different effects. All live load vehicles are considered notional vehicles. The special
live load, specified by using the SLL and SAL commands, may be either notional or non-notional. In
calculating the concurrent action, the truck configuration used is the same as the one used to maximize the
primary action.
The Thru Fill effect is non-notional: all axles are used to optimize each effect. The Thru Fill effect is obtained
by distributing the vehicle axle loads through the fill, resulting in a series of patch loadings. These patch
loadings are then stepped over the influence lines. Figure 5 illustrates the distribution of axle loads through
a fill into two patch loads, which are then stepped over influence lines. The figure shows that a tire footprint
and axle load are at the top of the fill, which get distributed through the fill to the top of the culvert as a patch
load. It also shows that Axles 1 and 2 are close enough together for this fill height that they form a single
patch.
The tire footprint, , is set for all design trucks, except for the user entered Special Live Load truck, according
to D3.6.1.2.5. For the Special Live Load truck the values are calculated based on the max axle weight and
dynamic load allowance using equations in DC3.6.1.2.5. The live load factor, γ, is set at a constant value
for all limit states at 1.35 for this calculation.
Figure 1 illustrates notional loading. In this figure, a three-axle truck is used to load an influence line for a
particular location. In the top part of the figure, just the front two axles are considered since the third axle
is over a negative portion of the influence line and therefore would decrease the effect. Similarly, the truck
is in a different location in the bottom part of the figure and only the third axle is considered since the first
two axles are over a negative portion.

Chapter 3 Method of Solution
3-28
BXLRFD implements notional loading by separating influence lines into positive and negative portions, and
loading them in a normal fashion. Figure 2 shows a shear influence line separated into just its positive
components. Once this modified influence line has been generated from the original version and all
negative effects have been eliminated, stepping a truck over it will result in only positive or zero
contributions.
Figure 3.3.12-1 Notional Truck Concept Showing Axles That Do Not Contribute To The Effect

Chapter 3 Method of Solution
3-29
Influence Lines
Shear Influence Line
Positive Portion of Shear Influence
0.50
0.10
-0.30
-0.70
0.60
0.40
0.20
0.00
Figure 3.3.12-2 Separating Influence Lines Into Positive and Negative Parts
Chapter 3 Method of Solution
3-30
Forward Direction
Response - First part of truck15000
10000
5000
0
15000
10000
5000
0
15000
10000
5000
0
Response - Second part of truck
2nd part - under variable constraints
Figure 3.3.12-3 Combination of Effects For a Variable Axle Notional Truck

Chapter 3 Method of Solution
3-31
2000
0
4000
6000
8000
10000
12000
14000
16000
Variable Truck Response - Forward - Shear
Figure 3.3.12-4 Total Effect For A Variable Axle Notional Truck
Distribution of AxleLoad Through Fill
Influence Lines
P3 P2 P1 Tire Footprint
Hfill
L2 L1
Patch LoadU1= (P1 + P2)/L1
Patch LoadU2 = (P3)/L2
Figure 3.3.12-5 Loading Influence Lines for the Through Fill Effect

Chapter 3 Method of Solution
3-32
In addition to the notional loading of influence lines, BXLRFD also loads influence lines with live load
vehicles having a variable axle spacing. For example, the second and third axles of the HS-20 vehicle have
a variable spacing from 14 to 30 ft. BXLRFD determines the response of a variable axle, notional truck by
separating the influence line into positive and negative portions, and separating the vehicle into two fixed
axle vehicles. The response of the second vehicle has constraints applied to it to account for the variable
axle spacing. Figure 3 shows a truck with variable spacing between Axles 2 and 3 separated into two fixed
axle trucks, with the effect of each fixed axle truck. The bottom of the figure shows the effect of the second
fixed axle truck with the variable axle constraints applied to it. Figure 4 shows the total effect for the variable
axle truck (notional), obtained by adding the effect of the first fixed axle truck to the effect of the constrained
second fixed axle truck. BXLRFD determines the effect of a variable axle, notional truck by separating the
influence line into positive and negative portions, and separating the vehicle into two fixed axle vehicles.
The effect of the second vehicle has constraints applied to it to account for the variable axle spacing.
The Thru Fill effect for variably spaced axle vehicles are obtained by creating a series of fixed axle trucks
with axle spacings increased by 1 ft. Each of these fixed axle trucks have their axle loads distributed
through the fill to obtain patch lengths and intensities, which are subsequently stepped over the influence
lines. The maximum effect among all the generated fixed axle trucks is used for the final effect of the
variable axle truck loading. Figure 5 shows how patch lengths (L1 and L2) and intensities are calculated.
In this figure, P1, P2 and P3 are the truck axle loads, and U1 and U2 are the patch load intensities.
3.3.14 Lane Load Effect
In calculating the HL-93 or PHL-93 effect, the program also considers the effect of a Design Lane Load.
This is a uniform lane load applied to the positive or negative regions of the influence line. The lane load
can also be a part of the Special Live Load. If the positive lane load effect is being sought, the sum of the
positive areas of the influence line is multiplied by the value of the uniform lane load, and the result is stored
as the positive lane load effect. The negative lane load effect is calculated similarly using the negative
areas of the influence line. The lane load effect is not considered when analyzing the top slab(s) of culverts
in accordance with D3.6.1.3.3. The lane load effect is still considered for all other components of the culvert.
A Lane Load is always applied directly to the culvert top slab for culverts at grade or under fill; it is not
distributed through the fill. When the lane load is placed on fill above the culvert deck, there is no lateral
distribution of load through the fill as there is with wheel loads; the lane load is assumed to act straight
down through the fill and is uniformly distributed over a 10.0 ft lane width. The lane load effect is factored
by the multiple presence factors for the Thru Fill case. If live load is not applied at all, i.e., the number of
specified lanes is zero, then the program uses only dead load in forming the load effects.
3.3.15 Fatigue Load Effect
The effects of a Fatigue Load are not considered by this program in accordance with A5.5.3.1.

Chapter 3 Method of Solution
3-33
3.3.16 Special Live Load
The effects of a Special Live Load are calculated in the same manner as explained in Section 3.3.11. The
effects of all axles are considered unless the user has specified to neglect the effects of those axles that
do not produce the same effect as the effect being sought. Also, if the combined effect of a Special Lane
Load and the Special Live Load is requested, the program computes these effects in a similar manner as
the LRFD loading.
In calculating the effect of a Special Live Load, the effects of all axle loads are considered only if the user
specifies to include the effects of all axles.
3.3.17 Live Load Envelopes
The program computes the live load effect considering dynamic load allowance, multiple presence factor,
and the equivalent strip width for the On Deck, Thru Fill, or both conditions depending on the fill height. If
Live Load is applied, Dynamic Load Allowance will be applied to all components of the culvert except for
strip footings. IM is not used for calculation of foundation bearing pressures as per revision to D3.6.2.2P.
For the P-82 and PA2016-13 loads, Dynamic Load Allowance is limited to 20%.
3.3.17.1 On Deck Live Loads
The general equation used to determine live load effect, applied directly to the culvert deck, (Qi)deck, on a
unit strip of culvert is:
(Qi) (Deck) = γi {Qi (Lane) + Qi (truck) (1+IM)} /Elat
The above equation considers the multiple presence factor associated with the number of loaded lanes.
The multiple presence factor is used only when the equivalent strip width is calculated as per A4.6.2.1.3.
The lane effect is determined by loading only the portion of the influence line that contributes to the effect
being sought. Truck axles that do not contribute to the extreme force effect under consideration (notional
load concept) are ignored when loading the influence lines.
The live load distribution factor for the On Deck condition is calculated by one of the following methods.
Case 1 - Height of fill less than 2 ft
For this case the program uses the Equivalent Strip method from A4.6.2.10.
12)(44.10.96 Elat
SpanCulvert+= (Span in feet)

Chapter 3 Method of Solution
3-34
Elat = Minimum (Elat M+, Elat M-) / MPF
Where:
MPF is equal to (1.2*Multiple Presence Reduction Factor) for a single lane
Culvert Span = center-of-wall to center-of-wall culvert span of a single cell, in feet
For Cast-In-Place, the Elat value must be less than or equal to the Culvert Segment Length. For precast,
Elat value must be less than or equal to the number of precast shear segments with shear transfer times
the Culvert Segment Length.
The dynamic load allowance is then computed. Finally, the load effect is computed per unit length using
the equivalent strip width, Elat.

Chapter 3 Method of Solution
3-35
3.3.17.2 Thru Fill Live Loads
Here, the wheel loads are applied as a uniform load distributed over a rectangular area with sides equal to
the tire contact area, as per D3.6.1.2.5. The sides are increased by 1.15 times the fill depth in accordance
with A3.6.1.2.6 and projected through the fill. Unlike the On Deck loading, the entire projected wheel area
is placed on the culvert. Loading only the portion of the influence line that maximizes the desired effect is
not considered.
The general equation used to determine total factored live load effect, distributed through the fill depth,
(Qi)Thru Fill, on a unit strip of culvert is :
(Qί) Thru Fill = γi {Qί (Lane) x MPF/dw + Qί (Truck) (1 + IM)/Elat}
Note that the above equation is different from the one for the On Deck envelope. The live load distribution
for Thru Fill effects is determined as shown in Figure 1. This figure depicts what is considered Case 2 or
the Thru Fill Case. First the lateral distribution distance, Elat(1), of the axle loads for one lane loaded is
determined. This distance is a function of the wheel axle spacing and the height of fill. Then, if the number
of design lanes is more than one, a second lane is loaded and Elat(2) is determined. This continues for as
many design lanes as is specified in the input file.
Elat is computed using the following equations:
I = number of lanes
LANE(i) = The geometric distance shown in Figure 3.3.17.2-1
LengthonDistributiLoadLiveMPFi
iLANEiElat ≤=*
)()(
Chapter 3 Method of Solution
3-36
Lane 1
Lane 2
Lane 3
LANE(1)
Lane 1
Lane 2
Lane 3
LANE(2)
1 Lane Loaded - Continuous ELAT
2 Lanes Loaded - Continuous ELAT
Top of Culvert
Top of Culvert
HeightofFill
HeightofFill
Lane 1
Lane 2
Dt
2 Lanes Loaded - Non-Continuous ELAT
Top of Culvert
HeightofFill
D1 D2
LANE(2) = Dt - D1 - D2
2
2
21.15
1.15
1.15
Figure 3.3.17.2-1 Case 2–- Live Load Distribution Distances for Thru Fill Effect

Chapter 3 Method of Solution
3-37
3.4 LOAD COMBINATIONS AND STRESSES
After the effects of all loads are calculated, as described in Section 3.3, the program computes the factored
moments, shears, deflections, reactions, and stresses as required by the LRFD Specifications and DM-4. In
accordance with DM-4, the program computes the total factored loads using the following equation:
∑=
i
iiiii or
ηqγqγηQ
where: Q = total factored load
η i = load modifier (See Table 3.4-1)
γ i = Load Factor (See Table 3.4-2)
q i = Load (unfactored analysis results)
In the above equation, when the maximum load factor is used for a given load, then η I γ i q i is used. When the
minimum load factor is used with a given load, then γ i q i / η I is used.
The program computes the load modifier in accordance with LRFD Specifications Article 1.3.2 and the
corresponding section of DM-4. The load modifier used for each combination is summarized in Table 3.4-1.
The unfactored analysis results are multiplied by the appropriate load factor. The load factor depends on the load
type and the limit state, as specified in the LRFD Specifications. The program considers LRFD Strength I,, Strength
IA, Strength II, and Service I limit states. In addition, the program uses load factors for checking construction /
uncured slab loads. The load factors used for each load type per limit state and construction / uncured slab loads,
are shown in Table 3.4-2. When two load factors are presented, the first load factor is the maximum load factor
and the second load factor in the minimum load factor.
Using the method described in section 3.3, the effects due to dead loads, earth loads and live loadings at all POI’s
are obtained and stored. These effects are then combined into the maximum effect cases for the purpose of design
or rating sections at POI’s. The load factors are shown in Table 3.4-2. These loads provide the Factored Load side
of the LRFD equation for various Limit States and Load Cases. The following sections describe how these factored
loads for applicable Limit States and Maximum Effect are obtained.

Chapter 3 Method of Solution
3-38
Table 3.4-1 Load Modifier
Load Combination
Load Modifier
All Strength Limit States
η = product of importance factor, ductility factor and redundancy factor (see
LDC command)
Minimum η = 1.0
Maximum η = 1.16
As per PennDOT DM-4 Section 1.3.2.1, Eta factors other than 1.0 are not
permitted by PennDOT.
All Service Limit States
η = 1.0
Construction/Uncured Slab
η = product of entered importance factor, ductility factor, and redundancy
factor (see LDC command)
Minimum η = 1.0
Maximum η = 1.16
As per PennDOT DM-4 Section 1.3.2.1, Eta factors other than 1.0 are not
permitted by PennDOT.

Chapter 3 Method of Solution
3-39
Table 3.4-2 Load Factors(γi), Live Loadings and Applicable Ratings
Load Service I Strength I Strength IA Strength II
Min. For Constr. Case (Strength)
DC 1.00 1.25,0.90 1.25,0.90 1.25,0.90 1.25,0.90 DCB 1.00 1.25,0.90 1.25,0.90 1.25,0.90 1.25,0.90
DW 1.00 1.50,0.65 1.50,0.65 1.50,0.65 N/A
AD 1.00 1.25,0.9 1.25,0.9 1.25,0.9 1.25,0.9 OV 1.00 1.50,0.65 1.50,0.65 1.50,0.65 N/A
EV 1.00 γEV γEV γEV γEV
EH 1.00 γEH γEH γEH 1.35, 0.901 LS 1.00, 0 1.75, 0 1.35, 0 1.35,0 1.50, 0
AL 1.00, 0 1.75, 0 1.35, 0 1.35, 0 1.50, 0
LLIM 1.00, 0 1.75, 0 1.35, 0 1.35,0 - WA 1.00,0 1.00,0 N/A 1.00,0 N/A
Design Live Loading PHL93 PHL93 PHL93
P82, PA2016-13 -
Rating Live Loading Rating Applicability: I = Inventory, O = Operating
PHL93 - I O - -
HL-93 - I O - -
P82 - - - O - ML80 - I - O -
TK527 - I - O -
EV2 - - - O - EV3 - - - O -
SU6TV - - - O -
PA2016-13 - - - O - HS20 - I - O -
H20 - I - O -
Spec. Veh. - I - O -
Notes: 1 Minimum load factor (EH) of 0.50 applies for top slabs of box culverts
Earth Load Factors
Max Min
γEV 1.30 0.90 γEH 1.35 0.90*
*Use 0.50 minimum for culvert top slab

Chapter 3 Method of Solution
3-40
3.4.1 Maximum Effect Cases
The following six (6) maximum effect cases are used for design and an analysis:
i. Positive moment with concurrent thrust and shear
ii. Negative moment with concurrent thrust and shear
iii. Tension thrust with concurrent moment and shear
iv. Compression thrust with concurrent moment and shear
v. Positive shear with concurrent moment and thrust
vi. Negative shear with concurrent moment and thrust
Cases 1, 2, 3 and 4 are used for flexure, and Cases 1, 2, 5 and 6 are used for shear. The controlling case
for flexure and the controlling case for shear are printed out.
3.4.2 Limit States and Load Factors
The effects from all applied loads are factored by maximum and minimum load factors and combined into
the following LRFD limit states:
• Strength I
• Strength IA
• Strength II
• Construction
• Service I
Typically, Strength I, Strength II and Construction limit states are used for Design (sizing member
thicknesses and reinforcement); Strength I, Strength IA and Strength II are used for an Analysis (section
capacities and rating factors).
The factoring and combining of effects into limit states follows the DM-4 Specifications. Table 3.4-2 lists
the minimum and maximum load factors for the various loading types, e.g., DC, DW, etc., for each limit
state, and also which live load and limit state is used to compute Inventory and Operating ratings. If only a
single load factor is listed, then it applies to both minimum and maximum. The program maximizes each
case in each Limit State by using the appropriate (maximum or minimum) Load Factor which will add to the
effect being sought. Once factored appropriately, the effects are summed together to form the limit state
combined loads. These limit state loads are used to compute section capacities, rating factors, design
member thicknesses and reinforcement, etc.

Chapter 3 Method of Solution
3-41
3.5 FACTORED RESISTANCE
The factored resistance of a section is calculated by computing nominal section resistance and applying the strength
reduction factor, φ. The factored resistance is used in Analysis to compute Rating Factors, and for determining
required flexure and shear reinforcement in Design.
Figure 1 defines section dimensions that will be used throughout the remainder of this chapter. In computing the
nominal resistance of a section, any sacrificial thicknesses of the section are ignored. Sacrificial thicknesses are:
wearing surface on a top slab when the slab is on grade, bottom slab scour, and foundation unevenness for a CIP
culvert. The section dimension, h, in the figure is the total thickness of the section as specified by the user or being
considered by the program. It is used to calculate member self weight and compute member stiffness. Top and
Bottom reinforcement covers have default values that are the minimum allowed by DM-4; the user may increase
the bar covers but not reduce them. The top face (top As, topc and dneg) is physically the top of the top and bottom
slabs, and the left side of the walls, while the bottom face (bottom As, botc and dpos) is physically the bottom of the
top and bottom slabs, and the right side of the walls. The distances, dneg and dpos are used in all strength
calculations.
3.5.1 Section Design
BXLRFD has the capability to provide three types of design:
1. DESIGN WITH KNOWN THICKNESSES - when the thicknesses are known, the sections are
designed for the areas of flexural and shear reinforcement required for the given thicknesses. This
is referred to as design type DR. Note that if the specified thickness is sufficient for shear, no shear
reinforcement will be required.
2. DESIGN WITH SHEAR REINFORCEMENT - when the thicknesses are not known, the members
are designed for the thickness required to resist bending moment and then the sections are
designed for the areas of flexural and shear reinforcement. This is referred to as design type DA.
3. DESIGN WITHOUT SHEAR REINFORCEMENT - when the thicknesses are not known, the
members are also designed for the thickness required to resist the bending moment and shear
without providing any shear reinforcement. This is referred to as design type DC.
Chapter 3 Method of Solution
3-42
dneg
dposh
topc
botc
twsor
tscour
tFU
Top As
Bot As
h = Specified Section Thickness
tws = Top Slab Integral Wearing Surface Thickness (Hfill = 0.0) - 0.5 inch
tscour = Bottom Scour Thickness - 0.5 inch
tFU = Foundation Unevenness Thickness (CIP only) - 1.0 inch
topc = Top Reinforcement Cover
botc = Bottom Reinforcement Cover
Note: h used for self weight and stiffness, dneg and dpos used for capacity
Figure 3.5-1 Cross Section Dimensions
All design strength limit states, all flexure maximum effect cases and all points-of-interest are considered.
The general procedure used for design is as follows. If the thickness of the member is to be computed, the
program starts with the greater of the thickness specified by the user or the minimum allowed thicknesses
in Table 5.8-1. The thickness required at a section to resist the bending moment (without consideration of
axial load) is computed and compared with the thickness provided. The difference between the thickness
required and the thickness provided is computed at each section of a member and the maximum difference
is stored. If the maximum difference is less than 0.5 inch, the thickness assumed for a member is
considered sufficient. If the maximum difference is greater than or equal to 0.5 inch then this difference is
rounded up to the next 0.5 inch thickness increment. This value is then added to the current assumed
thickness to find the new assumed thickness. This is done for each member. The structure is analyzed

Chapter 3 Method of Solution
3-43
with these new member thicknesses and again the required member thicknesses are computed. This
process is repeated until the difference between the assumed thickness and the required thickness is less
than 0.5 inch for all members.
For design types DA and DC, the factored load effect for Strength I, Strength II and Construction limit state
combinations are first generated, and then required member thickness, assuming a reinforcement ratio, ρ,
equal to 0.5 of balanced reinforcement ratio, (ρb), at a given POI. The minimum flexure reinforcement is
determined and the required amount of flexure reinforcement is computed using the minimum as a starting
point. The Service I limit state combination is then generated, then bar spacings required for strength and
crack control for eight bar sizes are computed. For a DC Design, member thicknesses are increased if
necessary to resist the shear force, without considering shear reinforcement. For a DA Design, member
thicknesses are increased to resist the shear force, with consideration of shear reinforcement.
For design type DR, Strength I, Strength II and Construction limit state combinations are generated,
minimum flexure reinforcement is determined and the required amount of flexure reinforcement is
computed. The Service I limit state combination is then generated, the bar spacings required for strength
and crack control for eight bar sizes are computed. The shear reinforcement to resist the total factored
shear force is computed, if required.
3.5.1.1 Member Thickness for Flexure
For design types DA and DC, the thicknesses of structure components other than strip footings are first
determined either starting from the minimum allowed thicknesses (see Table 5.8-1) or those specified in
the input file whichever is greater. The required thickness is equal to the required effective depth, dreq, plus
the distance from the centroid of the bar to the face of the member. The required member thickness for
strength is calculated by using the following formula, assuming a reinforcement ratio, ρ, equal to one-half
of the balanced reinforcement ratio, ρ b. The φ is calculated as described in Section 3.5.1.3.
−
c
ybyb
bureq
2(0.85)ff0.5
1 bf0.5
|M| = d
'
/ρ
ρ
φ
After the required thicknesses have been determined for all members, the overall structure geometry is
updated if any change in thickness is more than 0.5 inch. Each member thickness can change
independently of the other components except for top slabs: in a two cell culvert. The maximum thickness
among the two slabs is determined. This is necessary to maintain a constant slope for the top slabs. The
bottom slab thickness in a two cell culvert can be different due to a fish channel. However, the minimum
thicknesses must be the same.

Chapter 3 Method of Solution
3-44
For design type DR, the thickness of culvert components is specified by the user.
3.5.1.2 Flexural Reinforcement
The flexural reinforcement is determined by iterative procedure considering the interaction of moments and
axial forces. This procedure uses a very small amount of flexural reinforcement (0.001 Asmin) as a starting
point to build the first moment-axial interaction curve as shown in Figure 1. The equations shown on the
next several pages are used to build the interaction diagram. The fy for flexural and axial reinforcement
calculations is limited to 75 ksi as per A5.4.3.1.
The program iterates by varying the flexural reinforcement depending on where the total factored loads
point (Mu, Pu) falls. If it falls outside the interaction curve, then the flexure reinforcement is increased until
(Mu, Pu) falls within the curve. If the total factored load point (Mu, Pu) falls within the interaction curve, then
flexure reinforcement is decreased until (Mu, Pu) point falls on or very near the curve.
Figure 1 presents the moment-axial interaction curve used by BXLRFD to calculate the factored moment
resistance, Mr, and factored axial resistance, Pr. The interaction curve is defined by 14 discrete points,
seven for each face of the cross section. Face B of Figure 1 represents the interaction curve for positive
bending and face A represents the interaction curve for negative bending. The area of steel on the
compression face is ignored. Both curves have similar shapes but different magnitudes because the
effective depths of a section vary for positive and negative bending. Points 1 and 14 are at (0,φPo,ten),
Points 2 and 13 are at (φMo,0), Points 3 and 12 are at (φMt,φPt), Points 4 and 11 are at (φMb,φPb), Points
5 and 10 are at (φMc,φPc), Points 6 and 9 are found by computing the intersection of two lines. Points 7
and 8 are at (0,0.8 φ Po,comp).
The solid lines in Figure 1 define the factored resistance curve, whereas the dashed lines define the
unfactored or nominal section resistance curve. The factored moment and axial resistance, Mr and Pr, are
found by extending a load line from the (DL+E) load point to the (DL+E+LL) load point. The Load Line is
a linear line extended from the (DL+E) load point to the (DL+E+LL) load point. If the (DL+E+LL) load point
is inside the interaction curve, the load line is extended to find the intersection. If the (DL+E) load point is
zero, then the Load Line goes from the origin to the (DL+E+LL) load point. If the (DL+E) load point is
outside the interaction curve, the Load Line goes from the origin to the (DL+E) load point.
Chapter 3 Method of Solution
3-45
1
2
3
45
67
89
1011
12
φP0,ten
Pb
0.8φP0, comp
0.8P0, comp
P0,comp
(Mr,Pr)
MbM0
φM0M
P (Compression)
Face BFace A
UnfactoredFactored
Legend
(MDL+E,PDL+E)(MDL+E+LL,PDL+E+LL)
Mt
Pt
13
14Mc
Pc
Figure 3.5.1.2-1 Two Face Moment-Axial Interaction Curve Showing Load Line
The fourteen points, (1) to (14), correspond to the following factored conditions, as shown in Figure 1:
1 & 14. Pure axial tensile strength (based on reinforcement only)
recastPFor
CIPFor0.19.0
==φ
Positive Flexure
𝑃𝑃(1) = 𝜙𝜙 𝐴𝐴𝑠𝑠𝑠𝑠𝑠𝑠𝑓𝑓𝑦𝑦
𝑀𝑀(1) = 0 (eccentricity of tensile force is ignored) Negative Flexure
𝑃𝑃(14) = 𝜙𝜙 𝐴𝐴𝑠𝑠𝑠𝑠𝑠𝑠𝑓𝑓𝑦𝑦
𝑀𝑀(14) = 0 (eccentricity of tensile force is ignored)
2 & 13. Pure flexural strength (axial capacity = 0.0)

Chapter 3 Method of Solution
3-46
The resistance factor, 𝜙𝜙, is computed considering strain compatibility when appropriate, as
shown below. The 𝜙𝜙 limit is 0.9 for cast-in-place culverts and 1.0 for precast culverts.
Positive Flexure
02 =)(P
𝑀𝑀(2) = 𝜙𝜙 �𝐴𝐴𝑠𝑠𝑠𝑠𝑠𝑠𝑓𝑓𝑠𝑠 �𝑑𝑑𝑠𝑠𝑝𝑝𝑠𝑠 − 𝐴𝐴𝑠𝑠𝑠𝑠𝑠𝑠 𝑓𝑓𝑠𝑠2 (0.85 𝑓𝑓𝑐𝑐′ 𝑏𝑏)
��
Negative Flexure
𝑃𝑃(13) = 0
𝑀𝑀(13) = 𝜙𝜙 �𝐴𝐴𝑠𝑠𝑠𝑠𝑠𝑠𝑓𝑓𝑠𝑠 �𝑑𝑑𝑠𝑠𝑛𝑛𝑛𝑛 −𝐴𝐴𝑠𝑠𝑠𝑠𝑡𝑡 𝑓𝑓𝑠𝑠
2 (0.85 𝑓𝑓𝑐𝑐′ 𝑏𝑏)��
With the known area of steel the quadratic equation is solved for the moment resistance, M(2)
and M(13), with 𝜙𝜙 equal to the 𝜙𝜙 limit and assuming the stress in the reinforcement steel, fs, is
equal to the specified minimum yield strength, fy.
The net tensile strain and the stress in the reinforcement is computed from the following:
𝑐𝑐 = 𝐴𝐴𝑠𝑠 𝑓𝑓𝑠𝑠
0.85 𝑓𝑓𝑐𝑐′ 𝛽𝛽1 𝑏𝑏
ɛ𝑠𝑠 = 0.003 �𝑑𝑑𝑠𝑠𝑐𝑐− 1�
𝑓𝑓𝑠𝑠 = 𝑚𝑚𝑚𝑚𝑚𝑚�ɛ𝑠𝑠 · 𝐸𝐸𝑠𝑠 , 𝑓𝑓𝑦𝑦�
If the mild steel stress, fs, is less than the yield strength, fy, then the initial assumption was
incorrect and the nominal flexural resistance is determined based on conditions of equilibrium
and strain compatibility.
The resistance factor 𝜙𝜙 is computed with the net tensile strain using the equation:
0.75 ≤ 𝜙𝜙 = 0.75 + 0.15�𝜀𝜀𝑠𝑠(4)− 𝜀𝜀𝑐𝑐𝑐𝑐�(𝜀𝜀𝑠𝑠𝑐𝑐− 𝜀𝜀𝑐𝑐𝑐𝑐)
≤ 0.9 (for CIP)
0.75 ≤ 𝜙𝜙 = 0.75 + 0.25�𝜀𝜀𝑠𝑠(4)− 𝜀𝜀𝑐𝑐𝑐𝑐�(𝜀𝜀𝑠𝑠𝑐𝑐− 𝜀𝜀𝑐𝑐𝑐𝑐)
≤ 1.0 (for Precast)
where:
𝜀𝜀𝑐𝑐𝑐𝑐 = 𝑐𝑐𝑐𝑐𝑚𝑚𝑐𝑐𝑐𝑐𝑐𝑐𝑐𝑐𝑐𝑐𝑚𝑚𝑐𝑐𝑚𝑚˗𝑐𝑐𝑐𝑐𝑚𝑚𝑐𝑐𝑐𝑐𝑐𝑐𝑐𝑐𝑐𝑐𝑐𝑐𝑑𝑑 𝑐𝑐𝑐𝑐𝑐𝑐𝑠𝑠𝑚𝑚𝑚𝑚 𝑐𝑐𝑚𝑚𝑚𝑚𝑚𝑚𝑐𝑐, 0.002
𝜀𝜀𝑠𝑠𝑐𝑐 = 𝑐𝑐𝑐𝑐𝑚𝑚𝑐𝑐𝑚𝑚𝑐𝑐𝑚𝑚˗𝑐𝑐𝑐𝑐𝑚𝑚𝑐𝑐𝑐𝑐𝑐𝑐𝑐𝑐𝑐𝑐𝑐𝑐𝑑𝑑 𝑐𝑐𝑐𝑐𝑐𝑐𝑠𝑠𝑚𝑚𝑚𝑚 𝑐𝑐𝑚𝑚𝑚𝑚𝑚𝑚𝑐𝑐, 0.005

Chapter 3 Method of Solution
3-47
Finally, the factored flexural resistance is computed by multiplying the nominal flexural
resistance by 𝜙𝜙. If the computed 𝜙𝜙 factor is less than 0.90 (CIP) or 1.0 (Precast), then the
process is repeated with 𝜙𝜙 assumed to be 0.75 and a second moment resistance is computed.
Using the second moment resistance a new factored flexural resistance is computed. If the
second moment resistance is less than the applied factored moment then the cross section is
considered inadequate; otherwise, the phi factor is iterated until the assumed phi factor is equal
to the computed phi factor. For analysis, the inadequate resistance is reported; for design, the
culvert thickness or area of steel is incremented.
3 & 12. Tension controlled strain condition
recastPForCIPFor
0.19.0
==φ
Positive Flexure
𝜀𝜀𝑐𝑐𝑐𝑐 = 0.003
𝜀𝜀𝑠𝑠 = 𝜀𝜀𝑠𝑠𝑐𝑐 = 0.005 (program limited to fy ≤ 75.0 ksi)
𝑑𝑑𝑠𝑠𝑝𝑝𝑠𝑠′′ = 𝑑𝑑𝑠𝑠𝑝𝑝𝑠𝑠 − ℎ2
𝑐𝑐𝑠𝑠𝑝𝑝𝑠𝑠 = 𝜀𝜀𝑐𝑐𝑐𝑐 𝑑𝑑𝑠𝑠𝑝𝑝𝑠𝑠𝜀𝜀𝑠𝑠 + 𝜀𝜀𝑐𝑐𝑐𝑐
𝑠𝑠𝑠𝑠𝑝𝑝𝑠𝑠 = 𝛽𝛽1𝑐𝑐𝑠𝑠𝑝𝑝𝑠𝑠
𝐶𝐶𝑐𝑐 = 0.85𝑓𝑓 𝑐𝑐 ′ 𝛽𝛽1𝑐𝑐𝑠𝑠𝑝𝑝𝑠𝑠𝑏𝑏
𝑇𝑇 = 𝐴𝐴𝑠𝑠𝑠𝑠𝑠𝑠𝑀𝑀𝑀𝑀𝑀𝑀(𝑓𝑓𝑦𝑦 , 𝜀𝜀𝑠𝑠𝐸𝐸𝑠𝑠)
𝑃𝑃(3) = 𝜙𝜙 {𝐶𝐶𝑐𝑐 − 𝑇𝑇}
𝑀𝑀(3) = 𝜙𝜙 �𝐶𝐶𝑐𝑐 �𝑑𝑑𝑠𝑠𝑝𝑝𝑠𝑠 − 𝑎𝑎𝑠𝑠𝑝𝑝𝑠𝑠2− 𝑑𝑑𝑠𝑠𝑝𝑝𝑠𝑠′′� + 𝑇𝑇𝑑𝑑𝑠𝑠𝑝𝑝𝑠𝑠′′�
Negative Flexure
𝜀𝜀𝑐𝑐𝑐𝑐 = 0.003
𝜀𝜀𝑠𝑠 = 𝜀𝜀𝑠𝑠𝑐𝑐 = 0.005 (program limited to fy ≤ 75.0 ksi)
𝑑𝑑𝑠𝑠𝑛𝑛𝑛𝑛′′ = 𝑑𝑑𝑠𝑠𝑛𝑛𝑛𝑛 − ℎ2
𝑐𝑐𝑠𝑠𝑛𝑛𝑛𝑛 = 𝜀𝜀𝑐𝑐𝑐𝑐 𝑑𝑑𝑡𝑡𝑛𝑛𝑛𝑛𝜀𝜀𝑠𝑠 + 𝜀𝜀𝑐𝑐𝑐𝑐
𝑠𝑠𝑠𝑠𝑛𝑛𝑛𝑛 = 𝛽𝛽1𝑐𝑐𝑠𝑠𝑛𝑛𝑛𝑛
𝐶𝐶𝑐𝑐 = 0.85𝑓𝑓 𝑐𝑐 ′ 𝛽𝛽1𝑐𝑐𝑠𝑠𝑛𝑛𝑛𝑛𝑏𝑏
𝑇𝑇 = 𝐴𝐴𝑠𝑠𝑠𝑠𝑠𝑠𝑀𝑀𝑀𝑀𝑀𝑀(𝑓𝑓𝑦𝑦 , 𝜀𝜀𝑠𝑠𝐸𝐸𝑠𝑠)

Chapter 3 Method of Solution
3-48
𝑃𝑃(12) = 𝜙𝜙 {𝐶𝐶𝑐𝑐 − 𝑇𝑇}
𝑀𝑀(12) = 𝜙𝜙 �𝐶𝐶𝑐𝑐 �𝑑𝑑𝑠𝑠𝑛𝑛𝑛𝑛 − 𝑎𝑎𝑡𝑡𝑛𝑛𝑛𝑛2− 𝑑𝑑𝑠𝑠𝑛𝑛𝑛𝑛′′� + 𝑇𝑇𝑑𝑑𝑠𝑠𝑛𝑛𝑛𝑛′′�
4 & 11. Balanced condition
Positive Flexure
𝜀𝜀𝑐𝑐𝑐𝑐 = 0.003
𝜀𝜀𝑠𝑠 = 𝑓𝑓𝑦𝑦𝐸𝐸𝑠𝑠
𝑑𝑑𝑠𝑠𝑝𝑝𝑠𝑠′′ = 𝑑𝑑𝑠𝑠𝑝𝑝𝑠𝑠 − ℎ2
𝑐𝑐𝑠𝑠𝑝𝑝𝑠𝑠 = 𝜀𝜀𝑐𝑐𝑐𝑐 𝑑𝑑𝑠𝑠𝑝𝑝𝑠𝑠𝜀𝜀𝑠𝑠 + 𝜀𝜀𝑐𝑐𝑐𝑐
𝑠𝑠𝑠𝑠𝑝𝑝𝑠𝑠 = 𝛽𝛽1𝑐𝑐𝑠𝑠𝑝𝑝𝑠𝑠
𝐶𝐶𝑐𝑐 = 0.85𝑓𝑓 𝑐𝑐 ′ 𝛽𝛽1𝑐𝑐𝑠𝑠𝑝𝑝𝑠𝑠𝑏𝑏
𝑇𝑇 = 𝐴𝐴𝑠𝑠𝑠𝑠𝑠𝑠𝑀𝑀𝑀𝑀𝑀𝑀(𝑓𝑓𝑦𝑦 , 𝜀𝜀𝑠𝑠𝐸𝐸𝑠𝑠)
0.75 ≤ 𝜙𝜙 = 0.75 + 0.15�𝜀𝜀𝑠𝑠(4)− 𝜀𝜀𝑐𝑐𝑐𝑐�(𝜀𝜀𝑠𝑠𝑐𝑐− 𝜀𝜀𝑐𝑐𝑐𝑐)
≤ 0.9 (for CIP)
0.75 ≤ 𝜙𝜙 = 0.75 + 0.25�𝜀𝜀𝑠𝑠(4)− 𝜀𝜀𝑐𝑐𝑐𝑐�(𝜀𝜀𝑠𝑠𝑐𝑐− 𝜀𝜀𝑐𝑐𝑐𝑐)
≤ 1.0 (for Precast)
Where:
𝜀𝜀t(4) = εt from point (4)
𝜀𝜀cl = εcl from point (5)
𝜀𝜀tl = εtl from point (3)
𝑃𝑃(4) = 𝜙𝜙 {𝐶𝐶𝑐𝑐 − 𝑇𝑇}
𝑀𝑀(4) = 𝜙𝜙 �𝐶𝐶𝑐𝑐 �𝑑𝑑𝑠𝑠𝑝𝑝𝑠𝑠 − 𝑎𝑎𝑠𝑠𝑝𝑝𝑠𝑠2− 𝑑𝑑𝑠𝑠𝑝𝑝𝑠𝑠′′� + 𝑇𝑇𝑑𝑑𝑠𝑠𝑝𝑝𝑠𝑠′′�
Negative Flexure
𝜀𝜀𝑐𝑐𝑐𝑐 = 0.003
𝜀𝜀𝑠𝑠 = 𝑓𝑓𝑦𝑦𝐸𝐸𝑠𝑠
𝑑𝑑𝑠𝑠𝑛𝑛𝑛𝑛′′ = 𝑑𝑑𝑠𝑠𝑛𝑛𝑛𝑛 − ℎ2
𝑐𝑐𝑠𝑠𝑛𝑛𝑛𝑛 = 𝜀𝜀𝑐𝑐𝑐𝑐 𝑑𝑑𝑡𝑡𝑛𝑛𝑛𝑛𝜀𝜀𝑠𝑠 + 𝜀𝜀𝑐𝑐𝑐𝑐
𝑠𝑠𝑠𝑠𝑛𝑛𝑛𝑛 = 𝛽𝛽1𝑐𝑐𝑠𝑠𝑛𝑛𝑛𝑛

Chapter 3 Method of Solution
3-49
𝐶𝐶𝑐𝑐 = 0.85𝑓𝑓 𝑐𝑐 ′ 𝛽𝛽1𝑐𝑐𝑠𝑠𝑛𝑛𝑛𝑛𝑏𝑏
𝑇𝑇 = 𝐴𝐴𝑠𝑠𝑠𝑠𝑠𝑠𝑀𝑀𝑀𝑀𝑀𝑀(𝑓𝑓𝑦𝑦 , 𝜀𝜀𝑠𝑠𝐸𝐸𝑠𝑠)
0.75 ≤ 𝜙𝜙 = 0.75 + 0.15�𝜀𝜀𝑠𝑠(11)− 𝜀𝜀𝑐𝑐𝑐𝑐�(𝜀𝜀𝑠𝑠𝑐𝑐− 𝜀𝜀𝑐𝑐𝑐𝑐)
≤ 0.9 (for CIP)
0.75 ≤ 𝜙𝜙 = 0.75 + 0.25�𝜀𝜀𝑠𝑠(11)− 𝜀𝜀𝑐𝑐𝑐𝑐�(𝜀𝜀𝑠𝑠𝑐𝑐− 𝜀𝜀𝑐𝑐𝑐𝑐)
≤ 1.0 (for Precast)
Where:
𝜀𝜀t(11) = εt from point (11)
𝜀𝜀cl = εcl from point (10)
𝜀𝜀tl = εtl from point (12)
𝑃𝑃(11) = 𝜙𝜙 {𝐶𝐶𝑐𝑐 − 𝑇𝑇}
𝑀𝑀(11) = 𝜙𝜙 �𝐶𝐶𝑐𝑐 �𝑑𝑑𝑠𝑠𝑛𝑛𝑛𝑛 − 𝑎𝑎𝑡𝑡𝑛𝑛𝑛𝑛2− 𝑑𝑑𝑠𝑠𝑛𝑛𝑛𝑛′′� + 𝑇𝑇𝑑𝑑𝑠𝑠𝑛𝑛𝑛𝑛′′�
5 & 10. Compression controlled strain condition 𝜙𝜙 = 0.75
Positive Flexure
𝜀𝜀𝑐𝑐𝑐𝑐 = 0.003
𝜀𝜀𝑠𝑠 = 𝜀𝜀𝑐𝑐𝑐𝑐 = 0.002 (for fy ≤ 60.0 ksi)
𝜀𝜀𝑠𝑠 = 𝜀𝜀𝑐𝑐𝑐𝑐 = 0.002 + (𝑓𝑓𝑦𝑦−60.0)(0.002)
40.0 (for 60.0 ksi < fy ≤ 75.0 ksi)
𝑑𝑑𝑠𝑠𝑝𝑝𝑠𝑠′′ = 𝑑𝑑𝑠𝑠𝑝𝑝𝑠𝑠 − ℎ2
𝑐𝑐𝑠𝑠𝑝𝑝𝑠𝑠 = 𝜀𝜀𝑐𝑐𝑐𝑐 𝑑𝑑𝑠𝑠𝑝𝑝𝑠𝑠 𝜀𝜀𝑠𝑠 + 𝜀𝜀𝑐𝑐𝑐𝑐
𝑠𝑠𝑠𝑠𝑝𝑝𝑠𝑠 = 𝛽𝛽1𝑐𝑐𝑠𝑠𝑝𝑝𝑠𝑠
𝐶𝐶𝑐𝑐 = 0.85𝑓𝑓 𝑐𝑐 ′ 𝛽𝛽1𝑐𝑐𝑠𝑠𝑝𝑝𝑠𝑠𝑏𝑏
𝑇𝑇 = 𝐴𝐴𝑠𝑠𝑠𝑠𝑠𝑠𝑀𝑀𝑀𝑀𝑀𝑀(𝑓𝑓𝑦𝑦 , 𝜀𝜀𝑠𝑠𝐸𝐸𝑠𝑠)
𝑃𝑃(5) = 𝜙𝜙 {𝐶𝐶𝑐𝑐 − 𝑇𝑇}
𝑀𝑀(5) = 𝜙𝜙 �𝐶𝐶𝑐𝑐 �𝑑𝑑𝑠𝑠𝑝𝑝𝑠𝑠 − 𝑎𝑎𝑠𝑠𝑝𝑝𝑠𝑠2− 𝑑𝑑𝑠𝑠𝑝𝑝𝑠𝑠′′� + 𝑇𝑇𝑑𝑑𝑠𝑠𝑝𝑝𝑠𝑠′′�
Negative Flexure
𝜀𝜀𝑐𝑐𝑐𝑐 = 0.003
𝜀𝜀𝑠𝑠 = 𝜀𝜀𝑐𝑐𝑐𝑐 = 0.002 (for fy ≤ 60.0 ksi)

Chapter 3 Method of Solution
3-50
𝜀𝜀𝑠𝑠 = 𝜀𝜀𝑐𝑐𝑐𝑐 = 0.002 + (𝑓𝑓𝑦𝑦−60.0)(0.002)
40.0 (fy is limited to 75.0 ksi)
𝑑𝑑𝑠𝑠𝑛𝑛𝑛𝑛′′ = 𝑑𝑑𝑠𝑠𝑛𝑛𝑛𝑛 − ℎ2
𝑐𝑐𝑠𝑠𝑛𝑛𝑛𝑛 = 𝜀𝜀𝑐𝑐𝑐𝑐 𝑑𝑑𝑡𝑡𝑛𝑛𝑛𝑛 𝜀𝜀𝑠𝑠 + 𝜀𝜀𝑐𝑐𝑐𝑐
𝑠𝑠𝑠𝑠𝑛𝑛𝑛𝑛 = 𝛽𝛽1𝑐𝑐𝑠𝑠𝑛𝑛𝑛𝑛
𝐶𝐶𝑐𝑐 = 0.85𝑓𝑓 𝑐𝑐 ′ 𝛽𝛽1𝑐𝑐𝑠𝑠𝑛𝑛𝑛𝑛𝑏𝑏
𝑇𝑇 = 𝐴𝐴𝑠𝑠𝑠𝑠𝑠𝑠𝑀𝑀𝑀𝑀𝑀𝑀(𝑓𝑓𝑦𝑦 , 𝜀𝜀𝑠𝑠𝐸𝐸𝑠𝑠)
𝑃𝑃(10) = 𝜙𝜙 {𝐶𝐶𝑐𝑐 − 𝑇𝑇}
𝑀𝑀(10) = 𝜙𝜙 �𝐶𝐶𝑐𝑐 �𝑑𝑑𝑠𝑠𝑛𝑛𝑛𝑛 − 𝑎𝑎𝑡𝑡𝑛𝑛𝑛𝑛2− 𝑑𝑑𝑠𝑠𝑛𝑛𝑛𝑛′′� + 𝑇𝑇𝑑𝑑𝑠𝑠𝑛𝑛𝑛𝑛′′�
6 & 9. Interaction point when axial load = 0.8Po
𝜙𝜙 = 0.75 Positive Flexure
𝑃𝑃(6) = 𝜙𝜙 �0.8�0.85 𝑓𝑓 𝑐𝑐′ �𝐴𝐴𝑛𝑛 − 𝐴𝐴𝑠𝑠𝑠𝑠𝑠𝑠� + 𝑓𝑓𝑦𝑦 𝐴𝐴𝑠𝑠𝑠𝑠𝑠𝑠��
M(6) = The intersection of the horizontal line from P(7) with the line between
points 5 and φ(0.8·Po,comp)
Negative Flexure
𝑃𝑃(9) = 𝜙𝜙 �0.8�0.85 𝑓𝑓 𝑐𝑐′ �𝐴𝐴𝑛𝑛 − 𝐴𝐴𝑠𝑠𝑠𝑠𝑠𝑠� + 𝑓𝑓𝑦𝑦 𝐴𝐴𝑠𝑠𝑠𝑠𝑠𝑠��
M(9) = The intersection of the horizontal line from P(8) with the line between
points 10 and φ(0.8·Po,comp)
7 & 8. Po - Pure axial compressive strength, Po (Flexural Strength = 0.0)
𝜙𝜙 = 0.75 Positive Flexure
𝑃𝑃(7) = 𝑃𝑃(6)
𝑀𝑀(7) = 0 (eccentricity of compressive force is ignored)
Negative Flexure
𝑃𝑃(8) = 𝑃𝑃(9)
𝑀𝑀(8) = 0 (eccentricity of compressive force is ignored)

Chapter 3 Method of Solution
3-51
The factored points 1 to 6 and 14 to 9 are then sorted by increasing axial value, P, and stored as points
15 to 20 and 28 to 23, respectively shown in Figure 2. Then, the P value of point 21 is set equal to the P
value of point 20 and the P value of point 22 is set equal to the P value of point 23.
15
16
17
18
19
2021
2223
2425
26
McapM
P (Compression)
Face BFace A
FactoredLegend
(MDL+E,PDL+E)
(MDL+E+LL,PDL+E+LL)
(Mr,Pr)
27
28
P (Tension)
Pcap
Figure 3.5.1.2-2 Sorted, Factored Two Face Moment-Axial Interaction Diagram
Where:
φ = Resistance factor
Astp is the area of the positive reinforcement
Astn is the area of the negative reinforcement
β1= 0.85 for f’c <= 4 ksi
β1= 0.85 − 0.05 ∗ (𝑓𝑓 𝑐𝑐′ − 4.0) for f’c > 4, but not less than 0.65 A5.7.2.2
dpos is the positive flexure reinforcement effective depth
dneg is the negative flexure reinforcement effective depth
h is the total structural depth
εcu is the crushing concrete strain (0.003)
εt is the net tensile strain at nominal resistance
εcl is the compression-controlled strain limit
εtl is the tension-controlled strain limit
apos is the depth rectangular stress distribution for positive flexure reinforcement

Chapter 3 Method of Solution
3-52
aneg is the depth rectangular stress distribution for negative flexure reinforcement
b is the width of the section (12.0 inches)
cpos is the distance from outer compressive fiber to neutral-axis for positive flexure
reinforcement
cneg is the distance from outer compressive fiber to neutral-axis for negative flexure
reinforcement
Cc is the concrete compressive force
T is the steel tensile force
ρpos is the ratio of positive bending reinforcement to effective concrete area
ρneg is the ratio of negative bending reinforcement to effective concrete area
3.5.1.2.1. Minimum Transverse Reinforcement
Cast-In-Place Culverts
For cast-in-place culverts the minimum transverse flexure reinforcement is based on a required flexural
resistance of the lesser of 1) the temperature and shrinkage reinforcement in each face of the section as
calculated per D 5.10.8 and A 12.11.4.3, and 2) 4/3 Mu or Mcr as per D 5.7.3.3.2.
AsTmin1: See Section 3.5.3.2 Temperature and Shrinkage Spacing Check.
AsTmin2:
AsTmin2 = ρmin bd
Where
[ ]bdf
) (0.85fbd - M2 )fb(0.85- -
f f 0.85 =
y
c2
req-rc
y
c
φφφ
ρ'''
min
Where
𝑀𝑀𝑟𝑟−𝑟𝑟𝑛𝑛𝑟𝑟 = 𝑀𝑀𝑚𝑚𝑚𝑚 �43
|𝑀𝑀𝑀𝑀|, 𝛾𝛾3 (𝛾𝛾1 𝑓𝑓𝑟𝑟 𝑆𝑆)�
Where
S = b h 2 / 6
(ksi) f0.24 = f cr ' 𝛾𝛾1 = 1.6 for non prestressed concrete (D5.7.3.3.2)

Chapter 3 Method of Solution
3-53
𝛾𝛾3 = fy / fu (D5.7.3.3.2) Mu = Applied Moment
Minimum transverse steel reinforcement for cast-in-place culverts (AsTmin) is the larger of AsTmin1 and AsTmin2.
Precast Culverts
For precast culverts, the minimum transverse flexure reinforcement is based on the lesser of 1) the
temperature and shrinkage reinforcement in each face of the section as calculated per D 5.10.8 (for
segment lengths greater than 16.0 ft) and 2) 0.002 times the gross concrete area as per A 12.11.4.3.
Therefore, the minimum steel (AsTmin) is the larger of AsTmin1 and AsTmin2 which are calculated as follows:
AsTmin1: If the Segment Length ≤ 16.0 feet, AsTmin1 = 0.0 in.2 / ft.
Otherwise, AsTmin1 is computed as documented in Section 3.5.3.2 Temperature and Shrinkage Spacing Check.
AsTmin2:
AsTmin2 = 0.002 Ag (A12.11.4.3.2) Where
Ag = gross area of a cross section
AsTmin = MAX(AsTmin1, AsTmin2)
3.5.1.2.2. Minimum Longitudinal Reinforcement
Cast-in-Place Culverts
For cast-in-place culverts the program does not design or detail the longitudinal reinforcement.
Precast Culverts
Location: Top Slab, Bottom Bars
For precast culverts with a fill height less than 2.0 feet, the bottom longitudinal reinforcement, AsLmin1, in
the top slab is calculated as:
𝑃𝑃𝑐𝑐𝑐𝑐𝑐𝑐𝑐𝑐𝑚𝑚𝑐𝑐 = 100
√𝑆𝑆 ≤ 50% (A9.7.3.2)

Chapter 3 Method of Solution
3-54
𝐴𝐴𝑐𝑐𝐴𝐴𝑚𝑚𝑚𝑚𝑚𝑚1𝑠𝑠 = 𝑃𝑃𝑐𝑐𝑐𝑐𝑐𝑐𝑐𝑐𝑚𝑚𝑐𝑐 · 𝐴𝐴𝑐𝑐𝑇𝑇𝑚𝑚𝑚𝑚𝑚𝑚
𝐴𝐴𝑐𝑐𝐴𝐴𝑚𝑚𝑚𝑚𝑚𝑚1𝑏𝑏 = 0.002 𝐴𝐴𝐴𝐴 (A 12.11.4.3.2)
𝐴𝐴𝑐𝑐𝐴𝐴𝑚𝑚𝑚𝑚𝑚𝑚1 = 𝑀𝑀𝐴𝐴𝑀𝑀(𝐴𝐴𝑐𝑐𝐴𝐴𝑚𝑚𝑚𝑚𝑚𝑚1𝑠𝑠,𝐴𝐴𝑐𝑐𝐴𝐴𝑚𝑚𝑚𝑚𝑚𝑚1𝑏𝑏) (bottom longitudinal reinforcement only)
Where
Ag = gross area of a cross section
S = Clear Span (in feet)
b = unit width of culvert section
d = thickness of culvert section
Location: All Other Longitudinal Bars
For all precast culverts, the minimum longitudinal reinforcement is always at least 0.03 in.2 / ft. at each face.
AsLmin1 = 0.03 in.2 / ft.
For precast culverts with a culvert segment length ≤ 16.0 ft, the minimum longitudinal reinforcement area
is equal to AsLmin1:
AsLmin = AsLmin1
For precast culverts with a culvert segment length > 16.0 ft., the minimum longitudinal reinforcement area
is at least as large as calculated in Section 3.5.3.2 Temperature and Shrinkage Spacing Check.
AsLmin = MAX(value from Section 3.5.3.2, AsLmin1)
3.5.1.3 Resistance Phi Factor
The relationships that apply are based on the cross-section illustrated in Figure 3.5.1.3-1.

Chapter 3 Method of Solution
3-55
d
As
b
a c
tensile force
compressive force
internallever arm
Figure 3.5.1.3-1 Singly Reinforced Section
The current AASHTO specification now reduces the phi factor based on the strain condition at the cross-
section. A reduction in the phi factor for compression-controlled sections is used to compensate for
decreased ductility in comparison to tension-controlled sections. The variant resistance phi factor is
computed by the following equation:
𝜀𝜀𝑠𝑠 = 0.003(𝑑𝑑𝑠𝑠−𝑐𝑐)𝑐𝑐
AC5.7.2.1-1
Cast-In-Place
0.75 ≤ 𝜙𝜙 = 0.75 + 0.15(𝜀𝜀𝑠𝑠− 𝜀𝜀𝑐𝑐𝑐𝑐)(𝜀𝜀𝑠𝑠𝑐𝑐− 𝜀𝜀𝑐𝑐𝑐𝑐)
≤ 0.9 A5.5.4.2.1-2
Precast
0.75 ≤ 𝜙𝜙 = 0.75 + 0.25(𝜀𝜀𝑠𝑠− 𝜀𝜀𝑐𝑐𝑐𝑐)(𝜀𝜀𝑠𝑠𝑐𝑐− 𝜀𝜀𝑐𝑐𝑐𝑐)
≤ 1.0 A5.5.4.2.1-1
where:
εt = net tensile strain in the extreme tension steel at nominal resistance (in./in.)
εcl = compression-controlled strain limit in the extreme tension steel (in./in.)
εtl = tension-controlled strain limit in the extreme tension steel (in./in.)
c = distance from extreme compression fiber to neutral axis (in.)
dt = distance from the extreme compression fiber to the centroid of the
extreme tension steel (in.)

Chapter 3 Method of Solution
3-56
3.5.2 Service Load Stress
This section describes how the stress in the rebar is evaluated. This section can be applied to all double
reinforced sections experiencing flexural and axial loads. The program always assumes the section has
cracked and determines the tensile stress in the flexural reinforcement accordingly. The actual stress is
based on the reinforced concrete section theory for a cracked section under service limit states. The
program uses an iterative process to determine the tensile stress in the reinforcement as described in the
following steps as described in the following steps.
d
As
b
XnaA’
sd’
fs
f’s
fc
fc,Xna
h
h
2M+
P+
Figure 3.5.2-1 Double Reinforced Section and Stress Locations
1. The initial Neutral Axis is located at the center of the concrete section.
2hX c =
2. The modular ratio is calculated
y
c
EE
n = rounded to the nearest whole number
3. The tensile and compressive areas of steel are then transformed
( ) csstr XbAAnA *' ++=
4. A new neutral axis is calculated based on the transformed areas
( )tr
css
na A
XbdAdAn
X 2*
**2
'' ++=
5. The moment due to eccentric loading is then calculated using the new neutral axis
−−= nause XhPMM
2*
6. The transformed moment of inertia is then calculated for the section

Chapter 3 Method of Solution
3-57
23
2**
12*
−+= na
cc
cc X
XXb
XbI
( ) ( )[ ]2''2nasnass XdAXdAnI −+−=
sctr III +=
7. The tensile and compressive stresses are calculated based on the transformed section
Tensile Steel Stress
( )
−−=
tr
nause
trs I
XdMAPnf
Compressive Steel Stress
( )
−−=
tr
nause
trs I
XdMAPnf
''
Compressive Concrete Stress at the Current Neutral Axis
( )tr
nause
trc I
XMAPf
−−=
0
Compressive Concrete Stress at Assumed Neutral Axis
( )tr
nacuse
trXc I
XXMAPf
c
−−=,
The above calculations are iterated until fc,xc approaches zero. If fc,xc a is not equal to zero within a small
tolerance a new Xc is calculated with the following equation and used starting at Step 3.
When fc,xc is less than zero
2,
,lastcc
cnewc
XXXX
−−=
When fc,xc is greater than zero
2,
,lastcc
cnewc
XXXX
−+=
Chapter 3 Method of Solution
3-58
Where:
Xc,last = Xc from the previous iteration (For first iteration set to zero)
Xc,new = Xc to be used in next iteration
M = Applied Moment from the Service Limit State
P = Applied Axial Load from the Service Limit State
Muse = Combined moment due to Applied Moment and Axial Forces
3.5.3 Serviceability Check
Serviceability is always checked since the concrete section is always considered cracked. Once the
required As has been determined, then reinforcement bar spacings are calculated for eight different bar
sizes. The program begins by computing the spacing required just to satisfy strength requirements,
rounding down to the nearest spacing increment, 0.5 inch. Then the crack control spacing for the
reinforcement is computed. If the spacing exceeds the allowable spacing as per D 5.7.3.4, then the spacing
is reduced by the spacing increment. This process continues until the spacing for the reinforcement is less
than or equal to the allowable spacing. The minimum allowed bar spacing is computed and checked against
the computed bar spacing. Next, the maximum allowed bar spacing is computed and checked against the
computed bar spacing. If the computed bar spacing is larger than the maximum allowed, then the computed
spacing is set equal to the maximum allowed.
3.5.3.1 Maximum and Minimum Allowable Spacing Check
The maximum spacing for bar sizes under a #5 are as follows:
• 12 in for a # 4 bar
The maximum spacing for bar sizes #5 or larger is checked as per D5.10.3.2 which limits spacing with
the following equation:
),*.( in18t51MINSMAX =
The minimum spacing is checked as per D5.10.3.1 which limits spacing with the following equations:
).,*.,*.( in52AggregateMax51BarDiam51MAXSMIN = for Cast-In-Place
).,*.,( in51AggregateMax331BarDiamMAXSMIN = for Precast
3.5.3.2 Temperature and Shrinkage Spacing Check
( ) y
s fhbbhA
+=
23.1
1 (in2/ft) A5.10.8-1

Chapter 3 Method of Solution
3-59
If As1 < 0.11 Then
As1 = 0.11 in2/ft
If As1 > 0.6 Then
As1 = 0.6 in2/ft
As2 = #4’s @ 12 in = 0.2 in2/ft D5.10.8.1P
Asmin1 = MAX [As1, As2]
Where:
h = least height of the component (in)
b = least width of the component (in)
BXLRFD sets the least width of the component equal to the full width of the culvert for slabs, the full
height of the culvert for walls and the width of the footing for footings as illustrated in Figure 3.5.3.1-1.
The 0.12 in2/ft requirement from D5.10.8 does not control over D5.10.8.1P as is not considered by the
BXLRFD program.
The maximum temperature and shrinkage spacing is:
• 12 in for a # 4 bar
• 18 in for a # 5 bar or greater
The spacing is specified as per D5.10.8.1P.

Chapter 3 Method of Solution
3-60
B
Top SlabPositive slope with haunch
H
B
Top SlabPositive slope without haunch
H
B
Top SlabNegative slope with haunch
H
B
Top SlabNegative slope without haunch
H
B
Strip Footings
H
Frame Culvert
H
Walls
B
H
B
H
B
Box culvert
B
Bottom SlabWith Non-Standard fish channel
H1 H2
H = Minimum(H1, H2)
B
Bottom SlabWith Standard fish channel
H1 H2
H = Minimum(H1, H2)
Figure 3.5.3.1-1 Temperature and Shrinkage Dimensions

Chapter 3 Method of Solution
3-61
3.5.3.3 Crack Control Check
The crack control is checked as per D5.7.3.4 where the spacing of the main tensile reinforcement is
checked against the result of Equation D5.7.3.4-1
csss
e df
s 2700−≤
βγ
Where γe = 0.75 for a culvert
fss = MIN( fs, 0.6*fy)
βs)(7.0
1c
c
dhd
−+=
3.5.3.4 Development Length
The development length of a hooked reinforcing bar is calculated by the program during a rigid frame
culvert design run for the wall reinforcement of the controlling face entering the strip footing.
The following equation is used to compute the required hooked development length (Ldhb ) for given bar
sizes. The actual development length is adjusted by the correction factors (mi and md), which are
described further in the next sub-section. The correction factor considers the yield strength of the
reinforcement, area of reinforcement and epoxy coating on the bar. In the equation below, ldb refers to
the development length for a given bar size (see Table 1).
Id = MAX [ 6” , (mi md ) Idhb ,8db ]
where: Id = development length (in)
Idhb = development length required for a given bar (in)
md = decreasing adjustment factor applied to development length - considers area of
steel provided and required
mi = increasing adjustment factors applied to the development length - considers
reinforcement strength and epoxy coating
ldhb = fd
c
b
'38
A5.11.2.4.1
Note: the concrete compressive strength, f'c, and steel yield stresses, fy, are specified in ksi, the bar
diameter, db, is specified in inches; bar area is specified in in2, and the development length has the units
of inches.

Chapter 3 Method of Solution
3-62
3.5.3.5 Development Length Correction Factors
The development length for hooked bars is multiplied by the following factors (A5.11.2.4.2):
mi = m1 x m2
• If the yield strength (fy) is greater than 60 ksi,
m1 = 60fy
> 1.0
• If the bar is epoxy coated
m2 = 1.2 (otherwise m2 = 1.0 for plain bars)
• Adjusts the length by the ratio:
md =AA
sact
sreq < 1.0
3.5.4 Design For Fatigue
Fatigue checks are not performed by this program in accordance with A5.5.3.1.
3.5.5 Design For Shear
Once the section is designed for flexure, the program next designs the section for shear, satisfying the
following equation:
φvVn ≥ Vu
Where:
φv = 0.85 for cast-in-place culvert
φv = 0.90 for precast culvert
The nominal shear resistance, Vn, is determined as per A5.8.3.3 and the factored load, Vu, is determined
for all strength limit state combinations as per Section 3.4 of this chapter. The φv is determined as per Table
D12.5.5-1. The fy for shear reinforcement calculations is limited to 60 ksi.
The nominal shear resistance is determined as the lesser of:
Vn = Vc + Vs
Vn = 0.25 f'c bvdv A5.8.3.3-2

Chapter 3 Method of Solution
3-63
Where Vc is the shear resistance provided by concrete and Vs is the shear resistance provided by
shear reinforcement.
The value of Vs in the above equation is calculated as follows:
Vs = Avfysinα A5.8.3.3-5
Where the maximum value of Vs is limited to:
dbf0.095 vvc' A5.8.3.3-5
The value of dv in the above equation is calculated as follows:
For Design:
𝑑𝑑𝑣𝑣 = 𝑚𝑚𝑠𝑠𝑚𝑚 (0.9 𝑑𝑑𝑛𝑛 , 0.72 ℎ) A5.8.2.9
For Analysis (DC5.8.2.9P):
𝑑𝑑𝑣𝑣 = 𝑚𝑚𝑠𝑠𝑚𝑚 �𝑑𝑑𝑛𝑛 − 𝑓𝑓𝑦𝑦𝐴𝐴𝑠𝑠
2 (0.85)𝑓𝑓𝑐𝑐′𝑏𝑏, 0.9 𝑑𝑑𝑛𝑛 , 0.72 ℎ�
Where, h is the overall member depth and the effective member depth, de, is computed based on the section
thickness minus the distance from the centroid of the tension flexure reinforcement bar to the face of the
member. For design, the centroid location is based on the largest permissible reinforcement bar or wire
size as indicated in the Material Command. For analysis, the centroid location is based on the largest
reinforcement bar or wire size as specified along the entire length of the individual wall or slab.
The value of Vc in the above equation for Vn is calculated as follows:
For walls of culverts under any fill height and slabs of culverts under less than 2.0 ft. of fill height or U-
channels, the values of Vc and Vs are calculated assuming β = 2 in the following equations:
dbf0.0316 = V vvcc 'β
For both the top slab and the bottom slab of a culvert under a height of fill 2.0 ft. or more, the value of Vc is
computed as per A5.14.5.3 using the following equations and limits:
evu
eu
ev
scc db
MdV
dbA64f0.0676 = V
+ .'

Chapter 3 Method of Solution
3-64
Where: m
d V u
eu cannot be greater than 1. Vc is calculated for all applicable limit state cases
using corresponding values of Vu and Mu, and the maximum value of Vc is limited to:
dbf0.126 evc'
The minimum value of Vc for a Single Cell Culvert with slabs monolithic with walls is limited to:
dbf0.0948 evc' The minimum value of Vc for a Single Cell Culvert with a simply supported slab is limited to:
dbf0.0791 evc'
The above minimum limits do not apply to multi-cell culverts.
Once Vc is calculated as explained above, the value of φvVc is compared with the ultimate factored shear,
Vu. If Vu is less than φ v Vc , the shear strength provided by concrete is adequate and thus the section is
adequate to resist shear. Note that depending on the controlling equation for Vc, the value of M u may, or
may not, affect the concrete shear strength.
If Vu exceeds φ vVc and a design without shear reinforcement is requested, the member thickness is
increased and the structure is reanalyzed. The procedure is repeated until the shear resistance provided
by concrete is adequate.
If Vu exceeds φvVc and a design with shear reinforcement is requested, the program calculates the
maximum shear that can be resisted by shear reinforcement, Vsreq, as follows:
V - V = V cv
usreq φ
If Vsreq calculated above exceeds Vsmax calculated as follows, Vsreq is set to Vsmax.
db ’f 0.095 = V vvcs
Vsmax = 0.25 f’c bvdv - Vc

Chapter 3 Method of Solution
3-65
If Vsreq is greater than V smax , the member thickness is increased and the structure is analyzed. The
procedure is repeated until the shear resistance is adequate.
If Vsreq is less than or equal to Vsmax, the area of shear reinforcement, Av, is computed assuming a single
bar as follows:
αsiny
sreqv f
VA =
α = the angle between the shear reinforcement and the longitudinal tension reinforcement

Chapter 3 Method of Solution
3-66
3.6 LIVE LOAD RATINGS
When live load is applicable, the program calculates the flexure and shear ratings. If live load is not applicable, the
program computes resistance/demand ratio (R/D). The ratings are computed for PHL-93, P-82, PA2016-13, ML-
80, TK527, EV2, EV3, SU6TV, HS20, and H20 Loadings. If a special live load is entered, the ratings are given for
that loading.
Live Load Rating Factors and Resistance/Demand Ratios, if live load is not applicable, are the primary indicators
of performance for the culvert. A ratio less than one indicates that the culvert is inadequate for a particular live load
or just dead load if the R/D ratio is less than one. Rating factors are computed for all strength limit states, all live
loads in the analysis and all maximum effect cases. They are computed by reverse implementation of the LRFD
limit state combination. By specifying an input value, the program is able to generate ratings with and without Future
Wearing Surface loading in a single run of the program.
3.6.1 Strength Limit State Ratings
For a given section, all strength limits state combinations are generated. The section properties and flexural
and shear reinforcement areas are known. The ratings and resistance demand ratios are computed using
the following general equations:
Effect I) + L (LEffect E) + (DL - Resistance Section = Factor Rating
Effect E) + (DLResistance Section = RatioDemandResistance /
The interaction curve for the section is constructed as explained under section 3.5.1.2. The combined
moment and axial force at a section due to dead loads and earth pressure are determined. This gives the
(DL+E) load point (shown as Point (MDL+E, PDL+E) on Figure 3.5.1.2-1). The combined moment and axial
force at a section due to dead loads, earth pressure and live load are determined. This gives the (DL+E+LL)
load point (shown as Point (MDL+E+LL, PDL+E+LL) on Figure 3.5.1.2-1). A straight line passing through the
(DL+E) point and the (DL+E+LL) point is intersected with the interaction curve (point (Mr, Pr) in Figure
3.5.1.2-1). The coordinate of this point along the moment axis of the strength curve is the moment
resistance Mr of the section.

Chapter 3 Method of Solution
3-67
All strength limit states ratings and resistance demand ratios are computed as follows:
1. Flexure Rating Factor:
MM - M - M - M - M = RF
LLIMLLIM
LSLSEHEHEVEVDLDLrM γ
γγγγ
Resistance/Demand Ratio:
M - M - M - MM = RDR
LSLSEHEHEVEVDLDL
rM γγγγ
Where,
Mr = Factored flexural resistance
MDL = Dead load moment
MEV = Vertical earth moment
MEH = Horizontal earth moment
MLS = Live load surcharge moment
MLLIM = Live load moment including dynamic allowance.
γDL = Dead load factor
γEV = Vertical earth load factor
γEH = Horizontal earth load factor
γLS = Live Load surcharge load factor
γLLIM = Live load factor
2. Shear Rating Factor:
VV - V - V - V - V = RF
LLIMLLIM
LSLSEHEHEVEVDLDLrV γ
γγγγ
Resistance/Demand Ratio:
V - V - V - VV = RDR
LSLSEHEHEVEVDLDL
rV γγγγ
Where,
Vr = Factored shear resistance
VDL = Dead load shear
VEV = Vertical earth shear
VEH = Horizontal earth shear
VLS = Live load surcharge shear
VLLIM = Live load shear including dynamic allowance.
γDL = Dead load factor

Chapter 3 Method of Solution
3-68
γEV = Vertical earth load factor
γEH = Horizontal earth load factor
γLS = Live Load surcharge load factor
γLLIM = Live load factor
The procedure to compute the rating factor for shear is iterative because Vc and consequently Vr (Vr = φvVn, Vn =
Vc + Vs, see Section 3.5.4), depends on the ratio of factored shear to factored moment, not just live load. However,
if the spacing of shear reinforcement is known (i.e., entered), Vs is calculated assuming θ = 45° in the following
equation:
s ) + (dfA = V
vyvs
ααθ sincotcot A5.8.3.3-4
The iterative procedure assumes a starting Rating Factor of 1.0. The Factored shear and moment are then
computed. Then a new Rating Factor is computed. If the Factor is not within 1%, the procedure recalculates a new
set of factored shear and moment based on the computed Rating Factors. This procedure is repeated until the final
Rating Factor is within 1% of the previous one. The procedure is limited to 100 iterations. If, after 100 iterations,
the Rating Factors between calculations in two successive iterations are not with 1%, an error will result. Or, if after
100 iterations, an oscillation between two Rating Factors is detected, then the program will step from the lower
Rating Factor to the higher Rating Factor, incrementing the assumed rating factor by 0.1 each time to determine
the point at which the calculated and the assumed rating factors converge. The smaller of the assumed and
calculated Rating Factors at the point of convergence is reported by the program. In addition to Live Load Ratings,
the program performs the serviceability analysis as explained below.
The Rating Tonnage is calculated by taking the gross weight of the design vehicle and multiplying it by the live load
rating factor. The axle loads for ML-80 and TK527 vehicles include a 3% scale tolerance. When computing the
rating tonnages for ML-80 and TK527 vehicles, the program must remove the 3% scale tolerance. The program
divides the total of all the axle loads by the 3% scale tolerance before multiplying by the rating factor to find the
rating tonnage. For special live loads the axles should be entered without the scale tolerance and the scale
tolerance should be entered separately by the user as a PERCENT INCREASE entered on the SLL command. The
program then totals the special vehicle axle loads and multiplies it by the rating factor to find the rating tonnage.

Chapter 3 Method of Solution
3-69
3.7 SERVICEABILITY CHECK
Serviceability is always checked since the concrete section is assumed to always be cracked. The allowable crack
control spacing for the reinforcement is computed as per D 5.7.3.4.
The program next checks if the crack control bar spacing is greater than the flexural bar spacing. If the actual bar
spacing is less than the allowable, the bar spacing is satisfactory, and the program checks the next bar size. Detailed
description of checks is shown in Section 3.5.3.
3.8 FATIGUE ANALYSIS
The Fatigue Analysis is no longer performed in accordance with A5.5.3.1.

Chapter 3 Method of Solution
3-70
3.9 STRIP FOOTINGS
This section describes the procedures used for the analysis and design of a strip footing used at the bottom of
external and internal walls when a bottom slab is not part of the culvert. See the discussion of the CTL command
in Section 5.5 pertaining to the bottom slab. For an Analysis, Performance Ratios are calculated instead of rating
factors. Performance ratios are resistances divided by demands, and are similar to rating factors. For a Design,
flexure reinforcement is calculated assuming zero axial force, and bar spacings determined. No shear steel is
considered for strip footings.
3.9.1 Loading
When a bottom slab is not present, the culvert is analyzed as an open, one or two bay frame with fixed
boundary conditions at the bottom of the walls. The strip footing is not part of the structural analysis, rather,
the factored effects at the bottom of the walls (total limit state axial, shear and moment), are used to obtain
soil pressures acting on the bottom of the footings. The self weight of the footing and the weight of soil
above the footing also contribute to the calculated soil pressure. The external loads acting on the footing
are used to compute internal shears and moments (see Section 3.9.3) that are subsequently used in the
calculation of the Performance Ratios (see Section 3.9.4) or to design the reinforcement (see Section 3.9.5).
Figure 1 provides definitions for a two cell culvert with strip footings. The vertical uniformly distributed
loadings, WEV and W LS are factored loadings for Vertical Earth Pressure and Live Load Surcharge. The
expressions used to calculate the loadings and those used to compute the self weight loading, WDC, are as
follows:
WEV =(ρsoil)(HEV)(γEV)max
WLS = (ρsoil )(HLS) (γLS)
WDC = (Aftg)(ρc)(γDC)max
Maximum load factors are used to factor the loadings, and the load factors are multiplied by η. The height
of fill above the center of the footing heel is used to compute WEV.
3.9.2 Foundation Pressure and Eccentricity
Figure 1 shows the forces used for calculating footing force resultants, N and M0, and the associated
eccentricity (x0 or e). N is obtained by summing the total limit state axial force in the wall (Pw), the soil
loadings (WEV and WLS) and the footing self weight.
N = Pw + (WEV + WLS) (LHeel) + (WDC)

Chapter 3 Method of Solution
3-71
The moment of those forces (PW, WEV, WLS, WDC), and of the total limit state shear and moment at the
bottom of the wall (VW, MW), is taken about Point “O” in the figure.
M0 = Pw (B/2 - ep) - Mw - Vw(tf) + (WEV + WLS) LHeel (B - LHeel /2) + WDC(B/2) Where:
ep is the distance from the center of the footing to the center of the wall
tf is the thickness of the footing
The distance from point “O" to the location of N, x0, is obtained as shown below.
x0 = M0 / N
And finally, the eccentricity of N, from the center of the footing, e, is calculated:
e = B/2 - x0
The force resultants, and the eccentricity, are calculated for all strength and service limit states, all live
loadings in those limit states, and all six maximum effect cases.
Figure 2 shows the pressure distribution for calculating the left and right edge soil pressures, qL and qR, for
the case when the resultant, N, is within the middle third of the footing (i.e., |e| ≤ B / 6).
Figure 3 shows the pressure distribution when the resultant is outside the middle third (i.e.,|e| > B/6). The
left and right edge pressures for cases a and b as shown in figure are as follows:
12B
2BNe
- BN = q 3R

Chapter 3 Method of Solution
3-72
WEV
WLS
WEV
WLS
Hfill
HEV
HEV
Soil Slope
TS Slope
LHeel
LToe
LHeel
2
Figure 3.9.1-1 Strip Footing Definitions And Loads
LHeel
ep tf
x0 eN
B/2
B
B/2
( WEV + WLS )Mw
Pw
Vw
O
Figure 3.9.2-1 Strip Footing Force Resultants and Eccentricity

Chapter 3 Method of Solution
3-73
X0 e
qL
qR
B
N
CL Footing
Figure 3.9.2-2 Strip Footing Soil Pressure Distribution When The Resultant Is In The Middle Third
12B
2BNe
+ BN = q 3L
Bc = B
Case a: e > 0
x32N = q
0L qR = 0
Bc = 3x0
Case b: e < 0
qL = 0
( )x - B 32N = q
0R
Bc = 3(B - x0)

Chapter 3 Method of Solution
3-74
CL Footing
x0 e
N
Bc
B
qL
CL Footing
N
x0e
Case a: e > 0
Case b: e < 0
B
Bc
Figure 3.9.2-3 Strip Footing Soil Pressure Distribution When Resultant Not In Middle Third

Chapter 3 Method of Solution
3-75
X0 e
qb
Be
N
CL Footing
Figure 3.9.2-4 Strip Footing Settlement Pressure, qb, for soil
Figure 4 shows the settlement pressure, qb, which is used for reporting only. BXLRFD assumes the
footing is always founded on Soil.
Be = 2X0
BN = q
eb
Where:
Be is the distance over which qb is applicable
3.9.3 Forces at Critical Sections
Once the soil pressure is known, the internal shears and moments can be obtained. They are computed
using simple statics and for the POIs shown in Figure 1. The POIs shown in the figure are classified as
indicated. Shear is checked at the face of the wall if there is tension in the top of the footing. Shear is
checked at a distance d from the face of wall if the top of the footing is in compression.

Chapter 3 Method of Solution
3-76
Figure 2 shows the loads for computing the shears and moments. These include distributed loads, i.e., soil
pressure, WEV, WLS and WDC, and concentrated loads for a given limit state from the bottom of the wall,
i.e., Pw, Vw, and Mw. The following notation is used in the equations show in this section:
qa is the starting value of a soil loading.
qb is the ending value of a soil loading.
V2 is the shear at a section within a loading.
V3 is the shear at a section past a loading.
M2 is the moment at a section within a loading.
M3 is the moment at a section past a loading.
The equations are as follows:
Forces from distributed loads (soil pressure, EV, LS, DC)
At Section 2 (da > d2 > db)
d - dd - d = r
ab
a2
( ) ( )d - d 2
rq qr+ q - = V abaa
221
+−
( ) ( )3
d - d 2
q - rq + q r) - (1 +
2 d - d q = M a2
2abaa2
2a
2
At Section 3 (d3 > db)
( )d - d 2
q + q - = V abba
3
( ) ( ) ( ) ( )
d - d
32 + d - d
2d - d q - q +
2d + d - d d - d q = M aba3
ababba3aba3

Chapter 3 Method of Solution
3-77
V/M V/MV V
dL dRdL dR
- Consider POI For Shear Only
- Consider POI For Moment Only
- Consider POI For Shear And Moment
POIs at faces are considered for shear only if the moment is negative (tensionin top face).
V
M
V/M
Note:
- Locations of POIs
Figure 3.9.3-1 POI Locations and Type Definitions for Strip Footings
db
d3
tfM3
V3
VM
P
Mw
Pw
Vw
Positive Forces From Wall Bottom
da
M2V2
d2
dL
qa qb
Figure 3.9.3-2 Strip Footing Shear And Moment

Chapter 3 Method of Solution
3-78
Actions from concentrated loads (Pw, Vw, Mw):
At Section 2 (d2 ≤ dL)
V2 = 0
M2 = 0
At Section 3 (d3 > dL)
P = -Vw
V = Pw
M = Mw
V3 = -V
M3 = -(M - Ptf) + V(d3 - db)
3.9.4 Section Resistance and Performance Ratios
For an Analysis run, Performance Ratios are calculated, instead of rating factors. Performance Ratio is the
ratio of Section Resistance to Factored Forces acting at a section. The demands are the shears and
moments calculated as discussed in Section 3.9.3, and the capacities (resistances) are calculated as
follows (Minimum/Maximum rebar spacings are also calculated in an Analysis run.).
Moment Resistance (Mr):
Mr = 𝜙𝜙M0
𝑀𝑀0 = 𝐴𝐴𝑠𝑠𝑓𝑓𝑠𝑠 � 𝑑𝑑 −𝐴𝐴𝑠𝑠 𝑓𝑓𝑠𝑠
2�0.85 𝑓𝑓𝑐𝑐′ 𝑏𝑏� �
The resistance factor, 𝜙𝜙, is computed considering strain compatibility when appropriate, as shown below.
The 𝜙𝜙 limit is 0.9 for cast-in-place culverts and 1.0 for precast culverts.
With the known area of steel the quadratic equation is solved for the moment resistance, M0, with 𝜙𝜙 equal
to the 𝜙𝜙 limit and assuming the stress in the reinforcement steel, fs, is equal to the specified minimum
yield strength, fy.

Chapter 3 Method of Solution
3-79
The net tensile strain and the stress in the reinforcement is computed from the following:
𝑐𝑐 = 𝐴𝐴𝑠𝑠 𝑓𝑓𝑠𝑠
0.85 𝑓𝑓𝑐𝑐′ 𝛽𝛽1 𝑏𝑏
ɛ𝑠𝑠 = 0.003 �𝑑𝑑𝑠𝑠𝑐𝑐− 1�
𝑓𝑓𝑠𝑠 = 𝑚𝑚𝑚𝑚𝑚𝑚�ɛ𝑠𝑠 · 𝐸𝐸𝑠𝑠 , 𝑓𝑓𝑦𝑦�
If the mild steel stress, fs, is less than the yield strength, fy, then the initial assumption was incorrect and the
nominal flexural resistance is determined based on conditions of equilibrium and strain compatibility.
The resistance factor 𝜙𝜙 is computed with the net tensile strain using the equation:
0.75 ≤ 𝜙𝜙 = 0.75 + 0.15(𝜀𝜀𝑠𝑠− 𝜀𝜀𝑐𝑐𝑐𝑐)(𝜀𝜀𝑠𝑠𝑐𝑐− 𝜀𝜀𝑐𝑐𝑐𝑐)
≤ 0.9 (for CIP)
0.75 ≤ 𝜙𝜙 = 0.75 + 0.25(𝜀𝜀𝑠𝑠− 𝜀𝜀𝑐𝑐𝑐𝑐)(𝜀𝜀𝑠𝑠𝑐𝑐− 𝜀𝜀𝑐𝑐𝑐𝑐)
≤ 1.0 (for Precast)
where:
𝜀𝜀𝑐𝑐𝑐𝑐 = 𝑐𝑐𝑐𝑐𝑚𝑚𝑐𝑐𝑐𝑐𝑐𝑐𝑐𝑐𝑐𝑐𝑚𝑚𝑐𝑐𝑚𝑚˗𝑐𝑐𝑐𝑐𝑚𝑚𝑐𝑐𝑐𝑐𝑐𝑐𝑐𝑐𝑐𝑐𝑐𝑐𝑑𝑑 𝑐𝑐𝑐𝑐𝑐𝑐𝑠𝑠𝑚𝑚𝑚𝑚 𝑐𝑐𝑚𝑚𝑚𝑚𝑚𝑚𝑐𝑐, 0.002
𝜀𝜀𝑠𝑠𝑐𝑐 = 𝑐𝑐𝑐𝑐𝑚𝑚𝑐𝑐𝑚𝑚𝑐𝑐𝑚𝑚˗𝑐𝑐𝑐𝑐𝑚𝑚𝑐𝑐𝑐𝑐𝑐𝑐𝑐𝑐𝑐𝑐𝑐𝑐𝑑𝑑 𝑐𝑐𝑐𝑐𝑐𝑐𝑠𝑠𝑚𝑚𝑚𝑚 𝑐𝑐𝑚𝑚𝑚𝑚𝑚𝑚𝑐𝑐, 0.005
Finally, the factored flexural resistance is computed by multiplying the nominal flexural resistance by 𝜙𝜙. If
the computed 𝜙𝜙 factor is less than 0.90 (CIP) or 1.0 (Precast), then the process is repeated with 𝜙𝜙 assumed
to be 0.75 and a second moment resistance is computed. Using the second moment resistance a new
factored flexural resistance is computed. If the second moment resistance is less than the applied factored
moment then the cross section is considered inadequate; otherwise, the phi factor is iterated until the
assumed phi factor is equal to the computed phi factor. For analysis, the inadequate resistance is reported.

Chapter 3 Method of Solution
3-80
Shear Resistance (Vr ):
Vr = 𝜙𝜙 vVc
(US) db ’f 0. = V vvcc β316
Where:
β = 2
dv = See Section 3.5.4 for calculation of dv
3.9.5 Reinforcement Design
For a Design run, flexure reinforcement and rebar spacings are calculated. Shear reinforcement is not
considered, and the thickness of the footing is not changed. The design of the flexure reinforcement is
accomplished by solving the following quadratic equation with phi, 𝜙𝜙, assumed to be 0.90 (CIP) or 1.00
(Precast) for all limit states, all flexure maximum effect cases, and all points-of-interest. Note that in this
case, As is based on moment only, not moment and axial effects.
𝑓𝑓𝑦𝑦2
2 (0.85)𝑓𝑓𝑐𝑐′ 𝑏𝑏𝐴𝐴𝑠𝑠2 − 𝑓𝑓𝑦𝑦𝑑𝑑𝑠𝑠𝐴𝐴𝑠𝑠 +
|𝑀𝑀𝑈𝑈𝑈𝑈|∅
= 0
where:
𝐴𝐴𝑠𝑠 = −𝑏𝑏𝑐𝑐𝑝𝑝𝑛𝑛𝑓𝑓 ± �𝑏𝑏𝑐𝑐𝑝𝑝𝑛𝑛𝑓𝑓2 − 4𝑠𝑠𝑐𝑐𝑝𝑝𝑛𝑛𝑓𝑓𝑐𝑐𝑐𝑐𝑝𝑝𝑛𝑛𝑓𝑓
2𝑠𝑠𝑐𝑐𝑝𝑝𝑛𝑛𝑓𝑓
𝑠𝑠𝑐𝑐𝑝𝑝𝑛𝑛𝑓𝑓 = 𝑓𝑓𝑦𝑦2
2(0.85)𝑓𝑓𝑐𝑐′𝑏𝑏
𝑏𝑏𝑐𝑐𝑝𝑝𝑛𝑛𝑓𝑓 = −𝑓𝑓𝑦𝑦𝑑𝑑𝑠𝑠
𝑐𝑐𝑐𝑐𝑝𝑝𝑛𝑛𝑓𝑓 = 𝐴𝐴𝐴𝐴𝑆𝑆 �𝑀𝑀𝑐𝑐∅�
MUT = the total factored moment
The nominal moment resistance is computed with the assumption that fs is equal to fy in the following equations:
𝑐𝑐 =𝐴𝐴𝑠𝑠𝑓𝑓𝑠𝑠
0.85𝑓𝑓𝑐𝑐′𝛽𝛽1𝑏𝑏
𝑠𝑠 = 𝛽𝛽1𝑐𝑐
𝑀𝑀𝑠𝑠 = 𝐴𝐴𝑠𝑠𝑓𝑓𝑠𝑠 �𝑑𝑑 −
𝑠𝑠2�
where: c = distance from the extreme compression fiber to the neutral axis (in)
As = area of tension reinforcement (in2)
fs = stress in mild steel tension reinforcement at nominal flexural resistance (ksi)
𝑓𝑓𝑐𝑐′ = Concrete design strength (ksi)
𝛽𝛽1 = ratio of the depth of the equivalent uniformly stressed compression zone to the depth

Chapter 3 Method of Solution
3-81
of the actual compression zone
b = width of the compression face of the member (in)
a = depth of equivalent rectangular stress block (in)
Mn = nominal flexural resistance (in-kips)
d = distance from compression face to centroid of tension reinforcement (in)
The net tensile strain and the stress in the reinforcement is computed from the following:
𝜀𝜀𝑠𝑠 = 0.003 �𝑑𝑑𝑠𝑠𝑐𝑐− 1�
𝑓𝑓𝑠𝑠 = 𝑚𝑚𝑚𝑚𝑚𝑚�𝜀𝜀𝑠𝑠 ∙ 𝐸𝐸𝑠𝑠 , 𝑓𝑓𝑦𝑦�
where: 𝜀𝜀𝑠𝑠 = net tensile strain in extreme tension steel at nominal resistance (in/in)
ds = distance from extreme compression fiber to the centroid of the nonprestressed tensile
reinforcement (in)
Es = modulus of elasticity of reinforcing bars (ksi)
fy = specified minimum yield strength of reinforcing bars (ksi)
If the mild steel stress, fs, is less than the yield strength, fy, than the initial assumption was incorrect and
the nominal flexural resistance is determined based on conditions of equilibrium and strain compatibility.
The resistance factor phi is computed with the net tensile strain using the following equation:
0.75 ≤ 𝜙𝜙 = 0.75 + 0.15(𝜀𝜀𝑠𝑠− 𝜀𝜀𝑐𝑐𝑐𝑐)(𝜀𝜀𝑠𝑠𝑐𝑐− 𝜀𝜀𝑐𝑐𝑐𝑐)
≤ 0.9 (for CIP)
0.75 ≤ 𝜙𝜙 = 0.75 + 0.25(𝜀𝜀𝑠𝑠− 𝜀𝜀𝑐𝑐𝑐𝑐)(𝜀𝜀𝑠𝑠𝑐𝑐− 𝜀𝜀𝑐𝑐𝑐𝑐)
≤ 1.0 (for Precast)
where: 𝜀𝜀𝑐𝑐𝑐𝑐 = compression-controlled strain limit, 0.002
𝜀𝜀𝑠𝑠𝑐𝑐 = tension-controlled strain limit, 0.005
Finally, the factored flexural resistance is computed by multiplying nominal flexural resistance by phi. If the
computed phi factor is less than 0.90, then the process is repeated with phi assumed to be 0.75 and a
second steel area is computed from the quadratic equation. Using the second steel area a new factored
flexural resistance is computed. If the new factored flexural resistance is less than the applied factored
moment then the cross section is considered inadequate and the section depth is incremented and the
process is repeated. Otherwise, an iterative procedure is used to find an area of steel that results in a
factored flexural resistance that equals (within a tolerance) the applied factored moment.
If the resulting reinforcement is less than the minimum then the required As is set to the minimum steel.
Refer to Section 3.5.1.2 for calculation of minimum steel.

Chapter 3 Method of Solution
3-82
3.10 FOUNDATION PRESSURE FOR BOX CULVERTS AND U-CHANNELS
This section discusses how the pressure in the soil under the centerline of external and internal walls of a box
culvert and U-channel is calculated. Foundation pressure is computed for both an Analysis and a Design.
Foundation pressure is calculated for Strength and Service limit states.
The procedure uses the distributed reaction loadings computed on the bottom slab for all LRFD vertical dead and
earth loadings, i.e., DC, DW, OV, EV and WA as applicable for structure type. See Section 3.3 in this chapter for
a discussion of how these loads are applied. The expressions used to compute WA and the DC of the bottom slab
is presented in this section since they are not needed to analyze/design the structure components.
The program next generates vertical soil pressure influence lines for pressures under the centerlines of external
and internal walls. It does this by making use of the distributed reaction loading associated with the point loads
used to generated influence lines. See discussion of how influence lines are generated in this chapter. In
calculating a vertical soil pressure influence line ordinate at a given location, e.g., the left external wall, the pressure
under the interior wall (if present) and the right external wall are saved as associated values.
Pressures due to dead and earth loadings and vertical soil pressure influence lines are computed at the centerline
of the two external walls, and the centerline of the internal wall for two-cell culverts. The influence lines are loaded
identically to the axial, shear and moment influence lines generated for the other culvert components, e.g., top slab,
to produce raw truck and thru fill live load responses, and also lane response. Next, live load envelopes are
computed without dynamic load allowance as per D3.6.2.2, and finally, limit state load effects as described in
Section 3.4.
The vertical influence line pressures are computed for dead loads and live loads under the wall in question and the
corresponding pressures are saved for the other walls. The dead load vertical influence line pressure is applied to
a free body diagram of the bottom of footing and the moment and vertical force is computed. The same is done
with the live load vertical influence line pressure to obtain the moment and vertical force for the live load vertical
influence line pressures. Next, the DL and LL moments and vertical loads are totaled and an equivalent vertical
load (P) and eccentricity (e) is computed.
The equivalent vertical load (P) and eccentricity (e) are then used in the following equations to obtain the maximum
and minimum corresponding bearing pressures under the maximized current wall for each load and limit state.

Chapter 3 Method of Solution
3-83
( )
( )
( )
e32L3L
onDistributiessureTriangularLengthFoundationEffective
0q
e2L3
P2q
onDistributiessureTriangular2Le
6Lfor
Le61
LPq
Le61
LPq
onDistributiessurelTrapezoida6Lefor
eff −=
=
−
=
<≤
−=
+=
<
Pr
Pr
Pr
min
max
min
max
3.10.1 Self Weight for Bottom Slab
This section discusses how BXLRFD computes the LRFD load response, DC, for the bottom slab. This
loading is not needed to analyze/design the main culvert components, so it is only done in order to compute
the soil foundation pressure. The bottom slab DC load response in the soil is calculated simply by
multiplying the thickness of the bottom slab by the density of the reinforced concrete. If there is a fish
channel, the thickness of the bottom slab at the low point is used.

Chapter 3 Method of Solution
3-84
3.10.2 Pressure Due to Water, WA
This loading is not needed to analyze/design the main structure components, so it is only done in order to
compute the soil foundation pressure. When a fish channel is present the area of the fish channel is
subtracted from the area of the cell when the water weight is calculated. A load factor of 1.0 is used for all
limit states. The soil pressure, W, is calculated by the following expression:
( )L
ASHN W wfc cell γ−=
Where:
N cell = number of cells
S = clear span of culvert openings
H = clear height of culvert opening
Afc = area of the fish channel
γW = density of water
g = gravitational acceleration
L = distance between centerline of exterior walls

Chapter 3 Method of Solution
3-85
3.11 EDGE BEAM DESIGN
The BXLRFD program does not automatically design or analyze an edge beam, if one is required per DM-
4 Section 12.11.2.1. The user is responsible for determining if an edge beam design is required and if so,
the user must make a second (edge beam) run of the program using the length along the skewed side of
the culvert as the span length. The top slab moments from the edge beam run (1’ strip width) should then
be multiplied by the “equivalent strip width” calculated by the program, ELAT, Section 7.6.6 and divided by
the edge width (AASHTO Section 4.6.2.1.4b) and the result should then be used to design the
reinforcement for the edge beam shown in DM-4 Figure 12.6.2.2.5-1P.

Chapter 3 Method of Solution
3-86
This page is intentionally left blank.

4-1
4. GETTING STARTED 4.1 INSTALLATION
This program is delivered via download from the Department's website. Once payment has been received by
PennDOT you will receive a confirmation e-mail with instructions on how to download the software. The download
file is a self-extracting installation file for the licensed PennDOT engineering software. The engineering program
runs as a 32-bit application and is supported on Windows 7, Windows 8.1 and Windows 10 operating systems
(32 and 64 bit versions).
Your license number, license key and registered company name, found in the e-mail received from the Department,
are required to be entered when installing the program and must be entered exactly as shown in the e-mail. The
license number, license key and registered company name will also be needed when requesting future versions of
the program (i.e., enhancements, modifications, or error corrections), and requesting program support. A backup
copy of the program download and e-mail instructions should be made and used for future installations. You may
want to print the software license agreement, record the license number, license key and registered company name
and keep it in a safe place.
To install the program, follow the installation instructions provided with the original e-mail from the Department.
The following files will be installed in the program destination folder, which defaults to “C:\Program
Files\PennDOT\BXLRFD v<version number>\” or "C:\Program Files (x86)\PennDOT\BXLRFD v<version
number>\" for 64-bit operating systems::
1. BXLRFD.exe, BXLRFD_DLL.dll - Executable program and Dynamic Link Library.
2. BXLRFD.pd - Parameter definition file.
3. BXLRFD Users Manual.pdf - Program User’s Manual (PDF Format).
4. BXLRFDRevReq.dot - Revision Request form (MS Word template).
5. GettingStarted.pdf - A document describing installation and running of the
- program
6. LicenseAgreement.pdf - The program license agreement
7. MSVCR71.dll - Runtime Dynamic Link Libraries
The program example problem files (ex*.dat) will be installed in the program example folder, which defaults to
“C:\PennDOT\ BXLRFD v<version number> Examples\”. Users must have write access in order to run the input
files from this folder.

Chapter 4 Getting Started
4-2
4.2 PREPARING INPUT
The program requires an ASCII input file. The input file consists of a series of command lines. Each command line
defines a set of input parameters that are associated with that command. A description of the input commands can
be found in Chapter 5 of the User’s Manual. The input can be created using Engineering Assistant, described below
or any text editor.

Chapter 4 Getting Started
4-3
4.3 ENGINEERING ASSISTANT
The Engineering Assistant (EngAsst) is a Windows application developed by the Pennsylvania Department of
Transportation (PennDOT) to provide a graphical user interface (GUI) for PennDOT’s engineering programs.
The data for the input to the engineering program is presented in a user-friendly format, reflecting the implied
structure of the data, showing each record type on a separate tab page in the display and showing each field on
each record with a defining label.
With EngAsst the user can create a new input file, modify an existing input file, import input files, run the associated
engineering program and view the output in a Windows environment. The help and documentation are provided,
including text descriptions of each field, relevant images, and extended help text at both the record/tab level and
the field level. Access to all parts of the Engineering Program User’s Manual, where available, is also provided
within EngAsst.
EngAsst is not included with this software. It requires a separate license that can be obtained through the
Department’s standard Engineering Software licensing procedures. Order forms can be obtained from program
support website at http://penndot.engrprograms.com

Chapter 4 Getting Started
4-4
4.4 RUNNING THE PROGRAM WITHOUT ENGASST
BXLRFD is a FORTRAN console application program. It may be run from a command window, by double-clicking
on the program icon from Windows Explorer, by selecting the shortcut from the Start menu under PennDOT
BXLRFD vx.x.x.x subfolder, or by double-clicking the shortcut icon on the desktop. To run the program in a
command window, the user must specify the directory in which the program has been installed or change to the
directory.
The program will prompt for an input file name, and the user should then enter the appropriate input file name. The
input file must be created before running the program. The program will then prompt for whether the output should
be reviewed on the screen. The user should enter Y if the output is to be reviewed on the screen after execution
or N if the output is not to be reviewed on the screen. The program will then prompt for the name of the output file
in which the output is to be stored, and the user should then enter the desired output file name. If a file with the
specified output file name already exists, the program will ask the user whether to overwrite the existing file. The
user should enter Y if the existing file is to be overwritten or N if the existing file is not to be overwritten. If the user
enters N to specify that the existing file is not to be overwritten, the program will prompt the user for another output
file name. The program will then execute.
To cancel the program during execution, press <Ctrl C> or <Ctrl Break>, and then press <Enter>.
When the program completes execution, the user is prompted to “Press <ENTER> to exit program.” This allows
the user to view the last messages written to the screen when the program was started by double-clicking on the
program icon from Windows Explorer.
The user can view the *.OUT output file with a text editor and the *.PDF output file with Adobe Acrobat.

5-1
5. INPUT DESCRIPTION
5.1 INPUT DATA REQUIREMENTS
Before running the Box Culvert Design and Rating program, the user must create an input file. The input file consists
of a series of command lines. Each command line defines a set of input parameters that are associated with that
command. The program interprets each command line and checks the input parameters to insure that the input
data is of the correct type and within the allowable ranges set by the program.
The syntax of a command line is given as:
KWD parm1, parm2, , , parm5, ,
Where, KWD is a 3 character keyword representing a command and,
parm1, parm2... are the parameter values associated with KWD.
If a command line begins with an exclamation point (!), then it is treated as a comment line that is not used by the
program. Comment lines can be inserted by the user to provide descriptions and clarifications. The following are
two examples of a comment line:
! The Following Command is used to specify the top slab reinforcing.
! Top Slab Reinforcement Area is for #11 @ 24 inches
To temporarily make a command line void, the user can use an exclamation point (!) to transform the command line
into a comment line. For an input line to be treated as a comment line, the exclamation point must be put in column
one of the input line. For example, in the following case, the program will use the input data on the second line, but
will not use the input data on the first line:
! MAT 3.5, 4.0, 40.0, B, 45.0, 11
MAT 5.0, 4.0, 40.0, B, 45.0, 11
A command line must not exceed 256 characters in length. Command lines can be continued on any number of
data lines in the input file by placing a hyphen (-) at the end of each data line to be continued, and by placing any
remaining parameters on the following lines starting in column 4 of each continuation line. The limit of 256
characters includes all characters and parameters on all continuation lines of a given command line. Some

Chapter 5 Input Description
5-2
commands are repeatable and some commands have parameters or groups of parameters that are repeatable.
When parameters are repeatable, the user has the option of repeating the parameters in a single command or
repeating the command. For example, the BSA (Bottom Slab Reinforcement Areas) command has Range Distance
and Reinforced Area as repeatable parameters. The user could enter the Range Distance and Reinforced Area
two times on one command and one time on another command, or one time on a single command.
BSA 1, T, 3.0, 0.25 4.5, 0.33
BSA 1, T, 7.2, 0.11
or
BSA 1, T, 3.0, 0.25, 4.5, 0.33, 7.2, 0.11
Groups of repeatable parameters, such as Range Distance and Reinforced Area, must stay together in a command
line unless a continuation character (-) is used. That is, a command cannot end with a Range Distance input and
continue using another BSA command having the Reinforced Area input. When a continuation character is used,
the repeatable data can be separated on two lines. The program reads all continuation lines as one command. For
example,
Incorrect input:
BSA 1, T, 3.0, 0.25, 4.5, 0.33, 7.2
-0.11
Correct input:
BSA 1, T, 3.0, 0.25, 4.5, 0.33, -
7.2, 0.11
The first three columns of each command line are reserved for keywords that define the command type. Columns
4 through 256 are to be used to input the parameters associated with a command. One or more spaces are
recommended between the keyword and the input parameters to improve readability.
The parameters associated with each command must be entered in the order they appear in the command
description tables. The user must place commas to separate the parameters on the command line. Blank spaces
cannot be used to separate parameters. The parameter field width is not restricted; however, the total number of
characters cannot exceed 256.

Chapter 5 Input Description
5-3
The default value for a parameter is assigned by the program by placing a comma without any value for the
parameter. For example, in the command syntax example shown below, the default values will be assigned to
parameters parm3 and parm4.
KWD parm1, parm2, , , parm5
If the user places a comma and there is no default value, the program will return an error status. If a comma is
entered after the command keyword, the program will assign the default value to the first parameter. If the user
does not enter all the parameters for a command, the program will assign default values for those parameters not
entered. That is, the user is not required to place commas at the end of a command line. If the above example
required 7 parameters, parm6 and parm7 would also be assigned default values by the program.
The default values are stored in a parameter file which can be changed by the Department’s system manager. The
parameter file stores the parameter description, type of data, units, upper limit, lower limit, error or warning status
if the upper or lower limits are exceeded, and the default value for each parameter.
Any numerical value, within the upper and lower limits, can be entered for a parameter. The status codes, shown
in parentheses below the lower and upper limits, indicate the status if an input item exceeds the lower or upper
limits. The status code, (E), indicates an error. The status code, (W), indicates a warning.
In the following sections, all available commands and associated parameters are described with two tables for each
command. The first table contains the keyword for a particular command along with a description of the command.
The second table gives all the parameters associated with the given command, parameter description, units, limits
and default values.
The program will process all input and will check for errors and warnings. If the number of errors exceed 25 during
input processing, the program will terminate immediately. After all input is processed, the program checks if any
errors were found. If an error was found, the program will terminate. If warnings are found, the program will continue
to process. If the number of warnings exceed 200 during input processing for a single run, the program will terminate
immediately. The user should review all warnings in the output file to insure that the input data is correct. Warnings
are an indication that the input value has exceeded normally acceptable limits for that parameter.
For parameters which are defined in ranges (such as top slab reinforcement, bottom slab reinforcement, wall
reinforcement) the ranges cannot overlap.

Chapter 5 Input Description
5-4
5.2 ORDER OF COMMANDS
If the user wants to control the number of lines printed on a page or the number of lines to be left blank at the top
of each page, the CFG (configure) command should be the first command. The CFG command is optional and the
program will use default values if the CFG command is not entered. The first required command is the TTL (title)
command which is printed in the header at the top of each output page. A maximum of ten TTL commands are
printed on the first page of the output. The second required command after the title commands is the CTL (control)
command. The CTL command includes major control parameters, such as number of cells, type of run, precast of
cast-in-place, bottom slab, and top slab support.
The remaining commands can be entered in any order, provided certain parameters for a given command have
been entered previously. For example, the reinforcement type is defined by specifying the reinforcement type
parameter in the MAT (material) command. Since the reinforcement type is required to be defined in order to select
the appropriate reinforcement size or wire diameter on the TSR (Top Slab Reinforcement) command, the MAT
command must precede the TSR command. The program will return an error status if a command required data
that has not been previously entered.
The recommended order of commands is shown in Table 1. The commands are shown in alphabetical order in
Table 2. The section headings in these tables refer to the section number of this chapter where these commands
are described. Figure 1 shows the overall view of the typical input file with these commands.

Chapter 5 Input Description
5-5
TTL
CFG
CTL
SID
MAT
DIM
FTG
LDC
SLL
Configuration
Title
Control
Structure Identification
Material
Dimension
Footing
Special Live Loading
Special Axle Load
Load Control
HCH Haunch
Fish Channel
A
Top Slab Reinforcement Areas
OIN
Top Slab Reinforcement
Bottom Slab Reinforcement Areas
Bottom Slab Reinforcement
Wall Reinforcement Areas
Wall Reinforcement
Top Slab Shear Reinforcement Areas
Bottom Slab Shear Reinforcement Areas
Output of Input
SAL
FSH
TSR
BSA
BSR
WLA
WLR
FTA
BVA
WVA
A
Footing Reinforcement Areas
FTR Footing Reinforcement
TVA
OUR
OUI
Output of Results
Output of Intermediate Data
CVR
TSA
Covers
Wall Shear Reinforcement Areas
Figure 5.2-1 Overall View of Input File

Chapter 5 Input Description
5-6
Table 5.2-1 Recommended Order of Commands
Command
Command
Description
Comments/Requirements
Section
No.
CFG Configuration
Optional for both design and analysis
5.3
TTL
Title
At least one TTL command required for both design and analysis
5.4
CTL
Control
Required before other structure commands for both design and analysis
5.5
SID
Structure Identification
Required only for APRAS runs
5.6
MAT
Material
Required for both design and analysis
5.7
DIM
Dimensions
Required for both design and analysis
5.8
FTG
Footing
Required for both design and analysis only if CTL parameter specifies bottom slab is not present
5.9
LDC
Load Control
Required for both design and analysis
5.10
SLL
Special Live Loading
Required only for analysis with special live loading; not used for design
5.11
SAL
Special Axle Load
Required with SLL command only for analysis with special live loading; not used for design
5.12
HCH
Haunch
Optional for both design and analysis
5.13
FSH
Fish Channel
Optional for both design and analysis
5.14
CVR
Covers
Required for both design and analysis
5.15
TSA
Top Slab Reinforcement Areas
Optional only for analysis; not used for design; either TSA or TSR can be used, not both
5.16
TSR
Top Slab Reinforcement
Optional only for analysis; not used for design; either TSA or TSR can be used, not both
5.17
BSA
Bottom Slab Reinforcement Areas
Optional only for analysis; not used for design; either BSA or BSR can be used, not both
5.18
BSR
Bottom Slab Reinforcement
Optional only for analysis; not used for design; either BSR or BSA can be used, not both
5.19
WLA
Wall Reinforcement Areas
Optional only for analysis; not used for design; either WLA or WLR can be used, not both
5.20
WLR
Wall Reinforcement
Optional only for analysis; not used for design; either WLR or WLA can be used, not both
5.21
FTA
Footing Reinforcement Areas
Optional for both design and analysis with FTG command; either FTA or FTR can be used, not both
5.22
FTR
Footing Reinforcement
Optional for both design and analysis with FTG command; either FTR or FTA can be used, not both
5.23

Chapter 5 Input Description
5-7
Table 5.2-1 Recommended Order of Commands (Cont.)
Command
Command
Description
Comments/Requirements
Section
No.
TVA Top Slab Shear Reinforcement Areas
Optional only for analysis; not used for design
5.24
BVA Bottom Slab Shear Reinforcement Areas
Optional only for analysis; not used for design
5.25
WVA Wall Shear Reinforcement
Areas
Optional only for analysis; not used for design
5.26
OIN
Output of Input
Optional for both design and analysis
5.27
OUR
Output of Results
Optional for both design and analysis
5.28
OUI
Output of Intermediate Data
Optional for both design and analysis
5.29
Note: Design means DR, DA, or DC runs. Analysis means AR runs. See CTL command, Parameter 3.

Chapter 5 Input Description
5-8
Table 5.2-2 Commands in Alphabetical Order
Command
Command Description
Comments/Requirements
Section No.
BSA
Bottom Slab Reinforcement Areas
Optional only for analysis; not used for design; either BSA or BSR can be used, not both
5.18
BSR
Bottom Slab Reinforcement
Optional only for analysis; not used for design; either BSR or BSA can be used, not both
5.19
BVA
Bottom Slab Shear Reinforcement Areas
Optional only for analysis; not used for design
5.25
CFG
Configuration
Optional for both design and analysis
5.3
CTL Control
Required before other structure commands for both design and analysis
5.5
CVR
Covers
Required for both design and analysis
5.15
DIM Dimensions
Required for both design and analysis
5.8
FSH Fish Channel
Optional for both design and analysis
5.14
FTA Footing Reinforcement Areas
Optional for both design and analysis with FTG command; either FTA or FTR can be used, not both
5.22
FTG
Footing
Required for both design and analysis only if CTL parameter specifies bottom slab is not present
5.9
FTR
Footing Reinforcement
Optional for both design and analysis with FTG command; either FTR or FTA can be used, not both
5.23
HCH
Haunch
Optional for both design and analysis
5.13
LDC Load Control
Required for both design and analysis
5.10
MAT Material
Required for both design and analysis
5.7
OIN Output of Input
Optional for both design and analysis
5.27
OUI Output of Intermediate Data
Optional for both design and analysis
5.29
OUR Output of Results
Optional for both design and analysis
5.28
SAL Special Axle Load
Required with SLL command only for analysis with special live loading; not used for design
5.12
SID
Structure Identification
Required only for APRAS runs
5.6
SLL Special Live Loading
Required only for analysis with special live loading; not used for design
5.11
TSA
Top Slab Reinforcement Areas
Optional only for analysis; not used for design; either TSA or TSR can be used, not both
5.16
TSR
Top Slab Reinforcement
Optional only for analysis; not used for design; either TSA or TSR can be used, not both
5.17
TTL
Title
At least one TTL command required for both design and analysis
5.4

Chapter 5 Input Description
5-9
Table 5.2-2 Commands in Alphabetical Order (Cont.)
Command
Command Description
Comments/Requirements
Section No.
TVA
Top Slab Shear Reinforcement Areas
Optional only for analysis; not used for design
5.24
WLA Wall Reinforcement Areas
Optional only for analysis; not used for design; either WLA or WLR can be used, not both
5.20
WLR
Wall Reinforcement
Optional only for analysis; not used for design; either WLR or WLA can be used, not both
5.21
WVA
Wall Shear Reinforcement Areas
Optional only for analysis; not used for design
5.26
Note: Design means DR, DA, or DC runs. Analysis means AR runs. See CTL command, Parameter 3.

Chapter 5 Input Description
5-10
5.3 CFG - CONFIGURATION COMMAND
KEYWORD
COMMAND DESCRIPTION
CFG
CONFIGURATION - This command is used to set the control parameters for the characteristics of the printed output. An input file can have only one configuration command.
PARAMETER
DESCRIPTION
UNITS
LOWER LIMIT
UPPER LIMIT
Default
1. Lines per
Page
Enter the maximum number of lines that will be allowed to be printed on each page of output.
--
50 (E)
83 (E)
83
2. Top Blank
Lines per Page
Enter the number of blank lines that the program should leave at the top of each page of output to create a top of margin.
--
0
(E)
10 (E)
0

Chapter 5 Input Description
5-11
5.4 TTL - TITLE COMMAND
KEYWORD
COMMAND DESCRIPTION
TTL
TITLE - As many as ten TTL commands may be entered by the user. The first TTL command is printed in the header at the top of each output page. A maximum of ten TTL commands are printed on the first page of the output. If more than ten TTL commands are entered, the program will not use the TTL commands following the first ten TTL commands and a warning will be printed. The input file must have at least one TTL command.
PARAMETER
DESCRIPTION
1. Title
Enter any descriptive information about the project or structure. Title information can be entered anywhere between column 4 and column 79.

Chapter 5 Input Description
5-12
5.5 CTL - CONTROL COMMAND
KEYWORD
COMMAND DESCRIPTION
CTL
CONTROL - This command is used to set up the control parameters for the input. The control command is required input, and can only be entered once. Only the CFG command and the TTL command can precede the control command.
PARAMETER
DESCRIPTION
UNITS
LOWER LIMIT
UPPER LIMIT
Default
1. System of
Units
Units to be used in the input computations and output reports:
US - US Customary Units
--
US (E)
--
US
2. Structure
Type
Select the structure type: 1 – Single Cell Culvert 2 – Twin Cell Culvert U – U-Channel
--
1,2,U (E)
--
(E)
--
3. Type of
Run
Indicate type of run:
DR - Design Reinforcement for known member thickness including shear reinforcement for top slab, bottom slab and walls if required for capacity. (Not applicable for U-channels)
DA - Design Top and Bottom Slab Components with shear reinforcement and design walls without shear reinforcement. (Not applicable for U-channels)
DC - Design All Components without shear reinforcement.
AR - Analyze, do specifications checking, and then rate members. Member thickness and reinforcement are known.
--
DR DA DC AR (E)
--
--
4. Precast or
Cast-in-Place
Indicate if the structure is precast or cast-in-place:
P - Precast Box Culvert, or Precast Rigid Frame Culvert
C - Cast-in-Place structure/or Rigid Frame Culvert
--
P, C (E)
--
--
Chapter 5 Input Description
5-13
5.5 CTL – CONTROL COMMAND (Cont.)
PARAMETER
DESCRIPTION
UNITS
LOWER LIMIT
UPPER LIMIT
Default
5. Bottom
Slab
Specify whether the culvert has a bottom slab or no bottom slab:
Y - If the bottom slab is present. N - If the bottom slab is not present. If the
bottom slab is not present, the culvert will be analyzed as a rigid frame with walls, footings, and a top slab.
Leave blank for U-channels.
--
Y, N (E)
--
--
6. Top Slab
Support
For a cast-in-place culvert, indicate if the top slab is constructed monolithic with walls or it is simply supported on walls. Leave blank for precast culverts and U-channels.
M - Top slab is monolithic with walls. S - Top slab is simply supported on walls.
--
M, S (E)
--
M
7. Frame
Support
Frame support condition parameter.
P - Pinned Support Precast Rigid Frame Culvert.
F - Fixed Support Cast-in-place Rigid Frame Culvert
Leave blank for U-channels and culverts with bottom slabs.
--
P,F (E)
--
--

Chapter 5 Input Description
5-14
5.6 SID - STRUCTURE IDENTIFICATION COMMAND
KEYWORD
COMMAND DESCRIPTION
SID
STRUCTURE IDENTIFICATION - This command is used to pass parameters to APRAS (Automated Permit Routing Analysis System) for processing a permit load. The input file must have this command if this data file is to be processed by APRAS. This command is optional for other data files. Only one SID command can be used. Refer to PennDOT’s Bridge Management System (BMS2) Coding Manual, Publication 100A for instructions on how to enter this data.
PARAMETER
DESCRIPTION
UNITS
LOWER LIMIT
UPPER LIMIT
Default
1. Program
Identification
Enter =BXLRFD to identify that the data file is for the LRFD Box Culvert Design and Rating program.
--
=BXLRF
D (E)
--
=BXLRFD
2. County
Enter the county number as per PennDOT’s Bridge Management System (BMS2) (the 2 digit subfield of item number 5A01).
--
1
(E)
99 (E)
--
3. State Route
Enter the state route number as per PennDOT’s Bridge Management System (BMS2) (the 4 digit numeric subfield of item number 5A01).
--
0
(E)
9999 (E)
--
4. Segment
Enter the segment number as per PennDOT’s Bridge Management System (BMS2) (the 4 digit subfield of item number 5A01).
--
0
(E)
9999 (E)
--
5. Offset
Enter the offset distance as per PennDOT’s Bridge Management System (BMS2) (the 4 digit subfield of item number 5A01).
--
0
(E)
9999 (E)
--
6. Span
Identification
Enter the 4 digit alphanumeric Span Identification number as per PennDOT’s Bridge Management System (BMS2) (item number SS01). Note: For APRAS data files, the third character must be “F” to identify BXLRFD is used to analyze the span.
--
--
--
--

Chapter 5 Input Description
5-15
5.7 MAT - MATERIAL COMMAND
KEYWORD
COMMAND DESCRIPTION
MAT
MATERIAL - This command is used to specify concrete and steel material properties. This command may only be specified once.
PARAMETER
DESCRIPTION
UNITS
LOWER LIMIT
UPPER LIMIT
Default
1. f 'c for All
Members
For cast-in-place structures, enter the f 'c for the walls and bottom slab. For precast structures, enter the f 'c for the entire structure.
ksi
*
*
*
2. f ' c for
Top Slab
f 'c for the top slab of cast-in-place culverts at grade. This parameter defaults to f 'c described above if left blank. Leave blank for precast culverts and cast-in-place culverts under fill and U-channels.
ksi
0.0 (E)
6.0 (W)
**
3. Reinforcement
Grade
The culvert reinforcement grade. When fy is greater than 60, refer to Section 6.7.3 for information on how fy is utilized by the program.
ksi
33.0 (W)
65.0 (W)
60.0
4. Reinforcement
Type
For a precast structure, enter: W - if reinforcement is a wire mesh B - if reinforcement is a bar
Leave blank for a cast-in-place structure.
--
B, W (E)
--
B
5. Alpha
Angle of bent-up bars for shear reinforcement. The angle is measured from a horizontal line parallel to the bottom face of the slab. See Figure 5.24-1. Leave blank for U-channels or if no shear reinforcement is analyzed or designed.
degree
1.0 (E)
90.0 (E)
90
6. Rebar Size or
Wire Diameter
For design of cast-in-place structures, largest reinforcement bar that may be used. For design of precast structures, largest reinforcement bar or wire diameter that may be used. Leave blank for analysis runs.
--
*
*
--
7. Epoxy Coated
Reinforcement
Enter: Y – Reinforcement is epoxy coated N – Reinforcement is not epoxy coated Used only for design of cast in place rigid frame culverts where wall reinforcement extends into the strip footings. Leave blank for all other types of culverts including precast rigid frame culverts.
--
Y,N (E)
--
Y
* See Tables 1, 2 and 3 on the following page. **Default value is set equal to the value entered/set for parameter 1 for cast-in-place culverts only. Not used for precast culverts or U-channels.

Chapter 5 Input Description
5-16
5.7 MAT - MATERIAL COMMAND (Cont.)
PARAMETER
DESCRIPTION
UNITS
LOWER LIMIT
UPPER LIMIT
Default
8. Concrete Unit
Weight for DL
Enter the concrete unit weight/density for computing the dead load of the culvert.
lb/ft3
100. (W)
180. (W)
150.
9. Concrete Unit
Weight for E
Enter the unit weight/density for computing the concrete modulus of elasticity.
lb/ft3
100. (W)
180. (W)
145.
10. Reinforcement
Ultimate Strength (fu)
The ultimate strength of reinforcing steel in the culvert.
ksi
50.0 (W)
100.0 (W)
--1
1 Defaults to 90 ksi when fy is 60 ksi; otherwise no default value. Table 5.7-1 Limits and Defaults for f 'c for All Members
PARAMETER
UNITS
LOWER LIMIT
UPPER LIMIT
Default
f 'c for All Members Cast-in-Place
ksi
2.5 (E)
6.0 (W)
3.0
f 'c for All Members Precast
ksi
3.0 (E)
8.0 (W)
5.0
Table 5.7-2 Rebar Size or Wire Diameter Units, Limits and Defaults
PARAMETER
UNITS
LOWER LIMIT
UPPER LIMIT
Default
Rebar Size
US
4
(E)
11
(W)
--
Wire Diameter
in
0.1 (E)
0.6 (W)
--
Table 5.7-3 Valid Rebar Sizes
UNITS
SIZES
US 4
5
6
7
8
9
10
11

Chapter 5 Input Description
5-17
5.8 DIM - DIMENSIONS COMMAND
KEYWORD
COMMAND DESCRIPTION
DIM
DIMENSIONS - This command describes the physical dimensions of a box culvert or U-channel. This command may only be specified once.
PARAMETER
DESCRIPTION
UNITS
LOWER LIMIT
UPPER LIMIT
Default
1. Clear Span
The clear span of the culvert. The same value is used for both spans in a two cell culvert. See Figure 1.
ft
0.0 (E)
40.0 (W)
--
2. Clear
Height
The clear height of the culvert. If a fish channel is present, the height is measured from the low point of the fish channel. The same value is used for both spans in a two cell culvert. See Figure 1. Leave blank for a U-channel
ft
0.0 (E)
20.0 (W)
--
3. Top Slab
Thickness
The actual thickness of the top slab for Type of Run DR or AR. The minimum thickness of the top slab for Type of Run DA or DC. The slab thickness is entered for the outside left wall face. See Figure 1. Leave blank for a U-channel
in
0.0 (E)
48.0 (W)
*
4. Bottom
Slab Thickness
Bottom slab thickness. The actual thickness of the bottom slab for Type of Run DR or AR. The minimum thickness of the bottom slab for Type of Run DA or DC. If a fish channel is present, this is the thickness at the lowest point in the fish channel. In a two cell culvert, the slab thickness in the cell without the fish channel is also set to this thickness. See Figure 1. Leave blank for frame culvert.
in
0.0 (E)
48.0 (W)
*
5. Left Wall
Thickness
Thickness of the left wall. The actual thickness of the left wall for Type of Run DR or AR. The minimum thickness of the left wall for Type of Run DA or DC. See Figure 1.
in
0.0 (E)
36.0 (W)
*
6. Right Wall
Thickness
Thickness of the right wall. The actual thickness of the right wall for Type of Run DR or AR. The minimum thickness of the right wall for Type of Run DA or DC. See Figure 1.
in
0.0 (E)
36.0 (W)
*
7. Interior Wall
Thickness
Thickness of the interior wall of a two cell culvert. The actual thickness of the interior wall for Type of Run DR or AR. The minimum thickness of the interior wall for Type of Run DA or DC. See Figure 1. Leave blank for a one cell culvert or a U-channel.
in
0.0 (E)
36.0 (W)
*
*If the program is to design the member thicknesses, defaults are the minimum allowable member thickness as per DM-4 and are only enforced when the thickness parameter is left blank. See Tables 1 and 2.

Chapter 5 Input Description
5-18
5.8 DIM - DIMENSIONS COMMAND (Cont.)
PARAMETER
DESCRIPTION
UNITS
LOWER LIMIT
UPPER LIMIT
Default
8. Fill Grade
For culvert under fill, the slope of ground line expressed as a percent grade. The grade may be positive or negative. A positive grade is a ground line going up from left to right. See Figure 1. Leave blank for a culvert at grade or a U-channel.
%
-50.0 (W)
50.0 (W)
0.0
9. Top Slab
Grade
If the top surface of the top slab is sloping, regardless if the culvert is under fill or at grade, enter the slope of the top face of slab expressed as a percent grade. The grade may be positive or negative. A positive grade is the surface of top slab going up from left to right. See Figure 1. Leave blank for a U-channel
%
-10.0 (W)
10.0 (W)
0.0
10. U-Channel Left Wall Height
The clear height of the left U-channel wall. If a fish channel is present, the height is measured from the low point of the fish channel. See Figure 2. Leave blank for a box culvert.
ft
0.0 (E)
20.0 (W)
--
11. U-Channel Right Wall Height
The clear height of the right U-channel wall. If a fish channel is present, the height is measured from the low point of the fish channel. See Figure 2. Leave blank for a box culvert.
ft
0.0 (E)
20.0 (W)
--

Chapter 5 Input Description
5-19
5.8 DIM - DIMENSIONS COMMAND (Cont.)
Bottom SlabThickness
Y2(+)Y1(-)
X1 X2
ClearSpan
ClearHeight Interior
WallThickness
RightWall
Thickness
OverlayThickness
Top Slab GradeTopSlab
Thickness
LeftWall
Thickness
Non-Standard Fish Channel
RightWall
Thickness
Height of Fill
Top SlabThickness
LeftWall
Thickness
StandardFish Channel
Clear Span
ClearHeight
Fill Grade
Bottom SlabThickness
Future WearingSurface
Note: positive grades are shown.
Top Slab Grade
Figure 5.8-1 Culvert Dimensions

Chapter 5 Input Description
5-20
5.8 DIM - DIMENSIONS COMMAND (Cont.)
RightWall
Thickness
LeftWall
Thickness
StandardFish Channel
Clear Span
Bottom SlabThickness
U-channel RightWall
Height
U-channel LeftWall
Height
Figure 5.8-2 U-channel Dimensions
Table 5.8-1 Minimum Design Thicknesses
Precast Member Cast-in-Place Fill > 2’ Fill < 2’
Top Slab
10” Under Fill 10.5” At Grade
12” for S > 12’
s for 8’< S < 12’ s + 1” for S < 7’
12” for S > 12’
s for 8’< S < 12’ s + 1” for S = 7’ s + 2” for S = 6’ s + 3” for S = 5’
s + 3.5” for S = 4’ s + 4” for S = 3’
Add 0.5” if at grade
Bottom Slab
11.5”
12.5” for S > 12’
s + 0.5” for 8’< S < 12’ s + 1.5” for S < 7’
12.5” for S > 12’
s + 0.5” for 8’< S < 12’ s + 1.5” for 5’< S < 7’ s + 2.5” for 3’< S < 5’
s + 3.5” for S = 3’
Wall
10” for H < 5’ 12” for H > 5’
12” for S > 12’
s for 8’< S < 12’ s + 1” for S < 7’
12” for S > 12’
s for 8’< S < 12’ s + 1” for S < 7’
Where: S = Span (feet), s = Span (inches)/12 and H = Wall Height (feet)
Note: The scour, foundation, unevenness, and integral wearing thicknesses, if applicable, are included in the required design thickness specified.

Chapter 5 Input Description
5-21
5.9 FTG - FOOTING COMMAND
KEYWORD
COMMAND DESCRIPTION
FTG
FOOTING - This command specifies geometric data describing the footing of a frame culvert. The dimensions entered in this command do not change for either an analysis or a design run. This command is used in culverts which do not have a bottom slab. This command may only be specified once. This command is not applicable for U-channels. See Figure 1.
PARAMETER
DESCRIPTION
UNITS
LOWER LIMIT
UPPER LIMIT
Default
1. Left Footing
Width
Footing width at the bottom of the left wall.
in
0.0 (E)
108.0 (W)
--
2. Left Footing
Thickness
Footing thickness at the bottom of the left wall.
in
0.0 (E)
36.0 (W)
--
3. Left Toe
Projection
Left footing toe projection.
in
12.0 (E)
36.0 (W)
--
4. Right
Footing Width
Footing width at the bottom of the right wall.
in
0.0 (E)
108.0 (W)
--
5. Right
Footing Thickness
Footing thickness at the bottom of the right wall
in
0.0 (E)
36.0 (W)
--
6. Right Toe
Projection
Right footing toe projection.
in
12.0 (E)
36.0 (W)
--
7. Interior
Footing Width
Footing width at the bottom of the interior wall for a two-cell culvert. The footing will be centered on the interior wall. Leave blank for a single cell culvert.
in
0.0 (E)
108.0 (W)
--
8. Interior
Footing Thickness
Footing thickness at the bottom of the interior wall for a two-cell culvert. Leave blank for a single cell culvert.
in
0.0 (E)
36.0 (W)
--

Chapter 5 Input Description
5-22
5.9 FTG - FOOTING COMMAND (Cont.)
InteriorFooting
Thickness
Left Footing WidthInterior Footing
Width Right Footing Width
Left ToeProjection
Right ToeProjection
Left FootingThickness
RightFooting
Thickness
Figure 5.9-1 Footing Dimensions

Chapter 5 Input Description
5-23
5.10 LDC - LOAD CONTROL COMMAND
KEYWORD
COMMAND DESCRIPTION
LDC
LOAD CONTROL - This command describes the data needed to load the structure. This command may only be specified once.
PARAMETER
DESCRIPTION
UNITS
LOWER LIMIT
UPPER LIMIT
Default
1. Earth Weight
/ Density
Weight of earth.
lb/ft3
0.0 (E)
150.0 (W)
140.0
2. Height of
Fill
The height of fill measured from the upper left corner of the culvert. Leave blank if the top slab is at roadway grade. See Figure 5.8-1. For a U-Channel, leave blank. If Approach Slabs will be entered, leave blank. If an Overlay Thickness and Overlay Weight/Density will be entered, leave blank.
ft
0.0 (E)
100.0 (W)
--
3. Number of
Lanes
The number of design traffic lanes to be used for lateral distribution of wheel loads. Enter zero if the effect of the live load is to be neglected. Even if a number is entered here, the program will determine the applicability of a live load based on the height of fill and span length. Leave blank for a U-channel.
--
0
(E)
8
(W)
2
4. Live Load
Surcharge
Live load surcharge expressed as a height of fill. Enter zero if no live load surcharge is to be applied.
ft
0.0 (E)
5.0 (W)
3.0
5. Live Load
Standard live loading or user defined special live loading. Live load options for design are:
A - PHL-93 and P-82 B - HL-93 and P-82 C - HL-93 only D - PHL-93, ML-80, and P-82 E - PHL-93, ML-80, TK527 and P-82 F - PHL-93,ML-80,TK527, P-82, and PA2016-13
For design runs, choose option E to ensure that the ML-80 and TK527 inventory ratings are greater than 1.0 as per D3.6.1.2.8P and 3.6.12.9P. To also ensure the PA2016-13 Permit Vehicle operating ratings are greater than 1.0, choose option F. Live load options for analysis, specification checking and rating are:
A - PHL-93,P-82, ML-80, TK527, HS20 and H20 B - HL-93, HS20 and H20 C - ML-80 only D - P-82 only E - Special Live Loading F - TK527 only G - EV2, EV3, and SU6TV H - PA2016-13 only I - PHL-93, P-82, PA2016-13, ML-80, TK527,
--
A, B, C, D, E, F
(E)
A, B, C, D, E, F, G, H, I
(E)
--
E
A

Chapter 5 Input Description
5-24
5.10 LDC - LOAD CONTROL COMMAND (Cont.)
PARAMETER
DESCRIPTION
UNITS
LOWER LIMIT
UPPER LIMIT
Default
HS20,and H20
Leave blank for a U-channel or an APRAS run.
6. Overlay
Weight/ Density
Weight of the top slab overlay. Leave blank for a U-channel.
lb/ft3
0.0 (E)
160.0 (W)
150.0
7. Overlay
Thickness
The top slab overlay thickness. It can be applied to culverts at or below grade. See Figure 5.8-1. Leave blank for a U-channel.
in
0.0 (E)
12.0 (W)
--
8. Future
Wearing Surface
Uniform load of future wearing surface. Can be applied to culverts at or below grade. Leave blank for a U-channel.
lb/ft2
0.0 (E)
30.0 (W)
*
9. Maximum
Live Load Distribution Length
The maximum length of culvert over which the live load may be distributed in the culvert longitudinal direction. The program calculates the actual distribution length to be used, which is limited to the value entered for this parameter. See Figure 1. Leave blank for a U-channel.
ft
0.0 (E)
400.0 (W)
--
10. Segment
Length
The length of a single precast (PC) culvert segment or distance between expansion joints in cast-in-place (CIP) culverts. This length is used to determine axle load distribution factors for live loads applied directly on the culvert top slab.
ft
0.0(PC)
20.0(CIP) (E)
12.0(PC) 90.0(CIP)
(W)
--(PC)
90.0(CIP)
11. Multiple
Presence Reduction
The factor by which the Multiple Presence Factor is to be multiplied to take into the account the Average Daily Truck Traffic (ADTT) carried by the culvert. NOTE: This value is ignored for culverts with spans less than 15 ft and under less than 2 ft of fill. Leave blank for a U-channel.
--
1.0 (E)
1.0 (E)
1.0
12. PA Traffic
Factor
The Pennsylvania Traffic Factor to be used for the type of road for load-induced fatigue consideration. Leave blank for a U-channel. NOTE: This parameter is no longer used and should be left blank.
--
0.0 (E)
2.0 (W)
--
13. Fatigue
Dynamic Load Allowance
The Dynamic Load Allowance to be used for Fatigue Limit State load combination. NOTE: This parameter is no longer used and should be left blank.
--
0.75 (E)
2.0 (E)
--
14. Ductility
Factor
Factor applied to the force effects relating to ductility. As per DM-4 Section 1.3.4, a factor other than 1.0 is not permitted by PennDOT
--
0.95 (E)
1.05 (E)
1.0
15. Redundancy
Factor
Factor applied to the force effects relating to redundancy. As per DM-4 Section 1.3.5, a factor other than 1.0 is not permitted by PennDOT
--
0.95 (E)
1.05 (E)
1.0

Chapter 5 Input Description
5-25
5.10 LDC - LOAD CONTROL COMMAND (Cont.)
PARAMETER
DESCRIPTION
UNITS
LOWER LIMIT
UPPER LIMIT
Default
16. Importance
Factor
Factor applied to the force effects relating to operational importance. As per DM-4 Section 1.3.3, a factor other than 1.0 is not permitted by PennDOT
--
1.0 (E)
1.28 (E)
1.0
17. Permit Truck
Maximum Dynamic Load Allowance
The Dynamic Load Allowance limit to be used for P-82 and PA2016-13 truck loads.
--
1.00 (E)
2.0 (E)
1.20
18. Live Load
Override
Live Load Override allows for the application of live load regardless of the fill height. 0 – The program determines when live load is applicable. 1 – The program will apply live load. See Section 6.10.18 for more information.
--
0
(E)
1
(E)
0
19. Minimum
Equivalent Fluid Pressure
Minimum equivalent fluid pressure used to determine horizontal earth pressure for the minimum load case.
lb/ft3
1.0 (E)
80.0 (W)
45.0
20. Maximum
Equivalent Fluid Pressure
Maximum equivalent fluid pressure used to determine horizontal earth pressure for the maximum load case.
lb/ft3
1.0 (E)
80.0 (W)
70.0
21. Barrier Dead Load
Proportion of Barrier dead load applied to the culvert design length as a uniform load along the top slab of the culvert.
Design Length = 1 ft
Barrier Width
kips/ft 0.0 (E)
1.0 (W)
--

Chapter 5 Input Description
5-26
5.10 LDC - LOAD CONTROL COMMAND (Cont.)
PARAMETER
DESCRIPTION
UNITS
LOWER LIMIT
UPPER LIMIT
Default
22. Approach
Slab Dead Load - Left External Wall
Approach Slab dead load on the left exterior wall of the culvert applied at the centerline of the wall over the 1 foot design width of the culvert. The application of this load is based on BD-632. This load should be left blank when culvert is not at grade.
kips
0.0 (E)
3.0 (W)
23. Approach
Slab Live Load – Left External Wall
Approach Slab live load on the left exterior wall of the culvert applied at the centerline of the wall over the 1 foot design width of the culvert. The application of this load is based on BD-632. This load should be left blank when culvert is not at grade or if live load is not applied to the culvert.
kips
0.0 (E)
5.0 (W)
24. Approach
Slab Dead Load – Right External Wall
Approach Slab dead load on the right exterior wall of the culvert applied at the centerline of the wall over the 1 foot design width of the culvert. The application of this load is based on BD-632. This load should be left blank when culvert is not at grade.
kips
0.0 (E)
3.0 (W)
25. Approach
Slab Live Load - Right External Wall
Approach Slab live load on the right exterior wall of the culvert applied at the centerline of the wall over the 1 foot design width of the culvert. The application of this load is based on BD-632. This load should be left blank when culvert is not at grade or if live load is not applied to the culvert.
kips
0.0 (E)
5.0 (W)
26. Ratings
Without Future Wearing Surface
For analysis runs when Future Wearing Surface is specified. The program will calculate and output ratings with and without Future Wearing surface. Not applicable for Design runs or U-channels.
--
Y, N
(E)
--
N
27. Backfill Type
NOTE: This parameter is no longer used and should be left blank.
--
--
--
--
28. Number of
Precast Shear Transfer Segments
Number of precast segments with shear transfer as defined in DM-4 Section 4.6.2.10.4. Leave blank for Cast In Place culverts. Only set to 1 when there are no other means of shear transfer. All PennDOT projects follow BC-798M which provides shear transfer, therefore a value of at least 2 should be used for this parameter.
--
1
(E)
20
(W)-
2
*For design runs, 30.0 lbs/ft 2. For analysis runs, 0.0 lbs/ft 2.

Chapter 5 Input Description
5-27
5.10 LDC - LOAD CONTROL COMMAND (Cont.)
Edge of Fill
Top of Culvert
Headwall
Roadway
Maximum Live Load Distribution Length
Culvert Under Fill
Roadway
Maximum Live Load Distribution Length
Parapet(Typical)
Culvert at Grade
Figure 5.10-1 Maximum Live Load Distribution Length
Chapter 5 Input Description
5-28
5.11 SLL - SPECIAL LIVE LOADING COMMAND
KEYWORD
COMMAND DESCRIPTION
SLL
SPECIAL LIVE LOADING - This command is required when a special live loading is requested as the live load option in the LDC command. This command may only be specified once. This command is not applicable for U-channels.
PARAMETER
DESCRIPTION
UNITS
LOWER LIMIT
UPPER LIMIT
Default
1. Gage
Distance
The distance between the truck wheel lines.
ft
0.0 (E)
10.0 (W)
6.0
2. Passing
Distance
If more than one vehicle is assumed to be loaded on the culvert at a time, specify the minimum lateral distance between the adjacent wheels of passing vehicles.
ft
0.0 (E)
10.0 (W)
4.0
3. Axle Effect
Enter "Y" if the effects of all axle loads are to be included in calculating a given load effect. Enter "N" if the axle loads that do not contribute to the effect are to be neglected.
--
Y, N (E)
--
N
4. Lane Load
Enter a uniform lane load to be applied in combination with the SAL command.
kip/ft
0.0 (E)
1.5 (W)
0.0
5. Percent
Increase
Enter the percentage to increase the live load for checking permit loads for over-weight.
--
0.0 (E)
10.0 (W)
3.0
6. Load Factor
Strength I
The load factor to be applied to the Strength I Limit State.
--
0.0 (E)
2.0 (W)
--
7. Load Factor
Strength II
The load factor to be applied to the Special Live Load in the Strength II Limit State.
--
0.0 (E)
2.0 (W)
--
8. Load Factor
Service I
The load factor to be applied to the Special Live Load in the Service I Limit State.
--
0.0 (E)
2.0 (W)
--
9. Load Factor
Fatigue
The load factor to be applied to the Fatigue Limit State. NOTE: This parameter is no longer used and should be left blank.
--
0.0 (E)
2.0 (W)
--

Chapter 5 Input Description
5-29
5.12 SAL - SPECIAL AXLE LOADS COMMAND
KEYWORD
COMMAND DESCRIPTION
SAL
SPECIAL AXLE LOADS - This command is required when a special live loading is requested as the live load option in the LDC command. The parameters of this command may be repeated starting with parameter 1. For the last vehicle axle, the axle spacing can be left blank. This command is repeatable but the total number of axles from each SAL card must not exceed a maximum of 80 axle loads, 79 spacings. This command is not applicable for U-channels.
PARAMETER
DESCRIPTION
UNITS
LOWER LIMIT
UPPER LIMIT
Default
1. Axle Load
Enter the magnitude of the axle load corresponding to the previously specified axle spacing.
kips
0.0 (E)
150.0 (W)
--
2. Axle
Spacing
Enter the spacing from the axle under consideration to the next axle. For example, the fourth spacing is the distance between axle 4 and axle 5. Leave blank for last axle.
ft
0.0 (E)
50.0 (W)
--

Chapter 5 Input Description
5-30
5.13 HCH - HAUNCH COMMAND
KEYWORD
COMMAND DESCRIPTION
HCH HAUNCH - This command is used to describe the presence and dimensions of haunches in the corners of box culverts and U-channels. If only the top left haunch is described for box culverts, all remaining haunches will default to those dimensions when haunches are applicable. The bottom haunches must be individually specified for U-channels. Haunches may not be placed at bottom slabs with fish channels, or at the bottom of culverts without a bottom slab. Haunch x and y dimensions must be equal or the program will stop. This command may only be specified once. See Figure 1.
PARAMETER
DESCRIPTION
UNITS
LOWER LIMIT
UPPER LIMIT
Default
1. Top Left x
Haunch horizontal dimension at culvert top left corner. Leave blank for U-channels.
in
0.0 (E)
30.0 (W)
--
2. Top Left y
Haunch vertical dimension at culvert top left corner. Leave blank for U-channels.
in
0.0 (E)
30.0 (W)
--
3. Top
Right x
Haunch horizontal dimension at culvert top right corner. Leave blank for U-channels.
in
0.0 (E)
30.0 (W)
*
4. Top
Right y
Haunch vertical dimension at culvert top right corner. Leave blank for U-channels.
in
0.0 (E)
30.0 (W)
*
5. Bottom
Left x
Haunch horizontal dimension at culvert bottom left corner.
in
0.0 (E)
30.0 (W)
*
6. Bottom
Left y
Haunch vertical dimension at culvert bottom left corner.
in
0.0 (E)
30.0 (W)
*
7. Bottom
Right x
Haunch horizontal dimension at culvert bottom right corner.
in
0.0 (E)
30.0 (W)
*
8. Bottom
Right y
Haunch vertical dimension at culvert bottom right corner.
in
0.0 (E)
30.0 (W)
*
9. Top
Interior x
Haunch horizontal dimension at interior wall top of two cell culverts. Leave blank for U-channels.
in
0.0 (E)
30.0 (W)
*
10. Top
Interior y
Haunch vertical dimension at interior wall top of two cell culverts. Leave blank for U-channels.
in
0.0 (E)
30.0
750.0 (W)
*

Chapter 5 Input Description
5-31
5.13 HCH - HAUNCH COMMAND (Cont.)
PARAMETER
DESCRIPTION
UNITS
LOWER LIMIT
UPPER LIMIT
Default
11. Bottom
Interior x
Haunch horizontal dimension at interior wall bottom of two cell culverts. Leave blank for U-channels.
in
0.0 (E)
30.0 (W)
*
12. Bottom
Interior y
Haunch vertical dimension at interior wall bottom of two cell culverts. Leave blank for U-channels.
in
0.0 (E)
30.0 (W)
*
*Horizontal dimensions will default to the “top left x” dimension, and vertical dimensions will default to the “top left y” dimension for box culverts only.

Chapter 5 Input Description
5-32
5.13 HCH - HAUNCH COMMAND (Cont.)
Typical Haunch Dimensions (Inches)
These are part of the fishchannel, not a haunch. It istreated as a haunch if it has a45 degree slope.
TopLeft Top
Interior
TopRight
BottomInterior
BottomRight
y
x
Figure 5.13-1 Haunch Dimensions

Chapter 5 Input Description
5-33
5.14 FSH - FISH CHANNEL COMMAND
KEYWORD
COMMAND DESCRIPTION
FSH
FISH CHANNEL - This command is used to describe the type and dimensions of a fish channel. A standard or a non-standard may be specified. When a standard fish channel is specified, the program will use the fish channel dimensions shown in Figure 1. For a two cell culvert, the fish channel is assumed in the left cell bottom slab. When a standard fish channel is specified, parameters 2 and 3 are ignored. A non-standard fish channel can be described by entering the fish channel dimensions (segment length and change in slab thickness). A maximum of 4 segments can be entered. The fish channel command may only be specified once. Parameters 2 and 3 are repeatable a maximum of 4 times. See Figures 1 and 2.
PARAMETER
DESCRIPTION
UNITS
LOWER LIMIT
UPPER LIMIT
Default
1. Type
Type of fish channel. See Figures 1 and 2.
S - Standard Fish Channel N - Non-Standard Fish Channel
--
S, N (E)
--
--
2. Segment
Length
Horizontal distance of segment measured from previous segment. See Figure 2. Leave blank for a Standard Fish Channel.
in
0.0 (E)
240.0 (W)
--
3. Thickness
Change
Change in bottom slab thickness in segment 1. Positive if thickness increases in segment, negative if drop in thickness. See Figure 2. Leave blank for a Standard Fish Channel.
in
-24.0 (E)
24.0 (W)
--

Chapter 5 Input Description
5-34
5.14 FSH - FISH CHANNEL COMMAND (Cont.)
(a) Single Cell - S < 10'
(b) Single Cell - S > 10'
(c) Two Cell - S < 10'
(d) Two Cell - S > 10'
S
S-10'
S
10'
S S
S S
S-10' 10'
10" 10"1:1
1:1
1:1
1:1
10"10"
10" 10"
10"10"
Figure 5.14-1 Standard Fish Channel

Chapter 5 Input Description
5-35
5.14 FSH - FISH CHANNEL COMMAND (Cont.)
-y2 +y4
X1 X2 X3 X4
y1 and y3 = 0
Segment Length (typ.)
Thickness Change (typ.)Bottom Slab Thickness
Figure 5.14-2 Non-Standard Fish Channel

Chapter 5 Input Description
5-36
5.15 CVR - COVER COMMAND
KEYWORD
COMMAND DESCRIPTION
CVR
COVERS - This command is used to specify the clear concrete covers over reinforcement. The cover is measured from the concrete face to the nearest face of the reinforcement. (See Figure 1.) The default values of covers are dependent on the structure type, either precast or cast-in-place and are shown in Table 1. The cover command may only be specified once.
PARAMETER
DESCRIPTION
UNITS
LOWER LIMIT
UPPER LIMIT
Default
1. Top Slab -
Top Cover
Clear concrete cover for top reinforcement in top slab, including applicable integral wearing surface. Leave blank for a U-channel.
in
**
10.0 (W)
*
2. Top Slab -
Bottom Cover
Clear concrete cover for bottom reinforcement in top slab. Leave blank for a U-channel.
in
**
10.0 (W)
*
3. Bottom
Slab - Top Cover
Clear concrete cover for top reinforcement in bottom slab, including applicable scour thickness.
in
**
10.0 (W)
*
4. Bottom
Slab - Bottom Cover
Clear concrete cover for bottom reinforcement in bottom slab, including foundation unevenness.
in
**
10.0 (W)
*
5. All Wall
Covers
Clear concrete cover for all reinforcement in the walls.
in
**
10.0 (W)
*
6. Footing -
Top Cover
Clear concrete cover for top reinforcement in footing. Leave blank for a U-channel.
in
**
10.0 (W)
*
7. Footing -
Bottom Cover
Clear concrete cover for bottom reinforcement in footing. Leave blank for a U-channel.
in
**
10.0 (W)
*
* See Table 1. **For Analysis Runs, AR, the lower limit is equal to the minimum allowable as per DM-4 and is processed as a warning. For Design Runs, DR, DA or DC, the lower limit is equal to the minimum allowable as per DM-4 and is processed as an error check. See Table 1.

Chapter 5 Input Description
5-37
5.15 CVR - COVER COMMAND (Cont.)
Top Slab Top Cover
Top Slab Bottom Cover
0.5" Integral Wearing Surface
Wall Cover (Typ)
0.5" Bottom Slab Top Cover
Bottom Slab Bottom Cover1.0" Foundation Uneveness
dd
d
dd
d = effective depth of the section measured to the center of reinforcement
d
d
d
Figure 5.15-1 Reinforcement Covers

Chapter 5 Input Description
5-38
5.15 CVR - COVER COMMAND (Cont.)
Table 5.15-1 DM-4 Minimum Values of Reinforcement Covers
PARAMETER
UNITS
CAST-IN-PLACE
PRECAST
WELDED WIRE
PRECAST
REBAR Top Slab Under Fill -Top Cover
in
2.0
A
2.0
Top Slab at Grade - Top Cover
in
2.5
2.5
2.5
Top Slab - Bottom Cover
in
2.0
1.5
1.5
Bottom Slab - Top Cover
in
2.5
2.0
2.0
Bottom Slab - Bottom Cover
in
3.0
1.5
1.5
All Wall Covers
in
2.0
1.5
1.5
Footing - Top Cover
in
2.0
N/A
N/A
Footing - Bottom Cover
in
3.0
N/A
N/A
Where: A = 1.5" for fill > 2' = 2" for fill < 2'

Chapter 5 Input Description
5-39
5.16 TSA - TOP SLAB REINFORCEMENT AREAS COMMAND
KEYWORD
COMMAND DESCRIPTION
TSA
TOP SLAB REINFORCEMENT AREAS - This command is used to specify the top slab reinforcement when the areas of reinforcement per unit length of culvert are known for an existing culvert. This command is required when AR is entered as the type of run in the CTL command, and should not be entered for all other types. Either the TSA or the TSR command can be used to describe the reinforcement, but not both. The reinforcement areas are described by ranges within a given slab. The program assumes that the beginning of each range is the end of the previous range. The first range is assumed to begin at the left end of the slab. The last range distance must be equal to the clear span. This command can be repeated to specify the reinforcement areas for each face of each top slab. Up to 3 reinforcement ranges may be specified for each top slab, thus parameters 3 and 4 are repeatable. See Figures 1 and 2. This command is not applicable for U-channels.
PARAMETER
DESCRIPTION
UNITS
LOWER LIMIT
UPPER LIMIT
Default
1. Slab
Number
The number of the top slab for which the reinforcement is being described. Enter 1 if it is a single cell culvert or the left-most slab of a two cell culvert. Enter 2 if it is the right-most slab of a two cell culvert.
--
1
(E)
NCEL1
(E)
--
2. Face
Indicate at which face the reinforcement is located. T - Reinforcement is at top face
B - Reinforcement is at bottom face
--
T, B (E)
--
--
3. Range
Distance
Distance along the top slab from the left wall face for a single cell culvert or from the interior wall face for slab 2 of a two cell culvert to the location where the specified Range ends.
ft
0.0 (E)
*
(E)
--
4. Area
The area of reinforcement per unit length of culvert for this Range.
in2
0.0 (E)
6.25 (W)
--
1NCEL is equal to the number of cells entered on the CTL command. *Dependent on the Clear Span: the last Range Distance for each top slab must be equal to the Clear Span of the given top slab.
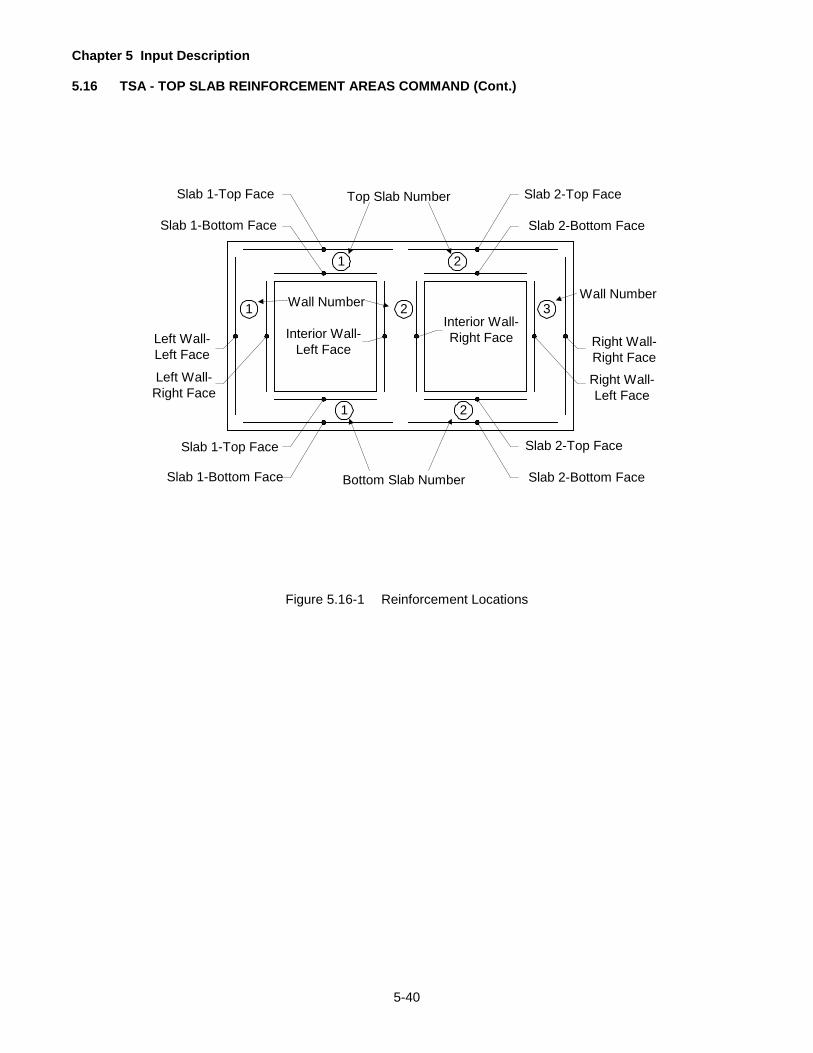
Chapter 5 Input Description
5-40
5.16 TSA - TOP SLAB REINFORCEMENT AREAS COMMAND (Cont.)
Top Slab Number
Bottom Slab Number
Slab 1-Top Face
Slab 1-Bottom Face
Slab 2-Top Face
Slab 2-Bottom Face
Slab 1-Top Face
Slab 1-Bottom Face
Slab 2-Top Face
Slab 2-Bottom Face
Left Wall-Left Face
Left Wall-Right Face
Right Wall-Right FaceRight Wall-Left Face
Interior Wall-Left Face
Interior Wall-Right Face
1 2
1
1
2
2 3Wall Number Wall Number
Figure 5.16-1 Reinforcement Locations

Chapter 5 Input Description
5-41
5.16 TSA - TOP SLAB REINFORCEMENT AREAS COMMAND (Cont.)
Range 2Range 1
Range 1
Range 1
Range 2Range 1
Ran
ge 3
Ran
ge 2
Ran
ge 1Range 2
Range 1
Range 1
Ran
ge 3
Range 1
Note: Reinforcement in each slab or wall may be specified by a maximum of three ranges.
Figure 5.16-2 Reinforcement Range Distances

Chapter 5 Input Description
5-42
5.17 TSR - TOP SLAB REINFORCEMENT COMMAND
KEYWORD
COMMAND DESCRIPTION
TSR
TOP SLAB REINFORCEMENT - This command is used to specify the top slab reinforcement when the reinforcement size and spacing are known in existing culverts. This command is required when AR is entered as the type of run in the CTL command, and should not be entered for all other types. Either the TSR or the TSA command can be used to describe the reinforcement, but not both. The reinforcement areas are described by ranges within a given slab. The program assumes that the beginning of each region is the end of the previous range. The first range is assumed to begin at the left end of the slab. The last range distance must be equal to the clear span. This command can be repeated to specify the reinforcement for each face of each top slab. Up to 3 reinforcement ranges may be specified for each top slab, thus parameters 3, 4, and 5 are repeatable. See Figures 5.16-1 and 5.16-2. This command is not applicable for U-channels.
PARAMETER
DESCRIPTION
UNITS
LOWER LIMIT
UPPER LIMIT
Default
1. Slab
Number
Number of the top slab for which the reinforcement is being described. Enter 1 if it is a single cell culvert or the left-most slab of a two cell culvert. Enter 2 if it is the right-most slab of a two cell culvert.
--
1
(E)
NCEL1
(E)
--
2. Face
Indicate at which face the reinforcement is located.
T - Reinforcement is at top face B - Reinforcement is at bottom face
--
T, B (E)
--
--
3. Range
Distance
Distance along the top slab from the left wall face for a single cell culvert or from the interior wall face for slab 2 of a two cell culvert to the location where the specified Range ends.
ft
0.0 (E)
** (E)
--
4. Reinf. Size
or Wire Diameter
Reinforcement size in the specified Range.
--
*
*
--
5. Spacing
Reinforcement spacing in the specified Range.
in
0.0 (E)
24.0 (W)
--
1 NCEL is equal to the number of cells entered on the CTL command. **Dependent on the Clear Span: the last Range Distance for each top slab must be equal to the Clear Span of the given top slab. *See Table 5.7-2.

Chapter 5 Input Description
5-43
5.18 BSA - BOTTOM SLAB REINFORCEMENT AREAS COMMAND
KEYWORD
COMMAND DESCRIPTION
BSA
BOTTOM SLAB REINFORCEMENT AREAS - This command is used to specify the bottom slab reinforcement when the areas of reinforcement per unit length of culvert are known for an existing culvert. This command is required when AR is entered as the type of run in the CTL command, and should not be entered for all other types. Either the BSA or the BSR command can be used to describe the reinforcement, but not both. The reinforcement areas are described by ranges within a given slab. The program assumes that the beginning of each range is the end of the previous range. The first range is assumed to begin at the left end of the slab. The last range distance must be equal to the clear span. This command can be repeated to specify the reinforcement areas of each face of each bottom slab. Up to 3 reinforcement ranges may be specified for each bottom slab, thus parameters 3 and 4 are repeatable. See Figures 5.16-1 and 5.16-2.
PARAMETER
DESCRIPTION
UNITS
LOWE
R LIMIT
UPPER LIMIT
Default
1. Slab
Number
The number of the bottom slab for which the reinforcement is being described. Enter 1 if it is a single cell culvert or the left-most slab of a two cell culvert. Enter 2 if it is the right-most slab of a two cell culvert.
--
1
(E)
NCEL1
(E)
--
2. Face
Indicate at which face the reinforcement is located.
T - Reinforcement is at top face B - Reinforcement is at bottom face
--
T, B (E)
--
--
3. Range
Distance
Distance along the bottom slab face from the left wall face for a single cell culvert or from the interior wall face for slab 2 of a two cell culvert to the location where the specified Range ends.
ft
0.0 (E)
*
(E)
--
4. Area
The area of reinforcement per unit length of culvert for this Range.
in2
0.0 (E)
6.25 (W)
--
1NCEL is equal to the number of cells entered on the CTL command. *Dependent on the Clear Span: the last Range Distance for each bottom slab must be equal to the Clear Span of the given bottom slab.

Chapter 5 Input Description
5-44
5.19 BSR - BOTTOM SLAB REINFORCEMENT COMMAND
KEYWORD
COMMAND DESCRIPTION
BSR
BOTTOM SLAB REINFORCEMENT - This command is used to specify the bottom slab reinforcement when the reinforcement size and spacing are known in existing culverts. This command is required when AR is entered as the type of run in the CTL command, and should not be entered for all other types. Either the BSR command or the BSA command can be used to describe the reinforcement, but not both. The reinforcement areas are described by ranges within a given slab. The program assumes that the beginning of each range is the end of the previous range. The first range is assumed to begin at the left end of the slab. The last range distance must be equal to the clear span. This command can be repeated to specify the reinforcement for each face of each bottom slab. Up to 3 reinforcement ranges may be specified for each bottom slab, thus parameters 3, 4, and 5 are repeatable. See Figures 5.16-1 and 5.16-2.
PARAMETER
DESCRIPTION
UNITS
LOWER LIMIT
UPPER LIMIT
Default
1. Slab
Number
Number of the bottom slab for which the reinforcement is being described. Enter 1 if it is a single cell culvert or the left-most slab of a two cell culvert. Enter 2 if it is the right-most slab of a two cell culvert.
--
1
(E)
NCEL1
(E)
--
2. Face
Indicate at which face the reinforcement is located.
T - Reinforcement is at top face B - Reinforcement is at bottom face
--
T, B (E)
--
--
3. Range
Distance
Distance along the bottom slab from the left wall face for a single cell culvert or from the interior wall face for slab 2 of a two cell culvert to the location where the specified Range ends.
ft
0.0 (E)
** (E)
--
4. Reinf. Size
or Wire Diameter
Reinforcement size in the specified Range.
--
*
*
--
5. Spacing
Reinforcement spacing in the specified Range.
in
0.0 (E)
24.0 (W)
--
1NCEL is equal to the number of cells entered on the CTL command. **Dependent on the Clear Span: the last Range Distance for each bottom slab must be equal to the Clear Span for the given bottom slab. *See Table 5.7-2.

Chapter 5 Input Description
5-45
5.20 WLA - WALL REINFORCEMENT AREAS COMMAND
KEYWORD
COMMAND DESCRIPTION
WLA
WALL REINFORCEMENT AREAS - This command is used to specify the wall reinforcement when the areas of reinforcement per unit length of culvert are known for an existing culvert. This command is required when AR is entered as the type of run in the CTL command, and should not be entered for all other types. Either the WLA command or the WLR command can be used to describe the reinforcement, but not both. The reinforcement areas are described by ranges within a given wall. The program assumes that the beginning of each range is the end of the previous range. The first range is assumed to begin at the bottom of the wall or bottom slab face. The last range for each wall must be equal to the clear height for the given wall. This command can be repeated to specify reinforcement areas for each face of each external and the internal walls. Up to 3 reinforcement ranges may be specified for each wall, thus parameters 3 and 4 are repeatable. See Figures 5.16-1 and 5.16-2.
PARAMETER
DESCRIPTION
UNITS
LOWE
R LIMIT
UPPER LIMIT
Default
1. Wall
Number
Number of the wall for which the reinforcement is being described. Walls are numbered from left to right.
--
1
(E)
NCEL1+1
(E)
--
2. Face
Indicate at which face the reinforcement is located.
L - Reinforcement is at left face R - Reinforcement is at right face
--
L, R (E)
--
--
3. Range
Distance
Distance along the wall from the bottom slab face to the location where the specified Range ends.
ft
0.0 (E)
*
(E)
--
4. Area
The area of reinforcement per unit length of culvert for this Range.
in2
0.0 (E)
6.25 (W)
--
1NCEL is equal to the number of cells entered on the CTL command. *Dependent on the Clear Height: the last Range Distance for each wall must be equal to the Clear Height for the given wall.

Chapter 5 Input Description
5-46
5.21 WLR - WALL REINFORCEMENT COMMAND
KEYWORD
COMMAND DESCRIPTION
WLR
WALL REINFORCEMENT - This command is used to specify the wall reinforcement when the reinforcement size and spacing are known in existing culverts. This command is required when AR is entered as the type of run in the CTL command, and should not be entered for all other types. Either the WLR command or the WLA command can be used to describe the reinforcement, but not both. The reinforcement areas are described by ranges within a given wall. The program assumes that the beginning of each range is the end of the previous range. The first range is assumed to begin at the left bottom of the wall or bottom slab face. The last range distance for each wall must be equal to the clear height for the given wall. This command can be repeated to specify reinforcement areas for each face of each external and the internal walls. Up to 3 reinforcement ranges may be specified for each wall, thus parameters 3, 4 and 5 are repeatable. See Figures 5.16-1 and 5.16-2.
PARAMETER
DESCRIPTION
UNITS
LOWER LIMIT
UPPER LIMIT
Default
1. Wall
Number
Number of the wall for which the reinforcement is being described. Walls are numbered from left to right.
--
1
(E)
NCEL1+1
(E)
--
2. Face
Indicate at which face the reinforcement is located.
L - Reinforcement is at the left face R - Reinforcement is at the right face
--
L,R (E)
--
--
3. Range
Distance
Distance along the wall from the bottom slab face to the location where the specified Range ends.
ft
0.0 (E)
** (E)
--
4. Reinf. Size
or Wire Diameter
Reinforcement size in the specified Range.
--
*
*
--
5. Spacing
Reinforcement spacing in the specified Range.
in
0.0 (E)
24.0 (W)
--
1NCEL is equal to the number of cells entered on the CTL command. **Dependent on the Clear Height: the last Range Distance for each wall must be equal to the Clear Height for the given wall. *See Table 5.7-2.

Chapter 5 Input Description
5-47
5.22 FTA - FOOTING REINFORCEMENT AREAS COMMAND
KEYWORD
COMMAND DESCRIPTION
FTA
FOOTING REINFORCEMENT AREAS - This command is used to specify the footing reinforcement when the areas of reinforcement per unit length of strip footing are known for an existing culvert. This command is required when AR is entered as the type of run in the CTL command, and should not be entered for all other types. Either the FTA or the FTR command can be used to describe the reinforcement, but not both. This command can be repeated to specify the reinforcement areas for each face of each strip footing. See Figure 1. This command is not applicable for U-channels.
PARAMETER
DESCRIPTION
UNITS
LOWER LIMIT
UPPER LIMIT
Default
1. Footing
Number
The number of the footing for which the reinforcement is being described.
--
1
(E)
NCEL1+1
(E)
--
2. Face
Indicate at which face the reinforcement is located.
T - Reinforcement is at top face B - Reinforcement is at bottom face
--
T, B (E)
--
--
3. Area
The area of reinforcement per unit length of culvert for the specified face.
in2
0.0 (E)
6.25 (W)
--
1NCEL is equal to the number of cells entered on the CTL command.

Chapter 5 Input Description
5-48
5.22 FTA - FOOTING REINFORCEMENT AREAS COMMAND (Cont.)
Top FaceReinforcement
(Typical)
Bottom FaceReinforcement
(Typical)
Footing #1 Footing #2
Footing #1 Footing #2 Footing #3
Right WallLeft Wall
Right WallLeft Wall
Figure 5.22-1 Footing Reinforcement Locations

Chapter 5 Input Description
5-49
5.23 FTR - FOOTING REINFORCEMENT COMMAND
KEYWORD
COMMAND DESCRIPTION
FTR
FOOTING REINFORCEMENT - This command is used to specify the strip footing reinforcement when the reinforcement size and spacing are known in existing culverts. This command is required when AR is entered as the type of run in the CTL command, and should not be entered for all other types. Either the FTR command or the FTA command can be used to describe the reinforcement, but not both. This command can be repeated to specify the reinforcement for each face of each strip footing. See Figure 5.22-1. This command is not applicable for U-channels.
PARAMETER
DESCRIPTION
UNITS
LOWER LIMIT
UPPER LIMIT
Default
1. Footing
Number
Number of the footing for which the reinforcement is being described.
--
1
(E)
NCEL1+1
(E)
--
2. Face
Indicate at which face the reinforcement is located.
T - Reinforcement is at top face B - Reinforcement is at bottom face
--
T, B (E)
--
--
3. Reinforcement
Size or Wire Diameter
Reinforcement bar size at the specified face.
--
*
*
--
4. Spacing
Reinforcement spacing at the specified face.
in
0.0 (E)
24.0 (W)
--
1NCEL is equal to the number of cells entered on the CTL command. *See Table 5.7-2.

Chapter 5 Input Description
5-50
5.24 TVA - TOP SLAB SHEAR REINFORCEMENT AREAS COMMAND
KEYWORD
COMMAND DESCRIPTION
TVA
TOP SLAB SHEAR REINFORCEMENT AREAS - This command is used to specify the top slab shear reinforcement areas, Av, in existing culverts. This command can be repeated to specify the shear reinforcement areas for each top slab. Up to 2 shear reinforcement regions may be specified per slab, thus parameters 2 through 5 are repeatable. The regions need not be continuous, but they cannot overlap. See Figure 1. This command is not applicable for U-channels.
PARAMETER
DESCRIPTION
UNITS
LOWER LIMIT
UPPER LIMIT
Default
1. Slab Number
Number of the top slab for which the reinforcement is being described. Enter 1 if it is a single cell culvert or the left-most slab of a two cell culvert. Enter 2 if it is the right-most slab of a two cell culvert.
--
1
(E)
NCEL1
(E)
--
2. Region Start
Distance
Distance along the top slab from the left wall face for a single cell culvert or from the interior wall for slab 2 of a two cell culvert to the location where the specified Region starts.
ft
0.0 (E)
*
(E)
--
3. Region End
Distance
Distance along the top slab from the left wall face for a single cell culvert or from the interior wall for slab 2 or a two cell culvert to the location where the specified Region ends.
ft
0.0 (E)
*
(E)
--
4. Shear Reinf.
Area
Shear reinforcement area per unit culvert length in the Region.
in2
0.0 (E)
1.80 (W)
--
5. Spacing
Shear reinforcement spacing within the Region.
in
0.0 (E)
24.0 (W)
--
1NCEL is equal to the number of cells entered on the CTL command. *Dependent on the Clear Span: the Region End Distance for each top slab must be < to the Clear Span of the given top slab.

Chapter 5 Input Description
5-51
5.24 TVA - TOP SLAB SHEAR REINFORCEMENT AREAS COMMAND (Cont.)
1α
Region End Distance
Region Start Distance
SpacingRegion End Distance
Region Start Distance
Region Start Distance
Bottom Slab Number
Top Slab Number
Region End Distance
α = angle of inclination of bent-up bars (Alpha) as specified on the MAT command.
Spacing
Bent-up Bars or Inclined Stirrups
Vertical Stirrups
Spacing
1
1 Wall Number
Region Start Distance
Region End Distance
Reg
ion
Sta
rt D
ista
nce
Reg
ion
End
Dis
tanc
e
Spa
cing
Reg
ion
End
Dis
t.
Reg
ion
Sta
rt D
ist.
Spa
cing
Figure 5.24-1 Shear Reinforcement

Chapter 5 Input Description
5-52
5.25 BVA - BOTTOM SLAB SHEAR REINFORCEMENT AREAS
KEYWORD
COMMAND DESCRIPTION
BVA
BOTTOM SLAB SHEAR REINFORCEMENT AREAS - This command is used to specify the bottom slab shear reinforcement areas, Av, in existing culverts. This command can be repeated to specify the shear reinforcement area for each bottom slab. Up to 2 shear reinforcement regions may be specified per slab, thus parameters 2 through 5 are repeatable. The regions need not be continuous, but they cannot overlap. See Figure 5.24-1. This command is not applicable for U-channels.
PARAMETER
DESCRIPTION
UNITS
LOWER LIMIT
UPPER LIMIT
Default
1. Slab
Number
Number of the bottom slab for which the reinforcement is being described. Enter 1 if it is a single cell culvert or the left-most slab of a two cell culvert. Enter 2 if it is the right-most slab of a two cell culvert.
--
1
(E)
NCEL1
(E)
--
2. Region
Start Distance
Distance along the bottom slab from the left wall face for a single cell culvert or from the interior wall for slab 2 of a two cell culvert to the location where the specified Region starts.
ft
0.0 (E)
*
(E)
--
3. Region End
Distance
Distance along the bottom slab from the left wall face for a single cell culvert or from the interior wall for slab 2 of a two cell culvert to the location where the specified Region ends.
ft
0.0 (E)
*
(E)
--
4. Shear
Reinf. Area
Shear reinforcement area per unit culvert length in the Region.
in2
0.0 (E)
1.80 (W)
--
5. Spacing
Shear reinforcement spacing within the Region.
in
0.0 (E)
24.0 (W)
--
1NCEL is equal to the number of cells entered on the CTL command. *Dependent on the Clear Span: the Region End Distance for each bottom slab must be < to the Clear Span of the given bottom slab.

Chapter 5 Input Description
5-53
5.26 WVA - WALL SHEAR REINFORCEMENT AREAS
KEYWORD
COMMAND DESCRIPTION
WVA
WALL SHEAR REINFORCEMENT AREAS - This command is used to specify the wall shear reinforcement areas, Av, in existing culverts. This command can be repeated to specify the shear reinforcement area for each wall. Up to 2 shear reinforcement regions may be specified per wall, thus parameters 2 through 5 are repeatable. The regions need not be continuous, but they cannot overlap. See Figure 5.24-1. This command is not applicable for U-channels.
PARAMETER
DESCRIPTION
UNITS
LOWER LIMIT
UPPER LIMIT
Default
1. Wall
Number
Number of the wall for which the reinforcement is being described. Walls are numbered from left to reight.
--
1
(E)
NCEL+11
(E)
--
2. Region
Start Distance
Distance along the wall from the bottom slab face to the location where the specified Region starts.
ft
0.0 (E)
*
(E)
--
3. Region End
Distance
Distance along the wall from bottom slab face to the location where the specified Region ends.
ft
0.0 (E)
*
(E)
--
4. Shear
Reinf. Area
Shear reinforcement area per unit culvert length in the Region.
in2
0.0 (E)
1.80 (W)
--
5. Spacing
Shear reinforcement spacing within the Region.
in
0.0 (E)
24.0 (W)
--
1NCEL is equal to the number of cells entered on the CTL command. *Dependent on the Clear Height: the Region End Distance for each wall must be < to the Clear Height.

Chapter 5 Input Description
5-54
5.27 OIN - OUTPUT OF INPUT COMMAND
KEYWORD
COMMAND DESCRIPTION
OIN
OUTPUT OF INPUT - This command is used to control the type of input data reports which can be requested by the user. This command may only be specified once.
PARAMETER
DESCRIPTION
UNITS
LOWER LIMIT
UPPER LIMIT
Default
1. Input File
Echo
An input file echo may be generated in the output.
0 - Do not print input file echo. 1 - Print echo of input file.
--
0
(E)
1
(E)
0
2. Input
Commands
The input data may be organized according to command, with a short description for each data item.
0 - Do not print input commands. 1 - Print input commands.
--
0
(E)
1
(E)
0
3. Input
Summary
A summary of the input data may be printed.
0 - Do not print input summary. 1 - Print input summary.
--
0
(E)
1
(E)
1

Chapter 5 Input Description
5-55
5.28 OUR - OUTPUT OF RESULTS
KEYWORD
COMMAND DESCRIPTION
OUR
OUTPUT OF RESULTS - This command is used to control the type of result reports which can be requested by the user. This command is only entered if the user wants to select output other than the standard output produced by the program. Standard output tables printed are those indicated by the default values as shown for each parameter in this command.
PARAMETER
DESCRIPTION
UNITS
LOWER LIMIT
UPPER LIMIT
Default
1. Section
Properties
0 - Do not print Section Properties 1 - Print Section Properties
--
0
(E)
1
(E)
*
2. Live Load
Rating
0 - Do not print Live Load Rating 1 - Print Live Load Rating
--
0
(E)
1
(E)
*
3. Rating
Summary
0 - Do not print Rating Summary 1 - Print Rating Summary
--
0
(E)
1
(E)
*
4. DL Effects and
Capacities
0 - Do not print DL Effects and Capacities 1 - Print DL Effects and Capacities
--
0
(E)
1
(E)
*
5. Flexural
Reinforcement
0 - Do not print flexural Reinforcement
Design 1 - Print flexural Reinforcement Design
--
0
(E)
1
(E)
*
6. Shear Design
0 - Do not print Shear Design 1 - Print Bar Shear Design
--
0
(E)
1
(E)
*
7. Foundation
Pressure
0 - Do not print Foundation Pressure 1 - Print Foundation Pressures
--
0
(E)
1
(E)
*
8. Quantities
0 - Do not print Quantities 1 - Print Quantities
--
0
(E)
1
(E)
*
9. Serviceability
Table
0 - Do not print Serviceability Table 1 - Print Serviceability Table
--
0
(E)
1
(E)
*
10.Serviceability
Summary
0 - Do not print Serviceability Summary
Table 1 - Print Serviceability Summary Table
--
0
(E)
1
(E)
*
11.Foundation
Pressure Summary
0 - Do not print Foundation Pressure
Summary Table 1 - Print Foundation Press Summary Table
--
0
(E)
1
(E)
*
12.Minimum
Reinforcement Check
0 - Do not print Minimum Reinforcement
Check 1 - Print Minimum Reinforcement Check
--
0
(E)
1
(E)
*
*The default values for every parameter on this command are determined based on the type of run (analysis or design). The defaults are detailed in Chapter 6.
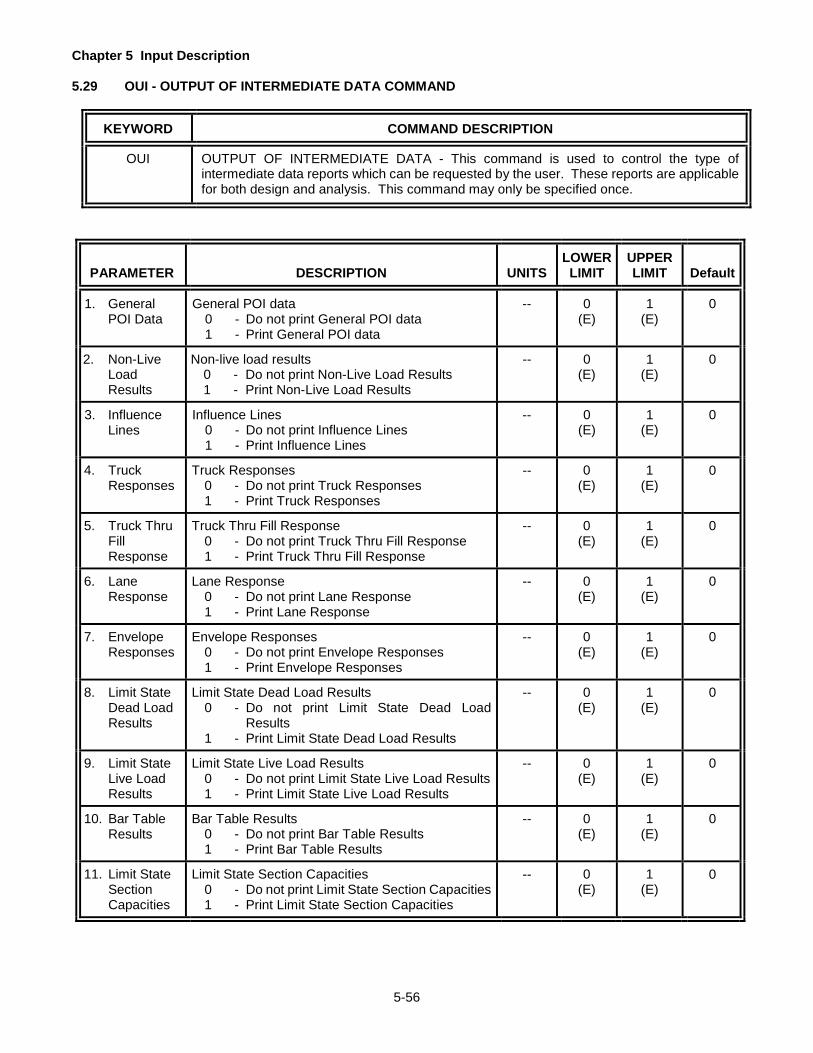
Chapter 5 Input Description
5-56
5.29 OUI - OUTPUT OF INTERMEDIATE DATA COMMAND
KEYWORD
COMMAND DESCRIPTION
OUI
OUTPUT OF INTERMEDIATE DATA - This command is used to control the type of intermediate data reports which can be requested by the user. These reports are applicable for both design and analysis. This command may only be specified once.
PARAMETER
DESCRIPTION
UNITS
LOWER LIMIT
UPPER LIMIT
Default
1. General
POI Data
General POI data
0 - Do not print General POI data 1 - Print General POI data
--
0
(E)
1
(E)
0
2. Non-Live
Load Results
Non-live load results
0 - Do not print Non-Live Load Results 1 - Print Non-Live Load Results
--
0
(E)
1
(E)
0
3. Influence
Lines
Influence Lines
0 - Do not print Influence Lines 1 - Print Influence Lines
--
0
(E)
1
(E)
0
4. Truck
Responses
Truck Responses
0 - Do not print Truck Responses 1 - Print Truck Responses
--
0
(E)
1
(E)
0
5. Truck Thru
Fill Response
Truck Thru Fill Response
0 - Do not print Truck Thru Fill Response 1 - Print Truck Thru Fill Response
--
0
(E)
1
(E)
0
6. Lane
Response
Lane Response
0 - Do not print Lane Response 1 - Print Lane Response
--
0
(E)
1
(E)
0
7. Envelope
Responses
Envelope Responses
0 - Do not print Envelope Responses 1 - Print Envelope Responses
--
0
(E)
1
(E)
0
8. Limit State
Dead Load Results
Limit State Dead Load Results
0 - Do not print Limit State Dead Load Results
1 - Print Limit State Dead Load Results
--
0
(E)
1
(E)
0
9. Limit State
Live Load Results
Limit State Live Load Results
0 - Do not print Limit State Live Load Results 1 - Print Limit State Live Load Results
--
0
(E)
1
(E)
0
10. Bar Table
Results
Bar Table Results
0 - Do not print Bar Table Results 1 - Print Bar Table Results
--
0
(E)
1
(E)
0
11. Limit State
Section Capacities
Limit State Section Capacities
0 - Do not print Limit State Section Capacities 1 - Print Limit State Section Capacities
--
0
(E)
1
(E)
0

Chapter 5 Input Description
5-57
5.29 OUI - OUTPUT OF INTERMEDIATE DATA COMMAND (Cont.)
PARAMETER
DESCRIPTION
UNITS
LOWER LIMIT
UPPER LIMIT
Default
12. Limit State
Rating Factors
Limit State Rating Factors
0 - Do not print Limit State Rating Factors 1 - Print Limit State Rating Factors
--
0
(E)
1
(E)
0
13. Limit State
Resist/ Demand Ratios
Limit State Resistance/Demand Ratios
0 - Do not print Limit State Resistance/ Demand Ratios
1 - Print Limit State Resistance/Demand Ratios
--
0
(E)
1
(E)
0
14. Limit State
Allowable Spacing
Limit State Allowable Spacing
0 - Do not print Limit State Allowable Spacings
1 - Print Limit State Allowable Spacings
--
0
(E)
1
(E)
0
15. Limit State
Service Stresses
Limit State Service Stresses
0 - Do not print Limit State Service Stresses 1 - Print Limit State Service Stresses
--
0
(E)
1
(E)
0
16. Stiffness
Analysis Model Report
Stiffness Analysis Model Report
0 - Do not print Finite Element Model Report 1 - Print Finite Element Model Report
--
0
(E)
1
(E)
0
17. Stiffness
Analysis Result Report
Stiffness Analysis Result Report
0 - Do not print Finite Element Result Report 1 - Print Finite Element Result Report
--
0
(E)
1
(E)
0
18. CMO1
(Nonlive Load)
CMO1 (Nonlive Load). Same results as those produced with Parameter 2, but formatted for easy import into a spread sheet.
0 - Do not print CMO1 (Nonlive Load) 1 - Print CMO1 (Nonlive Load)
--
0
(E)
1
(E)
0
19. CMO2
(Envelopes)
CMO2 (Envelopes). Same results as those produced with Parameter 7, but formatted for easy import into a spread sheet.
0 - Do not print CMO2 (Envelopes) 1 - Print CMO2 (Envelopes)
--
0
(E)
1
(E)
0
20. ACS1
(Influence Lines)
ACS1 (Influence Lines). Same results as those produced with Parameter 3, but formatted for easy import into a spread sheet.
0 - Do not print ACS1 (Influence Lines) 1 - Print ACS1 (Influence Lines)
--
0
(E)
1
(E)
0
21. SP (Soil
Pressure)
SP (Soil Pressure)
0 - Do not print SP (Soil Pressure) 1 - Print SP (Soil Pressure)
--
0
(E)
1
(E)
0

Chapter 5 Input Description
5-58
This page is intentionally left blank.

6-1
6. DETAILED INPUT DESCRIPTION
This chapter provides a detailed description of some of the input parameters which were described in Chapter 5,
but may need further explanation or commentary. The numbering scheme used in this chapter is as follows. The
section number for a command corresponds to the same section number in Chapter 5. The parameter being
described is preceded by a section number, whose last extension number refers to the parameter number in the
corresponding command in Chapter 5. For example, 6.10.9 Live Load Distribution Length corresponds to Section
5.10 LDC - Load Control Command, Parameter 9. Only the commands and parameters for which detailed
description is given are included in this chapter.
6.5 CTL - CONTROL COMMAND
6.5.3 Type of Run
This parameter is used to specify whether the user wants to have BXLRFD perform an Analysis (rating) or
one of three different types of design. Selecting AR, all structure member thicknesses and reinforcement
must be specified and the program performs a structural analysis, does specification checking, and then
rates the members for shear and moment. Selecting DR for the Type of Run, all culvert thicknesses must
be specified and flexure reinforcement is designed for strength. Bar spacings are computed for strength
and crack control. Shear reinforcement is computed (for top slabs, bottom slabs and walls) if required for
capacity. Selecting DC for Type of Run, all structure member thicknesses are designed and flexure
reinforcement is designed for strength. Bar spacings are computed for strength and crack control. Shear
reinforcement is not designed. Selecting DA, all structure member thicknesses are designed and flexure
reinforcement is designed for strength. Bar spacings are computed for strength and crack control. Shear
reinforcement is designed (for top slabs, bottom slabs and walls).
6.5.7 Frame Support
This parameter is used to specify whether the user wants to have BXLRFD perform an Analysis (rating) or
Design of a rigid frame culvert with either fixed supports at the bottom of the wall or pinned supports. The
pinned support option has been added to allow for analysis and design of precast frame culverts which are
placed upon cast-in-place footings. When the pinned precast frame culvert is selected, the precast or cast-
in-place parameter on the CTL command must be set to precast.

Chapter 6 Detailed Input Description
6-2
The pinned option is exclusive to precast frame culverts while fixed supports are exclusive to cast-in-place
frame culverts.

Chapter 6 Detailed Input Description
6-3
6.7 MAT – MATERIAL COMMAND
6.7.2 f’c for Top Slab
This parameter is used to specify f’c for just the top slab of cast-in-place constructed culverts. Its value
defaults to the value of f’c for all members (Parameter 1 on this command) if left blank. This parameter is
not applicable to precast culverts or U-channels and therefore it should be left blank.
6.7.3 Reinforcement Grade
This parameter is used to specify the fy grade for the reinforcement. While this value is typically 60 ksi,
values up to 100 ksi are also allowed with certain limitations. If an fy larger than 60 ksi is specified, Chief
Bridge Engineer approval is required. Also, limitations are placed on the fy value used for flexure, axial and
shear capacities.
Fy for flexure/axial is the lesser of input fy or 75 ksi.
Fy for shear is the lesser of input fy or 60 ksi.
Fy for development length is the input fy.
The fy for shear is limited to 60 ksi due to application recommendations for high strength reinforcement
outlined in AC5.4.3.3.
6.7.4 Reinforcement Type
This parameter is used to specify whether reinforcing bars or wire mesh is to be used in a precast structure.
Structures that are cast-in-place always use reinforcing bars and therefore this parameter should be left
blank.
When the Type of Run is AR (an analysis/rating), reinforcement commands (TSA or TSR, WLA or WLR,
BSA or BSR, FTA or FTR) must also be given and the value of this parameter dictates how those commands
treat the “Reinf. Size or Wire Diameter” parameter on those commands. Specifying “B” for this parameter
will cause the reinforcement commands to interpret the “Reinf. Size or Wire Diameter” parameter to be a
bar size; if “W” is specified, then it will be interpreted to be a wire diameter. Similarly, Parameter 6 of the
MAT command, “Rebar Size or Wire Diameter”, depends on the value of this parameter.
When the Type of Run is DR, DC or DA (a design), reinforcement commands cannot be specified and this
parameter is used to tell BXLRFD if it should use the maximum bar size or the maximum bar diameter when
it needs to compute the distance between the c.g. of reinforcement and the extreme compression fiber.
This is needed during the design of reinforcement area to determine the minimum concrete clear covers.

Chapter 6 Detailed Input Description
6-4
In addition, the calculation of shear capacity, Vc (LRFD 5.14.5.3-1) depends on the amount of the flexure
reinforcement, As, and the distance between the c.g. of reinforcement and the extreme compression fiber.
6.7.5 Alpha
This parameter is the angle of inclination of shear reinforcement to the longitudinal reinforcement used to
compute the shear capacity of shear reinforcing steel, Vs.
6.7.6 Rebar Size or Wire Diameter
Section 6.7.4 above explains the relationship between Reinforcement Type and this parameter. For
instance, if the Reinforcing Type is “B” for a design, then BXLRFD uses the maximum Rebar Size (this
parameter) to compute the distance between the c.g. of reinforcement and the extreme compression fiber
when it designs the flexure reinforcement. If the Reinforcement Type is “W”, then is uses the maximum
Wire Diameter.

Chapter 6 Detailed Input Description
6-5
6.8 DIM – DIMENSION COMMAND
In order to design the most efficient culvert geometry two design runs should be made. The first design run
should begin with small initial wall and slab thicknesses, which the program will increment if necessary.
The second design run should begin with initial slab thicknesses set equal to the final slab thicknesses from
the first design run, and setting the initial wall thicknesses to values that are smaller than those computed
by the first design run.
6.8.3 Top Slab Thickness
This parameter is used to specify the thickness of the top slab measured from the outside face of the left
external wall, from the top of the wall (end of the clear height) to the top of the top slab. The measurement
includes the thickness of the assumed waste material for an integral wearing surface, i.e., 0.5 inches when
there is zero fill height. When Type of Run is AR, this parameter (and the other member thicknesses)
represents the actual thickness of the top slab. When Type of Run is DC, DA or DR, this parameter (and
the other member thicknesses) represents the starting design thickness and is subsequently increased if
necessary for strength (flexure and shear) considerations.

Chapter 6 Detailed Input Description
6-6
6.10 LDC – LOAD CONTROL COMMAND
6.10.3 Number of Lanes
This parameter is utilized to specify the number of design traffic lanes to be used in determining the
response of the culvert for multiple loaded lanes. This is accomplished by using lateral distribution factors.
BXLRFD will determine if live load is applicable regardless of what is specified for this parameter.
19.10.6 Overlay Weight/Density
This parameter is used to specify material density of the overlay material. The value is multiplied by the
Overlay Thickness to determine the uniformly distributed loading to apply to the top slab. If the thickness
is zero, then there is no response for an overlay. If the thickness is greater than zero, then this loading gets
applied for either an Analysis or a Design.
If a culvert is set below road grade, but not enough to place soil fill, an overlay slab may be added by using
the Overlay Thickness parameter to specify the thickness of the overlay slab. If an overlay slab is to be
placed on the culvert, the Overlay Density should be set equal to the density of the overlay slab material. If
an overlay slab is specified, the Height of Fill parameter on the LDC command should be left blank.
6.10.7 Overlay Thickness
This parameter is used to specify thickness of the overlay material, if any. The value is multiplied by the
Overlay Weight/Density to determine the uniformly distributed loading to apply to the top slab. If the
thickness is zero, then there is no response for an overlay. If the thickness is greater than zero, then this
loading gets applied for either an Analysis or a Design.
If a culvert is set below road grade, but not enough to place soil fill, an overlay slab may be added by using
this parameter to specify the thickness of the overlay slab. If an overlay slab is specified, the Overlay
Thickness should be set equal to the thickness of the overlay slab. If an overlay slab is specified, the Height
of Fill parameter on the LDC command should be left blank.

Chapter 6 Detailed Input Description
6-7
6.10.8 Future Wearing Surface
This parameter is used to specify that a uniformly distributed loading applied to the top slab representing a
future wearing surface. If specified, it gets applied to culverts at or below grade. The program assumes a
value of zero for this parameter for an Analysis, and a value of 30 lbs/ft2 for a Design, if it is left blank. A
value of zero must be specified for a Design if the response of the culvert to a future wearing surface is to
be ignored.
6.10.9 Maximum Live Load Distribution Length
This parameter is used to limit the distribution of live load to the portion of the culvert where it physically
can be applied. For on-deck loading, it is the distance between the curbs. For the Thru Fill loading, it is
the limits of maximum fill width on the culvert. For the on-deck case, and for cell lengths less than 15 ft,
this parameter does not affect the solution. For cell lengths greater than 15 ft, the lateral distribution factor
for the greater than one lane case is limited to this parameter divided by the number of design lanes. For
the Thru-Fill case, the distribution factor for any number of lanes specified in parameter 5.10.3 is limited to
this parameter.
6.10.10 Segment Length
This parameter is used to limit the lateral distribution factors associated with the on-deck loading. This
parameter does not affect the Thru-Fill loading. Value is also used to compute volume and weight in the
quantities section of the output.

Chapter 6 Detailed Input Description
6-8
6.10.18 Live Load Override
To demonstrate the appropriate use of the live load override parameter, a description of the live load
applicability is illustrated with the following conditions.
Condition 1 – Single Cell Culvert – Fill Height > 8 ft & Culvert Width < Fill Height
For this condition the Influence Area where live load would be applied to the culvert does not intersect with
the ground line. In this case the program will not apply live load as the fill height is greater than the 8 ft and
greater than the center to center width of the exterior walls. The live load override is not required for a
single cell culvert that will be placed independently in the field (meaning it will not be adjacent to another
culvert).
Width of Culvert
Fill Height
Single Cell LL
Influence Area
1
2
Condition 2 – Twin Cell Culvert – Fill Height > 8 ft & Culvert Width > Fill Height
For this condition the twin cell culvert Influence Area intersects the ground level because the height of fill is
less than the width of the culvert between the center of the external walls. The program will automatically
apply live load and the live load override is not required.
Width of Culvert
Fill Height
Twin Cell LL
Influence Area
1
2

Chapter 6 Detailed Input Description
6-9
Condition 3 – Two Single Cell Culverts – Fill Height > 8 ft & Total Culvert Width > Fill Height
For this condition a single cell culvert is placed next to an existing single cell culvert. When considering for
D12.11.4.9P, the two single cell culverts will act as a single culvert as shown in the following diagram. The
design width of culvert, which is used to determine application of live load, should be the total width of both
culverts. In this diagram it can be seen that as a single cell culvert, the live load Influence Area does not
intersect with ground level so Live Load would not be applied by the program, however, as a two cell culvert,
the Influence Area intersects with the ground level indicating that live load should be considered during
design and or analysis. For this condition the live load override must be used to force the program to
consider live load for the single cell culvert.
New Culvert
Total Culvert Width
Fill Height
Existing Culvert
Single Cell LL Influence
Area
Two Cell LL
InfluenceArea
1
2
Condition 4 – Two Single Cell Culverts – Fill Height > 8 ft & Culvert Width < Fill Height
There are some cases where the live load override should not be used as even with the larger live load
Influence Area, the culvert will not have any live load applied. The following figure shows a case were the
live load override should not be applied because the height of fill exceeds the total culvert width.
New Culvert
Total Culvert Width
Fill Height
Existing Culvert
Single Cell LL
InfluenceArea
Two Cell LL
InfluenceArea
1
2
The previous described conditions provide general guidelines of when the live load override factor should
be used.

Chapter 6 Detailed Input Description
6-10
6.10.21 Barrier Dead Load
The barrier dead load may be assumed to be distributed over twice the width of the barrier.
Design Length = 1 ft
BarrierWidth
= 1'-8¼”
2x Barrier Width
Following this assumption, the Barrier Dead Load input for a Typical HT barrier (550 lb./ft.) would be:
𝐴𝐴𝑠𝑠𝑐𝑐𝑐𝑐𝑚𝑚𝑐𝑐𝑐𝑐 𝐷𝐷𝑐𝑐𝑠𝑠𝑑𝑑 𝐴𝐴𝑐𝑐𝑠𝑠𝑑𝑑 = 0.550𝑘𝑘𝑚𝑚𝑐𝑐𝑐𝑐𝑓𝑓𝑐𝑐
𝑃𝑃𝐴𝐴 𝐻𝐻𝑇𝑇 𝐴𝐴𝑠𝑠𝑐𝑐𝑐𝑐𝑚𝑚𝑐𝑐𝑐𝑐 𝐷𝐷𝑐𝑐𝑠𝑠𝑑𝑑 𝐴𝐴𝑐𝑐𝑠𝑠𝑑𝑑 ∗ 1′ 𝐷𝐷𝑐𝑐𝑐𝑐𝑚𝑚𝐴𝐴𝑚𝑚 𝐴𝐴𝑐𝑐𝑚𝑚𝐴𝐴𝑐𝑐ℎ
2 ∗ �1′ − 8 14 " 𝐴𝐴𝑠𝑠𝑐𝑐𝑐𝑐𝑚𝑚𝑐𝑐𝑐𝑐 𝑊𝑊𝑚𝑚𝑑𝑑𝑐𝑐ℎ�
𝐴𝐴𝑠𝑠𝑐𝑐𝑐𝑐𝑚𝑚𝑐𝑐𝑐𝑐 𝐷𝐷𝑐𝑐𝑠𝑠𝑑𝑑 𝐴𝐴𝑐𝑐𝑠𝑠𝑑𝑑 = 0.163 𝑘𝑘𝑘𝑘𝑠𝑠𝑓𝑓𝑠𝑠

Chapter 6 Detailed Input Description
6-11
6.23 FTR – FOOTING REINFORCEMENT COMMAND
Reinforcement Size or Wire Diameter
This parameter is used to specify a reinforcement bar size (if Reinforcement Type is “B”) or wire diameter
(if Reinforcement Type is “W”). Reinforcement must be specified for a Type of Run of AR, using either this
command or the FTA command.
If the Reinforcing Type is “W”, then BXLRFD interprets this parameter as a wire diameter and uses it as
necessary, no conversion or translation is done.

Chapter 6 Detailed Input Description
6-12
6.24 TVA – TOP SLAB SHEAR REINFORCEMENT COMMAND
Command Variable Information Shear Reinf. Area
This parameter is used to specify the shear reinforcement per unit length of culvert for the top slab. This
parameter, along with the Spacing parameter, is used to compute the shear capacity of the shear
reinforcement, Vs, during an Analysis (AR for Type of Run).
Spacing
This parameter is used to specify the spacing of the shear reinforcement along the top slab. This parameter,
along with the Shear Reinf. Area parameter, is used to compute the shear capacity of the shear
reinforcement, Vs, during an Analysis (AR for Type of Run). Section 3.6 and specifically LRFD 5.8.3.3 shows
how Vs is computed for a single shear reinforcing bar (spacing = 0) and for multiple shear rebars (spacing
> 0).
Additional Procedural Information
This section is provided to help explain how the BXLRFD program displays shear reinforcement design and
how to enter that information in an analysis problem. Information will be provided on where the program
checks shear based on culvert type, and how to determine if a failed Live Load Rating is due to incorrectly
set shear reinforcement regions.

Chapter 6 Detailed Input Description
6-13
Determining the Shear Region Prismatic Culvert with and without haunches
For a prismatic culvert, the BXLRFD program determines the shear regions based on the calculation of dneg
and whether the culvert has haunches. For a culvert with haunches the start of the shear region is the
distance dneg from the end of the haunch (see Fig -1). When there is not a haunch present, the shear region
starts at distance dneg from the face of the wall (see Fig – 1).
dneg
dneg
HorzHaunch
Dimension
Start ofShearRegion
Fig. 1 - Shear Region location on a Prismatic Culvert with and without haunch
dneg
dneg Start ofShearRegion
= 1/10th POI
= Special POI
Faceof
Wall
Note:
For Design dneg is calculated using the maximum bar size.
For Analysis dneg is calculated using the entered flexural bar size.
Non-Prismatic Culvert with and without haunches
The calculation of the shear regions for the non-prismatic culvert is similar to the prismatic except the
change in slab grade provides two different dneg values. The dneg for both ends of the slab must be
calculated and then 1/2 dneg is used to locate the beginning of the shear region on each end of the slab
respectively (see Fig-2).

Chapter 6 Detailed Input Description
6-14
dneg1
HorzHaunch
Dimension
Start ofShearRegion
Fig. 2 - Shear Region location and dnegon a Non-Prismatic Culvert with and without haunch
= 1/10th POI
= Special POI
dneg2
dneg1
12 Start of
ShearRegion
dneg2
12
with Haunch without Haunch
Culvert with a Standard Fish Channel
When a standard fish channel is present in the bottom slab of a culvert, the location of the shear region is
determined by treating the short 45o side as a haunch. By calculating dneg for the haunch end, and using
1/2 dneg from the end of the haunch the start of the first shear region is set. The slab end opposite of the
haunch is treated as a slab with grade taking half on dneg from the face of the wall to set the shear area (see
Fig.-4).
dneg1
HorzHaunch
Dimension
Start ofShearRegion
Fig. 4 - Shear Region location on a Culvert with a Standard Fish Channel
= 1/10th POI
= Special POI
dneg1
12
dneg2
Start ofShearRegion
dneg2
12

Chapter 6 Detailed Input Description
6-15
Culvert with a Non-Standard Fish Channel
A culvert with a non-standard fish channel is treated as a slab with a grade. Both dneg’s are calculated
independently and 1/2 dneg is used from the face of the wall to set the shear region on both sides.
dneg1
Start ofShearRegion
Fig. 5 - Shear Region location on a Culvert with a non-standard fish channel
= 1/10th POI
= Special POI
dneg1
12
dneg2
Start ofShearRegion
dneg2
12
Checking if the Shear Region was set incorrectly and caused a Rating Failure
When a design is produced in the BXLRFD program and is run as an analysis problem it is important to
make sure that the shear regions are being defined correctly. This text will provide guidelines to enter the
shear region from a design output, and how to check the shear regions in an analysis output file.
Below is the typical output from a design run that has been set to design the shear reinforcement. The
distances marked 1 and 4 represent the beginning of the first region and the end of the second region as
design in the program. The locations marked in rectangles show the locations where shear reinforcement
becomes unnecessary in the slab. By following the lines to the distance column marked 2 and 3, these
values represent the end of the first region and the start of the second.

Chapter 6 Detailed Input Description
6-16
LRFD Box Culvert Design and Rating, Version 2.2.0.0 PAGE 23 Input File: aaaaa.DAT xx/xx/xx xx:xx:xx --------------------------------------------------------------------------- SHEAR DESIGN --------------------------------------------------------------------------- Top Slab No. 1 Shear Conc+ Loading Factored Flex Shear Shear Shear Dist Code Shear Moment Reinf Depth Capac Reinf (ft) A B C D (kips) (kips-ft) (in^2) (in) (kips) (in^2) 1.22 1 6 1 1 -16.29 -12.16 1.17 8.23 10.80 0.192 2.00 1 6 1 1 -15.46 -4.52 1.17 8.23 10.80 0.170 4.00 1 6 1 1 -13.08 14.01 1.17 8.23 10.80 0.104 6.00 1 6 1 1 -10.49 28.27 1.17 8.23 10.80 0.034 8.00 1 6 1 1 -7.80 36.74 1.17 8.23 10.80 0.000 10.00 1 6 1 1 -5.14 38.83 1.17 8.23 10.80 0.000 12.00 1 5 1 1 7.77 36.43 1.17 8.23 10.80 0.000 14.00 1 5 1 1 10.46 28.03 1.17 8.23 10.80 0.033 16.00 1 5 1 1 13.06 13.81 1.17 8.23 10.80 0.104 18.00 1 5 1 1 15.45 -4.76 1.17 8.23 10.80 0.169 18.78 1 5 1 1 16.29 -12.44 1.17 8.23 10.80 0.192
It is important to note that when the program produces a design run, it will calculate the dneg based on the
maximum bar size entered on the MAT card. When the design is entered into an analysis run, the program
will use the actual bar size entered for the flexural reinforcement to calculate dneg. This will produce
variations between design and analysis and is the most probable cause of shear reinforcement issues.
The shear information provided from the design output can now be entered into the analysis input card TVA
or BVA. To accurately set the shear regions it will most likely require two analysis runs. The first run will
help to locate the analysis shear regions and redefine them for the next analysis run. For this example we
will enter the design shear regions as shown, but shorten the end of the first region one POI distance so
the rating fails.
1ST 1ST AREA 2ND 2ND AREA Slab REGION REGION OF REGION REGION OF
No START END STEEL SPACING START END STEEL SPACING
TVA 1, 1.22, 6.00, 0.20, 8.0, 12.00, 18.78, 0.20, 8.0
To view the location of the shear region the Live Load Rating Option must be set to 1 on the OUR card.
This will display the rating for all POI's in the problem. We can see below that for our example the rating
for shear at 6.00 ft has failed. It should be noted that looking over at the Reinforcement Column that no
shear steel is present. This means that the shear region must be extended to the next POI, in this case we
should set the end of the region to 8.00 ft. It can be seen for the start of the region that the PIO distance is
12.36 ft which is within the entered shear region.
1 3 4
1
4
2
3
Moved end region one POI back to provide a failed rating.

Chapter 6 Detailed Input Description
6-17
LRFD Box Culvert Design and Rating, Version 2.2.0.0 PAGE 23 Input File: aaaaa.DAT xx/xx/xx xx:xx:xx ---------------------------------------------------------------------------
LIVE LOAD RATING ---------------------------------------------------------------------------
PHL-93 Loading: Top Slab No. 1 Fact Rating Factor Fact Fact Fact Resist IR OR Dist Moment Thrust Shear (kips-ft) STR-I STR-IA Reinf (ft) (kips-ft) (kips) (kips) (kips) (in^2) 0.50 DL+E -11.17 4.12 -53.32 F2 1.61 1.60 T LL+I -26.16 1.14 DL+E -11.01 3.52 -53.39 F2 2.58 1.60 T
LL+I -16.44 0.72 1.25 DL+E -8.07 4.12 -3.99 -53.19 F2 2.32 1.60 T LL+I -19.46 1.18 -12.29 -64.32 V6 1.27 0.20 DL+E -7.91 3.52 -3.99 -53.27 F2 3.71 1.60 T LL+I -12.23 0.74 -7.72 -53.08 V6 2.02 0.20
2.00 DL+E -5.16 4.12 -3.64 -52.72 F2 3.46 1.60 T LL+I -13.76 1.83 -11.82 -64.32 V6 1.35 0.20 DL+E -5.00 3.52 -3.64 -52.79 F2 5.52 1.60 T LL+I -8.65 1.15 -7.43 -64.32 V6 2.15 0.20 4.00 DL+E 2.02 1.39 -2.73 53.60 F1 3.88 1.60 B LL+I 13.03 -0.99 -10.34 -64.32 V6 1.63 0.20 DL+E 2.02 1.39 -2.73 52.60 F1 6.17 1.60 B
LL+I 8.19 -0.62 -6.50 -64.32 V6 2.59 0.20 5.25 DL+E 6.58 1.39 -1.82 53.62 F1 2.07 1.60 B
LL+I 22.76 1.12 -8.66 -30.35 V6 0.86 0.00 DL+E 6.58 1.39 -1.82 53.62 F1 3.29 1.60 B LL+I 14.30 0.71 -5.44 -30.35 V6 1.36 0.00 8.00 DL+E 9.33 1.39 -0.92 53.56 F1 1.54 1.60 B LL+I 28.80 1.78 -6.89 -30.35 V6 1. 0.00 DL+E 9.33 1.39 -0.92 53.56 F1 2.44 1.60 B LL+I 18.10 1.12 -4.33 -30.35 V6 1.93 0.00
When producing an analysis run with an existing culvert that contains shear reinforcement it is
recommended to check the Live Load Rating report to make certain that the shear regions are correct. By
utilizing the checking method described, the chances of having a culvert not rate due to shear regions is
greatly reduced.
Location where the rating fails
This POI is the shear region start location. It is within the region entered for the analysis run.
Chapter 6 Detailed Input Description
6-18
6.25 BVA – BOTTOM SLAB SHEAR REINFORCEMENT COMMAND
The BVA command is similar to the TVA command. See Section 6.24 – TVA – Top Shear Reinforcement
Command
6.26 WVA – BOTTOM SLAB SHEAR REINFORCEMENT COMMAND
The BVA command is similar to the TVA command. See Section 6.24 – TVA – Top Shear Reinforcement
Command

Chapter 6 Detailed Input Description
6-19
6.27 OIN - OUTPUT OF INPUT COMMAND
The defaults for this command are dependent on whether an analysis or design run is being generated. A
summary of the defaults is presented in Table 1. Also presented in Table 1 is a list of the output tables
printed with each parameter.
Table 6.27-1 Summary of Defaults for OIN Command
DEFAULTS
PARAMETER
OUTPUT TABLES INCLUDED
ANALYSIS
RUN
DESIGN RUN
1. Input File Echo
INPUT DATA FILE ECHO
0
0
2. Input
Commands
COMMAND LINE INPUT
0
0
3. Input Summary
Summary of All Input Commands
1
1

Chapter 6 Detailed Input Description
6-20
6.28 OUR - OUTPUT OF RESULTS COMMAND
The defaults for this command are dependent on whether an analysis or design run is being generated. A summary
of the defaults is presented in Table 1. Also presented in Table 1 is a list of the output tables printed with each
parameter.
Table 6.28-1 Summary of Defaults for OUR Command
DEFAULTS
PARAMETER
OUTPUT TABLES INCLUDED
ANALYSIS
RUN
DESIGN RUN
1. Section
Properties
GROSS SECTION PROPERTIES
0
0
2. Live Load
Rating
LIVE LOAD RATING
0
N/A
3. Rating
Summary
RATING SUMMARY
1
N/A
4. DL Effects and
Capacities
DEAD LOAD EFFECTS AND CAPACITIES
1
N/A
5. Flexural
Reinforcement
DESIGN OF REINFORCEMENT
N/A
1
6. Shear Design
SHEAR REINFORCEMENT
N/A
1
7. Foundation
Pressure FOUNDATION PRESSURE
0
0
8. Quantities
QUANTITIES
1
1
9. Serviceability
Table SERVICABILITY TABLE
0
N/A
10. Serviceability
Summary SERVICEABILITY SUMMARY
1
N/A
11. Foundation
Pressure Summary
FOUNDATION PRESSURE SUMMARY
1
1
12. Minimum
Reinforcment Check
MINIMUM REINFORCEMENT CHECK
1
1
Note: N/A means option is not available.

Chapter 6 Detailed Input Description
6-21
6.29 OUI - OUTPUT OF INTERMEDIATE DATA COMMAND
The defaults for this command are dependent on whether an analysis or design run is being generated. A summary
of the defaults is presented in Table 1. Also presented in Table 1 is a list of the output tables printed with each
parameter. Parameters 18 (CMO1) and 19 (CMO2) give the same information as Parameters 2 and 7, respectively,
except the information is formatted for easy import into spread sheets. Parameter 20 (ASC1) gives the same
information as Parameter 3, except the information is formatted for easy import into spread sheets.
Table 6.29-1 Summary of Defaults for OUI Command
DEFAULTS
PARAMETER
OUTPUT TABLES INCLUDED
ANALYSIS
RUN
DESIGN RUN
1. General POI
Data
GROSS SECTION PROPERTIES
0
0
2. Non-Live Load
Results
NONLIVE LOAD RESPONSE
0
0
3. Influence
Lines
INFLUENCE LINES
0
0
4. Truck
Responses
TRUCK RESPONSES
0
0
5. Truck Through
Fill Responses
TRUCK THROUGH FILL RESPONSES
0
0
6. Lane
Responses
LANE RESPONSES
0
0
7. Envelope
Responses
ENVELOPE RESPONSES
0
0
8. Limit State
Dead Load Results
LIMIT STATE DEAD LOAD RESPONSES
0
0
9. Limit State
Live Load Results
LIMIT STATE LL AND LL+DL RESPONSES
0
0
10. Bar Table
Results
REINFORCEMENT DESIGN
0
0
11. Limit State
Section Capacities
LIMIT STATE SECTION CAPACITY RESULTS
0
0
12. Limit State Rating Factors
LIMIT STATE RATING FACTOR RESULTS
0
0

Chapter 6 Detailed Input Description
6-22
Table 6.29-1 Summary of Defaults for OUI Command (Cont.)
DEFAULTS
PARAMETER
OUTPUT TABLES INCLUDED
ANALYSIS
RUN
DESIGN RUN
13. Limit State
Resistance/ Demand Ratios
LIMIT STATE RESISTANCE/DEMAND RATIOS
0
0
14. Limit State
Allowable Spacing
LIMIT STATE ALLOWABLE SPACING RESULTS
0
0
15. Limit State
Service Stresses
LIMIT STATE SERVICE STRESS RESULTS
0
0
16. Stiffness
Analysis Model
NODE POINT COORDINATES BOUNDARY CONDITION INFORMATION EQUATION/NODE NUMBER MAPPING ELEMENT CONNECTIVITY ELEMENT SECTION PROPERTIES
0
0
17. Stiffness
Analysis
Results
STATIC_DISP
STATIC_FORCES
0
0
18. CMO1 (Non-
live Load)
NON-LIVE LOAD RESPONSES
0
0
20. ACS1
(Influence
Lines)
INFLUENCE LINES
0
0
21. Soil Pressure
STRIP FOOTING RESULTS
0
0

7-1
7. OUTPUT DESCRIPTION
This chapter describes the various reports that are generated by BXLRFD. Individual reports are included in the
output file by requesting them using the OIN and OUR commands discussed in Sections 5.26 and 5.27, respectively.
If the OIN and OUR commands are not specified, a standard set of reports is produced. It consists of:
Input Summary
Rating Summary
Dead Load Effects and Capacities (for when live load is not applicable)
Design of Reinforcement
Shear Design
Foundation Pressure
Quantities
Some of the above listed reports are applicable to an ANALYSIS and some to a DESIGN, and some to both.
7.1 GENERAL OUTPUT INFORMATION
Information is provided for describing output table controls, page format, page numbering, and page header. In
general, the page format is built into the program and cannot be changed by the user for either the .OUT output
file or the .PDF output file. The one exception is that the user can specify the number of blank lines to be printed
at the top of each page before the page header is printed. This formatting change will be reflected in both the
.OUT and .PDF output files accordingly.
7.1.1 Output Table Controls
The output table controls are specified using several input commands and parameters to control which
output reports will be printed. These controls are specified using three different input commands, according
to which kind of output they represent. These three kinds of output are: input data, analysis and design
results, and intermediate results. The commands and their defaults are discussed in Sections 6.26 through
6.28.
7.1.2 Page Format
There is a maximum of 99 columns in the output file. Column 1 has been left blank because it is reserved
for print characters. The output is therefore limited to 98 characters: column 2 to column 99. The user can
specify the number of lines to be left blank at the top of the page with the CFG command.

Chapter 7 Output Description
7-2
7.1.3 Page Numbering
The program assigns page numbers and determines when a new page should begin. There are certain
rules built into the program to determine when a new page should begin. The program will attempt to fit up
to the number of lines specified on the CFG command on each page. Internally, the program keeps track
of how many lines are left on the page and adjusts according to the number of lines in the heading of the
output table and a minimum number of data lines required after the heading.
7.1.4 Page Header
After the cover page, header information is printed at the top of each page. A sample header is shown in
Figure 1.
LRFD Box Culvert Design and Rating, Version 2.2.0.0 PAGE xxx
Input File: EX1.DAT xx/xx/xx xx:xx:xx
---------------------------------------------------------------------------
EXAMPLE 1
ANALYSIS (cont.)
---------------------------------------------------------------------------
Figure 7.1.4-1 Page Header
Information printed in the header includes:
1. Program Title, Version Number - the program name and version number is located at the top left
corner of the header.
2. Page Number - the page number appears at the top right corner of the header.
3. Input File - the name of the input data file used to create this output is shown at the beginning of the
second line.
4. Date and Time - the data and time of the program execution for this problem is printed at the right
side of the second line.
5. A separator line is printed between program specific header information and user specified header
information.
6. The next header line contains the first title line input by the user via the TTL command. This should
be a general descriptive line used to describe the problem to be run.
7. The next header line contains the type of output specified by the user.
8. The final header line is another separator line.

Chapter 7 Output Description
7-3
7.1.5 Units
For each value presented in the output, the corresponding units are provided. The units are presented in
the column headings directly below the column description. Presented in Table 1 is a summary of the basic
units of measure used by this program.
Table 7.1.5-1 Units
Variable Unit of Measure
AREA in2 AXLE LOAD kips AXLE SPACING ft CLEAR SPAN ft CLEAR HEIGHT ft CONCRETE CLEAR COVERS in CONCRETE DENSITY or UNIT WEIGHT lbf/ft3 DIAMETER in DISTANCE ALONG SLAB OR WALL ft DISTRIBUTED LOAD kip/ft EARTH WEIGHT/DENSITY lbf/ft3 FISH CHANNEL DIMENSIONS in FORCE kips FUTURE WEARING SURFACE lbf/ft2 f ’c ksi GAGE DISTANCE ft HAUNCH DIMENSIONS in LANE LOAD kip/ft LANE WIDTH ft LIVE LOAD SURCHARGE ft MASS N/A MODULUS OF ELASTICITY ksi MOMENT kip-ft MOMENT OF INERTIA in4 OVERLAY WEIGHT/DENSITY lbf/ft3 PASSING DISTANCE ft REINFORCEMENT AREA in2/ft REINFORCEMENT SPACING in ROTATION radians SHEAR kips STRESS ksi THICKNESS in WEIGHT lbf WIDTH in

Chapter 7 Output Description
7-4
7.1.6 Sign Conventions
The sign convention used for forces and moments associated with each culvert component is shown in
Figure 1. This convention is as follows:
Moment: Positive when it produces tension in the bottom fiber of a slab or in a right most fiber of a
wall.
Shear: Positive when it increases the moment going from left to right on slabs, or bottom to top
on walls.
Load: Positive where it acts towards the culvert.
Axial Force: Positive when it produces compression in the section.
Stress: Positive when it is tensile.

Chapter 7 Output Description
7-5
Figure 7.1.6-1 Positive Sign Convention for Axial/Shear/Moments

Chapter 7 Output Description
7-6
7.2 COVER PAGE
The first page of the output is the cover page. The following information is shown at the top of the cover page:
1. Program Title - LRFD Box Culvert Design and Rating
2. Program Name - BXLRFD
3. Version ii.nn - where ii represents the numeric designation for major revisions and enhancements to the
program and nn represents the numeric designation for minor revisions.
4. Last Updated - this is the date the program was last revised.
5. Documentation - this is the date the User’s Manual was last revised.
6. License Number - this is a unique number assigned to all licensees per the License Agreement.
The middle section of the cover page is reserved for the first 10 TTL commands input by the user. This information
typically should describe the bridge, location, stationing, span length, type of structure, and any other information
the user would need to identify the output.
The copyright notice is placed at the bottom of the cover page. This is the standard copyright notice and warranty
disclaimer which is printed by all PennDOT programs. Per the license agreement, any duplications, alterations, or
unauthorized use of these materials is strictly prohibited. A sample Cover Page is shown in Figure 1.

Chapter 7 Output Description
7-7
*************************************************************************** * * * Program Name LRFD Box Culvert Design and Rating * * Program Number 00000000 * * Version 2.2.0.0 * * Last Updated x/xx/xx * * Documentation x/xx/xx * * License No. 123456 * * * *************************************************************************** * * * Line 1 - This is the first line of the ten allowed * * Line 2 - This is the second line of the ten allowed * * Line 3 - This is the third line of the ten allowed * * Line 4 - This is the fourth line of the ten allowed * * Line 5 - This is the fifth line of the ten allowed * * Line 6 - This is the sixth line of the ten allowed * * Line 7 - This is the seventh line of the ten allowed * * Line 8 - This is the eighth line of the ten allowed * * Line 9 - This is the ninth line of the ten allowed * * Line 10 - This is the tenth line of the ten allowed * * * *************************************************************************** * * * COPYRIGHT © 2010 * * COMMONWEALTH OF PENNSYLVANIA * * DEPARTMENT OF TRANSPORTATION * * * * ALL RIGHTS RESERVED * * * * DUPLICATION, ALTERATION, OR OTHER UNAUTHORIZED * * USE OF THESE MATERIALS IS STRICTLY PROHIBITED. * * * * * * THE COMMONWEALTH EXCLUDES ANY AND ALL IMPLIED WARRANTIES, * * INCLUDING WARRANTIES OF MERCHANTABILITY AND FITNESS FOR A * * PARTICULAR PURPOSE, AND LIMITS THE USER'S REMEDY TO * * RETURN OF THE SOFTWARE AND DOCUMENTATION TO THE COMMONWEALTH * * FOR REPLACEMENT. * * * * THE COMMONWEALTH MAKES NO WARRANTY OR REPRESENTATION, EITHER * * EXPRESS OR IMPLIED, WITH RESPECT TO THIS SOFTWARE OR * * ACCOMPANYING DOCUMENTATION, INCLUDING THEIR QUALITY, * * PERFORMANCE, MERCHANTABILITY, OR FITNESS FOR A PARTICULAR * * PURPOSE. THIS SOFTWARE AND DOCUMENTATION ARE PROVIDED * * "AS IS" AND THE USER ASSUMES THE ENTIRE RISK AS TO * * THEIR QUALITY AND PERFORMANCE. * * * * THE COMMONWEALTH WILL NOT BE LIABLE FOR ANY DIRECT, INDIRECT, * * SPECIAL, INCIDENTAL, OR CONSEQUENTIAL DAMAGES ARISING OUT * * OF THE USE OR INABILITY TO USE THE SOFTWARE OR ANY * * ACCOMPANYING DOCUMENTATION. * * * * THE COMMONWEALTH WILL NOT BE LIABLE FOR ANY DIRECT, INDIRECT, * * SPECIAL, INCIDENTAL, OR CONSEQUENTIAL DAMAGES ARISING OUT * * OF ANY DEFECT IN THE SOFTWARE OR ANY ACCOMPANYING DOCUMENTATION. * * * ***************************************************************************
Figure 7.2-1 Cover Page

Chapter 7 Output Description
7-8
7.3 INPUT DATA
The input data consists of an echo of the input file, summary of input commands, and input summary tables. Each
of these can individually be turned on or off. A summary of the output tables included is given in Section 6.26.
7.3.1 Input File Echo
The input file echo is a listing of the input commands and comments as entered by the user. The user can
refer to this section to trace input errors and warnings by comparing the input data to the input descriptions
provided in Chapter 5. The input file can contain 256 characters in a single line, but the output is limited to
75 characters on a single line. If the input line contains more than 75 characters, the input file echo will be
wrapped to the next row. Other than this limitation, the echo of the input file should appear the same as
the input data file. A sample Input Echo Report is shown in Figure 1.

Chapter 7 Output Description
7-9
LRFD Box Culvert Design and Rating, Version 2.2.0.0 PAGE xx Input File: LBTEST.IN xx/xx/xx xx:xx --------------------------------------------------------------------------- Line 1 - This is the first line of the ten allowed ECHO OF INPUT FILE --------------------------------------------------------------------------- LBTEST.IN --------- CFG 83, 0 ! TTL Line 1 - This is the first line of the ten allowed TTL Line 2 - This is the second line of the ten allowed TTL Line 3 - This is the third line of the ten allowed TTL Line 4 - This is the fourth line of the ten allowed TTL Line 5 - This is the fifth line of the ten allowed TTL Line 6 - This is the sixth line of the ten allowed TTL Line 7 - This is the seventh line of the ten allowed TTL Line 8 - This is the eighth line of the ten allowed TTL Line 9 - This is the ninth line of the ten allowed TTL Line 10 - This is the tenth line of the ten allowed ! ! ! ! DESIGN CON BOT FNL ! UNITS, NCELL TYPE TYPE SLAB BC CTL US, 2, AR, C, N, M ! ! ! PRGM STATE SPAN ! ID COUNTY ROUTE SEGMENT OFFSET ID SID =BXLRFD, 50, 666, 555, 9996, 654 ! ! ! FPC REBAR ALPHA MAX EPOXY CONCRETE DENSITY ! FPC TS FY TYPE ANGLE REBAR COATED FOR DL FOR EC MAT 5.0, 5.0, 65, B, 33.5, 11, Y, 150.0, 145.0 ! ! ! TS BS LW RW IW SOIL TS ! SPAN HEIGHT THICK THICK THICK THICK THICK GRADE GRADE DIM 19.0, 16.0, 36.0, 0.0, 36.0, 36.0, 36.0, 0.0, 0.0 ! ! ! FTNG FTNG ! WIDTH THICK FTG 96.0, 30.0
Figure 7.3.1-1 Input Echo
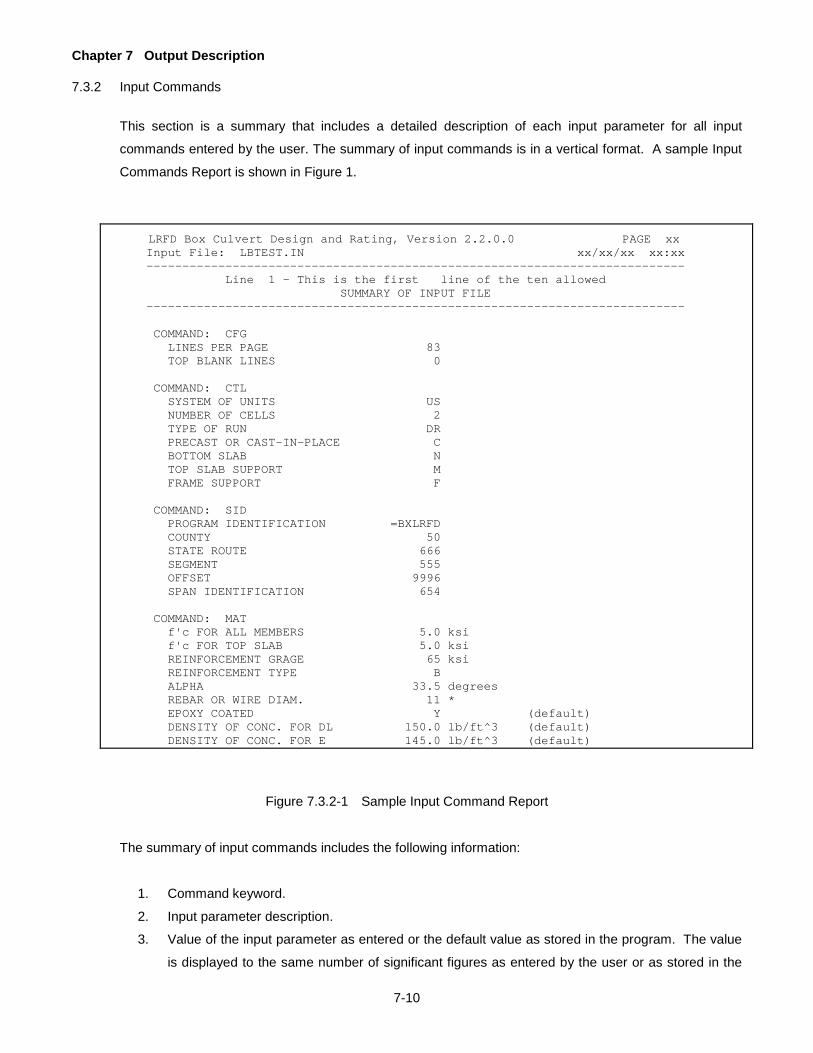
Chapter 7 Output Description
7-10
7.3.2 Input Commands
This section is a summary that includes a detailed description of each input parameter for all input
commands entered by the user. The summary of input commands is in a vertical format. A sample Input
Commands Report is shown in Figure 1.
LRFD Box Culvert Design and Rating, Version 2.2.0.0 PAGE xx Input File: LBTEST.IN xx/xx/xx xx:xx --------------------------------------------------------------------------- Line 1 - This is the first line of the ten allowed SUMMARY OF INPUT FILE --------------------------------------------------------------------------- COMMAND: CFG LINES PER PAGE 83 TOP BLANK LINES 0 COMMAND: CTL SYSTEM OF UNITS US NUMBER OF CELLS 2 TYPE OF RUN DR PRECAST OR CAST-IN-PLACE C BOTTOM SLAB N TOP SLAB SUPPORT M FRAME SUPPORT F COMMAND: SID PROGRAM IDENTIFICATION =BXLRFD COUNTY 50 STATE ROUTE 666 SEGMENT 555 OFFSET 9996 SPAN IDENTIFICATION 654 COMMAND: MAT f'c FOR ALL MEMBERS 5.0 ksi f'c FOR TOP SLAB 5.0 ksi REINFORCEMENT GRAGE 65 ksi REINFORCEMENT TYPE B ALPHA 33.5 degrees REBAR OR WIRE DIAM. 11 * EPOXY COATED Y (default) DENSITY OF CONC. FOR DL 150.0 lb/ft^3 (default) DENSITY OF CONC. FOR E 145.0 lb/ft^3 (default)
Figure 7.3.2-1 Sample Input Command Report
The summary of input commands includes the following information:
1. Command keyword.
2. Input parameter description.
3. Value of the input parameter as entered or the default value as stored in the program. The value
is displayed to the same number of significant figures as entered by the user or as stored in the

Chapter 7 Output Description
7-11
input parameter file. The word (default) is placed to the right of the units when default values are
used. An asterisk (*) indicates the input value is optional and was not entered.
4. Units if applicable.
5. Any warnings or errors encountered with respect to the input data.
Input values may be optional or required. Required input is input that is entered by the user or set to the
default value stored in the program. Default values are indicated with the text (default) placed to the right
of the units. If there is no default value stored in the program and the user does not enter a value, an error
message is displayed.
Optional input does not need to be entered by the user. An asterisk (*) is printed for the value indicating the
input value is optional. In some cases when input is not entered, the program sets the value. An example
of an optional input parameter set by the program is the reinforcement cover. Some input is optional
because it is not required for the particular problem being run. For example, the footing dimension is not
required for a closed box analysis. For more information regarding specific input requirements, refer to
Chapter 5.
Any warnings or errors encountered while processing the input data will be reflected with the appropriate
input command under the summary of input commands. If this level of input data output is turned off, the
warnings will still appear, though without the added benefit of the warnings and errors being grouped with
the corresponding input command. After encountering warnings or errors, the program also prints a
message to the screen advising the user to review the output file for explanations of the warnings and
errors.
7.3.3 Input Summary
The input summary consists of tables that include summaries of all input parameters in horizontal tabular
format. The input summary tables also include any processed input. Processed input is input that gets
computed by the program based on other input items, including program set optional input values. A more
complete description of all input items can be found in Chapters 5 and 6. A sample Summary of Input File
Report is shown in Figure 1.

Chapter 7 Output Description
7-12
LRFD Box Culvert Design and Rating, Version 2.2.0.0 PAGE xx
Input File: LBTEST.IN xx-xxx-xx xx:xx:xx
---------------------------------------------------------------------------
Line 1 - This is the first line of the ten allowed
INPUT SUMMARY
---------------------------------------------------------------------------
CONTROL Sys of No of Type Bottom Top Slab Frame Units Cells of Run P or C Slab Support Support US 1 DR P Y F N/A STRUCTURE IDENTIFICATION Program State Span ID County Route Segment Offset ID =BXLRFD 50 666 555 9996 654 MATERIAL f'c All f'c Reinf Reinf Rebar Epoxy Members Top Slab Grade Type Alpha Size Coated (ksi) (ksi) (ksi) (deg) 5.00 5.00 65.0 B 33.5 11 Y Concrete Density For DL For Ec (lb/ft^3) (lb/ft^3) 150.0 145.0 DIMENSIONS Clear Clear Slab Thickness Wall Thickness Fill Top Slab Span Height Top Bottom Left Right Int Grade Grade (ft) (ft) (in) (in) (in) (in) (in) (%) (%) 9.00 6.00 12.5 12.5 12.0 12.0 0.0 0.00 0.00 Left U-channel Right U-channel Wall Height Wall Height (ft) (ft) 0.00 0.00 LOAD CONTROL Future Earth Ht of No of Live Load Live Overlay Overlay Wearing Wt/Den Fill Lanes Surcharge Load Wt/Den Thick Surface (pcf) (ft) (ft) (pcf) (ft) (psf) 140.0 5.00 1 3.00 A 150.0 0.00 0.0 Live Load Multiple PA Fatigue Distrib Segment Presence Traffic Dynamic Load Duct Redund Length Length Factor Factor Allowance Factor Factor (ft) (ft) 25.00 12.00 1.00 N/A N/A 1.00 1.00 Permit Max Live Min Equiv Max Equiv Barrier Import Dynamic Load Load Fluid Fluid Dead Factor Allowance Override Pressure Pressure Load (pcf) (pcf) (kips/ft) 1.0 1.15 0 45.00 70.00 0.50
Figure 7.3.3-1 Sample Summary of Input Commands Report

Chapter 7 Output Description
7-13
The input summary tables contain the following information:
1. A description of the input data.
2. Input parameter header containing an abbreviated parameter description and units.
3. Input parameter values. The input values are shown to a fixed number of decimal places because of
the tabular format. The actual input value may be rounded to fit the output format. Refer to the
summary of input commands for the actual value input by the user.

Chapter 7 Output Description
7-14
7.4 RESULTS
This section describes in detail the Analysis, Design and general reports that can be generated by BXLRFD. Each
subsection discusses a single report. The report is described in general terms, then each column of data is
identified, and then a sample report is presented and discussed in detail. Some of the reports are quite involved
and actual numbers are used to help clarify what the numbers mean and where they come from.
7.4.1 Additional Information
The additional information report provides information relevant to the run such as computed values and
additional geometric information.
LRFD Box Culvert Design and Rating, Version 2.4.1.0(TEST) PAGE 11
Input File: ...bx\BIN\Bxrev204\Design\bxrev177-100.dat 02/12/2013 16:03:20
---------------------------------------------------------------------------
SR 0201- 31' CLEAR SPAN (EDGE BEAM)
ADDITIONAL INFORMATION
---------------------------------------------------------------------------
COMPUTED VALUES
Computed Computed Computed Computed
Input Flexure Axial Shear Development
Reinf Reinf Reinf Reinf Reinf
Grade Grade Grade Grade Grade
(ksi) (ksi) (ksi) (ksi) (ksi)
100.000 75.000 75.000 60.000 100.000
Figure 7.4.1-1 Sample Additional Information Report
The following information is reported for all structure types:
1. Input Reinforcement Grade – user entered reinforcement grade from the MAT command
2. Computed Flexure Reinforcement Grade – reinforcement grade used for all flexural capacity
calculations
3. Computed Axial Reinforcement Grade – reinforcement grade used for all axial capacity calculations
4. Computed Shear Reinforcement Grade – reinforcement grade used for all shear capacity calculations
5. Computed Development Reinforcement Grade – reinforcement grade used for all development length
calculations

Chapter 7 Output Description
7-15
LRFD Box Culvert Design and Rating, Version 2.5.1.0(TEST) PAGE 8 Input File: D:\LRFD\bx\BIN\Bxrev194\EX5.DAT 11/20/2013 10:11:55 --------------------------------------------------------------------------- BXLRFD EXAMPLE PROBLEM #5 ADDITIONAL INFORMATION (cont.) --------------------------------------------------------------------------- ADDITIONAL GEOMETRY Final Component Thickness Top Slab #1 Lft: 25.35 in Top Slab #1 Rgt: 18.19 in Top Slab #2 Lft: 17.84 in Top Slab #2 Rgt: 10.68 in Note: For sloped Top Slabs, the thickness is measured at the face of the walls or the end of haunches if present. Wall #1 : 12.00 in Wall #2 : 12.00 in Wall #3 : 12.00 in Bot Slab #1 : 15.00 in Bot Slab #2 : 15.00 in
Figure 7.4.1-2 Sample Additional Geometry Report
The following information is reported for top slabs of box culverts
No Slope
1. Top Slab #1 – thickness of the Top Slab for the first cell
2. Top Slab #2 - thickness of the Top Slab for the second cell
With Slope
1. Top Slab#1 Lft: - thickness of the top slab at the face (or end of haunch if present) of wall 1
2. Top Slab#1 Rgt: - thickness of the top slab at the face (or end of haunch if present) of wall 2
3. Top Slab#2 Lft: - thickness of the top slab at the face (or end of haunch if present) of wall 2
4. Top Slab#2 Rgt: - thickness of the top slab at the face (or end of haunch if present) of wall 3
The following information is reported for walls of box culverts
1. Wall #1 – thickness of the wall 1
2. Wall #2 – thickness of the wall 2
3. Wall #3 – thickness of the wall 3
The following information is reported for bottom slabs of box culverts. For bottom slabs with fish channels,
the program will report the thickness at the bottom of the fish channel.
1. Bot Slab #1 – thickness of the bottom slab 1
2. Bot Slab #2 – thickness of the bottom slab 2
The following information is reported for strip footings of frame culverts
1. Left Wall Toe Projection – toe projection of the footing under the left wall
2. Left Wall Heel Projection – heel projection of the footing under the left wall

Chapter 7 Output Description
7-16
3. Center Wall Projection – projection for the footing on either side of the center wall
4. Right Wall Toe Projection – toe projection of the footing under the right wall
5. Right Wall Heel Projection – heel projection of the footing under the right wall
7.4.2 Gross Section Properties
This table is applicable for any “Type of Run”, and includes all culvert components, e.g., top slab, external
wall, etc., and strip footings. This table provides component lengths and gross section properties: member
thickness, moment of inertia and cross sectional area. The properties are associated with the unreduced
section, e.g., before section reductions are made for scour, foundation unevenness, integral wearing
surface, and are reported at all points-of-interest, POI’s.
The following information is reported in the GROSS SECTION PROPERTIES output tables:
1. Clear Span - clear span of a culvert cell
2. Dist - distance from the beginning of the culvert component (i.e., the face of wall or slab) to the point-
of-interest, POI
3. Dist/Span Ratio - distance to span ratio of the POI
4. Member Thickness - total thickness of the member at the POI (includes any sacrificial covers)
5. Inertia - moment of inertia about the centroid of the section
6. Area - cross sectional area
A sample Gross Section Report is shown in Figure 1.

Chapter 7 Output Description
7-17
LRFD Box Culvert Design and Rating, Version 2.2.0.0 PAGE xx
Input File: LBTEST.IN xx-xxx-xx xx:xx:xx --------------------------------------------------------------------------- Line 1 - This is the first line of the ten allowed GROSS SECTION PROPERTIES --------------------------------------------------------------------------- Top Slab No. 1 Clear Span: 19.00 (ft) Dist/Span Member Dist Ratio Thickness Inertia Area (ft) (in) (in^4) (in^2) 0.00 0.00 36.00 46656.000 432.00 1.90 0.10 36.00 46656.000 432.00 2.77 0.15 36.00 46656.000 432.00 3.80 0.20 36.00 46656.000 432.00 5.70 0.30 36.00 46656.000 432.00 7.60 0.40 36.00 46656.000 432.00 9.50 0.50 36.00 46656.000 432.00 11.40 0.60 36.00 46656.000 432.00 13.30 0.70 36.00 46656.000 432.00 15.20 0.80 36.00 46656.000 432.00 16.23 0.85 36.00 46656.000 432.00 17.10 0.90 36.00 46656.000 432.00 19.00 1.00 36.00 46656.000 432.00 Note: Wall distances begin at the bottom of the wall and slab distances begin at the left side of the slab.
Figure 7.4.2-1 Sample Gross Section Properties Report
7.4.3 Live Load ELAT and IM Table
This table is applicable for design and analysis runs only when live loading is applied to the culvert. The
table reports the Dynamic Load Allowance and Live Load Distribution values used by the program, along
with intermediate information where applicable.
The following information is reported in the LIVE LOAD ELAT & IM output table:
Dynamic Load Allowance
1. Fill Height - average height of fill above the culvert.
2. IM - the calculated Dynamic Load Allowance factor.
3. Permit Truck IM - the calculated Dynamic Load Allowance factor for the P-82 and PA2016-13 truck
load.
Case 1 - On Deck Loading
1. No. of Lanes Loaded - number of loaded lanes ELAT is calculated for.
2. c-c Culvert Span - distance between the centerlines of the walls for a single span.
3. MPF - Multiple Presence factor including multiple presence reduction factor.

Chapter 7 Output Description
7-18
4. Calc Elat - calculated ELAT value based on Eq. D4.6.2.12.2P-1.
5. Calc Elat/MPF - Calculated Elat divided by MPF.
6. Seg Length – For cast-in-place culverts, this is the culvert segment length.
For precast culverts, this is the culvert segment length times the number of precast
shear transfer segments
7. Elat Used - final ELAT used by the program.
Case 2 - Thru Fill Loading
1. No. of Lanes Loaded - number of loaded lanes ELAT is calculated for.
2. Fill Height - average height of fill above culvert.
3. Live Load Distribution Length - user entered distribution length.
4. MPF - Multiple Presence factor including multiple presence reduction factor.
5. Total Width (LANE(i)) - Geometric lane width less thru-fill gaps (Section 3.3.17.2).
6. Elat Used - final ELAT used by program for the number of lanes.
LRFD Box Culvert Design and Rating, Version x.x.x.x PAGE xx Input File: TEST.DAT xx/xx/xxxx xx:xx:xx ------------------------------------------------------------------------------------ BXLRFD EXAMPLE PROBLEM #xx LIVE LOAD ELAT & IM TABLE ------------------------------------------------------------------------------------ Dynamic Load Allowance Fill Permit Height IM IM (ft) 4.50 1.18 N/A Case 1 - On Deck Loading No. of c-c Calc Elat Lanes Culvert Calc --------- Elat Loaded Span MPF * Elat MPF Seg Length Used (ft) (ft) (ft) (ft) (ft) 1 13.00 1.20 9.56 7.97 90.0 7.97 Case 2 - Thru Fill Loading No. of LL Total Lanes Fill Distribution Width Elat Loaded Height Length MPF * (LANE(i)) Used (ft) (ft) (ft) (ft) 1 4.50 60.0 1.20 12.84 10.70 2 4.50 60.0 1.00 22.84 11.42 * Includes Multiple Presence Reduction Factor
Figure 7.4.3-1 Sample Live Load ELAT & IM Table

Chapter 7 Output Description
7-19
7.4.4 Serviceability Check Table
This table is applicable for an analysis run and gives detailed information for all POI’s of all culvert
components e.g. slabs, walls, strip footings. The table reports whether a POI has failed for any of the
serviceability checks listed below by placing an asterisk next to the allowable spacing or controlling stress
value.
The following information is reported in the SERVICEABILITY CHECK output table for slabs and walls:
1. Dist – distance from the beginning of the culvert component to the POI.
2. Location – Whether the location at the POI is on the Top/Bottom Or Left/Right.
3. Bar Size - User entered bar size for the POI location.
4. Input Spacing - User entered bar spacing for the POI location.
5. Minimum Primary Spacing - Calculated allowable minimum spacing for the primary steel.
6. Maximum Primary spacing - Calculated allowable maximum spacing for the primary steel.
7. Temp/Shrink Spacing - Calculated allowable temperature and shrinkage spacing for the primary steel.
8. Crack Control Spacing – Calculated allowable crack control spacing.
9. Tens Reinf Stress – actual stress of the primary reinforcement that is in tension.
10. Codes - A - used to indicate live loading.
Due to the lengthiness of the information in this table a secondary table provides some of the information
in the Serviceability Summary Table described in Section 7.4.6. The program will only display the
Serviceability Check and Summary (Section7.4.4) tables when a user entered bar size and spacing is
detected.

Chapter 7 Output Description
7-20
LRFD Box Culvert Design and Rating, Version 2.2.0.0 PAGE xx Input File: xxx.DAT xx/xx/xxxx xx:xx:xx --------------------------------------------------------------------------- BXLRFD EXAMPLE PROBLEM #5 SERVICEABILITY SPACING CHECK --------------------------------------------------------------------------- Top Slab No. 1 Minimum Maximum Temp/ Crack Tens Bar Input Primary Primary Shrink Control Reinf Codes Dist Loc Size Spacing Spacing Spacing Spacing Spacing Stress A (ft) (in) (in) (in) (in) (in) (ksi) 0.00 T 7 6.50 2.50 18.00 18.00 B 7 7.50 2.50 18.00 18.00 99.99 1.59 2 1.90 T 7 6.50 2.50 18.00 18.00 B 7 7.50 2.50 18.00 18.00 40.75 9.98 2 2.05 T 7 6.50 2.50 18.00 18.00 B 7 7.50 2.50 18.00 18.00 38.27 10.55 2 4.10 T 7 6.50 2.50 18.00 18.00 B 7 7.50 2.50 18.00 18.00 22.30 16.76 2 ERROR!: User entered bar size and spacing has failed to meet serviceability criteria. An asterisk (*) indicates which criteria failed. Check the bar size and spacing against the allowable serviceability criteria. Refer to Design Manual Part 4, Section 5.7.3.4. Temp/Shrinkage Codes: Code A: Loading A - Steel Area is less 1 PHL-93 than allowable 2 HL-93 B - Steel Spacing is 3 P-82 greater than 4 ML-80 allowable 5 HS-20 N/A - Section thickness is 6 H-20 greater than 18 in 7 SLL
8 TK527 9 EV2 Z EV3 Y SU6TV X PA2016-13 Note: Wall distances begin at the bottom of the wall and slab distances begin at the left side of the slab.
Figure 7.4.4-1 Sample Serviceability Check Report for slabs and walls
The following information is reported in the SERVICEABILITY CHECK output table for strip footings:
1. Dist - distance from the face of the wall, left or right, to the POI.
2. Direction - Either L or R indicating which direction the POI is from the face of the wall
3. Face Location - either T or B indicating whether the crack control spacing is for the top face or the
bottom face.
4. Bar Size - User entered bar size for the POI location.
4. Input Spacing - User entered bar spacing for the POI location.
5. Minimum Primary Spacing - Calculated allowable minimum spacing for the primary steel.
6. Maximum Primary spacing - Calculated allowable maximum spacing for the primary steel.

Chapter 7 Output Description
7-21
7. Temp/Shrink Spacing - Calculated allowable temperature and shrinkage spacing for the primary steel.
8. Crack Control Spacing – Calculated allowable crack control spacing.
9. Tens Reinf Stress – actual stress of the primary reinforcement that is in tension.
10. Codes - A - used to indicate live loading.
LRFD Box Culvert Design and Rating, Version 2.2.0.0 PAGE xx Input File: xxx.DAT xx/xx/xxxx xx:xx:xx --------------------------------------------------------------------------- BXLRFD EXAMPLE PROBLEM #5 SERVICEABILITY SPACING CHECK --------------------------------------------------------------------------- STRIP FOOTING: Wall No. 1 Minimum Maximum Temp/ Crack Tens Bar Input Primary Primary Shrink Control Reinf Codes Dist Loc Size Spacing Spacing Spacing Spacing Spacing Stress A (ft) (in) (in) (in) (in) (in) (ksi) 2.16L T 9 5.00 2.50 18.00 18.00 B 9 5.00 2.50 18.00 18.00 99.99 1.16 4 0.00L T 9 5.00 2.50 18.00 18.00 B 9 5.00 2.50 18.00 18.00 62.93 6.76 4 0.00R T 9 5.00 2.50 18.00 18.00 B 9 5.00 2.50 18.00 18.00 99.99 2.14 4 2.16R T 9 5.00 2.50 18.00 18.00 B 9 5.00 2.50 18.00 18.00 99.99 0.13 4 ERROR!: User entered bar size and spacing has failed to meet serviceability criteria. An asterisk (*) indicates which criteria failed. Check the bar size and spacing against the allowable serviceability criteria. Refer to Design Manual Part 4, Section 5.7.3.4. Temp/Shrinkage Codes: Code A: Loading A - Steel Area is less 1 PHL-93 than allowable 2 HL-93 B - Steel Spacing is 3 P-82 greater than 4 ML-80 allowable 5 HS-20 N/A - Section thickness is 6 H-20 greater than 18 in 7 SLL
8 TK527 9 EV2 Z EV3 Y SU6TV X PA2016-13 Note: Wall distances begin at the bottom of the wall and slab distances begin at the left side of the slab.
Figure 7.4.4-2 Sample Serviceability Check Report for strip footings
7.4.5 Serviceability Summary Table
This table is applicable for an Analysis run and displays a summary of whether any serviceability conditions
have failed for all components.

Chapter 7 Output Description
7-22
The following information is reported in the SERVICEABILITY SUMMARY output table:
1. Minimum Primary Spacing – Indicates whether allowable minimum spacing for the primary steel has
passed.
2. Maximum Primary spacing – Indicates whether allowable maximum spacing for the primary steel has
passed.
3. Temp/Shrink Spacing – Indicates whether allowable temperature and shrinkage spacing for the primary
steel has passed.
4. Crack Control Spacing – Indicates whether allowable crack control spacing has passed.
This table is switched on by default. If both the Serviceability Check Table (Section 7.4.3) and the
Serviceability summary Table are switched off and a component fails to meet serviceability criteria, an error
message will be displayed in the output under the Serviceability Summary heading.
LRFD Box Culvert Design and Rating, Version 2.2.0.0 Page: xx
Input File: EX8ANTEST.DAT 10/22/2001 10:48:21 --------------------------------------------------------------------------- BXLRFD Example Problem #8 SERVICEABILITY SPACING SUMMARY --------------------------------------------------------------------------- Minimum Maximum Temp/ Crack Primary Primary Shrink Control Location Spacing Spacing Spacing Spacing Top Slab No. 1 OK OK OK NG Wall No. 1 OK OK OK NG Wall No. 2 OK OK OK OK STRIP FOOTING: Wall No. 1 OK OK OK OK STRIP FOOTING: Wall No. 2 OK OK OK OK ERROR!: Serviceability criteria has not been met. For further details activate the Serviceability Check Table in the OUR command. Then verify entered bar size and spacing values.
Figure 7.4.5-1 Sample Serviceability Summary Report
7.4.6 Live Load Rating
This table is applicable for an Analysis with live load (see Section 3.3.2.4 for a discussion when live load is
applicable), and includes all culvert components, e.g., top slab, external wall, etc., other than strip footings.
(The Strip Footing Rating Report is described in Section 7.4.6.) This table gives very detailed information
(and can be quite voluminous) on the demands and capacities (flexure and shear) of all analysis points,
referred to as Points-Of-Interest, POIs. A smaller version of this table, containing a summary of just some
of the information in this table, is the Rating Summary Report described in Section 7.4.7. The table indicates
in the heading whether Future Wearing Surface load is included in the ratings.
The following information is reported in the LIVE LOAD RATING output tables:

Chapter 7 Output Description
7-23
1. Name of Live Load - the name of the live load appears in the table heading, along with the name and
number of the component, e.g., Top Slab No. 1.
2. Dist - distance from the beginning of the culvert component to the POI.
3. Loading category - either “DL+E” for dead load results or “LL+I” for live load results.
4. Fact Moment - factored moment, either dead or live load, associated with the smallest flexure rating
factor.
5. Fact Thrust -factored axial force, either dead or live load, associated with the smallest flexure rating
factor.
6. Fact Shear -factored shear, either dead or live load, associated with the smallest shear rating factor.
7. Fact Resist - factored moment or shear resistance.
8. Zone – the controlling zone, either tension, compression, or transition.
9. Rating Factors - Inventory, IR, and Operating, OR, rating factors.
10. Prov Reinf – provided flexure reinforcement.
11. Face Location - either T or B indicating whether the smallest rating factor is for the top face of the
bottom face.
12. Min Reinf – Minimum required reinforcement.
13. Phi Factor – the flexural resistance factor.
A sample Live Load Rating table is shown in Figure 1. Blank lines have been added for clarity around the
POI at a distance of 0.77 ft. Note that the information for each POI includes 4 lines. The first two are the
inventory rating, and the last two are the operating rating information. All demands and capacities are
associated with the Maximum Effect Case with the smallest rating factor. Cases 1, 2, 3 and 4 are
considered for flexure, and Cases 1, 2, 5 and 6 are considered for shear. See Section 3.4 for a description
of the six Maximum Effect Cases.
The number of live loads reported in this table depends on the Live Load selected on the LDC Command:
A, B, C, D, E, F, G, H, or I. Each live load uses a particular limit state to compute its Inventory and Operating
rating. For example, the PHL-93 live load uses Strength I for Inventory and Strength IA for Operating, while
the ML-80 and TK527 live loads use Strength I for Inventory and Strength II for Operating. In addition, the
P-82 and PA2016-13 live load and FAST ACT live loads EV2, EV3, SU6TV are considered just at the
Operating level, using Strength II for its rating, and consequently has two fewer lines of information for each
POI. See Table 2.5-1 for complete information on which limit states are used to compute the IR and OR
for each possible live load.
The amount of flexural reinforcement for the appropriate face (top/bottom, or left/right) as well as the
minimum amount of required flexural reinforcement is also reported for each POI, as is any shear
reinforcement. Any blank entries in the table (usually associated with shear information) are due to the fact
the some POIs are used to check just moment, not moment and shear, and therefore shear results are not

Chapter 7 Output Description
7-24
applicable. Usually the POI closest to the ends of the components is just a moment POI and will not contain
any shear results. More POIs will be moment only if haunches are present since only moment is considered
within the haunch.
The smallest flexure and shear Inventory and Operating Rating factors are reported for each POI, along
with the associated factored dead and live loads. Dead load + earth are labeled “DL+E”, and live load +
dynamic load allowance are labeled “LL+I.” The factored flexure resistance is the Mr value shown in Section
3.5.1.2. The factored shear resistance is the Vr value shown in Section 3.5.
In Figure 1, at a distance of 0.77 ft, the smallest flexure IR, among all Maximum Effect Cases, is 35.94.
The “F” just to the left of the 35.94 indicates that this is a flexure rating; the number “1” to the right of the
“F” indicates that Maximum Effect Case 1 (Maximum Positive Moment and Concurrent Thrust) had the
smallest flexure rating. The factored dead load moment and concurrent thrust associated with Maximum
Effect Case 1 for Strength I for the PHL-93 live loading are 0.25 kips-ft and -0.79 kips, respectively. The
factored live load moment and concurrent thrust are on the line below, and are 1.70 kips-ft and 0.09 kips,
respectively; the factored moment resistance is 61.50 kips-ft (on the line with the rating factor). Thus all
the information is present to compute the flexure rating factor, i.e., RF = (Mr-Mudl)/Mull, or (61.50-0.25)/1.70
= 35.97, close to the reported value of 35.94. Note that Mudl and Mull are the factored dead and live load
moments. Finally, the amount of flexural reinforcement at this POI location is 1.56 in2 and the letter “B”
next to it indicates that the controlling face is the bottom (the positive sign of Mr reflects this also).
The smallest shear IR, among all Maximum Effect Cases, is 3.12. The “V” just to the left indicates that this
is a shear rating; the number 6 to the right of the “V” indicates that Maximum Effect Case 6 (Maximum
Negative Shear and Concurrent Moment) had the smallest shear rating. The factored dead load shear
associated with Maximum Effect Case 6 for Strength I for the PHL-93 live loading is -4.40 kips. The
associated factored live load shear is on the line below, and is -5.14 kips; the factored shear resistance, φv
(Vc+Vs), is -20.43 kips (on the line with the rating factor). Thus all the information is present to compute the
shear rating factor, i.e., RF = (Vr-Vudl)/Vull, or (-20.43-(-4.40))/(-5.14) = 3.11, close to the reported value of
3.12. Note that Vudl and V ull are the factored dead and live load shears. Finally, the amount of shear
reinforcement at this POI location is 0.00 in2 indicating that no shear steel exists at this location.
Similar information to that just discussed is reported on the next two lines and is associated with the
Operating level rating factors and Strength IA for this live load.
Lastly, the POI at location 0.00 ft and at 9.00 ft are moment only POIs due to the fact that only flexure
results are reported.

Chapter 7 Output Description
7-25
LRFD Box Culvert Design and Rating, Version2.2.0.0 Page: xx Input File: VER01_SIMPLE.IN xx-xxx-xx xx:xx:xx --------------------------------------------------------------------------- Line 1 - This is the first line of the ten allowed LIVE LOAD RATING W/ FWS --------------------------------------------------------------------------- PHL-93 Loading: Top Slab No. 1 Fact Rating Factor Fact Fact Fact Resist IR OR Prov Min Phi Dist Moment Thrust Shear (kips-ft) Zone STR-I STR-IA Reinf Reinf Factor (ft) (kips-ft) (kips) (kips) (kips) (in^2) (in^2) 0.00 DL+E -5.05 -3.81 -63.42 F4 TN 20.21 1.56 T 0.74 0.90 LL+I -2.89 -0.25 DL+E -4.90 -3.50 -63.41 F4 TN 32.23 1.56 T 0.74 0.90 LL+I -1.82 -0.15 0.77 DL+E 0.25 -0.79 -4.40 61.50 F1 TN 35.94 1.56 B 0.73 0.90 LL+I 1.70 0.09 -5.14 -20.43 V6 3.12 0.00 DL+E 0.25 -0.79 -4.40 61.50 F1 TN 57.18 1.56 B 0.73 0.90 LL+I 1.07 0.06 -3.23 -20.43 V6 4.96 9.00 DL+E -5.06 -3.81 -63.43 F4 TN 20.34 1.56 T 0.74 0.90 LL+I -2.87 -0.25 DL+E -4.91 -3.50 -63.42 F4 TN 32.43 1.56 T 0.74 0.90 LL+I -1.80 -0.15 * Negative Rating due to deadload effects being greater than capacity
F or V reported after the Fact Resist indicates whether the Rating is for Flexure (F) or Shear (V). The numerical code reported after F or V corresponds to the governing Maximum Effect Case for the Rating Factor.
Maximum Effect Cases:
1 Maximum Positive Moment and Concurrent Thrust 2 Maximum Negative Moment and Concurrent Thrust 3 Maximum Tension Thrust and Concurrent Moment 4 Maximum Compression Thrust and Concurrent Moment 5 Maximum Positive Shear and Concurrent Moment 6 Maximum negative Shear and Concurrent Moment T, B, L, or R reported after the Reinforcement (Reinf) indicates the location of the flexural reinforcement reported: T Top steel in a slab B Bottom steel in a slab L Left steel in a wall R Right steel in a wall Zone Code Descriptions TN – Tension controlled section TR – Transition section CM – Compression controlled section
Phi Factor Epsilon (cl) = 0.00200 Phi Factor Epsilon (tl) = 0.00500
Note: Wall distances begin at the bottom of the wall and slab distances begin at the left side of the slab.
Figure 7.4.6-1 Sample Live Load Rating Report

Chapter 7 Output Description
7-26
7.4.7 Strip Footing Performance Ratios
This table is applicable for an Analysis and includes only strip footings. (The Live Load Rating Report
described in Section 7.4.5. It gives Shear and Moment Performance Ratios, which are the factored
resistance divided by the factored force. The table indicates in the heading whether Future Wearing Surface
load is included in the ratings.
The following information is reported in the STRIP FOOTING PERFORMANCE RATIOS output tables:
1. Dist - distance from the face of the wall, left or right, to the POI.
2. Direction - Either L or R indicating which direction the POI is from the face of the wall
3. Face Location - either T or B indicating whether the smallest rating factor is for the top face of the
bottom face.
4. Flexure Load Code - limit state (A), maximum effect case (B), live load (C), live load type (D) associated
with the smallest flexure performance ratio.
5. Fact Moment - factored moment associated with the smallest flexure performance ratio.
6. Moment Resistance - factored moment resistance associated with the smallest performance ratio.
7. Moment Perf Ratio - smallest flexure performance ratio.
8. Phi Factor – the flexural resistance factor.
9. Shear Loading Code - limit state (A), maximum effect case (B), live load (C), live load type (D)
associated with the smallest shear performance ratio.
10. Fact Shear - factored shear associated with the smallest flexure performance ratio.
11. Shear Resist - factored shear resistance associated with the smallest performance ratio.
12. Shear Perf Ratio - smallest shear performance ratio.
A sample Strip Footing Rating Report is shown in Figure 1. All demands and capacities are associated
with the Limit State, Maximum Effect Case, Live Load and Live Load Type (On Deck or Through Fill) that
minimizes the performance ratio.
Limit States Strength I, Strength II and Strength IA, and all Maximum Effect Cases are considered for both
flexure and shear. (Recall that the moment in the footing is calculated from the total limit state response at
the bottom of the wall, so all six Maximum Effect Cases must be investigated.) Different live loads are used
for each limit state and the number and type of live loads used for the analysis depend on the selected live
load type on the LDC command. See Section 5.10 for a description of the LDC command. See Section
3.4 for a description of the six Maximum Effect Cases.

Chapter 7 Output Description
7-27
Two lines of information are used for each flexure POI: one for the top face, and one for the bottom face.
Only one line is used for each shear POI.
Four columns are associated with the flexure information and four columns for the shear information. The
Flexure and Shear Loading Code part of each line of information indicates the controlling Limit State,
Maximum Effect Case, Live Load and Live Load Type: Code A is the Limit State, Code B is the Maximum
Effect Case, Code C is the Live Load and Code D is the Live Load Type. The Legend at the end of the
table describes the values of the four Loading Codes.
The four columns of flexure information are reported first. The Flexure Loading Code is the condition that
causes the least perf. ratio.
The four columns of shear information are reported after the flexure information. The Shear Loading Code
is the condition that causes least perf. ratio.
In Figure 1, at a location of 0.00 ft from right face of Wall No. 1. The Moment Performance Ratio is 1.90
for the top face and bottom face. The Flexure Loading Codes indicate that Limit State Strength I, Maximum
Effect Case 4 (Maximum Compression Thrust with concurrent moment and shear in the wall), Live Load H-
20 and On Deck, cause this smallest ratio to occur. The total factored moment and factored resistance
associated with Strength I, Maximum Effect Case 4, H-20 and On Deck are 10.01 k-ft and 19.05 k-ft,
respectively.
In Figure 1, at a location of 1.69 ft from left face of Wall No. 1, the Shear Performance Ratio is 45.71. The
Shear Loading Codes indicate that Limit State Strength I and Maximum Effect Case 1 (Maximum Positive
Moment and Concurrent Thrust in the wall), Live Load PHL-93 and On Deck, cause this smallest ratio to
occur. The total factored shear and factored resistance associated with Strength I and Maximum Effect
Case 1, PHL-93 and Thru Fill are -0.49 k and -22.32 k, respectively.

Chapter 7 Output Description
7-28
LRFD Box Culvert Design and Rating, Version 2.0.0.0 PAGE xx Input File: 2011culv.dat xx/xx/xxxx xx:xx:xx --------------------------------------------------------------------------- SR2011 CULVERT DESIGN STRIP FOOTING PERFORMANCE RATIOS W/ FWS --------------------------------------------------------------------------- Wall No. 1 Flexure Moment Shear Shear Loading Fact Moment Phi Perf Loading Fact Shear Perf Dist Code Moment Resist Factor Ratio Code Shear Resist Ratio (ft) A B C D (kipS-ft) (kips-ft) A B C D (kips) (kips) 1.69L 1 1 1 1 -0.49 -22.32 45.71 0.00LT 1 1 1 1 9.80 19.05 0.9 1.94 2 2 4 1 5.11 22.32 4.37 LB 1 1 1 1 9.80 19.05 0.9 1.94 0.00RT 1 4 6 1 10.04 19.05 0.9 1.90 RB 1 4 6 1 10.04 19.05 0.9 1.90 Shear POI check at distance d not being done/reported on right side because distance d is outside the footing. Wall No. 2 Flexure Moment Shear Shear Loading Fact Moment Phi Perf Loading Fact Shear Perf Dist Code Moment Resist Factor Ratio Code Shear Resist Ratio (ft) A B C D (kipS-ft) (kips-ft) A B C D (kips) (kips) 0.00LT 1 4 6 1 10.10 19.05 0.9 1.89 LB 1 4 6 1 10.10 19.05 0.9 1.89 0.00RT 1 2 1 1 9.72 19.05 0.9 1.96 1 1 4 1 -5.18 -22.32 4.31 RB 1 2 1 1 9.72 19.05 0.9 1.96 1.69R 1 2 1 1 0.48 22.32 46.14 Shear POI check at distance d not being done/reported on left side because distance d is outside the footing. L or R after the distance indicates the Left or Right side of the strip footing. T or B after the distance indicates the location of the flexural reinforcement reported: T Top steel in footing B Bottom steel in footing Flexure/Shear Loading Codes: Code A Code B Code C Code D 1 Strength-I 1 Maximum Positive Moment 1 PHL-93 1 On Deck 2 Strength-II 2 Maximum Negative Moment 2 HL-93 2 Thru Fill 3 Strength-IA 3 Maximum Tension Thrust 3 P-82 4 Maximum Compression Thrust 4 ML-80 5 Maximum Positive Shear 5 HS-20 6 Maximum Negative Shear 6 H-20 7 SLL 8 TK527 9 EV2 Z EV3 Y SU6TV X PA2016-13
Figure 7.4.7-1 Sample Strip Footing Performance Ratios Report

Chapter 7 Output Description
7-29
7.4.8 Rating Summary
This table is applicable for an Analysis with live load, and includes all culvert components, e.g., top slab,
external wall, etc., other than strip footings. This table gives just a summary of controlling rating factors at
the Inventory and Operating levels, and indicates whether they are shear or moment, and where they occur
within each component. Minimum Inventory and Operating rating factors for the entire culvert are identified
by type and location within the component in which they occur. The table indicates in the heading whether
Future Wearing Surface load is included in the ratings. Finally, a table is located at the end of the Rating
Summary that provides the single controlling rating and tonnage for each load as well as the controlling
component and location.
The following information is reported in the RATING SUMMARY output tables:
1. Live Loading - the name of the live load is shown in the table header.
2. Member No. - Culvert member and number.
3. Dist - distance from the beginning of the culvert component to the controlling IR POI.
4. Dist/Span Ratio - distance ratio of the controlling IR POI.
5. IR Rating Factor - name of the live load associated with the Inventory Rating, IR, and the rating factor.
6. IR Rating Tonnage - rating value displayed in tons.
7. Dist - distance from the beginning of the culvert component to the controlling OR POI.
8. Dist/Span Ratio - distance ratio of the controlling OR POI.
9. OR Rating Factor - name of the live load associated with the Operating Rating, OR, and the rating
factor.
10. OR Rating Tonnage - rating value displayed in tons.
A sample Rating Summary Report is shown in Figure 1. There is a table for each live load in the analysis.
The number of live loads reported in this table depends on the Live Load selected on the LDC Command:
A, B, C, D, E or F, G, H or I. Each live load uses a particular limit state to compute its Inventory and
Operating rating. For example, the PHL-93 live load uses Strength I for Inventory, and Strength IA for
Operating, while the ML-80 and TK527 live loads use Strength I for Inventory, and Strength II for Operating.
In addition, the P-82 and PA2016-13 live load and FAST Act live loads EV2, EV3, SU6TV are considered
just at the Operating level, using Strength II for its rating, and consequently has three fewer columns of
information.

Chapter 7 Output Description
7-30
LRFD Box Culvert Design and Rating, Version2.2.0.0 Page: xx Input File: VER01_SIMPLE.IN xx-xxx-xx xx:xx:xx --------------------------------------------------------------------------- Line 1 - This is the first line of the ten allowed RATING SUMMARY W/ FWS --------------------------------------------------------------------------- Loading: PHL-93
Dist/ IR IR Dist/ OR OR Span Rating Rating Span Rating Rating Member No. Dist Ratio Factor Tonnage Dist Ratio Factor Tonnage (ft) STR-I (ton) (ft) STR-II (ton) Top Slab 1 4.50 0.50 2.49 F 89.67 4.50 0.50 3.23 F 116.24 Bot Slab 1 0.50 0.06 1.61 F 57.79 0.50 0.06 2.17 F 78.15 Wall 1 0.50 0.08 2.15 F 77.35 0.50 0.08 2.79 F 100.27
Wall 2 0.50 0.08 2.14 F 77.09 0.50 0.08 2.78 F 99.93
* Negative Rating due to deadload effects being greater than capacity
The Minimum Inventory Rating is governed by SHEAR. The Minimum Inventory Rating Factor is 3.56 at Distance 0.82 (ft) in TOP SLAB 1. The Minimum Operating Rating is governed by SHEAR. The Minimum Operating Rating Factor is 5.67 at Distance 0.82 (ft) in TOP SLAB 1. F or V reported after the Rating Factor indicates whether the Rating is for Flexure (F) or Shear (V).
Note: Wall distances begin at the bottom of the wall and slab distances begin at the left side of the slab.
Figure 7.4.8-1 Sample Rating Summary Report
The following information is reported in the COMBINED RATING SUMMARY output tables:
1. Member – Location of controlling inventory rating for the Live Load Vehicle
2. Distance – Distance to controlling inventory rating along member for the Live Load Vehicle
3. Limit State – Limit State which generated the controlling inventory rating for the Live LoadVehicle
4. Rating – Controlling inventory rating for the Live Load Vehicle
5. Rating Tons – Controlling inventory tonnage for the Live Load Vehicle
6. Member – Location of controlling operating rating for the Live Load Vehicle
7. Distance – Distance to controlling operating rating along member for the Live Load Vehicle 8. Limit State – Limit State which generated the controlling operating rating for the Live Load
Vehicle 9. Rating – Controlling operating rating for the Live Load Vehicle 10. Rating Tons – Controlling operating tonnage for the Live Load Vehicle
A sample Combined Rating Summary Report is shown in Figure 2. There is a column for each live load in
the analysis. The number of live loads reported in this table depends on the Live Load selected on the LDC
Command: A, B, C, D, E or F.

Chapter 7 Output Description
7-31
LRFD Box Culvert Design and Rating, Version 2.7.0.0 PAGE xx Input File: D:\LRFD\bx\BIN\Bxrev210\test\EX5.DAT xx/xx/xxxx xx:xx:xx -------------------------------------------------------------------------------------- BXLRFD EXAMPLE PROBLEM #5 RATING SUMMARY W/O FWS (cont.) ------------------------------------------------------------------------------------- +++++++++++++++++++++++++++++++++++++++++++++ + + + C O M B I N E D + + R A T I N G S U M M A R Y + + + +++++++++++++++++++++++++++++++++++++++++++++ H20 HS20 HL-93 INVENTORY Member Top Slab 2 Top Slab 2 Top Slab 2 RATING Dist. (ft) 20.17 20.17 20.17 (IR) Limit State STR-I STR-I STR-I Rating 0.95 V 0.84 V 0.74 V Rating Tons 18.95 30.10 -- H20 HS20 HL-93 OPERATING Member Top Slab 2 Top Slab 2 Top Slab 2 RATING Dist. (ft) 20.17 20.17 20.17 (OR) Limit State STR-II STR-II STR-IA Rating 1.23 V 1.09 V 1.18 V Rating Tons 24.60 39.08 -- All ratings are based on the exclusion of the design future wearing surface. F or V reported after the Rating Factor indicates whether the Rating is for Flexure (F) or Shear (V).
Figure 7.4.8-2 Sample Combined Rating Summary
7.4.9 Dead Load Effects and Capacities
This table is applicable for an Analysis without live load, and includes all culvert components, e.g., top slab,
external wall, etc., other than strip footings.
The following information is reported in the DEAD LOAD EFFECTS AND CAPACITIES output tables:
1. Dist - distance from the beginning of the culvert component to the controlling IR POI.
2. Dist/Span Ratio - distance ratio of the controlling IR POI.
3. Loading Code - limit state (A) and maximum effect case (B) associated with the smallest
resistance/demand ratio.
4. Moment - factored moment associated with the smallest flexure resistance/demand ratio.
5. Thrust - factored axial force associated with the smallest flexure resistance/demand ratio.
6. Shear - factored shear force associated with the smallest shear resistance/demand ratio.

Chapter 7 Output Description
7-32
7. Factored Resist - factored resistance, moment or shear, associated with the smallest
resistance/demand ratio.
8. Zone – the controlling zone, either tension, compression, or transition.
9. Resist/Demand Ratio - the smallest flexure or shear resistance/demand ratios.
10. Prov Reinf – Provided flexure or shear reinforcement.
11. Min Reinf – Minimum required reinforcement.
12. Phi Factor – the flexural resistance factor.
A sample Dead Load Effects And Capacities Report is shown in Figure 1. Blank lines have been added for clarity
around the POI at a distance of 0.77 ft. (The string 999.99 is printed if the smallest resistance/demand ratio is larger
than 999.99.) An “F” is printed next to the factored resistance to indicate moment information, and a “V” indicates
shear information. All demands and capacities are associated with the Limit State and Maximum Effect Case with
the smallest resistance/demand ratio. Cases 1, 2, 3 and 4 are considered for flexure, and Cases 1, 2, 5 and 6 are
considered for shear. See Section 3.4 for a description of the six Maximum Effect Cases.
Two lines of information are given for each POI: one for moment and one for shear. The Loading Code part of each
line of information indicates the controlling Limit State and Maximum Effect Case: Code A is the Limit State and
Code B is the Maximum Effect Case. The Legend at the end of the table describes the values of the two Loading
Codes.
The amount of flexural reinforcement for the appropriate face (top/bottom, or left/right) as well as the minimum
amount of required flexural reinforcement is also reported for each POI, as is any shear reinforcement. Any POI
that has just a single line of information is due to the fact the some POIs are used to check just moment, not moment
and shear, and therefore shear results are not applicable. Usually the POI closest to the ends of the components
is just a moment POI and will not contain any shear results. More POIs will be moment only if haunches are present
since only moment is considered within the haunch.
In Figure 1, at a distance of 0.77 ft, the smallest flexure resistance/demand ratio, among all Maximum Effect Cases,
is 7.69. The “F” just to the left of the 7.69 indicates that this is a flexure resistance/demand ratio; the number “1”
for Loading Code A and the number “1” for Load Code B indicates that Limit State Strength I and Maximum Effect
Case 1 (Maximum Positive Moment and Concurrent Thrust) had the smallest flexure resistance/demand ratio. The
associated factored dead load moment and thrust associated with Strength I and Maximum Effect Case 1 are 8.50
kips-ft and -8.77 kips, respectively, and the factored moment resistance is 65.40 kips-ft. Thus all the information is
present to compute the flexure resistance/demand ratio, i.e., r/d = Mr /Mudl, or 65.40/8.50 = 7.69. Finally, the amount
of flexural reinforcement at this POI location is 1.56 in2 and the letter “B” next to it indicates that the controlling face
is the bottom (the positive sign of M reflects this also).
The smallest shear resistance/demand ratio, among all Maximum Effect Cases, is 0.27. The “V” just to the left of
the 0.27 indicates that this is a shear resistance/demand ratio; the number “1” for Loading Code A and the number

Chapter 7 Output Description
7-33
“6” for Load Code B indicates that Limit State Strength I and Maximum Effect Case 6 (Maximum Negative Shear
and Concurrent Moment) had the smallest shear resistance/demand ratio. The associated factored dead load shear
associated with Strength I and Maximum Effect Case 6 is -74.78 kips, and the factored shear resistance, φv (Vc+Vs),
is -20.43 kips. Thus all the information is present to compute the shear resistance/demand ratio, i.e., r/d = Vr /Vudl,
or -20.43)/-74.78 = 0.27. Finally, the amount of shear reinforcement at this POI location is 0.00 in2 indicating that
no shear steel exists at this location.
Lastly, the POI at location 0.00 ft and at 9.00 ft are moment only POIs due to the fact that only flexure results are
reported.

Chapter 7 Output Description
7-34
LRFD Box Culvert Design and Rating, Version 2.2.0.0 Page: xx Input File: ver01_simple.in xx-xxx-xx xx:xx:xx --------------------------------------------------------------------------- Line 1 - This is the first line of the ten allowed DEAD LOAD EFFECTS AND CAPACITIES --------------------------------------------------------------------------- Top Slab No. 1 Dist/ Factored Resist/ Span Loading Resist Demand Prov Min Phi Dist Ratio Code Moment Thrust Shear (kips-ft) Zone Ratio Reinf Reinf Factor (ft) A B (kips-ft) (kips) (kips) (kips) (in^2) (in^2) 0.00 0.00 1 2 -7.15 4.04 -2.60 F TN 0.36 * 0.07 T 0.22 ** 1.00 0.48 0.06 1 2 -2.91 4.08 -3.48 F TN 1.19 0.07 T 0.20 ** 1.00 1 6 -8.31 -13.16 V 1.58 0.00 0.80 0.10 1 1 1.26 0.92 15.13 F TN 12.05 0.38 B 0.20 1.00
1 6 -7.56 -13.16 V 1.74 0.00
Loading Codes: Code A Code B 1 Strength-I 1 Maximum Positive Moment 2 Strength-II and Concurrent Thrust 3 Strength-IA 2 Maximum Negative Moment and Concurrent Thrust 3 Maximum Tension Thrust and Concurrent Moment 4 Maximum Compression Thrust and Concurrent Moment 5 Maximum Positive Shear and Concurrent Moment 6 Maximum Negative Shear and Concurrent Moment F or V reported after the Factored Resistance indicates whether the Resistance, Ratio, and Reinforcement reported are for Flexure (F) or Shear (V). Zone Code Descriptions TN – Tension controlled section TR – Transition section CM – Compression controlled section
Phi Factor Epsilon (cl) = 0.00200 Phi Factor Epsilon (tl) = 0.00500
Note: Wall distances begin at the bottom of the wall and slab distances begin at the left side of the slab.
Figure 7.4.9-1 Sample Dead Load and Capacities Report

Chapter 7 Output Description
7-35
7.4.10 Flexural Reinforcement Design - Reinforcement Bar
This table is applicable for a Design and includes all culvert components, e.g., top slab, external wall, strip
footings, etc. This table provides the primary result for a design: the amount of top and bottom flexure
reinforcement at each POI required to resist the applied factored forces and moments, and the permitted
reinforcement bar spacings. The spacings are given for eight rebar sizes, and are the smaller of that
required to satisfy strength, i.e., to provide the required As per unit length, and that to satisfy crack control
requirements. See Section 3.5.2 for a discussion of how the crack control spacings are calculated.
Spacings are rounded down to the nearest 0.5 in .
The following information is reported in the FLEXURAL REINFORCEMENT DESIGN output tables:
1. Member Name - the culvert member, e.g., Top Slab, appears in the table heading.
2. Face Location - the flexure reinf. location, either Top Face or Bottom Face appears in the table heading.
3. Dist - distance from the beginning of the culvert component to the POI.
4. Flexure Load Code - limit state (A), maximum effect case (B), live load (C), live load type (D) associated
with the largest amount of flexure reinforcement.
5. Factored Moment - factored moment associated with the required flexure reinforcement.
6. Factored Thrust - factored axial force associated with the largest amount of flexure reinforcement.
7. Factored Resisting Moment – factored resisting moment based on the required area of steel.
8. Factored Resisting Thrust – factored resisting thrust based on the required area of steel.
9. Zone – the controlling zone, either tension, compression, or transition.
10. Flex Reinf - required flexure reinforcement.
11. Phi Factor – the flexural resistance factor.
12. Bar Spacing - bar spacings for eight (8) bar sizes, with any associated codes.
A sample Flexural Reinforcement Design Report is shown in Figure 1. There is a table for the top or left
face, and the bottom or right face for each culvert component. There are always two lines of information
printed for each POI: one for the first four bar sizes, and one for the second four. The first line also contains
the required area of flexure reinforcement for strength and the set of Strength Loading Codes associated
with the required area. The controlling total limit state moment is also printed on the first line. The thrust is
printed on the second line. If reinforcement is not required, then the Loading Codes and demands are not
applicable and they are left blank.
The Flexure Loading Code part of the first line of information indicates the controlling Limit State, Maximum
Effect Case, Live Load and Live Load Type: Code A is the Limit State, Code B is the Maximum Effect
Case, Code C is the Live Load, and Code D is the Live Load Type. The Legend at the end of the table
describes the values of the four Strength Loading Codes. Limit States Strength I, Strength II and
Construction, and Maximum Effect Cases 1, 2, 3 and 4 are considered for flexure design. Different live

Chapter 7 Output Description
7-36
loads are used for each limit state and the number and type of live loads used for the design depend on the
selected live load type on the LDC command. See Section 5.10 for a description of the LDC command.
See Section 3.4 for a description of the six Maximum Effect Cases.
The total factored moment and thrust used to design the flexure reinforcement are given after the Flexure
Loading Code. The required flexure reinforcement is reported after the factored moment and thrust. This
amount of reinforcement is required in the indicated face for strength considerations to resist all factored
loads. If an “M” is printed next to the flexure reinforcement, then the minimum reinforcement controls the
design at the particular POI location.
For each point of interest the applicable condition for that section is reported in the Zone column - TN for
tension-controlled, CM for compression-controlled, and TR for balanced condition (see Section 3.5.1.2).
The phi resistance factor used in determining the nominal flexural resistance of the section for analysis runs
is shown in the Phi Factor column. For design runs, the phi resistance factor shown in the Phi Factor
column is used to compute the required area of reinforcement.
Bar spacings that are controlled by crack control requirements are indicated by an integer Crack Control
Code (1 through 8, see the Legend at the end of the table) and any spacing that exceeds the minimum or
maximum allowed is indicated by a letter code (V or W, again, see the table Legend). Bar spacings with
an integer Crack Control Code have a spacing less than that required to provide the design As, and
therefore will provide more As than that required for strength.
The Crack Control Codes contain only the Maximum Effect Cases and On Deck or Through Fill because
there is only one Limit State (Service I) and only one Live Load (PHL 93) used in crack control calculations.
In Figure 1, for the bottom face of the top slab, at a location of 5.55 ft, the amount of flexure reinforcement
is 0.52 in2. The Strength Loading Codes indicate that Strength I, Maximum Effect Case 1 (Maximum Positive
Moment and Concurrent Thrust), PHL-93 and On Deck loading caused the 41.8 k-ft moment and 2.14 k
thrust which requires 0.52 in2 flexure reinf. which is the largest among all Limit States and Maximum Effect
Cases. If Flexure Loading Codes C and D are blank, then live load would not have been applicable.
The bar spacings for all bar sizes are controlled by strength requirements, due to the fact that no integer
codes appear after the spacings. The bar spacings for bar sizes #10 and #11 are controlled by maximum
spacing requirements because of Code W after the spacings.
For Strip Footings, if the eccentricity is off the footing a warning message is displayed with a table that
includes the eccentricity and the edge of footing to centerline width for each limit state.

Chapter 7 Output Description
7-37
LRFD Box Culvert Design and Rating, Version 2.2.0.0 Page: xx Input File: LBTEST.IN xx-xxx-xx xx:xx:xx --------------------------------------------------------------------------- Line 1 - This is the first line of the ten allowed FLEXURAL REINFORCEMENT DESIGN --------------------------------------------------------------------------- Top Slab No. 1 - Bottom Face Flexure Factored Fact Resist Dist Loading Moment/Thrust Mom/Thrust Flex Phi Bar Spacing Code (kips-ft) (kips-ft) Zone Reinf Factor # 4/# 8 # 5/# 9 # 6/#10 # 7/#11 (ft) A B C D (kips) (kips) (in^2) (in) (in) (in) (in) 5.55 1 1 1 1 41.80 41.81 TN 0.52 0.90 4.5 7.0 10.0 13.5 2.14 2.15 0.90 18.0 23.0 24.0 W 24.0 W Flexure Loading Codes: Code A Code B Code C Code D 1 Strength-I 1 Maximum Positive Moment 1 PHL-93 1 On Deck 2 Strength-II and Concurrent Thrust 2 HL-93 2 Thru Fill 3 Construction 2 Maximum Negative Moment 3 P-82 4 Bot Slab Only and Concurrent Thrust 4 ML-80 3 Maximum Tension Thrust 5 HS-20 and Concurrent Moment 6 H-20 4 Maximum Compression Thrust 7 SLL and Concurrent Moment 8 TK527 9 EV2 Z EV3 Y SU6TV X PA2016-13 If the Flexure Loading Code is blank, no reinforcement is required for strength. If an M is printed next to the Flexural Reinforcement, the design is governed by minimum reinforcement. Zone Code Descriptions TN – Tension controlled section TR – Transition section CM – Compression controlled section
Phi Factor Epsilon (cl) = 0.00200 Phi Factor Epsilon (tl) = 0.00500

Chapter 7 Output Description
7-38
If a number appears after the spacing, it has been calculated using crack control requirements. That number corresponds to the Crack Control Codes listed below. If a number does not appear after the spacing, it has been calculated using the reported flexural reinforcement. The flexural reinforcement is based on the reported Flexure Loading Code. Crack Control Codes: 1 On Deck - Maximum Positive Moment and Concurrent Thrust 2 On Deck - Maximum Negative Moment and Concurrent Thrust 3 On Deck - Maximum Tension Thrust and Concurrent Moment 4 On Deck - Maximum Compression Thrust and Concurrent Moment 5 Through Fill - Maximum Positive Moment and Concurrent Thrust 6 Through Fill - Maximum Negative Moment and Concurrent Thrust 7 Through Fill - Maximum Tension Thrust and Concurrent Moment 8 Through Fill - Maximum Compression Thrust and Concurrent Moment When Live Load is not applicable, i.e., when Flexure Loading Codes C and D are blank, Crack Control Codes 1-4 will be used to indicate the Dead Load Maximum Effect Case. Ignore the 'On Deck' part of the code message. If a letter appears after the spacing, the letter corresponds to one of the following errors or messages: V Spacing < minimum (S5.10.3.1, S5.10.3.2) W Actual bar spacing was governed by DM-4 maximum spacing requirements (S5.10.3.2, S5.10.8.2)
Note: Wall distances begin at the bottom of the wall and slab distances begin at the left side of the slab.
Figure 7.4.10-1 Sample Design of Flexural Reinforcement Report – Reinforcement Bar

Chapter 7 Output Description
7-39
7.4.11 Flexural Reinforcement Design - Wire Mesh
This table is applicable for a Design and includes all culvert components, e.g., top slab, external wall, strip
footings, etc. This table provides the primary result for a design: the amount of top and bottom flexure
reinforcement at each POI required to resist the applied factored forces and moments.
The following information is reported in the FLEXURAL REINFORCEMENT DESIGN output tables:
1. Member Name - the culvert member, e.g., Top Slab, appears in the table heading.
2. Face Location - the flexure reinf. location, either Top Face or Bottom Face appears in the table heading.
3. Dist - distance from the beginning of the culvert component to the POI.
4. Flexure Load Code - limit state (A), maximum effect case (B), live load (C), live load type (D) associated
with the largest amount of flexure reinforcement.
5. Factored Moment - factored moment associated with the required flexure reinforcement.
6. Factored Thrust - factored axial force associated with the largest amount of flexure reinforcement.
7. Factored Resisting Moment – factored resisting moment based on required area of steel.
8. Factored resisting Thrust – factored axial resistance based on required area of steel.
9. Zone – the controlling zone, either tension, compression, or
transition.
10. Flex Reinf - required flexure reinforcement.
11. Phi Factor - the flexural resistance factor.
A sample Flexural Reinforcement Design Report is shown in Figure 1. There is a table for the top or left
face, and the bottom or right face for each culvert component. The first line contains the required area of
flexure reinforcement for strength and the set of Strength Loading Codes associated with the required area.
The controlling total limit state moment is also printed on the first line. The thrust is printed on the second
line. If reinforcement is not required, then the Loading Codes and demands are not applicable and they
are left blank.
The Flexure Loading Code part of the first line of information indicates the controlling Limit State, Maximum
Effect Case, Live Load and Live Load Type: Code A is the Limit State, Code B is the Maximum Effect
Case, Code C is the Live Load, and Code D is the Live Load Type. The Legend at the end of the table
describes the values of the four Strength Loading Codes. Limit States Strength I, Strength II and
Construction, and Maximum Effect Cases 1, 2, 3 and 4 are considered for flexure design. Different live
loads are used for each limit state and the number and type of live loads used for the design depend on the
selected live load type on the LDC command. See Section 5.10 for a description of the LDC command.
See Section 3.4 for a description of the six Maximum Effect Cases.

Chapter 7 Output Description
7-40
The total factored moment and thrust used to design the flexure reinforcement are given after the Flexure
Loading Code. The required flexure reinforcement is reported after the factored moment and thrust. This
amount of reinforcement is required in the indicated face for strength considerations to resist all factored
loads. If an “M” is printed next to the flexure reinforcement, then the minimum reinforcement controls the
design at the particular POI location.
In Figure 1, for the bottom face of the top slab, at a location of 1.80 ft, the amount of flexure reinforcement
is 0.21 in2. The Strength Loading Codes indicate that Strength I, Maximum Effect Case 1 (Maximum
Positive Moment and Concurrent Thrust caused the 6.52 k-ft moment and 10.77 k thrust which requires
0.21 in2 flexure reinf. which is the minimum required amount. If Flexure Loading Codes C and D are blank,
then live load would not have been applicable.
For Strip Footings, if the eccentricity is off the footing a warning message is displayed with a table that
includes the eccentricity and the edge of footing to centerline width for each limit state.

Chapter 7 Output Description
7-41
LRFD Box Culvert Design and Rating, Version 2.2.0.0 Page: xx Input File: LBTEST.IN xx-xxx-xx xx:xx:xx --------------------------------------------------------------------------- Line 1 - This is the first line of the ten allowed FLEXURAL REINFORCEMENT DESIGN --------------------------------------------------------------------------- Top Slab No. 1 - Bottom Face
Flexure Factored Fact Resist Dist Loading Moment/Thrust Mom/Thriust Flex Phi Code (kips-ft) (kips-ft) Zone Reinf Factor (ft) A B C D (kips) (kips) (in^2) 1.80 1 1 6.52 6.53 TN 0.21M 1.00
10.77 10.78 Flexure Loading Codes: Code A Code B Code C Code D 1 Strength-I 1 Maximum Positive Moment 1 PHL-93 1 On Deck 2 Strength-II and Concurrent Thrust 2 HL-93 2 Thru Fill 3 Construction 2 Maximum Negative Moment 3 P-82 4 Bot Slab Only and Concurrent Thrust 4 ML-80 3 Maximum Tension Thrust 5 HS-20 and Concurrent Moment 6 H-20 4 Maximum Compression Thrust 7 SLL and Concurrent Moment 8 TK527 9 EV2 Z EV3 Y SU6TV X PA2016-13
If the Flexure Loading Code is blank, no reinforcement is required for strength.
If an M is printed next to the Flexural Reinforcement, the design is governed by minimum reinforcement. Zone Code Descriptions TN – Tension controlled section TR – Transition section CM – Compression controlled section
Phi Factor Epsilon (cl) = 0.00200 Phi Factor Epsilon (tl) = 0.00500
Note: Wall distances begin at the bottom of the wall and slab distances begin at the left side of the slab.
Figure 7.4.11-1 Sample Design of Flexural Reinforcement Report – Wire Mesh
7.4.12 Development Length Check Table
This table is only displayed for the design of cast in place rigid frame fixed support culverts. This table
shows the hook development length of reinforcement bars (for the controlling face of the wall) that enter
the strip footings. This table is not applicable for precast rigid frame pinned support culverts.

Chapter 7 Output Description
7-42
This table is based on the results of the Design of Flexural Reinforcement and only shows development for
the bars that have been designed for flexure with unique spacing from each face of the wall. The data is
sorted based on smallest to largest bar size and shows the development length along with an indicator if
the bar cannot develop into the footing.
Figure 7.4.12-1 Sample Design of Development Length Check Report
The following information is reported in the DEVELOPMENT LENGTH CHECK output tables:
1. Wall Number - the culvert wall number appears in the table heading
2. Area Steel Required – the area of steel required at the bottom of the wall, appears in the table heading
3. Bar Spacing – All applicable flexural design spacings for a wall are shown.
4. Hooked Bar Development Length – The development length for relevant bars are shown.
7.4.13 Shear Design
This table is applicable for a Design and includes all culvert components, e.g., top slab, external wall, etc.,
other than strip footings. (The Strip Footing Shear Design Report described in Section 7.4.9.) This table
LRFD Box Culvert Design and Rating, Version x.x.x.x PAGE xx Input File:LBTEST.IN xx/xx/xxxx xx:xx:xx --------------------------------------------------------------------------- SR2011 CULVERT DESIGN DEVELOPMENT LENGTH CHECK (cont.) --------------------------------------------------------------------------- WALL BAR DEVELOPMENT INTO FOOTING Wall No. 2 Left Face is controlling (Area Steel Req’d = 0.698 in^2) Bar Hook Development Length Spacing # 4/# 8 # 5/# 9 # 6/#10 # 7/#11 (in) (in) (in) (in) (in) 3.0 11.49 -- -- -- -- -- -- -- 5.0 -- 15.44 -- -- -- -- -- -- 7.5 -- -- 19.59 -- -- -- -- -- 10.0 -- -- -- 22.34 -- -- -- -- 12.0 -- -- -- -- 23.27 -- -- -- 13.5 -- -- -- -- -- 23.33 -- -- 15.5 -- -- -- -- -- -- 23.75 -- 17.0 -- -- -- -- -- -- -- 23.54 18.0 -- -- -- -- -- -- 27.58 24.93 * - indicates the bar cannot develop into the footing
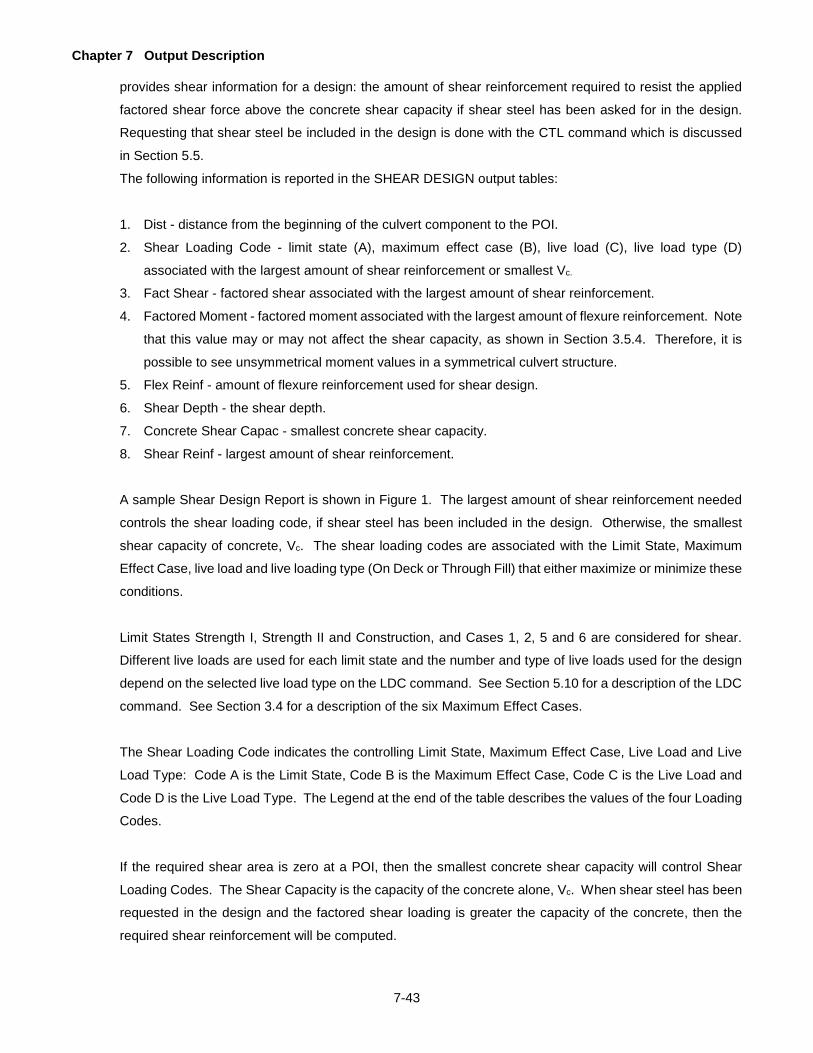
Chapter 7 Output Description
7-43
provides shear information for a design: the amount of shear reinforcement required to resist the applied
factored shear force above the concrete shear capacity if shear steel has been asked for in the design.
Requesting that shear steel be included in the design is done with the CTL command which is discussed
in Section 5.5.
The following information is reported in the SHEAR DESIGN output tables:
1. Dist - distance from the beginning of the culvert component to the POI.
2. Shear Loading Code - limit state (A), maximum effect case (B), live load (C), live load type (D)
associated with the largest amount of shear reinforcement or smallest Vc.
3. Fact Shear - factored shear associated with the largest amount of shear reinforcement.
4. Factored Moment - factored moment associated with the largest amount of flexure reinforcement. Note
that this value may or may not affect the shear capacity, as shown in Section 3.5.4. Therefore, it is
possible to see unsymmetrical moment values in a symmetrical culvert structure.
5. Flex Reinf - amount of flexure reinforcement used for shear design.
6. Shear Depth - the shear depth.
7. Concrete Shear Capac - smallest concrete shear capacity.
8. Shear Reinf - largest amount of shear reinforcement.
A sample Shear Design Report is shown in Figure 1. The largest amount of shear reinforcement needed
controls the shear loading code, if shear steel has been included in the design. Otherwise, the smallest
shear capacity of concrete, Vc. The shear loading codes are associated with the Limit State, Maximum
Effect Case, live load and live loading type (On Deck or Through Fill) that either maximize or minimize these
conditions.
Limit States Strength I, Strength II and Construction, and Cases 1, 2, 5 and 6 are considered for shear.
Different live loads are used for each limit state and the number and type of live loads used for the design
depend on the selected live load type on the LDC command. See Section 5.10 for a description of the LDC
command. See Section 3.4 for a description of the six Maximum Effect Cases.
The Shear Loading Code indicates the controlling Limit State, Maximum Effect Case, Live Load and Live
Load Type: Code A is the Limit State, Code B is the Maximum Effect Case, Code C is the Live Load and
Code D is the Live Load Type. The Legend at the end of the table describes the values of the four Loading
Codes.
If the required shear area is zero at a POI, then the smallest concrete shear capacity will control Shear
Loading Codes. The Shear Capacity is the capacity of the concrete alone, Vc. When shear steel has been
requested in the design and the factored shear loading is greater the capacity of the concrete, then the
required shear reinforcement will be computed.

Chapter 7 Output Description
7-44
In Figure 1, at a location of 5.55 ft, the amount of shear reinforcement required at this POI location is 0.00
in2. Since there is no required shear steel, then the reported Shear Capacity is the smallest among all Limit
States, Maximum Effect Cases, Live Loadings and Live Loading Types. If there would have been shear
steel required, then the reported value for Av would have been the largest among those conditions, and the
Shear Capacity would be that associated with the set of Loading Codes.
The Shear Loading Codes indicate that Limit State Strength-I and Maximum Effect Case 6 (Maximum
Negative Shear and Concurrent Moment) causes the Shear Capacity of 19.76 kips to occur and it is the
smallest among all Limit States and Maximum Effect Cases. Loading Codes C and D would be blank if a
construction limit state controlled. The total factored shear associated with Strength-I and Maximum Effect
Case 6 is -10.95 kips. The total factored moment is 36.84 kips-ft.

Chapter 7 Output Description
7-45
LRFD Box Culvert Design and Rating, Version 2.2.0.0 Page: xx Input File: LBTEST.IN xx-xxx-xx xx:xx:xx --------------------------------------------------------------------------- Line 1 - This is the first line of the ten allowed SHEAR DESIGN --------------------------------------------------------------------------- Top Slab No. 1 Shear Conc+ Loading Factored Flex Shear Shear Shear Dist Code Shear Moment Reinf Depth Capac Reinf (ft) A B C D (kips) (kips-ft) (in^2) (in) (kips) (in^2) 1.52 1 6 1 1 -16.56 1.70 0.46 17.84 19.92 0.000 1.85 1 6 1 1 -16.13 5.49 0.46 17.84 19.92 0.000 3.70 1 6 1 1 -13.58 23.87 0.46 17.84 19.92 0.000 … 14.80 1 5 1 1 14.67 17.93 0.46 17.84 19.92 0.000 16.65 1 5 1 1 17.15 -2.37 0.46 17.84 19.92 0.000 16.98 1 5 1 1 17.57 -6.44 0.46 17.84 19.92 0.000 * Indicates Vs required > Vs max Shear Loading Codes: Code A Code B Code C Code D 1 Strength-I 1 Maximum Positive Moment 1 PHL-93 1 On Deck 2 Strength-II and Concurrent Thrust 2 HL-93 2 Thru Fill 3 Construction 2 Maximum Negative Moment 3 P-82 4 Bot Slab Only and Concurrent Thrust 4 ML-80 3 Maximum Tension Thrust 5 HS-20 and Concurrent Moment 6 H-20 4 Maximum Compression Thrust 7 SLL and Concurrent Moment 8 TK527 5 Maximum Positive Shear 9 EV2 and Concurrent Moment Z EV3 6 Maximum Negative Shear Y SU6TV and Concurrent Moment X PA2016-13 + The Concrete Shear Capacity shown is the factored shear capacity (phiv*Vc) The Factored Moments shown are the moments associated with the reported Shear Loading Code (i.e., limit state, max effect case, live load, on deck/thru fill). Areas of flexural reinforcement printed here are used in shear calculations are optimized values that satisfy strength and serviceability requirements for member flexural regions. See section 3.5 in user's manual for further information.
Note: Wall distances begin at the bottom of the wall and slab distances begin at the left side of the slab.
Figure 7.4.13-1 Sample Design of Shear Reinforcement Report

Chapter 7 Output Description
7-46
7.4.14 Strip Footing Shear Design
This table is applicable for a Design and includes only strip footings. (The Shear Design Report described
in Section 7.4.11.) This table provides strip footing shear information for a design: the Shear Performance
Ratio, which is the Factored Shear Resistance divided by the Factored Shear. If the eccentricity is off the
footing a warning message is displayed with a table that includes the eccentricity and the edge of footing
to centerline width for each limit state.
The following information is reported in the STRIP FOOTING SHEAR DESIGN output tables:
1. Dist - distance from the beginning of the culvert component to the POI.
2. Side of Wall - either Left or Right indicating from which side of the wall the POI is measured.
3. Shear Loading Code - limit state (A), maximum effect case (B), live load (C), live load type (D)
associated with the smallest shear performance ratio.
4. Fact Shear - factored shear associated with the smallest shear performance ratio.
5. Shear Depth - the shear depth.
6. Concrete Shear Resist - factored shear resistance associated with the smallest shear performance
ratio.
7. Shear Perform - smallest shear performance ratio.
A sample Strip Footing Shear Design table is shown in Figure 1. The shear loading code is controlled by
the smallest Shear Performance Ratio. All demands and resistances are associated with the Limit State,
Maximum Effect Case, Live Load and Live Loading Type (On Deck or Through Fill) that maximizes the
shear performance ratio.
Limit States Strength I, Strength II and Construction, and all Maximum Effect Cases are considered for
shear. (Recall that the moment in the footing is calculated from the total limit state response at the bottom
of the wall, so all six Maximum Effect Cases must be investigated.) Different live loads are used for each
limit state and the number and type of live loads used for the design depend on the selected live load type
on the LDC command. See Section 5.10 for a description of the LDC command. See Section 3.4 for a
description of the six Maximum Effect Cases.
The Shear Loading Code indicates the controlling Limit State, Maximum Effect Case, Live Load and Live
Load Type: Code A is the Limit State, Code B is the Maximum Effect Case, Code C is the Live Load and
Code D is the Live Load Type. The Legend at the end of the table describes the values of the four Loading
Codes.
The Shear Loading Code is the condition that causes the smallest performance ratio. The Shear
Resistance is the capacity of the concrete alone,Vc.

Chapter 7 Output Description
7-47
In Figure 1, at a location of 1.58 ft for Wall No. 2, which is a distance-d from the right face, the Shear
Performance Ratio is 4.52. The Shear Loading Codes indicate that Limit State Strength I and Maximum
Effect Case 2 (Maximum Negative Moment and Concurrent Thrust in the wall) cause this smallest ratio to
occur. Loading Codes C and D are left blank when live load is not applicable or a construction limit state
controls. The total factored shear and factored resistance associated with Strength I and Maximum Effect
Case 2 are 4.69 kips and 21.21 kips, respectively.
LRFD Box Culvert Design and Rating, Version 2.2.0.0 Page: xx Input File: LBTEST.IN xx-xxx-xx xx:xx:xx --------------------------------------------------------------------------- Line 1 - This is the first line of the ten allowed STRIP FOOTING SHEAR DESIGN --------------------------------------------------------------------------- Under Wall No. 2 Dist Side Shear Conc from of Loading Fact Shear Shear Performance Face Wall Code Shear Depth Resist Ratio (ft) A B C D (kips) (in) (kips) 1.58 Left 3 1 -6.77 19.00 -21.21 3.13 0.00 Left 0.00 Right 3 1 -2.75 19.00 -21.21 7.73 1.58 Right 1 2 2 1 4.69 19.00 21.21 4.52 Shear Loading Codes: Code A Code B Code C Code D 1 Strength-I 1 Maximum Positive Moment 1 PHL-93 1 On Deck 2 Strength-II and Concurrent Thrust 2 HL-93 2 Thru Fill 3 Construction 2 Maximum Negative Moment 3 P-82 and Concurrent Thrust 4 ML-80 3 Maximum Tension Thrust 5 HS-20 and Concurrent Moment 6 H-20 4 Maximum Compression Thrust 7 SLL and Concurrent Moment 8 TK527 5 Maximum Positive Shear 9 EV2 and Concurrent Moment Z EV3 6 Maximum Negative Shear Y SU6TV and Concurrent Moment X PA2016-13
Figure 7.4.14-1 Sample Strip Footing Design Report
7.4.15 Minimum Reinforcement Check
This table reports calculated minimum reinforcement for relevant POI's for the various conditions. This table
is applicable for both an Analysis and Design.
The following information is reported in the MINIMUM REINFORCEMENT CHECK output tables:
1. Dist - distance from the beginning of the culvert component to the POI.

Chapter 7 Output Description
7-48
2. Cracking Moment - cracking moment for the section.
3. 4/3*M(u) - 4 / 3 * maximum applied moment.
4. Rho Min Area - minimum required reinforcement area for flexure.
5. Temp Shrink Area - minimum required reinforcement area for temperature and shrinkage.
6. 0.002Ag - 0.002 * gross section area.
7. Phi Factor – resistance factor in pure bending.
8. Area Prov/Width - reinforcement area specified (for analysis)/required (for design) for a unit width.
9. Status Code – used to indicate if the reinforcement area provided is less than required.
LRFD Box Culvert Design and Rating, Version 2.7.1.0) PAGE xx Input File: EX5.DAT xx/xx/xxxx xx:xx:xx -------------------------------------------------------------------------------- BXLRFD EXAMPLE PROBLEM MINIMUM REINFORCEMENT CHECK -------------------------------------------------------------------------------- Bottom Slab No. 1 - Bottom Face Cracking Temp Area Moment Rho Min Shrink 0.002 Phi Prov/ Status Dist M(cr) 4/3*M(u) Area Area Ag Factor Width Code (ft) (kip-ft) (kip-ft) (in^2) (in^2) (in^2) (in^2) (in^2) 0.00 13.47 28.42+ 0.27* 0.20 N/A 0.900 0.676 0.91 13.47+ 12.24 0.25* 0.20 N/A 0.900 0.676 2.05 13.47+ 5.80 0.12 0.20* N/A 0.900 0.676 4.10 13.47+ 0.00 0.00 0.20* N/A 0.900 0.676 6.15 13.47+ 0.00 0.00 0.20* N/A 0.900 0.676 8.20 13.47+ 0.00 0.00 0.20* N/A 0.900 0.676 10.25 13.47+ 0.00 0.00 0.20* N/A 0.900 0.676 12.30 13.47+ 0.00 0.00 0.20* N/A 0.900 0.880 14.35 13.47+ 0.00 0.00 0.20* N/A 0.900 0.880 16.40 13.47+ 0.00 0.00 0.20* N/A 0.900 0.880 18.45 13.47+ 0.00 0.00 0.20* N/A 0.900 0.880 19.59 13.47 13.66+ 0.28* 0.20 N/A 0.900 0.880 20.50 13.47 29.40+ 0.28* 0.20 N/A 0.900 0.880 Status Code Descriptions + - Controlling moment for Rho Min Area calculation * - Controlling minimum area of steel
A - Area provided smaller than required minimum area of steel
Figure 7.4.15-1 Sample Reinforcment Check Report
7.4.16 Foundation Pressure
This table is applicable for both an Analysis and Design, and when a bottom slab is present. (The Strip
Footing Bearing Pressure Report is described in Section 7.4.14.) The foundation pressure is reported at the
centerline of each wall for all live loads and for the limit states: Strength I, Strength II and Service I. The
number of live loads reported in this table depends on the Live Load selected on the LDC Command: A, B,
C, D, or E for a Design, and A, B, C, D, E or F for an Analysis. The maximum pressure in each limit state,
among all the walls, is indicated with an asterisk, “*”.

Chapter 7 Output Description
7-49
The following information is reported in the FOUNDATION PRSSURE output tables:
1. Lim St – Indicates which limit state results are being reported for.
2. Load - a live loading, e.g., PHL-93.
3. Wall Pressure – Indicates what the foundation pressure is under the indicated wall for the current
maximized wall location.
4. Effective Foundation Bearing Width – Shows the width of the culvert foundation that is exerting force on
the soil. For Trapezoidal distribution this is always the distance between the centerline of the exterior
walls. For Triangular distribution it is the distance from the center of the exterior wall that has foundation
pressure to the location where pressure goes to zero.
A sample Foundation Pressure Report is shown in Figure 1. LRFD Box Culvert Design and Rating, Version 2.2.0.0 Page: xx
Input File: EX1.DAT xx/xx/xxxx xx:xx:xx --------------------------------------------------------------------------- BXLRFD Example Problem #1 FOUNDATION PRESSURE --------------------------------------------------------------------------- Maximum Influence Line Pressure at Wall No. 1 Wall 1 Wall 2 Eff Foundation Lim St Load Press Press Bearing Width (ksf) (ksf) (ft) STR-I PHL-93 3.25 1.67 9.75 ML-80 2.65 1.67 9.75 HS20 2.86 1.54 9.75 H20 2.86 1.54 9.75 TK527 2.09 1.66 9.75 STR-II P-82 2.70 1.65 9.75 ML-80 2.43 1.67 9.75 HS20 2.59 1.56 9.75 H20 2.59 1.56 9.75 TK527 1.99 1.66 9.75 ... Maximum Influence Line Pressure at Wall No. 2 Wall 1 Wall 2 Eff Foundation Lim St Load Press Press Bearing Width (ksf) (ksf) (ft) STR-I PHL-93 1.66 3.25 * 9.75 ML-80 1.66 2.65 9.75 HS20 1.55 2.87 9.75 H20 1.55 2.87 9.75 TK527 1.66 2.09 9.75 STR-II P-82 1.66 2.70 * 9.75 ML-80 1.66 2.43 9.75 HS20 1.57 2.59 9.75 H20 1.57 2.59 9.75 TK527 1.66 1.99 9.75
* Indicates the maximum Foundation Pressure for each limit state.
Figure 7.4.16-1 Sample Foundation Pressure Report

Chapter 7 Output Description
7-50
7.4.17 Foundation Pressure Summary Table
This table is applicable for both Analysis and Design and displays a summary of maximum foundation
pressure under each wall for each limit state.
The following information is reported in the FOUNDATION PRESSURE SUMMARY output table:
1. Lim St – Indicates which limit state results are being reported for.
2. Load - a live loading, e.g., PHL-93.
3. Wall Pressure – Indicates what the maximum foundation pressure is under the indicated wall for the
indicated limit state.
This table is switched on by default.
A sample Foundation Pressure Summary Report is shown in Figure 1.
LRFD Box Culvert Design and Rating, Version 2.2.0.0 Page: xx
Input File: BXER021_2CELLA.DAT xx/xx/xxxx xx:xx:xx --------------------------------------------------------------------------- BXLRFD Example Problem #2 FOUNDATION PRESSURE SUMMARY --------------------------------------------------------------------------- Maximum Foundation Pressure Wall 1 Wall 2 Wall 3 Lim St Load Press Press Press (ksf) (ksf) (ksf) STR-I PHL-93 4.72 2.73 5.12 * STR-II P-82 3.08 2.65 3.46 * SER-I PHL-93 3.03 1.78 3.32 * * Indicates the maximum Foundation Pressure for each limit state.
Figure 7.4.17-1 Sample Foundation Pressure Summary Report
7.4.18 Strip Footing Bearing Pressure
This table is applicable for both an Analysis and Design, and when a bottom slab is not present. (The
Foundation Pressure Report described in Section 7.4.13.) The Strip Footing Bearing Pressure is reported at
the left and right edges of each footing for all live loads and for the limit states: Strength I, Strength II and
Service I. The number of live loads reported in this table depends on the Live Load selected on the LDC
Command: A, B, C, D or E for a Design, and A, B, C, D, E or F for an Analysis.

Chapter 7 Output Description
7-51
The following information is reported in the STRIP FOOTING BEARING PRSSURE output tables:
1. Wall Location - the wall number for which the pressures are reported appears in the table heading
2. Live Load - a live loading, e.g., PHL-93.
3. Location - either “L” or “R” indicating which edge of the footing the pressures are being reported.
4. e/B - resultant eccentricity / footing width ratio.
5. Bearing Pressure - soil bearing pressure.
The ratio of the eccentricity of the resultant of all external vertical loads: total factored axial force in the
wall; factored live load surcharge (LS) and factored weight of the column of soil above the midpoint of the
heel (EV); and the factored weight of the footing (DC), to the width of the footing, is reported as e/B. See
Section 3.7 for details on how the eccentricity and the pressure in the soil are calculated. The maximum
e/B ratio and pressure in each limit state and considering all six Maximum Effect Cases, among all the
footings, are indicated with an asterisk, “*”. The reported e/B ratios and soil pressures are independent
from each other, i.e., they are not associated quantities.
A sample Strip Footing Bearing Pressure Report is shown in Figure 1.
LRFD Box Culvert Design and Rating, Version 2.2.0.0 Page: xx Input File: LBTEST.IN xx-xxx-xx xx:xx:xx --------------------------------------------------------------------------- Line 1 - This is the first line of the ten allowed STRIP FOOTING BEARING PRESSURE --------------------------------------------------------------------------- Wall No. 1 STR-I STR-I STR-II STR-II SER-I SER-I Live e/B Bearing e/B Bearing e/B Bearing Load Locn Ratio Pressure Ratio Pressure Ratio Pressure (ksf) (ksf) (ksf) PHL-93 L 0.12 11.57 * 0.07 6.96 R 10.37 7.16 P-82 L 0.11 10.99 * R 9.56
L Left edge of the footing R Right edge of the footing A maximum value for qb of 4.74 (ksf) (qb = N/Be) occurs for the STR-I limit state, PHL-93 live load, maximum effect case 4. For this reported condition, Be is 5.08 (ft). This average pressure is used in the calculation of settlement for soils. * Indicates the maximum, e/B Ratio and Footing Pressure, among all maximum effect cases, for each limit state.
Figure 7.4.18-1 Sample Strip Footing Bearing Pressure Report

Chapter 7 Output Description
7-52
7.4.19 Quantities
This table is applicable for both an Analysis and Design. It always contains the same seven line items,
some of which may have zero volume values if the particular item is not present in the culvert.
The following information is reported in the QUANTITIES output tables:
1. Segment Length - Distance the quantities are based on.
2. Top Slab - volume of concrete for all top slabs.
3. Bottom Slab -volume of concrete for all bottom slabs.
4. Left Wall - volume of concrete for the left external wall.
5. Interior Wall - volume of concrete for the interior wall for two cell culverts.
6. Right Wall - volume of concrete for the right external wall.
7. Haunches - volume of concrete for all haunches if present.
8. Strip Footing - volume of concrete for all strip footings, if present.
9. Total - total volume of concrete.
10 Segment Weight - Weight of a precast culvert segment.
A sample Quantities Report is shown in Figure 1.
LRFD Box Culvert Design and Rating, Version 2.2.0.0 Page: xx Input File: EX1.DAT xx/xx/xxxx xx:xx:xx --------------------------------------------------------------------------- BXLRFD Example Problem #1 QUANTITIES --------------------------------------------------------------------------- Volume of Concrete Based on a segment length of: 12.00 ft. Top Slab: 3.50 (yd^3) Bottom Slab: 3.69 (yd^3) Left Wall: 2.00 (yd^3) Right Wall: 2.00 (yd^3) Haunches: 0.22* (yd^3) TOTAL: 11.42 (yd^3) Weight of Segment Segment Weight: 46.24 Kips * All haunches are included only in this total
Figure 7.4.19-1 Sample Quantities Report

Chapter 7 Output Description
7-53
7.5 INTERMEDIATE DATA
This section describes the various tables of data that constitute the intermediate report which is obtained by using
the OUI command.
7.5.1 General POI Data Table
This table presents general POI information. It is the first table printed (if requested) for each POI. A sample
table is shown in Figure 7.5.1-1.
The following information is reported in the General POI Table:
1. POI - the POI number
2. LOCN - distance location of the POI along the member (ft)
3. %SPAN - percent distance location of the POI along the member
4. Type - POI type classification: 1=axial; 2=shear; 3=moment; 4=shear and moment
5. Thick - structural thickness, i.e., nominal - waste material (inches)
6. Width - width of the unit strip of culvert (inches)
7. Top Cvr - top or left face rebar cover less waste material/sacrificial cover (inches)
8. Bot Cvr - bottom or right face rebar cover less waste material/sacrificial cover (inches)
9. Top As -specified top or left face flexural steel area (inches^2)
10. Bot As - specified bottom or right face flexural steel area (inches^2)
11. Shr Spc - specified spacing of shear steel along the member (inches)
12. Av - specified shear steel area (inches^2)
13. Top d - distance-d from bottom or right face to top flexural steel centroid (inches)
14. Bot d - distance-d from top or left face to bottom flexural steel centroid (inches)
15. STR ANG - shear rebar angle (degrees)
16. FILL HT - fill height (ft)
17. PHI SHR - resistance factor for shear
18. PHI BND - resistance factor for bending
19. PHI CMP - resistance factor for compression
20. BETA1 - beta-1
21. E STEEL - modulus of elasticity for rebar (kip/ft^2)
22. E CONCR - modulus of elasticity for concrete (kip/ft^2)
23. FPC - f’c of concrete (kip/ft^2)
24. FY - fy of rebar (kip/ft^2)
25. ASMN1T - As1-minimum for top or left face (inches^2)
26. ASMN1B - As1-minimum for bottom or right face (inches^2)
27. ASMN2T - As2-minimum for top or left face (inches^2)
28. ASMN2B - As2-minimum for bottom or right face (inches^2)

Chapter 7 Output Description
7-54
29. ASMINN - As minimum for negative (top or left) face (inches^2)
30. ASMINP - As-minimum for positive (bottom or right) face (inches^2)
31. SPMIN - minimum spacing for primary reinforcement (inches)
32. SPPMXT - maximum spacing for primary top or left reinforcement (inches)
33. SPPMXB - maximum spacing for primary bottom or right reinforcement (inches)
34. SPTXMX - maximum spacing for temperature / shrinkage concerns (inches)
35. SPDMAX - maximum spacing for distribution concerns (inches)
36. SPMAXT - final maximum spacing for top or left rebars (inches)
37. SPMAXB - final maximum spacing for bottom or right rebars (inches)
38. POSRCH - positive region change flag
39. NEGRCH - negative region change flag
40. ASPLS - As positive controlling limit state
41. ASPLL - As positive controlling live load
42. ASPCS - As positive controlling maximum effect case
43. ASPPUT - As positive controlling axial force (kips)
44. ASPMUT - As positive controlling moment (kip-ft)
45. ASPOS - As positive (inches^2)
46. ASNLS - As negative controlling limit state
47. ASNLL - As negative controlling live load
48. ASNCS - As negative controlling maximum effect case
49. ASNPUT - As negative controlling axial force (kips)
50. ASNMUT - As negative controlling moment (kip-ft)
51. ASNEG - As negative (inches^2)
52. VLS - shear controlling limit state
53. VLL - shear controlling live load
54. VCS - shear controlling maximum effect case
55. VVUT - shear controlling shear force (kips)
56. VMUT - shear controlling moment (kip-ft)
57. VC - concrete shear capacity (kip/ft^2)
58. VSREQ - Vs-required (kips)
59. VSMAX - Vs-maximum (kips)
60. VAREQ - Va-required (inches^2)
7.5.2 Non-Live Results
The non-live load table presents unfactored axial (kips), shear (kips) and moment (kip-ft) responses due to
applied non-live loads. A sample table is shown in Figure 7.5.2-1. For connection objects the non-live load
table presents unfactored bearing pressure response values due to applied non-live loads for each wall. A
sample table is shown in Figure 7.5.2-2.

Chapter 7 Output Description
7-55
7.5.3 Influence Lines
The influence line table presents influence line x-ordinate (ft) and y-ordinate (axial, shear and moment)
values. The x-ordinate values are above the dashed lines and are measured from the center of the left
wall. These influence lines are generated by placing point loads at every node point on the top slabs
(including walls), along with a reaction load on the bottom slab. A sample table is shown in Figure 7.5.3-1.
For connection objects the y-ordinate denotes bearing pressure values under each wall. A sample table is
shown in Figure 7.5.3-2.
7.5.4 Truck Response
The truck response table presents raw live load results for every live load in the analysis. For each live load,
a 6x6 matrix is given. The first three columns are the results when optimizing positive responses, and the
second three columns are the results when optimizing negative responses. The diagonals are therefore
the primary optimized responses and the off-diagonals are the associated responses. Axial and shear
forces are in units of kips, and moments are in units of kip-ft. Column 3 is Maximum Case 1, column 6 is
Case 2, column 1 is Case 3, column 4 is Case 4, column 2 is Case 5, and column 5 is Case 6.
The second three rows present information on the location of the live load when a response was optimized.
The TRKDIR row is a two-digit code: if the first digit is a 2, then the truck is a variable axial truck, if the first
digit is a 1, then it is a fixed axial truck. If the second digit is a 1, then the truck was moving left-to-right
when the response was optimized, if the second digit is a 2, then the truck was moving right-to-left. The
first TRKPOS row gives information on where the first truck axle was when the response was optimized,
relative to the center of the left wall. The second TRKPOS gives the spacing between the variable axles,
if applicable. A sample table is shown in Figure 7.5.4-1.
For connection objects the truck response table presents raw live load bearing pressure results for every
live load in the analysis. For each live load, a 6x6 or 4X4 matrix is given depending on the number of walls
in the culvert. For a twin cell culvert, the first three columns are the results when optimizing positive
responses, and the second three columns are the results when optimizing negative responses. For a single
cell culvert, the first two columns are the results when optimizing positive responses, and the second two
columns are the results when optimizing negative responses.
The diagonals are therefore the primary optimized responses and the off-diagonals are the associated
responses. All bearing pressures are in units of kips/ft2. A sample table is shown in Figure 7.5.4-2.
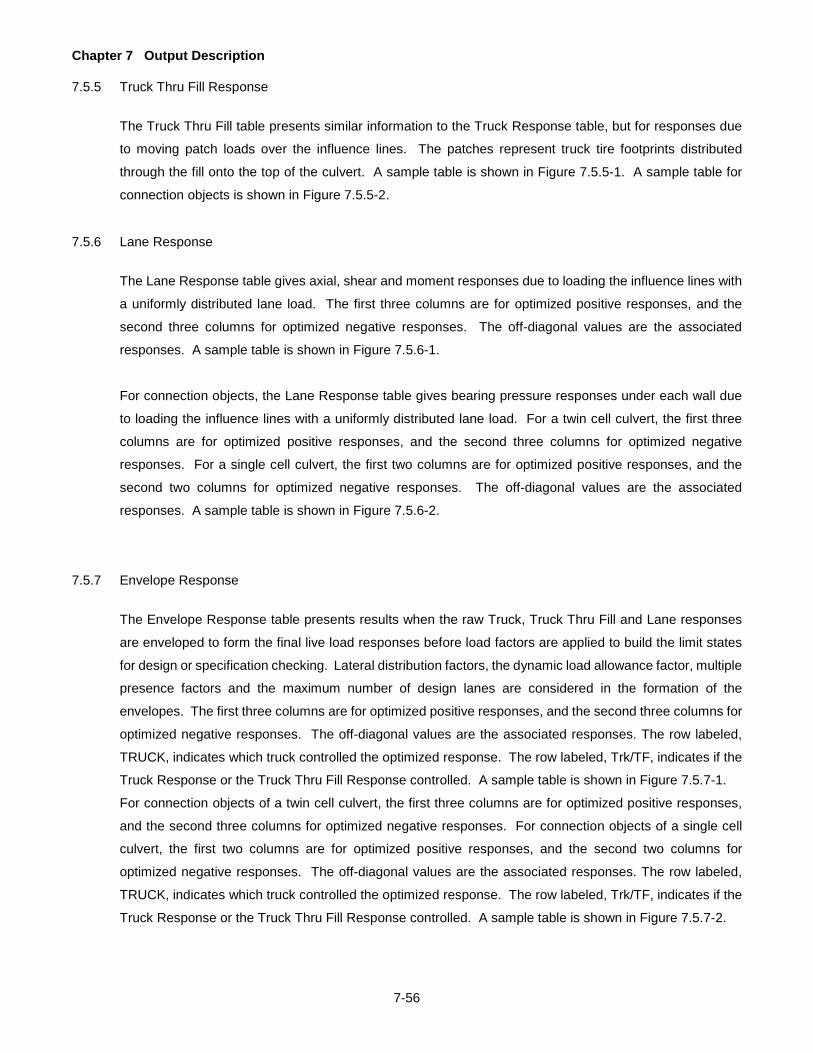
Chapter 7 Output Description
7-56
7.5.5 Truck Thru Fill Response
The Truck Thru Fill table presents similar information to the Truck Response table, but for responses due
to moving patch loads over the influence lines. The patches represent truck tire footprints distributed
through the fill onto the top of the culvert. A sample table is shown in Figure 7.5.5-1. A sample table for
connection objects is shown in Figure 7.5.5-2.
7.5.6 Lane Response
The Lane Response table gives axial, shear and moment responses due to loading the influence lines with
a uniformly distributed lane load. The first three columns are for optimized positive responses, and the
second three columns for optimized negative responses. The off-diagonal values are the associated
responses. A sample table is shown in Figure 7.5.6-1.
For connection objects, the Lane Response table gives bearing pressure responses under each wall due
to loading the influence lines with a uniformly distributed lane load. For a twin cell culvert, the first three
columns are for optimized positive responses, and the second three columns for optimized negative
responses. For a single cell culvert, the first two columns are for optimized positive responses, and the
second two columns for optimized negative responses. The off-diagonal values are the associated
responses. A sample table is shown in Figure 7.5.6-2.
7.5.7 Envelope Response
The Envelope Response table presents results when the raw Truck, Truck Thru Fill and Lane responses
are enveloped to form the final live load responses before load factors are applied to build the limit states
for design or specification checking. Lateral distribution factors, the dynamic load allowance factor, multiple
presence factors and the maximum number of design lanes are considered in the formation of the
envelopes. The first three columns are for optimized positive responses, and the second three columns for
optimized negative responses. The off-diagonal values are the associated responses. The row labeled,
TRUCK, indicates which truck controlled the optimized response. The row labeled, Trk/TF, indicates if the
Truck Response or the Truck Thru Fill Response controlled. A sample table is shown in Figure 7.5.7-1.
For connection objects of a twin cell culvert, the first three columns are for optimized positive responses,
and the second three columns for optimized negative responses. For connection objects of a single cell
culvert, the first two columns are for optimized positive responses, and the second two columns for
optimized negative responses. The off-diagonal values are the associated responses. The row labeled,
TRUCK, indicates which truck controlled the optimized response. The row labeled, Trk/TF, indicates if the
Truck Response or the Truck Thru Fill Response controlled. A sample table is shown in Figure 7.5.7-2.

Chapter 7 Output Description
7-57
7.5.8 Limit State Dead Load Response
The Limit State Dead Load table presents information on the factored non-live responses. A sample table
is shown in Figure 7.5.8-1. For connection objects the sample table is shown in Figure 7.5.8-2.
7.5.9 Limit State Live Load and Total Responses
The Limit State Live Load and Total Response table presents factored live load envelope responses and
then the sum of the Limit State Dead Load and Limit State Live Load responses, i.e., Total Limit State
Responses. The Total Limit State Responses are those used for design or specification checks. A sample
table is shown in Figure 7.5.9-1. For connection objects the sample table is shown in Figure 7.5.9-2.
7.5.10 Bar Table Results
The Bar table presents reinforcement bar information for the eight different bar sizes used in design. A
sample table is shown in Figure 7.5.10-1.
The following information is reported for each bar size in the Bar table:
1. S POS STR - positive (bottom or right) face bar spacing for strength (inches).
2. S NEG STR - negative (top or left) face bar spacing for strength (inches).
3. S POS CC - positive (bottom or right) face bar spacing for crack control (inches).
4. S NEG CC - negative (top or left) face bar spacing for crack control (inches).
5. S POS<MIN - True/False flag indicating if positive spacing is less than the minimum.
6. S NEG<MIN - True/False flag indicating if negative spacing is less than the minimum.
7. S POS>MAX -True/False flag indicating if positive spacing is greater than the maximum.
8. S NEG>MAX -True/False flag indicating if negative spacing is greater than the maximum.
9. POS CC LS - controlling limit state for positive face crack control spacing.
10. POS CC LL - controlling live load for the positive face crack control spacing.
11. POS CC CS - controlling maximum effect case for positive face crack control spacing.
12. POS CC PU - controlling axial force for positive face crack control spacing (kips).
13. POS CC MU - controlling moment for positive face crack control spacing (kip-ft).
14. NEG CC LS -controlling limit state for negative face crack control spacing.
15. NEG CC LL -controlling live load for the negative face crack control spacing.
16. NEG CC CS -controlling maximum effect case for negative face crack control spacing.
17. NEG CC PU -controlling axial force for negative face crack control spacing (kips).
18. NEG CC MU - controlling moment for negative face crack control spacing (kip-ft).

Chapter 7 Output Description
7-58
7.5.11 Limit State Section Capacities
The Limit State Section Capacities table presents information for axial (Pr), shear (Vr) and moment (Mr)
factored resistances. Column 3 is Maximum Effect Case 1, column 6 is Case 2, column 1 is Case 3 and
column 4 is Case 4. These are the four flexure cases and have axial and moment resistances. Column 2
is Case 5 and column 5 is Case 6. These two cases, along with Cases 1 and 2, are the four shear cases
and have only shear resistances. A sample table is shown in Figure 7.5.11-1.
7.5.12 Limit State Rating Factors
The Limit State Rating Factors table presents axial, shear and moment rating factors. There is a table for
each live load envelope in the analysis. Axial and moment rating factors within a column should be identical.
A sample table is shown in Figure 7.5.12-1.
7.5.13 Limit State Resistance/Demand Ratios
The Limit State Resistance/Demand Ratios table presents similar information to the Rating Factors in cases
when there is no live load. A sample table is shown in Figure 7.5.13-1.
7.5.14 Limit State Allowable Spacings
The Limit State Allowable Spacings table presents allowable reinforcement spacings for all live load
envelopes and for all service limit states in the analysis. A sample table is shown in Figure 7.5.14-1.
7.5.15 Limit State Service Stresses
The Limit State Service Stresses table presents actual concrete and reinforcement stresses. Both tension
and compression stresses are presented, for all live load envelopes and for all service limit states in the
analysis. A sample table is shown in Figure 7.5.15-1.
7.5.16 Stiffness Analysis Model Report (.FEM Output File)
This section presents finite element model information for the generated plane frame model. The model is
generated based on the information in the input file and internal assumptions. The first table details the
generated node points and their X-Y-Z coordinates. The model is generated in the X-Y plane, so the Z-
coordinate will always be zero. The second table gives boundary condition codes for all nodes acting as
boundary nodes. The integer boundary condition code is a packed integer representing the six possible
degrees-of-freedom, DOF, at each node. A zero represents a free DOF, and a 1 represents a fixed DOF.
The right-most digit represents the x-displacement, the next digit to the left is the y-displacement, the next
digit to the left is the z-displacement, the next digit to the left is the rotation about the x-axis (always fixed),

Chapter 7 Output Description
7-59
the next digit to the left is the rotation about the y-axis (always fixed) and the last digit is the rotation about
the z-axis (always zero or blank). The third table is presents information on the mappings between node
number and equation numbers for the six DOFs at each node point. The fourth table in this section is the
element connectivity table which gives information on the type, description, number and end node points
for all plane frame elements in the generated model. The last table is the element section properties table
which provides cross-sectional area, moments of inertia, modulus of elasticity, shear area, and shear
modulus for each member. Sample tables are shown in Figure 7.5.16-1.
7.5.17 Stiffness Analysis Results Report (.FER Output File)
This section presents finite element response information. The first table presents nodal displacements for
all nodes and for all load cases. Global X, Y, and Z translational displacements, and global X, Y and Z
rotations are presented. The column labeled, “M#”, represents the base finite element load cases applied
to the system, e.g., non-live loads and point loads for influence lines. The second table presents element
forces for all elements and all load cases. Initial and terminal end, axial, shear and moment responses are
presented. The responses in the column labeled, “3-Shear”, is the shear in the Z-direction and will always
be zero. In addition, the responses in the columns labeled, “Torsion” and “2-Moment”, will also always be
zero. Sample tables are shown in Figure 7.5.17-1.
7.5.18 CMO1 (Non-Live Load) (.MM Output File)
The information in this table is identical to that in Section 7.5.2 but it is presented in a format suitable for
easy transfer into a spread sheet.
7.5.19 CMO2 (Envelopes) (.MM Output File)
The information in this table is identical to that in Section 7.5.7 but it is presented in a format suitable for
easy transfer into a spread sheet.
7.5.20 ASC1 (Influence Lines) (.ANN Output File)
The information in this table is identical to that in Section 7.5.3 but it is presented in a format suitable for
easy transfer into a spread sheet.
7.5.21 Soil Pressures
The Soil Pressure table presents a variety of information for strip footings. The response in strip footings
is obtained by using the Total Limit State Responses at the bottom of the wall, so all six Maximum Effect
Cases need to be investigated for the footing. A sample table is shown in Figure 7.5.21-1.

Chapter 7 Output Description
7-60
The following information is reported:
1. P – Axial load force from the wall.
2. M – Moment force at bottom of wall.
3. V – Shear force at bottom of wall.
4. Bc – Effective footing width.
5. ecc – Eccentricity of wall loads.
6. N – Normalized axial load entering the footing for current POI.
7. Mo – Normalized moment load entering the footing for current POI.
8. Xo – Eccentricity of walls referenced to left edge of footing.
9. PRESS – Bearing pressure at current POI.
10. SHEAR – Shear force within footing.
11. MOMENT – Moment force within footing.
12. Vr – Shear resistance.
13. Mr – Moment resistance.

Chapter 7 Output Description
7-61
Figure 7.5.1-1 POI Information POI information for Top Span: 1
POI LOCN % SPAN Type Thick Width Top Cvr Bot Cvr Top As Bot As Shr Spc Av Top d Bot d
------- ------- ------- ------- ------- ------- ------- ------- ------- ------- ------- ------- ------- -------
6 3.20 0.40 Shr/Mmt 8.00 12.00 2.00 1.50 0.00 0.00 0.00 0.0 5.75 6.25
STR ANG FILL HT PHI SHR PHI BND PHI CMP BETA1 E STEEL E CONCR FPC FY
---------- ---------- ---------- ---------- ---------- ---------- ---------- ---------- ---------- ----------
45.00 10.00 0.90 1.00 0.75 0.80 4176000. 586696. 720.00 9360.00
ASMN1T ASMN1B ASMN2T ASMN2B ASMINN ASMINP SPMIN SPPMXT SPPMXB SPTSMX SPDMAX SPMAXT SPMAXB
------ ------ ------ ------ ------ ------ ------ ------ ------ ------ ------ ------ ------
0.072 0.072 0.065 0.207 0.072 0.207 0.00 0.00 0.00 0.00 0.00 0.00 0.00
OVRREN OVRREP POSRCH NEGRCH
------ ------ ------ ------
No No No No
ASPLS ASPLL ASPCS ASPPUT ASPMUT ASPOS ASNLS ASNLL ASNCS ASNPUT ASNMUT ASNEG
-------- -------- ------- ------- ------- ------- -------- -------- ------- ------- ------- -------
STR-I pos mom 0.92 12.59 0.385 0.00 0.00 0.072
VLS VLL VCS VVUT VMUT VC VSREQ VSMAX VAREQ
-------- -------- -------- -------- -------- -------- -------- -------- --------
STR-I pos mom -1.89 13. 15.90 0.00 15.31 0.000
Figure 7.5.2-1 Non-Live Load Results NonLive Load Response
WA DC DW OV EV EH1 EH2 DCB
-------- -------- -------- -------- -------- -------- -------- --------
AXIAL 0.000 -0.090 0.000 0.000 0.101 0.374 1.488 0.036
SHEAR 0.000 -0.080 0.000 0.000 -1.334 0.001 - small -2.000
MOMENT 0.000 0.641 0.000 0.000 9.133 -0.240 -0.714 -0.742

Chapter 7 Output Description
7-62
Figure 7.5.2-2 Non-Live Load Results – Connection Object NonLive Load Response
BRG PRS DC DCB DW OV EV WA
------- -------- -------- -------- -------- -------- --------
WALL1 0.892 0.000 0.000 0.000 0.121 0.697
WALL2 0.829 0.000 0.000 0.000 0.121 0.723
WALL3 0.766 0.000 0.000 0.000 0.121 0.749
Figure 7.5.3-1 Influence Lines Influence Lines
0.000 0.500 0.500 1.000 2.045 2.233 3.591 5.136 6.681 8.227
---------- ---------- ---------- ---------- ---------- ---------- ---------- ---------- ---------- ----------
AXIAL 0.003146 0.014347 0.014347 0.025916 0.051556 0.056327 0.091409 0.130006 0.163330 0.187364
SHEAR 0.002393 0.025027 -0.974973 -0.951500 -0.898294 -0.888124 -0.809635 -0.711766 -0.607743 -0.500620
MOMENT 0.018543 0.309715 0.309715 0.111984 -0.244551 -0.299686 -0.624197 -0.849079 -0.942870 -0.929244
9.772 11.317 12.862 14.220 14.408 15.453 15.953 16.453
---------- ---------- ---------- ---------- ---------- ---------- ---------- ----------
AXIAL 0.198093 0.191500 0.163570 0.118240 0.110285 0.057834 0.028261 -0.003146
SHEAR -0.393454 -0.289298 -0.191209 -0.112454 -0.102241 -0.048777 -0.025168 -0.002393
MOMENT -0.831876 -0.674439 -0.480607 -0.299017 -0.274053 -0.139094 -0.077879 -0.018543
Figure 7.5.3-2 Influence Lines - Connection Object Influence Lines
BRG PRS 0.000 0.833 2.358 2.683 4.533 6.383 8.233 10.083 11.933 13.783
------- ---------- ---------- ---------- ---------- ---------- ---------- ---------- ---------- ---------- ----------
WALL1 -0.050000 -0.040630 -0.023596 -0.019994 0.000127 0.019374 0.037393 0.053826 0.068319 0.080513
WALL2 0.175000 0.162505 0.139754 0.134931 0.107873 0.081688 0.056732 0.033361 0.011931 -0.007201
WALL3 0.025000 0.018755 0.007439 0.005056 -0.008127 -0.020437 -0.031518 -0.041014 -0.048569 -0.053826
BRG PRS 15.633 17.483 17.809 19.333 20.000 20.667 22.191 22.517 24.367 26.217
------- ---------- ---------- ---------- ---------- ---------- ---------- ---------- ---------- ---------- ----------
WALL1 0.090055 0.096587 0.097398 0.099753 0.100000 0.099753 0.097398 0.096587 0.090055 0.080513
WALL2 -0.023680 -0.037149 -0.039181 -0.047253 -0.050000 -0.052253 -0.055615 -0.056024 -0.056430 -0.053826
WALL3 -0.056430 -0.056024 -0.055615 -0.052253 -0.050000 -0.047253 -0.039181 -0.037149 -0.023680 -0.007201

Chapter 7 Output Description
7-63
Figure 7.5.4-1 Truck Responses Truck Responses
HS20 DESTNDB
..Tens.. ....Positive..... ..Compr. ....Negative..... ..Tens.. ....Positive..... ..Compr. ....Negative.....
Max Ax Max Shr Max Mmt Max Ax Max Shr Max Mmt Max Ax Max Shr Max Mmt Max Ax Max Shr Max Mmt
-------- -------- -------- -------- -------- -------- -------- -------- -------- -------- -------- --------
AXIAL -0.10 0.10 0.46 6.34 3.84 5.23 AXIAL -0.10 0.10 0.45 11.40 4.01 10.12
SHEAR -0.08 0.08 -31.20 -12.59 -34.33 -19.45 SHEAR -0.07 0.07 -30.47 -26.65 -53.97 -35.92
MOMENT -0.59 0.59 9.91 -26.62 1.52 -30.17 MOMENT -0.58 0.58 9.68 -50.36 -13.97 -53.78
TRKDIR 21 21 21 21 21 21 TRKDIR 11 11 11 11 11 11
TRKPOS 16.45 0.00 0.50 9.77 14.50 6.68 TRKPOS 20.45 0.00 0.50 11.32 4.50 9.14
TRKPOS 14.00 14.00 14.00 14.00 14.00 14.00 TRKPOS 0.00 0.00 0.00 0.00 0.00 0.00
Figure 7.5.4-2 Truck Responses – Connection Object Truck Responses HS20 DESTNDB Positive Response Negative Response Positive Response Negative Response BRG PRS WALL 1 WALL 2 WALL 3 WALL 1 WALL 2 WALL 3 BRG PRS WALL 1 WALL 2 WALL 3 WALL 1 WALL 2 WALL 3 ------- -------- -------- -------- -------- -------- -------- ------- -------- -------- -------- -------- -------- -------- WALL1 4.82 -2.00 -2.00 -2.00 4.26 4.32 WALL1 6.11 -1.74 -1.74 -1.74 5.56 5.56 WALL2 -1.67 5.80 2.20 2.20 -2.25 0.01 WALL2 -2.94 9.08 0.65 9.08 -3.42 -1.46 WALL3 -1.58 2.20 5.80 5.80 0.14 -2.25 WALL3 -3.02 0.65 9.08 0.65 -1.46 -3.42 TRKDIR 21 21 22 22 22 22 TRKDIR 11 11 11 11 11 11 TRKPOS 41.19 40.00 0.00 0.00 3.98 -5.72 TRKPOS 21.81 4.00 40.00 4.00 26.19 17.81 TRKPOS 14.00 26.00 26.00 26.00 14.00 14.00 TRKPOS 0.00 0.00 0.00 0.00 0.00 0.00
Figure 7.5.5-1 Truck Thru Fill Responses Truck Through Fill Responses
HS20 DESTNDB
..Tens.. ....Positive..... ..Compr. ....Negative..... ..Tens.. ....Positive..... ..Compr. ....Negative.....
Max Ax Max Shr Max Mmt Max Ax Max Shr Max Mmt Max Ax Max Shr Max Mmt Max Ax Max Shr Max Mmt
-------- -------- -------- -------- -------- -------- -------- -------- -------- -------- -------- --------
AXIAL -0.63 -0.10 -0.26 1.43 0.64 1.29 AXIAL -0.76 -0.12 -0.31 1.16 0.50 0.70
SHEAR -0.56 0.06 -2.97 -14.31 -21.46 -17.14 SHEAR -0.66 0.07 -3.56 -28.00 -28.77 -25.41
MOMENT -0.64 0.50 1.13 -17.54 -15.75 -18.31 MOMENT -0.74 0.60 1.36 -21.97 -23.30 -24.14
TRKDIR 1 1 1 1 1 1 TRKDIR 1 1 1 1 1 1
TRKPOS 14.19 0.32 0.98 8.34 6.39 7.58 TRKPOS 17.98 0.32 0.98 8.12 10.07 10.73
TRKPOS 0.00 0.00 0.00 0.00 0.00 0.00 TRKPOS 0.00 0.00 0.00 0.00 0.00 0.00

Chapter 7 Output Description
7-64
Figure 7.5.5-2 Truck Thru Fill Responses – Connection Object Truck Through Fill Responses
HS20 DESTNDB
Positive Response Negative Response Positive Response Negative Response
BRG PRS WALL 1 WALL 2 WALL 3 WALL 1 WALL 2 WALL 3 BRG PRS WALL 1 WALL 2 WALL 3 WALL 1 WALL 2 WALL 3
------- -------- -------- -------- -------- -------- -------- ------- -------- -------- -------- -------- -------- --------
WALL1 4.78 -1.85 0.35 -2.25 4.78 0.29 WALL1 7.39 -2.99 -0.19 -3.40 0.35 -1.63
WALL2 -0.93 4.85 -0.93 4.24 -0.93 4.23 WALL2 -0.48 6.11 -0.47 5.68 -0.89 5.67
WALL3 0.35 -1.35 4.78 0.27 0.35 -2.25 WALL3 -0.18 -2.93 7.42 -1.66 4.45 -3.40
TRKDIR 2 1 1 1 2 2 TRKDIR 1 1 1 1 1 1
TRKPOS -28.97 43.86 68.97 48.00 -28.97 -8.06 TRKPOS 7.72 24.00 40.00 27.59 44.14 20.14
TRKPOS 15.00 14.00 15.00 14.00 15.00 14.00 TRKPOS 0.00 0.00 0.00 0.00 0.00 0.00
Figure 7.5.6-1 Lane Responses Lane Responses
..Tens.. ....Positive..... ..Compr. ....Negative.....
Max Ax Max Shr Max Mmt Max Ax Max Shr Max Mmt
-------- -------- -------- -------- -------- --------
AXIAL -0.13 -0.01 -0.04 0.17 0.05 0.09
SHEAR -1.34 0.01 -0.36 -1.54 -2.89 -2.52
MOMENT -0.31 0.07 0.14 -1.97 -2.35 -2.42
Figure 7.5.6-2 Lane Responses – Connection Object Lane Responses
Positive Response Negative Response
BRG PRS WALL 1 WALL 2 WALL 3 WALL 1 WALL 2 WALL 3
------- -------- -------- -------- -------- -------- --------
WALL1 0.72 -0.27 0.17 -0.55 0.43 0.00
WALL2 0.09 1.26 0.09 1.03 -0.14 1.03
WALL3 0.17 -0.27 0.72 0.00 0.43 -0.55
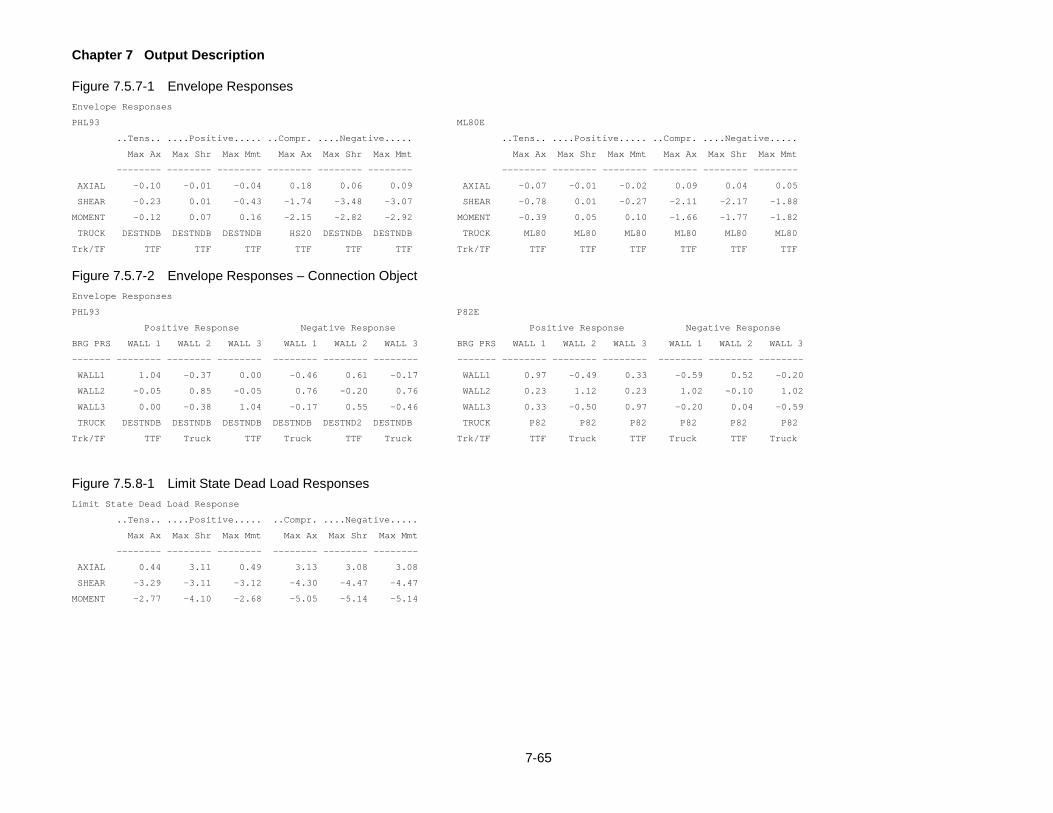
Chapter 7 Output Description
7-65
Figure 7.5.7-1 Envelope Responses Envelope Responses
PHL93 ML80E
..Tens.. ....Positive..... ..Compr. ....Negative..... ..Tens.. ....Positive..... ..Compr. ....Negative.....
Max Ax Max Shr Max Mmt Max Ax Max Shr Max Mmt Max Ax Max Shr Max Mmt Max Ax Max Shr Max Mmt
-------- -------- -------- -------- -------- -------- -------- -------- -------- -------- -------- --------
AXIAL -0.10 -0.01 -0.04 0.18 0.06 0.09 AXIAL -0.07 -0.01 -0.02 0.09 0.04 0.05
SHEAR -0.23 0.01 -0.43 -1.74 -3.48 -3.07 SHEAR -0.78 0.01 -0.27 -2.11 -2.17 -1.88
MOMENT -0.12 0.07 0.16 -2.15 -2.82 -2.92 MOMENT -0.39 0.05 0.10 -1.66 -1.77 -1.82
TRUCK DESTNDB DESTNDB DESTNDB HS20 DESTNDB DESTNDB TRUCK ML80 ML80 ML80 ML80 ML80 ML80
Trk/TF TTF TTF TTF TTF TTF TTF Trk/TF TTF TTF TTF TTF TTF TTF
Figure 7.5.7-2 Envelope Responses – Connection Object Envelope Responses
PHL93 P82E
Positive Response Negative Response Positive Response Negative Response
BRG PRS WALL 1 WALL 2 WALL 3 WALL 1 WALL 2 WALL 3 BRG PRS WALL 1 WALL 2 WALL 3 WALL 1 WALL 2 WALL 3
------- -------- -------- -------- -------- -------- -------- ------- -------- -------- -------- -------- -------- --------
WALL1 1.04 -0.37 0.00 -0.46 0.61 -0.17 WALL1 0.97 -0.49 0.33 -0.59 0.52 -0.20
WALL2 -0.05 0.85 -0.05 0.76 -0.20 0.76 WALL2 0.23 1.12 0.23 1.02 -0.10 1.02
WALL3 0.00 -0.38 1.04 -0.17 0.55 -0.46 WALL3 0.33 -0.50 0.97 -0.20 0.04 -0.59
TRUCK DESTNDB DESTNDB DESTNDB DESTNDB DESTND2 DESTNDB TRUCK P82 P82 P82 P82 P82 P82
Trk/TF TTF Truck TTF Truck TTF Truck Trk/TF TTF Truck TTF Truck TTF Truck
Figure 7.5.8-1 Limit State Dead Load Responses Limit State Dead Load Response
..Tens.. ....Positive..... ..Compr. ....Negative.....
Max Ax Max Shr Max Mmt Max Ax Max Shr Max Mmt
-------- -------- -------- -------- -------- --------
AXIAL 0.44 3.11 0.49 3.13 3.08 3.08
SHEAR -3.29 -3.11 -3.12 -4.30 -4.47 -4.47
MOMENT -2.77 -4.10 -2.68 -5.05 -5.14 -5.14

Chapter 7 Output Description
7-66
Figure 7.5.8-2 Limit State Dead Load Responses – Connection Object Limit State Dead Load Response
Positive Response Negative Response
BRG PRS WALL 1 WALL 2 WALL 3 WALL 1 WALL 2 WALL 3
------- -------- -------- -------- -------- -------- --------
WALL1 2.29 2.29 2.29 1.13 1.13 1.13
WALL2 2.23 2.23 2.23 1.07 1.07 1.07
WALL3 2.18 2.18 2.18 1.02 1.02 1.02
Figure 7.5.9-1 Limit State Live Load and Total Responses Limit State LL and LL+DL Responses
Envelope: PHL93 Dead Load + PHL93 Response
..Tens.. ....Positive..... ..Compr. ....Negative..... ..Tens.. ....Positive..... ..Compr. ....Negative.....
Max Ax Max Shr Max Mmt Max Ax Max Shr Max Mmt Max Ax Max Shr Max Mmt Max Ax Max Shr Max Mmt
-------- -------- -------- -------- -------- -------- -------- -------- -------- -------- -------- --------
AXIAL -0.17 -0.02 -0.07 0.31 0.11 0.15 AXIAL 0.27 3.09 0.42 3.44 3.19 3.24
SHEAR -0.41 0.01 -0.75 -3.05 -6.09 -5.37 SHEAR -3.70 -3.10 -3.87 -7.35 -10.57 -9.85
MOMENT -0.21 0.13 0.29 -3.76 -4.94 -5.11 MOMENT -2.98 -3.97 -2.40 -8.81 -10.08 -10.25
Figure 7.5.9-2 Limit State Live Load and Total Responses – Connection Object Limit State LL and LL+DL Responses
Envelope: PHL93 Dead Load + PHL93 Response
Positive Response Negative Response Positive Response Negative Response
BRG PRS WALL 1 WALL 2 WALL 3 WALL 1 WALL 2 WALL 3 BRG PRS WALL 1 WALL 2 WALL 3 WALL 1 WALL 2 WALL 3
------- -------- -------- -------- -------- -------- -------- ------- -------- -------- -------- -------- -------- --------
WALL1 1.81 -0.65 -0.01 -0.80 1.07 -0.29 WALL1 4.10 1.64 2.28 0.33 2.20 0.84
WALL2 -0.09 1.49 -0.09 1.33 -0.35 1.33 WALL2 2.14 3.72 2.15 2.41 0.72 2.41
WALL3 0.00 -0.67 1.82 -0.29 0.96 -0.80 WALL3 2.18 1.52 4.00 0.72 1.97 0.22

Chapter 7 Output Description
7-67
Figure 7.5.10-1 Reinforcement Design REINFORCEMENT DESIGN
Bar Size 4 5 6 7 8 9 10 11
-------- -------- -------- -------- -------- -------- -------- --------
S POS STR 14.50 22.50 32.50 44.00 58.50 74.00 94.00 115.50
S NEG STR 6.50 10.00 14.00 19.50 25.50 32.50 41.00 50.50
S POS CC 12.00 18.00 24.00 24.00 24.00 24.00 24.00 24.00
S NEG CC 6.50 10.00 14.00 19.50 24.00 24.00 24.00 24.00
S POS<MIN F F F F F F F F
S NEG<MIN F F F F F F F F
S POS>MAX T T T T T T T T
S NEG>MAX F F F F T T T T
POS CC LS
POS CC LL
POS CC CS
POS CC PU 0.00 0.00 0.00 0.00 0.00 0.00 0.00 0.00
POS CC MU 0.00 0.00 0.00 0.00 0.00 0.00 0.00 0.00
NEG CC LS
NEG CC LL
NEG CC CS
NEG CC PU 0.00 0.00 0.00 0.00 0.00 0.00 0.00 0.00
NEG CC MU 0.00 0.00 0.00 0.00 0.00 0.00 0.00 0.00

Chapter 7 Output Description
7-68
Figure 7.5.11-1 Limit State Section Capacities Limit State Section Capacity Results
Envelope: PHL93 Envelope: ML80E
..Tens.. ....Positive..... ..Compr. ....Negative..... ..Tens.. ....Positive..... ..Compr. ....Negative.....
Max Ax Max Shr Max Mmt Max Ax Max Shr Max Mmt Max Ax Max Shr Max Mmt Max Ax Max Shr Max Mmt
-------- -------- -------- -------- -------- -------- -------- -------- -------- -------- -------- --------
AXIAL -6.3 0.0 -7.5 4.2 0.0 3.5 AXIAL -1.9 0.0 -7.3 3.8 0.0 3.5
SHEAR 0.0 28.9 28.9 0.0 28.9 28.9 SHEAR 0.0 28.9 28.9 0.0 28.9 28.9
MOMENT -10.9 0.0 30.6 -18.4 0.0 -18.3 MOMENT -15.5 0.0 30.9 -18.3 0.0 -18.3
Figure 7.5-12-1 Limit State Rating Factors Limit State Rating Factor Results
Envelope: PHL93 Envelope: ML80E
.........Positive......... .........Negative......... .........Positive......... .........Negative.........
Max Ax Max Shr Max Mmt Max Ax Max Shr Max Mmt Max Ax Max Shr Max Mmt Max Ax Max Shr Max Mmt
-------- -------- -------- -------- -------- -------- -------- -------- -------- -------- -------- --------
AXIAL 39.26 0.00 115.99 3.56 0.00 2.57 AXIAL 18.63 0.00 187.85 4.57 0.00 4.12
SHEAR 0.00 2168.29 34.19 0.00 4.01 4.55 SHEAR 0.00 3529.00 54.98 0.00 6.44 7.41
MOMENT 39.26 0.00 115.99 3.56 0.00 2.57 MOMENT 18.63 0.00 187.85 4.57 0.00 4.12
Figure 7.5.13-1 Limit State Resistance/Demand Ratios Limit State Resistance/Demand Ratios
.........Positive......... .........Negative.........
Max Ax Max Shr Max Mmt Max Ax Max Shr Max Mmt
-------- -------- -------- -------- -------- --------
AXIAL 1.51 0.00 1.00 1.20 0.00 2.047-61
SHEAR 0.00 11.59 7.57 0.00 7.58 11.59
MOMENT 1.51 0.00 1.00 1.20 0.00 2.04

Chapter 7 Output Description
7-69
Figure 7.5.14-1 Limit State Allowable Spacings Limit State Allowable Spacing Results Envelope: PHL93 .........Positive......... .........Negative......... Max Ax Max Shr Max Mmt Max Ax Max Shr Max Mmt -------- -------- -------- -------- -------- -------- Spacing (in) 72.23 0.00 0.00 19.07 0.00 17.41 Location Top/Lft -- -- Top/Lft -- Top/Lft
Figure 7.5.15-1 Limit State Service Stresses Limit State Service Stress Results
Envelope: PHL93 Envelope: ML80E
.........Positive......... .........Negative......... .........Positive......... .........Negative.........
Max Ax Max Shr Max Mmt Max Ax Max Shr Max Mmt Max Ax Max Shr Max Mmt Max Ax Max Shr Max Mmt
-------- -------- -------- -------- -------- -------- -------- -------- -------- -------- -------- --------
CONC C -0.09 0.00 0.00 -0.17 0.00 -0.19 CONC C -0.10 0.00 0.00 -0.16 0.00 -0.16
CONC T 0.08 0.00 0.00 0.14 0.00 0.16 CONC T 0.09 0.00 0.00 0.13 0.00 0.14
REIN T 0.39 0.00 0.00 0.66 0.00 0.76 REIN T 0.42 0.00 0.00 0.60 0.00 0.62
REIN C 0.00 0.00 0.00 0.00 0.00 0.00 REIN C 0.00 0.00 0.00 0.00 0.00 0.00

Chapter 7 Output Description
7-70
Figure 7.5.16-1 Stiffness Analysis Model Report (.FEM Output File)
Node Point Coordinates
NODE X Y Z
(ft) (ft) (ft)
1 0.83333 14.70500 0.00000
2 2.35792 14.70500 0.00000
3 2.68333 14.70500 0.00000
4 4.53333 14.70500 0.00000
5 6.38333 14.70500 0.00000
Boundary Condition Information
NODE CODE
95 011101
96 011111
98 011110
100 011110
Equation Numbering NEQ= 295 Bandwidth= 12
NODE UNKNOWN NUMBER
NUMBER FX FY FZ THETA-X THETA-Y THETA-Z
1 189 190 0 0 0 191
2 180 181 0 0 0 182
3 171 172 0 0 0 173
4 162 163 0 0 0 164
5 153 154 0 0 0 155
Element Connectivity
Element Nodes
Type Description Number NI NJ
------------ ------------ ------ -- --
2 PFRAME TopSlab 1 1 2 0 0 0
3 PFRAME TopSlab 2 2 3 0 0 0
4 PFRAME TopSlab 3 3 4 0 0 0
5 PFRAME TopSlab 4 4 5 0 0 0
6 PFRAME TopSlab 5 5 6 0 0 0

Chapter 7 Output Description
7-71
Element Section Properties
Cross Shear Shear Shear
Section Moments of Inertia Areas Areas Modulus
Element ID Seg Length Area I11 I22 I33 E AV2 AV3 G
(ft) (ft^2) (ft^4) (ft^4) (ft^4) (ksf) (ft^2) (ft^2) (ksf)
---------- ------------ ------------ ------------ ------------ ------------ ------------ ------------ ------------ ------------
2 1.89 10000.00 0.00 0.00 0.82 454453.09 0.00 0.00 189355.46
3 0.11 10000.00 0.00 0.00 0.82 454453.09 0.00 0.00 189355.46
0.05 10000.00 0.00 0.00 0.82 454453.09 0.00 0.00 189355.46
4 2.05 10000.00 0.00 0.00 0.82 454453.09 0.00 0.00 189355.46
5 2.05 10000.00 0.00 0.00 0.82 454453.09 0.00 0.00 189355.46

Chapter 7 Output Description
7-72
Figure 7.5.17-1 Stiffness Analysis Results Report (.FER Output File) STATIC_DISP for SuperElement CULVERT 1
Node Coordinates
Node X Y Z M# X-Tran Y-Tran Z-Tran X-Rot Y-Rot Z-Rot
---- --------- --------- --------- -- ------------ ------------ ------------ ------------ ------------ ------------
1 0.38 6.77 0.00 ( 1) 0.00000E+00 0.00000E+00 0.00000E+00 0.00000E+00 0.00000E+00 0.00000E+00
( 2) 7.03383E-08 -5.41165E-05 0.00000E+00 0.00000E+00 0.00000E+00 -1.11591E-04
( 3) 0.00000E+00 0.00000E+00 0.00000E+00 0.00000E+00 0.00000E+00 0.00000E+00
( 4) 0.00000E+00 0.00000E+00 0.00000E+00 0.00000E+00 0.00000E+00 0.00000E+00
( 5) -2.42374E-08 -2.20826E-04 0.00000E+00 0.00000E+00 0.00000E+00 -4.73644E-04
( 6) -1.99741E-07 2.04068E-05 0.00000E+00 0.00000E+00 0.00000E+00 5.38628E-05
( 7) -3.85262E-07 2.92678E-05 0.00000E+00 0.00000E+00 0.00000E+00 7.73066E-05
STATIC_FORCES for SuperElement CULVERT 1
Description # LC Axial 2-Shear 3-Shear Torsion 2-Moment 3-Moment
------------ -- -- -------------- -------------- -------------- -------------- -------------- --------------
TopSlab 1 ( 1) I 0.00 0.00 0.00 0.00 0.00 0.00
J 0.00 0.00 0.00 0.00 0.00 0.00
( 2) I -0.14 0.51 0.00 0.00 0.00 0.25
J 0.14 -0.45 0.00 0.00 0.00 -0.01
( 3) I 0.00 0.00 0.00 0.00 0.00 0.00
J 0.00 0.00 0.00 0.00 0.00 0.00
( 4) I 0.00 0.00 0.00 0.00 0.00 0.00
J 0.00 0.00 0.00 0.00 0.00 0.00
( 5) I 0.05 2.96 0.00 0.00 0.00 2.37
J -0.05 -2.63 0.00 0.00 0.00 -0.98

Chapter 7 Output Description
7-73
Figure 7.5.21-1 Soil Pressures Strip Footing Results Envelope: PHL93 Envelope: ML80E .........Positive......... .........Negative......... .........Positive......... .........Negative......... Max Ax Max Shr Max Mmt Max Ax Max Shr Max Mmt Max Ax Max Shr Max Mmt Max Ax Max Shr Max Mmt -------- -------- -------- -------- -------- -------- -------- -------- -------- -------- -------- -------- P * 3.90 13.07 13.07 22.55 18.40 18.40 P * 3.90 9.80 9.80 18.82 16.03 16.03 V * 6.76 6.78 6.78 4.85 -1.38 -1.38 V * 6.76 6.77 6.77 4.64 -0.67 -0.67 M * 9.39 9.45 9.45 3.28 -8.71 -8.71 M * 9.39 9.43 9.43 2.61 -6.44 -6.44 Bc 1.94 3.76 3.76 4.25 4.25 4.25 Bc 1.94 3.34 3.34 4.25 4.25 4.25 ecc 1.48 0.87 0.87 0.30 -0.63 -0.63 ecc 1.48 1.01 1.01 0.28 -0.55 -0.55 N 11.09 20.26 20.26 29.74 25.59 25.59 N 11.09 16.99 16.99 26.01 23.22 23.22 Mo 7.17 25.41 25.41 54.40 70.55 70.55 Mo 7.17 18.91 18.91 48.02 62.12 62.12 Xo 0.65 1.25 1.25 1.83 2.76 2.76 Xo 0.65 1.11 1.11 1.85 2.67 2.67 PRESS+ 7.02 8.62 8.62 8.89 2.55 2.55 PRESS+ 7.02 7.89 7.89 7.68 2.72 2.72 SHEAR -6.64 -6.99 -6.99 -6.77 -0.92 -0.92 SHEAR -6.64 -6.50 -6.50 -5.80 -1.20 -1.20 MOMENT 2.70 2.72 2.72 2.59 0.26 0.26 MOMENT 2.70 2.54 2.54 2.21 0.38 0.38 Vr 0.00 22.32 22.32 0.00 22.32 22.32 Vr 0.00 22.32 22.32 0.00 22.32 22.32 Mr 19.05 0.00 19.05 19.05 0.00 19.05 Mr 19.05 0.00 19.05 19.05 0.00 19.05 * NOTE: P,V and M are from POI 1 in External Wall 1 + NOTE: PRESS is the bearing pressure at the POI of the footing for the indicated load case

Chapter 7 Output Description
7-74
7.6 FORMATTED OUTPUT TABLES
The following pages contain the format (i.e. the title, output parameters, units, field width and decimal locations, and
legends) for each output table described in this chapter, in the order listed in this chapter. On each table, the character
“a” represents a character value for that column, and the number of “a” characters shows the number of characters
possible there. The character “I” represents an integer value for that column, and the character “x” represents a real
value for that column, with the decimal location indicated. The output available for every run of the program may not
include all of the output tables shown. Depending on such items as the live loadings, type of run, specifications checked,
and output commands and parameters chosen; the program will print different combinations of these output reports.
7.6.1 INPUT FILE ECHO Report Format
[.ex01]ex01rtng.in ------------------ TTL BXLRFD Example Problem #1 TTL Single cell, haunches, no fish channel, level fill and level top slab ! ! DESIGN PC/ BS TS ! UNITS NCELL TYPE CIP SUP CTL US, 1, AR, P, Y, M ! ! PRGM STATE SPAN ! ID COUNTY ROUTE SEGMENT OFFSET ID SID =BXLRFD, 50, 666, 555, 9996, 654 ! ! FPC REIN REIN ALPHA MAX EPOXY CONCRETE DENSITY ! FPC TS GRADE TYPE ANGLE REBAR COATED FOR DL FOR EC MAT 5.0, , 65. , W, 45., 0.75, Y, 150.0, 145.0 ! ! TS BS LW RW IW % TS ! SPAN HEIGHT THICK THICK THICK THICK THICK GRAD GRAD DIM 9.0, 6.0, 9.0, 9.5, 9.0, 9.0, 0., 0.0, 0.0 ! ! SOIL FILL # LL LL OVRLAY OVRLAY FWS LL SEG MP ! DEN HEIGHT LANE SRCHRG TYPE DEN THICK PRESS DL LEN Fa LDC 120.0, 5.0, 1, 3.0, A, 0.0, 0.0, 0.0, 25., 12.,- , , , 1.0, 1.0, 1.0 ! ! TLX, TLY TRX, TRY BLX, BLY BRX, BRY TIX, TIY BIX, BIY HCH 6.0, 6.0, 6.0, 6.0, 6.0, 6.0, 6.0, 6.0, 0., 0., 0., 0. ! ! TS TS BS BS ALL FT FT ! TOP BOT TOP BOT WALLS TC BC CVR 2.0, 1.5, 2.0, 1.5, 1.5, 0.0, 0.0 ! ! ! SLAB BAR BAR BAR BAR BAR BAR ! # FACE R1 DIAM SPCNG R2 DIAM SPCNG R3 DIAM SPCN TSR 1, T, 9.0, 0.75, 20.5 TSR 1, B, 9.0, 0.75, 9.5 ! ! SLAB BAR BAR BAR BAR BAR BAR ! # FACE R1 DIAM SPCNG R2 DIAM SPCNG R3 DIAM SPCN

Chapter 7 Output Description
7-75
WLR 1, L, 3.0, 0.75, 18.0, 6.0, 0.75, 14.0 WLR 1, R, 6.0, 0.75, 14.0 ! ! SLAB BAR BAR BAR BAR BAR BAR ! # FACE R1 DIAM SPCNG R2 DIAM SPCNG R3 DIAM SPCN WLR 2, L, 6.0, 0.75, 14.0 WLR 2, R, 3.0, 0.75, 18.0, 6.0, 0.75, 14.0 ! ! SLAB BAR BAR BAR BAR BAR BAR ! # FACE R1 DIAM SPCNG R2 DIAM SPCNG R3 DIAM SPCN ! BSR 1, T, 9.0, 0.75, 8.5 BSR 1, B, 9.0, 0.75, 44.0 ! ! INP INP INP ! FILE CMNDS SUM OIN 1, 1, 1 ! ! SEC LL RAT DL DES RBR FND ! PROPS RAT SUM EFF/CAP REINF SPC PRES QUANT OUR 1, 1, 1, 1, 1, 1, 1, 1 ! ! GPOI NLL IL TRK TTF LNR ENV LSDL LSLL BART LSSC LSRF LSAS LSSS OUI 1, 1, 1, 1, 1, 1, 1, 1, 1, 0, 1, 1, 1,- 1, 0, 0, 0, 0, 0, 1
7.6.2 INPUT COMMANDS Report Format
COMMAND: CTL SYSTEM OF UNITS US NUMBER OF CELLS 1 TYPE OF RUN AR PRECAST OR CAST-IN-PLACE P BOTTOM SLAB Y TOP SLAB SUPPORT M FRAME SUPPORT F COMMAND: SID PROGRAM IDENTIFICATION =BXLRFD COUNTY 50 STATE ROUTE 666 SEGMENT 555 OFFSET 9996 SPAN IDENTIFICATION 654 COMMAND: MAT f'c FOR ALL MEMBERS 5.0 ksi f'c FOR TOP SLAB 4.0 ksi (default) REINFORCEMENT GRAGE 65. ksi REINFORCEMENT TYPE W ALPHA 45. degrees REBAR OR WIRE DIAM. 0.75 *
EPOXY COATED Y (default) DENSITY OF CONC. FOR DL 150.0 lb/ft^3 (default)
DENSITY OF CONC. FOR E 145.0 lb/ft^3 (default) COMMAND: DIM CLEAR SPAN 9.0 ft

Chapter 7 Output Description
7-76
CLEAR HEIGHT 6.0 ft TOP SLAB THICKNESS 9.0 in BOTTOM SLAB THICKNESS 9.5 in LEFT WALL THICKNESS 9.0 in RIGHT WALL THICKNESS 9.0 in INTERIOR WALL THICKNESS 0. in % GRADE 0.0 TOP SLAB % GRADE 0.0 UCHNL LEFT WALL HEIGHT * ft (computed, if necessary) UCHNL RIGHT WALL HEIGHT * ft (computed, if necessary) COMMAND: LDC EARTH WEIGHT/DENSITY 120.0 lbf/ft^3 HEIGHT OF FILL 5.0 ft NUMBER OF LANES 1 LIVE LOAD SURCHARGE 3.0 ft LIVE LOAD A OVERLAY WEIGHT/DENSITY 0.0 lbf/ft^3 OVERLAY THICKNESS 0.0 in FUTURE WEARING SURFACE 0.0 lbf/ft^2 LL DISTRIBUTION LENGTH 25. ft SEGMENT LENGTH 12. ft MULTIPLE PRESENCE REDUCT 1.0 (default) PA TRAFFIC FACTOR * (default) FATIGUE DYN. LOAD ALLOW. * (default) DUCTILITY FACTOR 1.0 REDUNDANCY FACTOR 1.0 IMPORTANCE FACTOR 1.0 PERMIT DYN. LOAD ALLOW. 1.20 (default) LIVE LOAD OVERRIDE 0 (default) MIN EQUIV FLUID PRESS 45.0 lbf/ft^3 (default) MAX EQUIV FLUID PRESS 70.0 lbf/ft^3 (default) BARRIER DEAD LOAD 0.5 kip/ft
APPROACH SLAB DL-LEFT 0 kip (default) APPROACH SLAB LL-LEFT 0 kip (default)
APPROACH SLAB DL-RIGHT 0 kip (default) APPROACH SLAB LL-RIGHT 0 kip (default)
RATINGS W/O FWS N (default) BACKFILL TYPE * NO. PC SHEAR TRNS SEG * COMMAND: HCH TOP LEFT X 6.0 in TOP LEFT Y 6.0 in TOP RIGHT X 6.0 in TOP RIGHT Y 6.0 in BOTTOM LEFT X 6.0 in BOTTOM LEFT Y 6.0 in BOTTOM RIGHT X 6.0 in BOTTOM RIGHT Y 6.0 in TOP INTERIOR X 0. in TOP INTERIOR Y 0. in BOTTOM INTERIOR X 0. in BOTTOM INTERIOR X 0. in
7.6.3 INPUT SUMMARY Report Format
CONFIGURATION

Chapter 7 Output Description
7-77
Lines Blank per Lines Page on Top ii ii TITLE aaaaaaaaaaaaaaaaaaaaaaaaaaaaaaaaaaaaaaaaaaaaaaaaaaaaaaaaaaaaaaaaaaaaaaaaaaa aaaaaaaaaaaaaaaaaaaaaaaaaaaaaaaaaaaaaaaaaaaaaaaaaaaaaaaaaaaaaaaaaaaaaaaaaaa aaaaaaaaaaaaaaaaaaaaaaaaaaaaaaaaaaaaaaaaaaaaaaaaaaaaaaaaaaaaaaaaaaaaaaaaaaa aaaaaaaaaaaaaaaaaaaaaaaaaaaaaaaaaaaaaaaaaaaaaaaaaaaaaaaaaaaaaaaaaaaaaaaaaaa CONTROL Sys of No of Type Bottom Top Slab Frame Units Cells of Run P or C Slab Support Support aa i aa a a a aaa STRUCTURE IDENTIFICATION Program State Span ID County Route Segment Offset ID =aaaaaa ii iiii iiii iiii iiii MATERIAL f'c All f'c Reinf Reinf Rebar Epoxy Members Top Slab Grade Type Alpha Size Coated (ksi) (ksi) (ksi) (deg) x.xx x.xx xx.x a xx.x ii a When using bars (instead of wires) MATERIAL f'c All f'c Reinf Reinf Wire Epoxy Members Top Slab Grade Type Alpha Diam Coated (ksi) (ksi) (ksi) (deg) (in) x.xx x.xx xxx.x a xx.x x.xx a When using wires (instead of bars) Concrete Density For DL For Ec (lb/ft^3) (lb/ft^3) xxxx.x xxxx.x DIMENSIONS Clear Clear Slab Thickness Wall Thickness Fill Top Slab Span Height Top Bottom Left Right Int Grade Grade (ft) (ft) (in) (in) (in) (in) (in) (%) (%) xx.xx xx.xx xx.x xx.x xx.x xx.x xx.x xx.xx xx.xx Left U-channel Right U-channel Wall Height Wall Height (ft) (ft) xx.xx xx.xx FOOTING

Chapter 7 Output Description
7-78
Left Left Left Right Right Right Inter Inter Footing Footing Footing Footing Footing Footing Footing Footing Width Thick Proj Width Thick Proj Width Thick (in) (in) (in) (in) (in) (in) (in) (in) xxx.x xxx.x xxx.x xxx.x xxx.x xxx.x xxx.x xxx.x LOAD CONTROL Future Earth Ht of No of Live Load Live Overlay Overlay Wearing Wt/Den Fill Lanes Surcharge Load Wt/Den Thick Surface (pcf) (ft) (ft) (pcf) (in) (psf) xxx.x xxx.xx i xx.xx a xxx.x xxxx.x xx.x Live Load Multiple PA Fatigue Distrib Segment Presence Traffic Dynamic Load Duct Redund Length Length Reduction Factor Allowance Factor Factor (ft) (ft) xxx.xx xxx.xx x.xx N/A N/A x.xx x.xx Permit Max Live Min Equiv Max Equiv Barrier Import Dynamic Load Load Fluid Fluid Dead Factor Allowance Override Pressure Pressure Load (pcf) (pcf) (kips/ft) x.xx x.xx i xxx.xx xxx.xx xx.xx Left Approach Slab Right Approach Slab Ratings w/o No. of Dead Live Dead Live Future Backfill Precast Load Load Load Load Wearing Type Shr Trns (kips) (kips) (kips) (kips) Surface Segments xx.xx xx.xx a xx.xx xx.xx a a N/A aaa * Note: Live Load set to 0.00 because Number of Lanes is zero SPECIAL LIVE LOAD Load Load Load Load Gage Pass Axle Lane Percent Factor Factor Factor Factor Dist Dist Effect Load Increase STR-I STR-II SER-I Fatigue (ft) (ft) (klf) xx.xx xx.xx a x.xx xx.xx x.xx x.xx x.xx N/A xx.xxx xx.xxx a x.xx xx.xx x.xx x.xx x.xx N/A SPECIAL AXLE LOADS Axle Axle Axle Axle Axle Axle Axle Load Spac Load Spac Load Spac Load (kip) (ft) (kip) (ft) (kip) (ft) (kip) xxx.xx xx.xx xxx.xx xx.xx xxx.xx xx.xx xxx.xx xx.xx xxx.xx xx.xx xxx.xx xx.xx xxx.xx xx.xx xxx.xx xx.xx xxx.xx xx.xx xxx.xx HAUNCH Top Left Top Right Bot Left Bot Right Top Int Bot Int X Y X Y X Y X Y X Y X Y (in) (in) (in) (in) (in) (in) (in) (in) (in) (in) (in) (in) xx.x xx.x xx.x xx.x xx.x xx.x xx.x xx.x xx.x xx.x xx.x xx.x

Chapter 7 Output Description
7-79
FISH CHANNEL Segment Thick Segment Thick Segment Thick Type Length Change Length Change Length Change (in) (in) (in) (in) (in) (in) a xx.xx x.xx xx.xx x.xx xx.xx x.xx x.xxx x.xxx x.xxx x.xxx x.xxx x.xxx COVERS Top Slab Bottom Slab Footing Top Bot Top Bot Walls Top Bot (in) (in) (in) (in) (in) (in) (in) xx.x xx.x xx.x xx.x xx.x xx.x xx.x TOP SLAB AREAS BOTTOM SLAB AREAS WALL AREAS Slab Range 1 Range 2 Range 3 No Face Dist Area Dist Area Dist Area (ft) (in^2) (ft) (in^2) (ft) (in^2) i a xx.xx xx.xxx xx.xx xx.xxx xx.xx xx.xxx i a xx.xx xx.xxx xx.xx xx.xxx xx.xx xx.xxx TOP SLAB REINFORCEMENT BOTTOM SLAB REINFORCEMENT WALL REINFORCEMENT Slab Range Bar Reinf Range Bar Reinf Range Bar Reinf No Face No 1 Size Spac No 2 Size Spac No 3 Size Spac (ft) (in) (ft) (in) (ft) (in) i a xx.xx ii xx.x xx.xx ii xx.x xx.xx ii xx.x i a xx.xx ii xx.x xx.xx ii xx.x xx.xx ii xx.x This table is used if BARS are specified (instead of wires) TOP SLAB REINFORCEMENT Slab Range Wire Reinf Range Wire Reinf Range Wire Reinf No Face 1 Diam Spac 2 Diam Spac 3 Diam Spac (ft) (in) (in) (ft) (in) (in) (ft) (in) (in) i a xx.xx xx.xx xx.x xx.xx xx.xx xx.x xx.xx xx.xx xx.x i a xx.xx xx.xx xx.x xx.xx xx.xx xx.x xx.xx xx.xx xx.x This table is used if WIRES are specified (instead of bars) TOP SLAB SHEAR REINFORCEMENT AREAS BOTTOM SLAB SHEAR REINFORCEMENT AREAS Slab No Region Start End Av Spac (ft) (ft) (in^2) (in) i i xx.xx xx.xx xx.xxx xx.x i xx.xx xx.xx xx.xxx xx.x WALL SHEAR REINFORCEMENT AREAS Wall No Region Start End Av Spac (ft) (ft) (in^2) (in) i i xx.xx xx.xx xx.xxx xx.x i xx.xx xx.xx xx.xxx xx.x

Chapter 7 Output Description
7-80
FOOTING AREAS Footing Number Face Area (in^2) i a xx.xxx i a xx.xxx FOOTING REINFORCEMENT Footing Bar Reinf Number Face Size Spac (in) i a ii xx.x i a ii xx.x This table is used if BARS are specified (instead of wires) FOOTING REINFORCEMENT Footing Wire Reinf Number Face Diam Spac (in) (in) i a x.xx xx.x i a x.xx xx.x This table is used if WIRES are specified (instead of bars) OUTPUT OF INPUT Input Input Input Echo Commands Summary i i I OUTPUT OF RESULTS Section LL Rating DL Eff Design Shear Found Serv Serv Props Rating Sum & Capac Reinf Design Press Quant Table Sum i i i i i i i i i i Found Press Summary i OUTPUT INTERMEDIATE RESULTS Genl Non-Live Truck Limit St POI Load Infl Truck Thru Fill Lane Envelope Dead Load Data Results Lines Response Response Response Response Results i i i i i i i i Limit St Limit St Limit St Limit St Limit St Live Load Bar Section Rating Allow Service FE FE Results Table Capac Factors Spacings Stresses Model Results i i i i i i i i Soil CMO1 CMO2 ACS1 Pressure

Chapter 7 Output Description
7-81
i i i i
7.6.4 ADDITIONAL INFORMATION Report Format
COMPUTED VALUES Computed Computed Computed Computed Input Flexure Axial Shear Development Reinf Reinf Reinf Reinf Reinf Grade Grade Grade Grade Grade (ksi) (ksi) (ksi) (ksi) (ksi) xxx.xxx xxx.xxx xxx.xxx xxx.xxx xxx.xxx ADDITIONAL GEOMETRY Final Component Thickness Top Slab #1 : xxx.xx in Top Slab #1 : xxx.xx in Top Slab #1 Lft: xxx.xx in Top Slab #1 Rgt: xxx.xx in Note: For sloped Top Slabs, the thickness is measured at the face of the walls or the end of haunches if present. Wall #1 : xxx.xx in Wall #2 : xxx.xx in Wall #3 : xxx.xx in Bot Slab #1 : xxx.xx in Bot Slab #2 : xxx.xx in Final Strip Footing Projections Left Wall Toe Projection : xxx.xx in Left Wall Heel Projection : xxx.xx in Center Wall Projection : xxx.xx in Right Wall Toe Projection : xxx.xx in Right Wall Heel Projection : xxx.xx in
7.6.5 GROSS SECTION PROPERTIES Report Format
Bottom Slab No. i Top Slab No. i Wall No. i Clear Span: xx.xxx (ft) Clear Height: xxx.xx (ft) Dist/Span Member Dist/Height Member M of Dist Ratio Thickness Inertia Area (ft) (in) (in^4) (in^2) xx.xxx x.xx xxxx. xxx.xxx xx.xx xx.xxx x.xx xxxx. xxx.xxx xx.xx xx.xxx x.xx xxxx. xxx.xxx xx.xx The minimum slab thickness for Bottom Slab No. 1 is xxx.xx (in)
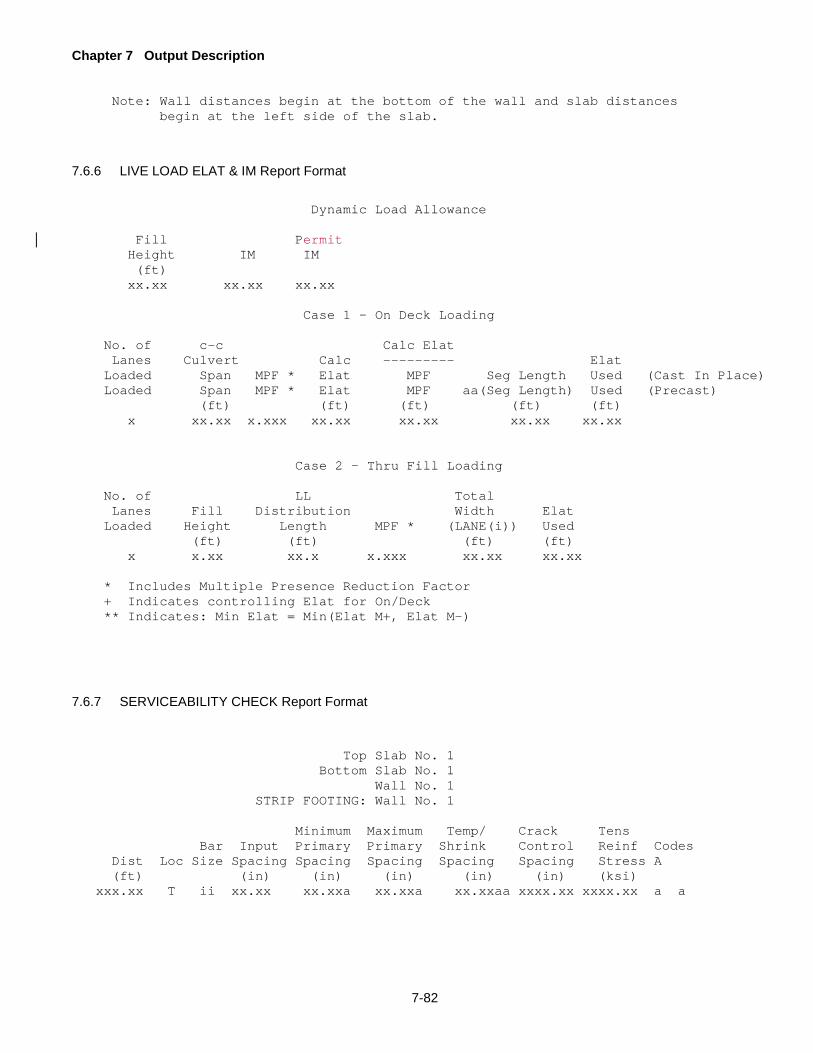
Chapter 7 Output Description
7-82
Note: Wall distances begin at the bottom of the wall and slab distances begin at the left side of the slab.
7.6.6 LIVE LOAD ELAT & IM Report Format
Dynamic Load Allowance Fill Permit Height IM IM (ft) xx.xx xx.xx xx.xx Case 1 - On Deck Loading No. of c-c Calc Elat Lanes Culvert Calc --------- Elat Loaded Span MPF * Elat MPF Seg Length Used (Cast In Place) Loaded Span MPF * Elat MPF aa(Seg Length) Used (Precast) (ft) (ft) (ft) (ft) (ft) x xx.xx x.xxx xx.xx xx.xx xx.xx xx.xx Case 2 - Thru Fill Loading No. of LL Total Lanes Fill Distribution Width Elat Loaded Height Length MPF * (LANE(i)) Used (ft) (ft) (ft) (ft) x x.xx xx.x x.xxx xx.xx xx.xx * Includes Multiple Presence Reduction Factor + Indicates controlling Elat for On/Deck ** Indicates: Min Elat = Min(Elat M+, Elat M-)
7.6.7 SERVICEABILITY CHECK Report Format
Top Slab No. 1 Bottom Slab No. 1 Wall No. 1 STRIP FOOTING: Wall No. 1 Minimum Maximum Temp/ Crack Tens Bar Input Primary Primary Shrink Control Reinf Codes Dist Loc Size Spacing Spacing Spacing Spacing Spacing Stress A (ft) (in) (in) (in) (in) (in) (ksi) xxx.xx T ii xx.xx xx.xxa xx.xxa xx.xxaa xxxx.xx xxxx.xx a a

Chapter 7 Output Description
7-83
ERROR!: User entered bar size and spacing has failed to meet serviceability criteria. An asterisk (*) indicates which criteria failed. Check the bar size and spacing against the allowable serviceability criteria. Refer to Design Manual Part 4, Section 5.7.3.4. NOTE: The Crack Control Stress criteria does not apply to the P-82 and PA2016-13 Permit Load Vehicle.
Temp/Shrinkage Codes: Code A: Loading A - Steel Area is less 1 PHL-93 than allowable 2 HL-93 B - Steel Spacing is 3 P-82 greater than 4 ML-80 allowable 5 HS-20 N/A - Section thickness is 6 H-20 greater than 18 in 7 SLL 8 TK527 9 EV2
Z EV3 Y SU6TV X PA2016-13
Note: Wall distances begin at the bottom of the wall and slab distances begin at the left side of the slab.
7.6.8 SERVICEABILITY SUMMARY Report Format
Minimum Maximum Temp/ Crack Primary Primary Shrink Control Location Spacing Spacing Spacing Spacing Top Slab No. 1 aa aa aa aa Wall No. 1 aa aa aa aa STRIP FOOTING: Wall No. 1 aa aa aa aa ERROR!: Serviceability criteria has not been met. For further details activate the Serviceability Check Table in the OUR command. Then verify entered bar size and spacing values.
7.6.9 LIVE LOAD RATING Report Format
LIVE LOAD RATING W/ FWS LIVE LOAD RATING W/O FWS
PHL-93 Loading: Top Slab No. 1 P-82 Loading: Bottom Slab No. 1 P-82 Loading: Wall No. 1 Fact Rating Factor Fact Fact Fact Resist IR OR Prov Min Phi Dist Moment Thrust Shear (kips-ft) Zone STR-I STR-IA Reinf Reinf Factor (ft) (kips-ft) (kip) (kip) (kip) (in^2) (in^2) xx.xx DL+E xxxx.xx xxx.xx xxx.xx xxxx.xx F1 aa xx.xx xxx.xx T xxx.xx aa x.xx LL+I xxxx.xx xxx.xx xxx.xx xxxx.xx V2 xx.xx xxx.xx DL+E xxxx.xx xxx.xx xxx.xx xxxx.xx F1 aa xx.xx xxx.xx T xxx.xx aa x.xx LL+I xxxx.xx xxx.xx xxx.xx xxxx.xx V1 xx.xx xx.xx DL+E xxxx.xx xxx.xx xxx.xx xxxx.xx F2 aa xx.xx xxx.xx T xxx.xx aa x.xx LL+I xxxx.xx xxx.xx xxx.xx xxxx.xx V5 xx.xx xxx.xx DL+E xxxx.xx xxx.xx xxx.xx xxxx.xx F3 aa xx.xx xxx.xx B xxx.xx aa x.xx

Chapter 7 Output Description
7-84
LL+I xxxx.xx xxx.xx xxx.xx xxxx.xx V6 xx.xx * Negative Rating due to deadload effects being greater than capacity ** Warning: The provided area of steel is less than the required minimum area of steel. F or V reported after the Fact Resist indicates whether the Rating is for Flexure (F) or Shear (V). The numerical code reported after F or V corresponds to the governing Maximum Effect Case for the Rating Factor. Maximum Effect Cases: 1 Maximum Positive Moment and Concurrent Thrust 2 Maximum Negative Moment and Concurrent Thrust 3 Maximum Tension Thrust and Concurrent Moment 4 Maximum Compression Thrust and Concurrent Moment 5 Maximum Positive Shear and Concurrent Moment 6 Maximum negative Shear and Concurrent Moment T, B, L, or R reported after the Reinforcement (Reinf) indicates the location of the flexural reinforcement reported: T Top steel in a slab B Bottom steel in a slab L Left steel in a wall R Right steel in a wall Zone Code Descriptions TN – Tension controlled section TR – Transition section CM – Compression controlled section
Phi Factor Epsilon (cl) = x.xxxxx Phi Factor Epsilon (tl) = x.xxxxx Note: Wall distances begin at the bottom of the wall and slab distances begin at the left side of the slab. +++++++++++++++++++++++++++++++++++++++++++++ + + + C O M B I N E D + + R A T I N G S U M M A R Y + + + +++++++++++++++++++++++++++++++++++++++++++++ H20 HS20 ML-80 TK527 PHL-93 INVENTORY Member aaaaaaaaaa aaaaaaaaaa aaaaaaaaaa aaaaaaaaaa aaaaaaaaaa RATING Dist. (ft) aaaaaaaaaa aaaaaaaaaa aaaaaaaaaa aaaaaaaaaa aaaaaaaaaa (IR) Limit State aaaaaaaaaa aaaaaaaaaa aaaaaaaaaa aaaaaaaaaa aaaaaaaaaa Rating aaaaaaaaaa aaaaaaaaaa aaaaaaaaaa aaaaaaaaaa aaaaaaaaaa Rating Tons aaaaaaaaaa aaaaaaaaaa aaaaaaaaaa aaaaaaaaaa aaaaaaaaaa H20 HS20 ML-80 TK527 PHL-93 P-82 OPERATING Member aaaaaaaaaa aaaaaaaaaa aaaaaaaaaa aaaaaaaaaa aaaaaaaaaa aaaaaaaaaa RATING Dist. (ft) aaaaaaaaaa aaaaaaaaaa aaaaaaaaaa aaaaaaaaaa aaaaaaaaaa aaaaaaaaaa (OR) Limit State aaaaaaaaaa aaaaaaaaaa aaaaaaaaaa aaaaaaaaaa aaaaaaaaaa aaaaaaaaaa Rating aaaaaaaaaa aaaaaaaaaa aaaaaaaaaa aaaaaaaaaa aaaaaaaaaa aaaaaaaaaa Rating Tons aaaaaaaaaa aaaaaaaaaa aaaaaaaaaa aaaaaaaaaa aaaaaaaaaa aaaaaaaaaa EV2 EV3 SU6TV PA2016-13 OPERATING Member aaaaaaaaaa aaaaaaaaaa aaaaaaaaaa aaaaaaaaaa RATING Dist. (ft) aaaaaaaaaa aaaaaaaaaa aaaaaaaaaa aaaaaaaaaa (OR) Limit State aaaaaaaaaa aaaaaaaaaa aaaaaaaaaa aaaaaaaaaa Rating aaaaaaaaaa aaaaaaaaaa aaaaaaaaaa aaaaaaaaaa Rating Tons aaaaaaaaaa aaaaaaaaaa aaaaaaaaaa aaaaaaaaaa All ratings are based on the inclusion of the design future wearing surface. All ratings are based on the exclusion of the design future wearing surface. F or V reported after the Rating Factor indicates whether the Rating

Chapter 7 Output Description
7-85
is for Flexure (F) or Shear (V).
7.6.10 STRIP FOOTING PERFORMANCE RATIOS Report Format
STRIP FOOTING PERFORMANCE RATIOS W/ FWS STRIP FOOTING PERFORMANCE RATIOS W/O FWS
Wall No. 1 Flexure Moment Shear Shear Loading Fact Moment Phi Perf Loading Fact Shear Perf Dist Code Moment Resist Factor Ratio Code Shear Resist Ratio (ft) A B C D (kips-ft) (kips-ft) A B C D (kips) (kips) xxx.xxLT 1 2 1 1 xxxxxx.xx xxxxx.xx x.xx xxx.xx LB 1 1 1 1 xxxxxx.xx xxxxx.xx x.xx xxx.xx xxx.xxRT 1 1 1 1 xxxxxx.xx xxxxx.xx x.xx xxx.xx RB 1 1 2 1 xxxxxx.xx xxxxx.xx x.xx xxx.xx xxx.xxLV 1 1 2 1 xxxxxx.xx xxxxx.xx x.xx xxx.xx i i i i xxxx.xx xxxx.xx xxx.xx xxx.xxRV i i i i xxxx.xx xxxx.xx xxx.xx L or R after the distance indicates the Left or Right side of the strip footing. T or B after the distance indicates the location of the flexural reinforcement reported: T Top steel in footing B Bottom steel in footing Flexure/Shear Loading Codes: Code A Code B Code C Code D 1 Strength-I 1 Maximum Positive Moment 1 PHL-93 1 On Deck 2 Strength-II 2 Maximum Negative Moment 2 HL-93 2 Thru Fill 3 Strength-IA 3 Maximum Tension Thrust 3 P-82 4 Maximum Compression Thrust 4 ML-80 5 Maximum Positive Shear 5 HS-20 6 Maximum Negative Shear 6 H-20 7 SLL 8 TK527 9 EV2 Z EV3 Y SU6TV X PA2016-13
7.6.11 RATING SUMMARY Report Format
RATING SUMMARY W/ FWS RATING SUMMARY W/O FWS Loading: PHL-93 Loading: P-82 Loading: ML-80 Loading: SPECIAL Loading: TK527 Dist/ IR IR Dist/ OR OR Span Rating Rating Span Rating Rating Member No. Dist Ratio Factor Tonnage Dist Ratio Factor Tonnage (ft) STR-I (ton) (ft) STR-II (ton) Top Slab 1 xx.xx xx.xx xx.xx F xxx.xx xx.xx xx.xx xx.xx F xxx.xx

Chapter 7 Output Description
7-86
Top Slab 2 xx.xx xx.xx xx.xx F xxx.xx xx.xx xx.xx xx.xx V xxx.xx Bot Slab 1 xx.xx xx.xx xx.xx F xxx.xx xx.xx xx.xx xx.xx F xxx.xx Bot Slab 2 xx.xx xx.xx xx.xx V xxx.xx xx.xx xx.xx xx.xx V xxx.xx Wall 1 xx.xx xx.xx xx.xx F xxx.xx xx.xx xx.xx xx.xx V xxx.xx Wall 2 xx.xx xx.xx xx.xx F xxx.xx xx.xx xx.xx xx.xx F xxx.xx Wall 3 xx.xx xx.xx xx.xx F xxx.xx xx.xx xx.xx xx.xx F xxx.xx * Negative Rating due to deadload effects being greater than capacity The Minimum Inventory Rating is governed by FLEXURE. The Minimum Inventory Rating is governed by SHEAR. The Minimum Inventory Rating Factor is xxx.xx at Distance xx.xxx (ft) in TOP SLAB 1. in BOTTOM SLAB 1. in WALL 1. The Minimum Operating Rating is governed by FLEXURE. The Minimum Operating Rating is governed by SHEAR. The Minimum Operating Rating Factor is xxx.xx at Distance xx.xxx (ft) in TOP SLAB 1. in BOTTOM SLAB 1. in WALL 1. F or V reported after the Rating Factor indicates whether the Rating is for Flexure (F) or Shear (V). Note: Wall distances begin at the bottom of the wall and slab distances begin at the left side of the slab.
7.6.12 DEAD LOAD EFFECTS AND CAPACITIES Report Format
Top Slab No. 1 Bottom Slab No. 1 Wall No. 1 Dist/ Factored Resist/ Height Loading Resist Demand Prov Min Phi Dist Ratio Code Moment Thrust Shear (kips-ft) Zone Ratio Reinf Reinf Factor (ft) A B (kips-ft) (kips) (kips) (kips) (in^2) (in^2) xx.xx x.xx i i xxxx.xx xxx.xx xxxx.xx F aa x.xx xx.xx T xxx.xx aa x.xx i i xxx.xx xxxx.xx V x.xx* xx.xx xx.xxx x.xx i i xxxx.xx xxx.xx xxxx.xx F aa x.xx xx.xx T xxx.xx aa x.xx i i xxx.xx xxxx.xx V x.xx xx.xx ** Warning: The provided area of steel is less than The required minimum area of steel. Loading Codes: Code A Code B 1 Strength-I 1 Maximum Positive Moment 2 Strength-II and Concurrent Thrust 3 Strength-IA 2 Maximum Negative Moment and Concurrent Thrust 3 Maximum Tension Thrust and Concurrent Moment 4 Maximum Compression Thrust and Concurrent Moment 5 Maximum Positive Shear and Concurrent Moment 6 Maximum Negative Shear
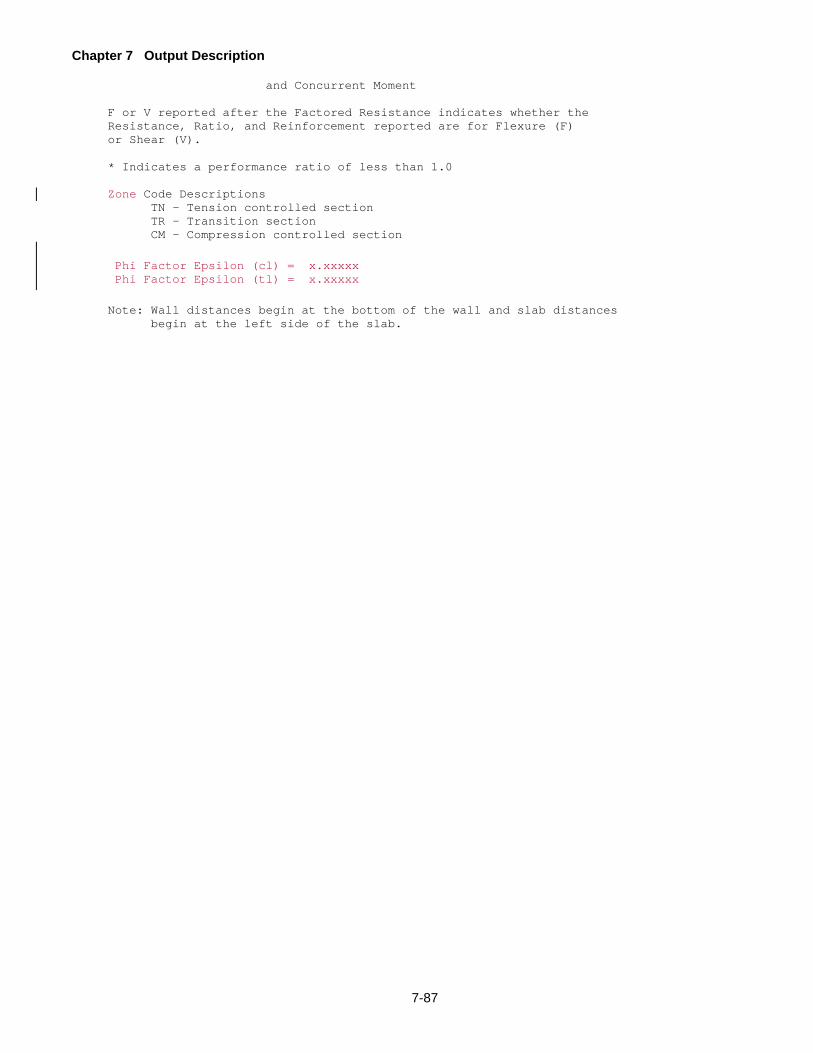
Chapter 7 Output Description
7-87
and Concurrent Moment F or V reported after the Factored Resistance indicates whether the Resistance, Ratio, and Reinforcement reported are for Flexure (F) or Shear (V). * Indicates a performance ratio of less than 1.0 Zone Code Descriptions TN – Tension controlled section TR – Transition section CM – Compression controlled section
Phi Factor Epsilon (cl) = x.xxxxx Phi Factor Epsilon (tl) = x.xxxxx
Note: Wall distances begin at the bottom of the wall and slab distances begin at the left side of the slab.
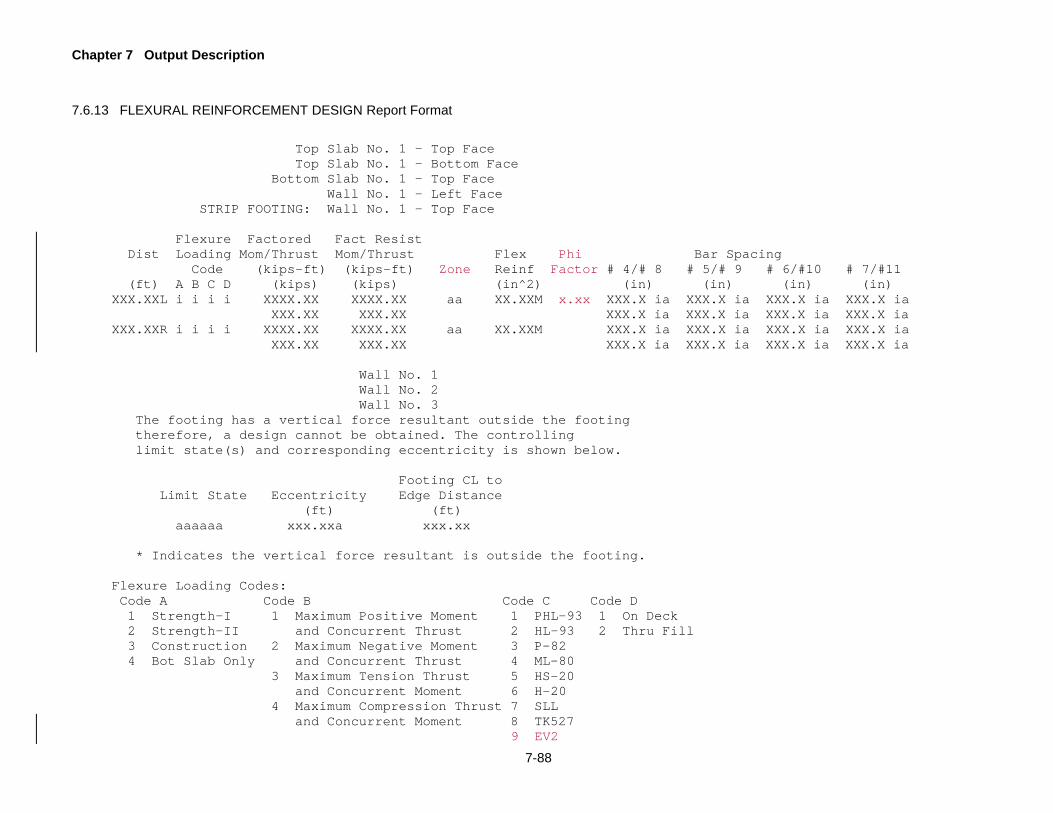
Chapter 7 Output Description
7-88
7.6.13 FLEXURAL REINFORCEMENT DESIGN Report Format
Top Slab No. 1 - Top Face Top Slab No. 1 - Bottom Face Bottom Slab No. 1 - Top Face Wall No. 1 - Left Face STRIP FOOTING: Wall No. 1 - Top Face Flexure Factored Fact Resist Dist Loading Mom/Thrust Mom/Thrust Flex Phi Bar Spacing Code (kips-ft) (kips-ft) Zone Reinf Factor # 4/# 8 # 5/# 9 # 6/#10 # 7/#11 (ft) A B C D (kips) (kips) (in^2) (in) (in) (in) (in) XXX.XXL i i i i XXXX.XX XXXX.XX aa XX.XXM x.xx XXX.X ia XXX.X ia XXX.X ia XXX.X ia XXX.XX XXX.XX XXX.X ia XXX.X ia XXX.X ia XXX.X ia XXX.XXR i i i i XXXX.XX XXXX.XX aa XX.XXM XXX.X ia XXX.X ia XXX.X ia XXX.X ia XXX.XX XXX.XX XXX.X ia XXX.X ia XXX.X ia XXX.X ia Wall No. 1 Wall No. 2 Wall No. 3 The footing has a vertical force resultant outside the footing therefore, a design cannot be obtained. The controlling limit state(s) and corresponding eccentricity is shown below. Footing CL to Limit State Eccentricity Edge Distance (ft) (ft) aaaaaa xxx.xxa xxx.xx * Indicates the vertical force resultant is outside the footing. Flexure Loading Codes: Code A Code B Code C Code D 1 Strength-I 1 Maximum Positive Moment 1 PHL-93 1 On Deck 2 Strength-II and Concurrent Thrust 2 HL-93 2 Thru Fill 3 Construction 2 Maximum Negative Moment 3 P-82 4 Bot Slab Only and Concurrent Thrust 4 ML-80 3 Maximum Tension Thrust 5 HS-20 and Concurrent Moment 6 H-20 4 Maximum Compression Thrust 7 SLL and Concurrent Moment 8 TK527 9 EV2

Chapter 7 Output Description
7-89
Z EV3 Y SU6TV X PA2016-13 If the Flexure Loading Code is blank, no reinforcement is required for strength. If an M is printed next to the Flexural Reinforcement, the design is governed by minimum reinforcement. Zone Code Descriptions TN – Tension controlled section TR – Transition section CM – Compression controlled section
Phi Factor Epsilon (cl) = x.xxxxx Phi Factor Epsilon (tl) = x.xxxxx
If a number appears after the spacing, it has been calculated using crack control requirements. That number corresponds to the Crack Control Codes listed below. If a number does not appear after the spacing, it has been calculated using the reported flexural reinforcement. The flexural reinforcement is based on the reported Flexure Loading Code. Crack Control Codes: 1 On Deck - Maximum Positive Moment and Concurrent Thrust 2 On Deck - Maximum Negative Moment and Concurrent Thrust 3 On Deck - Maximum Tension Thrust and Concurrent Moment 4 On Deck - Maximum Compression Thrust and Concurrent Moment 5 Through Fill - Maximum Positive Moment and Concurrent Thrust 6 Through Fill - Maximum Negative Moment and Concurrent Thrust 7 Through Fill - Maximum Tension Thrust and Concurrent Moment 8 Through Fill - Maximum Compression Thrust and Concurrent Moment When Live Load is not applicable, i.e., when Flexure Loading Codes C and D are blank, Crack Control Codes 1-4 will be used to indicate the Dead Load Maximum Effect Case. Ignore the 'On Deck' part of the code message. If a letter appears after the spacing, the letter corresponds to one of the following errors or messages: V Spacing < minimum (S5.10.3.1, S5.10.3.2) W Actual bar spacing was governed by DM-4 maximum spacing requirements (S5.10.3.2, S5.10.8.2)

Chapter 7 Output Description
7-90
Note: Wall distances begin at the bottom of the wall and slab distances begin at the left side of the slab.

Chapter 7 Output Description
7-91
7.6.14 DEVELOPMENT LENGTH CHECK Report Format
WALL BAR DEVELOPMENT INTO FOOTING Wall No. 2 Left Face is controlling (Area Steel Req’d = x.xxx in^2) Bar Hook Development Length Spacing # 4/# 8 # 5/# 9 # 6/#10 # 7/#11 (in) (in) (in) (in) (in) xx.x xx.xx xx.xx xx.xx xx.xx
xx.xx xx.xx xx.xx xx.xx
* - indicates the bar cannot develop into the footing
7.6.15 SHEAR DESIGN Report Format
Bottom Slab No. 1 Top Slab No. 1 Wall No. 1 Shear Conc+ Loading Factored Flex Shear Shear Shear Dist Code Shear Moment Reinf Depth Capac Reinf (ft) A B C D (kips) (kips-ft) (in^2) (in) (kips) (in^2) xx.xx i i i i xxx.xx xxxx.xx xx.xx xx.xx xxx.xx xx.xx* xx.xx i i i i xxx.xx xxxx.xx xx.xx xx.xx xxx.xx xx.xx * Indicates Vs required > Vs max Shear Loading Codes: Code A Code B Code C Code D 1 Strength-I 1 Maximum Positive Moment 1 PHL-93 1 On Deck 2 Strength-II and Concurrent Thrust 2 HL-93 2 Thru Fill 3 Construction 2 Maximum Negative Moment 3 P-82 4 Bot Slab Only and Concurrent Thrust 4 ML-80 3 Maximum Tension Thrust 5 HS-20 and Concurrent Moment 6 H-20 4 Maximum Compression Thrust 7 SLL and Concurrent Moment 8 TK527 5 Maximum Positive Shear 9 EV2 and Concurrent Moment Z EV3 6 Maximum Negative Shear Y SU6TV and Concurrent Moment X PA2016-13 + The Concrete Shear Capacity shown is the factored shear capacity (phiv*Vc) The Factored Moments shown are the moments associated with the reported Shear Loading Code (i.e., limit state, max effect case, live load, on deck/thru fill). Areas of flexural reinforcement printed here are used in shear calculations are optimized values that satisfy strength and

Chapter 7 Output Description
7-92
serviceability requirements for member flexural regions. See section 3.5 in user's manual for further information. Note: Wall distances begin at the bottom of the wall and slab distances begin at the left side of the slab.
7.6.16 STRIP FOOTING SHEAR DESIGN Report Format
Under Wall No. i Dist Side Shear from of Loading Fact Shear Shear Performance Face Wall Code Shear Depth Resist Ratio (ft) A B C D (kips) (in) (kips) XXX.XX Left i i i i XXXX.XX XX.XX XXXX.XX XXX.XX XXX.XX Right i i i i XXXX.XX XX.XX XXXX.XX XXX.XX The footing has a vertical force resultant outside the footing therefore, a design cannot be obtained. The controlling limit state(s) and corresponding eccentricity is shown below. Footing CL to Limit State Eccentricity Edge Distance (ft) (ft) aaaaaa xxx.xxa xxx.xx * Indicates the vertical force resultant is outside the footing. Shear Loading Codes: Code A Code B Code C Code D 1 Strength-I 1 Maximum Positive Moment 1 PHL-93 1 On Deck 2 Strength-II and Concurrent Thrust 2 HL-93 2 Thru Fill 3 Construction 2 Maximum Negative Moment 3 P-82 and Concurrent Thrust 4 ML-80 3 Maximum Tension Thrust 5 HS-20 and Concurrent Moment 6 H-20 4 Maximum Compression Thrust 7 SLL and Concurrent Moment 8 TK527 5 Maximum Positive Shear 9 EV2 and Concurrent Moment Z EV3 6 Maximum Negative Shear Y SU6TV and Concurrent Moment X PA2016-13 Shear POI check at distance d not being done/reported on left side because distance d is outside the footing. * Indicates a performance ratio of less than 1.0 The footing under this wall has a vertical force resultant outside the footing, therefore, a design cannot be obtained. See the STRIP FOOTING BEARING PRESSURE Report for more information on which Limit State caused this condition. Shear POI check at left face of wall not done/reported because there is no negative moment at this location.

Chapter 7 Output Description
7-93
7.6.17 MINIMUM REINFORCEMENT CHECK Report Format
Cracking Temp Area Moment Rho Min Shrink 0.002 Phi Prov/ Status Dist M(cr) 4/3*M(u) Area Area Ag Factor Width Code (ft) (kip-ft) (kip-ft) (in^2) (in^2) (in^2) (in^2) (in^2) xx.xx xx.xx xx.xx+ x.xx* x.xx xx.xx x.xxx x.xxx xx.xx xx.xx+ xx.xx x.xx* x.xx xx.xx x.xxx x.xxx A xx.xx xx.xx+ xx.xx x.xx x.xx* xx.xx x.xxx x.xxx xx.xx xx.xx xx.xx+ x.xx x.xx* xx.xx x.xxx x.xxx Status Code Descriptions + - Controlling moment for Rho Min Area calculation * - Controlling minimum area of steel A - Area provided smaller than required minimum area of steel
7.6.18 FOUNDATION PRESSURE Report Format
Maximum Influence Line Pressure at Wall No. 1 Maximum Influence Line Pressure at Wall No. 2 Maximum Influence Line Pressure at Wall No. 3 Wall 1 Wall 2 Wall 3 Eff Foundation Lim St Load Press Press Press Bearing Width (ksf) (ksf) (ksf) (ft) STR-I PHL-93 xxxx.xx * xxxx.xx xxxx.xx xxxx.xx P-82 xxxx.xx xxxx.xx xxxx.xx xxxx.xx HL-93 xxxx.xx xxxx.xx xxxx.xx xxxx.xx ML-80 xxxx.xx xxxx.xx xxxx.xx xxxx.xx HS-20 xxxx.xx xxxx.xx xxxx.xx xxxx.xx H-20 xxxx.xx xxxx.xx xxxx.xx xxxx.xx SLL xxxx.xx xxxx.xx xxxx.xx xxxx.xx TK527 xxxx.xx xxxx.xx xxxx.xx xxxx.xx EV2 xxxx.xx xxxx.xx xxxx.xx xxxx.xx EV3 xxxx.xx xxxx.xx xxxx.xx xxxx.xx SU6TV xxxx.xx xxxx.xx xxxx.xx xxxx.xx PA2016-13 xxxx.xx xxxx.xx xxxx.xx xxxx.xx * Indicates the maximum Foundation Pressure for each limit state.
7.6.19 FOUNDATION PRESSURE SUMMARY Report Format
Maximum Foundation Pressure Wall 1 Wall 2 Wall 3 Lim St Load Press Press Press (ksf) (ksf) (ksf) STR-I PHL-93 xxxx.xx * xxxx.xx xxxx.xx P-82 xxxx.xx xxxx.xx xxxx.xx HL-93 xxxx.xx xxxx.xx xxxx.xx ML-80 xxxx.xx xxxx.xx xxxx.xx TK527 xxxx.xx xxxx.xx xxxx.xx EV2 xxxx.xx xxxx.xx xxxx.xx EV3 xxxx.xx xxxx.xx xxxx.xx SU6TV xxxx.xx xxxx.xx xxxx.xx

Chapter 7 Output Description
7-94
PA2016-13 xxxx.xx xxxx.xx xxxx.xx aaaaaa xxxx.xx xxxx.xx xxxx.xx * Indicates the maximum Foundation Pressure for each limit state.
7.6.20 STRIP FOOTING BEARING PRESSURE Report Format
Wall No. 1 STR-I STR-I STR-II STR-II SER-I SER-I Live e/B Bearing e/B Bearing e/B Bearing Load Locn Ratio Pressure Ratio Pressure Ratio Pressure (ksf) (ksf) (ksf) PHL-93 L xx.xx xxx.xx xx.xx * xxx.xx xx.xx xxx.xx R xxx.xx xxx.xx xxx.xx P-82 L xx.xx xxx.xx xx.xx xxx.xx xx.xx xxx.xx R xxx.xx xxx.xx xxx.xx HL-93 L xx.xx * xxx.xx xx.xx xxx.xx xx.xx xxx.xx R xxx.xx xxx.xx xxx.xx SLL L xx.xx xxx.xx xx.xx xxx.xx xx.xx xxx.xx R xxx.xx xxx.xx xxx.xx ML-80 L xx.xx xxx.xx xx.xx xxx.xx xx.xx xxx.xx R xxx.xx * xxx.xx xxx.xx * HS-20 L xx.xx xxx.xx xx.xx xxx.xx xx.xx xxx.xx R xxx.xx xxx.xx xxx.xx H-20 L xx.xx xxx.xx xx.xx xxx.xx xx.xx xxx.xx R xxx.xx xxx.xx xxx.xx TK527 L xx.xx xxx.xx xx.xx xxx.xx xx.xx xxx.xx R xxx.xx xxx.xx xxx.xx EV2 L xx.xx xxx.xx xx.xx xxx.xx xx.xx xxx.xx R xxx.xx xxx.xx xxx.xx EV3 L xx.xx xxx.xx xx.xx xxx.xx xx.xx xxx.xx R xxx.xx xxx.xx xxx.xx SU6TV L xx.xx xxx.xx xx.xx xxx.xx xx.xx xxx.xx R xxx.xx xxx.xx xxx.xx PA2016-13 L xx.xx xxx.xx xx.xx xxx.xx xx.xx xxx.xx R xxx.xx xxx.xx xxx.xx * Indicates the maximum e/B Ratio and Footing Pressure, among all maximum effect cases, for each limit state. L Left edge of the footing R Right edge of the footing A maximum value for qb of xxx.xx (ksf) (qb = N/Be) occurs for the STR-II limit state, PHL-93 live load, maximum effect case 3. For this reported condition, Be is xxx.xx (ft). This average pressure is used in the calculation of settlement for soils.

Chapter 7 Output Description
7-95
7.6.21 QUANTITIES Report Format
Volume of Concrete Based on a segment length of: xxx.xx ft. Top Slab: xxx.xx (yd^3) Bottom Slab: xxx.xx (yd^3) Left Wall: xxx.xx (yd^3) Right Wall: xxx.xx (yd^3) Haunches: xxx.xx* (yd^3) TOTAL: xxx.xx (yd^3) Weight of Segment Segment Weight: xxx.xx Kips * All haunches are included only in this total

Chapter 7 Output Description
7-96
7.7 SPECIFICATION CHECK FAILURES
BXLRFD does not have an output table that gives a summary of output tables containing specification check
failures. Codes are printed next to data items in individual report tables, and footnotes are printed after tables, to
indicate specification check failures.

8-1
8. EXAMPLE PROBLEMS
8.1 EXAMPLE PROBLEMS
This chapter contains the example problems used to test and verify this program. Table 1 shows the example
problem matrix, which lists each example problem and the key input items used to differentiate the problems. For
each example problem, the following information is given: a brief narrative description of the problem; the input
items from the example problem matrix; additional assumptions and input items required to create the input data
file; and a sketch which shows the culvert geometry. The actual input data file for each example problem is listed
in this manual, and is included electronically along with the executable program.

Chapter 8 Example Problems
8-2
Table 8.1-1 Example Problem Matrix
Example Problem
Input Item
1*
2*
3*
4*
5*
# cells
1
2
1
1
2
Design Type (1)
AR
DR
DR
DA
AR
PC or CIP
PC
CIP
CIP
CIP
CIP
Units
US
US
US
US
US
Fill Ht or @grade
5.0'
1.0'
5.33'
@grade
@grade
Live Loading Type(2)
A
E
E
E
B
No. of LL Lanes
1
1
2
2
2
Clear Span Length
9.0'
18.5'
10.0'
24.0'
20.5'
Clear Height
6.0’
12.83'
6.83'
12.583'
12.0'
Top Slab Thickness
9.0"
21.0"
12.0"
10.0"
25.7"
Bottom Slab Thickness
9.5"
24.0"
12.0"
None
15.0"
Exterior Wall Thickness
9.0"
20.0"
12.0"
12.0"
12.0"
Interior Wall Thickness
---
16.0"
---
---
12.0"
Steel Grade (fy)
60 ksi
60 ksi
40 ksi
60 ksi
60 ksi
Concrete F’c
5.0 ksi
3.0 ksi
3.0 ksi
3.0 ksi
3.0 ksi
% Soil Grade
0.0
0.0
-6.98
0.0
0.0
% Deck Grade
0.0
0.0
0.0
1.0
-2.91
Live Load Surcharge
3.0'
3.0'
2.0'
3.0'
3.0'
Fish Channel (Std or Non-Std)
None
Std
Non-Std
---
None
Haunch
Yes
No
No
No
No
Simply Supported Top Slab
No
No
No
No
Yes
Shear α/θ Values
45o/45o
45o/45o
45o/45o
45o/45o
45o/45o
Max L.L Dist. Length
25'
48'
38'
76'
50'
Culvert Segment L
12'
90'
90'
90'
90'
Soil Density
120lb/ft3
120lb/ft3
120lb/ft3
120lb/ft3
120lb/ft3
Overlay Density
N.A.
N.A.
N.A.
N.A.
150lb/ft3

Chapter 8 Example Problems
8-3
Table 8.1-1 Example Problem Matrix (cont.)
Example Problem
Input Item
1*
2*
3*
4*
5*
Overlay Thickness
0.0
0.0
0.0
0.0
3.0"
Top Slab f’c
N.A.
Default
Default
4.5ksi
4.5ksi
User Specified FWS
none
none
none
none
none
MPRF
1.0
1.0
1.0
1.0
1.0
PA Traffic Factor
N.A.
N.A.
N.A.
N.A.
N.A.
PA Fatigue Factor
N.A.
N.A.
N.A.
N.A.
N.A.
Eta - D
1.0
1.0
1.0
1.0
1.0
Eta - R
1.0
1.0
1.0
1.0
1.0
Eta - I
1.0
1.0
1.0
1.0
1.0
Haunch Size
6.0"
N.A.
N.A.
N.A.
N.A.
Strip Footing Width
N.A.
N.A.
N.A.
84.0"
N.A.
Strip Footing Depth
N.A.
N.A.
N.A.
24.0"
N.A.
Max Bar or Wire Dia.
Wire-.60"
#11
#11
#8
#9
U-channel Left Wall Height
N.A.
N.A.
N.A.
N.A.
N.A.
U-channel Right Wall Height
N.A.
N.A.
N.A.
N.A.
N.A.
Min Equivalent Fluid Pressure
45lb/ft3
45lb/ft3
45lb/ft3
45lb/ft3
45lb/ft3
Max Equivalent Fluid Pressure
70lb/ft3
70lb/ft3
70lb/ft3
70lb/ft3
70lb/ft3
(1) DR = Design reinforcement with known slab t; DA = Design flexure reinf, shear reinf. and slab thickness;
DC = design flexure reinf. and slab thickness without shear reinf; AR = known reinf. and slab thickness, perform rating.
(2) Design Options Are: A = PHL93, P82 and ML80; B = HL93 and P82; C = HL93; D = PHL-93, ML-80 and P-82; E = PHL93, ML80, TK527, and P82; F = PHL93, ML80, TK527, PA2016-13, and P82 Rating Options Are: A = PHL93, P82 and ML80; B = HL93; C = ML80; D = P82; E = Special (user defined); F = TK527; G = EV2, EV3, SU6TV; H = PA2016-13; I = PHL93, P82, ML80, TK527, PA2016-13, HS20, H20
* Example problem taken from existing culvert program manual (BOX5).

Chapter 8 Example Problems
8-4
Table 8.1-1 Example Problem Matrix (cont.)
Example Problem
Input Item
7
8
9
10
# cells
1
1
2
2
Design Type (1)
DC
AR
AR
AR
PC or CIP
CIP
CIP
CIP
CIP
Units
US
US
US
US
Fill Ht or @grade
4.25 ft
7.25 ft
@grade
2.0 ft
Live Loading Type(2)
E
C
C
E
No. of LL Lanes
3
2
2
1
Clear Span Length
13.0 ft
29.5 ft
15.0 ft
12.0 ft
Clear Height
6.5 ft
13 ft
10.0 ft
7.0 ft
Top Slab Thickness
10 in
22.5 in
22 in
10 in
Bottom Slab Thickness
10 in
None
12 in
12 in
Exterior Wall Thickness
12 in
22 in
12 in
12 in
Interior Wall Thickness
N.A.
N.A.
12 in
10 in
Steel Grade (fy)
60 ksi
60 ksi
40 ksi
60 ksi
Concrete f'c
3.0 ksi
3.0 ksi
3.0 ksi
3.0 ksi
% Soil Grade
0.0
2.2
0.0
0.0
% Deck Grade
0.0
1.0
-2.0
0.0
Live Load Surcharge
2.0 ft
1.33 ft
2.0 ft
3.0 ft
Fish Channel (Std or Non-Std)
Non-Std
N.A.
Non-Std
None
Haunch
No
No
Yes
No
Simply Supported Top Slab
Yes
No
No
No
Shear α/θ Values
45o/45o
45o/45o
45o/45o
45o/45o
Max L.L. Dist. Length
54 ft
66 ft
56 ft
59 ft
Culvert Segment L
90 ft
90 ft
90 ft
90 ft
Soil Density
140 lb/ft3
140 lb/ft3
140 lb/ft3
default
Overlay Density
N.A.
N.A.
N.A.
140 lb/ft3

Chapter 8 Example Problems
8-5
Table 8.1-1 Example Problem Matrix (cont.)
Example Problem
Input Item
7
8
9
10
Overlay Thickness
0.0
0.0
0.0
4 in
Top Slab f'c
N.A.
N.A.
4.0 ksi
N.A.
User Specified FWS
none
none
30.7 lb/ft2
none
MPRF
0.95
1.0
1.0
1.0
PA Traffic Factor
N.A.
N.A.
N.A.
N.A.
PA Fatigue Factor
N.A.
N.A.
N.A.
N.A.
Eta - D
0.95
1.0
1.0
1.0
Eta - R
1.0
0.98
1.0
1.0
Eta - I
1.0
1.05
1.0
1.0
Haunch Size
N.A.
N.A.
6 in
N.A.
Strip Footing Width
N.A.
100 in
N.A.
N.A.
Strip Footing Depth
N.A.
30 in
N.A.
N.A.
Max Bar or Wire Dia.
#9
#11
#9
#9
U-channel Left Wall Height
N.A.
N.A.
N.A.
N.A.
U-channel Right Wall Height
N.A.
N.A.
N.A.
N.A.
Min Equivalent Fluid Pressure
45 lb/ft3
45 lb/ft3
45 lb/ft3
45 lb/ft3
Max Equivalent Fluid Pressure
70 lb/ft3
70 lb/ft3
70 lb/ft3
70 lb/ft3

Chapter 8 Example Problems
8-6
Table 8.1-1 Example Problem Matrix (cont.)
Example Problem Input Item
11
12
13
# cells
1
2
U
Design Type (1)
DA
DA
DC
PC or CIP
PC
CIP
CIP
Units
US
US
US
Fill Ht or @grade
10.0'
4.5'
N.A.
Live Loading Type(2)
N.A.
E
N.A.
No. of LL Lanes
N.A.
2
N.A
Clear Span Length
8.0'
12.0'
8.0’
Clear Height
6.0'
8.0'
N.A.
Top Slab Thickness
default
10.5'
N.A.
Bottom Slab Thickness
default
11.5'
11.5 in
Exterior Wall Thickness
default
12.0"
12.0”
Interior Wall Thickness
N.A.
12.0"
12.0”
Steel Grade (fy)
60 ksi
60 ksi
60 ksi
Concrete f'c
5.0 ksi
3.0 ksi
3.0 ksi
% Soil Grade
0.0
0.0
N.A.
% Deck Grade
0.0
0.0
N.A.
Live Load Surcharge
N.A.
3.0
3.0’
Fish Channel (Std or Non-Std)
None
Std
None
Haunch
No
Yes
No
Simply Supported Top Slab
No
No
N.A.
Shear α/θ Values
45o/45o
45o/45o
45o/45o
Max L.L. Dist. Length
80'
60'
N.A
Culvert Segment L
12'
90'
90‘
Soil Density
145lb/ft3
140lb/ft3
120lb/ft3

Chapter 8 Example Problems
8-7
Table 8.1-1 Example Problem Matrix (cont.)
Example Problem
Input Item
11
12
13
Overlay Thickness
0.0
0.0
N.A.
Top Slab f'c
N.A.
N.A.
N.A.
User Specified FWS
none
none
N.A.
MPRF
1.0
0.91
N.A.
PA Traffic Factor
N.A.
N.A.
N.A.
PA Fatigue Factor
N.A.
N.A.
N.A.
Eta - D
1.0
1.05
1.0
Eta - R
1.03
1.0
1.0
Eta - I
1.0
1.0
1.0
Haunch Size
N.A.
9.0"
N.A.
Strip Footing Width
N.A.
N.A.
N.A.
Strip Footing Depth
N.A.
N.A.
N.A.
Max Bar or Wire Dia.
Wire - 0.5"
#8
#8
U-channel Left Wall Height
N.A.
N.A.
10’
U-channel Right Wall Height
N.A.
N.A.
15’
Min Equivalent Fluid Pressure
45lb/ft3
45lb/ft3
45lb/ft3
Max Equivalent Fluid Pressure
70lb/ft3
70lb/ft3
70lb/ft3
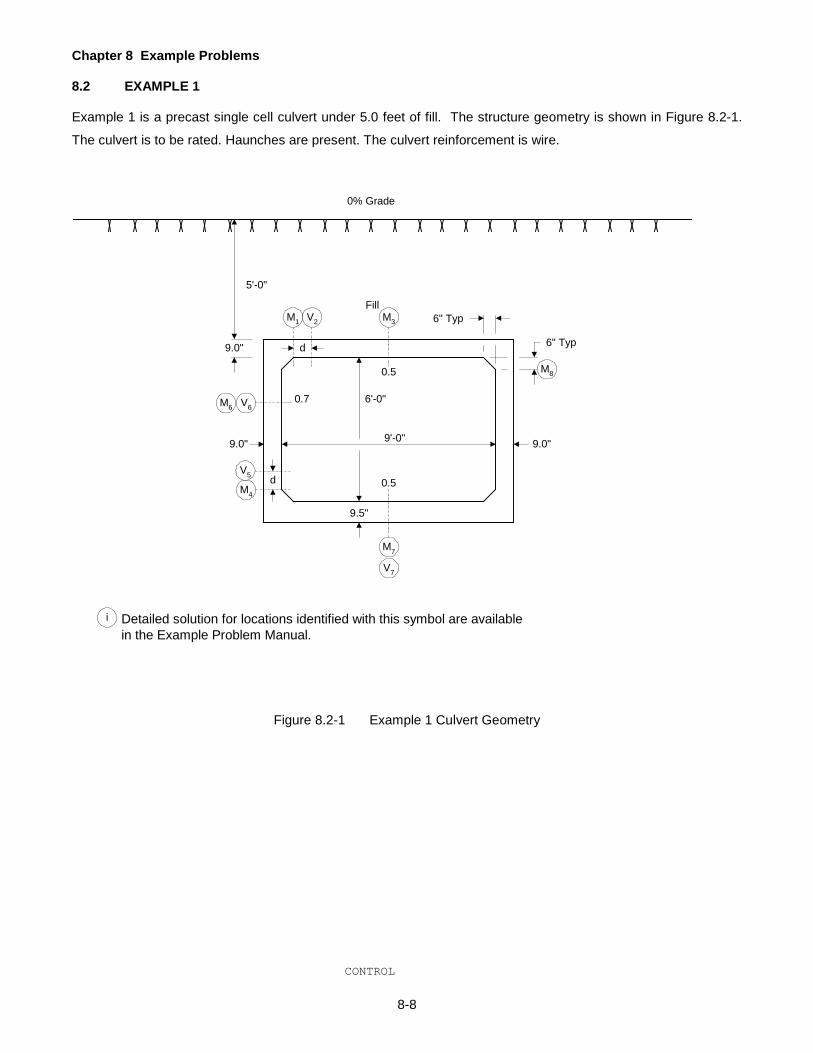
Chapter 8 Example Problems
8-8
8.2 EXAMPLE 1
Example 1 is a precast single cell culvert under 5.0 feet of fill. The structure geometry is shown in Figure 8.2-1.
The culvert is to be rated. Haunches are present. The culvert reinforcement is wire.
6" Typ
6'-0"
9'-0"
5'-0"
Fill
0% Grade
6" Typ
9.0"
9.5"
9.0"
9.0"
V7
d
d
0.5
0.5
M7
V5
V6
V2
M8
M4
M6
M1 M3
i Detailed solution for locations identified with this symbol are availablein the Example Problem Manual.
0.7
Figure 8.2-1 Example 1 Culvert Geometry
CONTROL

Chapter 8 Example Problems
8-9
Sys of Structure Type Bottom Top Slab Frame Units Type of Run P or C Slab Support Support US 1-CELL BOX AR P Y M N/A STRUCTURE IDENTIFICATION Program State Span ID County Route Segment Offset ID =BXLRFD 50 666 555 9996 654 MATERIAL f'c All f'c Reinf Reinf Wire Epoxy Members Top Slab Grade Type Alpha Diam Coated (ksi) (ksi) (ksi) (deg) (in) 5.00 5.00 60.0 W 45.0 0.60 N/A Concrete Density For DL For Ec fu (lb/ft^3) (lb/ft^3) (ksi) 150.0 145.0 90.00 DIMENSIONS Clear Clear Slab Thickness Wall Thickness Fill Top Slab Span Height Top Bottom Left Right Int Grade Grade (ft) (ft) (in) (in) (in) (in) (in) (%) (%) 9.00 6.00 9.0 9.5 9.0 9.0 0.0 0.00 0.00 Left U-channel Right U-channel Wall Height Wall Height (ft) (ft) 0.00 0.00 LOAD CONTROL Future Earth Ht of No of Live Load Live Overlay Overlay Wearing Wt/Den Fill Lanes Surcharge Load Wt/Den Thick Surface (pcf) (ft) (ft) (pcf) (in) (psf) 120.0 5.00 1 3.00 A 0.0 0.0 0.0 Live Load Multiple PA Fatigue Distrib Segment Presence Traffic Dynamic Load Duct Redund Length Length Reduction Factor Allowance Factor Factor (ft) (ft) 25.00 12.00 1.00 N/A N/A 1.00 1.00 Permit Max Live Min Equiv Max Equiv Barrier Import Dynamic Load Load Fluid Fluid Dead Factor Allowance Override Pressure Pressure Load (pcf) (pcf) (kips/ft) 1.00 1.20 0 45.00 70.00 0.00 Left Approach Slab Right Approach Slab Ratings w/o No. of Dead Live Dead Live Future Backfill Precast Load Load Load Load Wearing Type Shr Trns (kips) (kips) (kips) (kips) Surface Segments 0.00 0.00 0.00 0.00 N N/A 2 HAUNCH Top Left Top Right Bot Left Bot Right Top Int Bot Int X Y X Y X Y X Y X Y X Y (in) (in) (in) (in) (in) (in) (in) (in) (in) (in) (in) (in) 6.0 6.0 6.0 6.0 6.0 6.0 6.0 6.0 0.0 0.0 0.0 0.0 COVERS
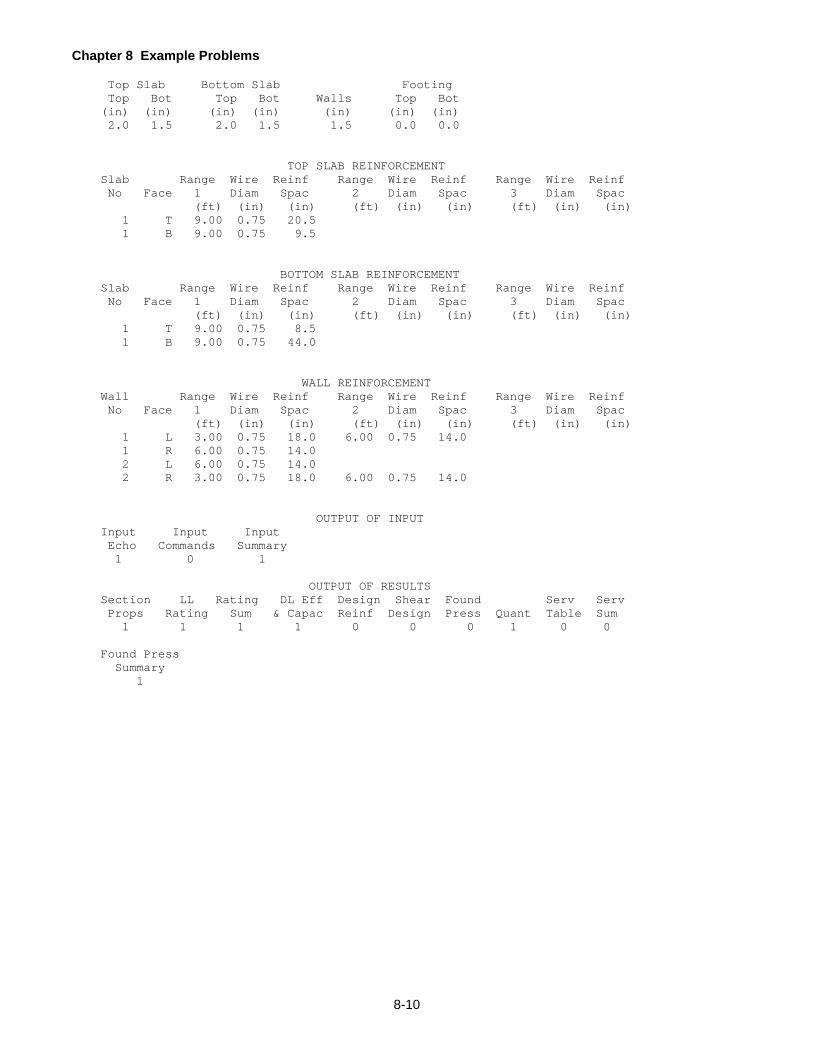
Chapter 8 Example Problems
8-10
Top Slab Bottom Slab Footing Top Bot Top Bot Walls Top Bot (in) (in) (in) (in) (in) (in) (in) 2.0 1.5 2.0 1.5 1.5 0.0 0.0 TOP SLAB REINFORCEMENT Slab Range Wire Reinf Range Wire Reinf Range Wire Reinf No Face 1 Diam Spac 2 Diam Spac 3 Diam Spac (ft) (in) (in) (ft) (in) (in) (ft) (in) (in) 1 T 9.00 0.75 20.5 1 B 9.00 0.75 9.5 BOTTOM SLAB REINFORCEMENT Slab Range Wire Reinf Range Wire Reinf Range Wire Reinf No Face 1 Diam Spac 2 Diam Spac 3 Diam Spac (ft) (in) (in) (ft) (in) (in) (ft) (in) (in) 1 T 9.00 0.75 8.5 1 B 9.00 0.75 44.0 WALL REINFORCEMENT Wall Range Wire Reinf Range Wire Reinf Range Wire Reinf No Face 1 Diam Spac 2 Diam Spac 3 Diam Spac (ft) (in) (in) (ft) (in) (in) (ft) (in) (in) 1 L 3.00 0.75 18.0 6.00 0.75 14.0 1 R 6.00 0.75 14.0 2 L 6.00 0.75 14.0 2 R 3.00 0.75 18.0 6.00 0.75 14.0 OUTPUT OF INPUT Input Input Input Echo Commands Summary 1 0 1 OUTPUT OF RESULTS Section LL Rating DL Eff Design Shear Found Serv Serv Props Rating Sum & Capac Reinf Design Press Quant Table Sum 1 1 1 1 0 0 0 1 0 0 Found Press Summary 1

Chapter 8 Example Problems
8-11
8.3 EXAMPLE 2
Example 2 is a cast-in-place two cell culvert under a 1.0 foot fill height. The structure geometry is shown in Figure
8.3-1. The culvert bar reinforcement is to be designed with known member thickness. The culvert has a standard
fish channel.
12'-10"
18'-6"
1'-0"
Fill
0% Grade
24"
20" 16" 20"
21"
Standard FishChannel
d
d
d2
V1
0.50.4
0.5
M2M3 M4
M7
M10
M5
V9
V8
M60.1 0.1
i Detailed solution for locations identified with this symbol are availablein the Example Problem Manual.
Figure 8.3-1 Example 2 Culvert Geometry

Chapter 8 Example Problems
8-12
CONTROL Sys of Structure Type Bottom Top Slab Frame Units Type of Run P or C Slab Support Support US 2-CELL BOX DR C Y M N/A STRUCTURE IDENTIFICATION Program State Span ID County Route Segment Offset ID =BXLRFD 50 666 555 9996 654 MATERIAL f'c All f'c Reinf Reinf Rebar Epoxy Members Top Slab Grade Type Alpha Size Coated (ksi) (ksi) (ksi) (deg) 3.00 3.00 60.0 B 45.0 11 Y Concrete Density For DL For Ec fu (lb/ft^3) (lb/ft^3) (ksi) 150.0 145.0 90.00 DIMENSIONS Clear Clear Slab Thickness Wall Thickness Fill Top Slab Span Height Top Bottom Left Right Int Grade Grade (ft) (ft) (in) (in) (in) (in) (in) (%) (%) 18.50 12.83 21.0 24.0 20.0 20.0 16.0 0.00 0.00 Left U-channel Right U-channel Wall Height Wall Height (ft) (ft) 0.00 0.00 LOAD CONTROL Future Earth Ht of No of Live Load Live Overlay Overlay Wearing Wt/Den Fill Lanes Surcharge Load Wt/Den Thick Surface (pcf) (ft) (ft) (pcf) (in) (psf) 120.0 1.00 1 3.00 E 0.0 0.0 0.0 Live Load Multiple PA Fatigue Distrib Segment Presence Traffic Dynamic Load Duct Redund Length Length Reduction Factor Allowance Factor Factor (ft) (ft) 48.00 90.00 1.00 N/A N/A 1.00 1.00 Permit Max Live Min Equiv Max Equiv Barrier Import Dynamic Load Load Fluid Fluid Dead Factor Allowance Override Pressure Pressure Load (pcf) (pcf) (kips/ft) 1.00 1.20 0 45.00 70.00 0.00 Left Approach Slab Right Approach Slab Ratings w/o No. of Dead Live Dead Live Future Backfill Precast Load Load Load Load Wearing Type Shr Trns (kips) (kips) (kips) (kips) Surface Segments 0.00 0.00 0.00 0.00 N/A N/A N/A FISH CHANNEL Segment Thick Segment Thick Segment Thick Type Length Change Length Change Length Change (in) (in) (in) (in) (in) (in) S 102.00 0.00 110.00 -10.00 10.00 10.00

Chapter 8 Example Problems
8-13
COVERS Top Slab Bottom Slab Footing Top Bot Top Bot Walls Top Bot (in) (in) (in) (in) (in) (in) (in) 2.0 2.0 2.5 3.0 2.0 2.0 3.0 OUTPUT OF INPUT Input Input Input Echo Commands Summary 1 0 1 OUTPUT OF RESULTS Section LL Rating DL Eff Design Shear Found Serv Serv Props Rating Sum & Capac Reinf Design Press Quant Table Sum 1 0 0 0 1 1 0 1 0 1 Found Press Summary 1

Chapter 8 Example Problems
8-14
8.4 EXAMPLE 3
Example 3 is a cast-in-place single cell culvert under 5.33 feet of fill. The structure geometry is shown in Figure
8.4-1. The culvert bar reinforcement is to be designed with known member thickness. The culvert has a non-
standard fish channel.
6'-10"
5'-0"
5'-4" Fill
-6.98% Grade
5'-0"12" 12"
10" (-) 10" (+)
12"
12"
M1
0.9
0.5
d2
d
d
V1 M2
V3
V7
M4
M6
M8
V3
i Detailed solution for locations identified with this symbol are availablein the Example Problem Manual.
Figure 8.4-1 Example 3 Culvert Geometry

Chapter 8 Example Problems
8-15
CONTROL Sys of Structure Type Bottom Top Slab Frame Units Type of Run P or C Slab Support Support US 1-CELL BOX DR C Y M N/A STRUCTURE IDENTIFICATION Program State Span ID County Route Segment Offset ID =BXLRFD 50 666 555 9996 654 MATERIAL f'c All f'c Reinf Reinf Rebar Epoxy Members Top Slab Grade Type Alpha Size Coated (ksi) (ksi) (ksi) (deg) 3.00 3.00 40.0 B 45.0 11 Y Concrete Density For DL For Ec fu (lb/ft^3) (lb/ft^3) (ksi) 150.0 145.0 55.00 DIMENSIONS Clear Clear Slab Thickness Wall Thickness Fill Top Slab Span Height Top Bottom Left Right Int Grade Grade (ft) (ft) (in) (in) (in) (in) (in) (%) (%) 10.00 6.83 12.0 12.0 12.0 12.0 0.0 -6.98 0.00 Left U-channel Right U-channel Wall Height Wall Height (ft) (ft) 0.00 0.00 LOAD CONTROL Future Earth Ht of No of Live Load Live Overlay Overlay Wearing Wt/Den Fill Lanes Surcharge Load Wt/Den Thick Surface (pcf) (ft) (ft) (pcf) (in) (psf) 120.0 5.33 2 2.00 E 150.0 0.0 0.0 Live Load Multiple PA Fatigue Distrib Segment Presence Traffic Dynamic Load Duct Redund Length Length Reduction Factor Allowance Factor Factor (ft) (ft) 38.00 90.00 1.00 N/A N/A 1.00 1.00 Permit Max Live Min Equiv Max Equiv Barrier Import Dynamic Load Load Fluid Fluid Dead Factor Allowance Override Pressure Pressure Load (pcf) (pcf) (kips/ft) 1.00 1.20 0 45.00 70.00 0.00 Left Approach Slab Right Approach Slab Ratings w/o No. of Dead Live Dead Live Future Backfill Precast Load Load Load Load Wearing Type Shr Trns (kips) (kips) (kips) (kips) Surface Segments 0.00 0.00 0.00 0.00 N/A N/A N/A FISH CHANNEL Segment Thick Segment Thick Segment Thick Type Length Change Length Change Length Change (in) (in) (in) (in) (in) (in) N 60.00 -10.00 60.00 10.00 COVERS

Chapter 8 Example Problems
8-16
Top Slab Bottom Slab Footing Top Bot Top Bot Walls Top Bot (in) (in) (in) (in) (in) (in) (in) 2.2 2.2 2.5 3.2 2.2 2.0 3.0 OUTPUT OF INPUT Input Input Input Echo Commands Summary 1 0 1 OUTPUT OF RESULTS Section LL Rating DL Eff Design Shear Found Serv Serv Props Rating Sum & Capac Reinf Design Press Quant Table Sum 1 0 0 0 1 1 0 1 0 1 Found Press Summary 1

Chapter 8 Example Problems
8-17
8.5 EXAMPLE 4
Example 4 is a cast-in-place single cell rigid frame culvert located at grade. The structure geometry is shown in
Figure 8.5-1. The culvert bar reinforcement and member thicknesses, with shear reinforcement, are to be designed.
The culvert does not have a bottom slab.
8'-0"
12'-7"
+1% Grade Roadway10.0"
12"
36" Typ
108" Typ
Note: Slab and wall thicknesses are initial design thicknesses.
12"
V2
d
0.5
0.5d2
d
d2
V3M1
M9
M7
M6
M4
V5
V8
36"
i Detailed solution for locations identified with this symbol are available in the Example Problem Manual.
Figure 8.5-1 Example 4 Culvert Geometry
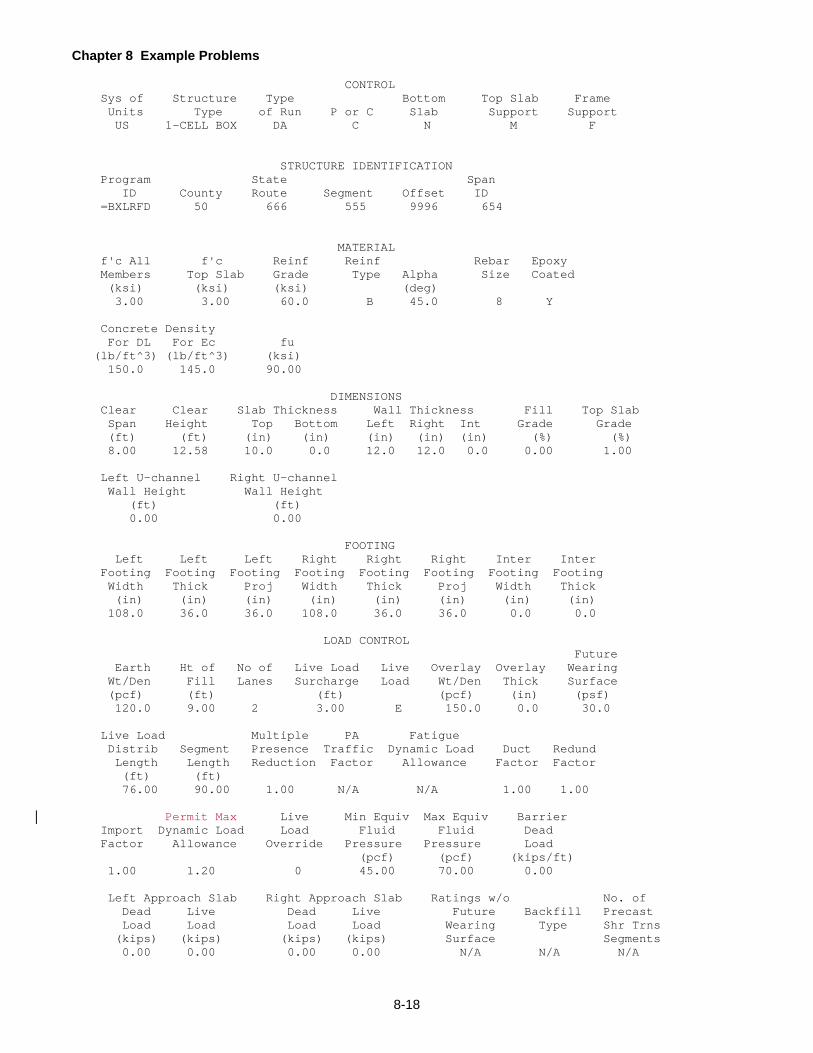
Chapter 8 Example Problems
8-18
CONTROL Sys of Structure Type Bottom Top Slab Frame Units Type of Run P or C Slab Support Support US 1-CELL BOX DA C N M F STRUCTURE IDENTIFICATION Program State Span ID County Route Segment Offset ID =BXLRFD 50 666 555 9996 654 MATERIAL f'c All f'c Reinf Reinf Rebar Epoxy Members Top Slab Grade Type Alpha Size Coated (ksi) (ksi) (ksi) (deg) 3.00 3.00 60.0 B 45.0 8 Y Concrete Density For DL For Ec fu (lb/ft^3) (lb/ft^3) (ksi) 150.0 145.0 90.00 DIMENSIONS Clear Clear Slab Thickness Wall Thickness Fill Top Slab Span Height Top Bottom Left Right Int Grade Grade (ft) (ft) (in) (in) (in) (in) (in) (%) (%) 8.00 12.58 10.0 0.0 12.0 12.0 0.0 0.00 1.00 Left U-channel Right U-channel Wall Height Wall Height (ft) (ft) 0.00 0.00 FOOTING Left Left Left Right Right Right Inter Inter Footing Footing Footing Footing Footing Footing Footing Footing Width Thick Proj Width Thick Proj Width Thick (in) (in) (in) (in) (in) (in) (in) (in) 108.0 36.0 36.0 108.0 36.0 36.0 0.0 0.0 LOAD CONTROL Future Earth Ht of No of Live Load Live Overlay Overlay Wearing Wt/Den Fill Lanes Surcharge Load Wt/Den Thick Surface (pcf) (ft) (ft) (pcf) (in) (psf) 120.0 9.00 2 3.00 E 150.0 0.0 30.0 Live Load Multiple PA Fatigue Distrib Segment Presence Traffic Dynamic Load Duct Redund Length Length Reduction Factor Allowance Factor Factor (ft) (ft) 76.00 90.00 1.00 N/A N/A 1.00 1.00 Permit Max Live Min Equiv Max Equiv Barrier Import Dynamic Load Load Fluid Fluid Dead Factor Allowance Override Pressure Pressure Load (pcf) (pcf) (kips/ft) 1.00 1.20 0 45.00 70.00 0.00 Left Approach Slab Right Approach Slab Ratings w/o No. of Dead Live Dead Live Future Backfill Precast Load Load Load Load Wearing Type Shr Trns (kips) (kips) (kips) (kips) Surface Segments 0.00 0.00 0.00 0.00 N/A N/A N/A

Chapter 8 Example Problems
8-19
COVERS Top Slab Bottom Slab Footing Top Bot Top Bot Walls Top Bot (in) (in) (in) (in) (in) (in) (in) 2.5 2.0 2.5 3.0 2.0 2.5 3.0 OUTPUT OF INPUT Input Input Input Echo Commands Summary 1 0 1 Section LL Rating DL Eff Design Shear Found Serv Serv Props Rating Sum & Capac Reinf Design Press Quant Table Sum 1 0 0 0 1 1 0 1 0 1 Found Press Summary 1 OUTPUT OF RESULTS Section LL Rating DL Eff Design Shear Found Serv Serv Props Rating Sum & Capac Reinf Design Press Quant Table Sum 1 0 0 0 1 1 0 1 0 1 Found Press Summary 1

Chapter 8 Example Problems
8-20
8.6 EXAMPLE 5
Example 5 is a cast-in-place two cell culvert located at grade. The structure geometry is shown in Figure 8.6-1.
The culvert is to be rated. Haunches are not present, and the top slab thickness varies and is pinned to the top of
the walls.
12"
25.7"
20'-6"12.0'
12" 12"
15"
-2.91% Grade3" Overlay
RoadwayM1
0.3
0.50.1
d2
d2
d
d
V2
M9 M10
M8
M5
M6
V7
V10
V8
V4
V3
V9
Pin
Pin
i Detailed solution for locations identified with this symbol are availablein the Example Problem Manual.
Figure 8.6-1 Example 5 Culvert Geometry
CONTROL Sys of Structure Type Bottom Top Slab Frame

Chapter 8 Example Problems
8-21
Units Type of Run P or C Slab Support Support US 2-CELL BOX AR C Y S N/A STRUCTURE IDENTIFICATION Program State Span ID County Route Segment Offset ID =BXLRFD 50 666 555 9996 654 MATERIAL f'c All f'c Reinf Reinf Rebar Epoxy Members Top Slab Grade Type Alpha Size Coated (ksi) (ksi) (ksi) (deg) 3.00 4.50 60.0 B 45.0 9 Y Concrete Density For DL For Ec fu (lb/ft^3) (lb/ft^3) (ksi) 150.0 145.0 90.00 DIMENSIONS Clear Clear Slab Thickness Wall Thickness Fill Top Slab Span Height Top Bottom Left Right Int Grade Grade (ft) (ft) (in) (in) (in) (in) (in) (%) (%) 20.50 12.00 25.7 15.0 12.0 12.0 12.0 0.00 -2.91 Left U-channel Right U-channel Wall Height Wall Height (ft) (ft) 0.00 0.00 LOAD CONTROL Future Earth Ht of No of Live Load Live Overlay Overlay Wearing Wt/Den Fill Lanes Surcharge Load Wt/Den Thick Surface (pcf) (ft) (ft) (pcf) (in) (psf) 120.0 0.00 2 3.00 B 150.0 3.0 0.0 Live Load Multiple PA Fatigue Distrib Segment Presence Traffic Dynamic Load Duct Redund Length Length Reduction Factor Allowance Factor Factor (ft) (ft) 50.00 90.00 1.00 N/A N/A 1.00 1.00 Permit Max Live Min Equiv Max Equiv Barrier Import Dynamic Load Load Fluid Fluid Dead Factor Allowance Override Pressure Pressure Load (pcf) (pcf) (kips/ft) 1.00 1.20 0 45.00 70.00 0.00 Left Approach Slab Right Approach Slab Ratings w/o No. of Dead Live Dead Live Future Backfill Precast Load Load Load Load Wearing Type Shr Trns (kips) (kips) (kips) (kips) Surface Segments 0.00 0.00 0.00 0.00 N N/A N/A COVERS Top Slab Bottom Slab Footing Top Bot Top Bot Walls Top Bot (in) (in) (in) (in) (in) (in) (in) 2.5 2.0 2.5 3.0 2.0 2.0 3.0 TOP SLAB REINFORCEMENT Slab Range Bar Reinf Range Bar Reinf Range Bar Reinf
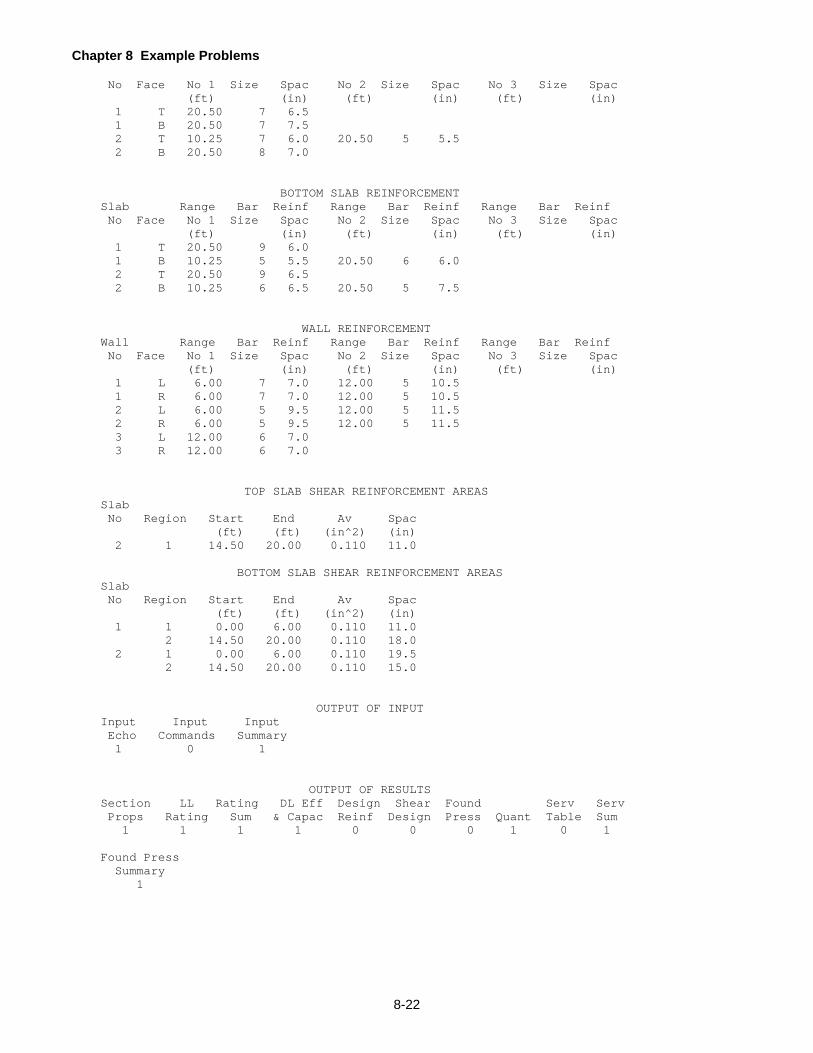
Chapter 8 Example Problems
8-22
No Face No 1 Size Spac No 2 Size Spac No 3 Size Spac (ft) (in) (ft) (in) (ft) (in) 1 T 20.50 7 6.5 1 B 20.50 7 7.5 2 T 10.25 7 6.0 20.50 5 5.5 2 B 20.50 8 7.0 BOTTOM SLAB REINFORCEMENT Slab Range Bar Reinf Range Bar Reinf Range Bar Reinf No Face No 1 Size Spac No 2 Size Spac No 3 Size Spac (ft) (in) (ft) (in) (ft) (in) 1 T 20.50 9 6.0 1 B 10.25 5 5.5 20.50 6 6.0 2 T 20.50 9 6.5 2 B 10.25 6 6.5 20.50 5 7.5 WALL REINFORCEMENT Wall Range Bar Reinf Range Bar Reinf Range Bar Reinf No Face No 1 Size Spac No 2 Size Spac No 3 Size Spac (ft) (in) (ft) (in) (ft) (in) 1 L 6.00 7 7.0 12.00 5 10.5 1 R 6.00 7 7.0 12.00 5 10.5 2 L 6.00 5 9.5 12.00 5 11.5 2 R 6.00 5 9.5 12.00 5 11.5 3 L 12.00 6 7.0 3 R 12.00 6 7.0 TOP SLAB SHEAR REINFORCEMENT AREAS Slab No Region Start End Av Spac (ft) (ft) (in^2) (in) 2 1 14.50 20.00 0.110 11.0 BOTTOM SLAB SHEAR REINFORCEMENT AREAS Slab No Region Start End Av Spac (ft) (ft) (in^2) (in) 1 1 0.00 6.00 0.110 11.0 2 14.50 20.00 0.110 18.0 2 1 0.00 6.00 0.110 19.5 2 14.50 20.00 0.110 15.0 OUTPUT OF INPUT Input Input Input Echo Commands Summary 1 0 1 OUTPUT OF RESULTS Section LL Rating DL Eff Design Shear Found Serv Serv Props Rating Sum & Capac Reinf Design Press Quant Table Sum 1 1 1 1 0 0 0 1 0 1 Found Press Summary 1

Chapter 8 Example Problems
8-23
8.7 EXAMPLE 6
In previous versions of BXLRFD, Example 6 was the metric version of Example 1. Since SI units are no longer
available, Example 6 was eliminated.

Chapter 8 Example Problems
8-24
8.8 EXAMPLE 7
Example 7 is a cast-in-place single cell culvert under 4.25 ft of fill. The structure geometry is shown in Figure 8.8-
1. The culvert bar reinforcement and member thicknesses, without shear reinforcement, are to be designed. The
culvert has a non-standard fish channel and the top slab is pinned to the top of the walls.
6.5'
13'
4.25' Fill
0% Grade
10"
10"
12"12"
Non-Standard Fish Channel
Note: Slab and Wall Thicknesses are Initial Design Thicknesses
M1
d
0.8
d2
10'
d
d
0.60.5
10"
M2
M3
V4
V7 V8
M9
V5
V6pin pin
i Detailed solution for locations identified with this symbol are available in the Example Problem Manual.
Figure 8.8-1 Example 7 Culvert Geometry

Chapter 8 Example Problems
8-25
CONTROL Sys of Structure Type Bottom Top Slab Frame Units Type of Run P or C Slab Support Support US 1-CELL BOX DC C Y S N/A STRUCTURE IDENTIFICATION Program State Span ID County Route Segment Offset ID =BXLRFD 50 666 555 9996 654 MATERIAL f'c All f'c Reinf Reinf Rebar Epoxy Members Top Slab Grade Type Alpha Size Coated (ksi) (ksi) (ksi) (deg) 3.00 3.00 60.0 B 45.0 9 Y Concrete Density For DL For Ec fu (lb/ft^3) (lb/ft^3) (ksi) 150.0 145.0 90.00 DIMENSIONS Clear Clear Slab Thickness Wall Thickness Fill Top Slab Span Height Top Bottom Left Right Int Grade Grade (ft) (ft) (in) (in) (in) (in) (in) (%) (%) 13.00 6.50 10.0 10.0 12.0 12.0 0.0 0.00 0.00 Left U-channel Right U-channel Wall Height Wall Height (ft) (ft) 0.00 0.00 LOAD CONTROL Future Earth Ht of No of Live Load Live Overlay Overlay Wearing Wt/Den Fill Lanes Surcharge Load Wt/Den Thick Surface (pcf) (ft) (ft) (pcf) (in) (psf) 140.0 4.25 3 2.00 E 150.0 0.0 0.0 Live Load Multiple PA Fatigue Distrib Segment Presence Traffic Dynamic Load Duct Redund Length Length Reduction Factor Allowance Factor Factor (ft) (ft) 54.00 90.00 1.00 N/A N/A 0.95 1.00 Permit Max Live Min Equiv Max Equiv Barrier Import Dynamic Load Load Fluid Fluid Dead Factor Allowance Override Pressure Pressure Load (pcf) (pcf) (kips/ft) 1.00 1.20 0 45.00 70.00 0.00 Left Approach Slab Right Approach Slab Ratings w/o No. of Dead Live Dead Live Future Backfill Precast Load Load Load Load Wearing Type Shr Trns (kips) (kips) (kips) (kips) Surface Segments 0.00 0.00 0.00 0.00 N/A N/A N/A FISH CHANNEL Segment Thick Segment Thick Segment Thick Type Length Change Length Change Length Change (in) (in) (in) (in) (in) (in) N 39.00 0.00 108.00 -10.00 9.00 10.00

Chapter 8 Example Problems
8-26
COVERS Top Slab Bottom Slab Footing Top Bot Top Bot Walls Top Bot (in) (in) (in) (in) (in) (in) (in) 2.0 2.0 2.5 3.0 2.0 2.0 3.0 OUTPUT OF INPUT Input Input Input Echo Commands Summary 1 0 1 OUTPUT OF RESULTS Section LL Rating DL Eff Design Shear Found Serv Serv Props Rating Sum & Capac Reinf Design Press Quant Table Sum 1 0 0 0 1 1 0 1 0 1 Found Press Summary 1

Chapter 8 Example Problems
8-27
8.9 EXAMPLE 8
Example 8 is a cast-in-place single cell rigid frame culvert under 7.25 ft of fill. The structure geometry is shown in
Figure 8.9-1. The culvert is to be rated. The culvert does not have a bottom slab.
29.5'13'
1% Grade
22.5"
22" 22"
7.25' Fill
+2.2% Grade
100"
30"
V1
d
0.1
0.4
0.5
d
d
0.5
V2 M3 M5
M6
M8
M7
V4
V9
V8
M10 V10
36"
i Detailed solution for locations identified with this symbol are available in the Example Problem Manual.
Figure 8.9-1 Example 8 Culvert Geometry

Chapter 8 Example Problems
8-28
CONTROL Sys of Structure Type Bottom Top Slab Frame Units Type of Run P or C Slab Support Support US 1-CELL BOX AR C N M F STRUCTURE IDENTIFICATION Program State Span ID County Route Segment Offset ID =BXLRFD 50 666 555 9996 654 MATERIAL f'c All f'c Reinf Reinf Rebar Epoxy Members Top Slab Grade Type Alpha Size Coated (ksi) (ksi) (ksi) (deg) 3.00 3.00 60.0 B 45.0 11 Y Concrete Density For DL For Ec fu (lb/ft^3) (lb/ft^3) (ksi) 150.0 145.0 90.00 DIMENSIONS Clear Clear Slab Thickness Wall Thickness Fill Top Slab Span Height Top Bottom Left Right Int Grade Grade (ft) (ft) (in) (in) (in) (in) (in) (%) (%) 29.50 13.00 22.5 0.0 22.0 22.0 0.0 2.20 1.00 Left U-channel Right U-channel Wall Height Wall Height (ft) (ft) 0.00 0.00 FOOTING Left Left Left Right Right Right Inter Inter Footing Footing Footing Footing Footing Footing Footing Footing Width Thick Proj Width Thick Proj Width Thick (in) (in) (in) (in) (in) (in) (in) (in) 100.0 30.0 36.0 100.0 30.0 36.0 0.0 0.0 LOAD CONTROL Future Earth Ht of No of Live Load Live Overlay Overlay Wearing Wt/Den Fill Lanes Surcharge Load Wt/Den Thick Surface (pcf) (ft) (ft) (pcf) (in) (psf) 140.0 7.25 2 1.33 C 150.0 0.0 0.0 Live Load Multiple PA Fatigue Distrib Segment Presence Traffic Dynamic Load Duct Redund Length Length Reduction Factor Allowance Factor Factor (ft) (ft) 66.00 90.00 1.00 N/A N/A 1.00 0.98 Permit Max Live Min Equiv Max Equiv Barrier Import Dynamic Load Load Fluid Fluid Dead Factor Allowance Override Pressure Pressure Load (pcf) (pcf) (kips/ft) 1.05 1.20 0 45.00 70.00 0.00 Left Approach Slab Right Approach Slab Ratings w/o No. of Dead Live Dead Live Future Backfill Precast Load Load Load Load Wearing Type Shr Trns (kips) (kips) (kips) (kips) Surface Segments 0.00 0.00 0.00 0.00 N N/A N/A

Chapter 8 Example Problems
8-29
COVERS Top Slab Bottom Slab Footing Top Bot Top Bot Walls Top Bot (in) (in) (in) (in) (in) (in) (in) 2.5 2.0 2.5 3.0 2.0 2.0 3.0 TOP SLAB REINFORCEMENT Slab Range Bar Reinf Range Bar Reinf Range Bar Reinf No Face No 1 Size Spac No 2 Size Spac No 3 Size Spac (ft) (in) (ft) (in) (ft) (in) 1 T 6.00 9 6.0 20.50 6 9.0 29.50 8 8.0 1 B 29.50 11 6.0 WALL REINFORCEMENT Wall Range Bar Reinf Range Bar Reinf Range Bar Reinf No Face No 1 Size Spac No 2 Size Spac No 3 Size Spac (ft) (in) (ft) (in) (ft) (in) 1 L 13.00 8 6.0 1 R 13.00 6 8.0 2 L 13.00 8 9.0 2 R 8.00 6 8.0 13.00 8 5.0 FOOTING REINFORCEMENT Footing Bar Reinf Number Face Size Spac (in) 1 T 9 5.0 B 9 5.0 2 T 9 5.0 B 9 5.0 OUTPUT OF INPUT Input Input Input Echo Commands Summary 1 0 1 OUTPUT OF RESULTS Section LL Rating DL Eff Design Shear Found Serv Serv Props Rating Sum & Capac Reinf Design Press Quant Table Sum 1 1 1 1 0 0 0 1 0 1 Found Press Summary 1

Chapter 8 Example Problems
8-30
8.10 EXAMPLE 9
Example 9 is a cast-in-place two cell culvert at grade. The structure geometry is shown in Figure 8.10-1. The
culvert is to be rated. Haunches are present, and the culvert has a non-standard fish channel.
12"
22"10'
15'12" 12"
12"
6" Typ
6" Typ
5' 5' 5'
d
M1
d2
d
0.5
V2
M5
M7
M4
M6
V8
V9
Roadway-2.0% Grade
V3
12"
i Detailed solution for locations identified with this symbol are available in the Example Problem Manual.
Figure 8.10-1 Example 9 Culvert Geometry

Chapter 8 Example Problems
8-31
CONTROL Sys of Structure Type Bottom Top Slab Frame Units Type of Run P or C Slab Support Support US 2-CELL BOX AR C Y M N/A STRUCTURE IDENTIFICATION Program State Span ID County Route Segment Offset ID =BXLRFD 50 666 555 9996 654 MATERIAL f’c All f’c Reinf Reinf Rebar Epoxy Members Top Slab Grade Type Alpha Size Coated (ksi) (ksi) (ksi) (deg) 3.00 4.00 40.0 B 45.0 9 Y Concrete Density For DL For Ec fu (lb/ft^3) (lb/ft^3) (ksi) 150.0 145.0 55.00 DIMENSIONS Clear Clear Slab Thickness Wall Thickness Fill Top Slab Span Height Top Bottom Left Right Int Grade Grade (ft) (ft) (in) (in) (in) (in) (in) (%) (%) 15.00 10.00 22.0 12.0 12.0 12.0 12.0 0.00 -2.00 Left U-channel Right U-channel Wall Height Wall Height (ft) (ft) 0.00 0.00 LOAD CONTROL Future Earth Ht of No of Live Load Live Overlay Overlay Wearing Wt/Den Fill Lanes Surcharge Load Wt/Den Thick Surface (pcf) (ft) (ft) (pcf) (in) (psf) 140.0 0.00 2 2.00 C 150.0 0.0 30.0 Live Load Multiple PA Fatigue Distrib Segment Presence Traffic Dynamic Load Duct Redund Length Length Reduction Factor Allowance Factor Factor (ft) (ft) 56.00 90.00 1.00 N/A N/A 1.00 1.00 Permit Max Live Min Equiv Max Equiv Barrier Import Dynamic Load Load Fluid Fluid Dead Factor Allowance Override Pressure Pressure Load (pcf) (pcf) (kips/ft) 1.00 1.20 0 45.00 70.00 0.00 Left Approach Slab Right Approach Slab Ratings w/o No. of Dead Live Dead Live Future Backfill Precast Load Load Load Load Wearing Type Shr Trns (kips) (kips) (kips) (kips) Surface Segments 0.00 0.00 0.00 0.00 N N/A N/A HAUNCH Top Left Top Right Bot Left Bot Right Top Int Bot Int X Y X Y X Y X Y X Y X Y (in) (in) (in) (in) (in) (in) (in) (in) (in) (in) (in) (in) 6.0 6.0 6.0 6.0 0.0 0.0 6.0 6.0 6.0 6.0 6.0 6.0

Chapter 8 Example Problems
8-32
FISH CHANNEL Segment Thick Segment Thick Segment Thick Type Length Change Length Change Length Change (in) (in) (in) (in) (in) (in) N 60.00 0.00 60.00 -12.00 60.00 12.00 COVERS Top Slab Bottom Slab Footing Top Bot Top Bot Walls Top Bot (in) (in) (in) (in) (in) (in) (in) 2.5 2.0 2.5 3.0 2.0 2.0 3.0 TOP SLAB REINFORCEMENT Slab Range Bar Reinf Range Bar Reinf Range Bar Reinf No Face No 1 Size Spac No 2 Size Spac No 3 Size Spac (ft) (in) (ft) (in) (ft) (in) 1 T 15.00 8 6.0 1 B 15.00 6 6.0 2 T 15.00 8 6.0 2 B 15.00 7 6.0 BOTTOM SLAB REINFORCEMENT Slab Range Bar Reinf Range Bar Reinf Range Bar Reinf No Face No 1 Size Spac No 2 Size Spac No 3 Size Spac (ft) (in) (ft) (in) (ft) (in) 1 T 5.00 6 6.0 11.50 9 6.0 15.00 6 6.0 1 B 15.00 8 12.0 2 T 4.00 8 6.0 15.00 9 6.0 2 B 2.50 8 8.0 13.00 4 5.0 15.00 5 5.0 WALL REINFORCEMENT Wall Range Bar Reinf Range Bar Reinf Range Bar Reinf No Face No 1 Size Spac No 2 Size Spac No 3 Size Spac (ft) (in) (ft) (in) (ft) (in) 1 L 10.00 5 6.0 1 R 10.00 5 12.0 2 L 10.00 5 6.0 2 R 10.00 5 6.0 3 L 10.00 5 12.0 3 R 10.00 5 6.0 BOTTOM SLAB SHEAR REINFORCEMENT AREAS Slab No Region Start End Av Spac (ft) (ft) (in^2) (in) 2 1 0.00 15.00 1.550 9.0 OUTPUT OF INPUT Input Input Input Echo Commands Summary 1 0 1 OUTPUT OF RESULTS Section LL Rating DL Eff Design Shear Found Serv Serv Props Rating Sum & Capac Reinf Design Press Quant Table Sum 1 1 1 1 0 0 1 1 1 1 Found Press Summary 1

Chapter 8 Example Problems
8-33
8.11 EXAMPLE 10
Example 10 is a cast-in-place two cell culvert under 2 feet of fill. The structure geometry is shown in Figure 8.11-
1. The culvert is rated for the special live load specified in the following BXLRFD input.
Fill
0% Grade
2'10"
7'
12'
12"
12" 10" 12"
M1
0.5
0.2
d
d
dd
M2
M5
M9
M8
M11
V3
V4
V7
V6
V10P12
i Detailed solution for locations identified with this symbol are available in the Example Problem Manual.
Figure 8.11-1 Example 10 Culvert Geometry

Chapter 8 Example Problems
8-34
CONTROL Sys of Structure Type Bottom Top Slab Frame Units Type of Run P or C Slab Support Support US 2-CELL BOX AR C Y M N/A STRUCTURE IDENTIFICATION Program State Span ID County Route Segment Offset ID =BXLRFD 50 666 555 9996 654 MATERIAL f'c All f'c Reinf Reinf Rebar Epoxy Members Top Slab Grade Type Alpha Size Coated (ksi) (ksi) (ksi) (deg) 3.00 3.00 60.0 B 45.0 9 Y Concrete Density For DL For Ec fu (lb/ft^3) (lb/ft^3) (ksi) 150.0 145.0 90.00 DIMENSIONS Clear Clear Slab Thickness Wall Thickness Fill Top Slab Span Height Top Bottom Left Right Int Grade Grade (ft) (ft) (in) (in) (in) (in) (in) (%) (%) 12.00 7.00 10.0 12.0 12.0 12.0 10.0 0.00 0.00 Left U-channel Right U-channel Wall Height Wall Height (ft) (ft) 0.00 0.00 LOAD CONTROL Future Earth Ht of No of Live Load Live Overlay Overlay Wearing Wt/Den Fill Lanes Surcharge Load Wt/Den Thick Surface (pcf) (ft) (ft) (pcf) (in) (psf) 140.0 2.00 1 3.00 E 140.0 4.0 0.0 Live Load Multiple PA Fatigue Distrib Segment Presence Traffic Dynamic Load Duct Redund Length Length Reduction Factor Allowance Factor Factor (ft) (ft) 59.00 90.00 1.00 N/A N/A 1.00 1.00 Permit Max Live Min Equiv Max Equiv Barrier Import Dynamic Load Load Fluid Fluid Dead Factor Allowance Override Pressure Pressure Load (pcf) (pcf) (kips/ft) 1.00 1.20 0 45.00 70.00 0.00 Left Approach Slab Right Approach Slab Ratings w/o No. of Dead Live Dead Live Future Backfill Precast Load Load Load Load Wearing Type Shr Trns (kips) (kips) (kips) (kips) Surface Segments 0.00 0.00 0.00 0.00 N N/A N/A SPECIAL LIVE LOAD Load Load Load Load Gage Pass Axle Lane Percent Factor Factor Factor Factor Dist Dist Effect Load Increase STR-I STR-II SER-I Fatigue (ft) (ft) (klf) 6.00 4.00 Y 0.00 0.00 1.70 1.35 1.00 N/A

Chapter 8 Example Problems
8-35
SPECIAL AXLE LOADS Axle Axle Axle Axle Axle Axle Axle Axle Load Spac Load Spac Load Spac Load Spac (kips) (ft) (kips) (ft) (kips) (ft) (kips) (ft) 15.70 11.00 27.00 4.00 27.00 4.00 27.00 24.00 27.00 4.00 27.00 4.00 27.00 4.00 27.00 COVERS Top Slab Bottom Slab Footing Top Bot Top Bot Walls Top Bot (in) (in) (in) (in) (in) (in) (in) 2.0 2.0 2.5 3.0 2.0 2.0 3.0 TOP SLAB REINFORCEMENT Slab Range Bar Reinf Range Bar Reinf Range Bar Reinf No Face No 1 Size Spac No 2 Size Spac No 3 Size Spac (ft) (in) (ft) (in) (ft) (in) 1 T 12.00 8 6.0 1 B 12.00 8 6.0 2 T 12.00 8 6.0 2 B 12.00 8 6.0 BOTTOM SLAB REINFORCEMENT Slab Range Bar Reinf Range Bar Reinf Range Bar Reinf No Face No 1 Size Spac No 2 Size Spac No 3 Size Spac (ft) (in) (ft) (in) (ft) (in) 1 T 12.00 9 6.0 1 B 12.00 9 6.0 2 T 12.00 9 6.0 2 B 12.00 9 6.0 WALL REINFORCEMENT Wall Range Bar Reinf Range Bar Reinf Range Bar Reinf No Face No 1 Size Spac No 2 Size Spac No 3 Size Spac (ft) (in) (ft) (in) (ft) (in) 1 L 7.00 6 9.0 1 R 7.00 6 9.0 2 L 7.00 5 10.0 2 R 7.00 5 10.0 3 L 7.00 6 9.0 3 R 7.00 6 9.0 TOP SLAB SHEAR REINFORCEMENT AREAS Slab No Region Start End Av Spac (ft) (ft) (in^2) (in) 1 1 0.00 12.00 0.200 18.0 2 1 0.00 12.00 0.200 18.0 OUTPUT OF INPUT Input Input Input Echo Commands Summary 1 0 1 OUTPUT OF RESULTS Section LL Rating DL Eff Design Shear Found Serv Serv Props Rating Sum & Capac Reinf Design Press Quant Table Sum 1 1 1 1 0 0 0 1 0 1 Found Press Summary 1

Chapter 8 Example Problems
8-36
8.12 EXAMPLE 11
Example 11 is a precast single cell culvert under a fill height of 10.0 feet. The structure geometry is shown in Figure
8.12-1. The culvert wire reinforcement and member thicknesses, with shear reinforcement, are to be designed.
6'-0"
8'-0"
10'-0"Fill
0% Grade
8.0"
8.0"
8.5"
8.0"
M1
0.6
0.9
d
d
d
d
0.6
0.50.4
M2 V3
M8
M6
M11M9
V7
V10
V4
V5
i Detailed solution for locations identified with this symbol are availablein the Example Problem Manual.
Note: Slab and wall thicknesses are initial design thicknesses.
Figure 8.12-1 Example 11 Culvert Geometry

Chapter 8 Example Problems
8-37
CONTROL
Sys of Structure Type Bottom Top Slab Frame
Units Type of Run P or C Slab Support Support
US 1-CELL BOX DA P Y M N/A
STRUCTURE IDENTIFICATION
Program State Span
ID County Route Segment Offset ID
=BXLRFD 50 666 555 9996 654
MATERIAL
f'c All f'c Reinf Reinf Wire Epoxy
Members Top Slab Grade Type Alpha Diam Coated
(ksi) (ksi) (ksi) (deg) (in)
5.00 5.00 60.0 W 45.0 0.50 N/A
Concrete Density
For DL For Ec fu
(lb/ft^3) (lb/ft^3) (ksi)
150.0 145.0 90.00
DIMENSIONS
Clear Clear Slab Thickness Wall Thickness Fill Top Slab
Span Height Top Bottom Left Right Int Grade Grade
(ft) (ft) (in) (in) (in) (in) (in) (%) (%)
8.00 6.00 0.0 0.0 0.0 0.0 0.0 0.00 0.00
Left U-channel Right U-channel
Wall Height Wall Height
(ft) (ft)
0.00 0.00
LOAD CONTROL
Future
Earth Ht of No of Live Load Live Overlay Overlay Wearing
Wt/Den Fill Lanes Surcharge Load Wt/Den Thick Surface
(pcf) (ft) (ft) (pcf) (in) (psf)
145.0 10.00 2 3.00 E 0.0 0.0 0.0
Live Load Multiple PA Fatigue
Distrib Segment Presence Traffic Dynamic Load Duct Redund
Length Length Reduction Factor Allowance Factor Factor
(ft) (ft)
80.00 12.00 1.00 N/A N/A 1.00 1.03
Permit Max Live Min Equiv Max Equiv Barrier
Import Dynamic Load Load Fluid Fluid Dead
Factor Allowance Override Pressure Pressure Load
(pcf) (pcf) (kips/ft)
1.00 1.20 0 45.00 70.00 0.00
Left Approach Slab Right Approach Slab Ratings w/o No. of
Dead Live Dead Live Future Backfill Precast
Load Load Load Load Wearing Type Shr Trns
(kips) (kips) (kips) (kips) Surface Segments
0.00 0.00 0.00 0.00 N/A N/A 2
COVERS
Top Slab Bottom Slab Footing
Top Bot Top Bot Walls Top Bot
(in) (in) (in) (in) (in) (in) (in)
2.0 1.5 2.0 1.5 1.5 0.0 0.0

Chapter 8 Example Problems
8-38
OUTPUT OF INPUT
Input Input Input
Echo Commands Summary
1 0 1
OUTPUT OF RESULTS
Section LL Rating DL Eff Design Shear Found Serv Serv
Props Rating Sum & Capac Reinf Design Press Quant Table Sum
1 0 0 0 1 1 0 1 0 1
Found Press
Summary
1

Chapter 8 Example Problems
8-39
8.13 EXAMPLE 12
Example 12 is a cast-in-place two cell culvert under 4.5 feet of fill. The structure geometry is shown in Figure 8.13-
1. The culvert bar reinforcement and member thicknesses, both with and without shear reinforcement, are to be
designed. Haunches are present, and the culvert has a standard fish channel.
4'-6" Fill
0% Grade
12"
10.5"
8'-0"12'-0"12" 12"
9" TYP
11.5"
9" TYP
Standard FishChannel
d
d
d d
0.5
0.5
0.4
M10 V11
M1 V2 M3
M4
V5
V6
V7
M8
M910"
10"
i Detailed solution for locations identified with this symbol are availablein the Example Problem Manual.
Note: Slab and wall thicknesses are initial design thicknesses.
Figure 8.13-1 Example 12 Culvert Geometry

Chapter 8 Example Problems
8-40
CONTROL Sys of Structure Type Bottom Top Slab Frame Units Type of Run P or C Slab Support Support US 2-CELL BOX DA C Y M N/A STRUCTURE IDENTIFICATION Program State Span ID County Route Segment Offset ID =BXLRFD 50 666 555 9996 654 MATERIAL f'c All f'c Reinf Reinf Rebar Epoxy Members Top Slab Grade Type Alpha Size Coated (ksi) (ksi) (ksi) (deg) 3.00 3.00 60.0 B 45.0 8 Y Concrete Density For DL For Ec fu (lb/ft^3) (lb/ft^3) (ksi) 150.0 145.0 90.00 DIMENSIONS Clear Clear Slab Thickness Wall Thickness Fill Top Slab Span Height Top Bottom Left Right Int Grade Grade (ft) (ft) (in) (in) (in) (in) (in) (%) (%) 12.00 8.00 10.5 11.5 12.0 12.0 12.0 0.00 0.00 Left U-channel Right U-channel Wall Height Wall Height (ft) (ft) 0.00 0.00 LOAD CONTROL Future Earth Ht of No of Live Load Live Overlay Overlay Wearing Wt/Den Fill Lanes Surcharge Load Wt/Den Thick Surface (pcf) (ft) (ft) (pcf) (in) (psf) 140.0 4.50 2 3.00 E 150.0 0.0 0.0 Live Load Multiple PA Fatigue Distrib Segment Presence Traffic Dynamic Load Duct Redund Length Length Reduction Factor Allowance Factor Factor (ft) (ft) 60.00 90.00 1.00 N/A N/A 1.05 1.00 Permit Max Live Min Equiv Max Equiv Barrier Import Dynamic Load Load Fluid Fluid Dead Factor Allowance Override Pressure Pressure Load (pcf) (pcf) (kips/ft) 1.00 1.20 0 45.00 70.00 0.00 Left Approach Slab Right Approach Slab Ratings w/o No. of Dead Live Dead Live Future Backfill Precast Load Load Load Load Wearing Type Shr Trns (kips) (kips) (kips) (kips) Surface Segments 0.00 0.00 0.00 0.00 N/A N/A N/A HAUNCH Top Left Top Right Bot Left Bot Right Top Int Bot Int X Y X Y X Y X Y X Y X Y (in) (in) (in) (in) (in) (in) (in) (in) (in) (in) (in) (in) 9.0 9.0 9.0 9.0 0.0 0.0 9.0 9.0 9.0 9.0 9.0 9.0 FISH CHANNEL

Chapter 8 Example Problems
8-41
Segment Thick Segment Thick Segment Thick Type Length Change Length Change Length Change (in) (in) (in) (in) (in) (in) S 24.00 0.00 110.00 -10.00 10.00 10.00 COVERS Top Slab Bottom Slab Footing Top Bot Top Bot Walls Top Bot (in) (in) (in) (in) (in) (in) (in) 2.0 2.0 2.5 3.0 2.0 2.0 3.0 OUTPUT OF INPUT Input Input Input Echo Commands Summary 1 0 1 OUTPUT OF RESULTS Section LL Rating DL Eff Design Shear Found Serv Serv Props Rating Sum & Capac Reinf Design Press Quant Table Sum 1 0 0 0 1 1 0 1 0 1 Found Press Summary 1

Chapter 8 Example Problems
8-42
8.14 EXAMPLE 13
Example 13 is a cast-in-place U-channel. The structure geometry is shown in Figure 8.14-1. The U-channel
reinforcement and member thicknesses are to be designed.
8'-0"
12.0"
11.5"
12.0"10.0'
15.0'
Figure 8.14-1 Example 13 U-channel Geometry
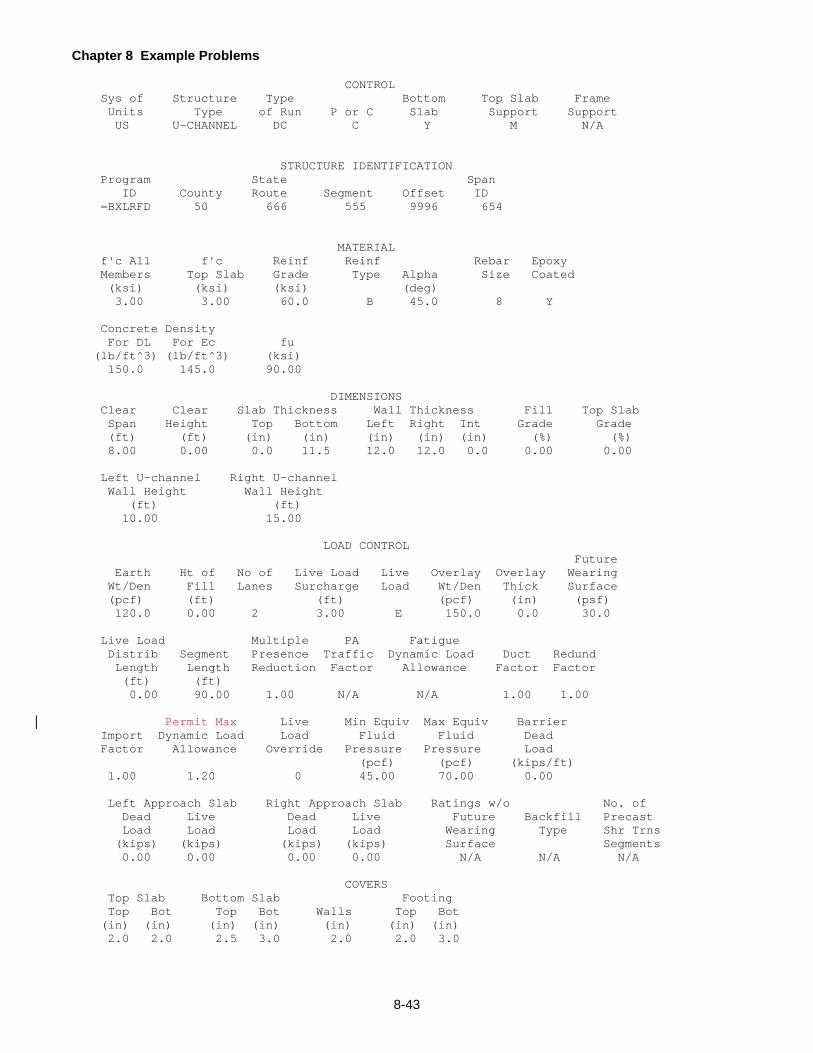
Chapter 8 Example Problems
8-43
CONTROL Sys of Structure Type Bottom Top Slab Frame Units Type of Run P or C Slab Support Support US U-CHANNEL DC C Y M N/A STRUCTURE IDENTIFICATION Program State Span ID County Route Segment Offset ID =BXLRFD 50 666 555 9996 654 MATERIAL f'c All f'c Reinf Reinf Rebar Epoxy Members Top Slab Grade Type Alpha Size Coated (ksi) (ksi) (ksi) (deg) 3.00 3.00 60.0 B 45.0 8 Y Concrete Density For DL For Ec fu (lb/ft^3) (lb/ft^3) (ksi) 150.0 145.0 90.00 DIMENSIONS Clear Clear Slab Thickness Wall Thickness Fill Top Slab Span Height Top Bottom Left Right Int Grade Grade (ft) (ft) (in) (in) (in) (in) (in) (%) (%) 8.00 0.00 0.0 11.5 12.0 12.0 0.0 0.00 0.00 Left U-channel Right U-channel Wall Height Wall Height (ft) (ft) 10.00 15.00 LOAD CONTROL Future Earth Ht of No of Live Load Live Overlay Overlay Wearing Wt/Den Fill Lanes Surcharge Load Wt/Den Thick Surface (pcf) (ft) (ft) (pcf) (in) (psf) 120.0 0.00 2 3.00 E 150.0 0.0 30.0 Live Load Multiple PA Fatigue Distrib Segment Presence Traffic Dynamic Load Duct Redund Length Length Reduction Factor Allowance Factor Factor (ft) (ft) 0.00 90.00 1.00 N/A N/A 1.00 1.00 Permit Max Live Min Equiv Max Equiv Barrier Import Dynamic Load Load Fluid Fluid Dead Factor Allowance Override Pressure Pressure Load (pcf) (pcf) (kips/ft) 1.00 1.20 0 45.00 70.00 0.00 Left Approach Slab Right Approach Slab Ratings w/o No. of Dead Live Dead Live Future Backfill Precast Load Load Load Load Wearing Type Shr Trns (kips) (kips) (kips) (kips) Surface Segments 0.00 0.00 0.00 0.00 N/A N/A N/A COVERS Top Slab Bottom Slab Footing Top Bot Top Bot Walls Top Bot (in) (in) (in) (in) (in) (in) (in) 2.0 2.0 2.5 3.0 2.0 2.0 3.0

Chapter 8 Example Problems
8-44
OUTPUT OF INPUT Input Input Input Echo Commands Summary 1 0 1 OUTPUT OF RESULTS Section LL Rating DL Eff Design Shear Found Serv Serv Props Rating Sum & Capac Reinf Design Press Quant Table Sum 1 0 0 0 1 1 0 1 0 1 Found Press Summary 1

9-45
TECHNICAL QUESTIONS AND REVISION REQUESTS This chapter contains reply forms to make it easier for users to convey their questions,
problems or comments to the proper unit within the Department. General procedures for using these forms are
given. Users should keep the forms in the manual as master copies which can be reproduced as needed. They
are also included as a Word template on the disk that has been provided for the program.
9.1 TECHNICAL QUESTIONS
Technical questions related to the interpretations of the design specifications as implemented in this program, why
certain assumptions are made, applicability and limitations of this program, and other questions not related to the
operation of this program can be directed to the appropriate person in PennDOT using this form or the information
provided on this form. Please review the information provided in this User's Manual and the references given in
Chapter 1 before submitting this form for processing or calling for assistance. The completed form should be sent
to the Bridge Design and Technology Division (see form for complete address).
9.2 REVISION REQUEST
This form is to be used to report suspected program malfunctions that may require revisions to the program. It can
also be used to request revisions that may be required due to changes in specifications and for the enhancement
of the program. Unexpected or incorrect output, rejection of input data, endless program cycling, and program
abortion are examples of program malfunctions. Users are requested to review their input data and the program
User’s Manual before submitting this form for processing.
This form may also be used to submit suggestions for improving the User’s Manual for this program. Suggestions
might include typographical error correction, clarification of confusing sections, expansion of certain sections,
changes in format, and the inclusion of additional information, diagrams, or examples.
The completed form should be sent to the Engineering Software Section via mail, fax, or e-mail.

9-46
This page is intentionally left blank.

9-47
BXLRFD TECHNICAL QUESTIONS
This form is to be used to ask questions on technical issues related to this engineering program. Questions on the interpretations of the design specifications as implemented in this program, why certain assumptions are made by the program and other questions not related to the operation of this program may be submitted using this form or by calling the telephone number listed in this form. Users are requested to read the User’s Manual, LRFD Specifications and DM-4 before submitting this form or calling to ask questions. CONTACT PERSON: _______________________________________ DATE: ____________________ ORGANIZATION: ______________________________________ PHONE: ____________________ E-MAIL ADDRESS: ______________________________________ FAX: ____________________
PROGRAM VERSION: _________
Clearly state your question(s) and attach documentation you feel would be helpful in answering your question(s). If you require more space, use additional 8½ x 11 sheets of plain paper.
FORWARD COMPLETED FORM TO: Pennsylvania Department of Transportation Bureau of Project Delivery Bridge Design and Technology Division P.O. Box 3560 Harrisburg, PA 17105-3560 PHONE: (717) 787-2881 FAX: (717) 787-2882
FOR DEPARTMENT USE ONLY
RECEIVED BY: ________________ ASSIGNED TO: ___________________ DATE: _____________

9-48
This page is intentionally left blank.

9-49
BXLRFD REVISION REQUEST
This form is to be used to report suspected program malfunctions, or to request revisions to the program or its documentation. Users are requested to review their input data and the program User’s Manual before submitting this form. CONTACT PERSON: _______________________________________ DATE: ____________________ ORGANIZATION: ______________________________________ PHONE: ____________________ E-MAIL ADDRESS: ______________________________________ FAX: ____________________
PROGRAM VERSION: _________
Define your problem and attach samples and/or documentation you feel would be helpful in correcting the problem. If the input data is more than 4 or 5 lines, Licensees should provide the input data file on a diskette. If you require more space, use additional 8½ x 11 sheets of plain paper. FORWARD COMPLETED FORM TO: Pennsylvania Office of Administration
Infrastructure and Economic Development Bureau of Business Solutions and Services Highway Applications Division EMAIL: [email protected] PHONE: (717) 783-8822 FAX: (717) 705-5529
FOR DEPARTMENT USE ONLY
RECEIVED BY: ________________ ASSIGNED TO: ___________________ DATE: _____________

9-50
This page is intentionally left blank.


![WisDOT Bridge Manual Chapter 36 – Box Culvertson.dot.wi.gov/dtid_bos/extranet/structures/LRFD/BridgeManual/Ch-36.… · LRFD [5.7.1] 36.2.2 Bridge or Culvert Occasionally, the waterway](https://static.fdocuments.net/doc/165x107/5a78b28c7f8b9a21538c127b/wisdot-bridge-manual-chapter-36-box-lrfd-571-3622-bridge-or-culvert.jpg)