LRF Training, Belgrade 13 th - 16 th November 2013 © ECMWF Sources of predictability and error in...
28
LRF Training, Belgrade 13 th - 16 th November 2013 © ECMWF Sources of predictability and error in ECMWF long range forecasts Tim Stockdale European Centre for Medium-Range Weather Forecasts
-
Upload
norman-hatfield -
Category
Documents
-
view
213 -
download
0
Transcript of LRF Training, Belgrade 13 th - 16 th November 2013 © ECMWF Sources of predictability and error in...

LRF Training, Belgrade 13th - 16th November 2013© ECMWF
Sources of predictability and error in ECMWF long range forecasts
Tim Stockdale
European Centre for Medium-Range Weather Forecasts

LRF Training, Belgrade 13th - 16th November 2013© ECMWF
Outline
Overview of System 4
Some recent research results
LRF Training, Belgrade 13th - 16th November 2013© ECMWF
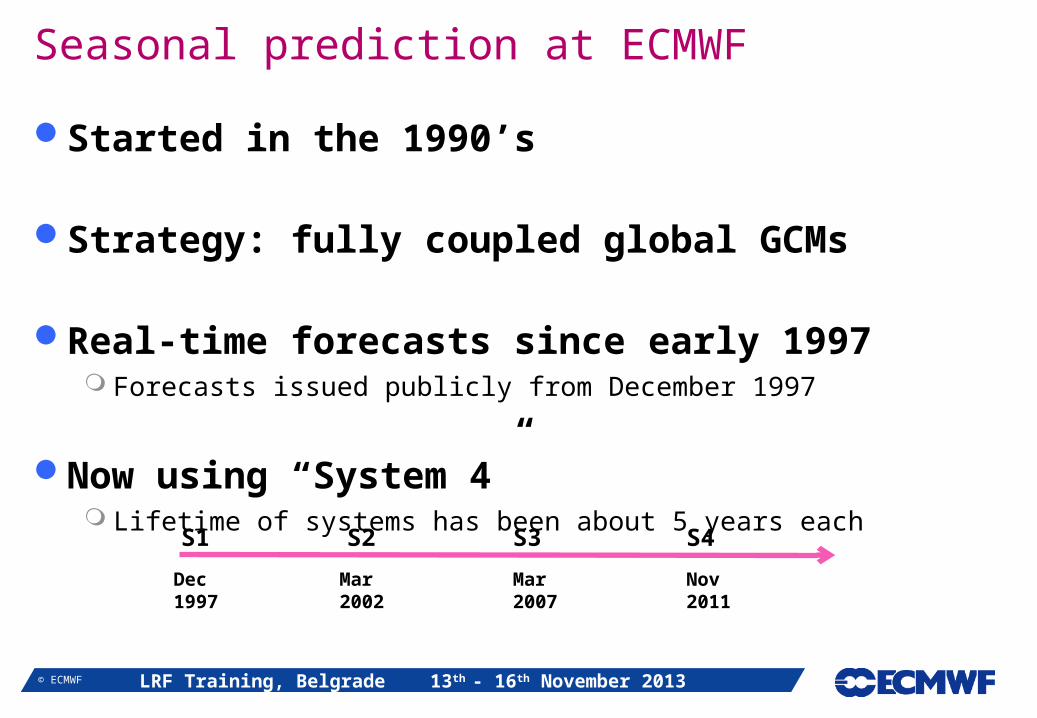
Seasonal prediction at ECMWF
Started in the 1990’s
Strategy: fully coupled global GCMs
Real-time forecasts since early 1997 Forecasts issued publicly from December 1997
Now using “System 4” Lifetime of systems has been about 5 years each
S1 S2 S4S3
Dec 1997
Mar 2002
Nov 2011
Mar 2007

LRF Training, Belgrade 13th - 16th November 2013© ECMWF
System 4 seasonal forecast model
IFS (atmosphere) TL255L91 Cy36r4, 0.7 deg grid for physics (operational in Dec 2010) Full stratosphere, enhanced stratospheric physics Singular vectors from EPS system to perturb atmosphere initial conditions Ocean currents coupled to atmosphere boundary layer calculations
NEMO (ocean) Global ocean model, 1x1 resolution, 0.3 meridional near equator NEMOVAR (3D-Var) analyses, newly developed.
Coupling Fully coupled, no flux adjustments Sea-ice based on sampling previous five years

LRF Training, Belgrade 13th - 16th November 2013© ECMWF
Reduced mean state errors
60°S60°S
30°S 30°S
0°0°
30°N 30°N
60°N60°N
135°W
135°W 90°W
90°W 45°W
45°W 0°
0° 45°E
45°E 90°E
90°E 135°E
135°E
Global rms error: 1 NH:1.43 TR:0.853 SH:0.7250hPa zonal wind S4(15)-ERA Int 1991-2008 DJF
[m/s]
-10
-8
-6
-4
-2
2
4
6
8
10
60°S60°S
30°S 30°S
0°0°
30°N 30°N
60°N60°N
135°W
135°W 90°W
90°W 45°W
45°W 0°
0° 45°E
45°E 90°E
90°E 135°E
135°E
Global rms error: 3.26 NH:5.53 TR:2.02 SH:2.0350hPa zonal wind S3(11)-ERA Int 1991-2008 DJF
[m/s]
-10
-8
-6
-4
-2
2
4
6
8
10
60°S60°S
30°S 30°S
0°0°
30°N 30°N
60°N60°N
135°W
135°W 90°W
90°W 45°W
45°W 0°
0° 45°E
45°E 90°E
90°E 135°E
135°E
mean -1.08 rms diff: 2.7U50 S4(15)-S3(11) 1991-2008 DJF
[m/s]
-5
-4
-3
-2
-1
1
2
3
4
5
60°S60°S
30°S 30°S
0°0°
30°N 30°N
60°N60°N
135°W
135°W 90°W
90°W 45°W
45°W 0°
0° 45°E
45°E 90°E
90°E 135°E
135°E
Global rms error: 0.663 NH:0.669 TR:0.662 SH:0.66850hPa temperature S4(15)-ERA Int 1991-2008 JJA
[K]
-8
-4
-3
-2
-1
1
2
3
4
8
60°S60°S
30°S 30°S
0°0°
30°N 30°N
60°N60°N
135°W
135°W 90°W
90°W 45°W
45°W 0°
0° 45°E
45°E 90°E
90°E 135°E
135°E
Global rms error: 1.07 NH:1.06 TR:0.798 SH:1.48850hPa temperature S3(11)-ERA Int 1991-2008 JJA
[K]
-8
-4
-3
-2
-1
1
2
3
4
8
60°S60°S
30°S 30°S
0°0°
30°N 30°N
60°N60°N
135°W
135°W 90°W
90°W 45°W
45°W 0°
0° 45°E
45°E 90°E
90°E 135°E
135°E
mean 0.275 rms diff: 0.786T850 S4(15)-S3(11) 1991-2008 JJA
[K]
-4
-2
-1.5
-1
-0.5
0.5
1
1.5
2
4
S4
S3
T850 U50

LRF Training, Belgrade 13th - 16th November 2013© ECMWF
Tropospheric scores
TR T850
TR 2mT
NH Z500
NH T850
NH 2mT
0
0.1
0.2
0.3
0.4
0.5
0.6
0.7
ACC S3 and S4 (m2-4; 30y)
S3 S4
AC
C
TR T850
TR 2mT
NH Z500
NH T850
NH 2mT
0
0.1
0.2
0.3
0.4
0.5
0.6
0.7
ACC S3 and S4 (m5-7; 30y)
S3 S4
AC
C
Spatially averaged grid-point temporal ACC
One month lead Four month lead
LRF Training, Belgrade 13th - 16th November 2013© ECMWF
1982 1984 1986 1988 1990 1992 1994 1996 1998 2000 2002 2004-2
-1
0
1
2
Ano
mal
y (d
eg C
)
-2
-1
0
1
2
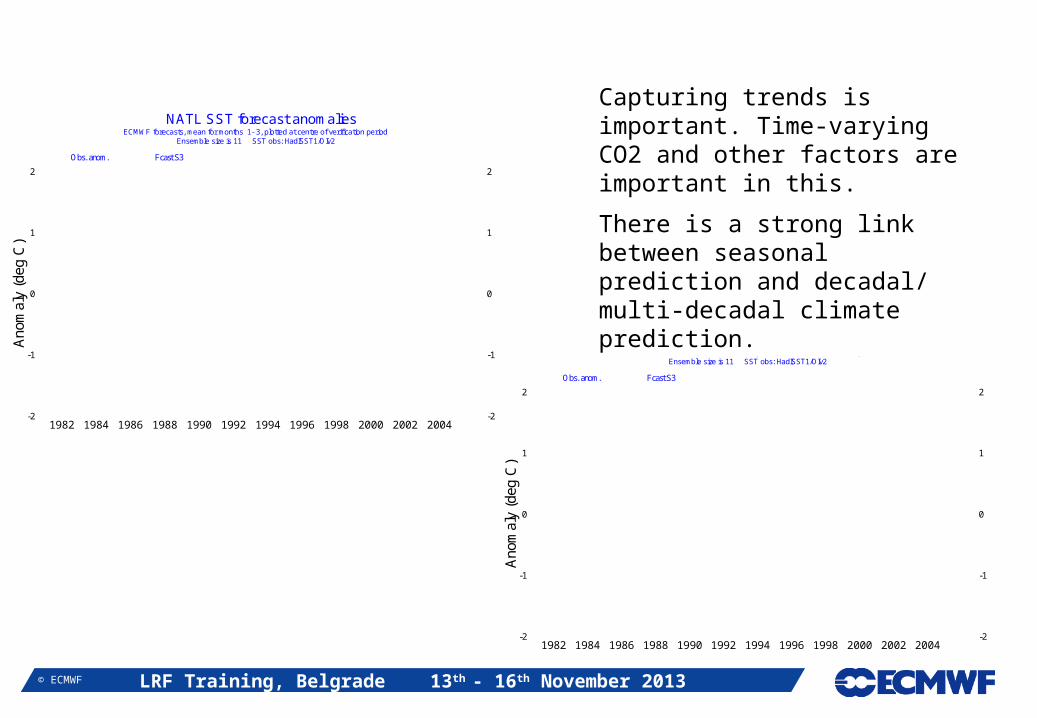
Ensemble size is 11 SST obs: HadISST1/OIv2ECMWF forecasts, mean for months 1- 3, plotted at centre of verification period
NATL SST forecast anomalies
Obs. anom. Fcast S3
MAGICS 6.11 cressida - net Sat Sep 1 00:30:54 2007
1982 1984 1986 1988 1990 1992 1994 1996 1998 2000 2002 2004-2
-1
0
1
2
Ano
mal
y (d
eg C
)
-2
-1
0
1
2
Ensemble size is 11 SST obs: HadISST1/OIv2ECMWF forecasts, mean for months 4- 6, plotted at centre of verification period
NATL SST forecast anomalies
Obs. anom. Fcast S3
MAGICS 6.11 cressida - net Sat Sep 1 00:29:36 2007
Capturing trends is important. Time-varying CO2 and other factors are important in this.
There is a strong link between seasonal prediction and decadal/ multi-decadal climate prediction.
LRF Training, Belgrade 13th - 16th November 2013© ECMWF
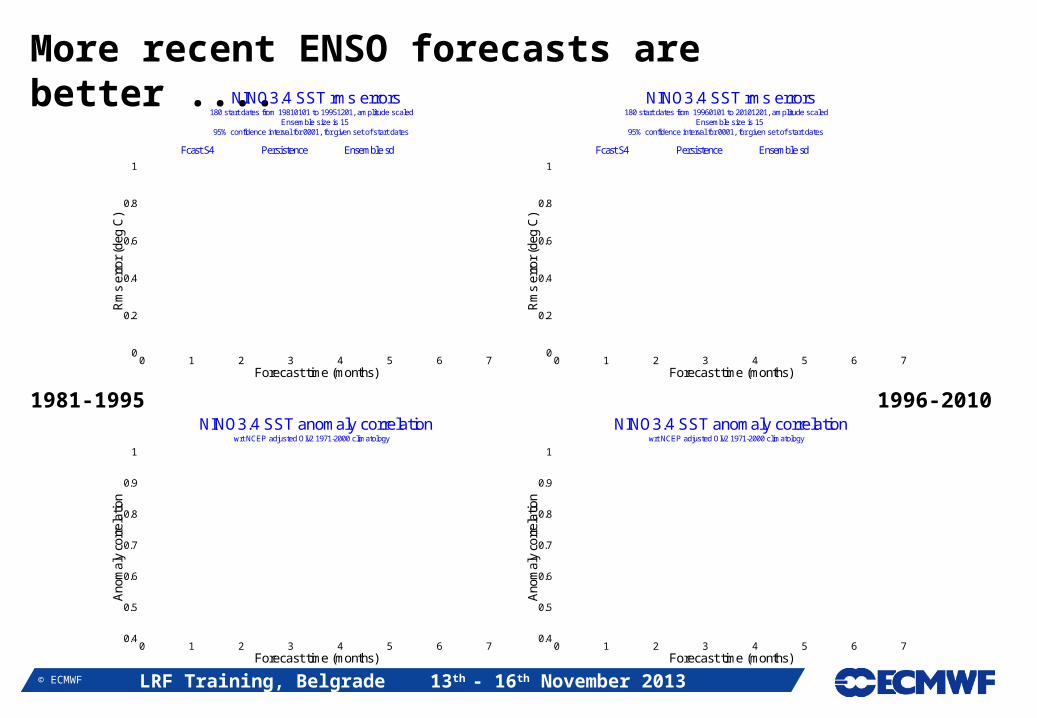
More recent ENSO forecasts are better ....
1981-1995 1996-2010
0 1 2 3 4 5 6 7Forecast time (months)
0.4
0.5
0.6
0.7
0.8
0.9
1
Ano
mal
y co
rrel
atio
n
wrt NCEP adjusted OIv2 1971-2000 climatology
NINO3.4 SST anomaly correlation
0 1 2 3 4 5 6 7Forecast time (months)
0
0.2
0.4
0.6
0.8
1
Rm
s er
ror
(deg
C)
95% confidence interval for 0001, for given set of start datesEnsemble size is 15
180 start dates from 19960101 to 20101201, amplitude scaled
NINO3.4 SST rms errors
Fcast S4 Persistence Ensemble sd
MAGICS 6.12 nautilus - net Wed May 16 12:19:01 2012
0 1 2 3 4 5 6 7Forecast time (months)
0.4
0.5
0.6
0.7
0.8
0.9
1
Ano
mal
y co
rrel
atio
n
wrt NCEP adjusted OIv2 1971-2000 climatology
NINO3.4 SST anomaly correlation
0 1 2 3 4 5 6 7Forecast time (months)
0
0.2
0.4
0.6
0.8
1
Rm
s er
ror
(deg
C)
95% confidence interval for 0001, for given set of start datesEnsemble size is 15
180 start dates from 19810101 to 19951201, amplitude scaled
NINO3.4 SST rms errors
Fcast S4 Persistence Ensemble sd
MAGICS 6.12 nautilus - net Wed May 16 12:21:31 2012

LRF Training, Belgrade 13th - 16th November 2013© ECMWF
System 4 configuration
Real time forecasts: 51 member ensemble forecast to 7 months SST and atmos. perturbations added to each member
15 member ensemble forecast to 13 months Designed to give an ‘outlook’ for ENSO Only once per quarter (Feb, May, Aug and Nov starts)
Back integrations from 1981-2010 (30 years) 15 member ensemble every month 15 members extended to 13 months once per quarter

LRF Training, Belgrade 13th - 16th November 2013© ECMWF
How many back integrations?
Back integrations dominate total cost of system System 4: 5400 back integrations (must be in first year) 612 real-time integrations (per year)
Back integrations define model climate Need both climate mean and the pdf, latter needs large sample May prefer to use a “recent” period (30 years? Or less??) System 2 had a 75 member “climate”, S3 had 275, S4 has 450. Sampling is basically OK
Back integrations provide information on skill A forecast cannot be used unless we know (or assume) its level of skill Observations have only 1 member, so large ensembles are less helpful
than large numbers of cases. Care needed e.g. to estimate skill of 51 member ensemble based on past
performance of 15 member ensemble For regions of high signal/noise, System 4 gives adequate skill estimates For regions of low signal/noise (eg <= 0.5), need hundreds of years

LRF Training, Belgrade 13th - 16th November 2013© ECMWF
QBO
1991 1992 1993 1994 1995 1996 1997 1998 1999 2000 2001 2002 2003 2004 2005-24
-12
0
12
24
Ano
mal
y (m
/s)
-24
-12
0
12
24
Ensemble size is 11 U50 obs: ec_eraiECMWF forecasts at month 7
5N-5S U50 forecast anomalies
Obs. anom. Fcast S3
MAGICS 6.12 nautilus - net Wed Sep 5 16:44:39 2012
50hPa
30hPa
System 3
1991 1992 1993 1994 1995 1996 1997 1998 1999 2000 2001 2002 2003 2004 2005-24
-12
0
12
24
Ano
mal
y (m
/s)
-24
-12
0
12
24
Ensemble size is 11 U50 obs: ec_eraiECMWF forecasts at month 7
5N-5S U50 forecast anomalies
Obs. anom. Fcast S4
MAGICS 6.12 nautilus - net Wed Sep 5 16:43:59 2012
1991 1992 1993 1994 1995 1996 1997 1998 1999 2000 2001 2002 2003 2004 2005
-24
-12
0
12
24
Ano
mal
y (m
/s)
-24
-12
0
12
24
Ensemble size is 11 U30 obs: ec_eraiECMWF forecasts at month 7
5N-5S U30 forecast anomalies
Obs. anom. Fcast S4
MAGICS 6.12 nautilus - net Wed Sep 5 16:45:10 2012
System 4

LRF Training, Belgrade 13th - 16th November 2013© ECMWF
Problematic ozone analyses
1991 1992 1993 1994 1995 1996 1997 1998 1999 2000 2001 2002 2003 2004 2005 2006 2007 2008 2009 2010-2
-1
0
1
2
Ano
mal
y (p
pm)
-2
-1
0
1
2
Ensemble size is 5 O30 obs: ec_eraiECMWF forecasts at month 7
GLOBAL O30 forecast anomalies
Obs. anom. Fcast S4
MAGICS 6.12 nautilus - net Thu May 31 10:57:12 2012
LRF Training, Belgrade 13th - 16th November 2013© ECMWF
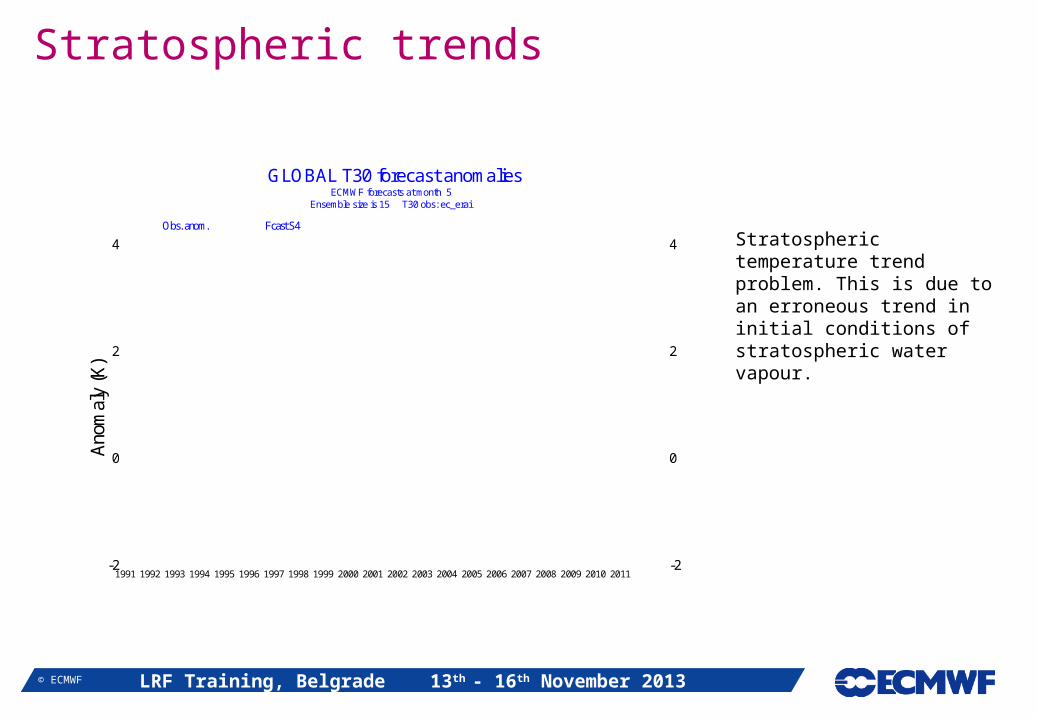
Stratospheric temperature trend problem. This is due to an erroneous trend in initial conditions of stratospheric water vapour.
1991 1992 1993 1994 1995 1996 1997 1998 1999 2000 2001 2002 2003 2004 2005 2006 2007 2008 2009 2010 2011-2
0
2
4
Ano
mal
y (K
)
-2
0
2
4
Ensemble size is 15 T30 obs: ec_eraiECMWF forecasts at month 5
GLOBAL T30 forecast anomalies
Obs. anom. Fcast S4
MAGICS 6.12 nautilus - net Wed May 16 12:43:33 2012
Stratospheric trends

LRF Training, Belgrade 13th - 16th November 2013© ECMWF
Land surface
Snow depth limits, 1st April

LRF Training, Belgrade 13th - 16th November 2013© ECMWF
Sea ice
LRF Training, Belgrade 13th - 16th November 2013© ECMWF
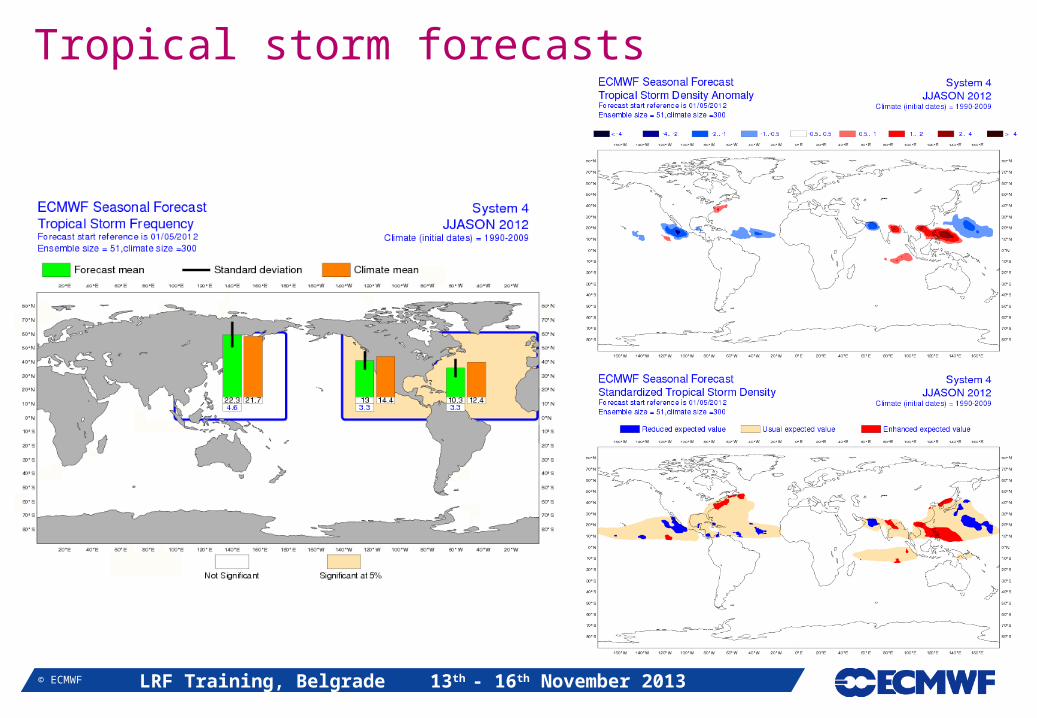
Tropical storm forecasts

LRF Training, Belgrade 13th - 16th November 2013© ECMWF
Model errors are still serious …
Models have errors other than mean bias Eg weak wind and SST variability in System 2 Past models underestimated MJO activity (S4 better) Suspected too-weak teleconnections to mid-latitudes
Mean state errors interact with model variability Nino 4 region is very sensitive (cold tongue/warm pool boundary) Atlantic variability suppressed if mean state is badly wrong
Forecast errors are often larger than they should be With respect to internal variability estimates and (occasionally) other
prediction systems Reliability of probabilistic forecasts is often not particularly high (S4 better)

LRF Training, Belgrade 13th - 16th November 2013© ECMWF
Recent Research

LRF Training, Belgrade 13th - 16th November 2013© ECMWF
S4 extended hindcast set
15 members
DJF Europe T2m>upper tercileRe-forecasts from 1 Nov, 1981-2010
Reliability score: 0.902ROC skill score: 0.06
51 members
DJF Europe T2m>upper tercileRe-forecasts from 1 Nov, 1981-2010
Reliability score: 0.981ROC skill score: 0.22
(Figures from Susanna Corti)
LRF Training, Belgrade 13th - 16th November 2013© ECMWF
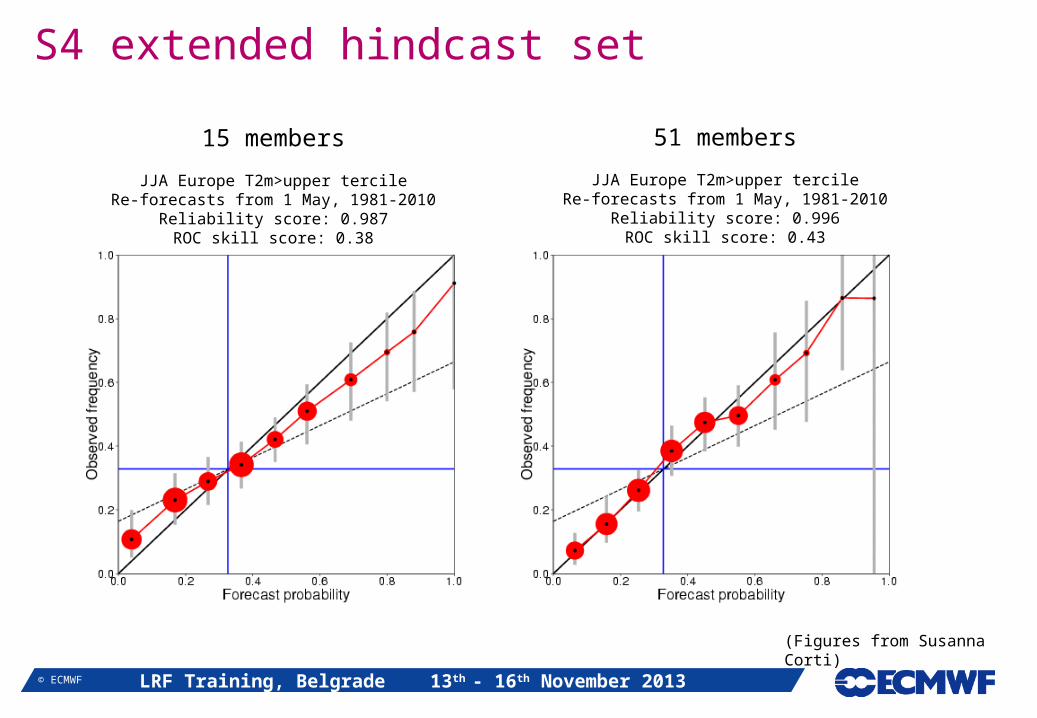
S4 extended hindcast set
15 members
JJA Europe T2m>upper tercileRe-forecasts from 1 May, 1981-2010
Reliability score: 0.987ROC skill score: 0.38
51 members
JJA Europe T2m>upper tercileRe-forecasts from 1 May, 1981-2010
Reliability score: 0.996ROC skill score: 0.43
(Figures from Susanna Corti)

LRF Training, Belgrade 13th - 16th November 2013© ECMWF
S4 ACCDJF Z500
S4 ACC perfect model limit

LRF Training, Belgrade 13th - 16th November 2013© ECMWF
Local p-value for perfect model
Indistinguishable from perfectWorse than perfectBetter than perfect
LRF Training, Belgrade 13th - 16th November 2013© ECMWF
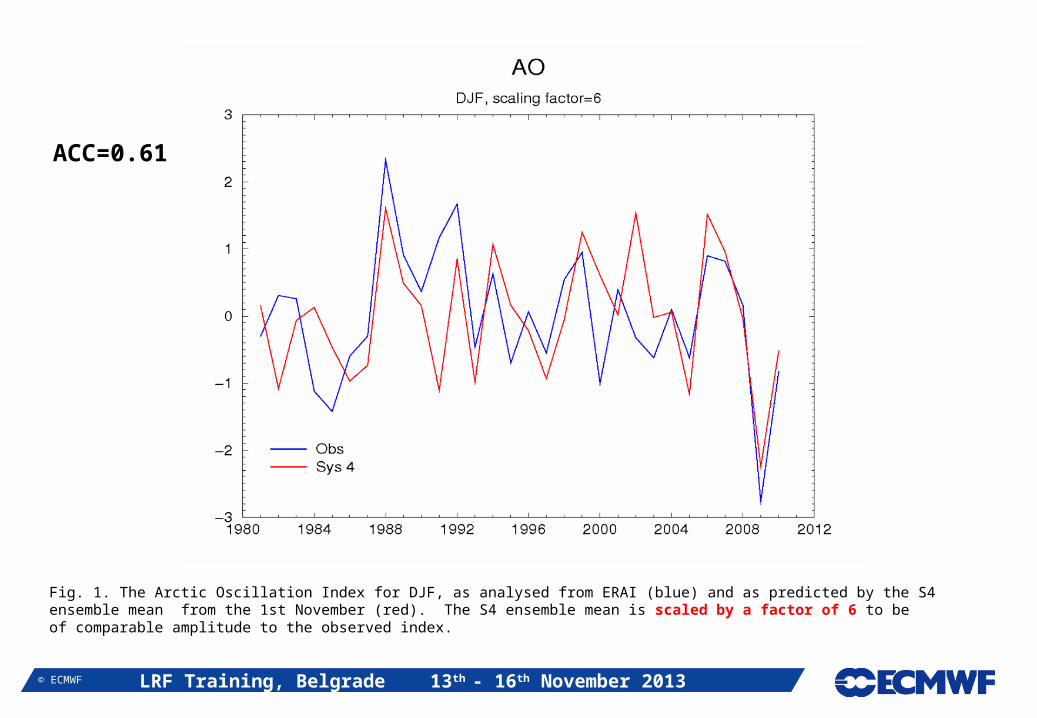
Fig. 1. The Arctic Oscillation Index for DJF, as analysed from ERAI (blue) and as predicted by the S4ensemble mean from the 1st November (red). The S4 ensemble mean is scaled by a factor of 6 to beof comparable amplitude to the observed index.
ACC=0.61

LRF Training, Belgrade 13th - 16th November 2013© ECMWF
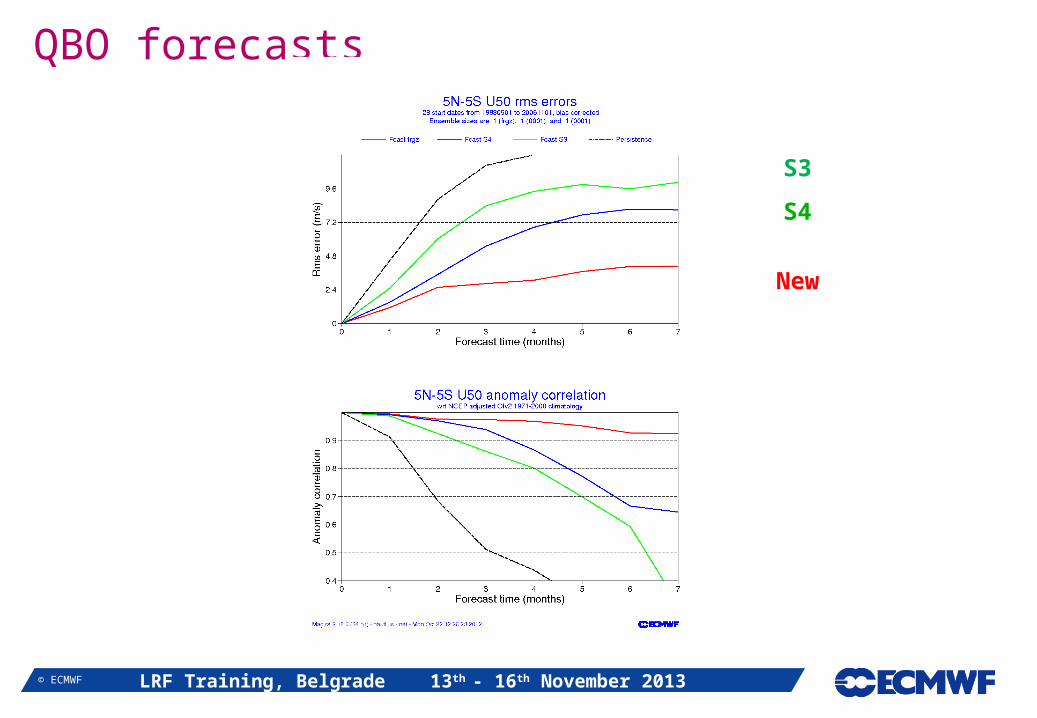
QBO
Period and downward penetration match observationsSemi-annual oscillation still poorly represented
A big reduction in vertical diffusion, and a further tuning of non-orographic GWD, has given a big additional improvement in the QBO compared to S4.
LRF Training, Belgrade 13th - 16th November 2013© ECMWF
QBO forecasts
S3
S4
New

LRF Training, Belgrade 13th - 16th November 2013© ECMWF
NH winter forecasts: vertical diffusion
0.319
0.371

LRF Training, Belgrade 13th - 16th November 2013© ECMWF
NH winter forecasts
Even with 101 members, ensemble mean signal not always well defined

LRF Training, Belgrade 13th - 16th November 2013© ECMWF
Conclusions
Models are improving Gradual but continuous improvement in scores Reliability can be high in many situations
Forecast systems still have deficiencies Need calibration, and often cannot be trusted at face value Some issues may affect real-time forecasts more than re-forecasts
Further improvements lie ahead Research results suggesting that previous estimates of predictability limits
might be wrong. Hard work needed to improve models and capture new sources of
predictability.