LPP EQUITY STORY€¦ · · 2017-12-11anyone who intends to make an investment decision with...
105
LPP EQUITY STORY GLOBAL ASPIRATIONS SEPTEMBER 2017
Transcript of LPP EQUITY STORY€¦ · · 2017-12-11anyone who intends to make an investment decision with...

1G L O B A L A S P I R A T I O N S
L P P E Q U I T Y S T O R Y
G L O B A L A S P I R A T I O N S
SEPT EMBER 2017

2G L O B A L A S P I R A T I O N S
Disclaimer
This presentation (the “Presentation”) was prepared by LPP SA (the “Company”) with a due care. Still, it may containcertain inconsistencies or omissions. The Presentation does not contain a complete or thorough financial analysis ofthe Company and does not present its standing or prospects in a comprehensive or in-depth manner. Therefore,anyone who intends to make an investment decision with respect to the Company should rely on the informationdisclosed in the official reports of the Company, published in accordance with the laws applicable to the Company.This Presentation was prepared for information purposes only and does not constitute an offer to buy or to sell anyfinancial instruments.
The Presentation may contain 'forward‐looking statements'. However, such statements cannot be treated asassurances or projections of any expected future results of the Company. Any statements concerning expectations offuture financial results cannot be understood as guarantees that any such results will actually be achieved in future.The expectations of the Management Board are based on their current knowledge and depend on many factors due towhich the actual results achieved by the Company may differ materially from the results presented in this document.Many of those factors are beyond the awareness and control of the Company or the Company’s ability to foreseethem.
Neither the Company, nor its directors, officers, advisors, nor representatives of any such persons are liable onaccount of any reason resulting from any use of this Presentation. Additionally, no information contained in thisPresentation constitutes any representation or warranty of the Company, its officers or directors, advisors orrepresentatives of any of the above persons. The Presentation and the forward‐looking statements speak only as atthe date of this Presentation. These may not be indicative of results or developments in future periods. The Companydoes not undertake any obligation to review, to confirm or to release publicly any revisions to any forward‐lookingstatements to reflect events that occur or circumstances that arise after the date of this Presentation.

3G L O B A L A S P I R A T I O N S
Table of contents
4 OVERVIEW
12 INVESTMENT CASE
14 NEW MARKETS DEVELOPMENT
23 DYNAMIC E-COMMERCE GROWTH
27 EFFICIENT BUSINESS MODEL
32 FREE CASH FLOW GENERATION
34 A RESPONSIBLE COMPANY
37 BACK-UP
38 BRANDS
48 LFLs
52 FLOORSPACE
55 REGIONS
68 GROWTH DRIVERS
74 BUSINESS MODEL DETAILS
91 CORPORATE MILESTONES
92 CORPORATE AND SOCIAL RESPONSIBILITY
100 STOCK EXCHANGE/IR

4G L O B A L A S P I R A T I O N S
1
2
3
Overview
Investment case
Back-up

5G L O B A L A S P I R A T I O N S
The largest clothing retailer on WSE
19COUNTRIES
1,710STORES
PLN 3bnREVENUES
69%FREE FLOAT
MSCI POLANDWIG 20 MEMBER
PLN 13bnMARKET
CAPITALISATION
Data as of 30.06.2017

6G L O B A L A S P I R A T I O N S
A diversified brand portfolio …

7G L O B A L A S P I R A T I O N S
…with varied store concepts

8G L O B A L A S P I R A T I O N S
2 growth pillars: stores and e-commerce
30.06.2017 No. of stores YoY
LPP GROUP 1,710 +24
Reserved 458 + 11
Cropp 386 - 2
House 338 - 5
Mohito 288 + 4
Sinsay 204 + 25
Tallinder 0 - 8
Outlets 36 -1
19countries off-line
9countries on-line
2pillars of growth
Germany SlovakiaCzech Republic
HungaryRomania Poland
Latvia EstoniaLithuania

9G L O B A L A S P I R A T I O N S
Over 1,700 stores on 3 continents
GDAŃSK LPP’s headquarters Design centres of
Reserved, Cropp, Sinsay brands
Back-office Logistics centre
WARSAW Reserved design centre Showrooms of 5 brands
CRACOW Design centre for House
and Mohito brandsDHAKA, BANGLADESH Offices
SHANGHAI, CHINA Offices
27 @
19 @
28 @
301
75
1,013@19@
80@
57@
17 @
1834@
12
1
1 1
3
1
3
Reserved London flagship
Data as of 30.06.2017 with exception of London flagship opened in September 2017.

10G L O B A L A S P I R A T I O N S
A lean retail oriented business model
545mcustomers annually
170mpieces of clothing
and accessories sold in 2016
200+ designers
700+ total number of people
creating collectionsof 5 brands
90%goods sourced
from Asia
500+suppliers
capacity to send up to
1.5m products daily to stores
the largest and most modern clothing
logistics centre in CEE
1,700+stores
19countries
3 continentsEurope, Asia, Africa
CustomersDesign Production Logistics Stores
Duration of the production cycle varies depending on the model, size of the order and country of production. Our models reflect the latest trends (the so-called must-haves) and are manufactured as quickly as 30 days. The rest of the collection is manufactured in approx. 90-100 days.

11G L O B A L A S P I R A T I O N S
6,019
3,185
1,765
634 599285 232 204 153
37,600
23,310
20,405
14,00812,548
10,174
1,376
Eyeing the international giants
Note: Data based on 2016 revenues or equivalent annual if available. Values calculated at average exchange rates for the period.
LEADER ON THE DOMESTIC
RETAIL MARKET
REVENUES (PLN m)
AMBITIONS TO BE AMONG
THE INTERNATIONAL LEADERS
REVENUES (EUR m)

12G L O B A L A S P I R A T I O N S
1
2
3
Overview
Investment case
Back-up

13G L O B A L A S P I R A T I O N S
Investment case
New markets development with 5 mainstream brands1
Dynamic e-commerce growth2
Efficient business model3
A responsible company managed by founders5
Free cash flow generation, sustaining dividends4
10% YoY floorspace growth targeted for 2017 and
2018
Sole ACCORD member from Poland
c.100% YoY e-commerce revenue growth pursued
in 2017 and 2018
Successful recovery from medium-term
turbulences
C. PLN 870m paid in dividends so far

14G L O B A L A S P I R A T I O N S
Portfolio of 5 mainstream brands
K E Y B R A N DF E A T U R E S
Anchor brand with broad customer base
Casual streetwear brandoffering also
international labels
Urban fashion brand with folk and vintage
elements
Comfort and elegance for business and informal
meetings
Clothes for every day inspirations and original
party outfits
T A R G E T C U S T O M E R S
Women, men, childrenTeenagers
(boys and girls)Teenagers
(boys and girls)Young women
Teenagers(girls only)
Y E A R O F L A U N C H
1998 20042001
(at LPP since 4Q08)2008
(at LPP since 4Q08)2013
C O U N T R I E S / R E G I O N S P R E S E N T
CEE, SEE, Baltic, CIS, Germany, ME
CEE, SEE, Baltic, CIS CEE, SEE, Baltic, CISCEE, SEE, Baltic, CIS
(excl. Belarus)CEE, Baltic, CIS (excl.
Belarus), SEE (excl. BGN)
# S T O R E S /F L O O R S P A C E2 Q 1 7
458520.8 ths m2
386121.9 ths m2
338106.6 ths m2
28899.3 ths m2
20472.5 ths m2
A V E R A G E S T O R E S I Z E
1,137 m2 316 m2 315 m2 345 m2 355 m2
Note: Sum of brand floorspace does not equal group floorspace as on top we had 12.6 ths m2 of outletsat the end of 2Q17.
W E F O C U S O N M A I N S T R E A M - P R I C E D B R A N D S

15G L O B A L A S P I R A T I O N S
Store upgrades to continue
450m2
355m2
28
2,500m2
1,137m2
52
We plan to continue to gradually enlarge the average size of stores of all our brands so as to accommodate room for more comprehensive collections.
49
450m2
315m2
53
450m2
316m2
73
450m2
345m2AV
ER
AG
E S
TO
RE
SIZ
E(C
UR
RE
NT
AN
D T
AR
GE
T)
PR
ICE
TA
G
(PLN
)

16G L O B A L A S P I R A T I O N S
Reserved remains our key brand. We continue to develop other brands to minimise fashion risk and benefit from economies of scale.
In the long-term we plan to open stores of each brand in all countries in which we are present today.
The priority in new markets’ expansion is given to Reserved brand (Germany, Middle East, the UK).
GROUP REVENIUES BY BRANDS(PLN m)
GROUP REVENIUES BY BRANDS
Reserved remains our most important brand
PLN m 2013 2014 2015 2016 1H17
LPP GROUP 4,116 4,769 5,130 6,019 3,068
Reserved 2,074 2,311 2,434 2,693 1,377
Cropp 687 771 790 915 442
House 546 634 673 767 339
Mohito 456 523 586 737 396
Sinsay 74 225 329 461 261
Tallinder 0 0 0 12 1
Other 279 306 318 434 251
2013 2014 2015 2016 1H16 1H17
Reserved Cropp House MOHITO SiNSAY Tallinder Other
4,1164,769
5,1306,019
2,6773,068
50% 48% 47% 45%45% 45%

17G L O B A L A S P I R A T I O N S
International growth opportunities
C E E B A L T I C S E E C I S W E M E
C O U N T R I E SP R E S E N T
Poland, Czech Republic, Hungary,
Slovakia
Lithuania, Latvia, Estonia
Bulgaria, Romania, Croatia
Russia, Ukraine, Belarus
GermanyEgypt, Kuwait,
Qatar, Saudi Arabia, UAE
# C O U N T R I E S P R E S E N T
4 3 3 3 1 5
B R A N D SReserved, Cropp,House, Mohito,
Sinsay
Reserved, Cropp,House, Mohito,
Sinsay
Reserved, Cropp,House, Mohito,
Sinsay
Reserved, Cropp,House, Mohito,
SinsayReserved Reserved
# S T O R E S 2 Q 1 7
1,167 74 64 379 19 7
T Y P E O F S T O R E S
Own (majority),franchise
Own OwnOwn (majority),
franchiseOwn Franchise
F L O O R S P A C E 2 Q 1 7
574.9 ths m2 39.9 ths m2 48.7 ths m2 216.5 ths m2 45.5 ths m2 8.2 ths m2
M A T U R I T Y D E V E L O P I N G E A R L Y S T A G ED E V E L O P M E N TS T A G E

18G L O B A L A S P I R A T I O N S
0%
1%
1%
2%
2%
3%
3%
4%
4%
5%
5%
0 10 20 30 40 50
Entry into high growth potential markets
GDP growth (2018F)
GDP/capita (ths US$, current prices, 2018F)
Scale of the bubble = population (m inhabitants)
Slovenia
Ukraine
Kazakhstan
SerbiaRomania
BulgariaIsrael
Source: International Monetary Fund, April 2017 dataset.
Germany
Belarus
Russia
UK
Croatia
GROWTH POTENTIAL OF COUNTRIES DEVELOPED
Positive 2018F GDP growth in all countries in which
floorspace expansion is
planned.Poland
Hungary
Czech Rep.
Slovakia

19G L O B A L A S P I R A T I O N S
New countries fuel revenue growth
CEE: dependency on Poland should continue to diminish in upcoming years. Maturity has been reached in Czech Republic and Slovakia, but Hungary still offers growth potential.
CIS: acceleration in 2017 – step-up in store openings in Russia and Ukraine and entry via franchise stores into Belarus(April 2017) and Kazakhstan (planned for 4Q17). SEE: entry into Serbia in August 2017.
WE: 20 stores in Germany by the end of 2018 and first store in London opened in September 2017.
PLN m 2013 2014 2015 2016 1H17
LPP GROUP 4,116 4,769 5,130 6,019 3,068
CEE 2,927 3,414 3,634 4,039 1,964
Baltic 186 200 222 256 127
SEE 52 65 134 230 130
CIS 952 1,076 1,025 1,269 718
WE 0 15 94 194 115
ME 0 0 23 31 13
GROUP REVENUES BY REGIONS(PLN m)
GROUP REVENUES BY REGIONS
2013 2014 2015 2016 1H16 1H17
CEE Baltic SEE CIS WE ME
4,1164,769
5,130
6,019
2,6773,068

20G L O B A L A S P I R A T I O N S
It is our target to add at least one new country every year.
In 2017 we have already opened three new markets: Belarus with franchise stores as well as Serbia and the UK with own stores. Franchise store in Kazakhstan remains to be launched in 4Q17.
In 2018 we plan to open first Reserved franchise stores in Israel and own stores in Slovenia.
EXPANSION BY COUNTRIES
New countries every year
eop 2013
13 states
17 states
18 states
21 states
23 states
+ Croatia
+ Germany
+ Egypt
+ Qatar
+ Kuwait
+ Saudi A. + UAE
+ Serbia
+ UK
+ Kazakhstan
- Saudi A.
+ Belarus
+ Israel
+ Slovenia
+ new market/s
11 states
eop 2014 eop 2015 eop 2016 eop 2017 eop 2018

21G L O B A L A S P I R A T I O N S
23 countries in 2018
@
@
@
@
@
@
@
@
@
@
@
@
@
■ CEE■ Baltic■ SEE ■ CIS ■ WE■ ME
Allregions as of the end of 2018.
@@
@

22G L O B A L A S P I R A T I O N S
We plan to grow floorspace by 10% YoY not only in 2017 but also in 2018.
2017 targets: (1) further CEE development, (2) CIS acceleration (especially in Russia), (3) further growth in the SEE region (focus on Romania, entry to Serbia in August 2017) and (4) new stores in WE (UK flagship).
LPP stores in 4 new countries in 2017: Belarus and Kazakhstan (both franchise) and Serbia and the UK (both own stores).
FLOORSPACE GROWTH TARGETS
(ths m2)
FLOORSPACE TARGETS BY REGIONS
Double-digit floorspace growth
+16% 2013 -16 CAGR
+10% YoY ths m2 2017 YoY 2018 YoY
LPP GROUP 1,008.8 10% 1,114.4 10%
Poland 510.1 3% 547.7 7%
Europe 236.5 13% 277.7 17%
CIS 255.6 23% 276.6 8%
ME 6.6 -13% 12.5 90%
+10% YoY
588.6
722.5843.5
920.71,008.8
1,114.4
2013 2014 2015 2016 2017 2018

23G L O B A L A S P I R A T I O N S
E-commerce is the second pillar of our of growth strategy.
We have high-quality internet and mobile stores of five brands in 9 countries.
We have been successful on every on-line market that we have launched.
Poland remains the largest on-line sales contributor due to strong recognition of our brands and much earlier roll-out.
LPP’s ON-LINE SALES DEVELOPMENT(PLN m)
E-commerce successful on every market
68.6
1H17 ON-LINE SALES BY REGIONS(PLN m)
139.7
+45.6 +7.6 +5.0 +4.0 +5.3 +0.6 +0.4 +0.7 +1.9
Poland78%
Other CEE14%
SEE4%
Baltic1% WE
3%

24G L O B A L A S P I R A T I O N S
In April 2017 we signed an agreement with Arvato to outsource on-line logistics of four our brands with the aim to speed up and improve the logistics.
We continue to work on e-commerce growth: in September we launched Reserved on-line store in the UK together with our London flagship and we see growth perspectives on the to-be-entered in 4Q17 markets: Russia and Ukraine.
It is our 2020 target for internet sales to constitute 7-8% of revenues.
LPP’s ON-LINE SALES(PLN m)
Triple-digit on-line sales growth to continue
+100% YoY
T A R G E T
We expect 2017 and 2018 e-commerce
revenues to grow some100% YoY.26.7
64.879.3
173.1
350.0
0%
1%
2%
3%
4%
5%
0
100
200
300
400
500
2013 2014 2015 2016 2017 Target
E-commerce revenues % of group sales

25G L O B A L A S P I R A T I O N S
Acceleration of e-commerce roll-out
07.2014
on-line store
GERMANY
05.2015
CZECH REP.
on-line store
10.2015
SLOVAKIA
on-line store
02.2016
POLAND
on-line store
12.2016
CZECH REP.,HUNGARY, ROMANIA, SLOVAKIA, GERMANY
on-line stores
09.2017
UK
on-line store
11.2015
ROMANIA
on-line store
03.2016
HUNGARY
on-line store
04.2017
LITHUANIA, LATVIA,ESTONIA
on-line stores
4Q2017
RUSSIA,UKRAINE
on-line stores
2018
BULGARIA, CROATIA, SERBIA, SLOVENIA
on-line stores

26G L O B A L A S P I R A T I O N S
Fast growing e-commerce reach
@@
@@
@@
@
@
@
@
@
@
E-commerce 2017 - 12 countries
E-commerce 1H17 - 9 countries
E-STORES IN 12 COUNTRIES
2018 PLANS
E-STORES IN 16 COUNTRIES
E-commerce 2018 - 16 countries
@ @
@@

27G L O B A L A S P I R A T I O N S
A positive 2017 outlook
REVENUES
GROSS PROFIT MARGIN
SG&A COSTS
INTEREST
FX LOSSES
Revenue growth should continue to exceed floorspace growth (positive LFLs at all brands).
Pick-up in gross profit margin versus 2016 level. Estimated 2017 group gross profit margin at 52-53%.
Controllable growth of SG&A/ m2, mostly due to salary increases.
Indebtedness at a low level, among others due to further net working capital improvements.
Cash flow hedge of invoices once sent by suppliers. Start end of June 2017.

28G L O B A L A S P I R A T I O N S
Sales/ m2 should continue to grow
Revenues/ m2 in Poland were on average c.17% higher in 2013-16 than on foreign markets.
The difference narrowed in 2016 and 1H17 due to stronger recognition of the younger brands abroad, more favourable FX trends especially in 2H16 and introduction of a new replenishment system abroad.
Except for Cropp, in 2013-16 revenues/ m2 in Poland were higher than abroad due to superior brand recognition, yet the difference gradually dissipates.
AVERAGE MONTHLY REVENUES/ M2 AVERAGE MONTHLY REVENUES/ M2
PLN m 2013 2014 2015 2016 1H17
LPP GROUP 664 589 548 575 563
Poland 691 647 598 595 571
Export 616 503 454 516 530
Reserved 617 547 483 475 457
Cropp 725 647 591 653 615
House 652 612 579 621 546
Mohito 759 583 549 636 669
Sinsay 670 584 531 607 616
-11% -22% -24% -13% -7%
-30%
-20%
-10%
0%
0
200
400
600
800
2013 2014 2015 2016 1H17
Poland Foreign operations Discount foreign to PL

29G L O B A L A S P I R A T I O N S
Gross profit margin should be on the rise
% 2013 2014 2015 2016 1H17
LPP GROUP 58.5% 58.6% 53.5% 48.8% 51.7%
FX – c. 90% of purchases aremade in the Far East and
indexed to US$. Appreciationof zloty to US$ decreases costs
of purchases from Asia.
Sell-off policy – new inventory management policy is aimed at
selling goods to a maximum extent in stores to avoid the costs
of their return and transport to post-season warehouse.
Quality of collections – we have introduced far reaching changes
within our design departments so as to better meet the customers’
expectations.
SOURCES OF GROSS PROFIT MARGIN IMPROVEMENT
First positive results.

30G L O B A L A S P I R A T I O N S
2016 2016 2016
High operating leverage business
70% of our SG&A costs are fixed, which implies a high operating leverage.
59% of SG&A costs are linked to foreign currencies zloty appreciation is favourable for EBIT.
Fall in SG&A/ m2 over 2013-15 optimisation of costs of stores and headquarters.
Higher SG&A/ m2 in 2016 growth in costs of stores (higher rentals due to depreciation of zloty versus euro, higher HR costs due to growing salaries) and pick-up in HQs costs.
AVERAGE MONTHLY SG&A COSTS/ M2 (PLN) SG&A COSTS
Variable costs30%
Fixed costs70%
HQs20%
Costs of stores80%
PLN costs41%
Note: SG&A relations based on group 2016 data.
FX costs59%
296274
234 251 245268
2013 2014 2015 2016 1H16 1H17

31G L O B A L A S P I R A T I O N S
LPP’S ROE CONTRIBUTORS
ROE levels should rebound
ADJ. NET INCOME
REVENUES
REVENUES
ASSETS
ASSETS
EQUITYROE
Note: 2014 net income adjusted for tax asset.
NI margin Asset Turnover Equity Multiplier ROE
2012 10.9% 1.7 1.8 33.4%
2013 10.5% 1.7 1.8 32.0%
2014 7.9% 1.6 1.9 23.9%
2015 6.9% 1.4 2.0 20.0%
2016 2.9% 1.6 1.8 8.7%
Lean business model remains intact.
NET INCOME PROFITABILITY
OPERATING EFFICIENCY
FINANCIAL LEVERAGE
Operating cost discipline
A leanbusiness model
Moderate usage of debt

32G L O B A L A S P I R A T I O N S
PLN m 2013 2014 2015 2016 1H17
FCFF 19 154 -64 454 152
NOPAT 509 638 426 205 57
D&A 148 194 224 267 147
Capex -542 -551 -491 -272 -202
NWC -96 -127 -223 254 149
We focus on FCFF generation
FCFF GENERATION
NOPAT We focus on positive LFLs on all brands.
Positive LFLs trigger the operating leverage to work in our favour.
Strong growths in the higher margin e-commerce should additionally support EBIT margin.
CAPEX & D&A We invest in high quality store locations where
we obtain fit-outs.
Current logistics centre is sufficient until 2020.
We outsource e-commerce logistics.
NWC It is our aim to match liabilities to the level of
inventory.
We use supply chain financing for our suppliers.
We search for the optimal inventory/ m2 level.
Positive 2016 and 1H17 FCFF (Free Cash Flow to Firm).
33G L O B A L A S P I R A T I O N S
209399
621
144
-11
-0.2
0.0
0.2
0.4
0.6
0.8
1.0
-200
0
200
400
600
800
2013 2014 2015 2016 1H17
Net debt Net debt/ EBITDA
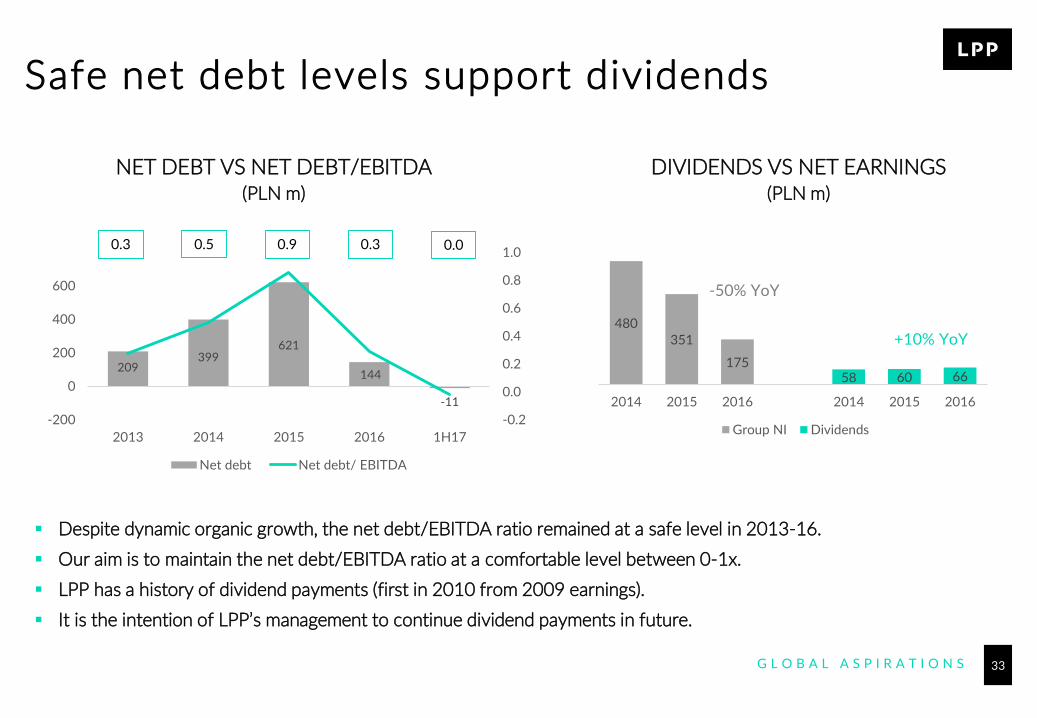
Safe net debt levels support dividends
Despite dynamic organic growth, the net debt/EBITDA ratio remained at a safe level in 2013-16.
Our aim is to maintain the net debt/EBITDA ratio at a comfortable level between 0-1x.
LPP has a history of dividend payments (first in 2010 from 2009 earnings).
It is the intention of LPP’s management to continue dividend payments in future.
NET DEBT VS NET DEBT/EBITDA(PLN m)
DIVIDENDS VS NET EARNINGS(PLN m)
0.3 0.5 0.9 0.3 0.0
480351
17558 60 66
2014 2015 2016 2014 2015 2016
Group NI Dividends
-50% YoY
+10% YoY

34G L O B A L A S P I R A T I O N S
We focus on all stakeholders
LPP was the only Polish retail company to join
ACCORD (Accord on Fire and Building Safety in
Bangladesh).
Over 190 retail companies and NGOs joined ACCORD
in October 2013.
Co-operation was signed for 5 years.
The aim of the alliance is to improve the safety of
workers in Bangladesh.
Since Apri l 2017 we co-operate with an international SGS
company in frames of audit ing the working condit ions at our
Asian subcontractors.

35G L O B A L A S P I R A T I O N S
Company managed by founders
Both LPP’s founders, Marek Piechocki (CEO, 56) and Jerzy Lubianiec (Chairman of the Supervisory Board, 57) have over 25 years of experience in the retail business and actively suport LPP’s development.
Both founders still control the business with 30% of equity and c.61% of votes.
Since IPO, top-ranked management for the quality of investor relations in domestic surveys among investment professionals.
Index of Success awarded by Deloitte and Rzeczpospolita newswire in 2016
for the last 10-year performance
No 1 at ranking Stock Company of the Year by Puls Biznesu(2014, 2012, 2011)
Most effective CEO by Harvard Business Review (2013)
No 1 Investor Relations by Parkiet(2015, 2014)
The most dynamically growing company in Pomerania region by Forbes (2014)

36G L O B A L A S P I R A T I O N S
LPP – an investment opportunity
High quality Company post medium-term
turbulences.
Stock benefiting from liquidity and recognition from WIG20 and MSCI
Poland membership.
Company actively pursuing international
expansion.

37G L O B A L A S P I R A T I O N S
1
2
3
Overview
Investment case
Back-up

38G L O B A L A S P I R A T I O N S
K E Y B R A N DF E A T U R E S
Anchor brand with broad customer base
T A R G E T C U S T O M E R S
Women, men, children
Y E A R O F L A U N C H
1998
# S T O R E S 458
# M A R K E T S 19
S T O R E S I Z E 1,137 m2
A D V E R T I S I N GInternational stars like KateMoss and Georgia May Jagger

39G L O B A L A S P I R A T I O N S
REVENUES (PLN m)
STORES
Key data 2013 2014 2015 2016 1H17
Revenues (PLN m) 2,073.8 2,311.3 2,433.8 2,692.9 1,376.9
No. of stores 386 425 449 461 458
Store size (m2) 835 917 1,027 1,104 1,137
Floorspace (ths, m2) 322.3 389.7 461.3 509.1 520.8
Sales/ m2 monthly 617 547 483 475 457
% of floorspace in PL 59% 54% 50% 49% 47%
YoY growth 2013 2014 2015 2016 1H17
Revenues (PLN m) 21% 11% 5% 11% 14%
No. of stores 12% 10% 6% 3% 2%
Store size (m2) 14% 10% 12% 7% 7%
Floorspace (eop, m2) 28% 21% 18% 10% 10%
Sales/ m2 monthly -2% -11% -12% -2% 4%
% of floorspace in PL -3ppt -5ppt -4ppt -1ppt -3ppt
2,0742,311 2,434
2,693
1,377
2013 2014 2015 2016 1H17
233 235 237 236 230
153 190 212 225 228
2013 2014 2015 2016 1H17
Stores PL Stores EX

40G L O B A L A S P I R A T I O N S
K E Y B R A N DF E A T U R E S
Casual streetwear brand with international labels
T A R G E T C U S T O M E R S
Teenagers (boys and girls)
Y E A R O F L A U N C H
2004
# S T O R E S 386
# M A R K E T S 13
S T O R E S I Z E 316 m2
A D V E R T I S I N GPartner of artistic and street art events

41G L O B A L A S P I R A T I O N S
REVENUES (PLN m)
STORES
Key data 2013 2014 2015 2016 1H17
Revenues (PLN m) 687.0 770.9 789.9 914.9 442.4
No. of stores 337 366 372 379 386
Store size (m2) 269 288 308 318 316
Floorspace (ths, m2) 90.6 105.4 114.5 120.4 121.9
Sales/ m2 monthly 725 647 591 653 615
% of floorspace in PL 60% 55% 55% 54% 55%
YoY growth 2013 2014 2015 2016 1H17
Revenues (PLN m) 18% 12% 2% 16% 11%
No. of stores 14% 9% 2% 2% -1%
Store size (m2) 10% 7% 7% 3% 4%
Floorspace (eop, m2) 26% 16% 9% 5% 4%
Sales/ m2 monthly -4% -11% -9% 11% 6%
% of floorspace in PL -2ppt -5ppt 0ppt -1ppt 0ppt
222 219 217 219 227
115 147 155 160 159
2013 2014 2015 2016 1H17
Stores PL Stores EX
687771 790
915
442
2013 2014 2015 2016 1H17

42G L O B A L A S P I R A T I O N S
K E Y B R A N DF E A T U R E S
Urban fashion brand with folk and vintage elements
T A R G E T C U S T O M E R S
Teenagers(boys and girls)
Y E A R O F L A U N C H
2001 (at LPP since 4Q08)
# S T O R E S 338
# M A R K E T S 13
S T O R E S I Z E 315 m2
A D V E R T I S I N GArtistic events partner and music sponsor

43G L O B A L A S P I R A T I O N S
REVENUES (PLN m)
STORES
Key data 2013 2014 2015 2016 1H17
Revenues (PLN m) 546.3 633.6 673.2 767.1 339.5
No. of stores 292 308 319 330 338
Store size (m2) 275 291 313 320 315
Floorspace (ths, m2) 80.2 89.6 99.7 105.7 106.6
Sales/ m2 monthly 652 612 579 621 546
% of floorspace in PL 69% 64% 62% 61% 61%
YoY growth 2013 2014 2015 2016 1H17
Revenues (PLN m) 25% 26% 6% 14% 2%
No. of stores 13% 5% 4% 3% -1%
Store size (m2) 11% 6% 7% 2% 3%
Floorspace (eop, m2) 26% 12% 11% 6% 2%
Sales/ m2 monthly 0% -2% -5% 7% -1%
% of floorspace in PL -4ppt -5ppt -2ppt -1ppt -1ppt
546634 673
767
339
2013 2014 2015 2016 1H17
211 209 208 212 219
81 99 111 118 119
2013 2014 2015 2016 1H17
Stores PL Stores EX

44G L O B A L A S P I R A T I O N S
K E Y B R A N DF E A T U R E S
Comfort and elegance; business and casual
T A R G E T C U S T O M E R S
Young women
Y E A R O F L A U N C H
2008 (at LPP since 4Q08)
# S T O R E S 288
# M A R K E T S 12
S T O R E S I Z E 345 m2
A D V E R T I S I N GSuper models (Anna Jagodzinska, Anja Rubik)

45G L O B A L A S P I R A T I O N S
REVENUES (PLN m)
STORES
Key data 2013 2014 2015 2016 1H17
Revenues (PLN m) 456.4 522.9 586.5 736.8 395.9
No. of stores 219 256 280 290 288
Store size (m2) 301 323 337 342 345
Floorspace (ths, m2) 66.0 82.8 94.5 99.1 99.3
Sales/ m2 monthly 759 583 549 636 669
% of floorspace in PL 62% 56% 55% 54% 53%
YoY growth 2013 2014 2015 2016 1H17
Revenues (PLN m) 76% 15% 12% 26% 19%
No. of stores 36% 17% 9% 4% 1%
Store size (m2) 25% 7% 4% 1% 2%
Floorspace (eop, m2) 70% 26% 14% 5% 4%
Sales/ m2 monthly -6% -19% -6% 16% 14%
% of floorspace in PL -5ppt -6ppt -1ppt -1ppt -1ppt
456523
586
737
396
2013 2014 2015 2016 1H17
144 153 164 166 162
75103 116 124 126
2013 2014 2015 2016 1H17
Stores PL Stores EX

46G L O B A L A S P I R A T I O N S
K E Y B R A N DF E A T U R E S
Every day clothes and original party outfits
T A R G E T C U S T O M E R S
Teenagers (girls only)
Y E A R O F L A U N C H
2013
# S T O R E S 204
# M A R K E T S 11
S T O R E S I Z E 355 m2
A D V E R T I S I N G Social media

47G L O B A L A S P I R A T I O N S
REVENUES (PLN m)
STORES
Key data 2013 2014 2015 2016 1H17
Revenues (PLN m) 74.0 224.7 328.9 460.9 260.7
No. of stores 62 129 170 198 204
Store size (m2) 325 338 351 352 355
Floorspace (ths, m2) 20.1 43.7 59.7 69.8 72.5
Sales/ m2 monthly 670 584 531 607 616
% of floorspace in PL 89% 75% 73% 70% 68%
YoY growth 2013 2014 2015 2016 1H17
Revenues (PLN m) - 204% 46% 40% 27%
No. of stores - 108% 32% 16% 14%
Store size (m2) - 4% 4% 0% 1%
Floorspace (eop, m2) - 117% 37% 17% 15%
Sales/ m2 monthly - -4% -9% 14% 9%
% of floorspace in PL - -14ppt -2ppt -3ppt -3ppt
74
225
329
461
261
2013 2014 2015 2016 1H17
5699 127 142 1426
3043
56 62
2013 2014 2015 2016 1H17
Stores PL Stores EX

48G L O B A L A S P I R A T I O N S
Acceleration of LFL growth
LFLs IN LOCAL CURRENCIES
% 2013 2014 2015 2016 1H17
LPP GROUP 5.6% -2.5% 0.6% 6.4% 5.5%
A C T I O N S T A KE N T O B O O S T L F L s
New collections
International stars
Attractive floorspace
Price
Promotions
LFLs DEFINITION
Stores that
have been the same as a year before (have not changed their floorspace, have not undergone upgrades) and
have been in operation for the past 12 months (without a break longer than 7 days).
Calculations are conducted without taking into account changes in currencies in countries in which LPP’s stores are run, i.e. in local currencies.

49G L O B A L A S P I R A T I O N S
Georgia May Jagger Cara Delevingne Kate Moss
Anja Rubik Anna Jagodzińska Zuzanna Bijoch
International stars promote our brands

50G L O B A L A S P I R A T I O N S
We focus on flagships
1,085 m22,300 m21,635 m2
3,500 m2
R e served i n S t u t t g a r t , Ge rm any
2,500 m2
R e served i n Mos c ow, R us s ia
R e served i n R i g a , La t v i a R e served i n Za k op a ne , Po l a nd R e served i n Bud a pest , Hung a ry
3,000 m2
R e served i n Lond on , U K

51G L O B A L A S P I R A T I O N S
Wide, open and transparent storefront allows for a deep view
into the store.
Modern LED lamps and LED screens
illuminate the collections in a better
way and create a warm ambience.
Comfortable, large and spacious fitting
rooms.
Lack of dedicated zones allows for a smooth transition
between women, men and children zones.
Furniture made of straight profiles,
flexible and more mobile.
New Reserved store concept

52G L O B A L A S P I R A T I O N S
Consistent network development
Floorspace (ths m2) 30.06.2015 30.09.2015 31.12.2015 31.03.2016 30.06.2016 30.09.2016 31.12.2016 31.03.2017 30.06.2017
Reserved 416.3 435.7 461.3 467.1 473.8 487.2 509.1 510.7 520.8
Poland 219.0 223.4 232.5 230.9 235.1 232.0 248.7 245.9 247.4
Europe 95.1 106.5 120.2 124.0 127.2 140.0 144.1 147.7 151.3
CIS 98.3 100.4 103.1 104.6 103.9 107.7 108.7 109.5 114.0
ME 3.9 5.5 5.5 7.6 7.6 7.6 7.6 7.6 8.2
Cropp 111.5 109.1 114.5 115.4 117.8 116.7 120.4 120.1 121.9
Poland 62.8 59.6 63.0 63.6 65.2 63.0 65.3 65.1 66.5
Europe 18.7 19.1 19.8 20.2 20.6 21.0 21.2 21.0 20.8
CIS 30.0 30.4 31.7 31.6 31.9 32.8 34.0 34.0 34.7
House 96.7 95.2 99.7 100.5 104.8 103.8 105.7 102.9 106.6
Poland 62.4 59.3 62.2 62.9 65.4 63.1 64.9 62.4 65.1
Europe 13.2 14.4 15.1 15.5 16.4 16.8 16.4 16.2 16.2
CIS 21.1 21.6 22.4 22.0 23.1 23.9 24.3 24.3 25.4
Mohito 89.1 90.3 94.5 94.9 95.9 97.6 99.1 97.8 99.3
Poland 49.2 49.7 52.1 52.5 51.8 52.4 53.4 51.7 52.6
Europe 14.5 15.2 16.1 16.5 17.7 18.1 18.1 18.1 18.1
CIS 25.4 25.4 26.2 25.9 26.3 27.1 27.7 28.0 28.6
Sinsay 52.4 54.8 59.7 60.5 63.1 65.2 69.8 69.8 72.5
Poland 38.6 40.3 43.5 43.9 44.5 45.5 48.6 48.6 49.0
Europe 6.3 6.6 7.6 8.0 8.8 9.2 9.7 9.7 10.4
CIS 7.6 7.9 8.6 8.6 9.8 10.5 11.5 11.5 13.1
Tallinder (Poland only) 0.0 0.0 0.0 2.9 3.7 3.7 4.1 0.0 0.0
Outlets 12.4 13.6 13.8 13.8 13.8 13.8 12.6 12.6 12.6
Total by regions
Poland 443.5 443.9 465.0 468.3 477.4 471.2 496.6 485.3 492.1
Europe 147.7 161.7 179.0 184.4 190.8 205.2 209.5 212.8 216.9
CIS 183.2 187.7 193.9 194.7 196.9 204.0 207.0 208.2 216.5
ME 3.9 5.5 5.5 7.6 7.6 7.6 7.6 7.6 8.2
TOTAL 778.4 798.8 843.5 855.0 872.7 888.0 920.7 913.9 933.7

53G L O B A L A S P I R A T I O N S
Double-digit 2017 floorspace growth
10% YoY floorspace growth in 2017.
Reserved stores should be in 21 countries at the end of 2017. 4 new countries in 2017 encompass:
Serbia and the UK (own stores) – openings in 3Q17,
Belarus (since April) and Kazakhstan (franchise stores).
2017 targets:
CEE development,
CIS acceleration,
further SEE development (especially in Romania, entry to Serbia),
new stores in WE (3 stores in Germany in 1H17 and entry to the UK).
Planned 2017 capex at c. PLN 375m, up c. 40% YoY due to floorspace growth. Planned store capex at PLN 340m and HQs outlays at PLN 35m.
Floorspace(ths m2)
2016 2017 former
target2017target
YoY
BY BRANDS
Reserved 509.1 578.4 565.3 11%
Cropp 120.4 129.0 127.4 6%
House 105.7 112.2 111.7 6%
Mohito 99.1 102.1 103.7 5%
Sinsay 69.8 89.5 86.3 24%
Tallinder 4.1 0.0 0.0 -100%
Outlets 12.6 11.6 14.5 15%
BY REGIONS
Poland 496.6 513.2 510.1 3%
Europe 209.5 251.0 236.5 13%
CIS 207.0 250.5 255.6 23%
ME 7.6 8.2 6.6 -13%
TOTAL 920.7 1,022.9 1,008.8 10%

54G L O B A L A S P I R A T I O N S
2017 network development detailsFLOORSPACE (ths m2)
31.12.2016 2017 TARGET Nom. growth YoY
Reserved 509.1 565.3 56.2 11%
Poland 248.7 263.8 15.2 6%
Europe 144.1 162.6 18.5 13%
CIS 108.7 132.2 23.5 22%
ME 7.6 6.6 -1.0 -13%
Cropp 120.4 127.4 7.0 6%
Poland 65.3 65.1 -0.2 0%
Europe 21.2 22.8 1.6 8%
CIS 34.0 39.5 5.6 16%
House 105.7 111.7 6.0 6%
Poland 64.9 64.9 0.0 0%
Europe 16.4 17.4 1.1 6%
CIS 24.3 29.3 5.0 20%
Mohito 99.1 103.7 4.6 5%
Poland 53.4 52.7 -0.7 -1%
Europe 18.1 20.0 1.9 11%
CIS 27.7 31.1 3.4 12%
Sinsay 69.8 86.3 16.5 24%
Poland 48.6 53.2 4.6 9%
Europe 9.7 13.5 3.8 40%
CIS 11.5 19.6 8.0 70%
Tallinder 4.1 0.0 -4.1 -100%
Poland 4.1 0.0 -4.1 -100%
Europe 0.0 0.0 0.0 0%
CIS 0.0 0.0 0.0 0%
Outlets 12.6 14.5 1.9 15%
Poland 11.6 10.3 -1.3 -11%
Europe 0.2 0.2 0.0 0%
CIS 0.8 4.0 3.2 404%
TOTAL 920.7 1,008.8 88.1 10%
NUMBER OF STORES
31.12.2016 2017 TARGET Nom. growth YoY
Reserved 461 466 5 1%
Poland 236 228 -8 -3%
Europe 116 119 3 3%
CIS 103 113 10 10%
ME 6 6 0 0%
Cropp 379 379 0 0%
Poland 219 208 -11 -5%
Europe 68 69 1 1%
CIS 92 102 10 11%
House 330 335 5 2%
Poland 212 205 -7 -3%
Europe 51 52 1 2%
CIS 67 78 11 16%
Mohito 290 293 3 1%
Poland 166 158 -8 -5%
Europe 57 54 -3 -5%
CIS 67 81 14 21%
Sinsay 198 238 40 20%
Poland 142 152 10 7%
Europe 26 36 10 38%
CIS 30 50 20 67%
Tallinder 9 0 -9 -100%
Poland 9 0 -9 -100%
Europe 0 0 0 0%
CIS 0 0 0 0%
Outlets 36 36 0 0%
Poland 33 30 -3 -9%
Europe 1 1 0 0%
CIS 2 5 3 150%
TOTAL 1 703 1 747 44 3%

55G L O B A L A S P I R A T I O N S
CENTRAL EASTERN EUROPE
CEE region
COUNTRIES PRESENT
Poland, Czech Republic, Slovakia, Hungary
GROWTH STAGE Maturity
TRADITIONAL STORES
Reserved, Cropp, House, Mohito, Sinsay in all countries
ON-LINE STORESReserved, Cropp, House, Mohito,
Sinsay in all countries
# STORES 1,167
FLORSPACE 574.9 ths m2
TYPE OF STORES Own (majority), franchise XX NUMBER OF STORES, END 1H17@ ON-LINE STORES, END 1H17
80 @
17 @
1,013 @
57 @

56G L O B A L A S P I R A T I O N S
Established position domestically
Poland is LPP’s largest market, generating 55% of group revenues in 1H17.
As development of company-owned stores was initiated domestically, Poland is the market where sales/ m2 are higher than average abroad due to stronger brand recognition.
Currently, stores of all brands are present in Poland in best shopping malls and high-streets.
We focus on network optimisation and quality of stores in Poland.
Key data Poland 2013 2014 2015 2016 1H17
Revenues (PLN m) 2,701 3,080 3,228 3,511 1,692
% of group revenues 66% 65% 63% 58% 55%
No. of stores 886 943 986 1,017 1,013
Floorspace (ths m2) 365.5 413.6 465.0 496.6 492.1
No. of stores 2013 2014 2015 2016 1H17
Poland 886 943 986 1,017 1,013
Reserved 233 235 237 236 230
Cropp 222 219 217 219 227
House 211 209 208 212 219
Mohito 144 153 164 166 162
Sinsay 56 99 127 142 142
Tallinder 0 0 0 9 0
Outlets 20 28 33 33 33
Focus set on network optimisationin Poland.

57G L O B A L A S P I R A T I O N S
Strong presence in other CEE countries
All five mainstream brands are now in Czech Republic and maturity has been reached.
Hungary remains the least saturated CEE market, despite 2015 introduction of House and Sinsay brands.
After taking over the Slovak franchise stores (April 2014), we still see somedevelopment potential.
Key data of other CEE 2013 2014 2015 2016 1H17
Revenues (PLN m) 225 334 406 527 272
% of group revenues 5% 7% 8% 9% 9%
No. of stores 90 132 158 160 154
Floorspace (ths, m2) 43.3 61.9 79.7 84.0 82.8
No. of stores 2013 2014 2015 2016 1H17
Other CEE countries 90 132 158 160 154
Czech Republic 66 73 80 80 80
Hungary 11 11 17 18 17
Slovakia 13 48 61 62 57
Strong presence in other CEE countries.

58G L O B A L A S P I R A T I O N S
BALTIC COUNTRIES
Baltic region
COUNTRIES PRESENT
Lithuania, Latvia, Estonia
GROWTH STAGE Maturity
TRADITIONAL STORES
Reserved, Cropp, House, Mohito, Sinsay in all countries
ON-LINE STORESReserved, Cropp, House, Mohito, Sinsay in all countries as of 1H17
# STORES 74
FLORSPACE 39.9 ths m2
TYPE OF STORES Own XX NUMBER OF STORES, END 1H17@ ON-LINE STORES, END 1H17
27 @
28 @
19 @

59G L O B A L A S P I R A T I O N S
Strong presence in Baltic countries
Five mainstream brands present in Lithuania, Latvia and Estonia.
Emphasis on efficiency improvement in traditional stores.
Focus on on-line sales. On-line stores of all brands launched in April 2017.
Key data 2013 2014 2015 2016 1H17
Revenues (PLN m) 186 200 222 256 127
% of group revenues 5% 4% 4% 4% 4%
No. of stores 58 70 71 73 74
Floorspace (ths, m2) 27.2 36.4 38.2 39.5 39.9
No. of stores 2013 2014 2015 2016 1H17
Baltic countries 58 70 71 73 74
Lithuania 23 25 26 28 28
Latvia 16 19 19 19 19
Estonia 19 26 26 26 27
On-l ine stores now in al l Balt ic countries.

60G L O B A L A S P I R A T I O N S
34 @
12
18
SERBIA
SOUTH EASTERN EUROPE
SEE region
COUNTRIES PRESENT
Bulgaria, Romania, Croatia;entry into Serbia in August 2017
GROWTH STAGE Developing
TRADITIONAL STORES
Reserved, Cropp, House, Mohitoin all countries, no Sinsay in
Bulgaria
ON-LINE STORESReserved, Cropp, House, Mohito,
Sinsay in Romania only
# STORES 64
FLORSPACE 48.7 ths m2
TYPE OF STORES OwnXX NUMBER OF STORES, END 1H17@ ON-LINE STORES, END 1H17■ NEW COUNTRIES, END 2017

61G L O B A L A S P I R A T I O N S
Developing presence in SEE countries
Late SEE entry (2008) due to: 1) priority given to CIS and 2) limited appropriate infrastructure in the region.
Along with softer macro environment, in 2014 we stepped up our SEE development, opening more stores in Romania and Bulgaria and entering Croatia.
We see medium-term development potential. First store in Serbia was opened in August 2017. In 2018 we plan to enter Slovenia.
Focus on e-commerce expansion in 2018.
Key data 2013 2014 2015 2016 1H17
Revenues (PLN m) 52 65 134 230 130
% of group revenues 1% 1% 3% 4% 4%
No. of stores 23 31 47 63 64
Floorspace (ths, m2) 10.2 22.6 34.1 48.3 48.7
No. of stores 2013 2014 2015 2016 1H17
SEE countries 23 31 47 63 64
Romania 5 11 22 34 34
Bulgaria 9 15 15 12 12
Croatia 0 5 10 17 18
We see development potential in the SEE regions .

62G L O B A L A S P I R A T I O N S
301
75
CIS REGION
CIS region
COUNTRIES PRESENT
Russia, Ukraine, Belarus;entry into Kazakhstan in 4Q17
GROWTH STAGE Developing
TRADITIONAL STORES
Reserved, Cropp, House, Mohito, Sinsay in Russia and Ukraine,
while Reserved, Cropp, House in Belarus
ON-LINE STORESReserved, Cropp, House, Mohito,
Sinsay in Russia and Ukraineby the end of 2017
# STORES 379
FLORSPACE 216.5 ths m2
TYPE OF STORES Own (majority), franchise
XX NUMBER OF STORES, END 1H17@ ON-LINE STORES, END 1H17■ NEW COUNTRIES, END 2017
3

63G L O B A L A S P I R A T I O N S
More opportunities in the CIS region
CIS is the second most important market after Poland, responsible for 23% of group sales in 1H17.
Following the geopolitical issues from 2014, we have withheld new Russian and Ukrainian openings. From 2017 we accelerate development in both Russia and Ukraine.
First franchise Reserved, Cropp and House stores were opened in April 2017in Minsk, Belarus. Kazakhstan is planned for 4Q17.
Key data 2013 2014 2015 2016 1H17
Revenues (PLN m) 952 1,076 1,025 1,269 718
% of group revenues 23% 23% 20% 21% 23%
No. of stores 272 336 349 368 379
Floorspace (ths, m2) 142.4 180.3 193.9 207.0 216.5
No. of stores 2013 2014 2015 2016 1H17
CIS countries 272 336 349 368 379
Russia 219 267 280 296 301
Ukraine 53 69 69 72 75
Belarus 0 0 0 0 3
We seek growth in Russia .

64G L O B A L A S P I R A T I O N S
19 @
1@
WESTERN EUROPE
Western Europe
COUNTRIES PRESENT
Germany;entry into the UK in September
2017
GROWTH STAGE Early stage
TRADITIONAL STORES
Reserved
ON-LINE STORESReserved, Cropp, House, Mohito, Sinsay in Germany, Reserved on-line in UK since September 2017
# STORES 19
FLORSPACE 45.5 ths m2
TYPE OF STORES Own
XX NUMBER OF STORES, END 1H17@ ON-LINE STORES, END 1H17■ NEW COUNTRIES, END 2017

65G L O B A L A S P I R A T I O N S
Western Europe as a new growth pillar
Germany was the first Western European country entered. In July 2014 we launched Reserved on-line store, while first shop followed in September 2014.
Flagship store in Munich opened in September 2016 was the first Reserved store in the new concept.
Our target: 20 stores in Germany by the end of 2018. Further development once these reach profitability.
Our first store in the UK, in the centre of London, was opened in September 2017.
Key data 2013 2014 2015 2016 1H17
Revenues (PLN m) 0 15 94 194 115
% of group revenues 0% 0% 2% 3% 4%
No. of stores 0 4 12 16 19
Floorspace (ths, m2) 0 7.6 27.1 37.7 45.5
No. of stores 2013 2014 2015 2016 1H17
WE countries 0 4 12 16 19
Germany 0 4 12 16 19
UK 0 0 0 0 0
We focus on BEP in Germany.

66G L O B A L A S P I R A T I O N S
1
1
MIDDLE EAST
Middle East
COUNTRIES PRESENT
Egypt, Kuwait, Qatar, Saudi Arabia, UAE
GROWTH STAGE Early stage
TRADITIONAL STORES
Reserved
ON-LINE STORES None
# STORES 7
FLORSPACE 8.2 ths m2
TYPE OF STORES Franchise XX NUMBER OF STORES, END 1H17@ ON-LINE STORES, END 1H17
1
3
1

67G L O B A L A S P I R A T I O N S
ME – foothold on the third continent
Development via franchise stores opened by franchisee Azadea since 1Q15.
Franchise stores require no capex, yet bear no retail margin.
Now, only Reserved stores are developed.
New country – Israel – to be opened in 2018. Entry is planned via franchise stores.
Key data 2013 2014 2015 2016 1H17
Revenues (PLN m) 0 0 23 31 13
% of group revenues 0% 0% 0% 1% 0%
No. of stores 0 0 4 6 7
Floorspace (ths, m2) 0 0 5.5 7.6 8.2
We develop ME via franchise stores.
No. of stores 2013 2014 2015 2016 1H17
ME countries 0 0 4 6 7
Egypt 0 0 1 1 1
Kuwait 0 0 1 1 1
Qatar 0 0 1 2 3
Saudi Arabia 0 0 1 1 1
UAE 0 0 0 1 1

68G L O B A L A S P I R A T I O N S
Younger brands fuel floorspace growth
ths m2 2013 2014 2015 2016 1H17
LPP GROUP 588.6 722.5 843.5 920.7 933.7
Reserved PL 188.9 209.2 232.5 248.7 247.4
Reserved EX 133.4 180.5 228.8 260.4 273.4
Cropp PL 54.5 58.3 63.0 65.3 66.5
Cropp EX 36.1 47.1 51.5 55.1 55.5
House PL 55.4 57.3 62.2 64.9 65.1
House EX 24.8 32.3 37.5 40.7 41.6
Mohito PL 40.9 46.2 52.1 53.4 52.6
Mohito EX 25.0 36.6 42.4 45.7 46.7
Sinsay PL 17.9 32.7 43.5 48.6 49.0
Sinsay EX 2.2 11.0 16.2 21.2 23.5
Tallinder PL 0.0 0.0 0.0 4.1 0.0
Outlets 9.3 11.3 13.8 12.6 12.6
ths
m2
FLOORSPACE GROWTH BY BRANDS
In 2013-16, Reserved dominated in floorspace openings due to entry into new countries.
Even though Sinsay was launched in 2013, it added more floorspace than the more mature Mohito.
Cropp and House growths came from domestic and foreign expansion.
588.6
18725 33 50 4
30920.73
FLOORSPACE BY BRANDS
+ 16% 2013-16 CAGR

69G L O B A L A S P I R A T I O N S
New regions fuel floorspace growth
ths m2 2013 2014 2015 2016 1H17
LPP GROUP 588.6 722.5 843.5 920.7 933.7
CEE 408.8 475.5 544.7 580.6 574.9
Poland 365.5 413.6 465.0 496.6 492.1
Other CEE 43.3 61.9 79.7 84.0 82.8
Baltic 27.2 36.4 38.2 39.5 39.9
SEE 10.2 22.6 34.1 48.3 48.7
CIS 142.4 180.3 193.9 207.0 216.5
WE 0.0 7.6 27.1 37.7 45.5
ME 0.0 0.0 5.5 7.6 8.2
ths
m2
FLOORSPACE GROWTH BY REGIONS
The CEE region dominated in new floorspace due to development of 5 mainstream brands in Poland.
The CIS region was the second largest contributor as more high quality mall space was available.
Even though Germany was launched in 2H14, German stores added similar m2 to SEE in 2013-16.
FLOORSPACE BY REGIONS
588.6131 41
386538
920.7
12
+16% 2013-16 CAGR
8

70G L O B A L A S P I R A T I O N S
Younger brands fuel revenue growth
PLN m 2013 2014 2015 2016 1H17
LPP GROUP 4,116.3 4,769.3 5,130.3 6,019.0 3,067.7
Reserved PL 1,298.0 1,425.7 1,421.5 1,407.0 670.0
Reserved EX 775.8 885.6 1,012.3 1,285.9 706.9
Cropp PL 419.3 469.8 467.8 497.4 224.7
Cropp EX 267.7 301.2 322.0 417.5 217.6
House PL 409.0 454.9 469.7 517.3 220.6
House EX 137.3 178.7 203.4 249.9 118.9
Mohito PL 307.6 340.5 353.5 405.5 206.8
Mohito EX 148.8 182.4 233.0 331.3 189.1
Sinsay PL 70.7 186.0 262.0 346.1 187.9
Sinsay EX 3.3 38.6 66.9 114.8 72.9
Tallinder PL 0.0 0.0 0.0 12.1 1.1
Other 278.8 305.9 318.2 434.4 251.2
PLN
m
REVENUE GROWTH BY BRANDS
Despite its scale in Poland, Reserved was the largest group revenue contributor in 2013-16.
Mohito and Sinsay proved to be successful concepts, growing domesticaly and abroad.
Cropp and House were similar revenue contributors.
REVENUES BY BRANDS
4,116619
221 280 387 12228
6,019
+14% 2013-16 CAGR
156

71G L O B A L A S P I R A T I O N S
New regions fuel revenue growth
PLN m 2013 2014 2015 2016 1H17
LPP GROUP 4,116.3 4,769.3 5,130.4 6,019.0 3,067.7
CEE 2,926.5 3,413.6 3,633.8 4,038.6 1,963.9
Poland 2,701.2 3,079.6 3,227.7 3,511.4 1,691.8
Other CEE 225.3 333.9 406.1 528.7 272.1
Baltic 186.4 199.8 221.6 256.4 126.7
SEE 51.7 64.6 133.8 229.8 130.4
CIS 951.7 1,076.2 1,024.6 1,269.3 718.2
WE 0.0 15.2 93.9 193.6 115.2
ME 0.0 0.0 22.6 31.4 13.3
PLN
m
REVENUE GROWTH BY REGIONS
The CEE dominated in terms of revenue contribution largely due to the core Polish market.
Floorspace expansion in Russia translated into CIS being the second largest revenue addition.
Expansion into SEE and WE is visible on our top-line. Since 2015 we develop in the Middle East.
REVENUES BY REGIONS
810178 318 194
302 70
4,116
6,01931
+14% 2013-16 CAGR

72G L O B A L A S P I R A T I O N S
Pick-up in sales/ m2 by brands
PLN 2013 2014 2015 2016 1H17
LPP GROUP 664 589 548 575 563
Reserved PL 644 599 536 494 452
Reserved EX 573 481 423 455 461
Cropp PL 720 684 624 648 576
Cropp EX 733 596 549 659 661
House PL 682 664 631 675 584
House EX 578 511 486 532 487
Mohito PL 777 647 601 640 657
Mohito EX 725 491 483 631 682
Sinsay PL 682 613 576 640 643
Sinsay EX 483 475 407 525 556
Tallinder PL - - - 346 -
REVENUES/ M2 MONTHLY(PLN)
All brands had higher revenues/ m2 in Poland than abroad, except for Cropp.
Growth in foreign sales/ m2 in PLN in 2016 relates to changes in replenishment system at foreign stores and growing recognition abroad of the younger brands.
In 2016, House had the highest revenues/ m2 in Poland while Cropp abroad.
REVENUES/ M2 MONTHLY
664589 548 575 563
2013 2014 2015 2016 1H17

73G L O B A L A S P I R A T I O N S
… and by regions
PLN 2013 2014 2015 2016 1H17
LPP GROUP 664 589 548 575 563
CEE 578 543 528 557 567
Poland 691 647 598 595 571
Other CEE 540 509 505 544 565
Baltic 604 530 493 560 540
SEE 467 457 382 444 438
CIS 663 508 451 514 541
WE - 836 510 490 558
Sales/ m2 in Poland were on average c.17% higher in 2013-16 than on foreign markets.
Visible improvement in CIS, among others due to more favourable FX relations, especially in 2H16.
Pick-up in sales/ m2 in WE in 1H17 due to stronger brand recognition.
REVENUES/ M2 MONTHLY (PLN)
REVENUES/ M2 MONTHLY
-11% -22% -24% -13% -7%
-30%
-20%
-10%
0%
0
200
400
600
800
2013 2014 2015 2016 1H17
Poland Foreign operations Discount foreign to PL

74G L O B A L A S P I R A T I O N S
54.2%
52.1%52.6%
54.8%
46.1%
49.9%
47.1%
50.8%
45.6%
56.5%
40%
45%
50%
55%
60%
Gross profit margin on the upward trend
The majority of purchases is conducted in the Far East and indexed to US$. Appreciation of zloty to US$ decreasescosts of purchases from Asia.
A new sell-out policy – goods are sold off to the maximum extent in stores, to avoid the costs of removal and transportation to the post-season warehouse.
Without the December 2016 inventory sell-off, 2016 gross profit margin would come at 50.8%, down 2.7 p.p.Reported 2016 gross profit margin came at 48.8%.
QUARTERLY GROSS PROFIT MARGIN 1H17 PURCHASESBY REGIONNEW
INVENTORY MANAGEMENT
POLICY
China46%
Far East41%
Turkey6%
Poland6%
Other1%

75G L O B A L A S P I R A T I O N S
New inventory management policy
U n s o l d g o o d s
F O R M E R C U R R E N T
C h a n g e i n c u s t o m e r
p r e f e r e n c e s
O u t l e t s
P r o m o t i o n s a n d s e l l - o f f s
Mid-season promotions depending on attractiveness of collections and
competitors’ actions.
Concentration on gross profit margin during the season but stronger post-
season sell-offs.
Unsold goods sent to post-season warehouse, while later once again
shifted to stores.
Post-season inventory sold to third parties. Goods older than 12 months
no longer in stores.
Outlets only in selected locations in Poland, due to focus on brand image.
Price as key purchase trigger. Possibility to sell goods from previous
seasons.
Clients increasingly reluctant to accept old stock. Limited ability to liquidate
unsold goods in outlets.
Unsold collections from the past season sold in outlets in Poland and
abroad.O u t l e t s

76G L O B A L A S P I R A T I O N S
117 106 91 94 95 98
59 5649 56 54 62
6357
49 49 47 53
2013 2014 2015 2016 1H16 1H17
Rental costs HR costs Other costs
Costs of own stores depend on rentals
Rental charges successful rental renegotiations; level paid depends on EUR/PLN exchange rate.
Personnel costs continuous headcount optimisation in 2013-15, but pressure on salaries growth from 2016.
Other costs of stores depreciation constitutes half of other costs of stores; other costs: energy, provisions, security.
COSTS OF OWN STORES/ m2
(PLN monthly)
1H17 COSTS OF OWN
STORES SPLIT-6%
2013-16 CAGR
Rental costs46%
HR costs29%
Other costs25%
239218
189 200 196 213

77G L O B A L A S P I R A T I O N S
296274
234251 245
268
2013 2014 2015 2016 1H16 1H17
We control SG&A/ m2
Fall in SG&A/ m2 in 2012-16 optimisation of costs of own stores and headquarters.
Costs of stores YoY growth in 2016 due to higher YoY floorspace, depreciation of zloty versus euro and HR costs. Fall in costs of franchise stores in Poland, due to switch to company owned stores.
HQ costs YoY growth in 2016 due to investments in product departments and e-commerce.
Franchise stores in the Middle East and in Belarus do not affect SG&A costs.
SG&A/ m2
(PLN monthly)
SG&A COSTS
(PLN m)
-5% 2013-16 CAGR 2,1912,1481,759 2,608
336 417 411 528 309
1,4231,731 1,781
2,080
1,154
2013 2014 2015 2016 1H17
HQ Costs of all stores
1,463

78G L O B A L A S P I R A T I O N S
455386 392
230
105175
2013 2014 2015 2016 1H16 1H17
Store capex Logistics capex Other
Store capex reduced by fit-outs
Target capex of PLN 3,000/ m2 is lowered by fit-outs obtained domestically and abroad. However, the number may go up along with more WE openings. Maintenance capex constitutes c.10% of store outlays.
Upgrade of Polish logistics center conducted in 2013-15 cost PLN 177m. It was launched in 2Q15.
Modernisation of Gdansk headquarters finished in September 2015. We continue to expand our HQs to make room for future growth.
CAPEX SPLIT
(PLN m)
1H17 CAPEX SPLIT
(PLN m)
542 551 489 271
125 201
Stores87%
Logistics Centre
2%
Other11%

79G L O B A L A S P I R A T I O N S
Logistics centre and HQs enlargement
2 SOURCES OF INFRASTRUCTURE SPENDING
Another logistics centre Gdansk HQs expansion
We search for location for our new logistics centre.
We are constructing another building next to current HQs.
C. PLN 300m of planned capex between 2019-20.
The plot owned is sufficient for construction of 4 new buildings.
The currently constructed first building is to cost c. PLN 90m between 2017-18.
Current logistics centre should be sufficient until 2020.

80G L O B A L A S P I R A T I O N S
1,444 1,480
116 135
756
1,215
2Q16 2Q16 2Q17 2Q17
Inventory Receivables Liabilities
Freeing up working capital
Longer inventory cycle in 1H17 YoY due to a higher level of AW collection. YoY fall in inventory/ m2 due to new inventory management policy and improved reception of collections by customers.
Higher YoY receivables due to further inventory sell-offs, in line with the new policy.
PLN 215m additional liabilities due to extension of payment terms for suppliers at the end of 2Q17.
Our aim is to match liabilities to the inventory level.
CASH CYCLE(days)
WORKING CAPITAL(PLN m)
PLN 688m
PLN 265m
13 13 10 99
156 165176
147 161
110 108 10295
127
2013 2014 2015 2016 1H17
Receivables (days) Inventory (days) Liabilities (days)

81G L O B A L A S P I R A T I O N S
Optimisation of NWC
S U P P L Y C H A I N F I N A N C E - S C F( S U P P L I E R F I N A N C I N G P R O G R A M M E )
Positive effect on LPP’s net working capital since 4Q16.
BANKING PLATFORM
Extended payment periods on invoices for goods purchased.
Net working capital and operating cash flows improvement.
B E N E F I T S F O R L P P
Possibility to discount invoicesfor LPP before the payment deadline (low discount rate based on LPP’s standing).
No impact on credit ability.
B E N E F I T S F O RS U P P L I E R S

82G L O B A L A S P I R A T I O N S
Stages of the designing and supply process
Preparation of project models and sending documentation to
suppliers
1
STAGE 1:Analysis of previous
seasons and determination of demand
STAGE 2:Inspirational meeting
STAGE 3:Preparation of projects
STAGE 4:Projects sent to suppliers
Placing orders for models (price, dates,
quality, quantity)
2
STAGE 5:Evaluation of designs prepared by suppliers
STAGE 6:MSM (meeting to decide on
orders)
STAGE 7:Sending comments to
suppliers
STAGE 8:Placing orders and
negotiating terms of a contract
Co-ordination of the production process
3
STAGE 9:Production monitoring
Shipping, display and sale of models
4
STAGE 10:Allocation, organization of delivery and transportation
STAGE 11:Visual merchandising
STAGE 12:Sale and customer service
STAGE 13: Replenishment
Introduction of sell-offs and withdrawal of unsold products
5
STAGE 14: Competition price survey
STAGE 15:Price adjustments in
seasonal sell-offs
STAGE 16: Changing seasons and
withdrawal of the end of line products

83G L O B A L A S P I R A T I O N S
Strengthening the designing teams
DESIGN CENTRES IN TOP3 CITIES IN POLAND.
CR
AC
OW
• Design centre for House and Mohito brands.
• Co-operation with designing schools.
WA
RSA
W
• A new design centre responsible for Reserved.
• Upgraded Showroom of all brands.
GD
AN
SK
• LPP’s largest design centre.
• The centre is responsible for Reserved, Cropp and Sinsay brands.

84G L O B A L A S P I R A T I O N S
Top quality logistics
The largest and most modern in CEE of its kind
Services all LPP stores ex. Russia
66,000 m2 floorspace
Sufficient for development until 2020
IN POLAND (OWNED) IN RUSSIA (RENTED)
9,500 m2 floorspace
Services 60% of goods in Russian stores
TRADITIONAL STORES
Operations and infrastructure ready for upcoming e-commerce
launch in Russia
E-COMMERCE
Co-operation with Arvato, outsourcing of e-commerce
operations of 4 out of 5 LPP’sbrands
30,000 m2 floorspace in the centre of Poland

85G L O B A L A S P I R A T I O N S
Arvato Poland will be responsible for e-commerce logistics of 4 LPP brands: Reserved, House, Mohito
and Sinsay.
Outsourcing of key elements (eg. warehouse, packaging, dispatch, returns) from a dedicated Arvato
warehouse in the centre of Poland.
Access to e-commerce logistics know-how.
A more convenient location of the logistics centre.
Faster delivery of products to customers.
After signing the contract, Arvatoincreased its warehouse space by
30 ths m2.
The agreement stipultaes the possibility to expand up to 60 ths m2
in the next 3 years.
Within the first year Arvato will increase headcount by c. 500 people.
Outsourcing of e-commerce logistics
WE AIM TO STREAMLINE E-COMMERCE OPERATIONS
CO-OPERATION DETAILS WAREHOUSE DETAILS OUR BENEFITS

86G L O B A L A S P I R A T I O N S
Group FX exposure
Note: LC stands for local currency. Calculations based on 2016 numbers.
REVENUES
STORES IN POLAND& WHOLESALE
Stores in Czech Rep., Hungary, Bulgaria, Romania,
Croatia
STORES IN RUSSIA, UKRAINE
(Foreign subsidiaries)
MIDDLE EAST STORES(Franchise)
Stores in Slovakia, Lithuania, Latvia, Estonia, Germany
LPP(Parent company)
41% PLN SG&A COSTS59% FX SG&A COSTS
58% PLN REVENUES42% FX REVENUES
MANUFACTURERS
RENTALS
COSTS
86% US$9% EUR5% other
78% EUR12% US$
10% other
PLN
LC/PLN
RUB/PLNUAH/US$
US$/PLN
EUR/PLN

87G L O B A L A S P I R A T I O N S
First hedging transactions
1 2 3
Lowering the level of indebtedness of subsidiaries towards the parent company (conversion of debt into
equity of subsidiaries).
Increase in self-financing of subsidiaries along with their improved financial standing.
Hedging to minimise the level of FX gains/losses in the net financials
line (below EBIT).
• Hedging of US$/PLN FX rate.
• Forwards with currency delivery.
• We hedge the period between booking the invoice
from the supplier and invoice payment.
• We hedge 70% of payments.
• Hedged amount at US$ 123m end-1H17.
Hedging will not affect gross profit margin.

88G L O B A L A S P I R A T I O N S
Earnings turnaround
PLN m 2013 2014 2015 2016 1H16 1H17 YoY
Revenues 4,116.3 4,769.3 5,130.4 6,020.6 2,677.2 3,067.7 14.6%
Gross profit on sales 2,409.2 2,792.5 2,742.8 2,935.3 1 291,5 1 585,0 22.7%
Gross profit margin 58.5% 58.6% 53.5% 48.8% 48.2% 51.7% 3.5 p.p.
SG&A costs 1,759.2 2,148.3 2,191.7 2,607.9 1,247.0 1,463.0 17.3%
Other operating line -34.3 -35.0 -48.5 -98.1 -21.9 -23.3
EBIT 615.6 609.1 502.7 229.3 22.6 98.6 337.2%
EBIT margin 15.0% 12.8% 9.8% 3.8% 0.8% 3.2% 2.4 p.p.
Net financial activity -91.8 -149.2 -88.3 -32.3 -2.6 -1.2
Pre-tax profit 523.9 459.9 414.4 197.0 19.9 97.5 388.8%
Tax 91.0 -22.0 63.0 21.0 -4.3 41.3
Minorities 1.9 2.3 0.0 0.0 0.0 0.1
Net income 431.0 479.5 351.3 175.9 24.2 56.2 132.1%
Net income margin 10.5% 10.1% 6.8% 2.9% 0.9% 1.8% 0.9 p.p.

89G L O B A L A S P I R A T I O N S
Balance sheet increasingly strong
PLN m 31.12.2013 31.12.2014 31.12.2015 31.12.2016 30.06.2016 30.06.2017
Non-current assets 1,231.9 1,516.4 1,797.0 1,838.7 1,811.7 1,795.2
fixed assets 281.2 315.9 324.4 1,291.3 1,266.0 1,248.5
intangibles (inc. goodwill) 896.8 1,038.8 1,258.8 330.6 326.5 339.3
Current assets 1,259.7 1,417.3 1,768.2 1,839.3 1,913.3 2,145.1
inventory 805.0 979.3 1,319.7 1,164.1 1,444.0 1,480.2
trade receivables 163.3 176.9 115.1 165.4 116.5 134.8
cash and equivalents 149.4 183.5 224.4 365.8 219.2 434.9
Total assets 2,491.6 2,933.7 3,565.2 3,677.9 3,724.9 3,940.3
Equity 1,496.5 1,638.4 1,889.7 2,134.7 1,933.9 2,063.3
Long-term liabilities 192.3 210.7 344.1 267.3 303.3 245.9
interest bearing debt 184.3 204.5 284.3 195.0 239.6 168.5
Short-term liabilities 802.7 1,084.6 1,331.3 1,275.9 1,487.8 1,631.1
trade liabilities 547.6 618.6 721.4 881.1 755.9 1,215.1
interest bearing debt 173.6 378.3 561.1 315.1 619.2 255.4
Total liabilities 2,491.6 2,933.7 3,565.2 3,677.9 3,724.9 3,940.3

90G L O B A L A S P I R A T I O N S
Record high operating CF in 2016 and 1H17
PLN m 2013 2014 2015 2016 1H16 1H17 YoY
Pre-tax profit 523.9 459.9 414.4 197.0 19.9 97.5 388.8%
D&A 148.2 193.7 223.6 267.4 129.2 147.4 14.1%
NWC -95.7 -127.3 -223.4 253.5 19.9 149.1 649.0%
Operating CF 508.8 492.9 253.9 718.2 77.4 348.9 351.0%
Capex -541.9 -550.5 -490.6 -271.8 -125.4 -201.5 60.8%
Investing CF -518.2 -476.0 -415.5 -181.4 -98.9 -187.0 89.1%
Interest bearing debt 167.4 204.0 277.7 -328.7 19.8 -83.2
Dividends -154.0 -169.6 -58.0 -59.9 0.0 0.0
Interest -12.5 -14.8 -18.5 -21.6 -11.3 -7.6
Financing CF -0.6 17.2 201.2 -393.8 16.7 -90.6 n/m
Total CF -10.0 34.2 39.5 143.0 -4.8 71.2 n/m

91G L O B A L A S P I R A T I O N S
10
50
100
40
500
1,000
>1,700
LPP’s success story
C O R P O R A T E M I L E S T O N E S
1991 Creation of Mistral company by Marek Piechocki and Jerzy Lubianiec
1995 Mistral transformed into LPP
1997 Opening offices in Shanghai
1998 Launch of Reserved – first retail store opened
2001 IPO on the Warsaw Stock Exchange
2002 Start of international expansion (Russia, Czech Rep., Estonia, Hungary, Latvia)
2003 Further international expansion (Lithuania, Ukraine, Slovakia)
2004 Launch of Cropp brand
2008 Acquisition of Artman, owner of the House and Mohito brands
2008 Launch of the modern logistics center; expansion into Romania and Bulgaria
2010 Payment of first dividend
2013 Launch of Sinsay brand
2014 New countries: Germany, Croatia; entry into MSCI Poland and WIG20 indices
2015 Middle East entry: Egypt, Kuwait, Qatar, Saudi Arabia
2016 Launch of Tallinder brand and decision to abandon it; entry into UAE
2017 Entry into Belarus, Serbia and the UK; closing down the Tallinder brand
N o . o f s t o r e s

92G L O B A L A S P I R A T I O N S
Corporate governance
• 5 to 6 members
• appointed for a 5 year term
• appoints Management Board
• serves as an AuditCommittee
S U P E R V I S O R Y B O A R D
• 2 to 6 members
• appointed for a 5 year term
• CEO can represent the company by himself
• additionally two management board members and management board member and legal representative can sign binding agreements.
M A N A G E M E N T B O A R D
• appoints Supervisory Board members
• approves annual financial statements
• grants discharge to the Management and Supervisory Board members
G E N E R A L S H A R E H O L D E R
M E E T I N G
ap
po
int
sa
pp
oin
ts
AUDIT COMMITTEE
• review of the financial statements
• assessment of the financial standing
• control and assessment of the internal audit reports
• evaluation of development strategy

93G L O B A L A S P I R A T I O N S
Founders actively involved in the business
MAREK PIECHOCKICHIEF EXECUTIVE OFFICER
JERZY LUBIANIECCHAIRMAN of SUPERVISORY BOARD
Present in the retail business since 1989.
• In 1991 together with Jerzy Lubianiec, founded a Mistral company, activities of which in 1995 weretransferred into LPP.
• CEO of LPP since 2000.
• The Best-Performing CEO according to Harvard Business Review (2013).
• 1991 - 1997 ran Mistral company as a sole trader(LPP’s predecessor).
1995 – 2000 CEO of LPP.
Since 2000 Chairman of the Supervisory Board of LPP.
LP
P’s
FO
UN
DE
RS

94G L O B A L A S P I R A T I O N S
Management with long-term vision
MAREK PIECHOCKI (56)CEO & FOUNDER
PRZEMYSŁAW LUTKIEWICZ (46)CFO
JACEK KUJAWA (43)BOARD MEMBER
SŁAWOMIR ŁOBODA (52)BOARD MEMBER
At LPP since 2004.
Responsible for logistics, administration and IT.
1999-2004 at Wirtualna Polska.
Cooperated with LPP since 1997.
Appointed: 14 October 2015.
Responsible for legal issues, new retail space and store development.
Since 1989 in retail business.
Founded LPP in 1991. CEO of LPP since 2000.
Responsible for LPP’s strategy and development of all brands.
At LPP since 2008.
Since 2015 LPP’s CFO. Initially Head of Controlling.
1995-2007 manager at First Data Poland.

95G L O B A L A S P I R A T I O N S
Former CEO and CFO sit on the Supervisory Board
JERZY LUBIANIEC (57)CHAIRMAN
2000 – 2014 CFO of LPP.
1995 – 2000 manager at LPP.
1991 – 1995 worked at Mistral (LPP’s predecessor).
Since 2004 member of the Supervisory Board of LPP.
Since 1993 a sole trader providing consulting services in real estate.
Shareholder at Fasko limited liability company.
Since 2004 member of the Supervisory Board of LPP.
Licensed stock broker, CFA charterholder.
Since 2006 CEO of Artemis Investment limited liability company.
Since 1999 member of the Supervisory Board of LPP.
1996 – 1997 LPP Management Board member.
1991 – 1996 partner at Mistral company (LPP’s predecessor).
Since 2000 Chairman of the Supervisory Board of LPP.
1995 – 2000 CEO of LPP.
1991 – 1997 ran Mistral company (LPP’s predecessor).
DARIUSZ PACHLA (56)Member
WOJCIECH OLEJNICZAK (61)Member
KRZYSZTOF OLSZEWSKI (56)Member
MACIEJ MATUSIAK (50)Member

96G L O B A L A S P I R A T I O N S
The shares held by the founders are privileged 1 to 5 in votes.
The Forum TFI manages Forum 64 FIZ related to Jerzy Lubianiec and Forum 65 FIZ related to Marek Piechocki.
Effectively, the founders control 30.0% of equity and 60.6% of votes.
Treasury shares (18,978) are valued at PLN 2,280 and partially used for the purpose of stock option plan.
Since September the number of shares and votes is higher by 13,132 due to conversion of warrants into shares.
SHAREHOLDERS BY EQUITY(30.06.2017)
SHAREHOLDERS BY VOTES (30.06.2017)
Company controlled by its founders
total no of shares: 1,839,291 total no of votes: 3,220,313
Marek Piechocki
9.5% Jerzy Lubianiec
9.5%
Forum TFI10.9%
Akcje własne1.0%Free-float
69.0%
Marek Piechocki
27.2%
Jerzy Lubianiec
27.2%
Forum TFI6.2%
Akcje własne0.0%
Free-float39.4%

97G L O B A L A S P I R A T I O N S
Safety in Asian factories in our goal
PLN 16m outlays for audits of working conditions in Bangladesh factories:
• 2/3 of the amount for working conditions audit was spent for on-siteinspections and audits of working conditions in factories,
• the remaining amount comprises of membership fees for ACCORD and Rana Plaza Trust Fund.
80 factories
21 people
PLN 16m
80 factories under ACCORD control:• 90% of factories had their electrical installations modernised or changed,• 75% of factories ended up with additional anti-fire alarms and installations,• 60% of factories had their constructions strengthened. In many cases the
production was transferred to other venues.
21 people full-time employed in Bangladesh offices and Audit Department in HQs.
LPP’s Code of Conduct puts safety in factories first. Suppliers have the obligation to provide a decent pay,max 48 hours of work per week and paid overtime. They are banned to hire children < 15 years old.

98G L O B A L A S P I R A T I O N S
Customers expect quicker changes within collections, faster fashion, answering the appearing fades.
We produce more locally
Retail market trends
Solution
We need to shorten the time we prepare our products and its way to stores (lead time).
Our response
Shorter delivery time of must-haves even to 6 weeks, among others due to increased production in Poland.
Customers want to buy local products, from their country of origin.
Higher sourcing from the local market.
Increased number of production orders in Poland to streamline value chain
management.
MADE IN POLAND
Poland is already 6% of 1H17production.
We produce selected higher quality models of Reserved and
Mohito brand domestically.
We plan to produce 5m of clothing pieces in 2017 in
Poland, up 50% YoY.
WE AIM TO DOUBLE PRODUCTION IN POLAND WITHIN THE NEXT 2 YEARS
Retail market trends
Solution
Our response

99G L O B A L A S P I R A T I O N S
We plan more CSR actions
2013
J o i n i ng t he A CCOR D a l l i a nc e
2015
S e t t i ng up o f f i c e s i n D ha k a ( B a ng l a de s h )
U p da t e o f Co de o f Co nduc t f o r s up p l i e r s
I n t r o duc t i o n o f o r g a n i c c o t t o n
2017
S t r o ng e r s up e r v i s i o n o v e r f a c t o r i e s i n A s i a
S t a r t o f c o - o p e r a t i o n w i t h S G S
2014
E s t a b l i s h i ng o f f a c t o r y
a ud i t d i v i s i o n
R e s i g na t i o n f r o m ango ra
2016
R e s i g na t i o n f r o m na t ur a l f u r s
2018
F i r s t s us t a i na b i l i t y r e p o r t

100G L O B A L A S P I R A T I O N S
Presence in key indicesP
OL
ISH
IN
DIC
ES
INT
ER
NA
TIO
NA
L I
ND
ICE
S
WIG
20
WIG
30
MS
CI
PO
LA
ND The most important index of the
WSE
Member since March 2014
c. 5.1% LPP’s weight
The sole clothing retailer in the index
WIG30 index of the 30 most liquidcompanies on the WSE
WIG30 index was launched September2013
LPP member since index inception
c. 4.7% LPP’s weight
MSCI Poland is a key index for international institutions investing in Poland
LPP member since August 2014
FTSE indices are tracked by ETFs
LPP member of three FTSE indices: All-World Index, Emerging Index, Global Style IndexF
TS
E
WIG
The broadest index of the WSE
c. 3.3% LPP’s weight
The largest clothing retailer in the index C
EC
E
CECE Index is created by the Vienna Stock Exchange. It comprises of companies from Poland, Czech Republic and Hungary
LPP re-entered the index mid-September 2017

101G L O B A L A S P I R A T I O N S
Strong medium-term market outperformer
LPP’S SHARE PRICE RELATIVE TO WIG 20 INDEX
TICKERS
WSE LPP
Bloomberg LPP PW
Reuters LPP.WA
PERFORMANCE
1Y +42%
3Y -15%
5Y +111%
MARKET DATA
Price (30.06.17) PLN 7,150
Min 1Y PLN 4,490
Max 1Y PLN 7,200
0
2,000
4,000
6,000
8,000
10,000
12,000
LPP WIG20 relative

102G L O B A L A S P I R A T I O N S
Broad analytical coverage
I N S T I T U T I O N A N A L Y S T E - M A I L
BDM Adrian Górniak [email protected]
BGŻ BNP Paribas BM Michał Krajczewski [email protected]
BofA/ML Ilya Ogorodnikov [email protected]
BOŚ DM Sylwia Jaśkiewicz [email protected]
BZ WBK DM Tomasz Sokołowski [email protected]
Citi Handlowy Rafał Wiatr [email protected]
DB Securities Tomasz Krukowski [email protected]
Erste Securities Marek Czachor [email protected]
Goldman Sachs Maxim Nekrasov [email protected]
Haitong Konrad Księżopolski [email protected]
IPOPEMA Securities Michał Bugajski [email protected]
JP Morgan Michał Kuzawiński [email protected]
mBank Piotr Bogusz [email protected]
Millennium DM Marcin Palenik [email protected]
Pekao IB Maria Mickiewicz [email protected]
PKO BP DM Adrian Skłodowski adrian.skł[email protected]
Raiffeisen Centrobank Jakub Krawczyk [email protected]
Trigon DM Dariusz Dziubiński [email protected]
UBS Michał Potyra [email protected]
Wood & Co. Łukasz Wachełko [email protected]

103G L O B A L A S P I R A T I O N S
Investor relations’ calendar
K E Y D A T E S
22.09.2017 Investors’ Day in London
02.10.2017 September trading update
02.11.2017 October trading update
03.11.2017 3Q17 trading update
21.11.2017 3Q17 results publication
01.12.2017 November trading update
Person: Magdalena Kopaczewska
IR Manager
E-mail: [email protected]@lppsa.com
Phone: + 48 693 904 337
Address: Łąkowa 39/44 Street
80-769 Gdansk, POLAND
I R C O N T A C T

104G L O B A L A S P I R A T I O N S
Glossary
Poland Retail sales in Poland and other sales of LPP SA.
CEE Region including: Czech Republic, Slovakia, Hungary.
Baltic Region including: Lithuania, Latvia, Estonia.
CIS Region including: Russia, Ukraine and from 2017 also Belarus and Kazakhstan.
SEE Region including: Bulgaria, Romania, Croatia, while from 2017 also Serbia.
WE Region including Germany and from 2017 also the UK.
ME Region including: Egypt, Qatar, Kuwait, Saudi Arabia, UAE.
Europe Region including: CEE, Baltic, SEE and WE.
EBITDA EBIT + depreciation from cash flow statement.
Average monthly revenues/m2 Revenues of segment or brand / average working total floorspace / 12.
Average monthly costs of own stores/m2 Costs of own stores / average working floorspace of own stores (ie. excluding all franchise stores which represent c. 6% of the working floorspace) / 12.
Average monthly SG&A PLN/m2 SG&A costs/ average working total floorspace excluding stores located in ME and Belarus / 12.
Inventory/ m2 End of period group inventory/ total floorspace without franchise stores in ME and Belarus.
Inventory days Average inventory/ group COGS * 365 days.
Receivables days Average receivables/ group revenues * 365 days.
Liabilities days Average short-term liabilities/ group COGS * 365 days.
Cash conversion cycle Inventory days + receivables days – liabilities days.

105G L O B A L A S P I R A T I O N S
CONTACT DETAILS
GDANSK HEADQUARTERSLPP SA
Łąkowa 39/44 Street
80-769 Gdansk, Poland
Tel. +48 58 76 96 900
Fax.+48 58 76 96 909
Email: [email protected]
CRACOW BRANCH
LPP SA
Bagrowa 7 Street
30-733 Cracow, Poland
Tel. +48 12 39 25 000
LOGISTICS CENTRE
LPP SA
Tczewska 2 Street
83-800 Pruszcz Gdański, Poland
MEDIA CONTACT
Email: [email protected]
IR CONTACT
Email: [email protected]


![Моризо ( morizo.ru ) [ 47,6 6] Mohito ( mohito.ru ) [45,92] Графит ( graphit.ru ) [ 36,4 ]](https://static.fdocuments.net/doc/165x107/568140eb550346895dacba27/-morizoru-476-6-mohito-mohitoru-4592-.jpg)